VERSION: October 2021
EdWorkingPaper No. 21-470
A Classroom Observer Like Me: The Effects of
Race-congruence and Gender-congruence Between
Teachers and Raters on Observation Scores
State and local education agencies across the country are prioritizing the goal of diversifying the teacher
workforce. To further understand the challenges of diversifying the teacher pipeline, I investigate race and
gender dynamics between teachers and school-based administrators, who are key decision-makers in hiring,
evaluating, and retaining teachers. I use longitudinal data from a large school district in the southeastern
United States to examine the effects of race-congruence and gender-congruence between teachers and
observers/administrators on teachers’ observation scores. Using models with two-way fixed effects, I find that
teachers, on average, experience small positive increases in their scores from sharing race or gender with their
observers, raising fairness concerns for teachers whose race or gender identities are not reflected by any of
their raters.
Suggested citation: Chi, Olivia L.. (2021). A Classroom Observer Like Me: The Effects of Race-congruence and Gender-congruence
Between Teachers and Raters on Observation Scores. (EdWorkingPaper: 21-470). Retrieved from Annenberg Institute at Brown
University: https://doi.org/10.26300/g8bz-zs40
Olivia L. Chi
Boston University
Running head: A CLASSROOM OBSERVER LIKE ME
A Classroom Observer Like Me: The Effects of Race-congruence and Gender-congruence Between Teachers and Raters on Observation Scores
Olivia L. Chi Boston University
Version: September 2021
Abstract
State and local education agencies across the country are prioritizing the goal of diversifying the teacher workforce. To further understand the challenges of diversifying the teacher pipeline, I investigate race and gender dynamics between teachers and school-based administrators, who are key decision-makers in hiring, evaluating, and retaining teachers. I use longitudinal data from a large school district in the southeastern United States to examine the effects of race-congruence and gender-congruence between teachers and observers/administrators on teachers’ observation scores. Using models with two-way fixed effects, I find that teachers, on average, experience small positive increases in their scores from sharing race or gender with their observers, raising fairness concerns for teachers whose race or gender identities are not reflected by any of their raters.
Correspondence regarding the paper can be sent to Olivia Chi at [email protected]. I thank Martin West, Eric Taylor, David Deming, Matthew Kraft, seminar participants at Harvard and Boston University, and session participants at AEFP and APPAM for their valuable comments and feedback. I am grateful for the support from the data providers. The research reported here was supported, in part, by the Institute of Education Sciences, U.S. Department of Education, through grant R305B150010 to Harvard University. The opinions expressed are those of the author and do not represent the views of the Institute or the U.S. Department of Education. Additional support came from the Multidisciplinary Program in Inequality and Social Policy at the Harvard Kennedy School. All errors are my own.
A CLASSROOM OBSERVER LIKE ME 1
I. Introduction
State education agencies and school districts across the country are prioritizing the goal
of diversifying the teacher workforce to better reflect the diversity of the student population.
Policymakers’ interest in efforts to recruit, hire, develop, and retain underrepresented teachers
are growing alongside the accumulation of rigorous empirical evidence that documents both
short- and long-term benefits to students who are assigned to same-race teachers (Dee, 2004;
Egalite et al., 2015; Gershenson et al., 2018; Lindsay & Hart, 2017; see Goldhaber et al., 2019
for an overview). However, states and districts face many significant challenges in their efforts to
close the diversity gap (Goe & Roth, 2019; Putman et al., 2016; Redding & Baker, 2019).
To further understand the challenges of diversifying the teacher pipeline, the roles and
characteristics of school-based administrators should receive particular attention, as school-based
administrators commonly act as key decision-makers in the processes of hiring, developing,
evaluating, and retaining teachers. Moreover, a growing body of research suggests that
administrators’ race and gender – and the race- or gender-congruence between principals and
teachers – may play an important role in teacher outcomes, such as teacher hiring, turnover, and
job satisfaction (Bartanen & Grissom, 2019; Grissom & Keiser, 2011; Husain et al., 2018).
In this study, I investigate the roles of race and gender dynamics between school-based
administrators and teachers in the context of teachers’ classroom observations. Over the past
decade, U.S. states and districts have come to rely on teacher evaluations – and in particular,
classroom observations conducted by administrators – as a key lever for teacher accountability.
Across states and districts implementing post-No Child Left Behind (NCLB) teacher evaluation
systems, classroom observations are the most frequently used measure of teachers’ on-the-job
A CLASSROOM OBSERVER LIKE ME 2
performance, and they typically represent the highest weighted component of a teacher’s
summative evaluation rating (Steinberg & Donaldson, 2016).
As ratings from teacher evaluation systems have become more widely available, a
growing body of research has documented substantial gaps in teachers’ scores by race and
gender, and gaps appear to persist even after accounting for other measures of teacher quality,
such as value-added to test scores (Drake et al., 2019; Grissom & Bartanen, 2020; Jacob &
Walsh, 2011; Jiang & Sporte, 2016). Taken together with recent work on the importance of
administrators’ race and gender identities, this raises concerns about whether and to what extent
administrators’ and teachers’ race and gender identities influence classroom observation scores.
In this study, I use longitudinal data from a large school district in North Carolina to
examine the relationship between teacher race/gender, the race/gender of the classroom observer
(typically a school administrator), and observation scores. I ask:
(1) Do teachers receive higher (or lower) classroom observation scores as a result of sharing
race or gender identities with their observers?
(2) Are the effects of race-congruence or gender-congruence mediated by the sharing of
other attributes, such as education history or teaching assignment history?
An important contribution of this study is the added rigor with which the effects of race-
congruence and gender-congruence are identified, stemming from the availability of detailed
data generated by the district’s classroom observation scheme. In this district, teachers receive
multiple rounds of classroom observations each school year, and they may be observed by
different raters across observation rounds. To identify race or gender interactions, I estimate
models that include both teacher-by-year fixed effects and observer-by-round-by-year fixed
effects. The inclusion of teacher-by-year fixed effects implies that the identifying variation

A CLASSROOM OBSERVER LIKE ME 3
comes from teacher-years in which the teacher is observed, in the same school year, by at least
one rater who shares the racial or gender characteristic of interest and at least one rater who does
not. By including observer-by-round-by-year fixed effects, I account for observed and
unobserved differences in rater characteristics across raters, observation rounds, and time. The
availability and inclusion of these particular sets of fixed effects address threats to internal
validity that remain in prior research. For example, these fixed effects alleviate lingering
concerns about estimates that may be biased by certain patterns of teacher sorting to
administrators/raters on unobservable characteristics.
I find that teachers, on average, experience small positive increases in their scores from
sharing race (0.03 SD) or gender (0.02 SD) with their observer. These dynamics imply that the
estimated sizes of the Black-White and male-female observation score gaps could fluctuate as a
function of the proportion of raters from underrepresented groups and how they are assigned to
teachers. I also find that the race and gender congruence effects are not mediated by the sharing
of other available attributes, such as whether the teacher and observer ever taught the same
teaching assignment, whether they have attended the same university, or the number of years
they have worked in the same school. These race and gender dynamics between teachers and
their raters appear to exist separately from the attributes I examine. Though the underlying
mechanisms for the effects of race-congruence and gender-congruence between teachers and
raters are unknown, the results raise fairness concerns for teachers whose race or gender
identities are not reflected by any of their administrators.
II. Background
A. Classroom Observation Scores
A CLASSROOM OBSERVER LIKE ME 4
Classroom observations using standards-based observation protocols (e.g., Charlotte
Danielson's Framework for Teaching, 1996) have become the cornerstone of post-NCLB teacher
evaluation systems (Steinberg & Donaldson, 2016). Using scores from formal classroom
observations as a measure of teacher performance poses many advantages. Prior work provides
evidence on the predictive validity of classroom observation instruments (e.g., Kane, McCaffrey,
Miller, & Staiger, 2013). Unlike test score value-added measures which can only be calculated
for teachers in tested grades and subjects, classroom observation scores can be made available
for all teachers. Furthermore, prior evidence indicates that evaluation systems with observations
and individualized performance feedback can improve teacher performance (Taylor & Tyler,
2012). And so, in theory, classroom observations serve not only the purpose of gathering
evidence for teacher evaluation, but also the purpose of developing teachers’ instructional skills
via a cycle of observation and feedback.
However, as standards-based classroom observations for teacher accountability have
become more widespread, a growing body of research has documented gaps in scores by race
and gender, raising questions about the sources of the gaps and whether specific subgroups are
disadvantaged in the implementation of the classroom observation process (Cohen & Goldhaber,
2016). Recent studies using data from Chicago, Michigan, and Tennessee find that teachers of
color and male teachers receive lower observation/evaluation ratings than their White and female
counterparts (Drake et al., 2019, Grissom & Bartanen, 2020; Jacob & Walsh, 2011; Jiang &
Sporte, 2016), and these differences persist even after accounting for observable differences
between teachers, such as their subject/grade assignments and value-added to test scores.
These evaluation and observation score gaps, which are unexplained by observable
teacher characteristics or measures of teachers’ contributions to test scores, raise concerns that
A CLASSROOM OBSERVER LIKE ME 5
classroom observation ratings are influenced by aspects of teachers’ context that are outside of
their control. Two recent studies using experimental evidence from the Measures of Effective
Teaching (MET) project focus on the role of classroom composition. Steinberg and Garrett
(2016) find that students’ incoming academic performance is positively related to observation
ratings, and Campbell and Ronfeldt (2018) find that teachers with higher proportions of Black,
Hispanic, male, and low-performing students receive lower observation ratings even after
controlling for classroom-specific value-added measures. While the results of these studies
cannot rule out the possibility that the differences in ratings are driven by actual differences in
instructional quality across classrooms, they provide evidence consistent with the explanation
that classroom observers may be biased by the classroom context in their ratings.
It is important to note that the evidence from the MET project is based on ratings from a
low-stakes research study. The influence of classroom characteristics may be different in the
high-stakes context of a teacher evaluation system. Recent work has documented differences in
administrators’ scoring behavior in high- vs. low-stakes contexts, demonstrating that observation
ratings can be influenced by the complex, social environments in which administrators work
(Grissom & Loeb, 2017; Kraft & Gilmour, 2017; Qi et al., 2018).
B. Race-congruence and Gender-congruence
A growing body of research suggests that administrators’ race and gender identities, as
well as the race- or gender-congruence between teachers and administrators, play an important
role in teacher outcomes and the demographic composition of the teachers in the school. Using
nationally representative data from the Schools and Staffing Survey (SASS) and the Teacher
Follow-up Survey (TFS), Grissom and Keiser (2011) investigate the effect of race-congruence
between teachers and principals on teacher satisfaction and teacher turnover using propensity
A CLASSROOM OBSERVER LIKE ME 6
score matching models and school fixed effects models. They find that teachers with same-race
principals are more likely to stay in their schools and report higher job satisfaction.
Recent studies using state administrative data also corroborate the potential importance of
administrators’ race and gender. Husain, Matsa, and Miller (2018), using school and teacher
fixed effects models with data from New York State, find that male teachers are more likely to
exit their schools under female principals than under male principals. Bartanen & Grissom
(2019), find that principals in Missouri and Tennessee are more likely to hire same-race teachers,
a result that is partially explained by principals hiring from within their networks. The authors
also find that teachers with race-congruent principals are less likely to exit their schools.
While these studies highlight the role of race/gender characteristics in hiring, retention,
and job satisfaction, three recent studies raise the importance of teachers’ and raters’ racial
identities within the context of the observation and feedback cycle. Kraft and Christian (2019),
using teacher survey data from Boston, find that teachers of color who are evaluated by same-
race administrators report receiving higher-quality feedback. The positive relationship between
race-congruence and perceived feedback quality is partially explained by teachers’ perceptions
of their sense of mutual respect, trust, and enjoyment in working with their evaluators.
Campbell (2020), using data from North Carolina, examines gaps in summative
observation ratings between Black and White women teachers in middle schools. Using a school
fixed effects identification strategy, Campbell finds that principals rate White women teachers
higher than they rate Black women teachers, even after accounting for value-added measures,
teacher and classroom characteristics, and indicators for race-, gender-, and race-and-gender-
congruency. However, in this study, the gap in ratings between Black and White women was not
explained by race-, gender-, and race-and-gender-congruence between the teacher and principal.
A CLASSROOM OBSERVER LIKE ME 7
In a study that is closely related in topic to this one, Grissom and Bartanen (2020)
examine potential sources of race and gender biases in high-stakes teacher evaluations using data
from Tennessee. Using models that include controls for teacher characteristics and teacher work
assignment, indicators for observation round, rater fixed effects, and school-by-year fixed
effects, they find that teachers benefit, in terms of receiving higher observation ratings, when
they share race with their observers (0.03 SD). However, they do not find effects of gender
matching on observation ratings.
Taken all together, these studies put forth the importance of race and gender dynamics
and teacher-administrator relationships for the teacher observation and evaluation process. This
study builds upon and contributes to the prior research in this area by (1) providing an
exploration of how the sharing of other attributes and/or the degree of professional familiarity
between teachers and raters could mediate the effects of race- and gender-congruence, and (2)
employing estimation models that address threats to internal validity that remain in prior work.
In prior studies with fixed effects strategies where the identifying variation comes from across
individual teachers in the same race or gender subgroup (perhaps in the same school-year and/or
the same school), one may be concerned that estimates of the effects of race- or gender-
congruence are biased by the sorting of individual teachers to administrators/raters on
unobservable characteristics.1 In prior fixed-effects studies where the identifying variation comes
from within individuals across multiple school-years, one may be concerned about bias
stemming from how individuals sort to administrators/raters on unobservable characteristics over
time across school-years.2 In contrast, these patterns of sorting on unobservable characteristics
1 For example, the teachers within a school with relatively higher motivation may specifically seek out and lobby for race-congruent or gender-congruent raters. 2 For example, teachers may systematically seek out race-congruent or gender-congruent raters during school years in which they are struggling.
A CLASSROOM OBSERVER LIKE ME 8
do not pose threats to internal validity here. The models in this study estimate the effects of race
and gender congruence between teachers and their raters/administrators using within teacher-by-
year variation, while also accounting for rater differences across raters, observation rounds, and
time. Further details on the empirical strategy are presented in Section IV.
III. Data and Measures
A. Data and Sample
I use administrative data from a large district in North Carolina in school years 2013-
2014 to 2017-2018. During these years, the state required all teachers who are licensed by the
North Carolina Department of Instruction to be annually evaluated using the North Carolina
Teacher Evaluation Process (NCTEP), which includes two to three classroom observations that
are typically conducted by school administrators. The data includes information from each
classroom observation, as well as an identifier for the observer. The data also contains teacher
and administrator personnel records, which include race, gender, job classification, job location,
years of teaching experience, and teacher-student links.3
The data contain 114,000 classroom observations in 45,792 teacher-years from 13,753
unique teachers. I exclude 3.87% of the classroom observations that are conducted by non-
administrators or individuals outside of the teacher’s school. I also restrict to the sample of
individuals for whom I have two or three observations, further reducing the sample to 108,203
classroom observations. Lastly, as I am attempting to explore the role of race and gender
identities, I restrict my analytic sample to the two race subgroups for which I have a substantial
sample size: Black and White teachers who are observed by Black and White administrators.
3 Throughout this paper, I (mis)use the term “gender” to refer to the identities of teachers and administrators who have reported “male” or “female” to their district employer, thereby conflating “gender” and “sex.” This usage is incorrect, as these terms are not interchangeable. However, I do so to remain consistent with related prior literature that uses the terms “gender,” “gender-match,” and “gender-congruence.”
A CLASSROOM OBSERVER LIKE ME 9
This produces an analytic sample of 93,975 classroom observations in 38,262 teacher-years from
12,490 unique teachers. These observations were conducted by 2,319 observer-years from 672
unique observers.
Columns 1-4 of Table 1 provide summary characteristics for my analytic sample.
Thirteen percent of my sample identify as Black, and 81% are female. Teachers, on average,
have 12.3 years of teaching experience and are observed 2.5 times within a school year. Among
the classroom observers, 29% identify as Black and 60% are female. Thirty-five percent are
school principals and 65% are assistant principals. On average, an observer conducts 44
classroom observations in a school year.
B. Teacher Evaluation and Classroom Observation Ratings4
In NCTEP, each teacher is assigned to one of the three evaluation cycle types and
required to be formally or informally observed two or three times per school year. Formal
observations are intended to last 45 minutes or an entire class period, while informal
observations are intended to last at least 20 minutes. The three evaluation cycle types are:
• Comprehensive – teachers are required to receive three formal observations.
• Standard – teachers are required to have one formal observation and two additional
observations that can be formal or informal.
• Abbreviated – teachers are required to have two formal or informal observations.
Teachers with fewer than three years of consecutive employment must be evaluated using the
comprehensive cycle, while those with three or more years of consecutive employment can be
evaluated using any of the three cycles.
4 Information on the NCTEP was gathered from the manual North Carolina Teacher Evaluation Process (North Carolina State Board of Education, 2015).
A CLASSROOM OBSERVER LIKE ME 10
During classroom observations, the observer, who is typically a principal or assistant
principal, evaluates teachers on the Rubric for Evaluating North Carolina Teachers, which was
developed to align with the North Carolina Professional Teaching Standards. The rubric includes
five standards: Standard I - Teachers Demonstrate Leadership; Standard II - Teachers Establish a
Respectful Environment for a Diverse Population of Students; Standard III - Teachers Know the
Content they Teach; Standard IV - Teachers Facilitate Learning for their Students; and Standard
V - Teachers Reflect on their Practice. Each standard has between three and eight performance
elements, along with descriptors, that are used to evaluate teachers. Figure 1 provides an excerpt
of the rubric. The descriptors are classified under four categories (from lowest to highest):
Developing, Proficient, Accomplished, and Distinguished. During a classroom observation, the
rater checks the descriptors that they observe. If none of the descriptors are observed, then the
performance element is considered “Not Demonstrated.”
The rubric includes 25 elements across the five standards. However, in practice,
observers are not charged with checking off descriptors for each of the 25 elements; many of the
elements are not designed to be assessed during a classroom observation. For example, the
descriptors under “Element Ib. Teachers demonstrate leadership in the school” are demonstrated
by teachers’ participation in professional learning communities and school improvement plans,
which an observer cannot assess during a classroom lesson. Furthermore, the NCTEP manual
states that teachers undergoing the abbreviated evaluation cycle are only evaluated on Standards
I and IV during their classroom observations. As a result of this design, many parts of the rubric
are not completed, and I present the rates of missingness by element in Appendix Table A1. Only
seven of the 25 elements are filled in with checks for descriptors at least 90% of the time, and I
A CLASSROOM OBSERVER LIKE ME 11
use only the information from these seven elements to construct scores for each classroom
observation.5
In the NCTEP, individual classroom observations do not receive official ratings or scores.
Rather, the information from each classroom observation is compiled to form a teacher’s end-of-
year summary evaluation. After completing a teacher’s set of classroom observations, the
principal is directed to compile the checks on the descriptors from each classroom observation to
obtain the summary rating on each element for the teacher’s end-of-year summary evaluation.
The teacher receives a summary rating (Not Demonstrated, Developing, Proficient,
Accomplished, or Distinguished) that matches the highest rating under which all the descriptors
were observed at least once across all the classroom observation.6
Since individual classroom observations do not receive official ratings, I assign element
ratings for each of these seven most consistently used elements on the rubric by: (a) examining
the descriptors that were checked off as being present during the classroom observation, and (b)
assigning the highest rating under which all the descriptors are checked, similar to the procedure
described above. I provide illustrative examples of how this assignment rule is applied in
Appendix Section A. Results are also quite similar under the following alternative rules for
assigning element ratings from observed descriptors: (a) assign the highest rating under which
any descriptors are checked, or (b) assign the highest rating under which at least half of the
descriptors are checked.
5 The seven elements with non-missing rates of 90% or more are: Ia - Teachers lead in their classrooms; IVa - Teachers know the ways in which learning takes place, and they know the appropriate levels of intellectual, physical, social, and emotional development of their students; IVb - Teachers plan instruction appropriate for their students; IVc - Teachers use a variety of instructional methods; IVe - Teachers help students develop critical thinking and problem-solving skills; IVg - Teachers communicate effectively; and IVh - Teachers use a variety of methods to assess what each student has learned. 6 For example, take a teacher who receives checks for all the descriptors under Element IVa, as shown in Figure 1, except the following descriptor in the Distinguished column: “Encourages and guides colleagues to adapt instruction to align with students’ developmental levels.” This teacher receives a rating of “Accomplished” because it is the highest rating category under which she was observed to have met all of the descriptors.
A CLASSROOM OBSERVER LIKE ME 12
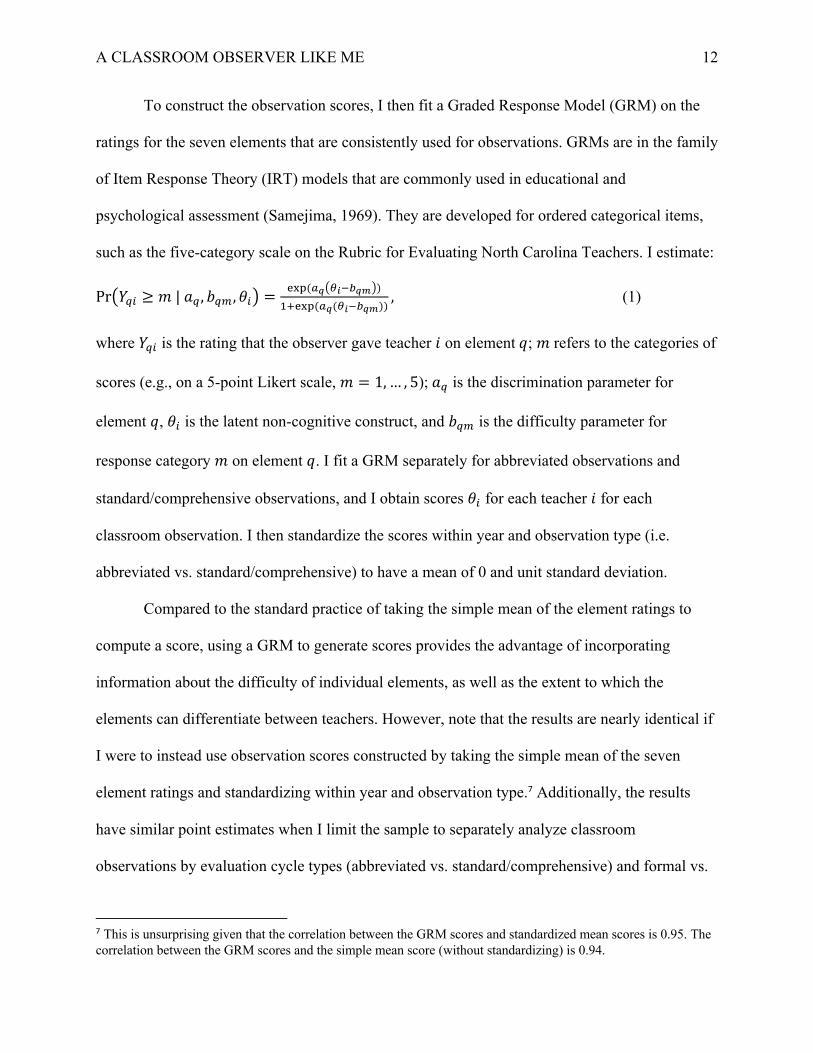
To construct the observation scores, I then fit a Graded Response Model (GRM) on the
ratings for the seven elements that are consistently used for observations. GRMs are in the family
of Item Response Theory (IRT) models that are commonly used in educational and
psychological assessment (Samejima, 1969). They are developed for ordered categorical items,
such as the five-category scale on the Rubric for Evaluating North Carolina Teachers. I estimate:
Pr#$!" ≥ &|)! , +!#, ,"- =$%&((!)*"+,!#-)/0$%&((!(*"+,!#))
, (1)
where $!" is the rating that the observer gave teacher / on element0; & refers to the categories of
scores (e.g., on a 5-point Likert scale, & = 1,… , 5);)! is the discrimination parameter for
element 0, ," is the latent non-cognitive construct, and +!# is the difficulty parameter for
response category & on element 0. I fit a GRM separately for abbreviated observations and
standard/comprehensive observations, and I obtain scores ," for each teacher / for each
classroom observation. I then standardize the scores within year and observation type (i.e.
abbreviated vs. standard/comprehensive) to have a mean of 0 and unit standard deviation.
Compared to the standard practice of taking the simple mean of the element ratings to
compute a score, using a GRM to generate scores provides the advantage of incorporating
information about the difficulty of individual elements, as well as the extent to which the
elements can differentiate between teachers. However, note that the results are nearly identical if
I were to instead use observation scores constructed by taking the simple mean of the seven
element ratings and standardizing within year and observation type.7 Additionally, the results
have similar point estimates when I limit the sample to separately analyze classroom
observations by evaluation cycle types (abbreviated vs. standard/comprehensive) and formal vs.
7 This is unsurprising given that the correlation between the GRM scores and standardized mean scores is 0.95. The correlation between the GRM scores and the simple mean score (without standardizing) is 0.94.
A CLASSROOM OBSERVER LIKE ME 13
informal observations (proxied by observation lengths of above and below 45 minutes,
respectively).8
C. Scores by Subgroup
Table 2 provides the mean and standard deviations of teachers’ observation scores by
subgroup. The mean observation score across my analytic sample is 0.013. Consistent with prior
research (e.g., Campbell & Ronfeldt, 2018, Drake et al., 2019, Jacob & Walsh, 2011, Jiang &
Sporte, 2016), I find large raw gaps in ratings by race and gender, where Black teachers and male
teachers receive lower scores than their counterparts. As shown in Column 2, the Black-White
gap is about 0.18 SD (Black mean = -0.14 SD; White mean = 0.04 SD), whereas the male-female
gap is about 0.20 SD (male mean = -0.15 SD; female mean = 0.05 SD).9 To further examine the
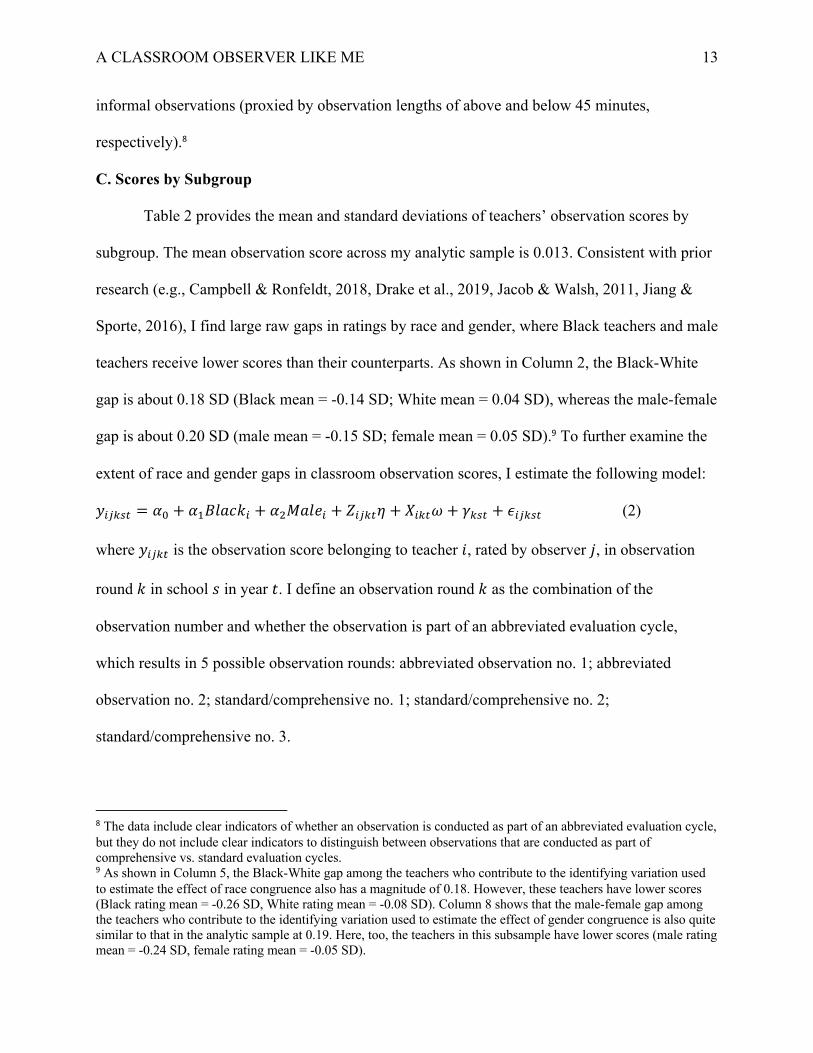
extent of race and gender gaps in classroom observation scores, I estimate the following model:
4"1234 = 55 + 5/78)9:" + 56;)8<" + ="124> + ?"24@ + A234 + B"1234 (2)
where 4"124 is the observation score belonging to teacher /, rated by observer C, in observation
round : in school D in year E. I define an observation round : as the combination of the
observation number and whether the observation is part of an abbreviated evaluation cycle,
which results in 5 possible observation rounds: abbreviated observation no. 1; abbreviated
observation no. 2; standard/comprehensive no. 1; standard/comprehensive no. 2;
standard/comprehensive no. 3.
8 The data include clear indicators of whether an observation is conducted as part of an abbreviated evaluation cycle, but they do not include clear indicators to distinguish between observations that are conducted as part of comprehensive vs. standard evaluation cycles. 9 As shown in Column 5, the Black-White gap among the teachers who contribute to the identifying variation used to estimate the effect of race congruence also has a magnitude of 0.18. However, these teachers have lower scores (Black rating mean = -0.26 SD, White rating mean = -0.08 SD). Column 8 shows that the male-female gap among the teachers who contribute to the identifying variation used to estimate the effect of gender congruence is also quite similar to that in the analytic sample at 0.19. Here, too, the teachers in this subsample have lower scores (male rating mean = -0.24 SD, female rating mean = -0.05 SD).
A CLASSROOM OBSERVER LIKE ME 14
="124 is a vector of observation-level covariates: a quartic function for the time length in
minutes, indicators for the starting hour, and indicators for the month in which the observation is
conducted. ?"24 are teacher-level covariates, including a function of years of teacher experience,
indicators for teaching assignment (e.g., first grade, middle school science, high school English
language arts (ELA), etc.), and characteristics of teacher /’s linked students in school year E. The
student characteristics include the share of students in each race group, who are male, have an
English learner status, have a special education status, have a math gifted status, have an ELA
gifted status, and for students in grades 4 and up, mean prior test scores.
A234 represents fixed effects for the school-by-observation round-by-year. By including
these fixed effects, teacher C’s score from round : is compared with the round : observation
scores belonging to the other teachers in the same school during the same school year.
78)9:" and ;)8<" are indicators for whether teacher / identifies as Black and male,
respectively. Here, the coefficient 5/ represents the scores of Black teachers relative to White
teachers, and 56 represents the scores of male teachers relative to female teachers. These
coefficients provide the magnitudes of the gaps that are unexplained by the teacher
characteristics and school-by-observation round-by-year fixed effects included in the model.
Table 3 presents the results from estimating Equation 2. Column 1 shows that the Black-
White gap is -0.12 SD and the female-male gap is -0.16 SD after controlling for observation
characteristics, as well as fixed effects for the school-round-year. Even after including additional
controls for teacher experience, assignment, and linked student characteristics, the gaps remain
similarly sized (Column 2).
Next, I explore whether differences in teachers’ contributions to test scores can explain
some of the remaining gaps in classroom observation scores. To do so, for math and ELA
A CLASSROOM OBSERVER LIKE ME 15
teachers in tested grades, I include teacher/’s test score value-added measure from time E in the
right-hand side of Equation 2.10 Columns 3-4 and 5-6 limit the sample to include teachers with
math and ELA value-added estimates, respectively. Evidence from prior research suggests that
the distribution of performance measures for teachers in high-stakes grades/subjects may be
different from that in low-stakes grades/subjects, as administrators make strategic staffing
decisions in response to accountability pressures (Chingos & West, 2011; Grissom et al., 2017).
Columns 3 and 5, which include the same covariates as Column 2, indeed highlight a
compositional change. Within these samples, the estimated Black-White gaps are smaller (0.08
SD in math sample and 0.08 SD in ELA sample) and no longer statistically significant. The
male-female gaps in these samples, however, are still large and statistically significant: 0.20 SD
and 0.21 SD in the math and ELA value-added samples, respectively.
Using the same sample of observations as Columns 3 and 5, Columns 4 and 6 present the
coefficients on 78)9:" and ;)8<" after accounting for teacher quality as measured by value-
added to test scores. The point estimates of the race and gender gaps decrease slightly in the
math value-added sample, but generally, the estimates remain fairly stable even after this
inclusion of value-added measures. At least in these limited samples, the results provide
evidence that differences in teachers’ estimated contributions to test scores do not account for the
gaps in classroom observation scores.
Value-added measures may be limited in that they capture contributions to test scores, but
not necessarily other important aspects of teacher quality. And so, the gaps in observation scores
may reflect genuine differences in teacher quality that are not captured by differences in value-
added measures. Nevertheless, such results, here and in prior research, raise concerns about
possible factors that lead to gaps in observation scores but are not related to teacher quality.
10 See Appendix Section B for value-added model details.
A CLASSROOM OBSERVER LIKE ME 16
IV. Empirical Strategy
In this paper, I ask: (1) What are the effects of race-congruence and gender-congruence
between teachers and raters on teachers’ classroom observation ratings? In other words, I
examine whether teachers receive higher or lower scores as a result of sharing race or gender
identities with their observers. (2) Are the effects of race- or gender-congruence mediated by the
sharing of other attributes, such as education history or teaching assignment history?
A. Race-congruence and Gender-congruence
To examine the impact of sharing racial or gender identities with a classroom observer on
observation scores, I estimate a model with two-way fixed effects:
4"124 =F5 + F/;)E9ℎ_I"124 + ="124J + K"4 + L124 + M"124 (3)
Here, ;)E9ℎ_I"124 is an indicator that equals 1 if teacher / and observer C share the same
characteristic of interest I. ="124 are controls for the characteristics of the classroom observation;
these are the same as those in Equation 2.
K"4 represents teacher-by-year fixed effects, which control for unobserved teacher quality
and other teacher characteristics that are invariant within year E. By including K"4, I control for
the possibility that better or worse teachers – or teachers in their better or worse school years –
are systematically sorting to classroom observers who share their characteristics. With the
inclusion of K"4, I am comparing a teacher’s observation score to the other observation scores she
received in the same school year E. This implies that the identifying variation comes from
teacher-years in which the teacher is observed by at least one rater who shares the characteristic
of interest and at least one rater who does not in the same school-year. Columns 5-8 and 9-12 of
Table 1 provide descriptive characteristics of teachers and observers who contribute to the
A CLASSROOM OBSERVER LIKE ME 17
identifying variation used to estimate the effect of race and gender congruence effects,
respectively. Columns 4-9 of Table 2 also provide mean scores for these teachers.
L124 represents observer-by-round-by-year fixed effects. Including L124 controls for
observer characteristics, as well as shocks, that are common across all the classroom
observations conducted by observer Cin round : in school year E. For example, individual
observers may vary in their average difficulty or harshness as raters, and individual raters’
difficulty may even vary across school-years and/or observation rounds. By including this set of
fixed effects, I account for such unobserved and observed differences in rater characteristics
across raters, rounds, and time. Standard errors are two-way clustered at the teacher-level and
observer-level.
F/ represents the average effect of a teacher and the classroom observer sharing the
characteristic I. That is, for teacher / and observer C who share the characteristic I, F/ is the
estimated difference in the score that teacher / receives from observer Cas a result of sharing that
characteristic. Absent the sharing of characteristic I, teacher / is predicted to have received the
same score minus F/ from observer C. It is important to note that the observer-round-year fixed
effects absorb the “main effect” of observer race or observer gender (e.g., if female raters on
average have higher standards for all the teachers they observe). I prefer to include this set of
observer-round-year fixed effects because doing so separates the “main effect” of observers from
the race or gender interaction effects of interest. For example, when the characteristic of interest
I is race, F/ is a weighted average of the interaction effect for Black teachers observed by Black
raters and the interaction effect for White teachers observed by White raters. Any main effect of
having a Black rater or White rater is not included in F/ when observer-round-year fixed effects
are included.
A CLASSROOM OBSERVER LIKE ME 18
To interpret F/ as the average effect of race or gender congruence between teachers and
their raters, the identifying assumption is that, among the observations that a teacher receives in
the same school year, selection into having an observer who shares the characteristic I is
uncorrelated with unobserved determinants of observation scores. The coefficient F/ could be
biased if systematic sorting to same-race or same-gendered raters occurs within teacher-years.
One could imagine tales of how non-random assignment of teachers to raters within school-years
could bias the estimate of F/ in either direction. For example, if race- or gender-matches
systematically coincide with teachers having extra motivation during the window for an
observation round, the estimate of F/ would be biased upward. In this example, teachers’ extra
motivation acts as an omitted variable, allowing teachers to both lobby for a same-race or same-
gendered rater and perform better as teachers. However, as an additional example, if teachers are
systematically assigned to same-race or same-gendered raters during relative rough patches in
the school-year, perhaps because administrators believe it will lessen the stress put on those
teachers, the estimate of F/ would be biased downward. Such systematic sorting poses threats to
the validity of my estimates. However, I do not find evidence of problematic sorting of teachers
to same-race or same-gendered raters within school-year in the data. In Appendix Section C, I
provide evidence against problematic sorting.
B. Exploring Potential Mediators
The second part of my analysis explores additional characteristics of the relationships
between teachers and their observers that could mediate the effects of race- or gender-
congruence estimated above. The extent to which teachers experience gains in observation scores
from race- or gender-congruence with their observers could be mediated by other characteristics
of the relationships between teachers and observers. For example, one could imagine there exists
A CLASSROOM OBSERVER LIKE ME 19
systematic sorting of female and male teachers to different subjects/content areas. If so, the
effects of gender congruence could be mediated by having an observer who shares the same
subject-specific content knowledge as the teacher.
To investigate potential mediators of the effects of race- or gender-congruence, I use
district administrative data with staff assignments going back to 2003 to generate variables that
capture commonalities between teachers and their observers.
• To assess the role of sharing content knowledge and experience teaching the same
content, I create an indicator that equals 1 if the observer C has ever taught the same
teaching assignment as that of teacher / at the time of the observation.
• To assess the role of attending the same university, I create an indicator that equals 1 if
teacher / and observer C both have degrees from the same university.
• To assess the role of attending a university in the same state, I create an indicator that
equals 1 if teacher / and observer C both have degrees from universities in the same state.
To attempt to measure the impact of having existing relationships with a classroom observer, I
also create variables that measure the degree of familiarity that teacher / and observer C have
with one another. Specifically, I examine:
• the discrete number of school years in which teacher / and observer C have worked in the
same school; and
• the discrete number of school years in which teacher / and observer C have had the same
teaching assignment while working in the same school. This measures familiarity from
working on the same grade-level or content team.
I then re-estimate Equation 3 with the inclusion of these generated variables in the right-
hand side. Changes, or lack thereof, in the coefficients on the indicators for race or gender
A CLASSROOM OBSERVER LIKE ME 20
congruence provide evidence of the extent to which these measures of commonalities or
familiarity act as mediators.
V. Results
A. Race-congruence and Gender-congruence Between Teachers and Raters
Race congruence. Table 4 presents the estimates of the effects of race-matching between
teachers and their observers. I first focus on the results for having a same-race classroom
observer (Panel A) before turning to results for the effect of having a same-gender classroom
observer (Panel B). In Column 1, I present results using a specification that includes teacher-year
fixed effects and controls for the characteristics of the observation, as well as school-round-year
fixed effects, which account for shocks that are common across all the classroom observations in
the same school, same observation round, and same school-year. Note that, unlike my preferred
specification as described in Equation 3, observer-round-year fixed effects are not included. That
is, I do not control for observer characteristics in Column 1.11 Using within teacher-year
variation, I find that teachers who are observed by race congruent teachers, on average, have
0.08 SD higher scores (Panel A).
Since this estimate is from a specification that does not account for observer
characteristics, it could reflect observer characteristics that happen to vary with race and may not
be reflective of racial dynamics between teachers and their raters. In Column 2, I re-estimate the
specification used in Column 1, now including controls for the observer position (i.e., principal
vs. assistant principal) and a quadratic function of years of administrator experience. The results
are very similar, which indicates that these particular rater characteristics do not drive the result.
11 The estimates in Column 1 conflate the raters’ “main effects” (i.e., the effects of individual raters that are applicable to all teachers) with the effects of race or gender interactions.
A CLASSROOM OBSERVER LIKE ME 21
Nevertheless, there may be additional unobserved rater characteristics or experiences that happen
to vary with race and explain the apparent effect.
In Column 3, I estimate my preferred specification as shown in Equation 3, which
includes observer-round-year fixed effects instead of school-round-year fixed effects. In doing
so, I now control for unobserved rater characteristics, in addition to other shocks, that are
common across all the classroom observations conducted by the same rater in the same school,
round, and school year. Here, the observer-round-year fixed effects absorb any “main effects” of
observer race (e.g., if Black raters, for whatever reason, have higher standards for all the teachers
they observe), thereby leaving the coefficient of interest to reflect race interaction effects. After
including this set of fixed effects, the estimated effect of having a race congruent observer is 0.03
SD. As a point of comparison, this magnitude is about 10% of the estimated average within-
teacher returns to experience after 1 year of teaching.12
In this pooled specification, this estimated effect is a weighted average of the interaction
effect for Black teachers observed by Black raters and the interaction effect for White teachers
observed by White raters. To investigate potential differences in the extent to which racial
subgroups benefit from sharing characteristics with their observers (i.e., include interactions for
race congruence by subgroup), I must modify the preferred specification, as I cannot
simultaneously include: a) teacher-year fixed effects, b) observer-round-year fixed effects, and c)
interactions for race congruence by subgroup.13 In this modification, I once again exclude
12 The average within-teacher returns to experience after 1 year of teaching (relative to the novice year) is 0.316. To obtain this estimate, I model observation scores as a function of experience, teacher fixed effects, and teaching assignment-by-year fixed effects. The function of experience includes individual indicator variables for years 1-10, and indicators for 11-15, 16-20, 21-25, and 26+ years of experience. 13 Equation 3 includes both teacher-year fixed effects, which absorb the interaction for one of the teacher subgroup (e.g., White teachers), and observer-round-year fixed effects, which absorb the interaction for one of the observer groups (e.g., White observers). Including both sets of fixed effects would imply that only one of four possible interactions (i.e., White teacher/White observer; Black teacher/White observer; Black teacher/White observer; Black teacher/Black observer) could be identified. Therefore, in order to estimate interactions for race-congruence by
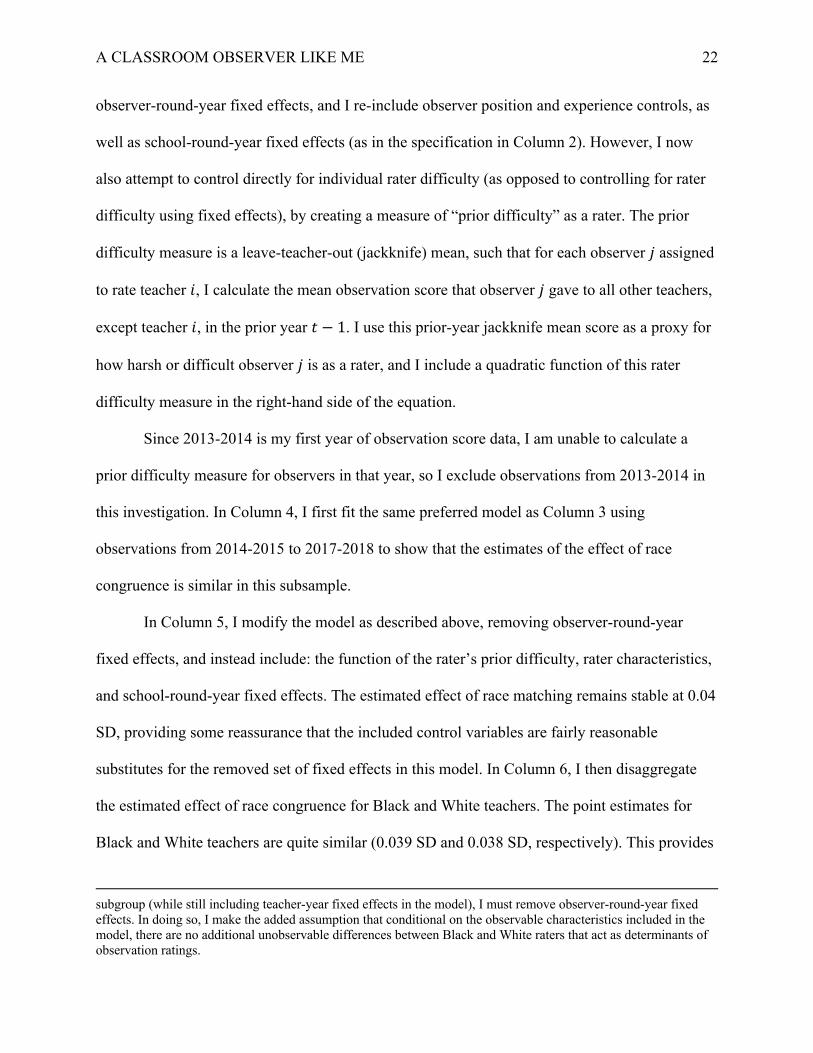
A CLASSROOM OBSERVER LIKE ME 22
observer-round-year fixed effects, and I re-include observer position and experience controls, as
well as school-round-year fixed effects (as in the specification in Column 2). However, I now
also attempt to control directly for individual rater difficulty (as opposed to controlling for rater
difficulty using fixed effects), by creating a measure of “prior difficulty” as a rater. The prior
difficulty measure is a leave-teacher-out (jackknife) mean, such that for each observer C assigned
to rate teacher /, I calculate the mean observation score that observer C gave to all other teachers,
except teacher /, in the prior year E − 1. I use this prior-year jackknife mean score as a proxy for
how harsh or difficult observer C is as a rater, and I include a quadratic function of this rater
difficulty measure in the right-hand side of the equation.
Since 2013-2014 is my first year of observation score data, I am unable to calculate a
prior difficulty measure for observers in that year, so I exclude observations from 2013-2014 in
this investigation. In Column 4, I first fit the same preferred model as Column 3 using
observations from 2014-2015 to 2017-2018 to show that the estimates of the effect of race
congruence is similar in this subsample.
In Column 5, I modify the model as described above, removing observer-round-year
fixed effects, and instead include: the function of the rater’s prior difficulty, rater characteristics,
and school-round-year fixed effects. The estimated effect of race matching remains stable at 0.04
SD, providing some reassurance that the included control variables are fairly reasonable
substitutes for the removed set of fixed effects in this model. In Column 6, I then disaggregate
the estimated effect of race congruence for Black and White teachers. The point estimates for
Black and White teachers are quite similar (0.039 SD and 0.038 SD, respectively). This provides
subgroup (while still including teacher-year fixed effects in the model), I must remove observer-round-year fixed effects. In doing so, I make the added assumption that conditional on the observable characteristics included in the model, there are no additional unobservable differences between Black and White raters that act as determinants of observation ratings.
A CLASSROOM OBSERVER LIKE ME 23
some suggestive evidence that, conditional on the included observer characteristics, each subset
of teachers benefits from being rated by a same-race classroom observer, and the magnitude of
the benefit is comparable. However, I note that the estimate for Black teachers is not statistically
significant given the smaller share of Black teachers, and the estimate for White teachers is only
marginally significant.
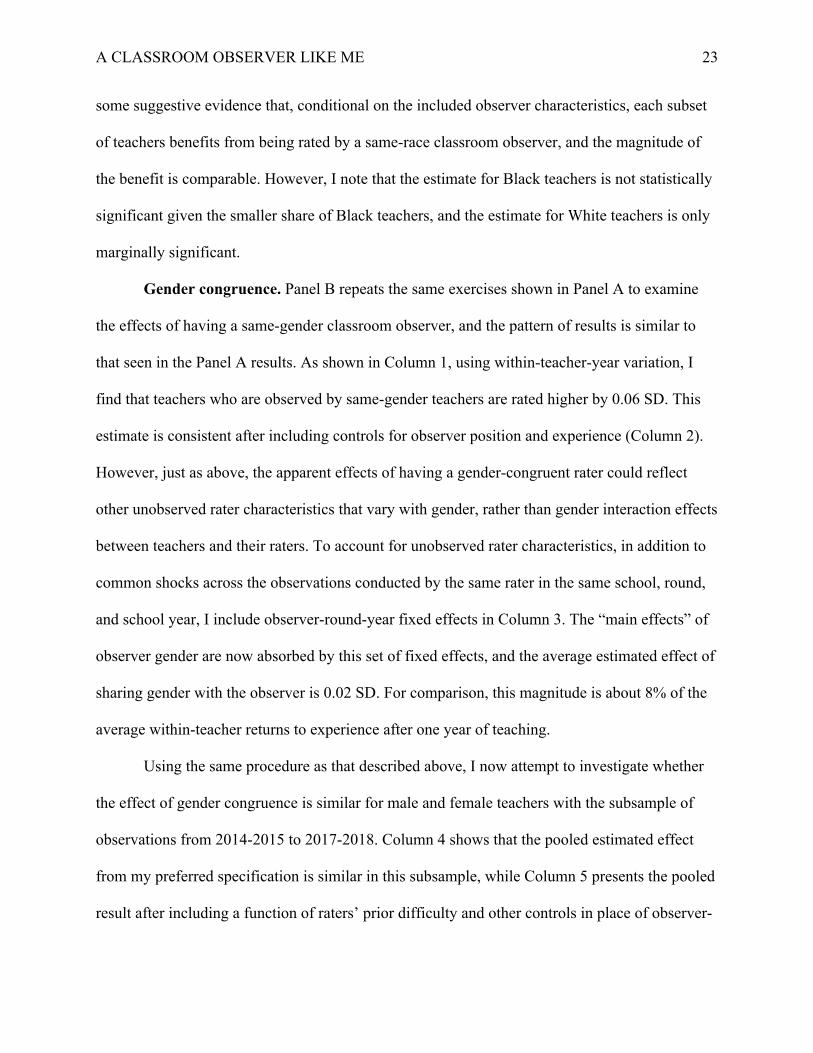
Gender congruence. Panel B repeats the same exercises shown in Panel A to examine
the effects of having a same-gender classroom observer, and the pattern of results is similar to
that seen in the Panel A results. As shown in Column 1, using within-teacher-year variation, I
find that teachers who are observed by same-gender teachers are rated higher by 0.06 SD. This
estimate is consistent after including controls for observer position and experience (Column 2).
However, just as above, the apparent effects of having a gender-congruent rater could reflect
other unobserved rater characteristics that vary with gender, rather than gender interaction effects
between teachers and their raters. To account for unobserved rater characteristics, in addition to
common shocks across the observations conducted by the same rater in the same school, round,
and school year, I include observer-round-year fixed effects in Column 3. The “main effects” of
observer gender are now absorbed by this set of fixed effects, and the average estimated effect of
sharing gender with the observer is 0.02 SD. For comparison, this magnitude is about 8% of the
average within-teacher returns to experience after one year of teaching.
Using the same procedure as that described above, I now attempt to investigate whether
the effect of gender congruence is similar for male and female teachers with the subsample of
observations from 2014-2015 to 2017-2018. Column 4 shows that the pooled estimated effect
from my preferred specification is similar in this subsample, while Column 5 presents the pooled
result after including a function of raters’ prior difficulty and other controls in place of observer-
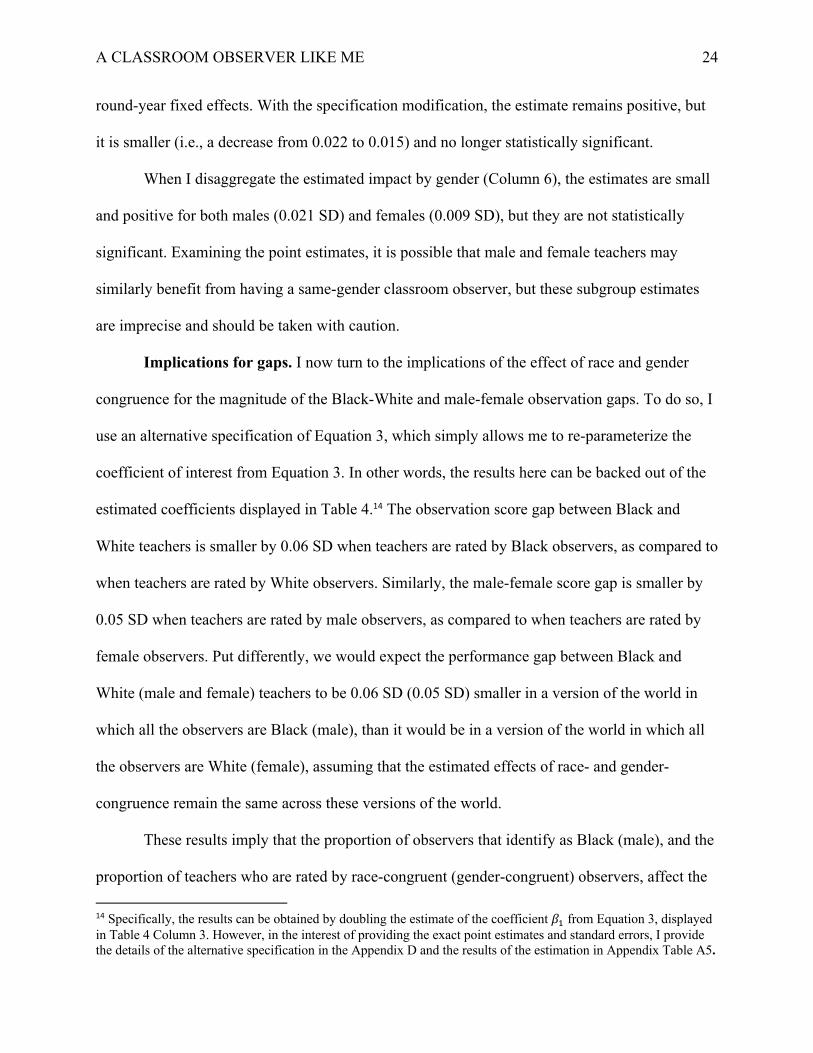
A CLASSROOM OBSERVER LIKE ME 24
round-year fixed effects. With the specification modification, the estimate remains positive, but
it is smaller (i.e., a decrease from 0.022 to 0.015) and no longer statistically significant.
When I disaggregate the estimated impact by gender (Column 6), the estimates are small
and positive for both males (0.021 SD) and females (0.009 SD), but they are not statistically
significant. Examining the point estimates, it is possible that male and female teachers may
similarly benefit from having a same-gender classroom observer, but these subgroup estimates
are imprecise and should be taken with caution.
Implications for gaps. I now turn to the implications of the effect of race and gender
congruence for the magnitude of the Black-White and male-female observation gaps. To do so, I
use an alternative specification of Equation 3, which simply allows me to re-parameterize the
coefficient of interest from Equation 3. In other words, the results here can be backed out of the
estimated coefficients displayed in Table 4.14 The observation score gap between Black and
White teachers is smaller by 0.06 SD when teachers are rated by Black observers, as compared to
when teachers are rated by White observers. Similarly, the male-female score gap is smaller by
0.05 SD when teachers are rated by male observers, as compared to when teachers are rated by
female observers. Put differently, we would expect the performance gap between Black and
White (male and female) teachers to be 0.06 SD (0.05 SD) smaller in a version of the world in
which all the observers are Black (male), than it would be in a version of the world in which all
the observers are White (female), assuming that the estimated effects of race- and gender-
congruence remain the same across these versions of the world.
These results imply that the proportion of observers that identify as Black (male), and the
proportion of teachers who are rated by race-congruent (gender-congruent) observers, affect the
14 Specifically, the results can be obtained by doubling the estimate of the coefficient !$ from Equation 3, displayed in Table 4 Column 3. However, in the interest of providing the exact point estimates and standard errors, I provide the details of the alternative specification in the Appendix D and the results of the estimation in Appendix Table A5.
A CLASSROOM OBSERVER LIKE ME 25
magnitude of the performance gap. The extents to which the performance gaps could fluctuate as
a function of these characteristics of the classroom observation system are non-trivial; 0.06 SD is
roughly one-third of the magnitude of the unconditional Black-White gap in observation scores,
and 0.05 SD is roughly a quarter of the size of the unconditional male-female gap.15
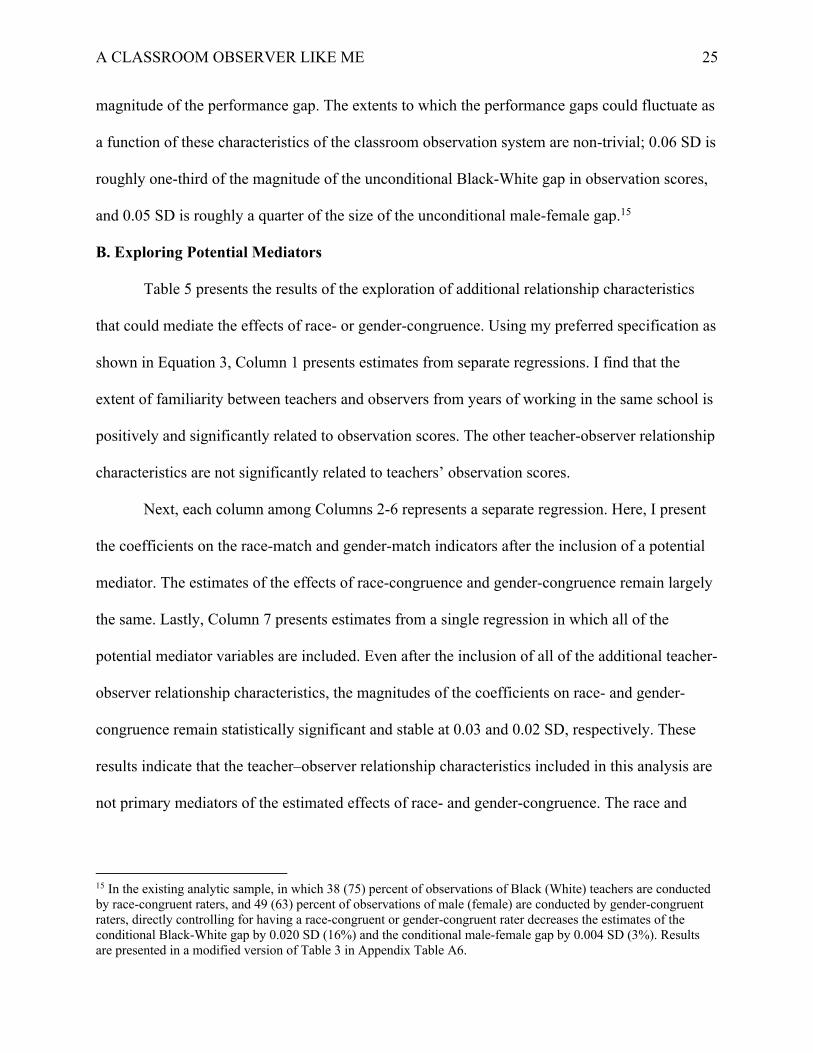
B. Exploring Potential Mediators
Table 5 presents the results of the exploration of additional relationship characteristics
that could mediate the effects of race- or gender-congruence. Using my preferred specification as
shown in Equation 3, Column 1 presents estimates from separate regressions. I find that the
extent of familiarity between teachers and observers from years of working in the same school is
positively and significantly related to observation scores. The other teacher-observer relationship
characteristics are not significantly related to teachers’ observation scores.
Next, each column among Columns 2-6 represents a separate regression. Here, I present
the coefficients on the race-match and gender-match indicators after the inclusion of a potential
mediator. The estimates of the effects of race-congruence and gender-congruence remain largely
the same. Lastly, Column 7 presents estimates from a single regression in which all of the
potential mediator variables are included. Even after the inclusion of all of the additional teacher-
observer relationship characteristics, the magnitudes of the coefficients on race- and gender-
congruence remain statistically significant and stable at 0.03 and 0.02 SD, respectively. These
results indicate that the teacher–observer relationship characteristics included in this analysis are
not primary mediators of the estimated effects of race- and gender-congruence. The race and
15 In the existing analytic sample, in which 38 (75) percent of observations of Black (White) teachers are conducted by race-congruent raters, and 49 (63) percent of observations of male (female) are conducted by gender-congruent raters, directly controlling for having a race-congruent or gender-congruent rater decreases the estimates of the conditional Black-White gap by 0.020 SD (16%) and the conditional male-female gap by 0.004 SD (3%). Results are presented in a modified version of Table 3 in Appendix Table A6.
A CLASSROOM OBSERVER LIKE ME 26
gender dynamics between teachers and their raters appear to exist separately from the
relationship characteristics included here.
However, it is important to emphasize that there exist many other relationship-based
explanations for the effects of race- and gender-congruence that are worth exploring, and this
analysis is limited by the teacher–observer relationship characteristics that could be generated
using available administrative data. For example, one could imagine there exists racial
homophily among school staff such that staff members are better friends with other staff
members of the same race. If so, the effects of race congruence could be mediated by the
strength of the friendship between teachers and observers who share the same race. Here, I’m
unable to generate a measure of friendship strength, or other in-depth measures of relationships,
between teachers and observers. To further investigate explanations for the effects of race- and
gender-congruence, future research could use surveys or interviews to capture richer measures of
relationship characteristics.
C. Heterogeneity, Robustness, and Limitations
In Appendix Section E, I explore the potential heterogeneity in the effects of having a
race- or gender-congruent observer across subgroups of teachers by intersections of race and
gender, teaching experience, and prior evaluation scores. As discussed in the Appendix, I do not
find any evidence of problematic differential sorting of teachers to race- or gender-congruent
observers (Section C), nor do I find any evidence that the results are driven by the inability to
control for the characteristics of the specific set of students sitting in a teacher’s classroom
during each classroom observation (Section F). Appendix Section G also provides a discussion
of the potential challenges to the generalizability of this study.
VI. Conclusion and Discussion
A CLASSROOM OBSERVER LIKE ME 27
In this paper, I examine how race and gender congruence between teachers and their
administrators/raters affect the subjective assessments of teachers. Leveraging data from
classroom observations, I employ two-way fixed effects models that address threats to internal
validity that remain in prior work on the effects of race-matches and gender-matches between
teachers and administrators. I find that teachers, on average, experience small positive increases
in their observation scores from sharing race or gender with their observer. While the estimated
effect sizes for race-congruence (0.03 SD) and gender-congruence (0.02 SD) seem fairly small,
these dynamics imply that the estimated sizes of the Black-White and male-female observation
score gaps could fluctuate by as much as 0.06 SD and 0.05 SD, respectively, as a function of the
proportion of raters from underrepresented groups and how they are assigned to teachers.
To the extent that performance measures – and gaps in performance measures – may
influence teachers’ self-efficacy and/or teachers’ decisions to remain in the teacher workforce,
these characteristics of the classroom observation system could potentially enlarge gaps in
teacher retention between Black and White (male and female) teachers. In other locations with
similar conditions to those in the context of this study – in which Black (male) teachers are both
underrepresented and less likely to have race-congruent (gender-congruent) raters – this potential
link between performance gaps and workforce retention gaps may dampen efforts to retain
underrepresented teachers and diversify the workforce.
I also explore whether other characteristics of the relationships between teachers and their
observers mediate the estimated effects of race- and gender-congruence. While I do find that the
extent of professional familiarity between teachers and observers (as measured by years of
working in the same school) is significantly related to observation scores, I do not find that any
of my included relationship measures mediate the race and gender congruence effects. However,
A CLASSROOM OBSERVER LIKE ME 28
these included measures are limited. Future research could investigate the potential mediating
role of relationships using richer measures of the strength and quality of the personal and
professional relationships between teachers and observers/administrators.
As with prior research that has documented the effects of race- or gender-congruence, the
mechanisms at work are unclear. One possible explanation is that raters’ perceptions and
assessments of instructional quality are influenced by teachers’ race or gender identities –
perhaps, consciously or subconsciously, as a result of ingroup favoritism (see, e.g., Tajfel &
Turner, 1979; Stauffer & Buckley, 2005). An alternative explanation is that raters may hold
implicit or explicit biases against specific subgroups of teachers. Recent work by Chin et al.
(2020) examines teachers’ implicit Black/White bias (as measured by the implicit association
test), documenting that teachers’ implicit bias appears, on average, to vary across race and
gender identities. For instance, they find that teachers of color appear less biased than White
teachers. Therefore, it is possible that variation in anti-Black implicit bias across Black and
White raters may serve as a mechanism for the effects of race-congruence between teachers and
raters. Yet another alternative explanation is that teachers feel less anxiety teaching in front of
raters who belong to their ingroup (see, e.g., Stephan, 2014). As a result, they perform better in
these observed lessons, and their improved performance is reflected in their observation ratings.
The underlying mechanisms and how they manifest across Black and White (male and
female) teachers may have implications for the diversity of the teacher workforce. For example,
the presence of racial bias may not only exacerbate performance gaps, but may also contribute to
difficulty in recruiting and retaining teachers of color. Or, the presence of ingroup favoritism
among a workforce that is predominantly White and female may also lead to exclusion of
underrepresented teachers in the teacher workforce. Unfortunately, the data cannot be used to
A CLASSROOM OBSERVER LIKE ME 29
determine which, if any, of these mechanisms are at play, and it cannot speak to whether and
which observers, if any, are more/less biased or accurate in their ratings. Additional research is
needed, perhaps in the form of field experiments designed to test possible mechanisms.
Even though the underlying mechanisms are unclear, the results speak to the extant
research that suggests that observation scores can be influenced by factors that are beyond
teachers’ control. This raises fairness concerns for teachers whose race or gender identities are
not reflected by any of their administrators. However, as also pointed out by Campbell and
Ronfeldt (2018), such results do not imply that states and districts should discontinue classroom
observations. Rather, the results implore those who use observation scores and evaluation scores
to carefully consider the circumstances and context under which the scores were generated when
making decisions. For example, administrators may consider a teacher’s history of observation
scores when deliberating over whether to renew her contract. Similarly, administrators,
superintendents, or other district officials may consider observation scores when examining the
short list of teachers who are being considered for promotion to leadership or specialist positions.
The results from this study suggest that these decision makers should perhaps consider the extent
to which teachers may have benefitted from race- or gender-congruence or lacked such benefits.
Future studies might explore best practices for how leaders can account for factors that are
beyond teachers’ control in the decision-making process.
Furthermore, the results in this study do not imply that teachers should necessarily be
assigned to race- or gender-congruent observers by default, as teachers’ instructional practice
could benefit from other types of strategic assignment to observers (e.g., Papay, Taylor, Tyler, &
Laski, 2020). Rather, the results prompt future research to: (a) investigate what are the elements
of these race- and gender-congruent pairings that could help improve the observation and
A CLASSROOM OBSERVER LIKE ME 30
feedback process, and (b) uncover how best to support and promote the development of teachers
who may not have these benefits.
More broadly, this study contributes rigorous evidence to the growing literature on the
role of teachers’ and administrators’ race and gender identities (Bartanen & Grissom, 2019;
Grissom & Bartanen, 2020; Grissom & Keiser, 2011; Husain et al., 2018; Kraft & Christian,
2019). The results prompt further investigation into how race and gender dynamics influence the
subjective assessments of teachers throughout the teacher pipeline. Administrators frequently
rely on their subjective judgments to make human resources decisions, and the dynamics that
operate in the context of subjective observation ratings may be relevant in the context of other
stages of the pipeline. For example, one could imagine that similar race and gender dynamics
could be at play when administrators observe and evaluate teacher applicants’ demonstration
lessons during the interviewing process. The presence of these dynamics could contribute to
performance/assessment gaps by race or gender in the teacher hiring process, perhaps
disadvantaging underrepresented teacher applicants, who may be less likely to be assessed by
race- or gender-congruent administrators. Larger race- or gender-based performance/assessment
gaps within the teacher hiring process could, in turn, contribute to worse hiring outcomes for
underrepresented teachers and further dampen efforts to diversify the teacher workforce.
Future research ought to further examine the potential roles of race- and gender-
congruence between administrators and teachers on how teachers are rated during the screening
and hiring processes, as well the processes involving teachers’ contract renewals and
recommendations for promotions to leadership positions. Uncovering whether and how these
dynamics influence assessments of teachers in these additional contexts may help to highlight
focus points for initiatives aiming to diversify the teacher pipeline.
A CLASSROOM OBSERVER LIKE ME 31
References Bartanen, B., & Grissom, J. A. (2019). School principal race and the hiring and retention of
racially diverse teachers (EdWorkingPaper No. 19–59; EdWorkingPaper).
http://edworkingpapers.com/ai19-59
Campbell, S. L. (2020). Ratings in black and white: A quantcrit examination of race and gender
in teacher evaluation reform. Race Ethnicity and Education, 1–19.
https://doi.org/10.1080/13613324.2020.1842345
Campbell, S. L., & Ronfeldt, M. (2018). Observational Evaluation of Teachers: Measuring More
Than We Bargained for? American Educational Research Journal, 55(6), 1233–1267.
https://doi.org/10.3102/0002831218776216
Chin, M. J., Quinn, D. M., Dhaliwal, T. K., & Lovison, V. S. (2020). Bias in the Air: A
Nationwide Exploration of Teachers’ Implicit Racial Attitudes, Aggregate Bias, and
Student Outcomes. Educational Researcher, 49(8), 566–578.
https://doi.org/10.3102/0013189X20937240
Chingos, M. M., & West, M. R. (2011). Promotion and reassignment in public school districts:
How do schools respond to differences in teacher effectiveness? Economics of Education
Review, 30(3), 419–433. https://doi.org/10.1016/j.econedurev.2010.12.011
Cohen, J., & Goldhaber, D. (2016). Building a more complete understanding of teacher
evaluation using classroom observations. Educational Researcher, 45(6), 378–387.
https://doi.org/10.3102/0013189X16659442
Danielson, C. (1996). Enhancing professional practice: A framework for teaching. Association
for Supervision and Curriculum Development.
A CLASSROOM OBSERVER LIKE ME 32
Dee, T. S. (2004). Teachers, race, and student achievement in a randomized experiment. Review
of Economics and Statistics, 86(1), 195–210.
Drake, S., Auletto, A., & Cowen, J. M. (2019). Grading Teachers: Race and Gender Differences
in Low Evaluation Ratings and Teacher Employment Outcomes. American Educational
Research Journal, 000283121983577. https://doi.org/10.3102/0002831219835776
Egalite, A. J., Kisida, B., & Winters, M. A. (2015). Representation in the classroom: The effect
of own-race teachers on student achievement. Economics of Education Review, 45, 44–
52. https://doi.org/10.1016/j.econedurev.2015.01.007
Fairlie, R. W., Hoffmann, F., & Oreopoulos, P. (2014). A Community College Instructor Like
Me: Race and Ethnicity Interactions in the Classroom. American Economic Review,
104(8), 2567–2591. https://doi.org/10.1257/aer.104.8.2567
Gershenson, S., Hart, C. M., Hyman, J., Lindsay, C., & Papageorge, N. (2018). The Long-Run
Impacts of Same-Race Teachers (No. w25254; p. w25254). National Bureau of Economic
Research. https://doi.org/10.3386/w25254
Goe, L., & Roth, A. (2019). Strategies for Supporting Educator Preparation Programs’ Efforts
to Attract, Admit, Support, and Graduate Teacher Candidates From Underrepresented
Groups (RM-19-03; p. 34). Educational Testing Service.
Goldhaber, D., Theobald, R., & Tien, C. (2019). Why we need a diverse teacher workforce. Phi
Delta Kappan, 100(5), 25–30. https://doi.org/10.1177/0031721719827540
Grissom, J. A., & Bartanen, B. (2020). Investigating Race and Gender Biases in High-Stakes
Teacher Observations [Vanderbilt University Working Paper].
Grissom, J. A., Kalogrides, D., & Loeb, S. (2017). Strategic Staffing? How Performance
Pressures Affect the Distribution of Teachers Within Schools and Resulting Student
A CLASSROOM OBSERVER LIKE ME 33
Achievement. American Educational Research Journal, 54(6), 1079–1116.
https://doi.org/10.3102/0002831217716301
Grissom, J. A., & Keiser, L. R. (2011). A supervisor like me: Race, representation, and the
satisfaction and turnover decisions of public sector employees: Race, Representation, and
the Satisfaction and Turnover Decisions of Public Sector Employees. Journal of Policy
Analysis and Management, 30(3), 557–580. https://doi.org/10.1002/pam.20579
Grissom, J. A., & Loeb, S. (2017). Assessing Principals’ Assessments: Subjective Evaluations of
Teacher Effectiveness in Low- and High-Stakes Environments. Education Finance and
Policy, 12(3), 369–395. https://doi.org/10.1162/EDFP_a_00210
Husain, A. N., Matsa, D. A., & Miller, A. R. (2018). Do Male Workers Prefer Male Leaders? An
Analysis of Principals’ Effects on Teacher Retention (NBER WP No. 25263). National
Bureau of Economic Research.
Jacob, B. A., & Walsh, E. (2011). What’s in a rating? Economics of Education Review, 30(3),
434–448. https://doi.org/10.1016/j.econedurev.2010.12.009
Jiang, J. Y., & Sporte, S. E. (2016). Teacher Evaluation in Chicago: Differences in Observation
and Value-added Scores by Teacher, Student, and School Characteristics. University of
Chicago Consortium on School Research.
Kane, T. J., McCaffrey, Miller, T., & Staiger, D. O. (2013). Have we identified effective
teachers? Validating measures of effective teaching using random assignment. Bill and
Melinda Gates Foundation.
Kraft, M. A., & Christian, A. (2019). In Search of High-Quality Evaluation Feedback: An
Administrator Training Field Experiment (EdWorkingPaper No.19-62).
http://www.edworkingpapers.com/sites/default/files/ai19-62_1.pdf
A CLASSROOM OBSERVER LIKE ME 34
Kraft, M. A., & Gilmour, A. F. (2017). Revisiting The Widget Effect: Teacher Evaluation
Reforms and the Distribution of Teacher Effectiveness. Educational Researcher, 46(5),
234–249. https://doi.org/10.3102/0013189X17718797
Lindsay, C. A., & Hart, C. M. D. (2017). Exposure to Same-Race Teachers and Student
Disciplinary Outcomes for Black Students in North Carolina. Educational Evaluation
and Policy Analysis, 39(3), 485–510. https://doi.org/10.3102/0162373717693109
North Carolina State Board of Education. (2015). North Carolina Teacher Evaluation Process.
http://www.dpi.state.nc.us/docs/effectiveness-model/ncees/instruments/teach-eval-
manual.pdf
Putman, H., Hansen, M., Walsh, K., & Quintero, D. (2016). High hopes and harsh realities: The
real challenges to building a diverse workforce (p. 22). Brown Center on Education
Policy at Brookings.
Qi, Y., Bell, C. A., Jones, N. D., Lewis, J. M., Witherspoon, M. W., & Redash, A. (2018).
Administrators’ uses of teacher observation protocol in different rating contexts
(Research Report ETS RR-18-18; pp. 1–19). http://doi.wiley.com/10.1002/ets2.12205
Redding, C., & Baker, D. J. (2019). Understanding Racial/Ethnic Diversity Gaps Among Early
Career Teachers. AERA Open, 5(2), 233285841984844.
https://doi.org/10.1177/2332858419848440
Samejima, F. (1969). Estimation of latent ability using a response pattern of graded scores
(Psychometric monograph No. 17).
http://www.psychometrika.org/journal/online/MN17.pdf
Stauffer, J. M., & Buckley, M. R. (2005). The Existence and Nature of Racial Bias in
Supervisory Ratings. Journal of Applied Psychology, 90, 586–591.
A CLASSROOM OBSERVER LIKE ME 35
Steinberg, M. P., & Donaldson, M. L. (2016). The new educational accountability:
Understanding the landscape of teacher evaluation in the post-NCLB era. Education
Finance and Policy, 11(3), 340–359. https://doi.org/10.1162/EDFP_a_00186
Steinberg, M. P., & Garrett, R. (2016). Classroom Composition and Measured Teacher
Performance: What Do Teacher Observation Scores Really Measure? Educational
Evaluation and Policy Analysis, 38(2), 293–317.
https://doi.org/10.3102/0162373715616249
Stephan, W. G. (2014). Intergroup Anxiety: Theory, Research, and Practice. Personality and
Social Psychology Review, 18(8), 239–255.
Tajfel, H., & Turner, J. C. (1979). An integrative theory of intergroup conflict. In S. Worchel &
W. G. Austin (Eds.), The Social Psychology of Intergroup Relations (pp. 33–37).
Taylor, E. S., & Tyler, J. H. (2012). The Effect of Evaluation on Teacher Performance. American
Economic Review, 102(7), 3628–3651. https://doi.org/10.1257/aer.102.7.3628
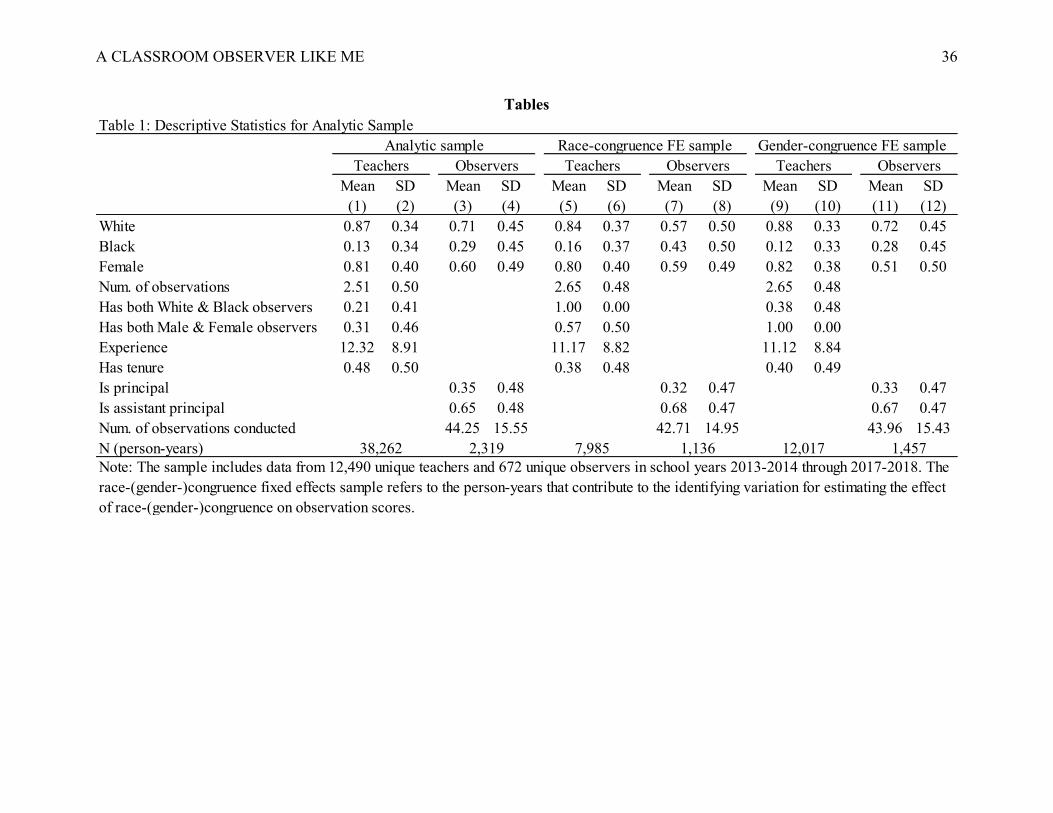
A CLASSROOM OBSERVER LIKE ME 36
Tables
Mean SD Mean SD Mean SD Mean SD Mean SD Mean SD(1) (2) (3) (4) (5) (6) (7) (8) (9) (10) (11) (12)
White 0.87 0.34 0.71 0.45 0.84 0.37 0.57 0.50 0.88 0.33 0.72 0.45Black 0.13 0.34 0.29 0.45 0.16 0.37 0.43 0.50 0.12 0.33 0.28 0.45Female 0.81 0.40 0.60 0.49 0.80 0.40 0.59 0.49 0.82 0.38 0.51 0.50Num. of observations 2.51 0.50 2.65 0.48 2.65 0.48Has both White & Black observers 0.21 0.41 1.00 0.00 0.38 0.48Has both Male & Female observers 0.31 0.46 0.57 0.50 1.00 0.00Experience 12.32 8.91 11.17 8.82 11.12 8.84Has tenure 0.48 0.50 0.38 0.48 0.40 0.49Is principal 0.35 0.48 0.32 0.47 0.33 0.47Is assistant principal 0.65 0.48 0.68 0.47 0.67 0.47Num. of observations conducted 44.25 15.55 42.71 14.95 43.96 15.43N (person-years)Note: The sample includes data from 12,490 unique teachers and 672 unique observers in school years 2013-2014 through 2017-2018. The race-(gender-)congruence fixed effects sample refers to the person-years that contribute to the identifying variation for estimating the effect of race-(gender-)congruence on observation scores.
Teachers Observers
38,262 2,319
Observers
12,017 1,4577,985 1,136
Table 1: Descriptive Statistics for Analytic SampleAnalytic sample Race-congruence FE sample Gender-congruence FE sample
Teachers Observers Teachers
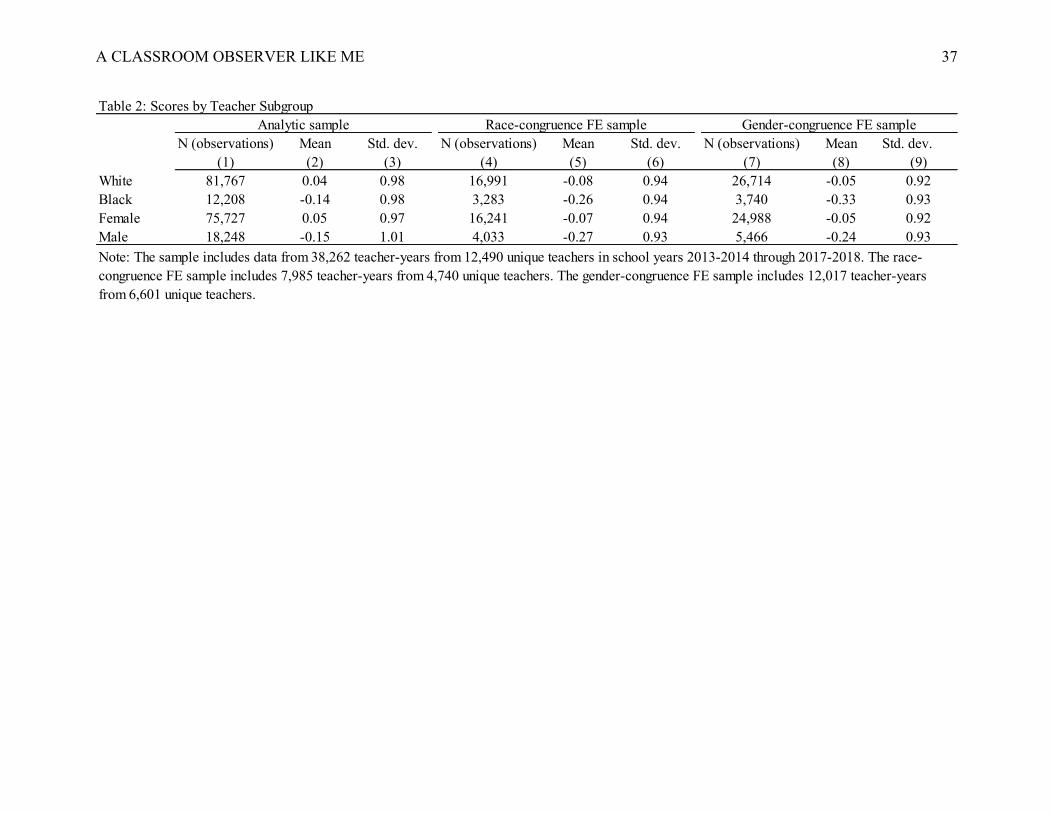
A CLASSROOM OBSERVER LIKE ME 37
N (observations) Mean Std. dev. N (observations) Mean Std. dev. N (observations) Mean Std. dev.(1) (2) (3) (4) (5) (6) (7) (8) (9)
White 81,767 0.04 0.98 16,991 -0.08 0.94 26,714 -0.05 0.92Black 12,208 -0.14 0.98 3,283 -0.26 0.94 3,740 -0.33 0.93Female 75,727 0.05 0.97 16,241 -0.07 0.94 24,988 -0.05 0.92Male 18,248 -0.15 1.01 4,033 -0.27 0.93 5,466 -0.24 0.93
Table 2: Scores by Teacher SubgroupAnalytic sample Race-congruence FE sample Gender-congruence FE sample
Note: The sample includes data from 38,262 teacher-years from 12,490 unique teachers in school years 2013-2014 through 2017-2018. The race-congruence FE sample includes 7,985 teacher-years from 4,740 unique teachers. The gender-congruence FE sample includes 12,017 teacher-years from 6,601 unique teachers.
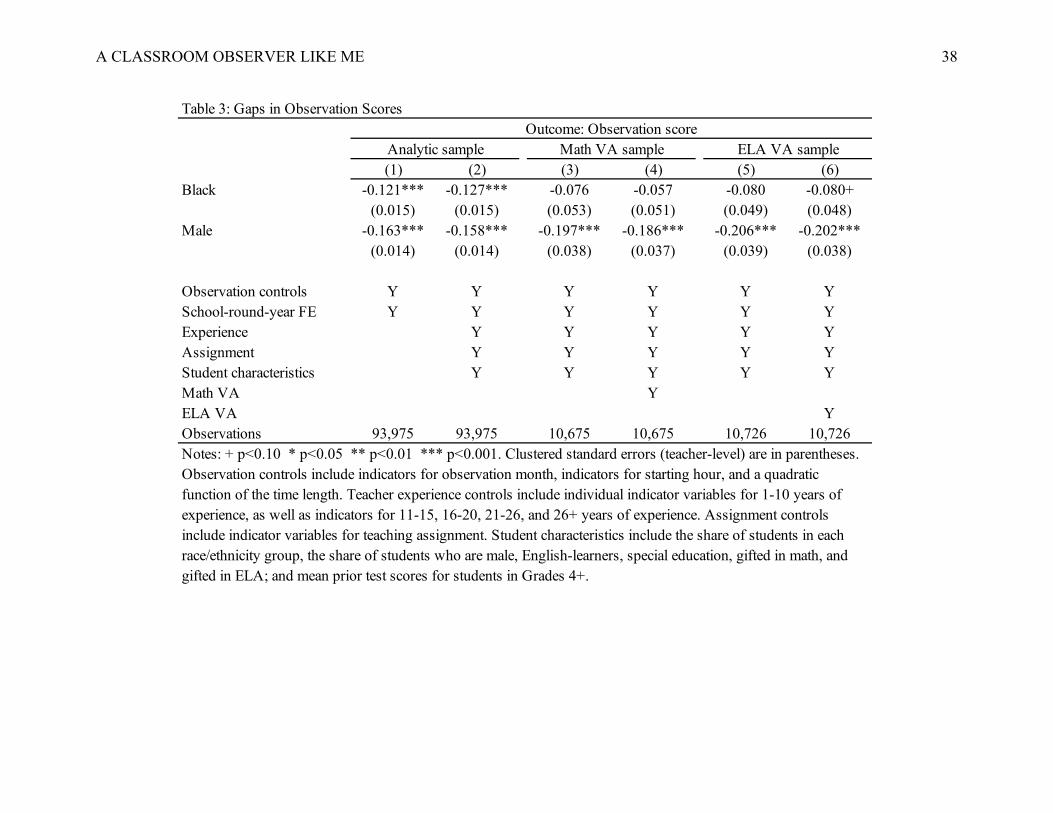
A CLASSROOM OBSERVER LIKE ME 38
(1) (2) (3) (4) (5) (6)Black -0.121*** -0.127*** -0.076 -0.057 -0.080 -0.080+
(0.015) (0.015) (0.053) (0.051) (0.049) (0.048)Male -0.163*** -0.158*** -0.197*** -0.186*** -0.206*** -0.202***
(0.014) (0.014) (0.038) (0.037) (0.039) (0.038)
Observation controls Y Y Y Y Y YSchool-round-year FE Y Y Y Y Y YExperience Y Y Y Y YAssignment Y Y Y Y YStudent characteristics Y Y Y Y YMath VA YELA VA YObservations 93,975 93,975 10,675 10,675 10,726 10,726Notes: + p<0.10 * p<0.05 ** p<0.01 *** p<0.001. Clustered standard errors (teacher-level) are in parentheses. Observation controls include indicators for observation month, indicators for starting hour, and a quadratic function of the time length. Teacher experience controls include individual indicator variables for 1-10 years of experience, as well as indicators for 11-15, 16-20, 21-26, and 26+ years of experience. Assignment controls include indicator variables for teaching assignment. Student characteristics include the share of students in each race/ethnicity group, the share of students who are male, English-learners, special education, gifted in math, and gifted in ELA; and mean prior test scores for students in Grades 4+.
Outcome: Observation scoreMath VA sample ELA VA sample
Table 3: Gaps in Observation Scores
Analytic sample
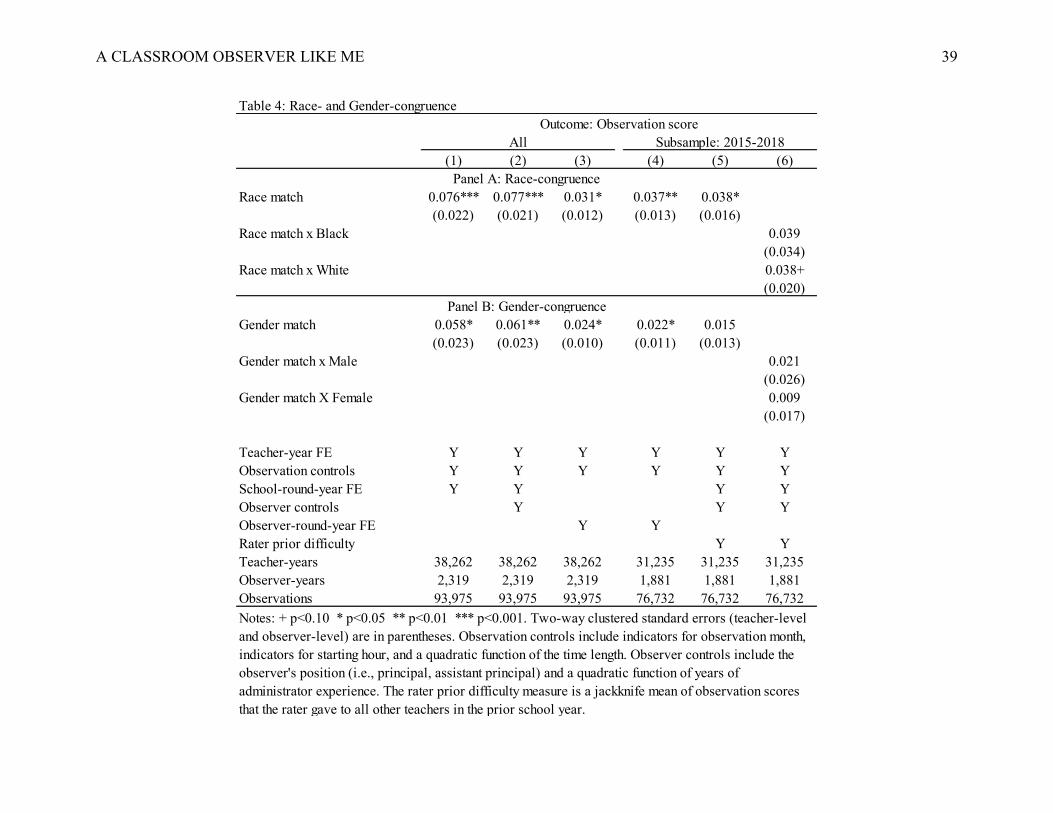
A CLASSROOM OBSERVER LIKE ME 39
(1) (2) (3) (4) (5) (6)
Race match 0.076*** 0.077*** 0.031* 0.037** 0.038*(0.022) (0.021) (0.012) (0.013) (0.016)
Race match x Black 0.039(0.034)
Race match x White 0.038+(0.020)
Gender match 0.058* 0.061** 0.024* 0.022* 0.015(0.023) (0.023) (0.010) (0.011) (0.013)
Gender match x Male 0.021(0.026)
Gender match X Female 0.009(0.017)
Teacher-year FE Y Y Y Y Y YObservation controls Y Y Y Y Y YSchool-round-year FE Y Y Y YObserver controls Y Y YObserver-round-year FE Y YRater prior difficulty Y YTeacher-years 38,262 38,262 38,262 31,235 31,235 31,235Observer-years 2,319 2,319 2,319 1,881 1,881 1,881Observations 93,975 93,975 93,975 76,732 76,732 76,732Notes: + p<0.10 * p<0.05 ** p<0.01 *** p<0.001. Two-way clustered standard errors (teacher-level and observer-level) are in parentheses. Observation controls include indicators for observation month, indicators for starting hour, and a quadratic function of the time length. Observer controls include the observer's position (i.e., principal, assistant principal) and a quadratic function of years of administrator experience. The rater prior difficulty measure is a jackknife mean of observation scores that the rater gave to all other teachers in the prior school year.
Table 4: Race- and Gender-congruenceOutcome: Observation score
All Subsample: 2015-2018
Panel A: Race-congruence
Panel B: Gender-congruence
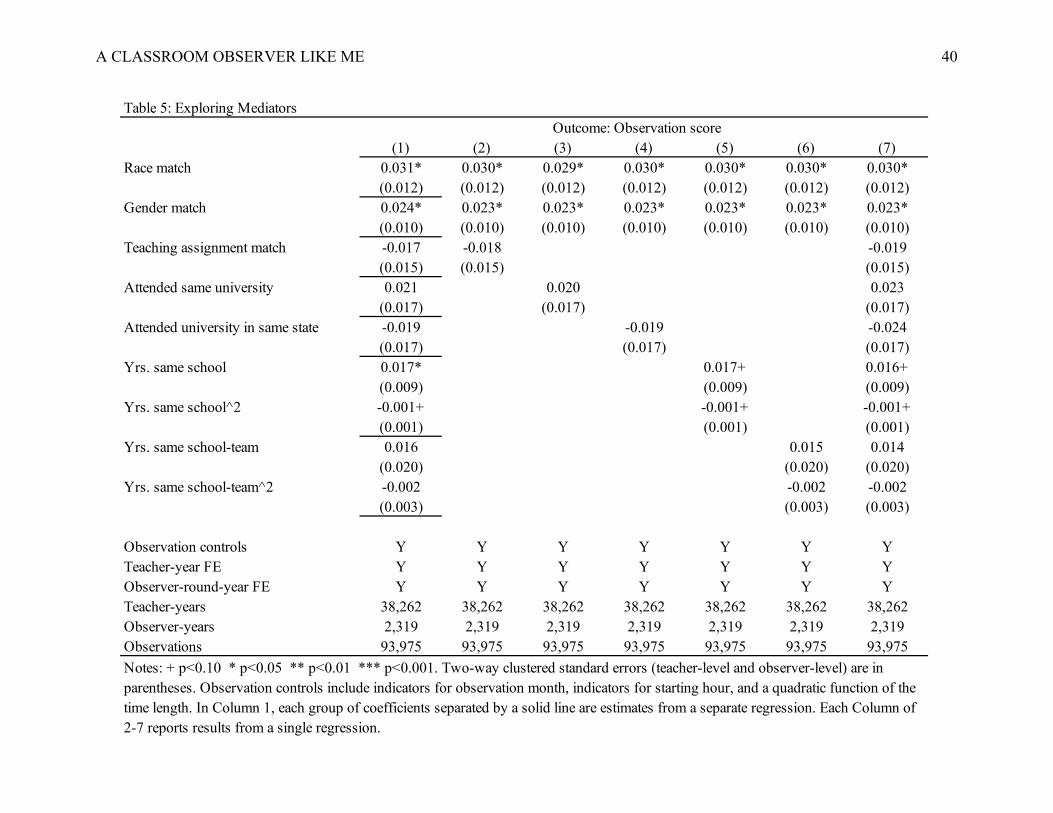
A CLASSROOM OBSERVER LIKE ME 40
(1) (2) (3) (4) (5) (6) (7)Race match 0.031* 0.030* 0.029* 0.030* 0.030* 0.030* 0.030*
(0.012) (0.012) (0.012) (0.012) (0.012) (0.012) (0.012)Gender match 0.024* 0.023* 0.023* 0.023* 0.023* 0.023* 0.023*
(0.010) (0.010) (0.010) (0.010) (0.010) (0.010) (0.010)Teaching assignment match -0.017 -0.018 -0.019
(0.015) (0.015) (0.015)Attended same university 0.021 0.020 0.023
(0.017) (0.017) (0.017)Attended university in same state -0.019 -0.019 -0.024
(0.017) (0.017) (0.017)Yrs. same school 0.017* 0.017+ 0.016+
(0.009) (0.009) (0.009)Yrs. same school^2 -0.001+ -0.001+ -0.001+
(0.001) (0.001) (0.001)Yrs. same school-team 0.016 0.015 0.014
(0.020) (0.020) (0.020)Yrs. same school-team^2 -0.002 -0.002 -0.002
(0.003) (0.003) (0.003)
Observation controls Y Y Y Y Y Y YTeacher-year FE Y Y Y Y Y Y YObserver-round-year FE Y Y Y Y Y Y YTeacher-years 38,262 38,262 38,262 38,262 38,262 38,262 38,262Observer-years 2,319 2,319 2,319 2,319 2,319 2,319 2,319Observations 93,975 93,975 93,975 93,975 93,975 93,975 93,975
Outcome: Observation score Table 5: Exploring Mediators
Notes: + p<0.10 * p<0.05 ** p<0.01 *** p<0.001. Two-way clustered standard errors (teacher-level and observer-level) are in parentheses. Observation controls include indicators for observation month, indicators for starting hour, and a quadratic function of the time length. In Column 1, each group of coefficients separated by a solid line are estimates from a separate regression. Each Column of 2-7 reports results from a single regression.
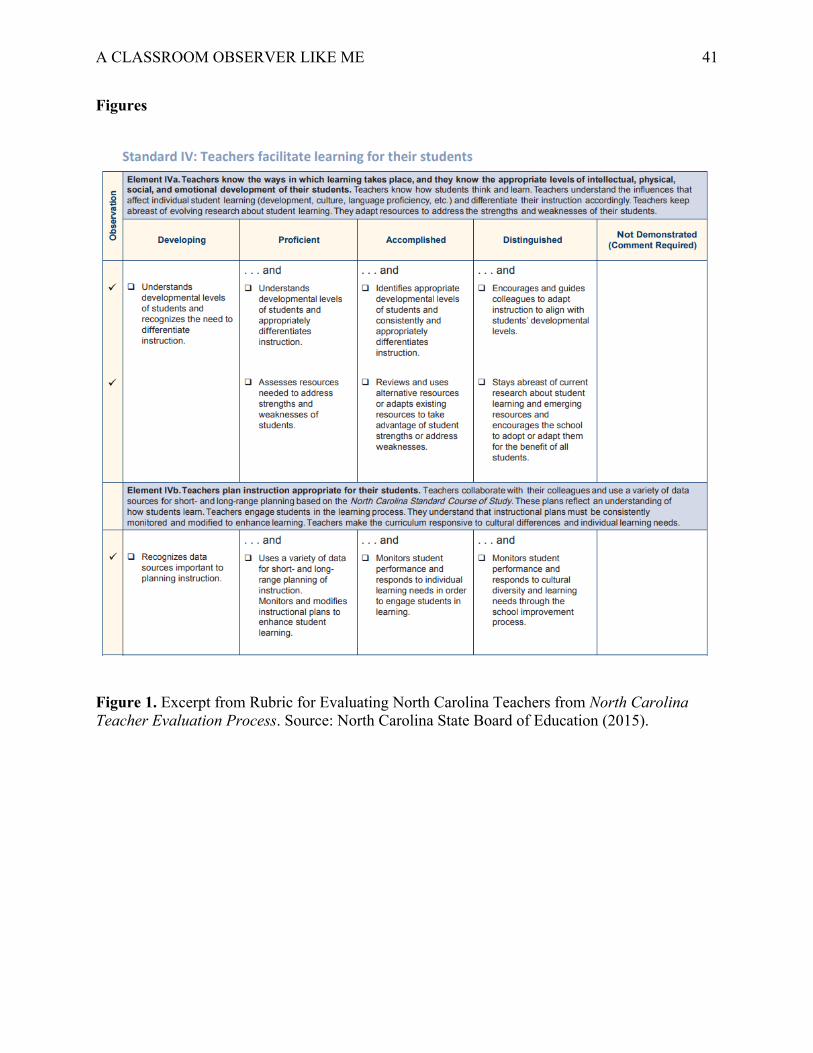
A CLASSROOM OBSERVER LIKE ME 41
Figures
Figure 1. Excerpt from Rubric for Evaluating North Carolina Teachers from North Carolina Teacher Evaluation Process. Source: North Carolina State Board of Education (2015).
A CLASSROOM OBSERVER LIKE ME 42
Appendix
A. Assigning Element Ratings from Observed Descriptors for Individual Classroom
Observations
Since individual classroom observations do not receive official ratings, I assign element
ratings for individual classroom observations using the data on which descriptors were checked
off by the rater during individual classroom observations. To do so, I use an assignment rule that
mimics the procedure used to obtain the summary rating on each element for a teacher’s end-of-
year summary evaluation. However, results are similar if I adopt alternative assignment rules, as
I detail below.
To assign ratings for each element on the rubric for individual classroom observations, I:
a) examine the descriptors that were checked off as being present during the classroom
observation, and b) assign the highest rating under which all the descriptors are checked. To
clearly illustrate this procedure, I provide examples of assigning a rating to Element IVa based
on the descriptors that are checked off by the rater.
Example 1: As shown in Figure A1, take a teacher, who during an individual classroom
observation, received checks for all the descriptors under Element IVa, except the following
descriptor in the Distinguished column: “Encourages and guides colleagues to adapt instruction
to align with students’ developmental levels.” I would assign this teacher to have a rating of
“Accomplished” on Element IVa, as it is the highest rating category under which she was
observed to have demonstrated all of the descriptors.
Example 2: As shown in Figure A2, take a teacher, who during an individual classroom
observation, received checks for: all the descriptors under Developing, all the descriptors under
Proficient, one descriptor under Accomplished, and one descriptor under Distinguished. Despite
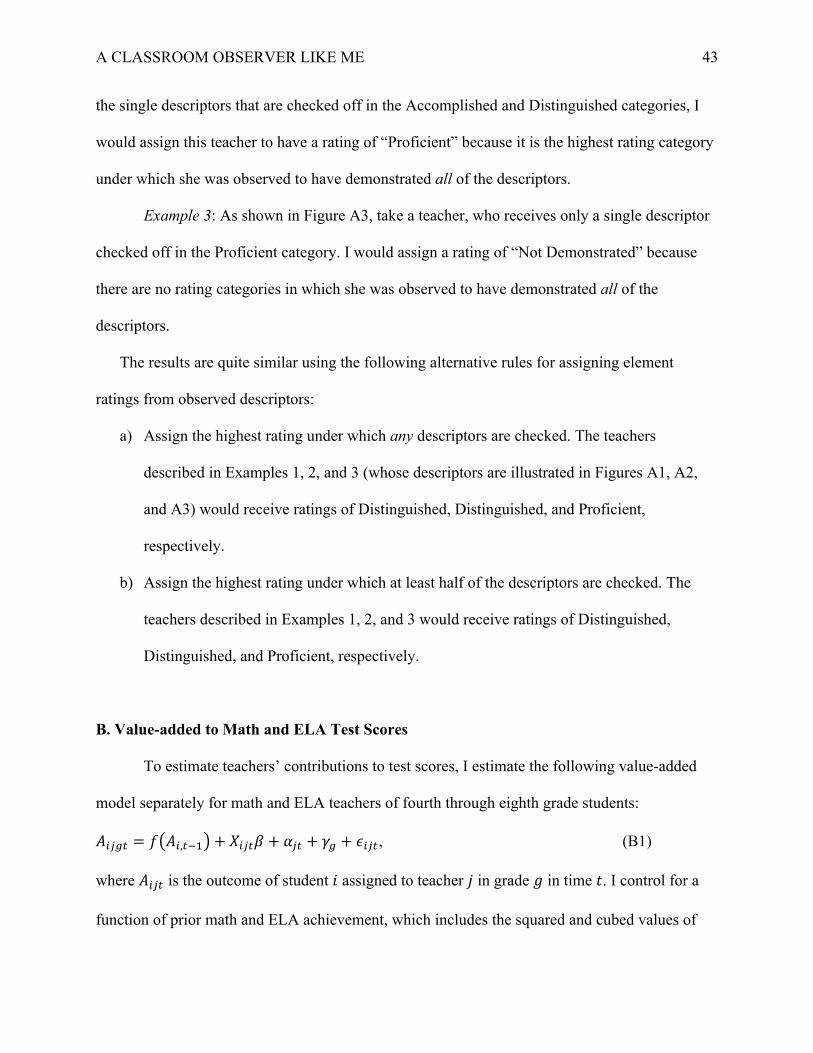
A CLASSROOM OBSERVER LIKE ME 43
the single descriptors that are checked off in the Accomplished and Distinguished categories, I
would assign this teacher to have a rating of “Proficient” because it is the highest rating category
under which she was observed to have demonstrated all of the descriptors.
Example 3: As shown in Figure A3, take a teacher, who receives only a single descriptor
checked off in the Proficient category. I would assign a rating of “Not Demonstrated” because
there are no rating categories in which she was observed to have demonstrated all of the
descriptors.
The results are quite similar using the following alternative rules for assigning element
ratings from observed descriptors:
a) Assign the highest rating under which any descriptors are checked. The teachers
described in Examples 1, 2, and 3 (whose descriptors are illustrated in Figures A1, A2,
and A3) would receive ratings of Distinguished, Distinguished, and Proficient,
respectively.
b) Assign the highest rating under which at least half of the descriptors are checked. The
teachers described in Examples 1, 2, and 3 would receive ratings of Distinguished,
Distinguished, and Proficient, respectively.
B. Value-added to Math and ELA Test Scores
To estimate teachers’ contributions to test scores, I estimate the following value-added
model separately for math and ELA teachers of fourth through eighth grade students:
!!"#$ = #$!!,$&'% + '!"$( + )"$ + *# + +!"$, (B1)
where !!"$ is the outcome of student , assigned to teacher - in grade . in time /. I control for a
function of prior math and ELA achievement, which includes the squared and cubed values of
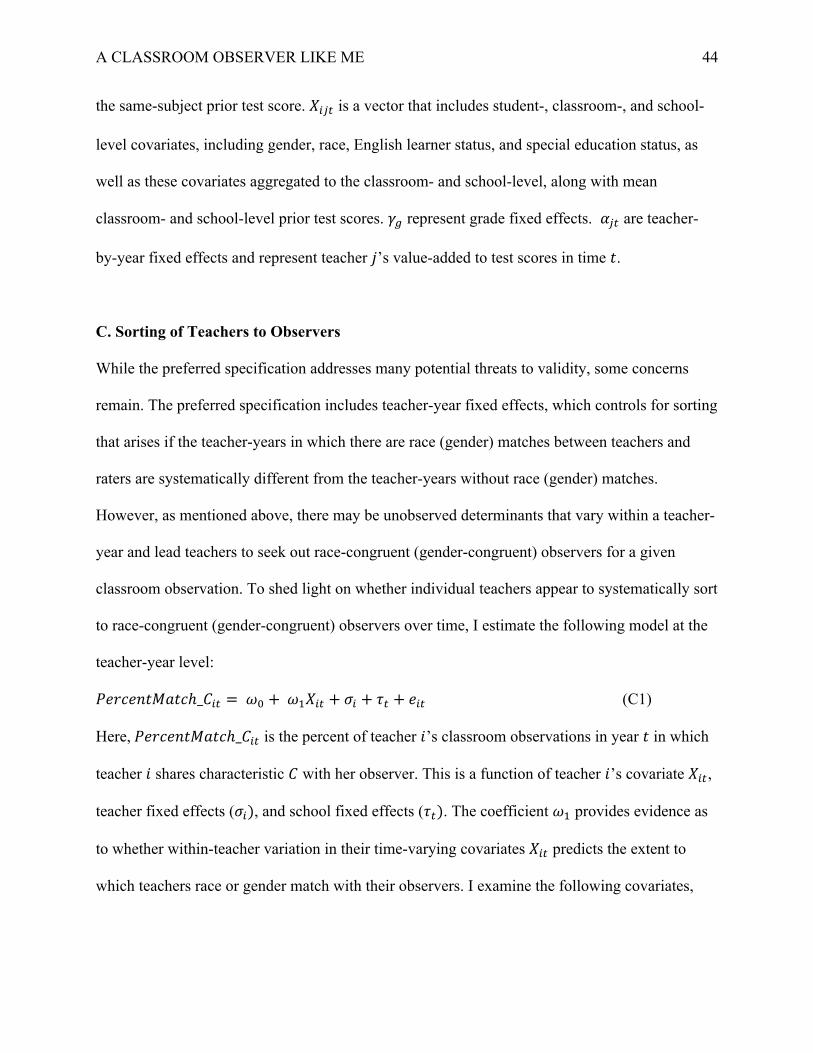
A CLASSROOM OBSERVER LIKE ME 44
the same-subject prior test score. '!"$ is a vector that includes student-, classroom-, and school-
level covariates, including gender, race, English learner status, and special education status, as
well as these covariates aggregated to the classroom- and school-level, along with mean
classroom- and school-level prior test scores. *# represent grade fixed effects. )"$ are teacher-
by-year fixed effects and represent teacher -’s value-added to test scores in time /.
C. Sorting of Teachers to Observers
While the preferred specification addresses many potential threats to validity, some concerns
remain. The preferred specification includes teacher-year fixed effects, which controls for sorting
that arises if the teacher-years in which there are race (gender) matches between teachers and
raters are systematically different from the teacher-years without race (gender) matches.
However, as mentioned above, there may be unobserved determinants that vary within a teacher-
year and lead teachers to seek out race-congruent (gender-congruent) observers for a given
classroom observation. To shed light on whether individual teachers appear to systematically sort
to race-congruent (gender-congruent) observers over time, I estimate the following model at the
teacher-year level:
012314/56/3ℎ_9!$ =;( +;''!$ + <! + =$ + 1!$ (C1)
Here,012314/56/3ℎ_9!$ is the percent of teacher ,’s classroom observations in year / in which
teacher , shares characteristic 9 with her observer. This is a function of teacher ,’s covariate '!$,
teacher fixed effects (<!), and school fixed effects (=$). The coefficient ;' provides evidence as
to whether within-teacher variation in their time-varying covariates '!$ predicts the extent to
which teachers race or gender match with their observers. I examine the following covariates,
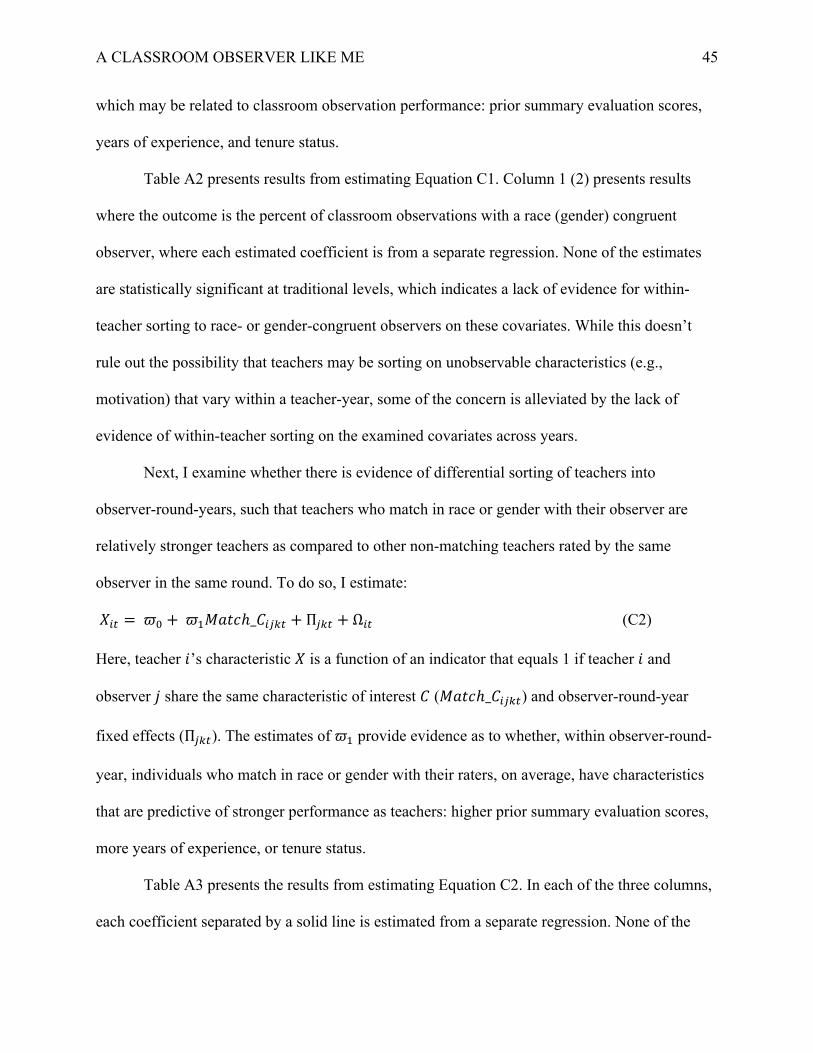
A CLASSROOM OBSERVER LIKE ME 45
which may be related to classroom observation performance: prior summary evaluation scores,
years of experience, and tenure status.
Table A2 presents results from estimating Equation C1. Column 1 (2) presents results
where the outcome is the percent of classroom observations with a race (gender) congruent
observer, where each estimated coefficient is from a separate regression. None of the estimates
are statistically significant at traditional levels, which indicates a lack of evidence for within-
teacher sorting to race- or gender-congruent observers on these covariates. While this doesn’t
rule out the possibility that teachers may be sorting on unobservable characteristics (e.g.,
motivation) that vary within a teacher-year, some of the concern is alleviated by the lack of
evidence of within-teacher sorting on the examined covariates across years.
Next, I examine whether there is evidence of differential sorting of teachers into
observer-round-years, such that teachers who match in race or gender with their observer are
relatively stronger teachers as compared to other non-matching teachers rated by the same
observer in the same round. To do so, I estimate:
'!$ =?( +?'56/3ℎ_9!")$ + Π")$ + Ω!$ (C2)
Here, teacher ,’s characteristic ' is a function of an indicator that equals 1 if teacher , and
observer - share the same characteristic of interest 9 (56/3ℎ_9!")$) and observer-round-year
fixed effects (Π")$). The estimates of ?' provide evidence as to whether, within observer-round-
year, individuals who match in race or gender with their raters, on average, have characteristics
that are predictive of stronger performance as teachers: higher prior summary evaluation scores,
more years of experience, or tenure status.
Table A3 presents the results from estimating Equation C2. In each of the three columns,
each coefficient separated by a solid line is estimated from a separate regression. None of the
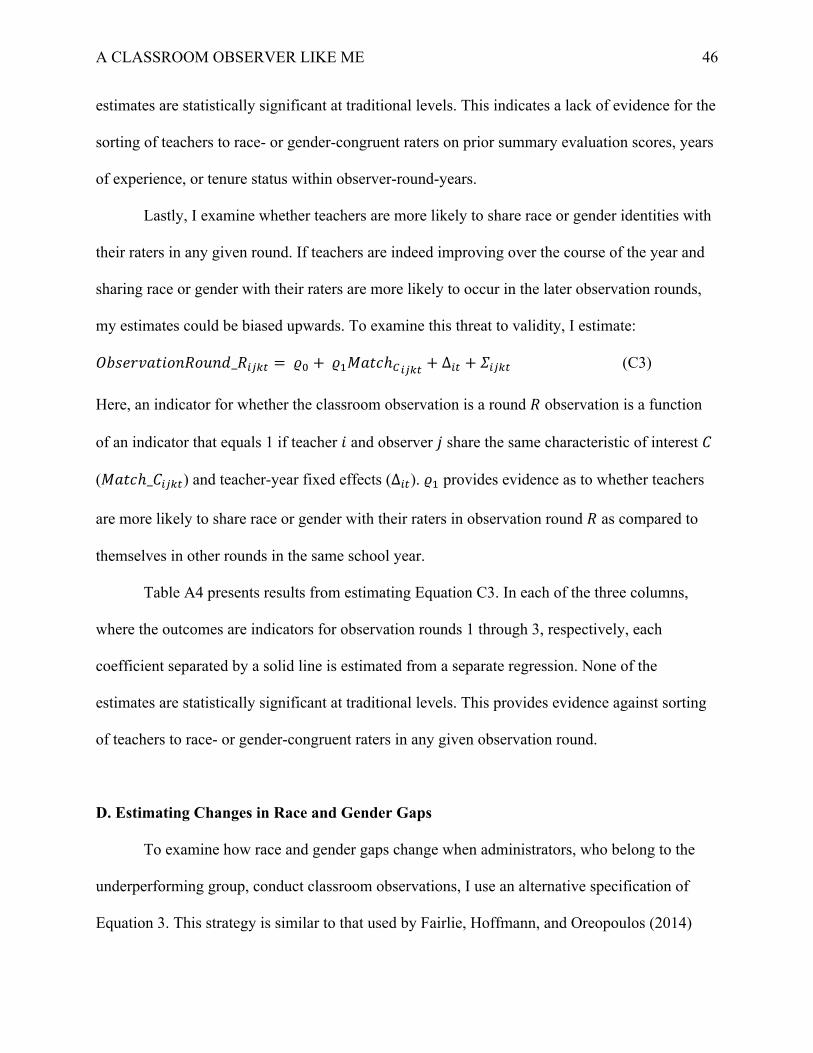
A CLASSROOM OBSERVER LIKE ME 46
estimates are statistically significant at traditional levels. This indicates a lack of evidence for the
sorting of teachers to race- or gender-congruent raters on prior summary evaluation scores, years
of experience, or tenure status within observer-round-years.
Lastly, I examine whether teachers are more likely to share race or gender identities with
their raters in any given round. If teachers are indeed improving over the course of the year and
sharing race or gender with their raters are more likely to occur in the later observation rounds,
my estimates could be biased upwards. To examine this threat to validity, I estimate:
BCD12E6/,F4GFH4I_G!")$ =J( +J'56/3ℎ*!")$ + Δ!$ + L!")$ (C3)
Here, an indicator for whether the classroom observation is a round G observation is a function
of an indicator that equals 1 if teacher , and observer - share the same characteristic of interest 9
(56/3ℎ_9!")$) and teacher-year fixed effects (Δ!$). J' provides evidence as to whether teachers
are more likely to share race or gender with their raters in observation round G as compared to
themselves in other rounds in the same school year.
Table A4 presents results from estimating Equation C3. In each of the three columns,
where the outcomes are indicators for observation rounds 1 through 3, respectively, each
coefficient separated by a solid line is estimated from a separate regression. None of the
estimates are statistically significant at traditional levels. This provides evidence against sorting
of teachers to race- or gender-congruent raters in any given observation round.
D. Estimating Changes in Race and Gender Gaps
To examine how race and gender gaps change when administrators, who belong to the
underperforming group, conduct classroom observations, I use an alternative specification of
Equation 3. This strategy is similar to that used by Fairlie, Hoffmann, and Oreopoulos (2014)
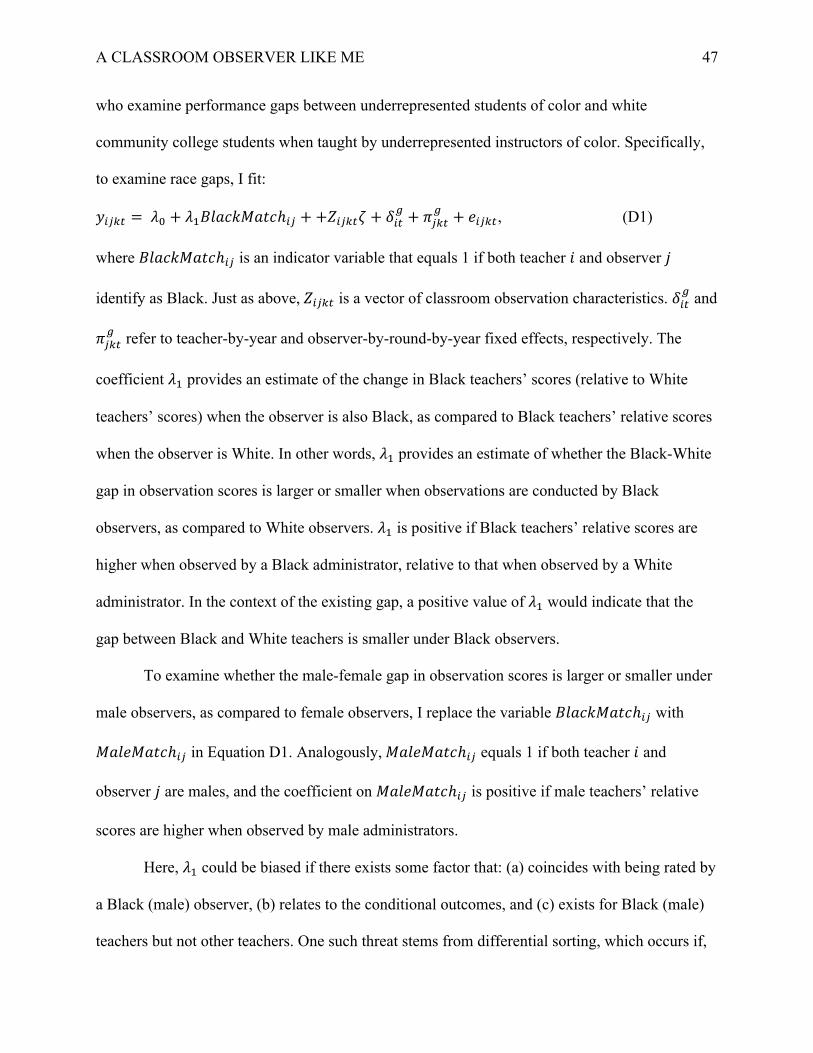
A CLASSROOM OBSERVER LIKE ME 47
who examine performance gaps between underrepresented students of color and white
community college students when taught by underrepresented instructors of color. Specifically,
to examine race gaps, I fit:
M!")$ =N( + N'OP63Q56/3ℎ!" ++R!")$S + T!$# + U")$
# + 1!")$, (D1)
where OP63Q56/3ℎ!" is an indicator variable that equals 1 if both teacher , and observer -
identify as Black. Just as above,R!")$ is a vector of classroom observation characteristics. T!$# and
U")$# refer to teacher-by-year and observer-by-round-by-year fixed effects, respectively. The
coefficient N' provides an estimate of the change in Black teachers’ scores (relative to White
teachers’ scores) when the observer is also Black, as compared to Black teachers’ relative scores
when the observer is White. In other words, N' provides an estimate of whether the Black-White
gap in observation scores is larger or smaller when observations are conducted by Black
observers, as compared to White observers. N' is positive if Black teachers’ relative scores are
higher when observed by a Black administrator, relative to that when observed by a White
administrator. In the context of the existing gap, a positive value of N' would indicate that the
gap between Black and White teachers is smaller under Black observers.
To examine whether the male-female gap in observation scores is larger or smaller under
male observers, as compared to female observers, I replace the variable OP63Q56/3ℎ!" with
56P156/3ℎ!" in Equation D1. Analogously,56P156/3ℎ!" equals 1 if both teacher , and
observer - are males, and the coefficient on 56P156/3ℎ!" is positive if male teachers’ relative
scores are higher when observed by male administrators.
Here, N' could be biased if there exists some factor that: (a) coincides with being rated by
a Black (male) observer, (b) relates to the conditional outcomes, and (c) exists for Black (male)
teachers but not other teachers. One such threat stems from differential sorting, which occurs if,
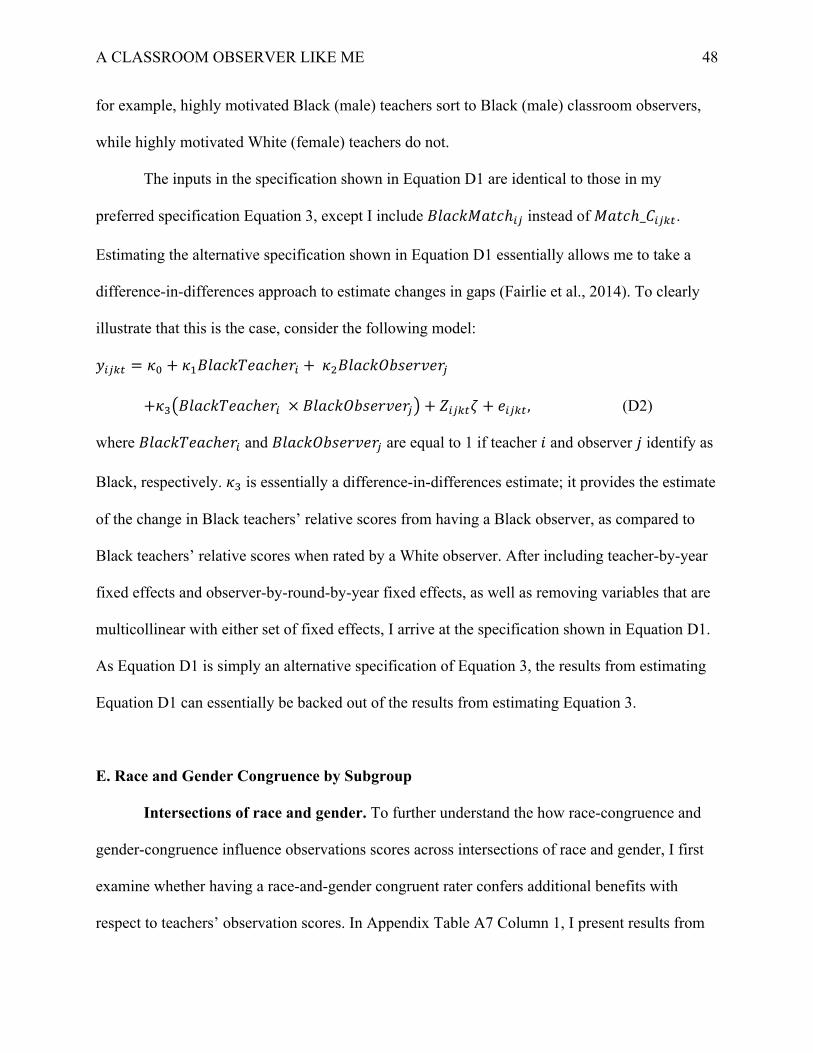
A CLASSROOM OBSERVER LIKE ME 48
for example, highly motivated Black (male) teachers sort to Black (male) classroom observers,
while highly motivated White (female) teachers do not.
The inputs in the specification shown in Equation D1 are identical to those in my
preferred specification Equation 3, except I include OP63Q56/3ℎ!" instead of 56/3ℎ_9!")$.
Estimating the alternative specification shown in Equation D1 essentially allows me to take a
difference-in-differences approach to estimate changes in gaps (Fairlie et al., 2014). To clearly
illustrate that this is the case, consider the following model:
M!")$ = V( + V'OP63QW163ℎ12! +V+OP63QBCD12E12"
+V,$OP63QW163ℎ12! × OP63QBCD12E12"% + R!")$S + 1!")$ , (D2)
where OP63QW163ℎ12! and OP63QBCD12E12" are equal to 1 if teacher , and observer - identify as
Black, respectively. V, is essentially a difference-in-differences estimate; it provides the estimate
of the change in Black teachers’ relative scores from having a Black observer, as compared to
Black teachers’ relative scores when rated by a White observer. After including teacher-by-year
fixed effects and observer-by-round-by-year fixed effects, as well as removing variables that are
multicollinear with either set of fixed effects, I arrive at the specification shown in Equation D1.
As Equation D1 is simply an alternative specification of Equation 3, the results from estimating
Equation D1 can essentially be backed out of the results from estimating Equation 3.
E. Race and Gender Congruence by Subgroup
Intersections of race and gender. To further understand the how race-congruence and
gender-congruence influence observations scores across intersections of race and gender, I first
examine whether having a race-and-gender congruent rater confers additional benefits with
respect to teachers’ observation scores. In Appendix Table A7 Column 1, I present results from

A CLASSROOM OBSERVER LIKE ME 49
estimating Equation 3 with separate indicators for race-congruence, gender-congruence, as well
the interaction between the two (i.e., an indicator for race-and-gender congruence). The
coefficient on the indicator for race-and-gender congruence provides an estimate of the average
effect of sharing both race and gender identities with one’s observer (beyond the main effects of
sharing race or sharing gender with one’s observer). The estimated coefficient is -0.009 and is
statistically insignificant. The lack of a positive estimate, as well as the imprecision of the
estimate, fails to provide any notable indication of additional benefits from having a race-and-
gender-congruent rater that exist beyond the main effects.
In the rest of Appendix Table A7, I begin to examine the average effects of having race-
congruent and gender-congruent observers across subgroups of teachers by race and gender
intersectional identities. To do so, in Columns 2-6, I use the subsample of teachers from school-
years 2014-2015 to 2017-2018, just as in the sample included in Table 4 Columns 4-6 for
analogous reasons. First, Column 2 repeats the exercise from Column 1 using the 2015-2018
subsample of teachers, illustrating that the patterns in race-and-gender matching effects that are
present within the greater analytic sample also hold in this subsample.
In Columns 3 and 4, I examine the effect of having a race-congruent rater, separately for
Black males and White males (Column 3) and separately for Black females and White females
(Column 4). Though the estimates are generally imprecise with only one of the estimates being
statistically significant (for White males), the positive point estimates hint that each of the
teacher subgroups may benefit, in terms of higher observation scores, from sharing race with
their observers.
In Columns 5 and 6, I examine the effect of having a gender-congruent rater, separately
for Black males and Black females (Column 5) and separately for White males and White
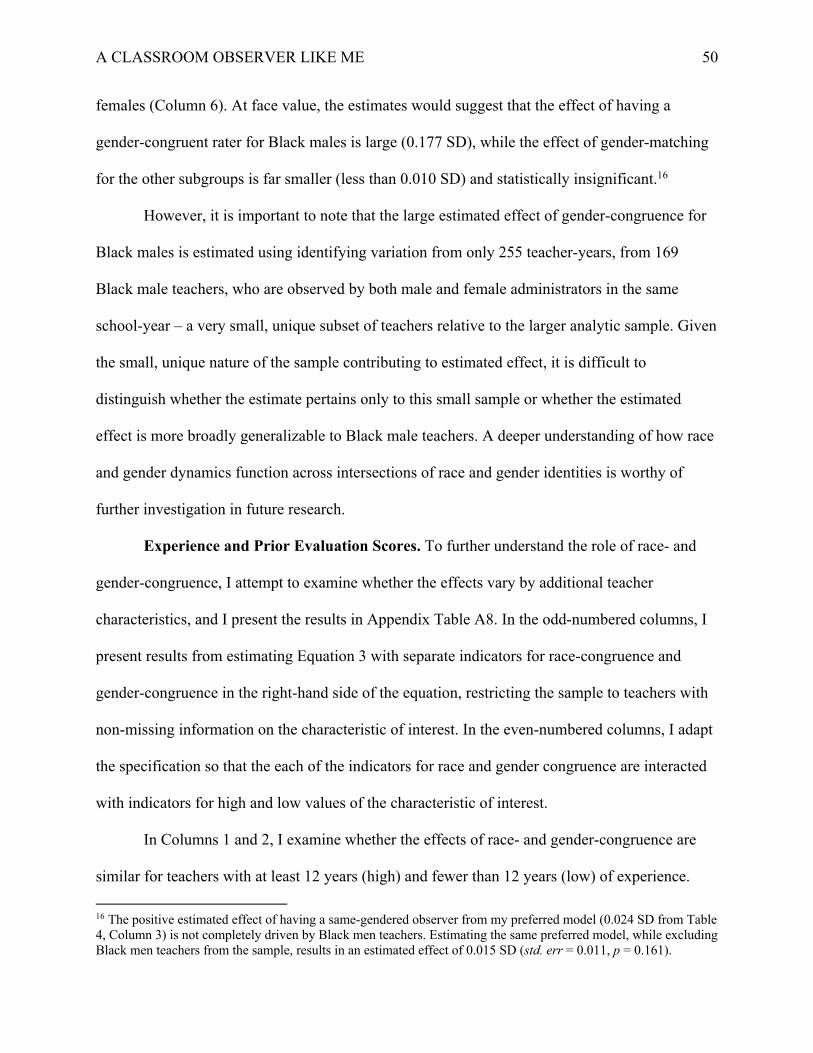
A CLASSROOM OBSERVER LIKE ME 50
females (Column 6). At face value, the estimates would suggest that the effect of having a
gender-congruent rater for Black males is large (0.177 SD), while the effect of gender-matching
for the other subgroups is far smaller (less than 0.010 SD) and statistically insignificant.16
However, it is important to note that the large estimated effect of gender-congruence for
Black males is estimated using identifying variation from only 255 teacher-years, from 169
Black male teachers, who are observed by both male and female administrators in the same
school-year – a very small, unique subset of teachers relative to the larger analytic sample. Given
the small, unique nature of the sample contributing to estimated effect, it is difficult to
distinguish whether the estimate pertains only to this small sample or whether the estimated
effect is more broadly generalizable to Black male teachers. A deeper understanding of how race
and gender dynamics function across intersections of race and gender identities is worthy of
further investigation in future research.
Experience and Prior Evaluation Scores. To further understand the role of race- and
gender-congruence, I attempt to examine whether the effects vary by additional teacher
characteristics, and I present the results in Appendix Table A8. In the odd-numbered columns, I
present results from estimating Equation 3 with separate indicators for race-congruence and
gender-congruence in the right-hand side of the equation, restricting the sample to teachers with
non-missing information on the characteristic of interest. In the even-numbered columns, I adapt
the specification so that the each of the indicators for race and gender congruence are interacted
with indicators for high and low values of the characteristic of interest.
In Columns 1 and 2, I examine whether the effects of race- and gender-congruence are
similar for teachers with at least 12 years (high) and fewer than 12 years (low) of experience.
16 The positive estimated effect of having a same-gendered observer from my preferred model (0.024 SD from Table 4, Column 3) is not completely driven by Black men teachers. Estimating the same preferred model, while excluding Black men teachers from the sample, results in an estimated effect of 0.015 SD (std. err = 0.011, p = 0.161).
A CLASSROOM OBSERVER LIKE ME 51
Column 2 shows that less-experienced teachers and highly experienced teachers have similarly
positive point estimates for the effect of race congruence (0.03 SD vs. 0.04 SD), as well as
similarly positive point estimates for the effect of gender congruence (0.03 SD vs. 0.02 SD).17
In Columns 3 and 4, I examine whether the effects of race- and gender-congruence are
similar for teachers with above-average and below-average prior evaluation scores. Here, I
restrict the sample to teachers with non-missing summative evaluation scores from the prior
school year.18 Column 3 shows that the average estimated effects of race and gender congruence
are 0.04 SD and 0.03 SD, respectively, across this sample. These results are fairly similar to
those for the full analytic sample. Column 4 provides some suggestive evidence of heterogeneity
by prior evaluation scores. The point estimates indicate that the estimated effects of race
congruence are larger for teachers with above-average prior evaluation scores (0.06 SD vs. 0.02
SD). The same can be said for the effects of gender congruence; the estimated effects also appear
larger for teachers with above-average prior evaluation scores (0.05 SD vs. 0.02 SD). I lack the
precision to be able to state that these estimates are statistically different from one another, but
the point estimates suggest that there could be meaningful differences by teacher subgroup.19
One speculative explanation for such a finding is that raters, while checking off performance
descriptors, could be more willing to give the benefit of the doubt to race- or gender-congruent
teachers whom they know to have prior teaching success.
17 The p-value on the null hypothesis that the race-(gender-)congruence coefficients for less- and highly experienced teachers are equal is 0.61 (0.70). 18 In the North Carolina Teacher Evaluation Process, teachers are required to be reviewed annually by their principals (or a similar designated evaluator). To construct each teacher’s summative evaluation score, I use the predicted scores from a Graded Response Model (GRM) fit on the ratings that teachers receive on each element of their end-of-year summary rating forms from the North Carolina evaluation regime. I then standardized the estimated scores within-year to have a mean of 0 and a standard deviation of 1. 19 The p-value on the null hypothesis that the race-(gender-)congruence coefficients for above- and below-average prior scoring teachers are equal is 0.17 (0.20).
A CLASSROOM OBSERVER LIKE ME 52
F. Classroom Observation Covariates
All the models that were estimated included some controls for the characteristics of the
classroom observation, such as the month, the starting hour, and the length of the observation.
However, I lack the data and information to create additional control variables for the specific
course being taught and the characteristics of the students sitting in the classroom during the
observation. Teachers, particularly in middle and high school, often teach multiple courses with
different sets of students, and student characteristics may look fairly different across an
individual teacher’s courses. As discussed above, previous research indicates that the
background characteristics and prior test scores of students may influence classroom observation
scores (Campbell & Ronfeldt, 2018; Steinberg & Garrett, 2016). My results could be biased if:
(a) the characteristics of the students sitting in a classroom indeed influence observation ratings,
and (b) race- or gender-congruent raters, for whatever reason, are more likely than non-matching
raters to observe teachers with their higher-performing classrooms.
As a robustness check, I attempt to assess whether my results hold in a subsample of the
data where teachers are most likely to be observed teaching the same set of students across all
the observations they receive in the same school year: elementary school teachers who are
assigned to specific grade levels (i.e., teachers who are likely in self-contained classrooms). The
main results for the effects of race congruence look qualitatively similar in the elementary
subsample, though I lose statistical significance given a smaller sample (results available upon
request). This provides some reassurance that the main race-congruence results are not driven by
some assignment mechanism where same-race observers are more likely to conduct their
observations with teachers’ most advantaged students sitting in the classroom. I can speak less to
the estimates for gender-congruence, which are very noisy given a relatively small population of
A CLASSROOM OBSERVER LIKE ME 53
male elementary teachers. Males make up only 6.3% of the elementary subsample of teacher-
years.
G. External Validity
The context of this study poses some potential challenges to the generalizability of this
study. Importantly, the result for the effect of race-(gender-)congruence is identified using
teachers who are observed by both Black and White (male and female) administrators in the
same school year. If the teachers and administrators who sort to schools with variation in
administrators’ race or gender identities are different from those who sort to schools without
variation in administrators’ race or gender identities, the results here may not generalize.
Additionally, in this context, the classroom observers are school administrators who work
in the same school as the teachers they observe. It is also unclear whether these results would
generalize to evaluation systems in which classroom observations are conducted by individuals
who work outside of the teachers’ schools. Furthermore, in this study, the race-congruence
analysis focuses on Black and White teachers with Black and White classroom observers, as the
district has only two adequately sized race groups for analysis. It is unclear the degree to which
these results would generalize to other districts with large shares of teachers belonging to other
race groups.
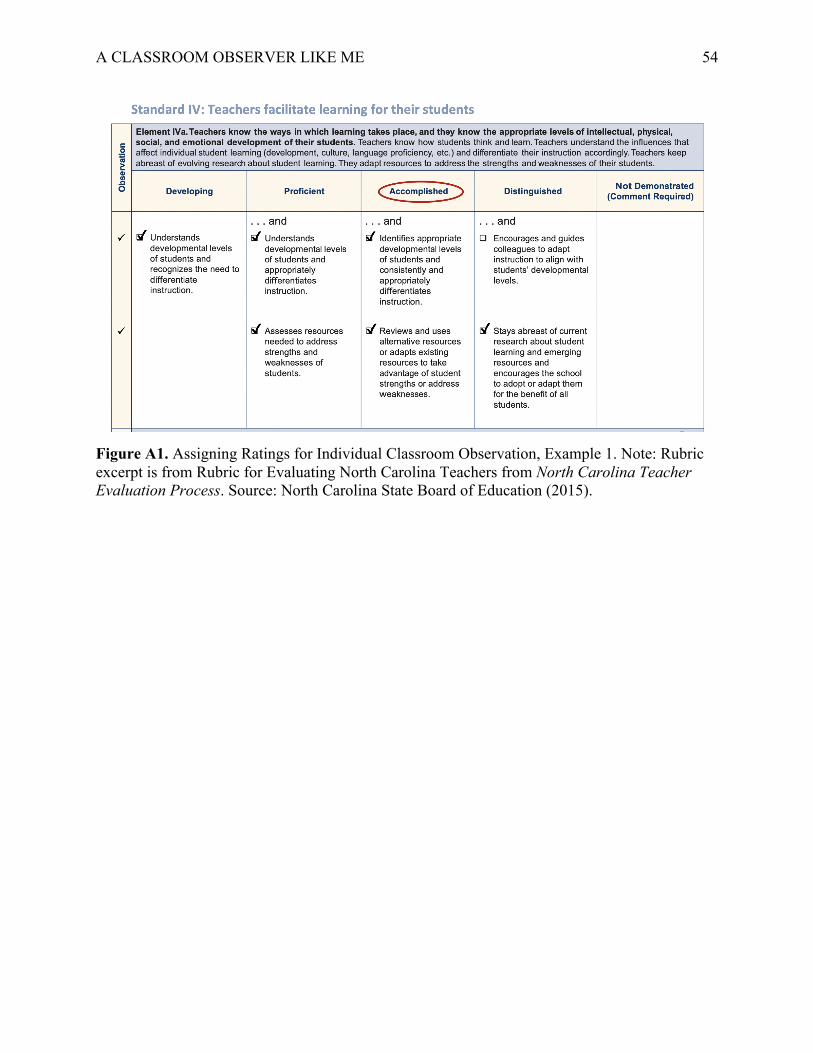
A CLASSROOM OBSERVER LIKE ME 54
Figure A1. Assigning Ratings for Individual Classroom Observation, Example 1. Note: Rubric excerpt is from Rubric for Evaluating North Carolina Teachers from North Carolina Teacher Evaluation Process. Source: North Carolina State Board of Education (2015).
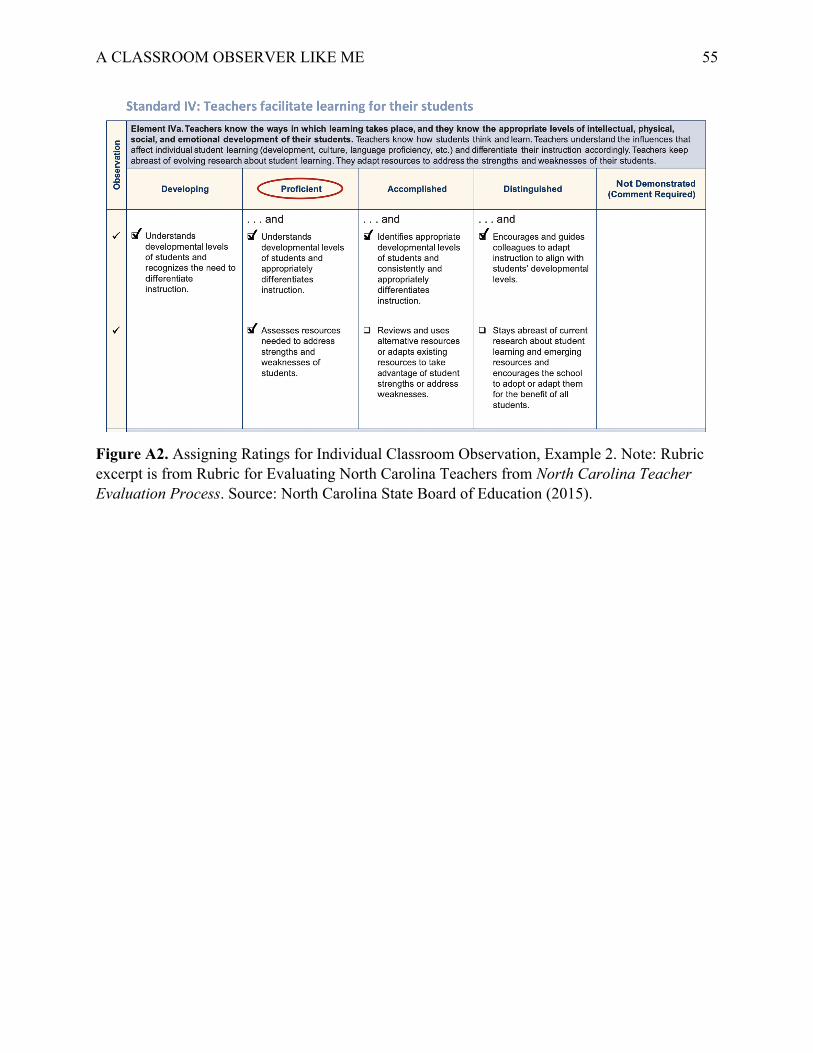
A CLASSROOM OBSERVER LIKE ME 55
Figure A2. Assigning Ratings for Individual Classroom Observation, Example 2. Note: Rubric excerpt is from Rubric for Evaluating North Carolina Teachers from North Carolina Teacher Evaluation Process. Source: North Carolina State Board of Education (2015).
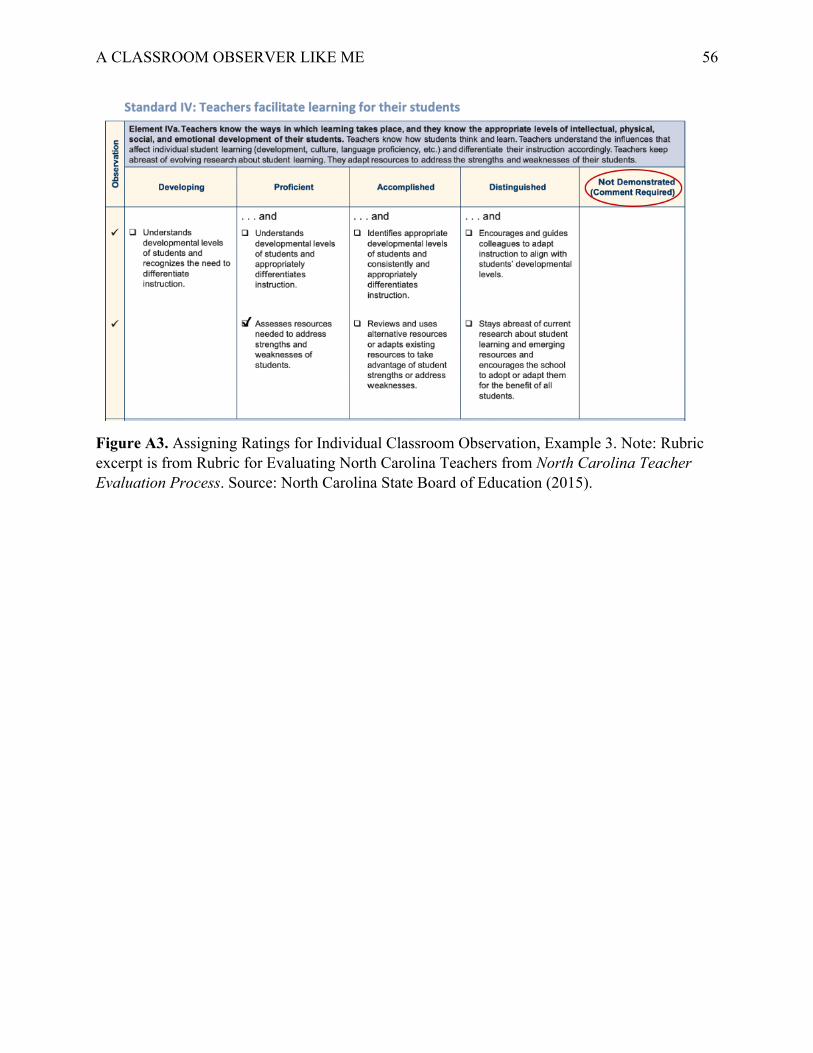
A CLASSROOM OBSERVER LIKE ME 56
Figure A3. Assigning Ratings for Individual Classroom Observation, Example 3. Note: Rubric excerpt is from Rubric for Evaluating North Carolina Teachers from North Carolina Teacher Evaluation Process. Source: North Carolina State Board of Education (2015).
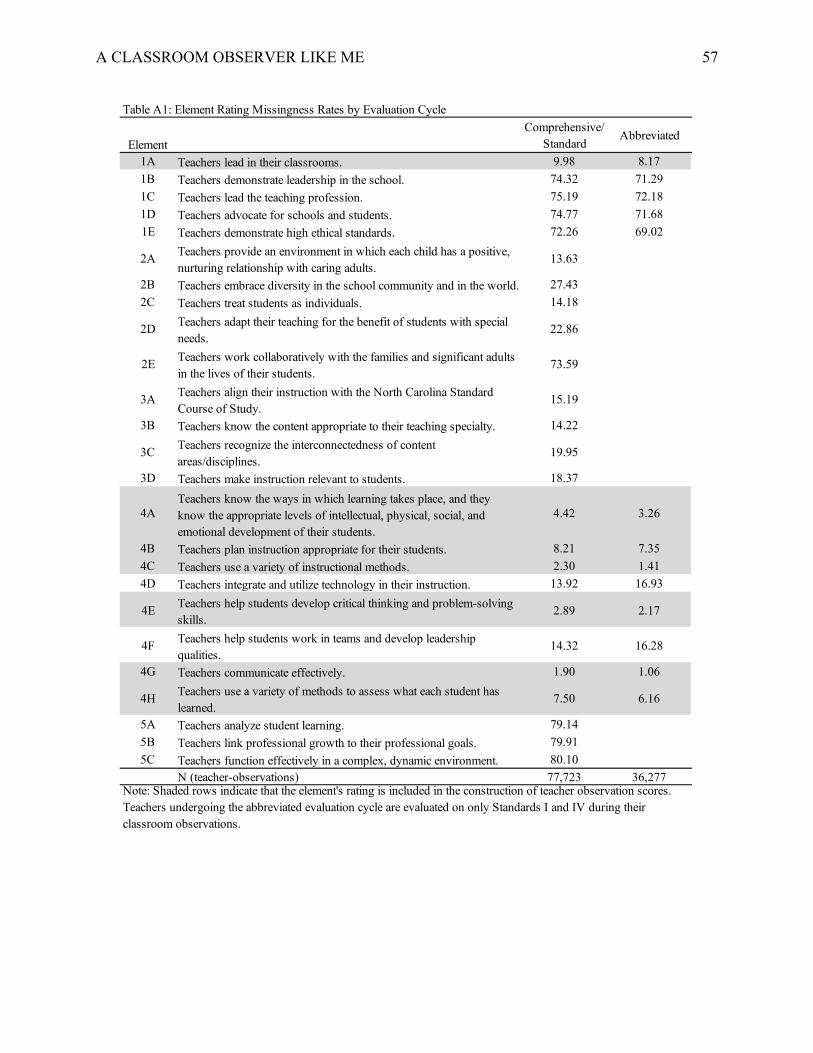
A CLASSROOM OBSERVER LIKE ME 57
Element
Comprehensive/Standard
Abbreviated
1A Teachers lead in their classrooms. 9.98 8.17
1B Teachers demonstrate leadership in the school. 74.32 71.29
1C Teachers lead the teaching profession. 75.19 72.18
1D Teachers advocate for schools and students. 74.77 71.68
1E Teachers demonstrate high ethical standards. 72.26 69.02
2ATeachers provide an environment in which each child has a positive, nurturing relationship with caring adults.
13.63
2B Teachers embrace diversity in the school community and in the world. 27.43
2C Teachers treat students as individuals. 14.18
2DTeachers adapt their teaching for the benefit of students with special needs.
22.86
2ETeachers work collaboratively with the families and significant adults in the lives of their students.
73.59
3ATeachers align their instruction with the North Carolina Standard Course of Study.
15.19
3B Teachers know the content appropriate to their teaching specialty. 14.22
3CTeachers recognize the interconnectedness of content areas/disciplines.
19.95
3D Teachers make instruction relevant to students. 18.37
4ATeachers know the ways in which learning takes place, and they know the appropriate levels of intellectual, physical, social, and emotional development of their students.
4.42 3.26
4B Teachers plan instruction appropriate for their students. 8.21 7.35
4C Teachers use a variety of instructional methods. 2.30 1.41
4D Teachers integrate and utilize technology in their instruction. 13.92 16.93
4ETeachers help students develop critical thinking and problem-solving skills.
2.89 2.17
4FTeachers help students work in teams and develop leadership qualities.
14.32 16.28
4G Teachers communicate effectively. 1.90 1.06
4HTeachers use a variety of methods to assess what each student has learned.
7.50 6.16
5A Teachers analyze student learning. 79.14
5B Teachers link professional growth to their professional goals. 79.91
5C Teachers function effectively in a complex, dynamic environment. 80.10
N (teacher-observations) 77,723 36,277
Table A1: Element Rating Missingness Rates by Evaluation Cycle
Note: Shaded rows indicate that the element's rating is included in the construction of teacher observation scores. Teachers undergoing the abbreviated evaluation cycle are evaluated on only Standards I and IV during their classroom observations.
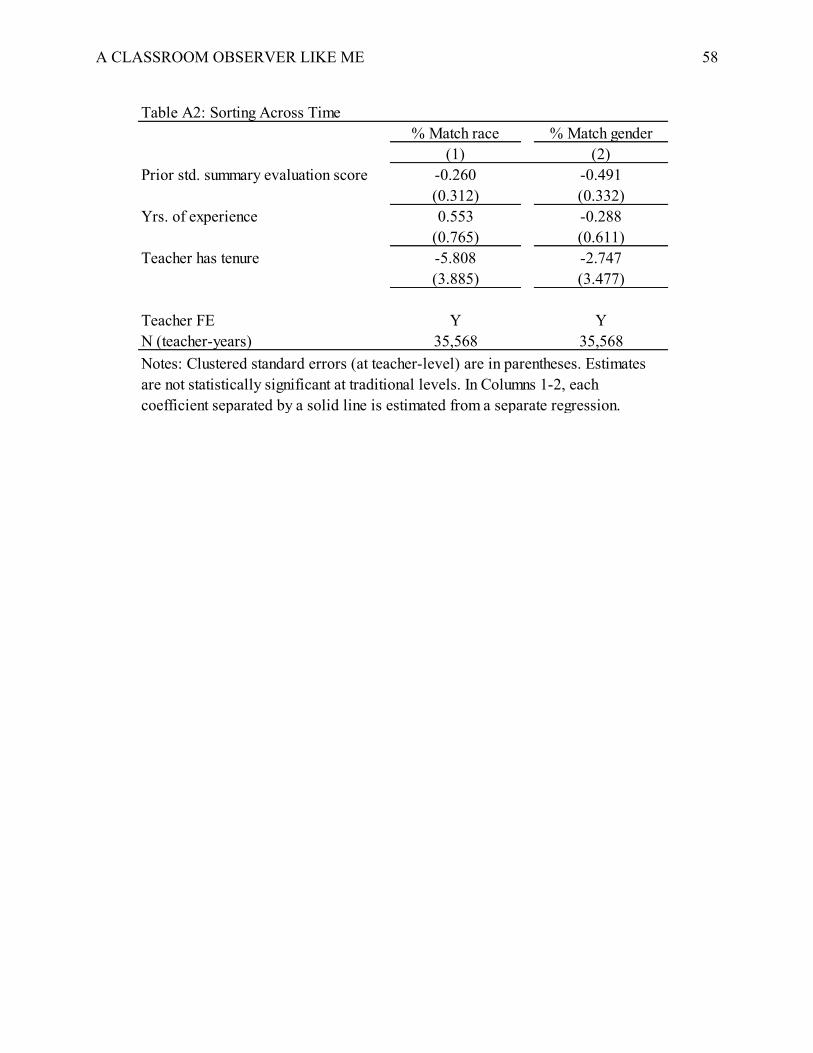
A CLASSROOM OBSERVER LIKE ME 58
% Match race % Match gender(1) (2)
Prior std. summary evaluation score -0.260 -0.491(0.312) (0.332)
Yrs. of experience 0.553 -0.288(0.765) (0.611)
Teacher has tenure -5.808 -2.747(3.885) (3.477)
Teacher FE Y YN (teacher-years) 35,568 35,568Notes: Clustered standard errors (at teacher-level) are in parentheses. Estimates are not statistically significant at traditional levels. In Columns 1-2, each coefficient separated by a solid line is estimated from a separate regression.
Table A2: Sorting Across Time
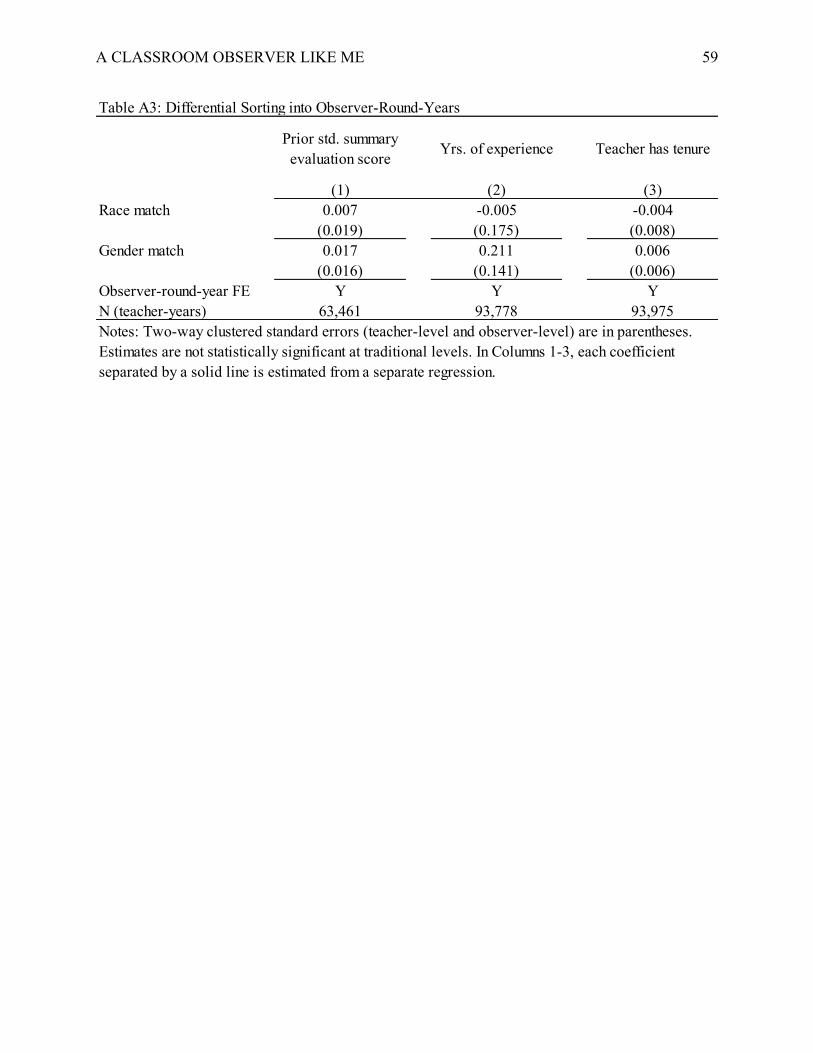
A CLASSROOM OBSERVER LIKE ME 59
Prior std. summary evaluation score
Yrs. of experience Teacher has tenure
(1) (2) (3)Race match 0.007 -0.005 -0.004
(0.019) (0.175) (0.008)Gender match 0.017 0.211 0.006
(0.016) (0.141) (0.006)Observer-round-year FE Y Y YN (teacher-years) 63,461 93,778 93,975
Table A3: Differential Sorting into Observer-Round-Years
Notes: Two-way clustered standard errors (teacher-level and observer-level) are in parentheses. Estimates are not statistically significant at traditional levels. In Columns 1-3, each coefficient separated by a solid line is estimated from a separate regression.
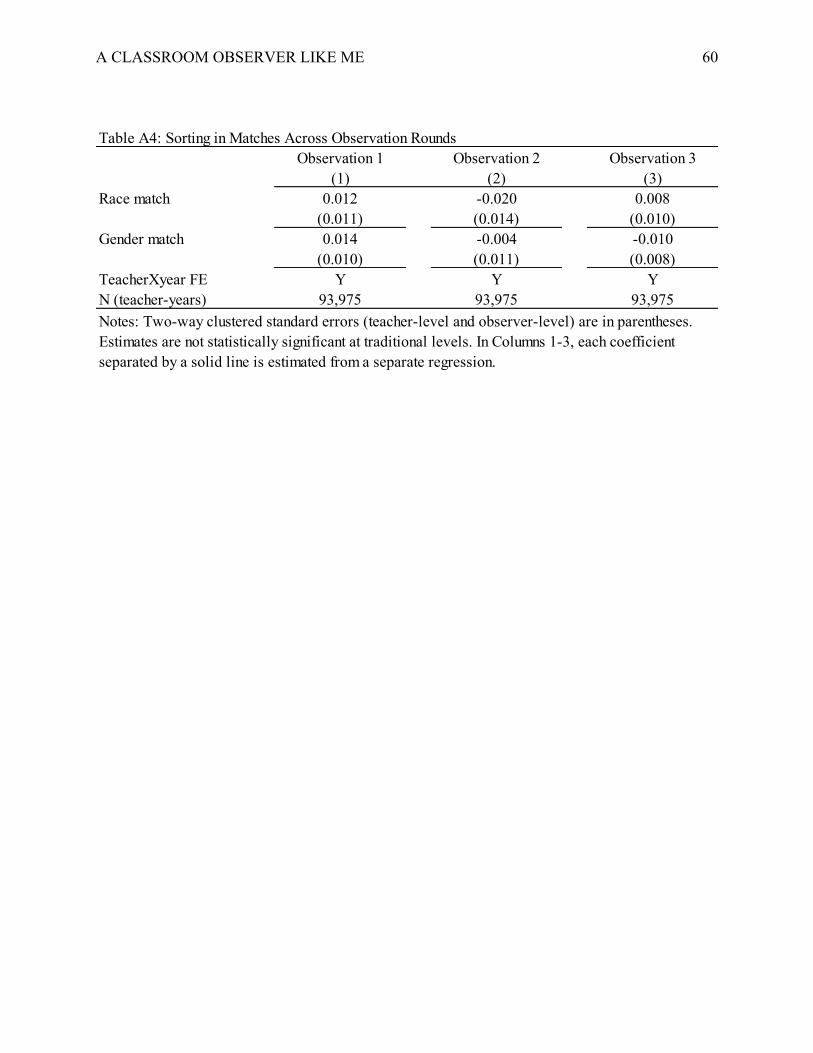
A CLASSROOM OBSERVER LIKE ME 60
Observation 1 Observation 2 Observation 3(1) (2) (3)
Race match 0.012 -0.020 0.008(0.011) (0.014) (0.010)
Gender match 0.014 -0.004 -0.010(0.010) (0.011) (0.008)
TeacherXyear FE Y Y YN (teacher-years) 93,975 93,975 93,975Notes: Two-way clustered standard errors (teacher-level and observer-level) are in parentheses. Estimates are not statistically significant at traditional levels. In Columns 1-3, each coefficient separated by a solid line is estimated from a separate regression.
Table A4: Sorting in Matches Across Observation Rounds
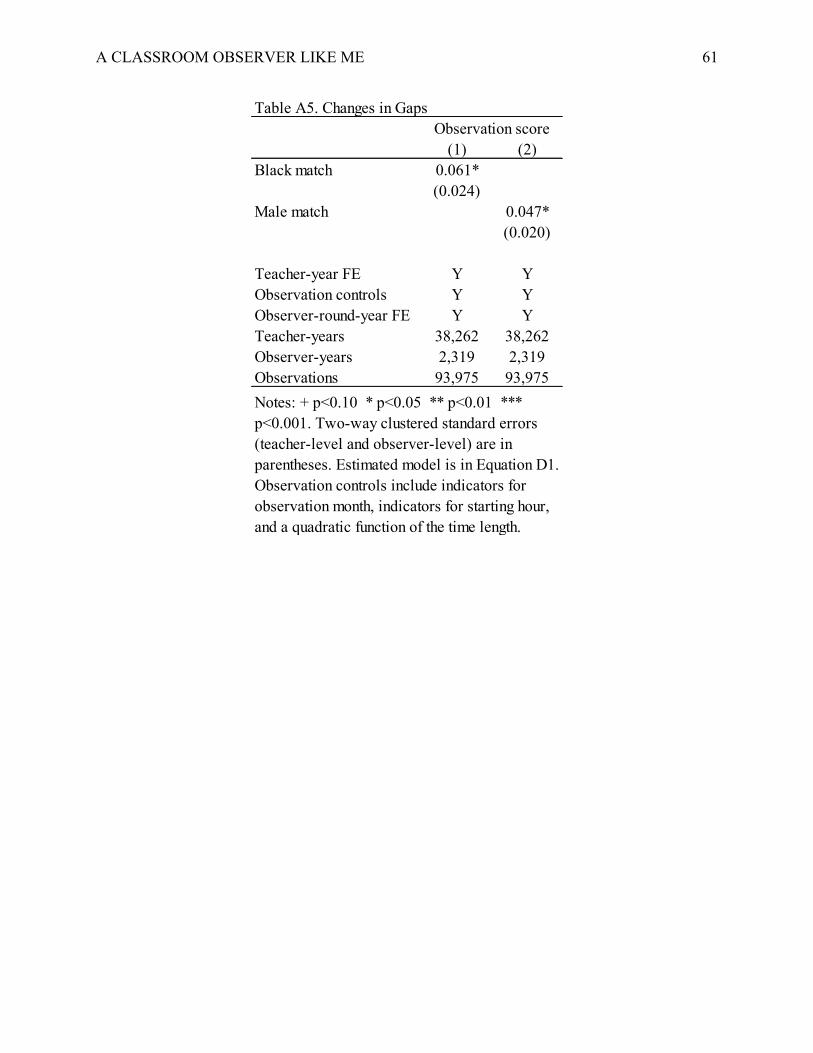
A CLASSROOM OBSERVER LIKE ME 61
(1) (2)
Black match 0.061*
(0.024)
Male match 0.047*
(0.020)
Teacher-year FE Y Y
Observation controls Y Y
Observer-round-year FE Y Y
Teacher-years 38,262 38,262
Observer-years 2,319 2,319
Observations 93,975 93,975
Notes: + p<0.10 * p<0.05 ** p<0.01 ***
p<0.001. Two-way clustered standard errors
(teacher-level and observer-level) are in
parentheses. Estimated model is in Equation D1.
Observation controls include indicators for
observation month, indicators for starting hour,
and a quadratic function of the time length.
Table A5. Changes in Gaps
Observation score
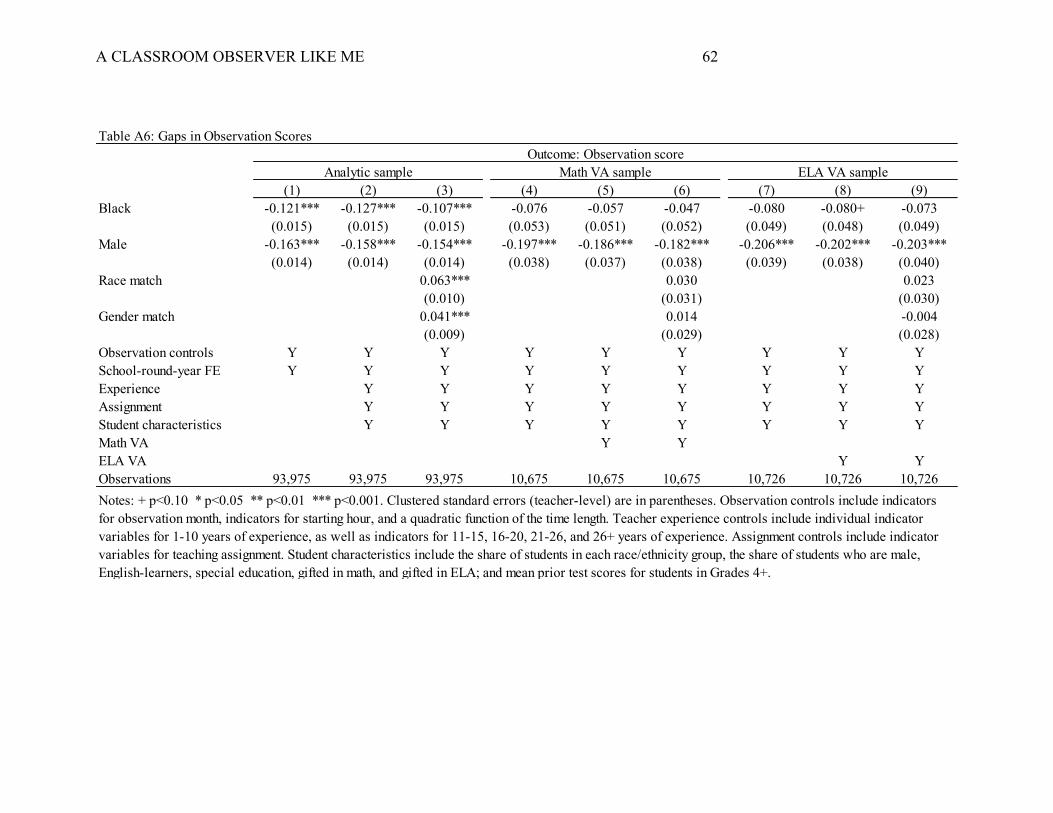
A CLASSROOM OBSERVER LIKE ME 62
(1) (2) (3) (4) (5) (6) (7) (8) (9)Black -0.121*** -0.127*** -0.107*** -0.076 -0.057 -0.047 -0.080 -0.080+ -0.073
(0.015) (0.015) (0.015) (0.053) (0.051) (0.052) (0.049) (0.048) (0.049)Male -0.163*** -0.158*** -0.154*** -0.197*** -0.186*** -0.182*** -0.206*** -0.202*** -0.203***
(0.014) (0.014) (0.014) (0.038) (0.037) (0.038) (0.039) (0.038) (0.040)Race match 0.063*** 0.030 0.023
(0.010) (0.031) (0.030)Gender match 0.041*** 0.014 -0.004
(0.009) (0.029) (0.028)Observation controls Y Y Y Y Y Y Y Y YSchool-round-year FE Y Y Y Y Y Y Y Y YExperience Y Y Y Y Y Y Y YAssignment Y Y Y Y Y Y Y YStudent characteristics Y Y Y Y Y Y Y YMath VA Y YELA VA Y YObservations 93,975 93,975 93,975 10,675 10,675 10,675 10,726 10,726 10,726
Table A6: Gaps in Observation ScoresOutcome: Observation score
Notes: + p<0.10 * p<0.05 ** p<0.01 *** p<0.001. Clustered standard errors (teacher-level) are in parentheses. Observation controls include indicators for observation month, indicators for starting hour, and a quadratic function of the time length. Teacher experience controls include individual indicator variables for 1-10 years of experience, as well as indicators for 11-15, 16-20, 21-26, and 26+ years of experience. Assignment controls include indicator variables for teaching assignment. Student characteristics include the share of students in each race/ethnicity group, the share of students who are male, English-learners, special education, gifted in math, and gifted in ELA; and mean prior test scores for students in Grades 4+.
Analytic sample Math VA sample ELA VA sample
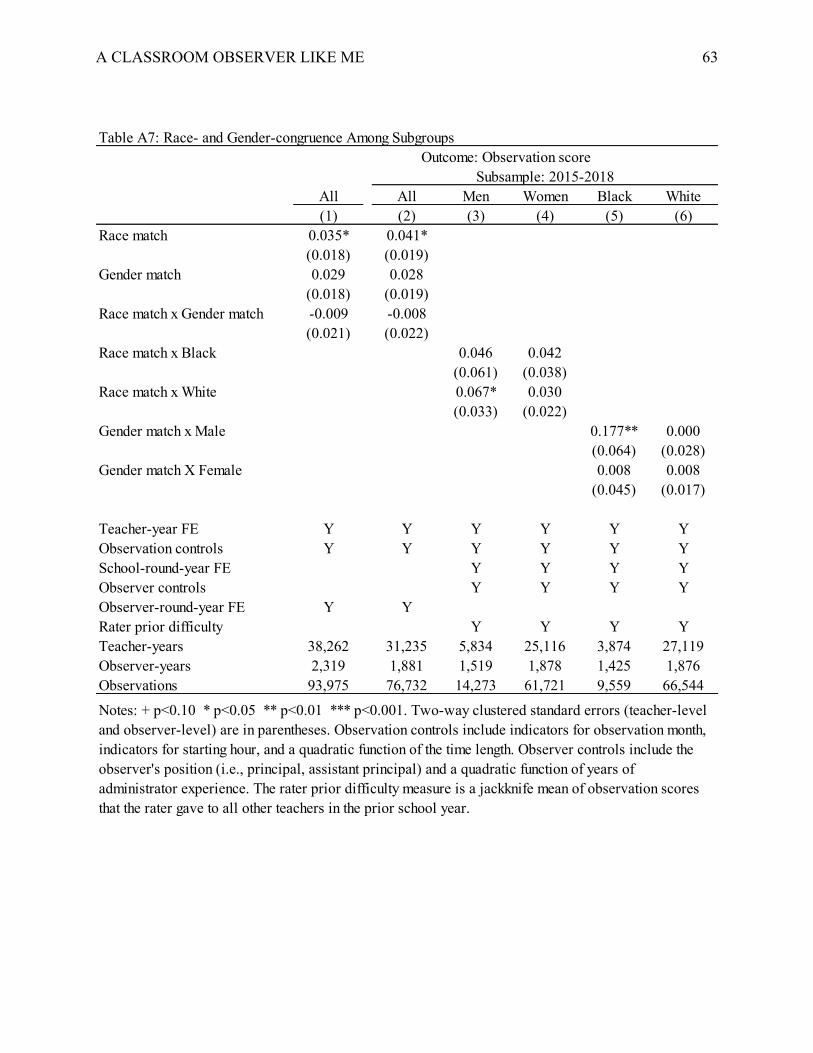
A CLASSROOM OBSERVER LIKE ME 63
All All Men Women Black White(1) (2) (3) (4) (5) (6)
Race match 0.035* 0.041*(0.018) (0.019)
Gender match 0.029 0.028(0.018) (0.019)
Race match x Gender match -0.009 -0.008(0.021) (0.022)
Race match x Black 0.046 0.042(0.061) (0.038)
Race match x White 0.067* 0.030(0.033) (0.022)
Gender match x Male 0.177** 0.000(0.064) (0.028)
Gender match X Female 0.008 0.008(0.045) (0.017)
Teacher-year FE Y Y Y Y Y YObservation controls Y Y Y Y Y YSchool-round-year FE Y Y Y YObserver controls Y Y Y YObserver-round-year FE Y YRater prior difficulty Y Y Y YTeacher-years 38,262 31,235 5,834 25,116 3,874 27,119Observer-years 2,319 1,881 1,519 1,878 1,425 1,876Observations 93,975 76,732 14,273 61,721 9,559 66,544
Notes: + p<0.10 * p<0.05 ** p<0.01 *** p<0.001. Two-way clustered standard errors (teacher-level and observer-level) are in parentheses. Observation controls include indicators for observation month, indicators for starting hour, and a quadratic function of the time length. Observer controls include the observer's position (i.e., principal, assistant principal) and a quadratic function of years of administrator experience. The rater prior difficulty measure is a jackknife mean of observation scores that the rater gave to all other teachers in the prior school year.
Table A7: Race- and Gender-congruence Among SubgroupsOutcome: Observation score
Subsample: 2015-2018
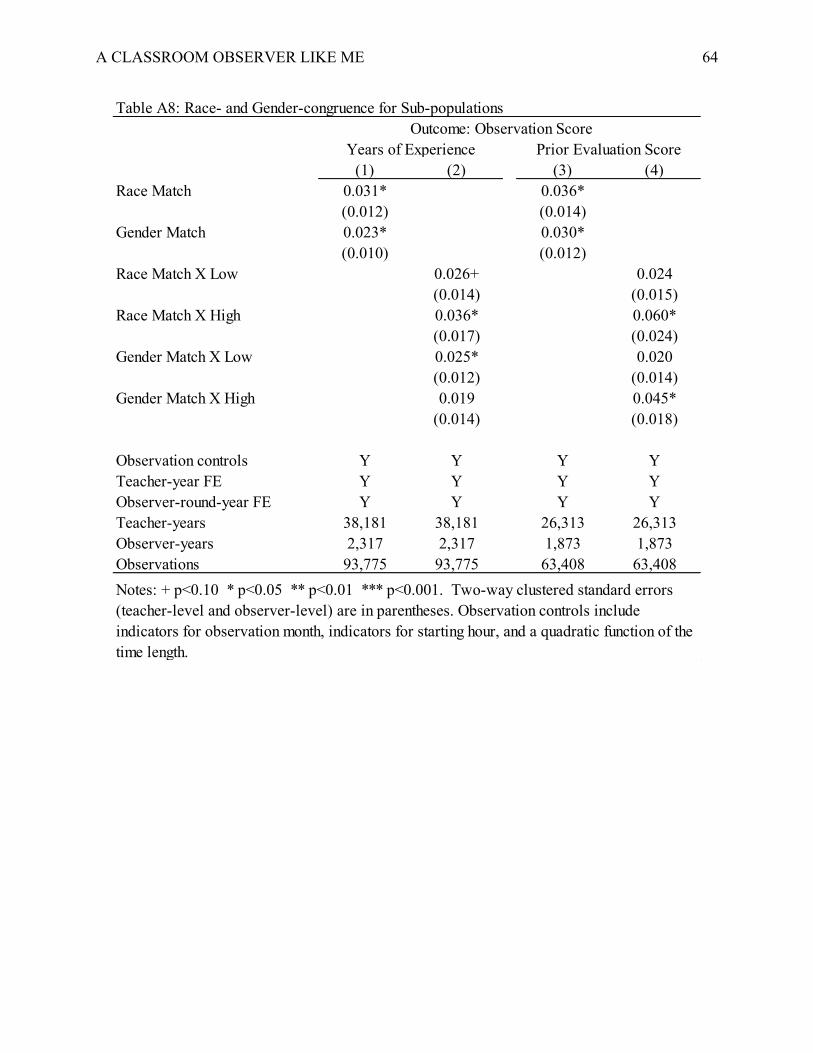
A CLASSROOM OBSERVER LIKE ME 64
(1) (2) (3) (4)
Race Match 0.031* 0.036*
(0.012) (0.014)
Gender Match 0.023* 0.030*
(0.010) (0.012)
Race Match X Low 0.026+ 0.024
(0.014) (0.015)
Race Match X High 0.036* 0.060*
(0.017) (0.024)
Gender Match X Low 0.025* 0.020
(0.012) (0.014)
Gender Match X High 0.019 0.045*
(0.014) (0.018)
Observation controls Y Y Y Y
Teacher-year FE Y Y Y Y
Observer-round-year FE Y Y Y Y
Teacher-years 38,181 38,181 26,313 26,313
Observer-years 2,317 2,317 1,873 1,873
Observations 93,775 93,775 63,408 63,408
Notes: + p<0.10 * p<0.05 ** p<0.01 *** p<0.001. Two-way clustered standard errors
(teacher-level and observer-level) are in parentheses. Observation controls include
indicators for observation month, indicators for starting hour, and a quadratic function of the
time length.
Table A8: Race- and Gender-congruence for Sub-populations
Prior Evaluation Score
Outcome: Observation Score
Years of Experience
Recommended