Education Indicators – Mechanisms to gather Education Indicators – Mechanisms to gather data from national sourcesdata from national sources
Workshop on MDG MonitoringBangkok, THAILAND
10- 12 December 2008
2
Brief course description
Objective: Better understanding on international comparative data in monitoring developmental goals
• Key players in producing international comparative data in education
• Mechanism of collecting and producing of these data
• Key issues and challenges

3
Background
• Established in 1999• Formerly, UNESCO Division of Statistics • In September 2001, the UIS moved to its new place at
University of Montreal, Quebec, CANADA• 30 November 2001 - Director-General inaugurates
the UNESCO Institute for Statistics in Montreal• Director, Mr. Hendrik VAN DER POL• Asia-Pacific Regional Advisor, Ko-Chih Tung
4
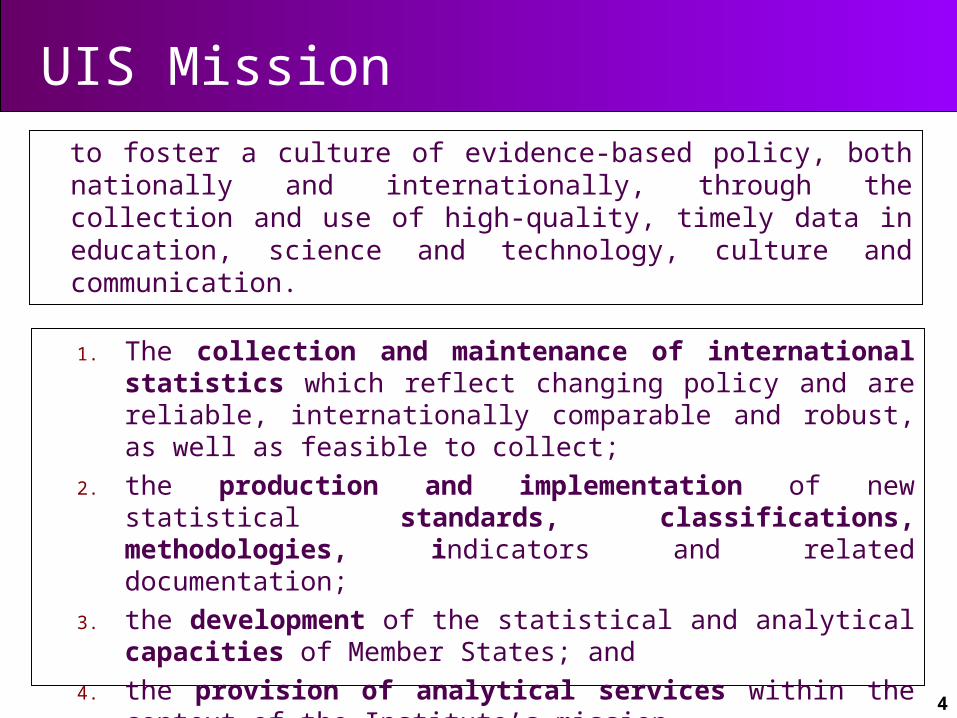
UIS Mission
to foster a culture of evidence-based policy, both nationally and internationally, through the collection and use of high-quality, timely data in education, science and technology, culture and communication.
1. The collection and maintenance of international statistics which reflect changing policy and are reliable, internationally comparable and robust, as well as feasible to collect;
2. the production and implementation of new statistical standards, classifications, methodologies, indicators and related documentation;
3. the development of the statistical and analytical capacities of Member States; and
4. the provision of analytical services within the context of the Institute’s mission..
5
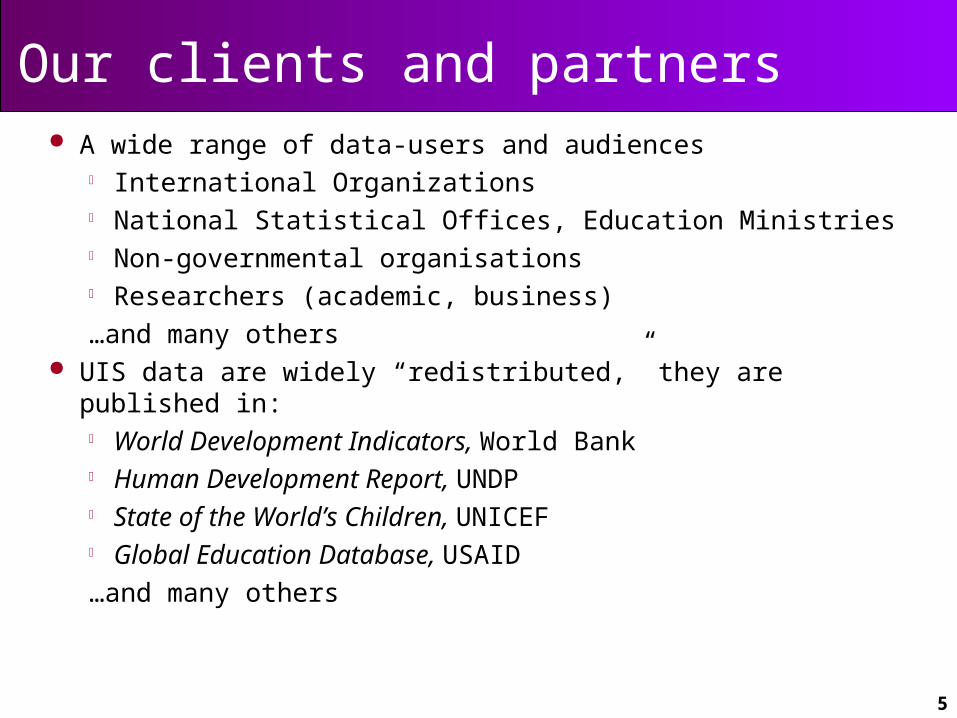
Our clients and partners A wide range of data-users and audiences
International Organizations National Statistical Offices, Education Ministries Non-governmental organisations Researchers (academic, business)…and many others
UIS data are widely “redistributed,” they are published in: World Development Indicators, World Bank Human Development Report, UNDP State of the World’s Children, UNICEF Global Education Database, USAID…and many others
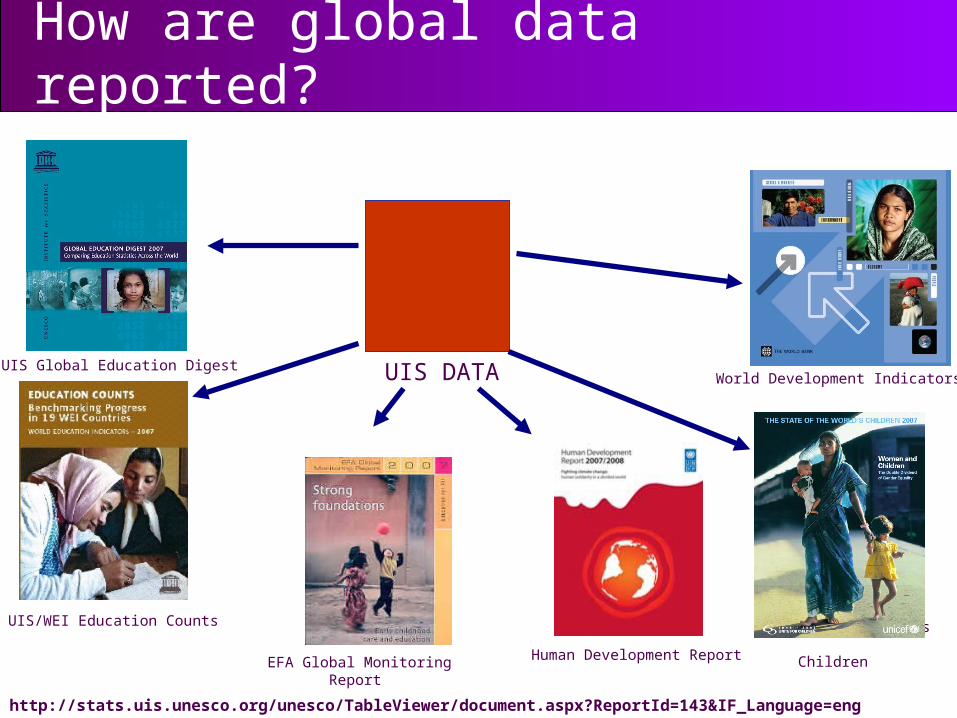
How are global data reported?
EFA Global Monitoring Report
World Development Indicators
State of the World’s Children Human Development Report
UIS DATAUIS Global Education Digest
UIS/WEI Education Counts
http://stats.uis.unesco.org/unesco/TableViewer/document.aspx?ReportId=143&IF_Language=eng
7
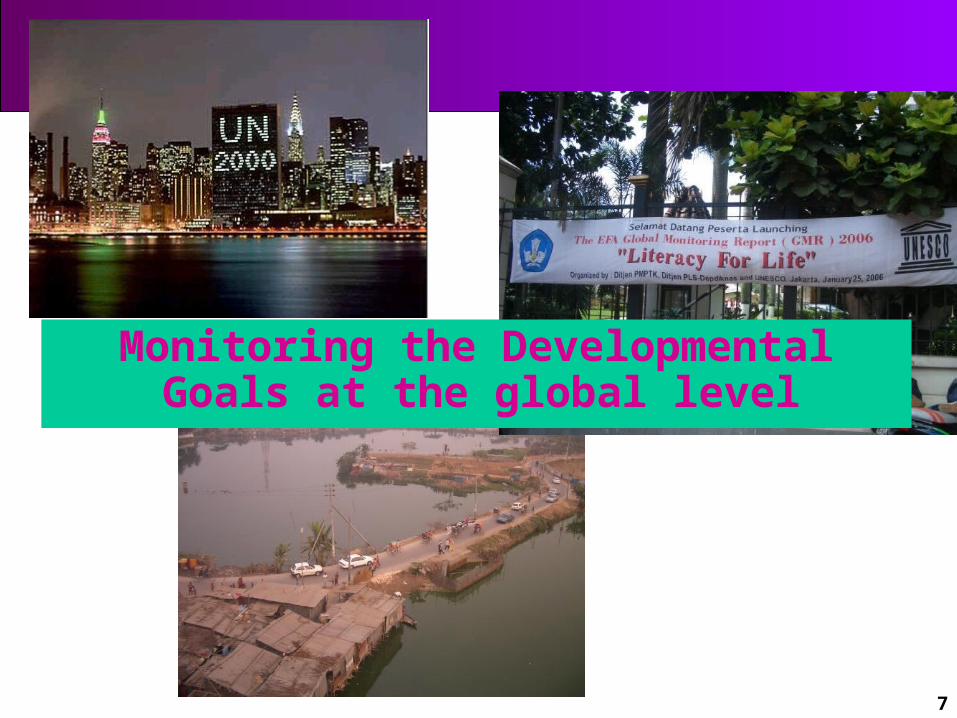
Monitoring the Developmental Goals at the global level
8
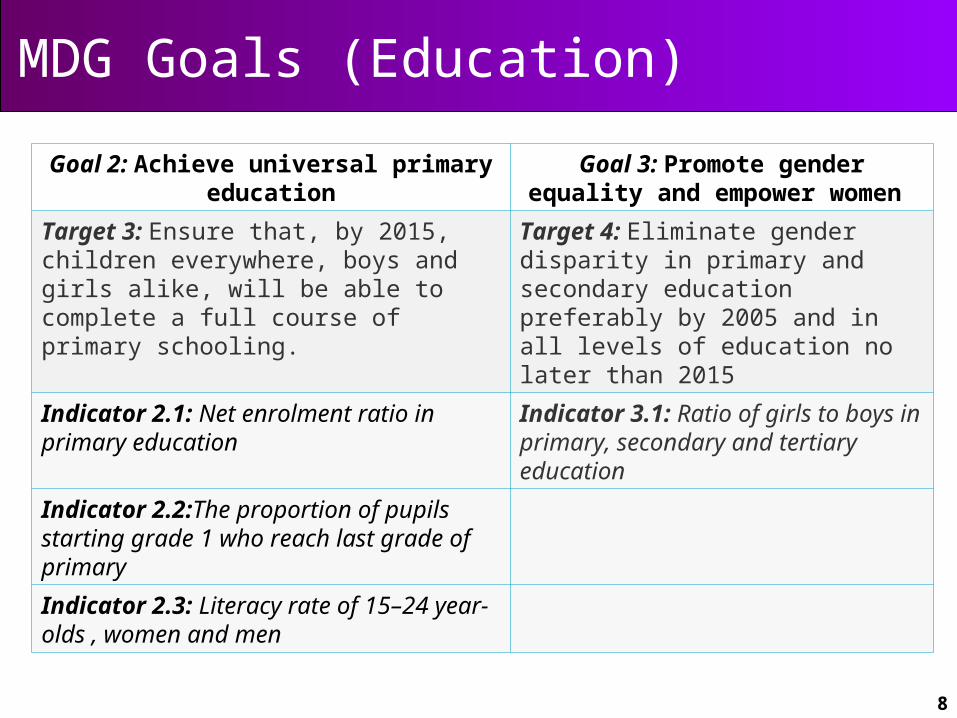
MDG Goals (Education)
Goal 2: Achieve universal primary education Goal 3: Promote gender equality and empower women
Target 3: Ensure that, by 2015, children everywhere, boys and girls alike, will be able to complete a full course of primary schooling.
Target 4: Eliminate gender disparity in primary and secondary education preferably by 2005 and in all levels of education no later than 2015
Indicator 2.1: Net enrolment ratio in primary education
Indicator 3.1: Ratio of girls to boys in primary, secondary and tertiary education
Indicator 2.2:The proportion of pupils starting grade 1 who reach last grade of primary
Indicator 2.3: Literacy rate of 15–24 year-olds , women and men
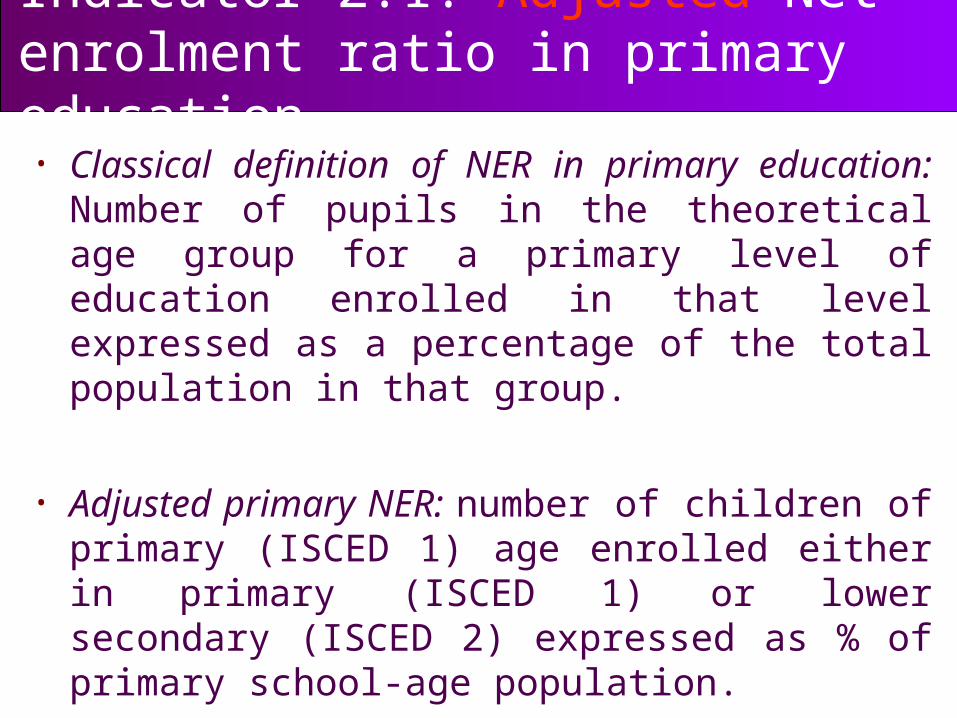
Indicator 2.1: Adjusted Net enrolment ratio in primary education • Classical definition of NER in primary
education: Number of pupils in the theoretical age group for a primary level of education enrolled in that level expressed as a percentage of the total population in that group.
• Adjusted primary NER: number of children of primary (ISCED 1) age enrolled either in primary (ISCED 1) or lower secondary (ISCED 2) expressed as % of primary school-age population.
10
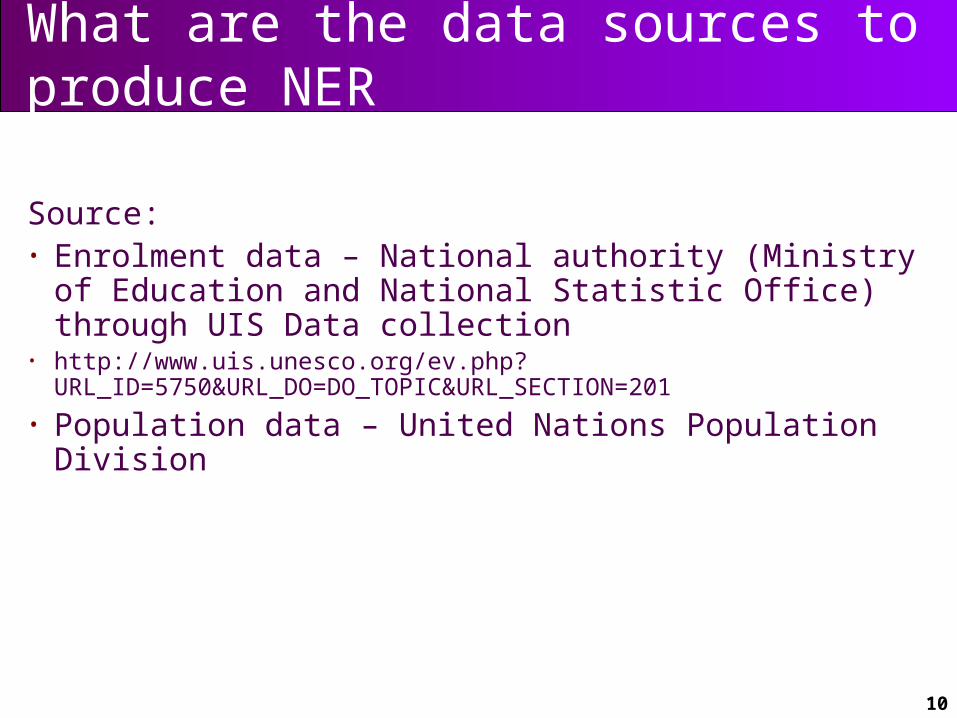
What are the data sources to produce NER
Source:• Enrolment data – National authority (Ministry of
Education and National Statistic Office) through UIS Data collection
• http://www.uis.unesco.org/ev.php?URL_ID=5750&URL_DO=DO_TOPIC&URL_SECTION=201
• Population data – United Nations Population Division
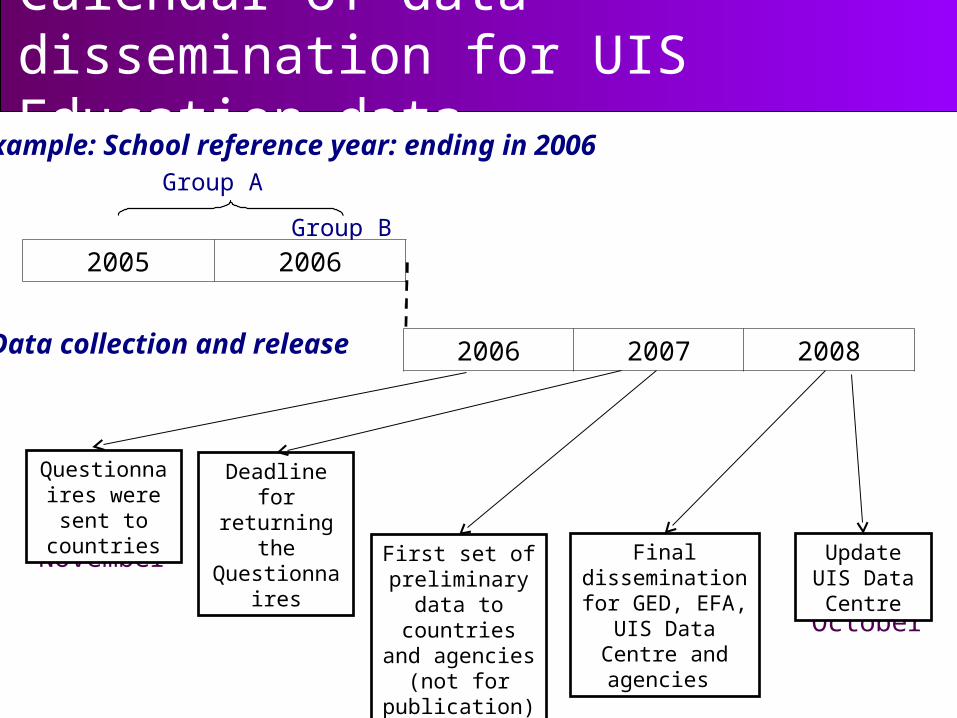
Calendar of data dissemination for UIS Education dataExample: School reference year: ending in 2006
Group A
Data collection and release
Group B
November March
December
October
April
2005 2006
2006 2007 2008
Questionnaires were sent to
countries
Deadline for returning the
QuestionnairesFirst set of
preliminary data to countries and agencies (not for
publication)
Final dissemination for GED, EFA, UIS Data Centre and
agencies
Update UIS Data Centre
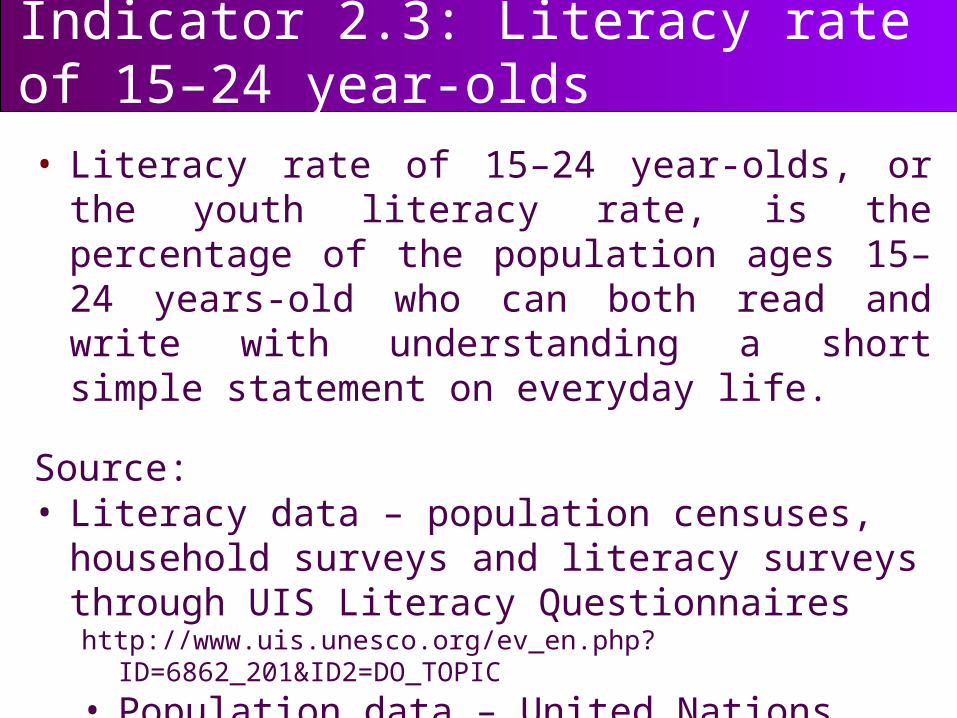
Indicator 2.3: Literacy rate of 15–24 year-olds• Literacy rate of 15–24 year-olds, or the youth literacy
rate, is the percentage of the population ages 15–24 years-old who can both read and write with understanding a short simple statement on everyday life.
Source:• Literacy data – population censuses, household surveys
and literacy surveys through UIS Literacy Questionnaireshttp://www.uis.unesco.org/ev_en.php?ID=6862_201&ID2=DO_TOPIC• Population data – United Nations Population Division
13
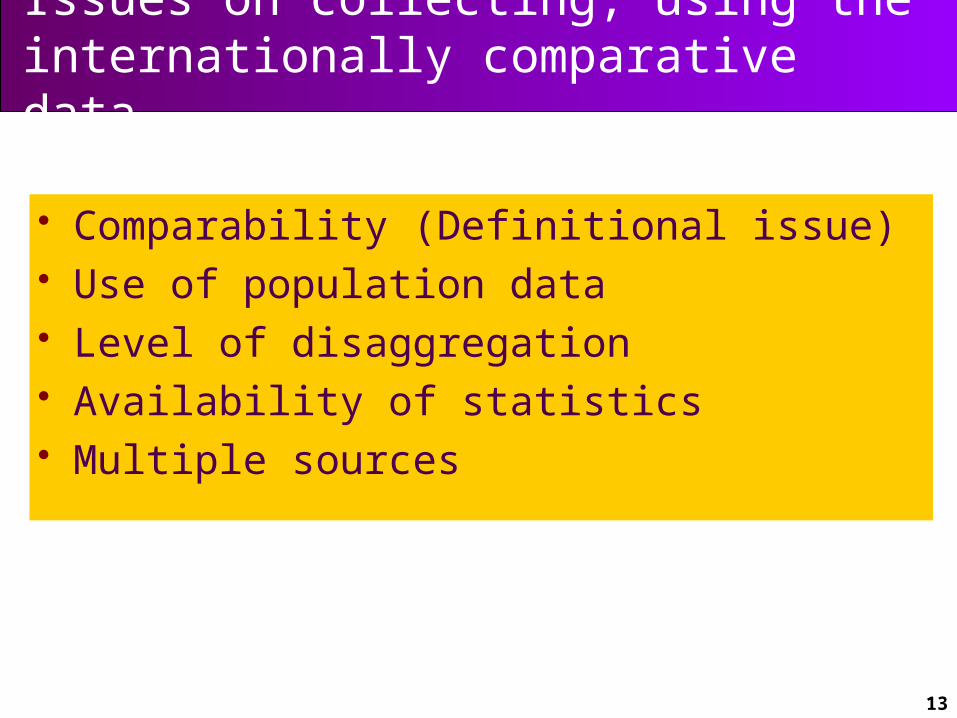
Comparability (Definitional issue) Use of population data Level of disaggregation Availability of statistics Multiple sources
Issues on collecting, using the internationally comparative data
14
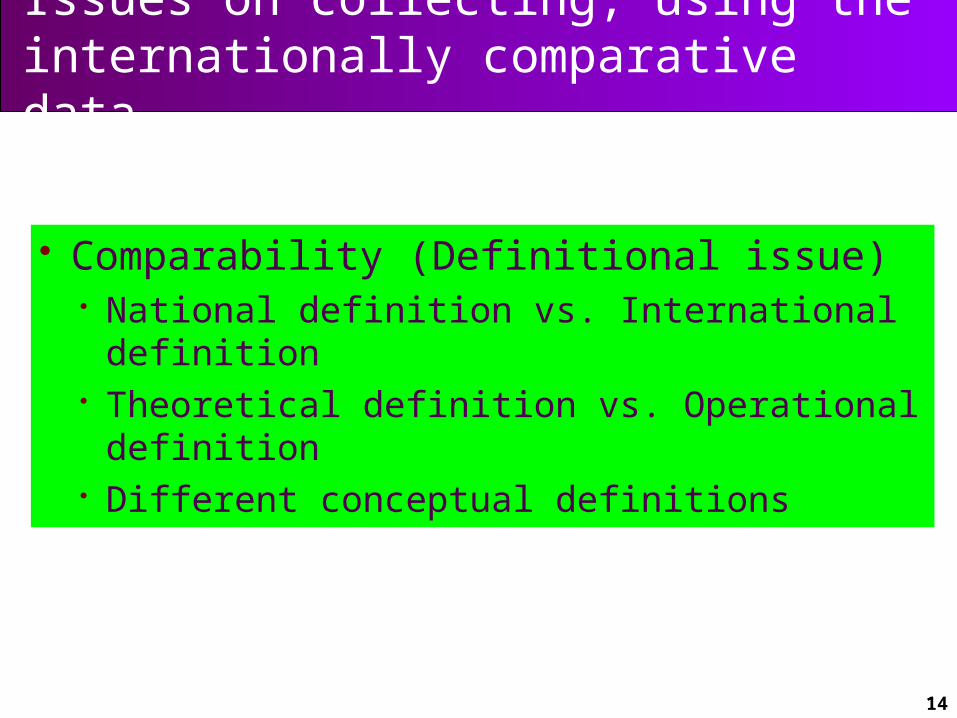
Comparability (Definitional issue) National definition vs. International definition Theoretical definition vs. Operational
definition Different conceptual definitions
Issues on collecting, using the internationally comparative data
15
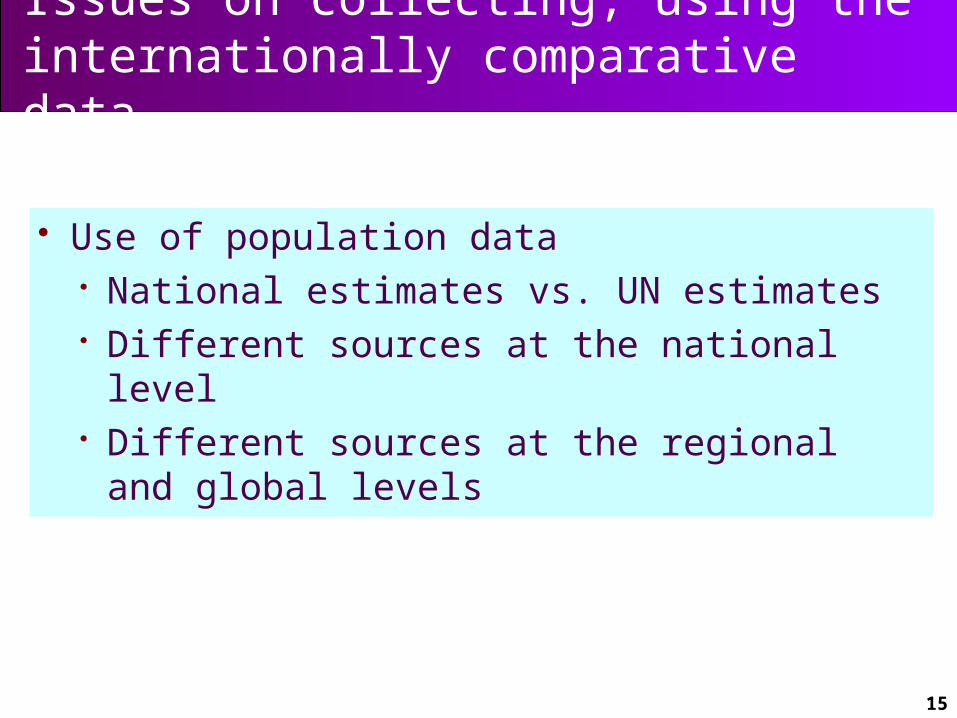
Use of population data National estimates vs. UN estimates Different sources at the national level Different sources at the regional and global
levels
Issues on collecting, using the internationally comparative data
16
Level of disaggregation Availability of data by disaggregating Reflecting true situation Geographical break-down Other social-economic break-down
Issues on collecting, using the internationally comparative data
17
Availability of statistics Which indicators are available at the which
level Regional average Global figures Estimating methodology (Treating missing
values)
Issues on collecting, using the internationally comparative data
18
Multiple sources Different sources at the national level Different sources at the regional and global
levels Population Education Indicators Surveys vs. EMIS
Issues on collecting, using the internationally comparative data
Recommended