Edinburgh Research Explorer
Neighbourhood Effects on Youth Delinquency and Drug Use
Citation for published version:McVie, S & Norris, P 2006, Neighbourhood Effects on Youth Delinquency and Drug Use. Centre for Lawand Society, University of Edinburgh.
Link:Link to publication record in Edinburgh Research Explorer
Document Version:Publisher's PDF, also known as Version of record
Publisher Rights Statement:© McVie, S., & Norris, P. (2006). Neighbourhood Effects on Youth Delinquency and Drug Use. Centre for Lawand Society, University of Edinburgh.
General rightsCopyright for the publications made accessible via the Edinburgh Research Explorer is retained by the author(s)and / or other copyright owners and it is a condition of accessing these publications that users recognise andabide by the legal requirements associated with these rights.
Take down policyThe University of Edinburgh has made every reasonable effort to ensure that Edinburgh Research Explorercontent complies with UK legislation. If you believe that the public display of this file breaches copyright pleasecontact [email protected] providing details, and we will remove access to the work immediately andinvestigate your claim.
Download date: 14. Jun. 2018
Neighbourhood Effects on Youth Delinquency and
Drug Use
Susan McVie Paul Norris
Number 10
Edinburgh Study of Youth Transitions and Crime
2
Other titles in this series of research digests, priced £10, are available on re-quest (subject to ability) from:
The Edinburgh Study of Youth Transitions and Crime 2.12 31 Buccleuch Place Edinburgh EH8 9JS
Email: [email protected] Copies of all titles are also available to download, free if charge, from our website at www.law.ed.ac.uk/cls/esytc/ Other titles in this series: Number 1: The Edinburgh Study of Youth Transitions and Crime: Key Find-ings at Ages 12 and 13 Number 2: Gender and Youth Offending Number 3: Parenting and Delinquency ay Ages 12 to 15 Number 4: Truancy, School Exclusion and Substance Misuse Number 5: The Links Between Victimization and Offending Number 6: Patterns of Referral to the Children’s Hearings Systems for Drugs or Alcohol Misuse Number 7: Adolescent Smoking, Drinking and Drug Use Number 8: Gang Membership and Teenage Offending Number 9: Family Functioning and Substance Use at Ages 12 to 17 Number 11: The Effect of Neighbourhoods on Adolescent Property Offending Number 12: Social Inclusion and Early Desistance from Crime Number 13: School Experience and Delinquency at Ages 13 to 16

3
4
NEIGHBOURHOOD EFFECTS ON
YOUTH DELINQUENCY AND DRUG USE
Susan McVie
Centre for Law and Society
The University of Edinburgh
and
Paul Norris
School of Social and Political Studies
The University of Edinburgh
The Edinburgh Study of Youth Transitions and Crime
2006
5
Copyright © 2006 Centre for Law and Society, The University of Edinburgh
Published 2006 by Centre for Law and Society
The University of Edinburgh
Old College
Edinburgh
EH8 9YL
All rights reserved.
The views expressed in this report do not represent those of The Edinburgh
Study’s funding bodies or of The University of Edinburgh.
Limited extracts from the text may be reproduced provided the source is acknowledged.
For more extensive reproduction please contact the Edinburgh Study of Youth
Transitions and Crime 2.12, 31 Buccleuch Place Edinburgh EH8 9JS.
Further printed copies of this report are available, priced £10. To order, please contact
the Edinburgh Study at the above address or email [email protected].
A PDF version of the report is also available to download, free of charge, from our
website at www.law.ed.ac.uk/cls/esytc
6
KEY FINDINGS
Characteristics of the neighbourhoods in which young people live do play a role in
influencing aspects of their delinquent and drug using behaviour, although their impact
is relatively weak in comparison to the effect of individual characteristics, such as
gender and personality.
The neighbourhood factors involved in explaining higher levels of delinquency,
cannabis and hard drug use amongst 16 year olds are quite different, which indicates
that a different theoretical framework may be needed to understand the contextual
effects of areas on different problematic behaviours.
Whereas delinquency and hard drug use are partially explained by negative
neighbourhood characteristics (such as greater deprivation in the case of delinquency
and higher crime rates for hard drug use), more frequent cannabis use is greater within
prosperous neighbourhoods but also within areas in which there is greater social
disorganisation.
The findings support crime control policies based on tackling underlying structural
deprivation (such as unemployment and density of local authority housing). However,
they also indicate that community-based strategies that take a uniform approach to
tackling both crime and drug use are unlikely to be entirely successful due to the
different influences of neighbourhood factors.
7
INTRODUCTION
This report aims to investigate whether the characteristics of residential neighbourhoods
exert an influence on two forms of problematic adolescent behaviour, criminal
offending and drug use, that is independent of factors relating specifically to the
individual. It draws on the findings of the Edinburgh Study of Youth Transitions and
Crime (the Edinburgh Study), a longitudinal research programme exploring pathways
into and out of offending for a cohort of 4,328 young people, who started secondary
school in the City of Edinburgh in 1998. The key aims and methods of the research
programme are summarized below.1
Aims of the programme
• To investigate the factors leading to involvement in offending and desistance from it
• To examine the striking contrast between males and females in criminal offending
• To explore the above in three contexts:
- Individual development
- Interactions with formal agencies of control
- The social and physical structures of neighbourhoods
• To develop new theories explaining offending behaviour and contribute to practical policies
targeting young people
Overview of methods
• Self report questionnaires (annual sweeps)
• Semi-structured interviews (40 undertaken in sweep 2)
• School, social work, children’s hearings records (annual sweeps)
• Teacher questionnaires (1999)
• Police juvenile liaison officer and Scottish criminal records (from 2002)
• Parent survey (2001)
• Geographic information system
Participating schools
• All 23 state secondary schools
• 8 out of 14 independent sector schools
• 9 out of 12 special schools
Response Rates
• Sweep 1 96.2% (n=4,300)
• Sweep 2 95.6% (n=4299)
• Sweep 3 95.2% (n=4296)
• Sweep 4 92.6% (n=4144)
• Sweep 5 89.1% (n=3856)
• Sweep 6 80.5% (n=3531)
Research Team
• Lizzy Burgess, Lucy Holmes, Lesley McAra, Susan McVie,
Paul Norris (left 2005), Jackie Palmer, David J. Smith
Study Funding
• Economic and Social Research Council (1998 - 2002)
• The Scottish Executive (2002- 2005)
• The Nuffield Foundation (2002 - 2006)
The design of the study, which involves collecting longitudinal data from a single age
cohort covering an entire city, is ideal for assessing neighbourhood effects on
individual behaviour. The large cohort size ensures adequate numbers for comparison
between 91 local neighbourhoods which have been derived within the City of
1 See also Smith et al (2001) and Smith and McVie (2003) for further details about the study.
8
Edinburgh. The analysis for this report includes descriptive statistics to identify
patterns in delinquency and drug use and maps of their distribution across the 91
neighbourhoods; correlation analysis which shows the relationships between these
behaviours and a variety of potential explanatory factors; and regression modelling to
establish whether neighbourhood-level factors impact on offending and drug use in
ways that are not attributable to the underlying individual characteristics of cohort
members.
Context
Crime and the neighbourhood context
There is a long history of research that shows large differences in rates of crime
between different types of neighbourhood (see Bottoms and Wiles 2002). In general,
higher levels of offending tend to be concentrated in neighbourhoods characterised by
greater socio-economic deprivation, social stress and physical disorder. At the same
time, offending varies according to a wide range of individual risk factors (for a review
see Farrington 2002) and the composition of the population varies between
neighbourhoods such that the prevalence of these individual risk factors for offending is
relatively high in neighbourhoods with higher levels of deprivation and socio-economic
stress. In recent years, advances in statistical analysis using multilevel modelling has
provided strong evidence that neighbourhoods impact on behaviour over and above the
effects of individual level influences (Wikstrom and Loeber 2000; Oberwittler 2004).
A number of theories have been put forward to explain the relationship between
neighbourhood and crime. One of the earliest is that of ‘social disorganisation’
(recently redefined under the heading of ‘social capital’) which stems from the work of
Shaw and McKay (1942), amongst others. This theory proposes that delinquency is
caused by the disruption of social networks and ties within communities due to
residential turnover and migration, which results in an erosion of common values and
an inability to maintain effective social order. However, critics have argued that it is
not simply the absence of dense social ties that causes increased crime rates. William J.
Wilson (1987), for example, argues that the residents of very poor neighbourhoods may
have close bonds and network ties, but they often lack sufficient resources to establish
social control. Wilson argues that it is the ‘concentration effect’ of extreme socio-
economic disadvantage such as high unemployment rates, poverty and overcrowding
that results in higher crime rates.
Sampson et al (1997) also reject the notion that mechanisms of social control are
simply about strong community ties. Their theory is that public order is maintained and
crime is reduced through ‘collective efficacy’ which links together both social cohesion
and shared expectations of control. Their measure of collective efficacy is based on
asking people how likely it is that they could rely on their neighbours to take action in
various circumstances, such as if children were skipping school and hanging around
their street corner. Sampson (2004) has also argued that a range of positive
neighbourhood characteristics are required to produce a social ethos that benefits all
residents and helps to reduce crime, including such factors as community safety.
Another influential ecological theory is the ‘broken windows’ theory which posits that
social and physical disorder, if unheeded, can escalate from minor signs of incivility or
urban decay, such as graffiti or vandalism, to more serious forms of predatory crime
because local residents, feeling threatened and vulnerable, withdraw from
9
neighbourhood affairs (Wilson and Kelling 1982). Despite underpinning many crime
control policies, recent research has indicated that social processes such as collective
efficacy are more important in influencing crime rates and that disorder and incivility
are symptoms rather than causes of crime (Sampson and Raudenbush 2001).
From a behaviourist perspective, social learning theorists posit that all behaviours,
including offending, are learned through the observation of the behaviours of others,
such as family, friends and neighbours (Bandura 1977). From this theoretical
standpoint, exposure to high levels of offending within the residential area might
impact on an individuals’ propensity to offend. Thus, living within an area
characterised by high crime rates may have an independent effect on the behaviour of
individuals living there.
Drugs and the neighbourhood context
Limited research exists on the effect of neighbourhood context on drug use.
Commentators have long recognised the need to include ecological variables in studies
of adolescent drug use because neighbourhood characteristics, such as drug availability
and acceptability, may influence individual drug use (Dembo et al 1986 in Jang &
Johnson 2001). However, analysis has tended to be restricted to simple mapping of
problematic drug use (e.g. levels of injecting or Class A use) or analysis of national
prevalence using spatial units which are too large to say anything about neighbourhood
characteristics (Forsyth and Barnard 1999).
The little research that exists has produced ambiguous results. Jang and Johnson
(2001), using data from the American National Youth Survey, found that living in
neighbourhoods with high perceptions of disorder was a significant risk factor for
adolescent drug use. They proposed that disordered neighbourhoods provided a context
within which adolescents could initiate, establish and maintain drug use because such
areas symbolised a lack of social controls in the neighbourhood with fewer concerns
about standards relating to drug use. Forsyth and Barnard (1999) found no clear
causative relationship between adolescent drug use and deprivation (as measured using
the Carstairs & Morris Deprivation Categorisation System) across a range of urban and
rural communities in Scotland. Although, more recently, analysis of British Crime
Survey data found that levels of drug use in England and Wales were greatest within
more affluent housing types, according to ACORN classification (Chivite-Matthews et
al 2005).
Scottish policy development
Reducing crime and drug use are key government policy objectives in Scotland2. Both
crime and drug use have been viewed as symbols of community disintegration and
weakened social controls within society; therefore there has been a strong policy focus
on neighbourhoods. Policies have sought to address the geographical distribution of
crime and disorder by increasing the involvement of social housing agencies, local
authorities and communities in tackling antisocial behaviour at a neighbourhood level
(Flint 2002). Tackling crime and the fear of crime forms a key part of the Scottish
Executive’s community safety partnerships. Drug action teams co-ordinate a local
response to drug misuse and have an integral role to play in the action plans of
2 Scottish Executive policy documents include A Safer Scotland (1999); Better Communities in Scot-
land (2002); Putting our communities first (2003); Tackling Drugs in Scotland: Action in Partnership
(1999); and Protecting our Future: Scottish Executive’s Drug Action Plan (2000).
10
community safety partnerships. More detailed information about the impact of
neighbourhood level factors on offending and drug use would help to better inform
such community based policies.
Structure of the report
The first part of this report presents a descriptive analysis of the variables used for
analysis in this paper. This includes measures of delinquency and drug use, various
individual characteristics and neighbourhood-level factors. The second part explores
the relationships between delinquency and drug use and the potential explanatory
variables described in part one. In the third part, regression analysis is used to estimate
the impact of various neighbourhood factors on young people’s delinquency and drug
use whilst controlling for the impact of their individual characteristics. The report
concludes with a discussion of the key findings from the analysis and some policy
relevant conclusions.
11
PART 1: INDIVIDUAL AND NEIGHBOURHOOD LEVEL
CHARACTERISTICS
This section describes the variables used in the analysis for this paper. The dependent
variables (or variables to be explained) include a measure of delinquency and two
measures of drug use: cannabis use (a class C drug) which is the most common form of
adolescent drug use; and harder drug use (class A and B drugs) which is far less
common (see McVie and Bradshaw 2005). In addition, a range of potential individual
and neighbourhood level explanatory variables are described here.
The dependent and individual level explanatory variables were all collected from the
cohort members using a self-report questionnaire at sweep five of the study, when they
were aged 16 years on average. The neighbourhood level explanatory variables were
derived from three independent sources (the census, the police and a community
survey) which were all broadly contemporaneous with the sweep five data collection
period. Further details of all the variables are given in appendix 1.
Delinquency measure
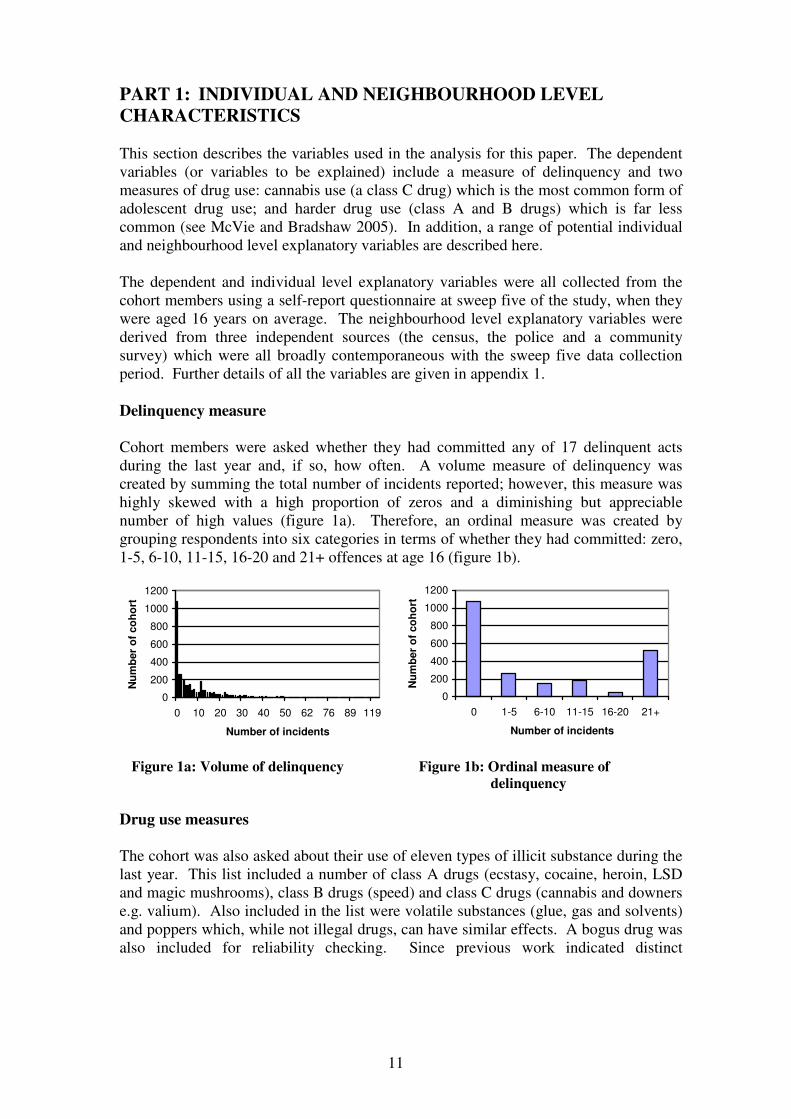
Cohort members were asked whether they had committed any of 17 delinquent acts
during the last year and, if so, how often. A volume measure of delinquency was
created by summing the total number of incidents reported; however, this measure was
highly skewed with a high proportion of zeros and a diminishing but appreciable
number of high values (figure 1a). Therefore, an ordinal measure was created by
grouping respondents into six categories in terms of whether they had committed: zero,
1-5, 6-10, 11-15, 16-20 and 21+ offences at age 16 (figure 1b).
0
200
400
600
800
1000
1200
0 10 20 30 40 50 62 76 89 119
Number of incidents
Nu
mb
er
of
co
ho
rt
0
200
400
600
800
1000
1200
0 1-5 6-10 11-15 16-20 21+
Number of incidents
Nu
mb
er
of
co
ho
rt
Figure 1a: Volume of delinquency Figure 1b: Ordinal measure of
delinquency
Drug use measures
The cohort was also asked about their use of eleven types of illicit substance during the
last year. This list included a number of class A drugs (ecstasy, cocaine, heroin, LSD
and magic mushrooms), class B drugs (speed) and class C drugs (cannabis and downers
e.g. valium). Also included in the list were volatile substances (glue, gas and solvents)
and poppers which, while not illegal drugs, can have similar effects. A bogus drug was
also included for reliability checking. Since previous work indicated distinct
12
differences between types of drug users (McVie and Bradshaw 2005), analysis
differentiated between cannabis use and ‘hard’ drug use (class A and B).3
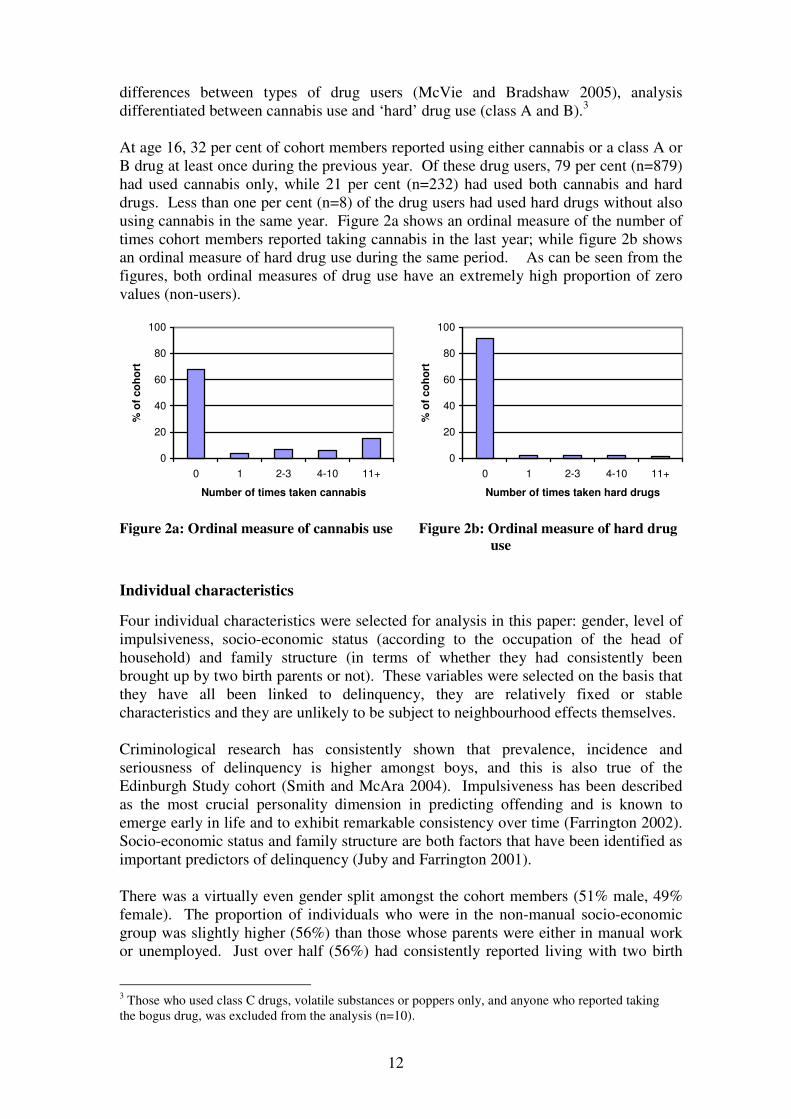
At age 16, 32 per cent of cohort members reported using either cannabis or a class A or
B drug at least once during the previous year. Of these drug users, 79 per cent (n=879)
had used cannabis only, while 21 per cent (n=232) had used both cannabis and hard
drugs. Less than one per cent (n=8) of the drug users had used hard drugs without also
using cannabis in the same year. Figure 2a shows an ordinal measure of the number of
times cohort members reported taking cannabis in the last year; while figure 2b shows
an ordinal measure of hard drug use during the same period. As can be seen from the
figures, both ordinal measures of drug use have an extremely high proportion of zero
values (non-users).
0
20
40
60
80
100
0 1 2-3 4-10 11+
Number of times taken cannabis
% o
f co
ho
rt
0
20
40
60
80
100
0 1 2-3 4-10 11+
Number of times taken hard drugs
% o
f co
ho
rt
Figure 2a: Ordinal measure of cannabis use Figure 2b: Ordinal measure of hard drug
use
Individual characteristics
Four individual characteristics were selected for analysis in this paper: gender, level of
impulsiveness, socio-economic status (according to the occupation of the head of
household) and family structure (in terms of whether they had consistently been
brought up by two birth parents or not). These variables were selected on the basis that
they have all been linked to delinquency, they are relatively fixed or stable
characteristics and they are unlikely to be subject to neighbourhood effects themselves.
Criminological research has consistently shown that prevalence, incidence and
seriousness of delinquency is higher amongst boys, and this is also true of the
Edinburgh Study cohort (Smith and McAra 2004). Impulsiveness has been described
as the most crucial personality dimension in predicting offending and is known to
emerge early in life and to exhibit remarkable consistency over time (Farrington 2002).
Socio-economic status and family structure are both factors that have been identified as
important predictors of delinquency (Juby and Farrington 2001).
There was a virtually even gender split amongst the cohort members (51% male, 49%
female). The proportion of individuals who were in the non-manual socio-economic
group was slightly higher (56%) than those whose parents were either in manual work
or unemployed. Just over half (56%) had consistently reported living with two birth
3 Those who used class C drugs, volatile substances or poppers only, and anyone who reported taking
the bogus drug, was excluded from the analysis (n=10).
13
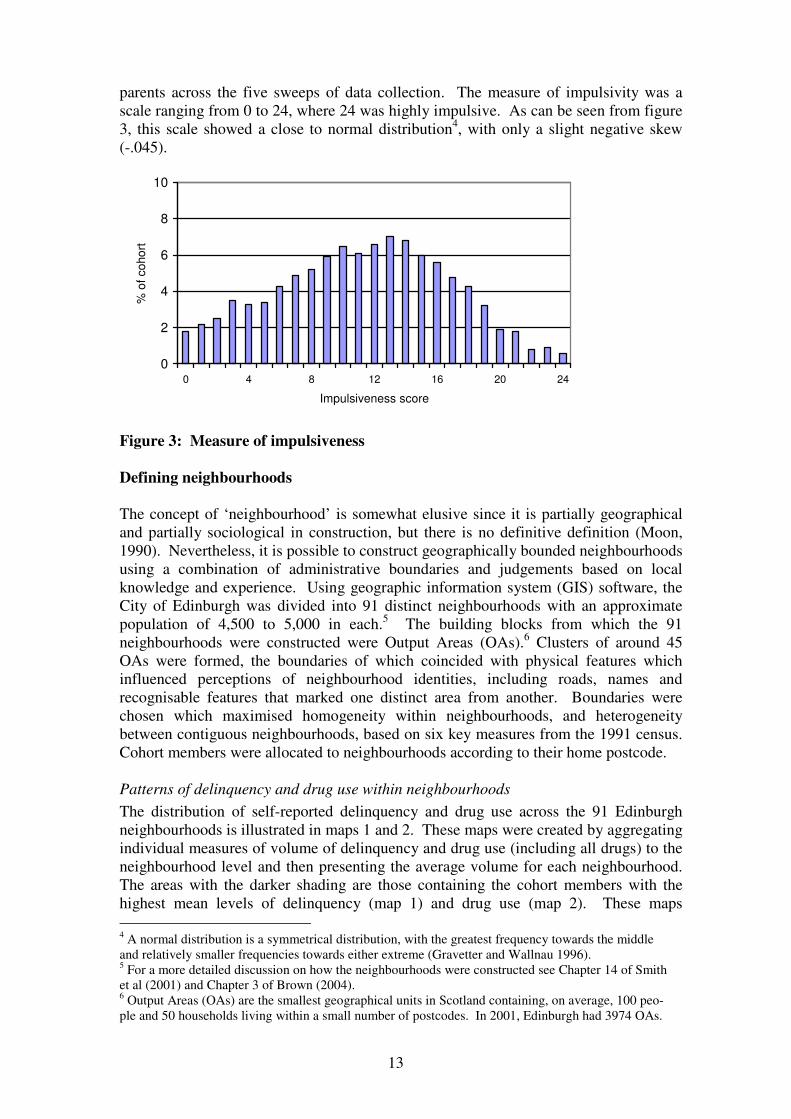
parents across the five sweeps of data collection. The measure of impulsivity was a
scale ranging from 0 to 24, where 24 was highly impulsive. As can be seen from figure
3, this scale showed a close to normal distribution4, with only a slight negative skew
(-.045).
0
2
4
6
8
10
0 4 8 12 16 20 24
Impulsiveness score
% o
f co
ho
rt
Figure 3: Measure of impulsiveness
Defining neighbourhoods
The concept of ‘neighbourhood’ is somewhat elusive since it is partially geographical
and partially sociological in construction, but there is no definitive definition (Moon,
1990). Nevertheless, it is possible to construct geographically bounded neighbourhoods
using a combination of administrative boundaries and judgements based on local
knowledge and experience. Using geographic information system (GIS) software, the
City of Edinburgh was divided into 91 distinct neighbourhoods with an approximate
population of 4,500 to 5,000 in each.5 The building blocks from which the 91
neighbourhoods were constructed were Output Areas (OAs).6 Clusters of around 45
OAs were formed, the boundaries of which coincided with physical features which
influenced perceptions of neighbourhood identities, including roads, names and
recognisable features that marked one distinct area from another. Boundaries were
chosen which maximised homogeneity within neighbourhoods, and heterogeneity
between contiguous neighbourhoods, based on six key measures from the 1991 census.
Cohort members were allocated to neighbourhoods according to their home postcode.
Patterns of delinquency and drug use within neighbourhoods
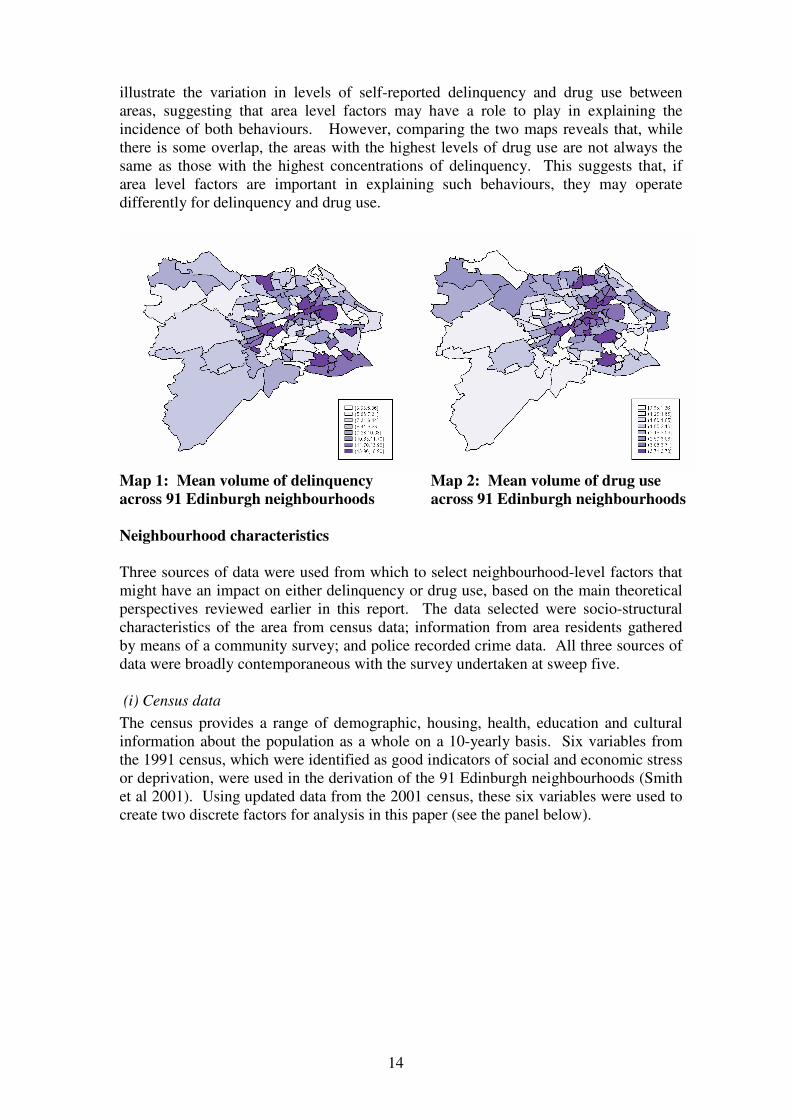
The distribution of self-reported delinquency and drug use across the 91 Edinburgh
neighbourhoods is illustrated in maps 1 and 2. These maps were created by aggregating
individual measures of volume of delinquency and drug use (including all drugs) to the
neighbourhood level and then presenting the average volume for each neighbourhood.
The areas with the darker shading are those containing the cohort members with the
highest mean levels of delinquency (map 1) and drug use (map 2). These maps
4 A normal distribution is a symmetrical distribution, with the greatest frequency towards the middle
and relatively smaller frequencies towards either extreme (Gravetter and Wallnau 1996). 5 For a more detailed discussion on how the neighbourhoods were constructed see Chapter 14 of Smith
et al (2001) and Chapter 3 of Brown (2004). 6 Output Areas (OAs) are the smallest geographical units in Scotland containing, on average, 100 peo-
ple and 50 households living within a small number of postcodes. In 2001, Edinburgh had 3974 OAs.
14
illustrate the variation in levels of self-reported delinquency and drug use between
areas, suggesting that area level factors may have a role to play in explaining the
incidence of both behaviours. However, comparing the two maps reveals that, while
there is some overlap, the areas with the highest levels of drug use are not always the
same as those with the highest concentrations of delinquency. This suggests that, if
area level factors are important in explaining such behaviours, they may operate
differently for delinquency and drug use.
Map 1: Mean volume of delinquency Map 2: Mean volume of drug use
across 91 Edinburgh neighbourhoods across 91 Edinburgh neighbourhoods
Neighbourhood characteristics
Three sources of data were used from which to select neighbourhood-level factors that
might have an impact on either delinquency or drug use, based on the main theoretical
perspectives reviewed earlier in this report. The data selected were socio-structural
characteristics of the area from census data; information from area residents gathered
by means of a community survey; and police recorded crime data. All three sources of
data were broadly contemporaneous with the survey undertaken at sweep five.
(i) Census data
The census provides a range of demographic, housing, health, education and cultural
information about the population as a whole on a 10-yearly basis. Six variables from
the 1991 census, which were identified as good indicators of social and economic stress
or deprivation, were used in the derivation of the 91 Edinburgh neighbourhoods (Smith
et al 2001). Using updated data from the 2001 census, these six variables were used to
create two discrete factors for analysis in this paper (see the panel below).
15
Measure of neighbourhood instability:
• % of the population who had lived in the area for less than 12 months (migration)
• % of the population aged between 10 and 24 (youth)
Measure of economic deprivation:
• % of households consisting of lone parents with dependent children (single parents)
• % of households with more than one person per room (overcrowding)
• % of households in local authority housing (LA renting)
• % of the population who are out of work (unemployment)
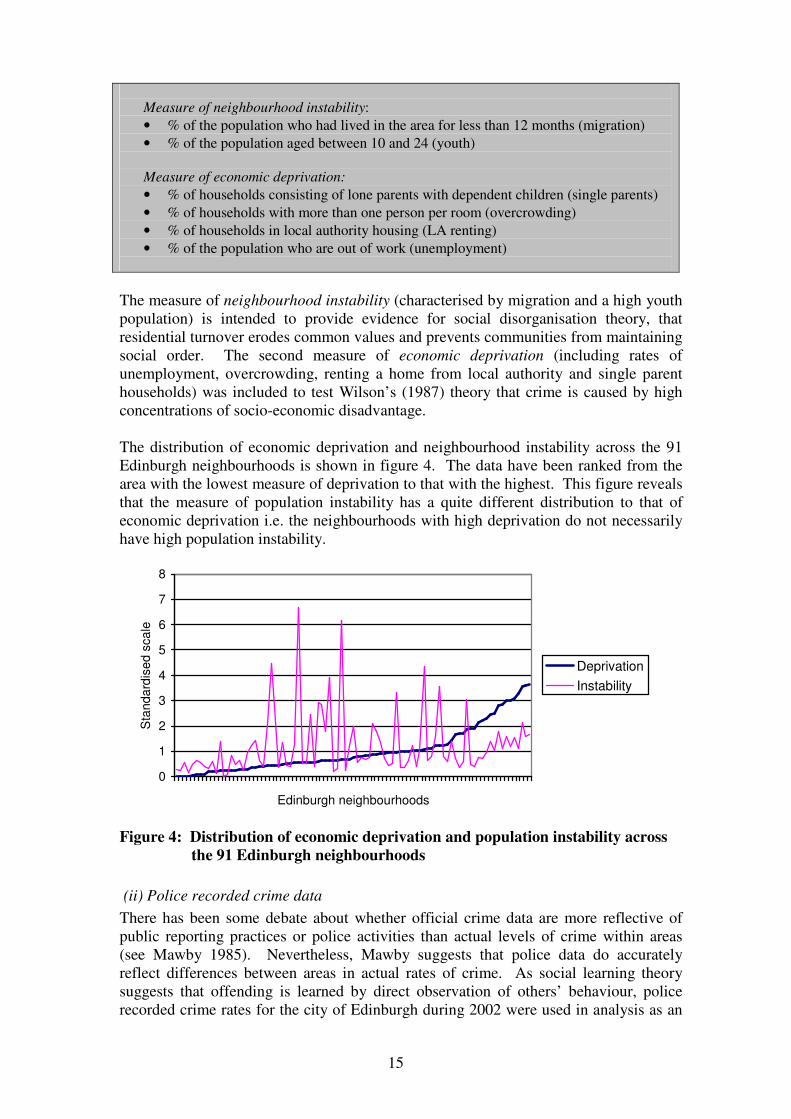
The measure of neighbourhood instability (characterised by migration and a high youth
population) is intended to provide evidence for social disorganisation theory, that
residential turnover erodes common values and prevents communities from maintaining
social order. The second measure of economic deprivation (including rates of
unemployment, overcrowding, renting a home from local authority and single parent
households) was included to test Wilson’s (1987) theory that crime is caused by high
concentrations of socio-economic disadvantage.
The distribution of economic deprivation and neighbourhood instability across the 91
Edinburgh neighbourhoods is shown in figure 4. The data have been ranked from the
area with the lowest measure of deprivation to that with the highest. This figure reveals
that the measure of population instability has a quite different distribution to that of
economic deprivation i.e. the neighbourhoods with high deprivation do not necessarily
have high population instability.
0
1
2
3
4
5
6
7
8
Edinburgh neighbourhoods
Sta
nd
ard
ise
d s
ca
le
Deprivation
Instability
Figure 4: Distribution of economic deprivation and population instability across
the 91 Edinburgh neighbourhoods
(ii) Police recorded crime data
There has been some debate about whether official crime data are more reflective of
public reporting practices or police activities than actual levels of crime within areas
(see Mawby 1985). Nevertheless, Mawby suggests that police data do accurately
reflect differences between areas in actual rates of crime. As social learning theory
suggests that offending is learned by direct observation of others’ behaviour, police
recorded crime rates for the city of Edinburgh during 2002 were used in analysis as an
16
independent measure of the amount of crime occurring in young people’s
neighbourhoods to which they would be exposed. Analysis was restricted to visible
‘street crimes’ which could have a potentially greater impact on individual behaviour
according to social learning theory. The crimes included in this measure are listed in
Appendix 1.
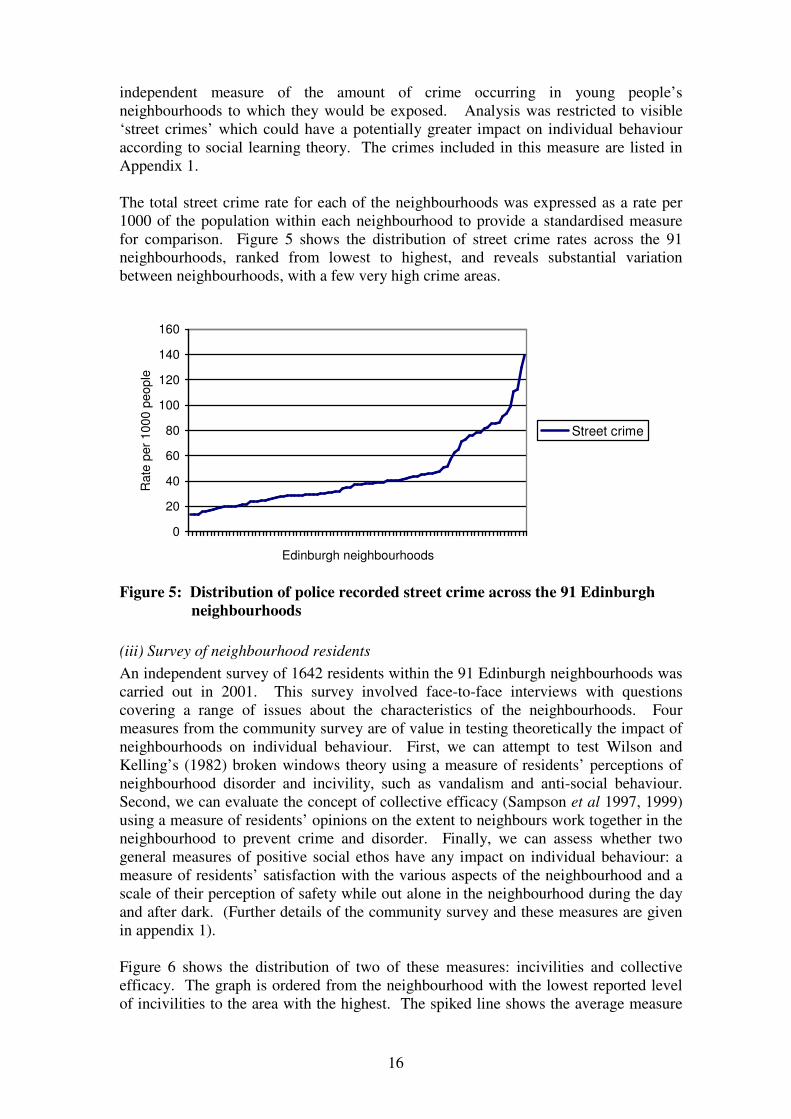
The total street crime rate for each of the neighbourhoods was expressed as a rate per
1000 of the population within each neighbourhood to provide a standardised measure
for comparison. Figure 5 shows the distribution of street crime rates across the 91
neighbourhoods, ranked from lowest to highest, and reveals substantial variation
between neighbourhoods, with a few very high crime areas.
0
20
40
60
80
100
120
140
160
Edinburgh neighbourhoods
Ra
te p
er
10
00
pe
op
le
Street crime
Figure 5: Distribution of police recorded street crime across the 91 Edinburgh
neighbourhoods
(iii) Survey of neighbourhood residents
An independent survey of 1642 residents within the 91 Edinburgh neighbourhoods was
carried out in 2001. This survey involved face-to-face interviews with questions
covering a range of issues about the characteristics of the neighbourhoods. Four
measures from the community survey are of value in testing theoretically the impact of
neighbourhoods on individual behaviour. First, we can attempt to test Wilson and
Kelling’s (1982) broken windows theory using a measure of residents’ perceptions of
neighbourhood disorder and incivility, such as vandalism and anti-social behaviour.
Second, we can evaluate the concept of collective efficacy (Sampson et al 1997, 1999)
using a measure of residents’ opinions on the extent to neighbours work together in the
neighbourhood to prevent crime and disorder. Finally, we can assess whether two
general measures of positive social ethos have any impact on individual behaviour: a
measure of residents’ satisfaction with the various aspects of the neighbourhood and a
scale of their perception of safety while out alone in the neighbourhood during the day
and after dark. (Further details of the community survey and these measures are given
in appendix 1).
Figure 6 shows the distribution of two of these measures: incivilities and collective
efficacy. The graph is ordered from the neighbourhood with the lowest reported level
of incivilities to the area with the highest. The spiked line shows the average measure
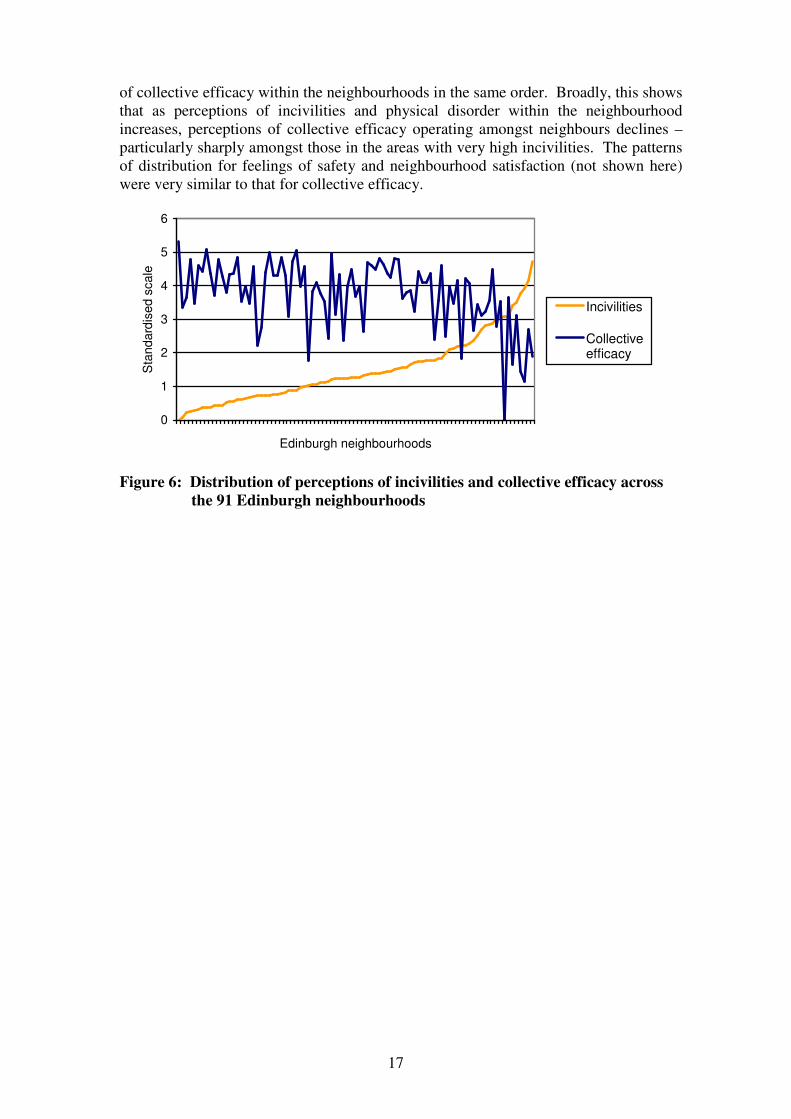
17
of collective efficacy within the neighbourhoods in the same order. Broadly, this shows
that as perceptions of incivilities and physical disorder within the neighbourhood
increases, perceptions of collective efficacy operating amongst neighbours declines –
particularly sharply amongst those in the areas with very high incivilities. The patterns
of distribution for feelings of safety and neighbourhood satisfaction (not shown here)
were very similar to that for collective efficacy.
0
1
2
3
4
5
6
Edinburgh neighbourhoods
Sta
nd
ard
ise
d s
ca
le
Incivilities
Collectiveefficacy
Figure 6: Distribution of perceptions of incivilities and collective efficacy across
the 91 Edinburgh neighbourhoods
18
PART 2: TESTING RELATIONSHIPS BETWEEN VARIABLES
The first phase of analysis was to test the strength of relationships between the three
behaviours of interest - delinquency, cannabis use and hard drug use - and each of the
individual and neighbourhood level explanatory variables (described in part one). This
was done using correlation coefficients, which show the extent to which a change in
one variable results in a change in another. A correlation score of 1 (or -1) reveals a
perfect positive (or negative) association between the variance of the two variables,
while a score of 0 indicates that they are completely independent. It is important to
note that correlations reveal simple relationships between two variables, but they do not
take account of the impact that other variables may have on this relationship.
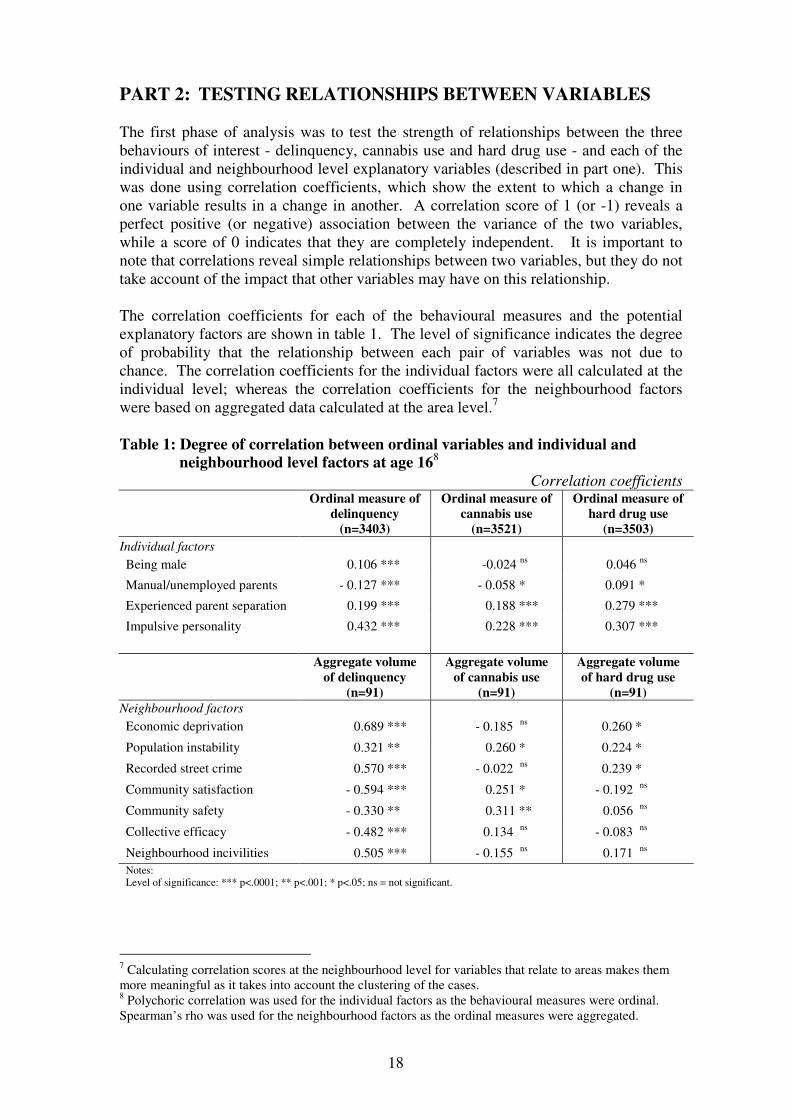
The correlation coefficients for each of the behavioural measures and the potential
explanatory factors are shown in table 1. The level of significance indicates the degree
of probability that the relationship between each pair of variables was not due to
chance. The correlation coefficients for the individual factors were all calculated at the
individual level; whereas the correlation coefficients for the neighbourhood factors
were based on aggregated data calculated at the area level.7
Table 1: Degree of correlation between ordinal variables and individual and
neighbourhood level factors at age 168
Correlation coefficients
Ordinal measure of
delinquency
(n=3403)
Ordinal measure of
cannabis use
(n=3521)
Ordinal measure of
hard drug use
(n=3503)
Individual factors
Being male 0.106 ***n -0.024 ns n
0.046 ns n
Manual/unemployed parents - 0.127 ***n - 0.058 *nn 0.091 *nn
Experienced parent separation 0.199 ***n 0.188 *** 0.279 ***
Impulsive personality 0.432 ***n 0.228 *** 0.307 ***
Aggregate volume
of delinquency
(n=91)
Aggregate volume
of cannabis use
(n=91)
Aggregate volume
of hard drug use
(n=91)
Neighbourhood factors
Economic deprivation 0.689 *** - 0.185 ns n
0.260 *n.n
Population instability 0.321 **n 0.260 *nn 0.224 *nn.
Recorded street crime 0.570 *** - 0.022 ns n
0.239 *n.n
Community satisfaction - 0.594 *** 0.251 *nn - 0.192 ns n
Community safety - 0.330 **n 0.311 **n 0.056 ns n
Collective efficacy - 0.482 *** 0.134 ns n
- 0.083 ns n
Neighbourhood incivilities 0.505 *** - 0.155 ns n
0.171 ns n
Notes:
Level of significance: *** p<.0001; ** p<.001; * p<.05; ns = not significant.
7 Calculating correlation scores at the neighbourhood level for variables that relate to areas makes them
more meaningful as it takes into account the clustering of the cases. 8 Polychoric correlation was used for the individual factors as the behavioural measures were ordinal.
Spearman’s rho was used for the neighbourhood factors as the ordinal measures were aggregated.
19
Delinquency proved to be correlated with all of the explanatory variables at the 99 per
cent confidence level or above, whereas cannabis and hard drug use were more weakly
or non-significantly correlated with the majority of variables (which may, in part, be
due to the much larger number of cases scoring zero on the drug measures). In terms of
the individual factors, both impulsivity and experience of parental separation proved to
be very strongly correlated to all three forms of problematic behaviour. Delinquency
was positively correlated with being male; however, there was no significant
relationship between gender and drug use. Being less affluent (based on parental
employment) was strongly associated with higher levels of delinquency and weakly
associated with frequent hard drug use, whereas frequent cannabis use was weakly
correlated with greater affluence at the family level.
Table 1 reveals some interesting differences between the delinquency and drug use
measures in terms of their association with the neighbourhood variables. A higher level
of delinquency within areas was strongly correlated with all seven of the
neighbourhood factors, particularly greater economic deprivation, higher rates of police
recorded street crime, lack of community satisfaction and greater neighbourhood
disorder. The drug use variables, on the other hand, showed less association with the
neighbourhood variables. The correlations for hard drug use showed some similarity to
those for delinquency, in that more frequent hard drug use was positively correlated
with economic deprivation, population instability and higher street crime rates, albeit
the correlation coefficients were weaker than for delinquency. However, none of the
community survey measures were significantly correlated with hard drug use.
Cannabis use was also associated with population instability but, unlikely delinquency
and hard drug use, demonstrated no significant association with economic deprivation
or recorded street crime. Instead, cannabis use was positively associated with greater
community satisfaction and feelings of safety. Like hard drug use, however, cannabis
use showed far less association with neighbourhood characteristics than delinquency.
Two key issues arise from these correlation analyses that require further exploration.
First, it appears that being a frequent offender may be more strongly related to
environmental factors than being a frequent drug user. And second, it seems that
relationship between hard drug use and neighbourhood factors may be more similar to
that for delinquency than cannabis use. These issues are discussed further in part three.
20
PART 3: EXPLORING THE EFFECT OF NEIGHBOURHOOD
VARIABLES ON DELINQUENCY AND DRUG USE
The correlation analysis presented in part 2 shows the bivariate relationships between
delinquency, cannabis use and hard drug use and each of the individual and
neighbourhood factors at age 16. However, more complex techniques are necessary to
establish the relative importance of each factor or combination of factors. The final
stage of analysis, therefore, involves ordinal regression modelling to test whether the
neighbourhood level factors have an effect on delinquency and drug use even when
controlling for the effects of individual level influences on such behaviours. A form of
multilevel modelling is adopted to take account of the effect of clustering at the
neighbourhood level within the models (see appendix 2 for further details).
The dependent variables (or the variables to be explained) in the regression models
were the ordinal measures of delinquency, cannabis use and hard drug use, described in
part one. The modelling aimed to show which of the independent variables (or
potential explanatory factors), described in part two, were significantly likely to explain
higher levels of offending or drug use amongst cohort members. A series of separate
models were tested which included the four individual level factors and each
neighbourhood factor in turn, before the final models were constructed containing only
those factors that were significant in explaining more frequent delinquency and drug
use, while controlling for each of the other factors in the model (the method is fully
explained in appendix 2). Table 2 presents the results of the three final regression
models, and shows which independent variables proved to be significant explanatory
factors for delinquency, cannabis use and hard drug use along with their standardised
correlation coefficients.
In terms of both the number of variables that proved to be significant within the models
and the size of the coefficients, it is clear that the individual level factors proved to be
more important in terms of explaining greater involvement in delinquency, cannabis
and hard drug use than the area level factors. Furthermore, it is likely that the
neighbourhood effect would be weakened further if other explanatory variables were
included in the model. This fits with other research that has indicated that the level of
variance in offending explained by neighbourhood factors is relatively low in
comparison to other explanatory variables (Oberwittler 2004).
21
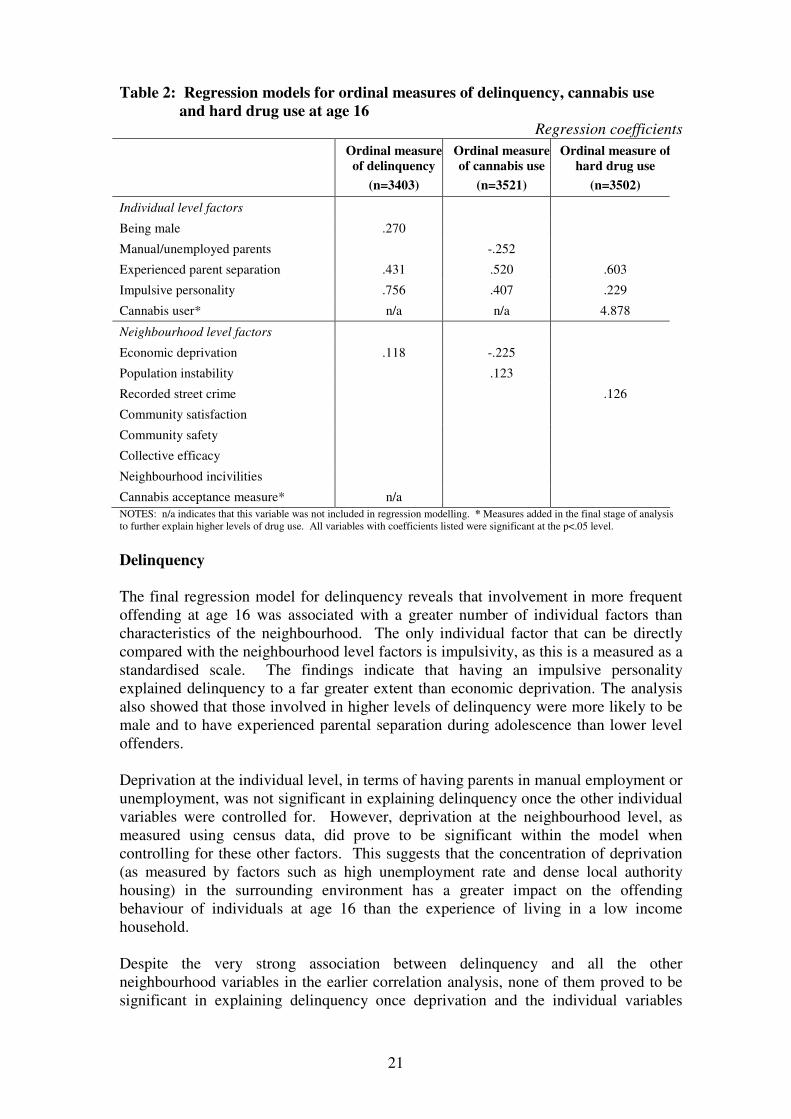
Table 2: Regression models for ordinal measures of delinquency, cannabis use
and hard drug use at age 16
Regression coefficients
Ordinal measure
of delinquency
(n=3403)
Ordinal measure
of cannabis use
(n=3521)
Ordinal measure of
hard drug use
(n=3502)
Individual level factors
Being male .270
Manual/unemployed parents -.252
Experienced parent separation .431 .520 .603
Impulsive personality .756 .407 .229
Cannabis user* n/a n/a 4.878
Neighbourhood level factors
Economic deprivation .118 -.225
Population instability .123
Recorded street crime .126
Community satisfaction
Community safety
Collective efficacy
Neighbourhood incivilities
Cannabis acceptance measure* n/a
NOTES: n/a indicates that this variable was not included in regression modelling. * Measures added in the final stage of analysis
to further explain higher levels of drug use. All variables with coefficients listed were significant at the p<.05 level.
Delinquency
The final regression model for delinquency reveals that involvement in more frequent
offending at age 16 was associated with a greater number of individual factors than
characteristics of the neighbourhood. The only individual factor that can be directly
compared with the neighbourhood level factors is impulsivity, as this is a measured as a
standardised scale. The findings indicate that having an impulsive personality
explained delinquency to a far greater extent than economic deprivation. The analysis
also showed that those involved in higher levels of delinquency were more likely to be
male and to have experienced parental separation during adolescence than lower level
offenders.
Deprivation at the individual level, in terms of having parents in manual employment or
unemployment, was not significant in explaining delinquency once the other individual
variables were controlled for. However, deprivation at the neighbourhood level, as
measured using census data, did prove to be significant within the model when
controlling for these other factors. This suggests that the concentration of deprivation
(as measured by factors such as high unemployment rate and dense local authority
housing) in the surrounding environment has a greater impact on the offending
behaviour of individuals at age 16 than the experience of living in a low income
household.
Despite the very strong association between delinquency and all the other
neighbourhood variables in the earlier correlation analysis, none of them proved to be
significant in explaining delinquency once deprivation and the individual variables
22
were controlled for.9 There was no evidence that more frequent involvement in
offending generally was explained by living in a neighbourhood characterised by an
unstable population, a higher rate of police recorded street crime, signs of physical
disorder, poor social controls or a negative social ethos,. These findings lend little
support to theories that offending can be simply explained by social disorganisation or
poor social capital, by weak collective efficacy and poor social cohesion, by the
detrimental influence of incivility and urban decay, or by learned behaviour caused by
exposure to high crime rates.
Cannabis use
Frequency of cannabis use at age 16 was associated with two neighbourhood level
factors, compared with only one for the delinquency and hard drug use models,
although most of the neighbourhood factors did not prove to be significant within the
final model. Like the delinquency model, the measure of impulsivity proved to be a
stronger explanatory factor than either of these two neighbourhood variables. The
experience of parental separation also explained more frequent cannabis use. Unlike
the delinquency model, gender was not significant in explaining greater cannabis use,
but family socio-economic status was significant, with more frequent cannabis users
being more likely to live in affluent households.
The two area level factors that emerged as significant in explaining increased cannabis
use were the census measures of economic deprivation and neighbourhood instability.
However, in contrast to the delinquency model, it emerged that cannabis use was
greater amongst those who were living in areas of lower deprivation. This is consistent
with the finding that frequent cannabis users were likely to come from more prosperous
family backgrounds, and suggests that there is an effect of affluence at both the
individual and the neighbourhood level in explaining higher levels of cannabis use
amongst cohort members at age 16. Living in an area of higher population instability
(i.e. with frequent population turnover and a high density of young people living in the
area) also had a significant association with more habitual cannabis use which provides
some evidence for social disorganisation theory relating to cannabis use.
Although the community survey measures of satisfaction and safety were significantly
correlated with more frequent cannabis use during earlier analysis, neither of these
proved to be significant explanatory variables when controlling for the census measures
and the individual variables. The finding that cannabis use is more frequent within
areas of greater affluence and social disorganisation, as opposed to delinquency which
was higher in areas of greater deprivation, indicates that different theoretical
approaches are necessary to explain these two behaviours.
In order to assess whether there might be additional cultural factors operating within
these neighbourhoods, a measure of cannabis acceptance was included in the regression
modelling for cannabis use. This variable was taken from the community survey and
involved respondents being asked whether they thought the use of cannabis should be
legalised. During model construction, this variable was positively associated with
9 This may be due in part to the close relationships between the neighbourhood variables themselves
and the fact that several variables might have been tapping in to similar types of problem (e.g. depriva-
tion and incivilities), which would have the effect of knocking the weaker of the two out of the model.
23
cannabis use, although it did not prove to be significant within the final model when the
census measures were controlled for.
Hard drug use
The relatively small number of cohort members who reported taking hard drugs
(n=240) may have had some bearing on the model results for this dependent variable.10
Nevertheless, the model for hard drug use showed some consistency with both the
delinquency and cannabis use models in terms of the individual factors that emerged as
significant. Like both delinquency and cannabis use, increased hard drug use at age 16
was associated with having experienced parental separation and with having a more
impulsive personality. In comparison to the other two models, however, there was a
relative increase in the influence of parental separation and a decrease in the influence
of impulsivity in explaining hard drug use. Impulsivity was still a stronger explanatory
factor than the one emerging neighbourhood factor, however. Like the cannabis model,
gender was not significant in explaining increased hard drug use. While like the
delinquency model, hard drug use was not increased by familial socio-economic status.
In contrast to both of the previous models, neither of the census measures proved to be
significant in explaining more frequent involvement in hard drug use at age 16. The
only area level variable to emerge as significant within the hard drug use model was
living in an area with a higher rate of street crime. It is not exactly clear how living in
an area with a higher rate of crime such as property damage, theft and violence might
precipitate a greater level of hard drug use, especially since this variable had no bearing
on frequency of delinquency. There was no indication that concentrated deprivation,
social disorganisation, poor collective efficacy or neighbourhood disorder had any
impact on increased levels of hard drug use within areas. In addition, when the
measure of cannabis acceptability was included in the model, it proved to have no
impact on hard drug use which discounts general drug tolerance as an explanation.
The influence of neighbourhood on hard drug use was very different to that for
cannabis use, despite the fact that the vast majority of hard drug users were also
cannabis users (see part one). When frequency of cannabis use itself was taken into
account within the model, it proved to be highly significant in explaining more frequent
hard drug use, which shows a strong link between these two behaviours. However,
even when controlling for frequent cannabis use, the street crime measure remained
within the model. It seems likely, therefore, that hard drug users are a very distinct
subpopulation – quite different from the majority of cannabis users – and that a range of
other individual factors might be more important in terms of explaining this behaviour.
It is also possible that the street crime variable is acting as a proxy for other more
pertinent neighbourhood factors that were not included in this analysis, such as hard
drug availability.
10
There are problems with conducting ordinal regression with small numbers or ‘rare events’ in some
categories as it is harder to generalise about the characteristics of a group based on small numbers.
24
CONCLUSION
The aim of this report was to examine whether neighbourhoods had an effect on
adolescent delinquency and drug use at age 16 that was over and above the effect of
individual characteristics and, if so, whether the effect was similar. Two clear findings
emerged. First, the characteristics of the neighbourhoods in which young people live
do play some part in influencing their delinquent and drug using behaviour, although
fewer of these factors were significant as compared with individual characteristics and
the explanatory power of the impulsivity measure was stronger than that of any of the
significant neighbourhood characteristics. It is likely that the inclusion of further
individual level explanatory variables would weaken the impact of neighbourhood even
further, which is broadly in line with the findings of other cross-sectional analyses (see
for example Oberwittler 2004). This finding is supported to an extent by other analysis
of Edinburgh Study data that showed weak neighbourhood effects in explaining
trajectories of property offenders, particularly for those who start offending later in
adolescence (McVie and Norris 2006).
The second main finding from this analysis is that there are distinct differences in the
characteristics of neighbourhoods that impact on delinquency, cannabis and hard drug
use, which suggests that quite different explanatory frameworks are required. The
evidence presented here suggests that delinquency thrives within areas experiencing
structural adversity and economic deprivation. This is consistent with other recent
evidence from the Edinburgh Study that shows that those living in deprived
neighbourhoods were less likely to desist from offending than those living in more
affluent neighbourhoods (Smith 2006). Such evidence highlights the contextual
importance of the places that young people grow up and is broadly supportive of
Sampson and Laub’s (1993) theory that social stress within neighbourhoods acts as an
inhibitor to the formation of strong social bonds which are necessary to enable young
people to ‘grow out’ of crime. To a certain extent, this supports theories of crime
which focus on social disorganisation and social capital; however, we found no support
for theories about crime being caused by poor collective efficacy, by visible signs of
social and physical disorder or by exposure to high levels of offending within the
residential neighbourhood. Of course, the measure of delinquency used within this
analysis is a composite one, and it is possible that neighbourhood factors influence
different types of offending in different ways (see McVie and Norris 2006 for a more
specific analysis of property offending).
In contrast, more frequent cannabis use was found to be associated with economic
prosperity – both at the individual and the neighbourhood level. The association
between drug use and economic prosperity has recently been noted elsewhere. Chivite-
Matthews et al (2005) argued that those living in ‘rising areas’ (which included
affluent, prosperous professional and better off executive areas) had the highest levels
of drug use (of which the most common type was cannabis use). This strongly suggests
that there are cultural factors at work in terms of explaining cannabis use, which may be
in part environmentally determined (e.g. through the availability of drugs or the
collective approval of such behaviour, although we did not find this to be the case from
our analysis) and that the developmental processes involved in cannabis use are quite
distinct from those of delinquency. In addition, increased cannabis use is associated
with areas characterised by a younger, more transient population which is somewhat
supportive of theories around social disorganisation.
25
The finding that hard drug use was more frequent within areas of high recorded street
crime is quite difficult to interpret, since it is highly unlikely that this in itself is a causal
factor. It is probable that the police crime measure was acting as a proxy for some
other pertinent neighbourhood characteristic, such as hard drug availability. However,
it must be acknowledged that the very low prevalence of hard drug use at age 16 may
have prevented a clear picture of the geographical distribution of this problem
emerging.
The fact that different explanatory frameworks are required suggests that different
policy responses are also needed to address these problems. The differences in the
neighbourhood characteristics for each of the three behaviours examined imply that
community-based strategies which take a uniform approach to tackling crime and drug
use are unlikely to be entirely successful and that more specifically targeted approaches
are necessary. The findings are supportive of crime control policies aimed at tackling
underlying aspects of structural deprivation (such as unemployment and density of local
authority housing). However, such initiatives are unlikely to have much impact on
reducing cannabis use, which is associated with greater affluence and prosperity.
Emphasis might need to be placed on targeting health education, particularly within
communities that have a high population of young people and transitional populations.
Although it appears that strategies for reducing hard drug use may be best targeted
within high crime areas, much more needs to be understood about hard drug use within
a population as young as 16 before policy implications can be considered.
While the primary focus of this report has been on neighbourhood characteristics, the
individual level factors did prove to be strong explanatory factors for all three
behavioural problems and revealed both similarities and differences. The differential
impact of gender on delinquency and drug use indicates that different educational
responses may be required. However, higher levels of delinquency, cannabis and hard
drug use were all partially accounted for by poor behavioural self-control and by early
parental separation. Analysis carried out elsewhere (Smith 2004; McVie and Holmes
2005) has shown that parenting style is also important in influencing both delinquency
and drug use, so this may be being partly reflected in the parental separation variable.
Although these appear to be risk factors that underlie problematic behaviour generally,
there is evidence that they may impact differentially on delinquency and drug use, with
impulsivity being more important in explaining delinquency and family disruption
being more pertinent to the development of drug problems. These findings support the
need for initiatives to provide parents with the skills to deal effectively with difficult
children and to advise and support families, particularly in the context of relationship
breakdown.
26
APPENDIX 1: VARIABLES USED IN ANALYSIS
Items of delinquency
1. Travelling on a bus or train without paying enough/using someone else’s pass.
2. Writing or spraying paint on property that did not belong to you.
3. Stealing something from a shop or store.
4. Selling an illegal drug to someone.
5. Riding in a stolen car or van or on a stolen motorbike.
6. Breaking into a car or van to try and steal something out of it.
7. Breaking into a house or building to try and steal something.
8. Hitting/kicking/punching/attacking someone with the intention of really hurting
them.
9. Damaging or destroying property that did not belong to you on purpose.
10. Selling something that didn’t belong to you or that you knew was stolen.
11. Stealing money/property that someone was holding/carrying/wearing at the time.
12. Hitting or picking on someone because of their race or skin colour.
13. Hurting or injuring any animals or birds on purpose.
14. Setting fire or trying to set fire to something on purpose.
15. Carrying a knife/other weapon for protection/in case it was needed in a fight.
16. Being loud/rowdy/unruly in a public place so people complained/you got into
trouble.
17. Skipping or skiving (truanting) from school.
Ordinal measure of delinquency
For each of the 17 items shown above, respondents were asked to say whether they had
engaged in this act once, twice, three times, four times, five times, between six and ten
times or more than ten times. A minimum estimate of the number of occasions that the
respondent had engaged in a delinquent act was created by summing the number of
times reported at each item (using zero for those who had not engaged in the act),
assuming a minimum of six times for the ‘between six and ten times’ category and
eleven for those in the ‘more than ten times’ category. The final scores were then
grouped into six categories in terms of whether they had committed: zero, 1-5, 6-10,
11-15, 16-20 and 21+ offences.
Ordinal measure of cannabis
Respondents were asked how often they had tried cannabis during the last year,
allowing responses of never, once, two or three times, four to ten times and more than
ten times. A minimum estimate of the number of times cannabis had been taken was
created by assuming a score of two for the ‘two or three times’ category, four for the
‘four to ten times’ category and eleven for the ‘more than ten times’ category. Those
who reported that they had not used cannabis were given a score of zero.
Ordinal measure of hard drug use
A minimum score was created for all of the class A and B drugs, as for cannabis. These
scores were then summed to provide a minimum volume measure of hard drug use.
Due to the small numbers involved, an ordinal scale the same as that for cannabis was
created, with a score of one for those who had only taken a drug once, two for 2-3
27
times, four for 4-10 times and eleven for those who had taken drugs on more than 10
occasions. Again, those who did not report using any hard drugs (the majority of
respondents) were assigned a value of zero.
Socio-economic group
At sweep one, respondents’ descriptions of their parents’ occupations were coded using
the Registrar General Social Classification Scheme (RGSC). The socio-economic
group (SEG) of the parent in the highest class grouping (with full time workers taking
precedence over part time workers) was assigned to the child. Unfortunately, SEG
could be assigned to only 61.4% of the cohort. At sweep four, a survey of parents’
provided more precise and up to date information on SEG for 69.5% of the cohort.
Despite the three year gap between the two sources of data, they were strongly
correlated (0.637) showing considerable stability over time. Therefore, the sweep four
SEG was used and, where this data was missing, sweep one data was substituted. This
process produced a socio-economic group code for 88.3% of all cohort members. To
make analysis simpler, and to allow reasonable leeway for error, the respondents were
divided into two broad social class groupings according to whether their parents’
occupation was classed as ‘non-manual’ (i.e. SEG groupings I, II and IIIa) or ‘manual
or unemployed’ (i.e. SEG groupings IIIb, IV, V and unemployed).
Impulsivity
A modified version of the Eysenck Impulsivity Scale (Eysenck et al 1984) was used to
measure lack of constraint amongst the cohort members at sweeps one, three and five of
the Edinburgh Study. The original measure had 27 items but this was reduced to 6 after
careful piloting. Some changes of wording were made to make the statements more
appropriate for the age group and the response format was changed to a 5-point verbal
scale (from strongly agree to strongly disagree). The individual items used in the
questionnaire were:
• Planning takes the fun out of things
• I get into trouble because I do things without thinking
• I put down the first answer that comes into my head on a test and often forget to
check it later
• I get involved in things that I later wish I could get out of
• I sometimes break rules because I do things without thinking
• I get so excited about doing new things that I forget to think about problems that
might happen
Each item was scored from 0 to 4, with a high score corresponding to a more impulsive
personality. A high level of internal reliability was found between the individual items
at sweeps one, three and five, with Cronbach’s alpha scores of .787, .734 and .772
respectively. The composite impulsivity scale was created by adding the scores from
the six items together, producing a range from 0 to 24. Correlation scores showed that
there was a strong relationship between level of impulsivity at sweeps one and three
(.402) and between sweeps three and five (.508). The correlation score between sweeps
one and five was weaker (.324), but was still highly significant at the 99% level. This
indicates that level of impulsivity between the ages of 12 and 16 displays a high degree
of stability.
28
Family structure
At each sweep of the study, respondents were asked whether about their current family
structure and who they lived with. If they spent some time in one household and some
time in another, they were asked to distinguish these two households. Using the
responses to these questions, it was possible to distinguish those who were living with
both birth parents consistently across the five sweeps from those who had experienced
some form of parental disruption or separation. Where data were missing at any sweep,
it was assumed that their parental status had not changed in the last year.
Cohort allocation to neighbourhoods
Address information for the cohort was initially collected through school records at
sweep one and then from a survey of parents at sweep four, and thereafter updated by
respondents themselves. At sweep five (the sweep to which the analysis within this
report refers) valid postcode information was available for 4075 (94.2%) of all eligible
participants. A small proportion of these (4.1%) were not resident within the city of
Edinburgh, therefore, a total of 3898 (90.1%) were allocated to one of the 91 Edinburgh
neighbourhoods. This meant that data from the individual respondents could then be
viewed spatially across the city by aggregating responses on any variable, such as
frequency of offending or drug use, to the neighbourhood level.
Police recorded crime data
Police recorded crimes for the calendar year 2001 within the City of Edinburgh were
provided with postcodes of the locus of each incident and (in the majority of cases)
already geo-coded. Those incidents for which there was no geo-code or postcode
(4.0% of the total) were not included in the analysis. Each incident had a SOHD code,
a standard crime classification defined by the Scottish Executive. For the purposes of
analysis in this paper, it was decided only to include only a measure of visible or semi-
visible ‘street crimes’. This was created by summing the rate per 1000 of the
population for each of the crimes shown in the panel below.
Police recorded crime categories used to form ‘street crime’ measure:
1. Vandalism
2. Fire-raising.
3. Theft of and from motor vehicles (including attempts).
4. Theft by housebreaking (including attempts) and housebreaking with intent to steal
5. Non-sexual violent offences (including possession of an offensive weapon).
Survey of neighbourhood residents
In 2001, the Scottish Executive funded a survey of Edinburgh residents as part of the
doctoral work of a post-graduate student attached to the Edinburgh Study (Brown
2004). This survey involved face-to-face interviews with an achieved sample of 1642
respondents, stratified across the 91 neighbourhoods of Edinburgh. The Postal Address
File for Edinburgh provided the sampling frame. Due to financial constraints, a quota
sample rather than a random sample was used. Quotas of approximately 18
respondents per area were selected, based on age, sex and working status (calculated on
the basis of the 1991 census). The precise details of the survey can be found in Brown
(2004).
29
The questions used in the survey were almost all adapted from other, validated
questionnaires, including those from the Chicago Neighbourhood Study, the Housing
Attitude Survey, the Scottish Household Survey and the Edinburgh Study of Parents.
The information collected in the survey was used to construct five continuous measures
which were used in the analysis for this report, as shown in the panel below. Each of
the scales was aggregated to the neighbourhood level and standardised (making them
directly comparable) prior to analysis. The four constructed scales had a good level of
reliability according to Cronbach’s alpha.
Neighbourhood variables collected in the community survey:
1. Neighbourhood satisfaction scale. Four items rated from ‘agree strongly’ to ‘disagree
strongly’: “this neighbourhood has a good community spirit”; “this area has a good
reputation”; “this area is going downhill”; “if I was able to, I would like to live in another
area”. Scale ranged from 0 to 16, where 16 represented extreme satisfaction with the
area of residence. Cronbach’s alpha=.604.
2. Feelings of safety. Two items rated ‘agree strongly’ to ‘disagree strongly’: “I feel safe
when I am out alone in this neighbourhood during the day” and “I feel safe when I am out
alone in this neighbourhood after dark”. Scale ranged from 0 to 8, where 8 represented a
strong feeling of safety. Cronbach’s alpha=.651.
3. Neighbourhood incivilities. Eight items rated from ‘not at all common’ to ‘very
common’ in the neighbourhood: “noisy neighbours or loud parties”, “vandalism, graffiti
or other deliberate property damage”, “groups of youth people hanging around on the
street”, people who have been drinking or taking drugs”, “rubbish or litter lying around”,
“abandoned or burn out cars”, “used syringes lying around” and “derelict or empty
houses”. Scale ranged from 0 to 32, where 32 indicated a high level of incivilities.
Cronbach’s alpha=.839.
4. Collective efficacy. Three items rated from ‘very likely’ to ‘very unlikely’: “if a group
of local children were skipping school and hanging out on a street corner, how likely is it
that you or your neighbours would do something about it?”, “if some local children were
spraying graffiti on a local building, how likely is it that you or your neighbours would
do something about it?” and “if there was a fight in front of your house and someone was
being beaten up or threatened, how likely is it that you or your neighbours would break it
up or call the police?”. Scale ranged from 0 to 12, where 8 represented a high level of
collective efficacy amongst neighbours. Cronbach’s alpha=.713.
5. Cannabis acceptance. One question which asked how much the respondent agreed or
disagreed with the statement “the use of cannabis should be legalised”. Responses
ranged from ‘agree strongly’ (given a score of 4) to ‘disagree strongly’ (given a score of
0).
30
APPENDIX 2: DETAILS OF THE REGRESSION MODELS
The regression models presented in this paper were created using the ordinal logistic
regression routine in Stata Version 9. The models fitted by this routine are suitable for
analysing dependent variables where each respondent is coded as belonging to one of
several discrete categories which can be placed in a logical order. Ordinal logistic
regression models are based on the assertion that underlying the categorical data is an
unobserved continuous variable. An individual’s score on this continuous variable is
affected by their score on the explanatory factors being considered (similar to how
explanatory factors might influence an outcome in linear regression). At various points
along the underlying continuous variable are thresholds (which are calculated by the
program depending on the nature and spread of the ordinal dependent variable). As an
individual’s score on the underlying continuous variable increases they cross over the
various threshold points and are therefore seen as moving up from one category of the
ordinal dependent variable to another. A fuller description of these methods containing
both examples and full mathematical explanations can be found in Long and Freese
(2003:151-183).
For the regression modelling in this report, a series of models were specified for each
dependent variable starting with a null-model (Model 0) containing only the dependent
variable and the constant term but allowing for clustering at the neighbourhood level.
This provides a coefficient for the intercept which indicates the level of variance in the
dependent variable that is explained purely by area clustering. Model 1 was run
containing all four of the individual explanatory factors and backward deletion was
used to eliminate the variable with the highest p-value at each stage, until only those
variables meeting the criterion p-value of less than 0.05 remained. Model 1 formed the
basis for each of the subsequent models, which additionally tested each of the
neighbourhood variables in turn. Model 2, therefore, contained each of the significant
individual variables and the measure of police recorded street crime. Models 3 and 4
tested the three community survey variables and the two census measures, respectively,
using a sequential selection procedure, wherein each variable was entered into the
model individually and in combination with the others to establish the best model fit.
The final model (Model 5), summarised in table 2, represented the best fitting model
overall containing each of the significant variables from the previous four models.
Multilevel modelling was achieved by using the clustering function in Stata which takes
into account the fact that cohort members are not independent of each other, but are
grouped together by virtue of the fact that they live in the same neighbourhoods. The
clustering function takes account of this by adjusting the standard errors appropriately,
and reduces the likelihood of neighbourhood factors appearing to be significant within
the regression models when in fact they are not.
31
REFERENCES
Bandura, A. (1977) Social learning theory. New York: General Learning Press.
Bottoms, A.E. and Wiles, P. (2002) ‘Environmental criminology’ in Maguire, M.,
Morgan, R. and Reiner, R. (Eds) The Oxford Handbook of Criminology, 3rd
Edition.
Oxford: Oxford University Press.
Brown, A.M. (2004) The Edinburgh Neighbourhood Study: Implications for
contemporary criminological and political discourse on community and crime.
University of Edinburgh PhD Thesis.
Chivite-Matthews, N., Richardson, A., O’Shea, J., Becker, J., Owen, N., Roe, S. and
Condon, J. (2005) Drug misuse declared: findings from the 2003/04 British Crime
Survey, England and Wales. London: Home Office Statistical Bulletin 04/05.
Eysenck, S.B.J., Easting, G., and Pearson, P.R. (1984). ‘Age-norms for impulsiveness,
venturesomeness and empathy in children’, Personality and Individual Differences, vol.
5, issue 3: 315-321.
Farrington, D.P. (2002) ‘Developmental criminology and risk focused prevention’ in
Maguire, M., Morgan, R. and Reiner, R. (Eds) The Oxford Handbook of Criminology,
3rd
Edition. Oxford: Oxford University Press.
Flint, J. (2002) ‘Social housing agencies and the governance of antisocial behaviour’,
Housing Studies, vol. 17 (4): 619-637.
Forsyth, A.J.M. and Barnard, M. (1999) ‘Contrasting levels of adolescent drug use
between adjacent urban and rural communities in Scotland’, Addiction, 94 (11): 1707-
1718
Gravetter, F. J. and Wallnau, L. B. (1996) Statistics for the Behavioural Sciences.
Minneapolis: West Publishing Company.
Jang, S.J. and Johnson, B.R. (2001) ‘Neighbourhood disorder, individual religiosity and
adolescent use of illicit drugs: a test of multilevel hypothesis’, Criminology, 39 (1):
109-141
Juby, H. and Farrington, D.P. (2001) ‘Disentangling the link between disrupted families
and delinquency’, British Journal of Criminology, 41: 22-40.
Long, J. S. and Freese, J. (2003) Regression analysis for categorical dependent
variables using Stata. Texas: Stata Press.
Mawby, R. I. (1985) ‘Policing and the criminal area’ in Davies, K.D. and Herbert, D.T.
(Eds) The Geography of Crime. London: Belhaven Press.
McVie, S. and Holmes, L. (2005) Family functioning and substance use at ages 12 to
17, Edinburgh Study of Youth Transitions and Crime, Research Digest No. 9.
32
McVie, S. and Bradshaw, P. (2005) Adolescent smoking, drinking and drug use,
Edinburgh Study of Youth Transitions and Crime, Research Digest No. 7.
McVie, S. and Norris, P. (2006) The effect of neighbourhoods on adolescent property
offending. Edinburgh Study of Youth Transitions and Crime, Research Digest No. 11.
Moon, G. (1990). ‘Conceptions of space and community in British health policy’,
Social Science and Medicine, vol. 30, no. 1: 165-171
Oberwittler, D. (2004) ‘A multilevel analysis of neighbourhood contextual effects on
serious juvenile offending: The role of subcultural values and social disorganization’,
European Journal of Criminology, vol. 1, no. 2: 201-235
Sampson, R.J. (2004) ‘Networks and neighbourhoods: the implications of connectivity
for thinking about crime in the modern city’ in McCarthy, H., Miller, P. and Skidmore,
P. (Eds) Who governs in an interconnected world? Demos: Network Logic
Sampson, R. and Laub, J. (1993). Crime in the making: Pathways and turning points
through life. Cambridge, Mass.: Harvard University Press.
Sampson, R.J., Morenoff, J.D. and Earls, F. (1999) ‘Beyond social capital: spatial
dynamics of collective efficacy for children’, American Sociological Review, vol. 64,
no. 5: 633-660
Sampson, R.J. and Raudenbush, S.W. (2001) Disorder in urban neighbourhoods: does
it lead to crime? National Institute of Justice Research in Brief. Washington, DC: U.S.
Department of Justice. www.ojp.usdog.gov/nij
Sampson, R.J., Raudenbush, S. W. and Earls, F.J. (1997) ‘Neighbourhoods and violent
crime: A multilevel study of collective efficacy’, Science, 277: 918-924.
Scottish Executive (2003) Community safety partnership award programme:
Application guidance for community safety partnerships 2004-2005. Edinburgh:
Scottish Executive. www.scotland.gov.uk
Shaw, C. and McKay, H. (1942) Juvenile Delinquency and Urban Areas. Chicago:
University of Chicago Press.
Smith, D.J. (2004) Parenting and delinquency. Edinburgh Study of Youth Transitions
and Crime Digest Report No. 3.
Smith, D.J. (2006) Social inclusion and early desistance from crime. Edinburgh Study
of Youth Transitions and Crime Digest Report No. 12
Smith, D.J. and McAra, L. (2004) Gender and youth offending. Edinburgh Study of
Youth Transitions and Crime Digest Report No. 2.
Smith, D. J. and McVie, S. (2003) ‘Theory and methods in the Edinburgh Study of
Youth Transitions and Crime’ British Journal of Criminology, vol. 43, no. 1: 169-195
33
Smith, D., McVie, S., Woodward, R., Shute,J., Flint, J., McAra, L. (2001) The
Edinburgh Study of Youth Transitions and Crime: Key Findings at Ages 12 and 13
www.law.ed.ac.uk/cls/esytc/findingsreport.htm.
Wikstrom P.-O.H. and Loeber, R. (2000) ‘Do disadvantaged neighbourhoods cause
well-adjusted children to become adolescent delinquents?: A study of male serious
juvenile offending, individual risk and protective factors and neighbourhood context’,
Criminology, 38: 1109-1142.
Wilson, J.Q. and Kelling, G. (1982). Broken windows. The Atlantic Monthly, vol. 269,
no. 3: 29-38
Wilson, W.J. (1987) The truly disadvantaged: the inner city, the underclass and public
policy. Chicago: University of Chicago Press.
34
This report is part of a series of research digests presenting key findings from the Edinburgh Study of Youth Transitions and Crime. This is a longitudinal study exploring pathways in and out of offending for a cohort of over 4000 young people, since 1998. The research has been funded by: The Scottish Executive The Nuffield Foundation The Economic and Social Research Council R000237157
R000239150 To order further copies of this report, priced £10, please contact the Edin-burgh Study of Youth Transitions and Crime 2.12, 31 Buccleuch Place Edin-burgh EH8 9JS, or by emailing [email protected] A PDF version of this report is also available to download, free of charge, from our website at www.law.ed.ac.uk/cls/esytc
ISBN 0-905893-10-7
Price £10.00
Recommended


![[Nego] Digests](https://img.pdfslide.us/doc/110x75/5456d645b1af9fda448b47d1/nego-digests-55844f0cb5a76.jpg)