Economic Impact of Fruit Flies in Mango Production in Senegal: Ex-Post
Analysis of mango losses in Ziguinchor (Casamance)
Pierre Maurice Diatta
Thesis submitted to the faculty of the Virginia Polytechnic Institute and State University in
partial fulfillment of the requirements for the degree of
Master of Science
In
Agriculture and Applied Economics
Bradford Mills
George Norton
Everett Peterson
July 13, 2016
Blacksburg, VA
Keywords: Mango production, Fruit fly infestation, Mean yield decrease loss, Producer risk loss
General Abstract Mango production is an important activity in Senegal such as in the south part of the country, in
Ziguinchor (Casamance). And this activity hurled Senegal to the second largest exporter among
West African countries in European market place. However, mango production is threatening by
fruit fly pests and are responsible for a considerable loss in production. The aim of this paper is
to evaluate the losses faced by mango producers in the south of Senegal by calculating the
average losses and losses from a variation of the mango production for three years. Furthermore,
characterize the different variable that are principally responsible for producer losses. A survey
has been run in Ziguinchor. The results that farmer losses can reach up to 17.09% of annual total
income per year. The different variables that impact the most losses are the number of plants, the
production and the Keitt variety mango.
Keywords: Mango production, Fruit fly infestation, Mean yield decrease loss, Producer risk loss
Academic Abstract The mango tree is one the important sources of income in the rural economy of Senegal.
However, mango producers in Ziguinchor are facing fruit fly infestations leading to important
losses in income. The aim of this study is to measure the impact of the losses encountered by
mango farmers in Ziguinchor over three years 2012, 2013, and 2014 and conduct an econometric
study to examine household characteristics associated with high level of losses. At the household
level, the total yearly losses on average from fruit fly infestations represent 17.09 % of the
average total household income in Ziguinchor (Casamance). The losses associated with
variability of production are much smaller than losses from decreases of average yield.
Furthermore, the results show that the number of hectares, level production, and use of Keitt
varieties are three factors statistically significant, with a significant positive influence on losses
from infestation. The use of fruit fly control technologies does not appear to significantly reduce
losses.
Keywords: Mango production, Fruit fly infestation, Mean yield decrease loss, Producer risk loss
i
Table of Contents
General Abstract ..............................................................................................................................
Academic Abstract............................................................................................................................
CHAPTER I INTRODUCTION .................................................................................................... 1
1.1 GENERAL BACKGROUND ............................................................................................... 1
1.2 JUSTIFICATION OF THE STUDY..................................................................................... 3
1.3 Research Objectives .............................................................................................................. 3
1.3.1. Overall Objective ........................................................................................................... 3
1.3.2 Specific Objectives ......................................................................................................... 3
1.4 HYPOTHESES ..................................................................................................................... 4
CHAPTER II LITERATURE REVIEW ....................................................................................... 5
2.1 INTRODUCTION ................................................................................................................. 5
2.2 Fruit Flies and Their Damage................................................................................................ 5
2.3 FRUIT FLY CONTROLS ..................................................................................................... 7
2.3.1 Utilization of Pesticide ................................................................................................... 7
2.3.2 Integrated Pest Management (IPM) ................................................................................ 8
2.3.2.1 Male Annihilation Technique (MAT) ......................................................................... 8
2.3.2.2 Bait Application Technique (BAT) ............................................................................. 8
2.3.2.3 Orchard Sanitation ....................................................................................................... 8
2.3.3EFFECTIVENESS OF IPM ................................................................................................ 9
2.4 Economic Losses from Infestation ........................................................................................ 9
2.5 Economic Impact................................................................................................................. 10
2.5.1 Techniques Used to Measure Economic Impacts ......................................................... 12
2.5.2. Evaluations .................................................................................................................. 13
2.5.3 Economic Surplus Methods .......................................................................................... 13
2.5.4 Price Spillovers ............................................................................................................. 14
2.5.5 Losses due to Risk ........................................................................................................ 15
2.6 SUMMARY ........................................................................................................................ 16
CHAPTER III METHODOLOGY ........................................................................................... 18
ii
3.1 ECONOMIC SURPLUS ..................................................................................................... 18
3.2 SUPPLY ELASTICITY ...................................................................................................... 20
3.3 LOSSES FROM MEAN YIELD DECREASES ................................................................ 21
3.4 YIELD VARIANCE INCREASE ....................................................................................... 21
3.5 TOTAL INCOME ............................................................................................................... 23
3.6 MANGO SHARE OF INCOME ......................................................................................... 23
3.7 COEFFICIENT OF VARIATION ...................................................................................... 24
3.8 RISK AVERSION COEFFICIENT .................................................................................... 25
3.9 ECONOMETRIC MODEL ................................................................................................. 25
3.10 VARIABLES USED IN THE REGRESSION ................................................................. 27
CHAPTER VI AREA AND DATA ............................................................................................ 29
4.1 STUDY AREA .................................................................................................................... 29
4.1.1 Climate.......................................................................................................................... 29
4.1.2 Agriculture .................................................................................................................... 30
4.1.3 Production of Mango in Casamance ............................................................................. 33
4.2 DATA .................................................................................................................................. 34
4.2.1 Survey Instruments ....................................................................................................... 35
4.2.2 Selection of Villages ..................................................................................................... 36
4.2.3 Selection of Household ................................................................................................. 36
CHAPTERV RESULTS ............................................................................................................... 40
5.1 INTRODUCTION ............................................................................................................... 40
5.2 LOSS ESTIMATES ............................................................................................................ 40
5.3 ECONOMETRICS ANALYSIS OF LOSSES ................................................................... 44
5.4 DISCUSSION ..................................................................................................................... 50
CHAPTER VI CONCLUSION .................................................................................................... 54
BIBLIOGRAPHY......................................................................................................................... 57
APPENDIX .................................................................................................................................. 61

iii
TABLES
Table 1: Variable for the regression.............................................................................................. 28
Table 2: Production period of mango in Senegal.......................................................................... 32
Table 3: Summary Statistic Table ................................................................................................. 38
Table 4: Mango Harvest Time ...................................................................................................... 39
Table 5: LOSS AT THE HOUSEHOLD LEVEL ........................................................................ 41
Table 6: LOSS AT THE VILLAGE LEVEL ............................................................................... 43
Table 7: OLS REGRESSION RESULTS ..................................................................................... 46
Table 8: VARIATION OF VARIABLES IN THE PANEL DATA............................................. 48
Table 9: OUTPUT OF THE PANEL DATA ................................................................................ 49
FIGURES
Figure 1:African Invader Fly (Bactrocera Invadens) Figure 2: Mango Fruit Fly
(Ceratitis Cosyra) ............................................................................................................................ 7
Figure 3: Graphical analysis of the change in supply in Ziguinchor market ................................ 19
Figure 4: Exportation of mango in Senegal .................................................................................. 32
Figure 5: Average Temperatrure (*C) for Ziguinchor .................................................................. 33
Figure 6: Average Rainfall Ziguinchor ......................................................................................... 33
Figure 7: Villages surveyed in Ziguinchor (villages with the yellow pick represent survey
village) .......................................................................................................................................... 35
1
CHAPTER I INTRODUCTION
1.1 GENERAL BACKGROUND Agriculture in Senegal occupies an important position in the development of the country.
In fact, it is practiced by the majority (72%) of the population (World Statistics 2015). The
agricultural sector in Senegal produces a widespread diversity of fruits and vegetables. These
activities are beneficial because they generate jobs for both small and large holder farmers in
Senegal and improve the diet of the population by providing needed vitamins. Among all fruits
and vegetables produced in Senegal, mangos have seen the most rapid growth. In fact, Senegal
produces around 150,000 tons of fruit per year, of which 60,000 tons are mangos—meaning 40%
of fruit and vegetable produced each year by Senegal are mangos (Diouf, 2009). Thus, mango
production makes up a large part of fruit and vegetable production in the country.
More importantly, mango is an economically important crop that is both locally
consumed and internationally exported. Indeed, global trade of mango fruit around the world has
increased considerably over the time. As of 2009, European countries alone imported 1,146,712
tons. This growing global market might be seen as an interesting economic opportunity for
countries that produce mango. According to the Global Atlas (2008), in 2008, Senegal exported
7,164 tons of mango—worth around $5.9 million. This makes Senegal the second largest mango
exporter in West Africa after the Ivory Coast (specializing in mainly Keiit and Kent varieties).
Furthermore, mango production provides certain opportunities for the local population. In a
country where the rate of unemployment is relatively high at around 10.2 % (ANDS, 2011),
mangos are estimated to provide jobs for around 23,600 people, 44.7 % of whom are women.
(USAID, 2012).

2
In the southern part of the country of Senegal, in of Casamance, commonly called
Ziguinchor, mango production has always been considered as a second source of income. In fact,
producers always kept mango and other fruits in their backyards for consumption. The
introduction of new varieties of mango, around 1860, which were more sustainable and more
valuable, made the production of mango more attractive and commercially viable for producers.
At that time, mango became an attractive fruit for opportunistic farmers, and the number of
orchards grew rapidly as well as farmer’s income from their sale.
However, the agricultural sector faces a number of difficulties including the degradation
of lands, declining yields, and poverty among farmers. Most of these difficulties stem from land
exploitation practices of small farmers. However, mango production is facing numerous
problems, primarily fruit fly infestations (Bactrocera Invadens and Ceratitis Cosyra). Mango
harvesting occurs at the time of heavy rainfall and hot temperatures, thus triggering the rapid
development of fruit flies in the area. Infestation mostly occurs between the months of April and
July, which is only made worse as fruit flies attack the late mango varieties (including Keiit and
Kent varieties) that are the most valuable mango fruits. The production of the early local
varieties occurs mostly in early May, before the rainy season. Therefore, most of the time there
are no attacks on local varieties. However, local varieties are mostly intended for domestic
consumption and are not as valuable on the international market. Thus, farmers do not have a
strong economic incentive to grow these varieties. The purpose of this paper is to evaluate the
magnitude of losses encountered by mango producers in Ziguinchor, a region in southern
Senegal. This introductory chapter justifies the study and presents its objective and hypothesis.
3
1.2 JUSTIFICATION OF THE STUDY In their study “Population dynamics and on-farm fruit fly integrated pest management in
mango orchards in the natural area of Niayes in Senegal,” Ndiaye et al. (2008) mention that it is
important to identify the different species of fruit fly infestation on mango. However, another
important aspect is to evaluate the economic losses from these infestations. These results would
be valuable for decision makers when making investments with respect to mango production in
Senegal, in particular in Ziguinchor. Further, the Senegalese government would have guidance
on the different parameters to focus on in order to boost the mango sector. Therefore, the goal of
this thesis is to measure the losses from fruit flies encountered by mango producers in southern
Senegal. In fact, this study seeks to document production losses of mango that farmers have
faced due to fruit fly infestations. Analysis of the survey data will show the variability of losses
over a three-year period (2012, 2013, and 2014) based on estimations of household and village
level losses. Itwill estimate the economic losses from production variability associated with fruit
fly infestations. This study also will provide estimates of producers’ losses from mean decreases
of the yield of mango. The results will document the significant losses due to this scourge.
1.3 Research Objectives
1.3.1. Overall Objective
The principal objective of this study is to measure the economic losses faced by southern
Senegal mango producers due to fruit fly infestation. Furthermore, household characteristics
associated with particularly severe losses are identified in the analysis
1.3.2 Specific Objectives
The specific objectives of the study are:
1. To estimate the economic losses from mean yield decreases due to fruit fly infestations in
southern Senegal,
4
2. To calculate the additional risk losses to mango producer from production variability
associated with fruit fly infestations, and
3. To examine household characteristics associated with high levels of losses.
1.4 HYPOTHESES 1. Farmers already have a general and background knowledge about fruit fly and different
manifestation symptoms—whether based on information from studies, experimentation, or folk
remedies.
2. There are no changes in the price of export oriented varieties of mangos because in Senegal’s
open mango economy, prices are set by the world market.
The rest of the paper is structured as follows Section two provides a literature review of the
major topics in the thesis. Section three describe the methods and model used to measure the
losses face by producers in Ziguinchor, as well as the key variables and data used for the
analysis. The results with respect to loss estimates are laid out in section four, followed by a
concluding chapter.
5
CHAPTER II LITERATURE REVIEW
2.1 INTRODUCTION In this section, an overview of the fruit fly invasion in Senegal will be presented followed by
a discussion the pesticide and different Integrated Pest Management (IPM) methods used to
control the invasion. Then, methods for measuring economic losses of production crop
infestations are examined, specifically economic impact analysis (EIA) economic surplus as a
method to measure impacts. Methods to account for price spillovers and risk losses due to
infestation are also discussed.
2.2 Fruit Flies and Their Damage Invasive species around the world can constitute a serious threat for the economy and the
environment, as well as to human health (Pimentel et al., 2005). One factor contributing to the
increased spread of species around the world is globalization. In other words, as worldwide trade
is growing, the travel of good and people around the world facilitates and accelerates the
introduction and the spread of new species (Josling et al., 2003).
Fruit flies such as B. invadens were first identified in India, so it is possible that India was
the first host of these species before they spread out around the world and became a pest of
significant economic concern (Mwatawala et al., 2004; Drew et al., 2005). Specific fruit fly
species have been seen in 28 African countries including the Comoros Island because tropical
conditions are favorable for the development of the species (Drew et al., 2005; Ekesi & Billah,
2006). In tropical climates, the moist, soft soils are ideal for the development of their pupae.
Fruit flies were recorded in Africa for the first time in 2003 in Kenya (Lux and al., 2003; Drew et
al., 2005) and in Tanzania (Mwatawala et al., 2004); in 2004, they were reported in Sudan
(Luckman, 2004), and Cameroon (Ndzala Abanda et al., 2008). The species Bactrocera invadens
6
and Ceratitis cosyra were found for the first time in Africa in 2005 (Drew et al., 2005). These
two invasive species are now the major fly specifies encountered in Africa.
In general, fruit flies are among the most damaging pests for horticultural and vegetable
crops worldwide and a number of species are considered high risk quarantine organisms (Clarke
et al. 2005; Follet & Neven, 2006). Fruit flies attack a wide variety of soft, fleshy fruits and
vegetables. Species attack over 30 types of fruit like guava, lemon, orange, apple, tomato, and
banana. However, the fruit fly has long been recognized as the most damaging pest to mango in
Africa (Mwatawala et al. 2004; Drew et al. 2005; Ekesi & Billah, 2006; Rwomushana et al.,
2008).
Fruit fly infestation has led to enormous losses in mango producing African countries due
to restrictions on exportation from countries where there is an invasion of fruit flies and from
quarantines in order to avoid an expansion of the fly population. Damages to commercial fruit
from these species can be enormous. Indeed, in terms of export, the detection of one larva in the
country of destination will involve the destruction of the batch, at a cost of €30,000 per container
(Niaye et al., 2008). Furthermore, all those charges are supported by the exporter. In 2003 alone,
these insects destroyed an average of 41% of the total mango yield produced in Africa,
equivalent to 1.9 million tons. In Kenya, 20-30% of the mango crop is lost on average every year
due to Ceratitis cosyra, reducing export earnings and affecting the quality and price of locally
sold fruit domestically (Lux et al., 2003a).
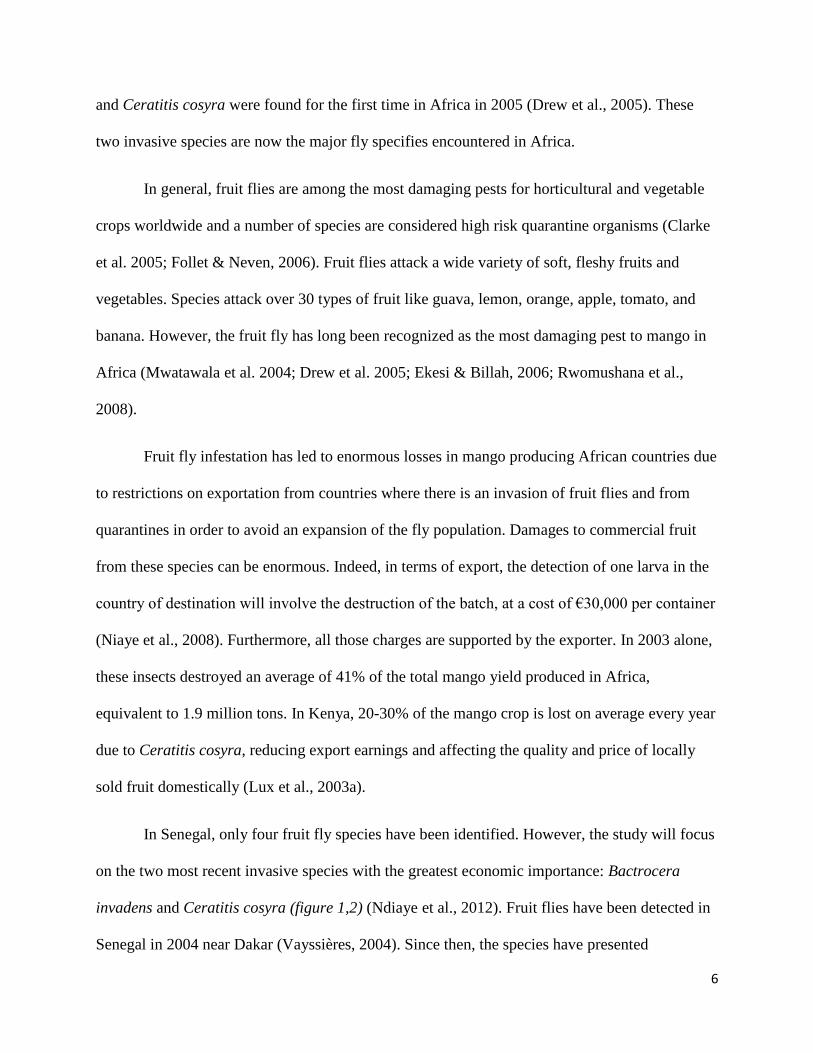
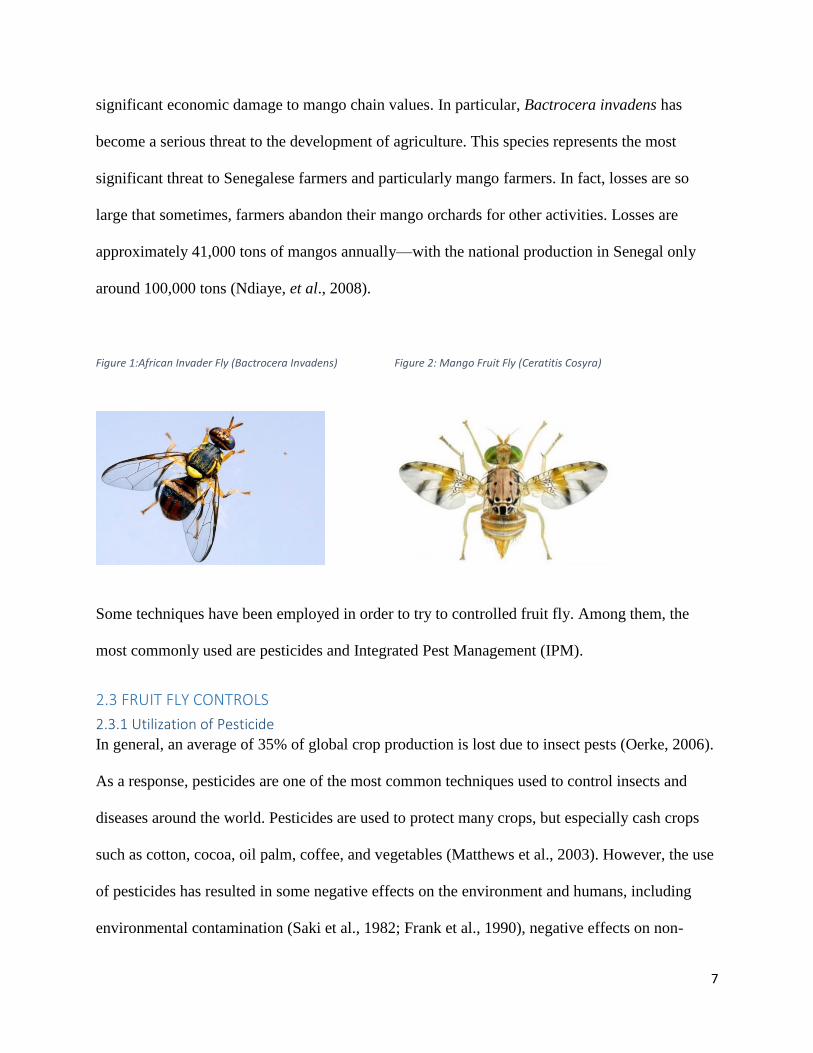
In Senegal, only four fruit fly species have been identified. However, the study will focus
on the two most recent invasive species with the greatest economic importance: Bactrocera
invadens and Ceratitis cosyra (figure 1,2) (Ndiaye et al., 2012). Fruit flies have been detected in
Senegal in 2004 near Dakar (Vayssières, 2004). Since then, the species have presented
7
significant economic damage to mango chain values. In particular, Bactrocera invadens has
become a serious threat to the development of agriculture. This species represents the most
significant threat to Senegalese farmers and particularly mango farmers. In fact, losses are so
large that sometimes, farmers abandon their mango orchards for other activities. Losses are
approximately 41,000 tons of mangos annually—with the national production in Senegal only
around 100,000 tons (Ndiaye, et al., 2008).
Figure 1:African Invader Fly (Bactrocera Invadens) Figure 2: Mango Fruit Fly (Ceratitis Cosyra)
Some techniques have been employed in order to try to controlled fruit fly. Among them, the
most commonly used are pesticides and Integrated Pest Management (IPM).
2.3 FRUIT FLY CONTROLS
2.3.1 Utilization of Pesticide
In general, an average of 35% of global crop production is lost due to insect pests (Oerke, 2006).
As a response, pesticides are one of the most common techniques used to control insects and
diseases around the world. Pesticides are used to protect many crops, but especially cash crops
such as cotton, cocoa, oil palm, coffee, and vegetables (Matthews et al., 2003). However, the use
of pesticides has resulted in some negative effects on the environment and humans, including
environmental contamination (Saki et al., 1982; Frank et al., 1990), negative effects on non-
8
target organisms, and the development of resistance (Bender, 1969; Mulla & Mian 1981; Gary &
Mussen, 1984; Brattsten et al., 1986; Tabshmik et al., 1987).
2.3.2 Integrated Pest Management (IPM)
Due to the economic importance of mango (in addition to concerns over health and
environment), new and more sustainable Integrated Pest Management (IPM) methods have been
put in place in many countries in order to control pests such us fruit flies. In Senegal, there are
different types of IPM practices that are used in order to control fruit flies. The ones that are used
frequently are: male annihilation, “succes appat”, bagging, and biological control (Badji &
Vaughan, 2012).
2.3.2.1 Male Annihilation Technique (MAT)
MAT exploits the attraction of male fruit flies to para-pheromones and eradicates males so that
flies cannot reproduce (Cunningham, 1989). MAT uses fruit fly traps that contain a male lure in
liquid form (i.e. methyl eugenol) that is combined with a toxic insecticide. The technique aims to
reduce the male fruit fly population to such a low level that no mating occurs (Allwood et al.,
2002).
2.3.2.2 Bait Application Technique (BAT)
BAT exploits a protein that female fruit flies need before they are able to lay their eggs. BAT
used that protein and mixed with insecticide. The protein attracts and kills adult fruit flies
(Roessler, 1989). The goal is to eliminate female fruit flies.
2.3.2.3 Orchard Sanitation
Field sanitation is generally the widest spread and simplest fruit fly control method practiced by
farmers in the north of Senegal. Before the propagation of fruits flies, farmers used to leave their
fallen and rotten fruits on the ground and use them as manure. However, nowadays, because
9
female fruit flies lay their eggs in the rotten fruit that contain the necessary proteins for the
development of larvae (Liquido 1991a, b), it is necessary for farmers to practice sanitation.
2.3.3EFFECTIVENESS OF IPM A lot of studies into fly control and crop protection have been conducted in order to evaluate the
effectiveness BAT, MAT and sanitation techniques. In India studies were conducted on fruit
infestations by B. zonata (peach fruit fly) and B. dorsalis. A reduction of fruit infestations of
80% was found for soil raking, for the orchard sanitation a reduction of 90% was found.
Similarly, reductions are 100% by MAT and 60% by BAT. Effectiveness is found to be 100% if
MAT is combined with other cultural controls (Patel et al., 2005). For instance, studies done in
Pakistan show MAT seem to be efficient for a reduction of the fly population in guava (Marwat
et al, 1992). Another study also showed the same MAT might be a good IPM practice to control
fruit flies in mango (Mohyuddin and Mahmood, 1993) and that BAT was effective in controlling
fruit flies on guava and other fruits (melon). Furthermore, BAT was preferable to pesticide
sprays for due to lower cost, better security, and less ecological damage (J. Stonehouse et al.,
2002).
2.4 Economic Losses from Infestation There are multiple methods for measuring losses that result from infestation. For
example, De Groote (2002) estimates the economic value losses for maize due to stemborers. In
the study, the author differentiates maize yield losses in the absence of infestation and maize
yield in the presence of infestation. This differentiation was referred to as “Potential Yield” and
“Actual Yield” (De Groote 2002). The differential value that resulted was then multiplied by the
area of the region and the market price for each major agricultural ecological zone in Kenya,
Africa. This method takes into account the proportional losses according to acreage. Overall, De
Groote (2002) found that the high-potential areas of production have lower proportionate losses
10
than low-potential areas. The high-potential zone losses represented approximately (10-12%) and
low-potential zones (15-21%) of the total losses (0.39 million tons of maize).
Other studies have been conducted in the United States to determine the economic impact
of a newly established insect pest, the Spotted Wing Drosophila (SWD) (Diptera drospohilidae),
which is a pest of stone fruits (also called drupe and berry fruits) that includes strawberries,
blueberries, raspberries, blackberries, and cherries. Spotted Wing Drosophila is an invasive
species that originates from Southeast Asia. SWD was first reported in Santa Cruz County,
California in 2008 (National Agricultural Statistics Service). In a study by Bola et al. (2009),
yield losses were recorded for specific crop-region pairs in the states of California, Oregon, and
Washington. The study findings show economic losses based on maximum reported losses up to
40% for blueberries, 50% for blackberries, 50% for raspberries, and 33% for cherries.
Strawberry losses vary based on location, with most losses occurring in California (Bola et al.,
2009).
However, these calculations are based on only a few parameters, such as price and weight. In
term of measuring losses, there are many factors than can influence loss. Principally, changes in
price, demand, and supply can greatly influence the magnitude of loss. These aspects must be
included to properly measure losses and provide decision-makers with concrete knowledge
about the cost, benefit, or loss with respect to new technologies or pest invasions. Therefore, a
more sophisticated method for measuring loss will be presented in the next section
2.5 Economic Impact Several methods can be used in order to quantify the losses due to fruit flies. For example, a
survey can be employed. For example, Vayssieres et al. (2008) quantify the economic losses of

11
crops by collecting a sample, counting the number of mangos that are infested, and multiplying
them proportionally to the size of the orchard.
Mango losses are likely to have broader impact—including economic impacts—across
various domains and at various levels of economic activity in a given area. Economic impact
may be assessed in terms of losses in business output, worth, wealth, personal income, or jobs.
Economic impacts may occur across various domains, including ecological impacts. Kabubo-
Mariara and Karanja (2007) conducted a study that measured the economic impact of climate on
crops in Kenya. In the study, they used cross sectional data on climate, hydrological, soil, and
household levels under a seasonal Ricardian model to measure the influence of climate on net
crop yield per acre. The results showed that climate affects productivity and that the relationships
between temperature and revenue and between precipitation and revenue are not linear. The
authors conclude that global warming is harmful for crop productivity and leads to a negative
impact on net crop revenue in Kenya.
Calculations of economic impact can be used in other domains, such as in analyzing the
effect of new technology on a specific area such as a community. Various impact studies have
been completed in India, such as one on the economic impact of genetically modified cotton
(Bennett et al., 2004). For that study, data were collected from planters growing the crop under
market conditions rather that trials. The research consisted in evaluating the performance of
farmers who use genetically and non-genetically modified cotton. The results indicated that
genetically modified Bt (Bacillus thuringiensis) cotton has a positive effect on average earnings
and on economic performance of cotton farmers. In terms of cotton yield (tons/ha), revenue from
cotton yield (Rupees/ha) and gross margin (Rupees/ha), the authors demonstrated that Bt cotton
has higher returns (Bennett et al., 2004).
12
Several articles by Kostandini et al. have also examined the economic benefits of producer
risk reduction through agriculture technologies. In one study (2009), they evaluate the economic
impact of mean-increasing and variance reducing new seeds for maize, sorghum, and millet in
rain feed areas of Uganda, Kenya and Ethiopia. Impact among small, medium and large
household producers are measured through surveys in the three countries. The authors find that
there may be substantial benefits from mean increases and yield variance reduction from
research on transgenic maize, millet, and sorghum done by the private sector, but also by the
public sector in these countries. They found that total benefits to producers and consumers from
adopting these new drought resistant maize, sorghum, and millet varieties can reach $86 million,
$7.5 million and $5.5 million respectively in the aforementioned countries. Furthermore, the
benefits from mean increases and variance reduction from GMO adoption can bring $90 million
to the public sector and $28 million to the private sector.
For this study, the intention is to calculate the losses recorded by producers in Senegal, in
particular the losses from mean decreases and variance increases of the production due to fruit
fly infestations. The Kostandini et al. (2009), methodology is relevant for an evaluation of the
variable losses from producers in Senegal.
2.5.1 Techniques Used to Measure Economic Impacts
Economic impact is an instrument that gives farmers and decision-makers a tool for making
objective decisions in terms of benefits and costs with respect to the new technology. Economic
impact can be used in various domains such as: health, agriculture and environmental protection.
Both the society and the farmer can gain from the availability of the information and technology
(Birkhaeuser et al., 1991). In fact, a successful technology should be profitable for the applicant

13
as well as the community. There are numerous ways to evaluate the economic impact of a project
or technology. The various evaluation methods will be summarized in the next section.
2.5.2. Evaluations
There are two temporal aspects of evaluation that economists focus on: 1) the ex-post and 2)
the ex-ante evaluation of impacts. On the one hand, the ex-post analysis is typically conducted
after implementation and functions as a way to assess the impact of completed activities to allow
for people or investors to continue investing in the future (with respect to the new technology or
project willing to be implemented down the line). On the other hand, the ex-ante evaluation is
done before the implementation of the program or project, typically during the design phase.
This perspective helps the decision-maker select the most valuable and cost-effective projects to
fund. In general, economic evaluation is seen as a method to estimate the benefits or profitability
of a technology or project either ex-ante or ex-post. The most widely method used for such
evaluation is the economic surplus method which discussed in the following section.
2.5.3 Economic Surplus Methods
Economic surplus considers two important aspects: 1) consumer surplus and 2) producer
surplus. The consumer surplus refers to the surplus that a consumer is willing to pay for a
commodity or product above the market price. Consumer surplus measures how much the
consumer values the particular good or service. The producer surplus is the area under the market
price and is the willingness to supply for a commodity or product below the market price.
Economic surplus is the most popular method or approach used to measure the consequences
of a new technology in agriculture research. As discussed by Alston et al. (1995), economic
surplus establishes a relationship between the productivity, uncontrolled factors, and investment
in current/past agricultural research. Economic surplus details the level at which research or
14
technological advances can lead to a reduction in the cost of production for a commodity. Also,
economic surplus provides information about market price reductions and changes in distribution
of benefits among producers and consumers (Alston et al., 1995). Commonly used basic cost-
benefit analysis is a special case of economic surplus analysis that assumes the supply elasticity
is 0 and the elasticity of the demand is infinity for commodities (Mills, 1998).
There are numerous studies that have used economic surplus methods to evaluate the
benefits/cost of implementation. Alston et al. (1995) present multitude ex-post and ex-ante
economic methods.
Mills (1998) evaluates new technologies by conducting an ex-ante evaluation for a new
variety of sorghum in Kenya. In that evaluation, the focus is on different agro-ecologic
conditions and different market structures (opened and closed) The economic surplus method is
utilized to evaluate the different benefits under two market types in the various regions of Kenya.
A study conducted by Kristjanson et al. (1999) utilized economic surplus to estimate the
productivity increase for specific African animals with and without the vaccine for
Trypanosomosis. Results from that study show that the adoption of the vaccine can significantly
reduce the cost of the production of milk and meat in Africa. In terms of value, the vaccine can
increase profits for milk and meat from $420 million to $1.1 billion per year. Furthermore,
consumers also benefit from the low prices and the producers benefit from the cost effectiveness
(Kristjanson et al., 1999).
2.5.4 Price Spillovers
In terms of development and trade, products can be produced domestically for local usage
or for exportation. Therefore, when a country heavily influences the market, both locally and
internationally, advancements in technology introduced into that country have the potential to
15
lower the price of commodities. In fact, Alston et al. (1995) stipulate that price spillovers result
when new technologies affect trading prices of goods between countries and regions. Through
their study, the authors showed a range of possibilities as to the effect that price and technology
spillovers on different countries depending on their export status (importing or exporting) and
the importance of production of the commodity relative the rest of the world.
In another study, a model was developed to evaluate the implementation of a new
technology based on price spillovers. Singla and Nasseem (2011) examine the economic impact
of genomic based marker-assisted selection (MAS) in canola. The authors conduct an ex-ante
economic assessment of MAS breeding in variety development when comparing Canada with
other parts of the world. This study draws on partial-equilibrium and economic surplus with
regards to price spillovers. Overall, the authors found the aggregate mean benefits between no
MAS variety development and variety development are expected to be $ 3.9 billion in Canada
and $1 billion for the rest of the world.
2.5.5 Losses due to Risk
An important benefit of new agricultural technologies is yield variance reduction (Heisey &
Morris, 2006). The most widely used framework for measuring the impact of yield variance
reductions is elaborated by Newbery and Stiglitz (1981). In fact, the purpose of Newbery and
Stiglitz’s (1981) method was to measure the welfare gain of famers with initial domestic price
stabilization. And the potential risk benefits if there is a reduction in domestic surplus.
There are several studies that use this approach to measure risk benefits from stabilization
of the prices. However, authors tend to change the formula or the assumptions established in the
beginning by Newbery and Stiglitz (1981). For instance, in a study conducted by Coleman and
Jones (1992), the authors estimate the difference in welfare effects by stabilizing prices for four

16
commodities under a variable tariff scheme and a storage scheme, which combines a modified
method of Newbery and Stiglitz (1981). The study, finds that there are no changes in domestic
surplus with respect to risk benefits from trade policies However, storage schemes do change
welfare due to the elimination of the world price uncertainty.
Another study conducted by Kostandini et al. (2009) used an approach different from the
one used by Newbery and Stiglitz (1981) to determine the risk benefits by stabilization of
production. In the study, the authors estimate the benefits of yield variance reduction for
producers in an ex-ante analysis of the benefits of transgenic drought tolerance research on cereal
crops in eight low-income countries. For their approach, they use the change in variance in
producer income and consumer income to estimate the producer and consumer risk benefits.
Furthermore, they stipulated that the benefits increase from a reduction of the yield variance not
price stabilization. From this study, they found that benefits form yield variance reductions are
very important and represent 40% of the total benefits of drought tolerant varieties across the
eight countries (Kostandini et al., 2009).
2.6 SUMMARY In this chapter, the origin of fruit flies and their expansion was examined, as well as the different
type of flies encountered in Senegal. Furthermore, a background of fruit flies and the different
damages caused by the pest was highlighted. In fact, the damages are truly important and could
in fact reach 100% loss of crops or productions. However, there are several techniques that can
be used to control fruit flies—although their efficiency is yet to be proved. Moreover, several
studies were summarized that calculated the economic losses from infestations. These studies
used different approaches to evaluated the losses. Based on a review of the literature, the most
and widely used method to analyze market-level impacts of changes in agricultural production is
17
economic surplus. Economic surplus analysis reveals additional dimensions on welfare that a
normal benefit-cost analysis does not. The literature on welfare loss due to risk was highlighted,
as well as the change in producer variance due to fruit fly infestation that will lead to household
welfare changes. In fact, for any study of benefits or losses, an increase in variance of production
leads to additional welfare losses. This information is vital to determining the methods used in
this study. These methods are discussed in the next chapter.
18
CHAPTER III METHODOLOGY In this chapter, the methods that are used to measure the losses from fruit fly among mango
producers are discussed. Furthermore, we will discuss the formula for the losses from mean yield
decrease and the yield variance increase associated with fruit fly infestation. Then, the different
parameters employed, total income, share of mango, risk aversion coefficient, and coefficient of
variation as discussed. This is followed by a presentation of the econometric model. Finally, the
different variables used for the regression are discussed.
3.1 ECONOMIC SURPLUS Many studies about the impact of agricultural technologies look at the benefits by extrapolating
the farm-level yield or the income gains using simulations with economic surplus models (Alston
et al., 1995). If adopted, technological changes tend to increase the yield and decrease the cost of
production of commodities. The fact that a new technology decreases the unit cost implies shifts
of the commodity supply function to the lower right relative to the initial supply function
(figure2).
However, alternative scenarios are possible. In this case, the scenario of infestation, natural
disasters, or pests shifts the supply curve up and toward the left Thus, these events increase the
unit cost of the commodity and decrease the yield of the producer.
Following this approach, the economic impact of fruit flies on mango that will be assessed in this
paper using the concept of economic surplus in a partial equilibrium framework. The variant
takes into account the fact that infestation in mango production leads to an increase of the unit
cost and decrease in production. This situation will lead to a shift of the supply curve leftward.
We assume that there is a horizontal demand function due to the fact that Senegal is considered
as an open economy with respect to the mango export market. In this case the demand function is
19
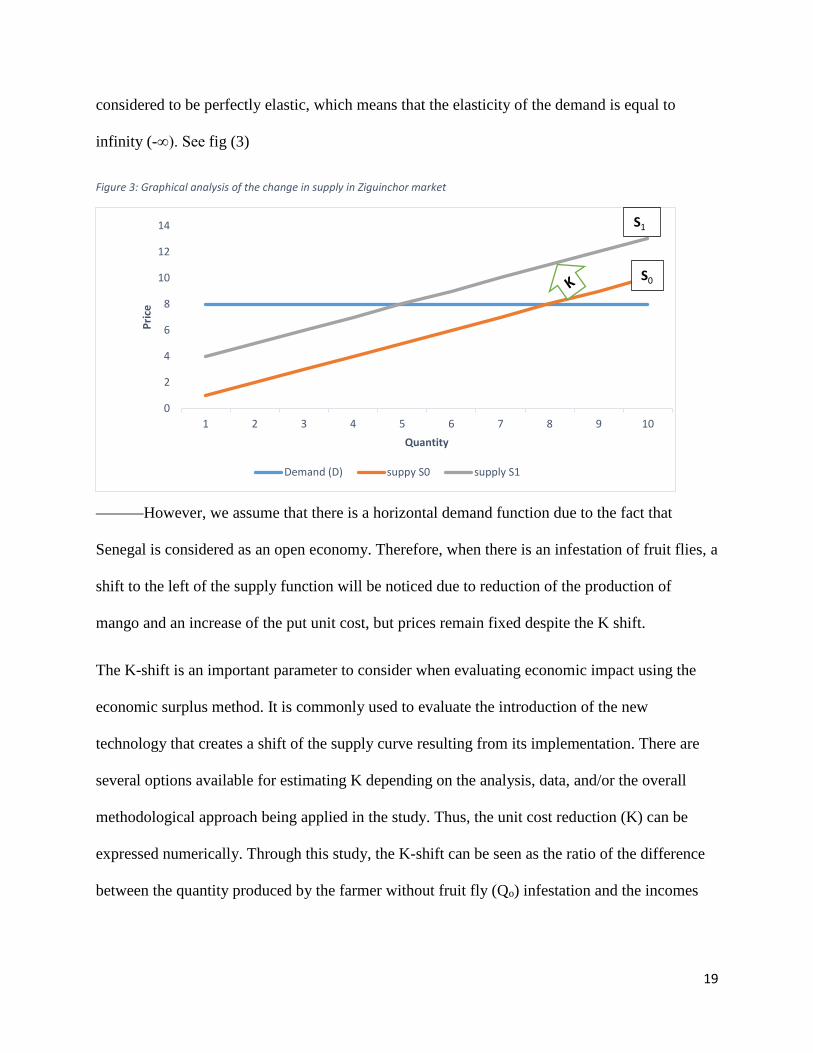
considered to be perfectly elastic, which means that the elasticity of the demand is equal to
infinity (-∞). See fig (3)
Figure 3: Graphical analysis of the change in supply in Ziguinchor market
However, we assume that there is a horizontal demand function due to the fact that
Senegal is considered as an open economy. Therefore, when there is an infestation of fruit flies, a
shift to the left of the supply function will be noticed due to reduction of the production of
mango and an increase of the put unit cost, but prices remain fixed despite the K shift.
The K-shift is an important parameter to consider when evaluating economic impact using the
economic surplus method. It is commonly used to evaluate the introduction of the new
technology that creates a shift of the supply curve resulting from its implementation. There are
several options available for estimating K depending on the analysis, data, and/or the overall
methodological approach being applied in the study. Thus, the unit cost reduction (K) can be
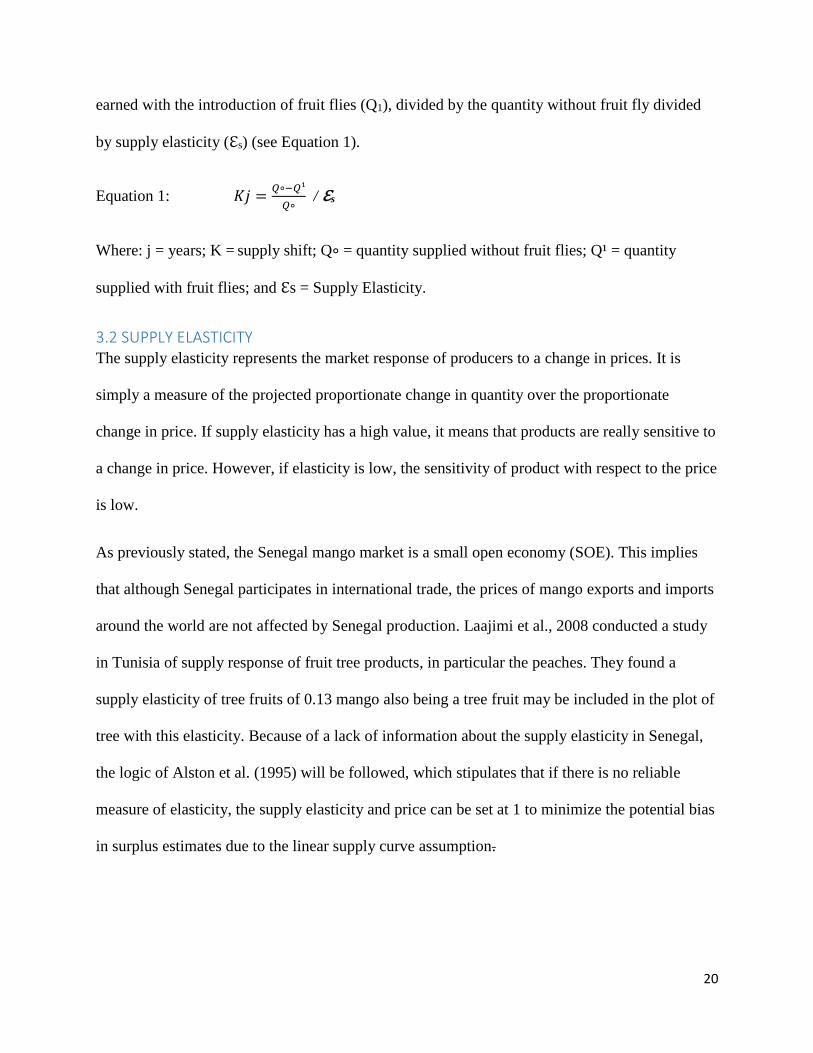
expressed numerically. Through this study, the K-shift can be seen as the ratio of the difference
between the quantity produced by the farmer without fruit fly (Qo) infestation and the incomes
0
2
4
6
8
10
12
14
1 2 3 4 5 6 7 8 9 10
Price
Quantity
Demand (D) suppy S0 supply S1
S0
S1
20
earned with the introduction of fruit flies (Q1), divided by the quantity without fruit fly divided
by supply elasticity (ℇs) (see Equation 1).
Equation 1: 𝐾𝑗 =𝑄∘−𝑄¹
𝑄∘ / ℇs
Where: j = years; K = supply shift; Q∘ = quantity supplied without fruit flies; Q¹ = quantity
supplied with fruit flies; and ℇs = Supply Elasticity.
3.2 SUPPLY ELASTICITY The supply elasticity represents the market response of producers to a change in prices. It is
simply a measure of the projected proportionate change in quantity over the proportionate
change in price. If supply elasticity has a high value, it means that products are really sensitive to
a change in price. However, if elasticity is low, the sensitivity of product with respect to the price
is low.
As previously stated, the Senegal mango market is a small open economy (SOE). This implies
that although Senegal participates in international trade, the prices of mango exports and imports
around the world are not affected by Senegal production. Laajimi et al., 2008 conducted a study
in Tunisia of supply response of fruit tree products, in particular the peaches. They found a
supply elasticity of tree fruits of 0.13 mango also being a tree fruit may be included in the plot of
tree with this elasticity. Because of a lack of information about the supply elasticity in Senegal,
the logic of Alston et al. (1995) will be followed, which stipulates that if there is no reliable
measure of elasticity, the supply elasticity and price can be set at 1 to minimize the potential bias
in surplus estimates due to the linear supply curve assumption.
21
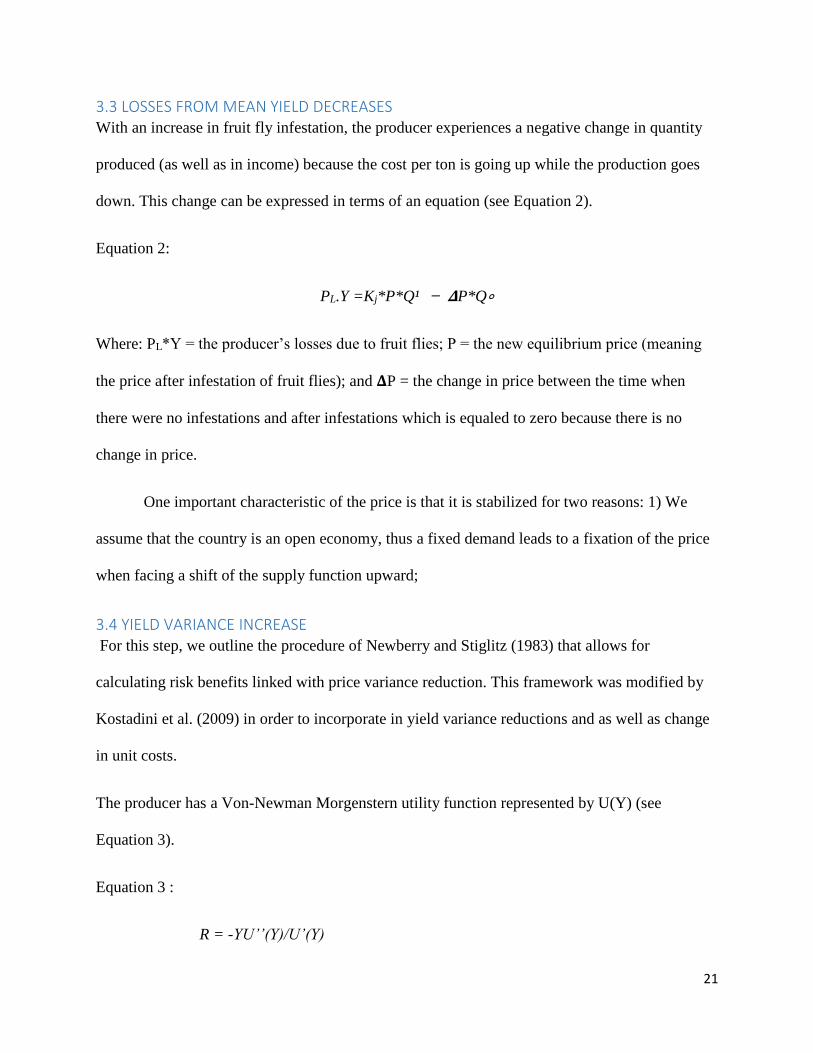
3.3 LOSSES FROM MEAN YIELD DECREASES With an increase in fruit fly infestation, the producer experiences a negative change in quantity
produced (as well as in income) because the cost per ton is going up while the production goes
down. This change can be expressed in terms of an equation (see Equation 2).
Equation 2:
PL.Y =Kj*P*Q¹ ̶ 𝚫P*Q∘
Where: PL*Y = the producer’s losses due to fruit flies; P = the new equilibrium price (meaning
the price after infestation of fruit flies); and 𝚫P = the change in price between the time when
there were no infestations and after infestations which is equaled to zero because there is no
change in price.
One important characteristic of the price is that it is stabilized for two reasons: 1) We
assume that the country is an open economy, thus a fixed demand leads to a fixation of the price
when facing a shift of the supply function upward;
3.4 YIELD VARIANCE INCREASE For this step, we outline the procedure of Newberry and Stiglitz (1983) that allows for
calculating risk benefits linked with price variance reduction. This framework was modified by
Kostadini et al. (2009) in order to incorporate in yield variance reductions and as well as change
in unit costs.
The producer has a Von-Newman Morgenstern utility function represented by U(Y) (see
Equation 3).
Equation 3 :
R = -YU’’(Y)/U’(Y)
22
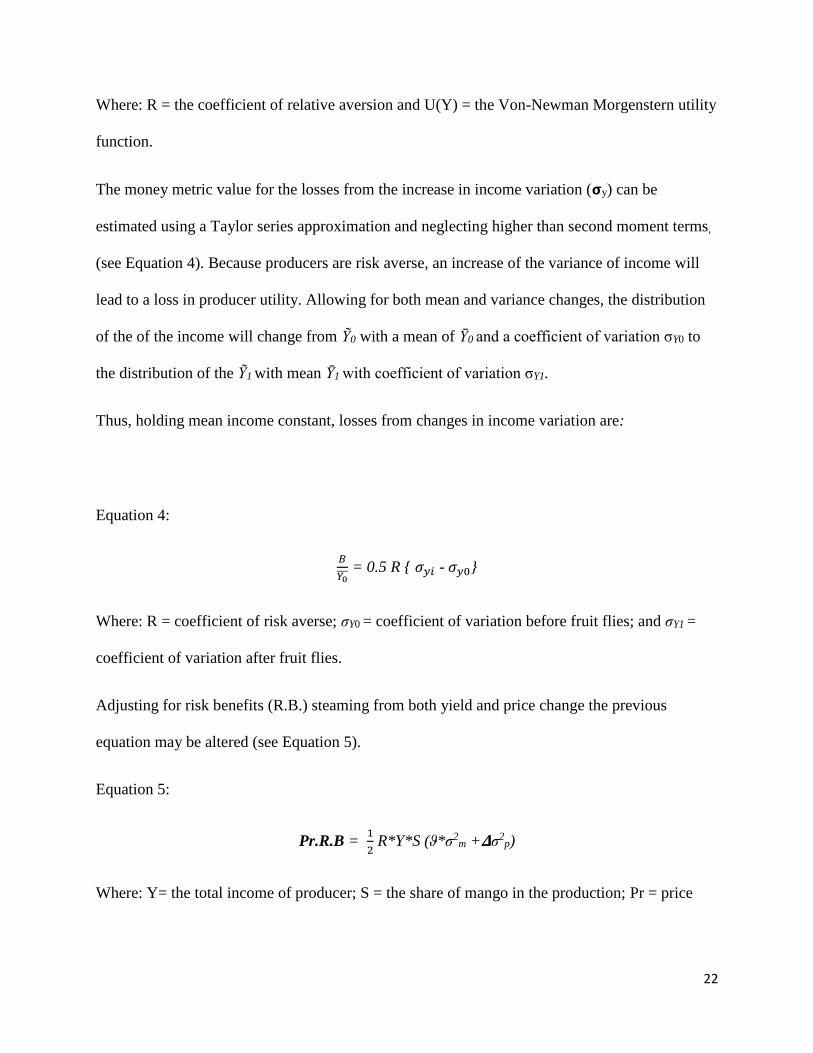
Where: R = the coefficient of relative aversion and U(Y) = the Von-Newman Morgenstern utility
function.
The money metric value for the losses from the increase in income variation (𝞂y) can be
estimated using a Taylor series approximation and neglecting higher than second moment terms,
(see Equation 4). Because producers are risk averse, an increase of the variance of income will
lead to a loss in producer utility. Allowing for both mean and variance changes, the distribution
of the of the income will change from Ỹ0 with a mean of Ῡ0 and a coefficient of variation σY0 to
the distribution of the Ỹ1 with mean Ῡ1 with coefficient of variation σY1.
Thus, holding mean income constant, losses from changes in income variation are:
Equation 4:
𝐵
𝑌0̅̅ ̅ = 0.5 R { 𝜎𝑦𝑖 - 𝜎𝑦0}
Where: R = coefficient of risk averse; σY0 = coefficient of variation before fruit flies; and σY1 =
coefficient of variation after fruit flies.
Adjusting for risk benefits (R.B.) steaming from both yield and price change the previous
equation may be altered (see Equation 5).
Equation 5:
Pr.R.B = 1
2 R*Y*S (ϑ*σ2
m +𝚫σ2p)
Where: Y= the total income of producer; S = the share of mango in the production; Pr = price
23
ϑ = the percentage change in yield coefficient of variation; the percentage change is the
percentage variation of the coefficient of variation without and with fruit fly infestation. In fact,
the parameter shows the stability of the coefficient of variation between the two different events;
σ2m = is the change in coefficient of variation of mango production due to fruit flies. This
coefficient of variation is the one found with no infestation of mango. This parameter is chosen
because of the fact that it is more stable in terms of variability of the data set compared to the
data collected with fruit fly infestation; and
∆σ2p = the variation of the coefficient of variation with respect to the price before and after fruit
fly infestation. However, in the scenario there is no prices variation, therefore the variation of the
coefficient of variation with respect to the price is null.
3.5 TOTAL INCOME The difficulty of having reliable data on producer income is the main motivation that leads us to
use household data from the World Bank about living standard monitoring survey conducted
(LSMS) conducted in Senegal. The survey collected the total income that a producer could have
during a year (e.g. income coming from parents, gifts, or from a parent outside of the country for
representative households in each region). Average total income for household in the region of
Ziguinchor was calculated and used in this paper as the average total income earned by
households (ANDS, 2011).
3.6 MANGO SHARE OF INCOME Of the total income, one part comes from the production of mango, along with maize, peanut,
millet, etc. The income from mango taken for each household in the Ziguichor region in the
LSMS and divided by the total income to come up with the average household income share
from mango (see Equation 6).
24
Equation 6:
S = ∑𝐼𝑖𝑚
𝐼𝑖𝑡
𝑛𝑖=1 ∗
1
𝐻
Where: I = the individual; Iim = the income of mango of the individual; Iit total income of
individual; and H = total household.
3.7 COEFFICIENT OF VARIATION The coefficient of variation is the ratio of the standard deviation over the mean. It is useful here
because it allows for meaningful comparisons between two or more magnitudes of variation,
even if they have different means or different scales of measurement. For this study, the
coefficient of variation is used to measure the degree of variability of mango production with and
without fruit fly infestations relative to the respective with and without mean of the production.
The coefficient of variation is stipulated as follows (see Equation 7 and Equation 8). The
coefficient of variation, Means and Standard Deviation are calculated across three years of recall
data for each household as follows.
Equation 7:
σ = 𝑆𝐷
𝑀𝑒𝑎𝑛
Where: 𝞂 = the coefficient of variation; and SD = Standard Deviation.
Equation 8:
𝑆𝐷 = √∑(𝒙−�̅�)𝟐
𝒏−𝟏

25
Where: SD = Standard Deviation being the variation in mango production over the three years
from the mean; x = mango production of one producer over three years; �̅� = the mean production
of mango during three years; and.
3.8 RISK AVERSION COEFFICIENT The risk aversion coefficient gives the big picture of the behavior of an individual in term of how
much they will pay to reduce uncertainty. On the one hand, there is a great deal of variation in
estimated relative risk aversion coefficients across African countries. Yesuf and Bluffstone
(2009) found a constant relative risk aversion of 4.2. Harrison, Humphrey and Verschoor (2010)
estimated a constant relative risk aversion (CRRA) that equaled 0.5. However, these two findings
were for in Ethiopia, and may not be suitable references for Senegal.
Some studies have estimated the risk aversion coefficient in for Senegal. Charness and Viceisza
(2012) estimate a CRRA coefficient of 1.39—showing that Senegalese farmers are somewhat
risk averse.
3.9 ECONOMETRIC MODEL The main goal of this paper is to address the different parameters that influence the losses of
production and income. For this model, we use ordinary least Squares (OLS) regression as well
as a panel data model. The OLS regression was specified as follows:
Log(Pl_Yt) = f(cost of techniques, technology, gender, Keiit/Kent/local varieties, number of
hectares, number of plants, and yearly production)
Where: t represents the years; and f factors cost of techniques, technology, gender,
Keiit/Kent/local varieties, number of hectares, number of plants, and yearly production.
26
More specifically, the relationship between producer losses and the explanatory variables is
expressed as:
Log(Pl_Y) t = a*costtecht + b*techt + c*male +d*keiit + e*kent + g*hect + h*numbplantt +
i*prodt j*2013i + k*2014i+ εi
Where: PL_Y is the logarithm of the losses encountered by producers; PL = Price
Costtech is the factor representing the cost of the IPM used to control fruit flies;
Tech: this parameter takes two values 1 and 0 and represent the use or not of a technique to
control fruit flies;
Male: this parameter is a vector gender and takes two values 1 and 0, 1 for female and 0 for
male;
Keiit, Kent and Locva are vectors of the varieties that are in the farm;
Hect represents the number of hectares possess by producers;
Numplant is a vector of the number of pants in the orchard; and
Prod is the vector production in one specific year.
εi is the errors terms
The coefficients a, b will be negative if fruit fly control technologies reduce losses. The
coefficients d and e should be positive because Keiit and Kent mangos are late varieties (and so
are more likely to face more damage). The coefficient g, h, and i are expected to be positive
because the larger the scale of production, the more producers are susceptible to losses.
27
Furthermore, a fixed effect panel data model is estimated to control for potential household
unobserved heterogeneity in losses Thus, the functional form of the panel data model which
includes only time variant variables is as followed
Pl_Y = f (cost of techniques, production technology)
More specifically, the relationship between producer losses and the explanatory variables is set
as followed:
Log (Pl_Y) it = di + a*costtechit + b*prodit +c*technoit + εit
We suspect the coefficients a and c will be negative if IPM and other technologies reduce losses,
while the for the coefficient b should be positive because the greater the level of the production
the greater the losses. d is the household fixed effect.
3.10 VARIABLES USED IN THE REGRESSION The following parameters are calculated for each household: the losses of mean yield decreases
and the losses of yield variance increases using the OLS and panel data fixed effects statistical
models. However, the panel data model only uses the time variant parameters. Table 1 presents
the dependent and independent variable included in the analysis.

28
Table 1: Variable for the regression
Independent
Variables Variable Descriptions
Gender Gender of respondent 1=male 0=female
number of hectares Number of hectares possessed by household
number of plants number of mango plants in the whole orchard
Keiit number of trees for Keiit Variety
Kent number of variety for Kent variety
Local Varieties number of trees for Local varieties
Prodi Production of mango in tons
Techi Technique used to control fruit flies: 1= Use at least one technique, 0 =
N/A
Costtechnicsi Total Cost of those techniques
income Total Income gather by household
Dependent
Variables
P_Losses Production lost caused by fruit flies.
P_Risk B Producers risk benefits
29
CHAPTER VI AREA AND DATA
4.1 STUDY AREA This study was conducted in Senegal, a country in West Africa with a surface area of 196,723
km2 and a density of 66.58 habitants per km2. The population in Senegal is comprised of a
majority of young people, with a 42% of people between the age of 0 and 14 years old and
30.4% of the population between 25 and 54 years old. The rate of birth in this country is very
high at 2.48%, with a fecundity rate of 4.52 children per women
Most of the countries in West Africa are located within a semiarid region called the Sahel.
Senegal, being in this area, has a variable and low rate of rainfall (Leroux, 1973a). There are two
factors that influence the Senegalese climate ‒ the lack of significant hills or mountains and its
geographical position. Mostly, Senegal is a flat country. The altitude of this country typically
does not exceed 130 meters, with the exception of the altitude going up to 581 meters in the
southern part of the country (Sene et al., 2006; Fall et al., 2005). In fact, the absence of steep
topography is one of the reasons that Senegal is exposed to different air masses, which generate a
northeasterly flow of dry, warm air (harmattan) and the southwest winter monsoon. Beside this
aspect, the geographical location means Senegal belongs entirely in the tropics (Leroux, 2000).
4.1.1 Climate
The climate in Senegal divides the year into two main seasons, the rainy season and the dry
season. The rainy season lasts from May to October with a rainfall distribution that varies from
one area to another. The duration of the rains is longest in the South, lasting up to six months.
The duration is four months in the Center, while the northern part of the country has only three
months of rainy season.
30
In fact, in the North the total rainfall might be around 250 mm while in the South, it could reach
1,500 mm. The temperature during this period may go up to 30˚ C on average across the country.
The temperature range varies, with highest temperature around 45˚ Celsius and the lowest going
down to 10˚ Celsius—mostly along the coast.
Agriculture in Senegal is rainfall dependent. This situation helps explain why rural exodus is
viewed as important for better living conditions. With the advent of climate change, the
frequency of the rain in some area has become very low. The importance of agriculture to
Senegal is discussed further below.
4.1.2 Agriculture
Agriculture occupies a preponderant place in the Senegalese economy. Agriculture and livestock
still have important roles in the economy, although most farms are small scale and engaged in
market gardening or subsistence farming. In fact, more than half of the population is comprised
of farmers who get their subsistence from agriculture. About 70% of the population are engaged
in farming, despite the fact that there are more and more people leaving rural areas for urban
ones. Although most of the population is involved in farming, the contribution of agriculture to
the Senegalese economy is declining. In fact, from 1960 to 2003, 59% of the population was
engaged in farming, but the agriculture sector represented only 10% of the GDP per capita. From
2003 to today, for the same percentage of people considered to be farmers, the GDP has dropped
to 8% (DPS, 2004).
However, the mango sector in Senegal in booming. According to the International Trade Center
(2015), the exportation of mango from Senegal has reached the level of 10,247 tons in 2014
against 8,205 tons in 2013 (ITC, 2015). In fact, Senegal is the second exporter in Africa after
Ivory Coast and the ninth in the world (Toure, 2012). This exportation is mainly done by mango

31
producers in the North West along the coast of Senegal. The exportation of mango is expedited
as Senegal is located on the coast, making it easy to ship mango to the European Union by boat
and/or by plane. Indeed, shipping by boat takes only six days and by plane three hours. This
gives Senegal a strategic advantage compared to other mango exporting countries (González,
2014).
Thus, chain of value offers a lot opportunity for investing in the country. Moreover, especially
for Senegal’s young population, the value chain of mango is important because it creates many
jobs for the population—and particularly for women. Indeed, the chain of value of mango has
around 33,600 employees in Senegal (with 44.7% being women) (ASEPEX, 2012). In a country
where unemployment is around 13%, the production of mango can be an asset.
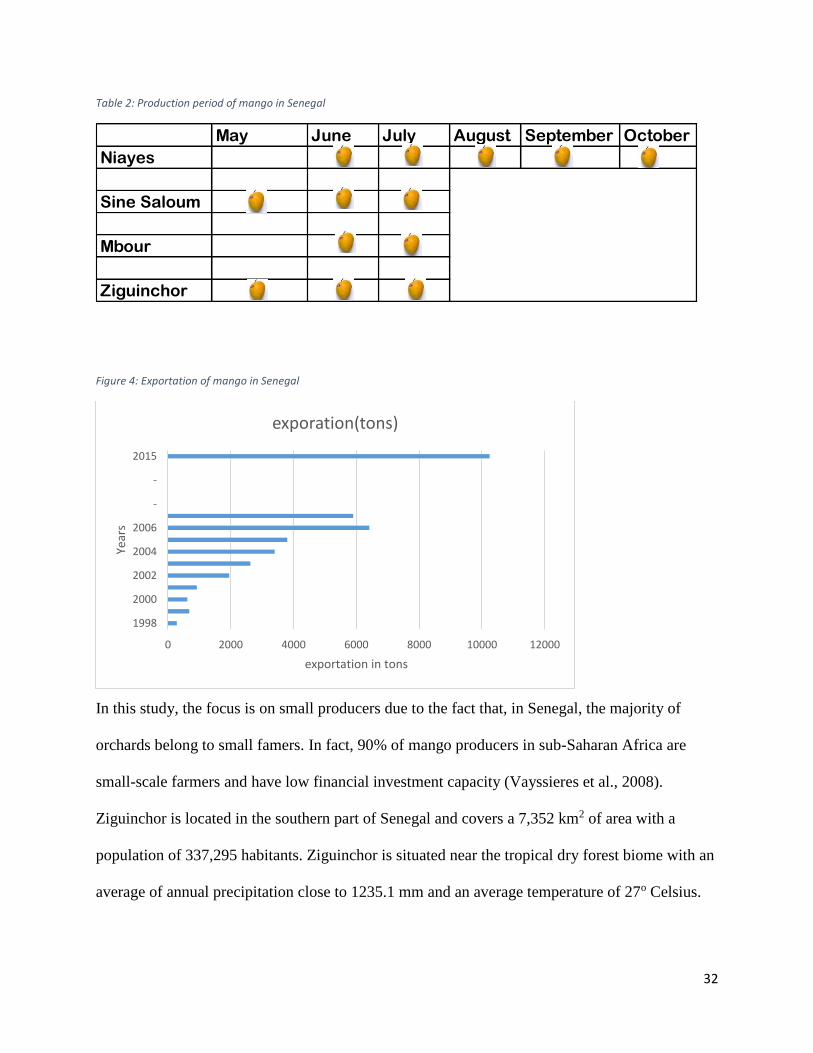
Senegal has 14 regions and the principal areas for mango production are Niayes, Mbour, Sine-
Saloum, and Ziguinchor. However, these different regions do not have the same period of mango
production. The following table shows the different months of production (see Table 2). In the
Niayes region, the mango season lasts from June to October, while Sine-Saloum and Ziguinchor
both produce mangos from May to July and, finally, in Mbour production occurs for two months
(June and July). Figure 5 shows the evolution of the exportation from Senegal for the last few
years (1998-2015). Exportation of mango to European Union has increased considerably from
280 tons in 1998 (Diouf, 2009) to 10247 tons in 2015 (ITC, 2015).
32
Table 2: Production period of mango in Senegal
Figure 4: Exportation of mango in Senegal
In this study, the focus is on small producers due to the fact that, in Senegal, the majority of
orchards belong to small famers. In fact, 90% of mango producers in sub-Saharan Africa are
small-scale farmers and have low financial investment capacity (Vayssieres et al., 2008).
Ziguinchor is located in the southern part of Senegal and covers a 7,352 km2 of area with a
population of 337,295 habitants. Ziguinchor is situated near the tropical dry forest biome with an
average of annual precipitation close to 1235.1 mm and an average temperature of 27o Celsius.
May June July August September October
Niayes
Sine Saloum
Mbour
Ziguinchor
0 2000 4000 6000 8000 10000 12000
1998
2000
2002
2004
2006
-
-
2015
exportation in tons
Year
s
exporation(tons)
33
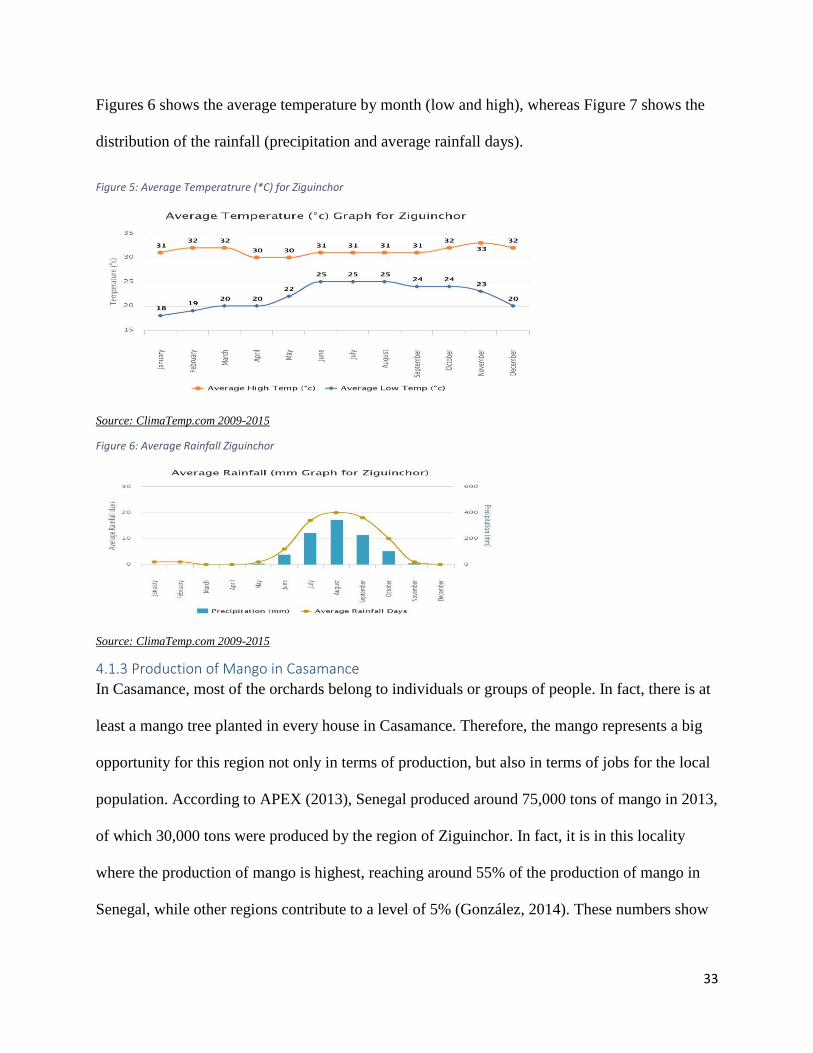
Figures 6 shows the average temperature by month (low and high), whereas Figure 7 shows the
distribution of the rainfall (precipitation and average rainfall days).
Figure 5: Average Temperatrure (*C) for Ziguinchor
Source: ClimaTemp.com 2009-2015
Figure 6: Average Rainfall Ziguinchor
Source: ClimaTemp.com 2009-2015
4.1.3 Production of Mango in Casamance
In Casamance, most of the orchards belong to individuals or groups of people. In fact, there is at
least a mango tree planted in every house in Casamance. Therefore, the mango represents a big
opportunity for this region not only in terms of production, but also in terms of jobs for the local
population. According to APEX (2013), Senegal produced around 75,000 tons of mango in 2013,
of which 30,000 tons were produced by the region of Ziguinchor. In fact, it is in this locality
where the production of mango is highest, reaching around 55% of the production of mango in
Senegal, while other regions contribute to a level of 5% (González, 2014). These numbers show

34
the importance of the mango production in the Ziguinchor (Casamance) region, and justify its
selection as the study region.
4.2 DATA The data presented in this study are the results of a survey run in May 2015 among the
population of households in the region of Ziguinchor, Senegal. Before conducting the survey, we
received the approval of the IRB (Institutional Review Board) at Virginia Tech. The data set
includes household information about the number of hectares, number of trees and varieties of
mangos, and the production of mango over three years from 2012 to 2014. Household
information was also collected on the losses of production due to fruit flies, techniques used to
control fruit flies, the gain of production from those technics, the cost of techniques, and the total
value of the production sold every year. Before the survey, villages were selected based on
production of mango in the regions, meaning that the villages are the principal zones for
production of mango in Ziguinchor. These villages included: Kaleane, Kaguitte, Nyassia,
Ediamath, Kagnobo, Djegoune, Elana, Djimande, Mangagoulack, Mlomp, Kabiline, Djinacky,
Baline, Mahmouda Cherif, Ebinkine, Kafountine, Diannah, Abene, Albadar, Colomba, Niaguiss.
Boulome, Diagnon, Sindone, Djifanghor, Adeane, Tambacoumba, Tobor, Aniak Petit, and Aniak
Grand. For each village, 10 households were chosen randomly. In theory, we should have
collected 300 surveys; however, 9 households were missing data, and the total sample size was
291. Figure 8 provides a map of the study villages.
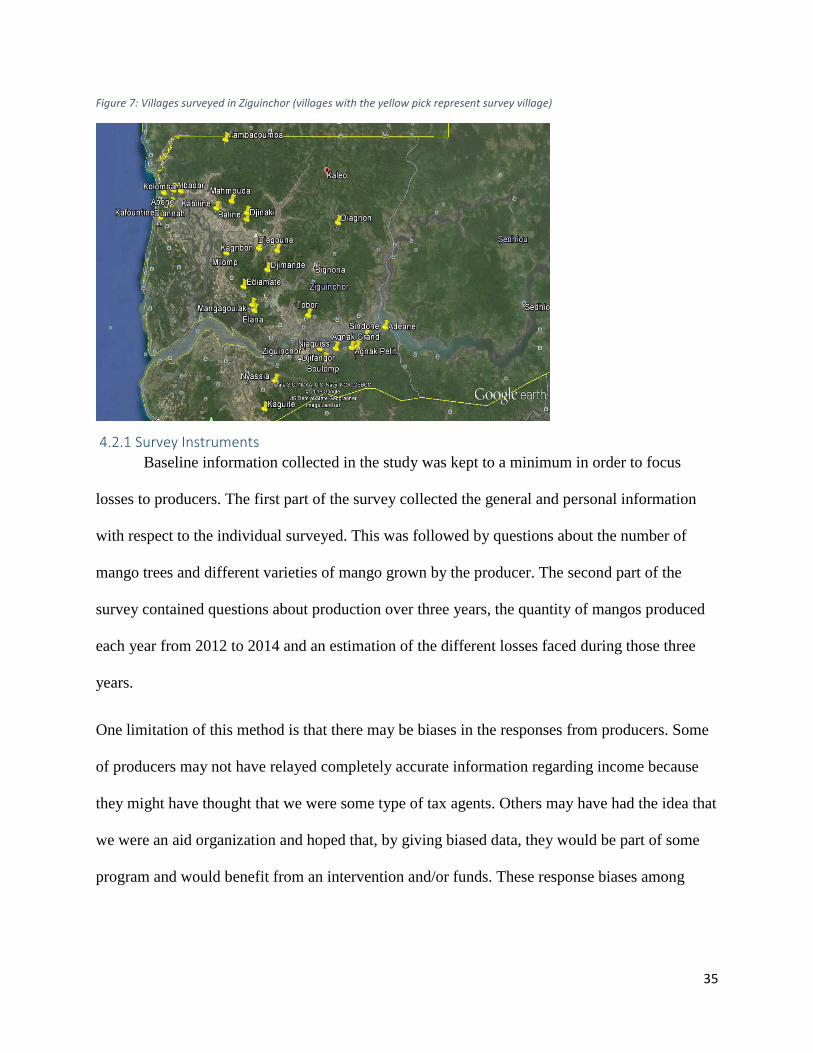
35
Figure 7: Villages surveyed in Ziguinchor (villages with the yellow pick represent survey village)
4.2.1 Survey Instruments
Baseline information collected in the study was kept to a minimum in order to focus
losses to producers. The first part of the survey collected the general and personal information
with respect to the individual surveyed. This was followed by questions about the number of
mango trees and different varieties of mango grown by the producer. The second part of the
survey contained questions about production over three years, the quantity of mangos produced
each year from 2012 to 2014 and an estimation of the different losses faced during those three
years.
One limitation of this method is that there may be biases in the responses from producers. Some
of producers may not have relayed completely accurate information regarding income because
they might have thought that we were some type of tax agents. Others may have had the idea that
we were an aid organization and hoped that, by giving biased data, they would be part of some
program and would benefit from an intervention and/or funds. These response biases among

36
others could have potentially affected our estimates in terms of underestimating or
overestimation the impact of fruit flies on mango.
4.2.2 Selection of Villages
Ziguinchor has three departments, five communes, eight districts and 25 rural communities. The
selection of the villages for this study was carried out with the help of the Regional Office of
Rural Development (DRDR) in Ziguinchor. Among 25 rural communities. Then we divided the
number of rural communities by three and we chose every rural community at that interval.
Then, for village, we adopt the same technique. We selected all the villages in each chosen
community and selected villages proportionally, according to the number of people in each rural
community—as each rural community does not have the same number of villages, with some
more than others. For the selection of the villages, we referred to documents from ANDS which
gave us records on the population number for any rural community chosen. Then the total
population in one rural community is divided by the total population for all rural communities
and then multiply by 30. Thus the results will give us the number of villages that will be chosen
in each rural community according to the population density. This method resulted in the
selection of the 30 villages mentioned in the previous section. Finally, within each village, 10
households were chosen—representing the population of the village and giving us a sample of
300 households overall.
4.2.3 Selection of Household
When the survey team arrived in a village, the chief of the village was asked to provide us a
record book listing the names of all households. In order to keep the selection random, we
divided the number of households in the village by 10 and then choose every household in the
village off a list at that interval. Then, a question was posed to the chief of the village in order to
confirm whether these chosen households had an orchard. Finally, the chief of the village was

37
responsible for making the chosen households aware about our upcoming visit for the survey.
Every producer was eligible to be chosen for the survey. We did not only try to choose producers
with a high production of mango or with a high number of hectares. In fact, as the data shows,
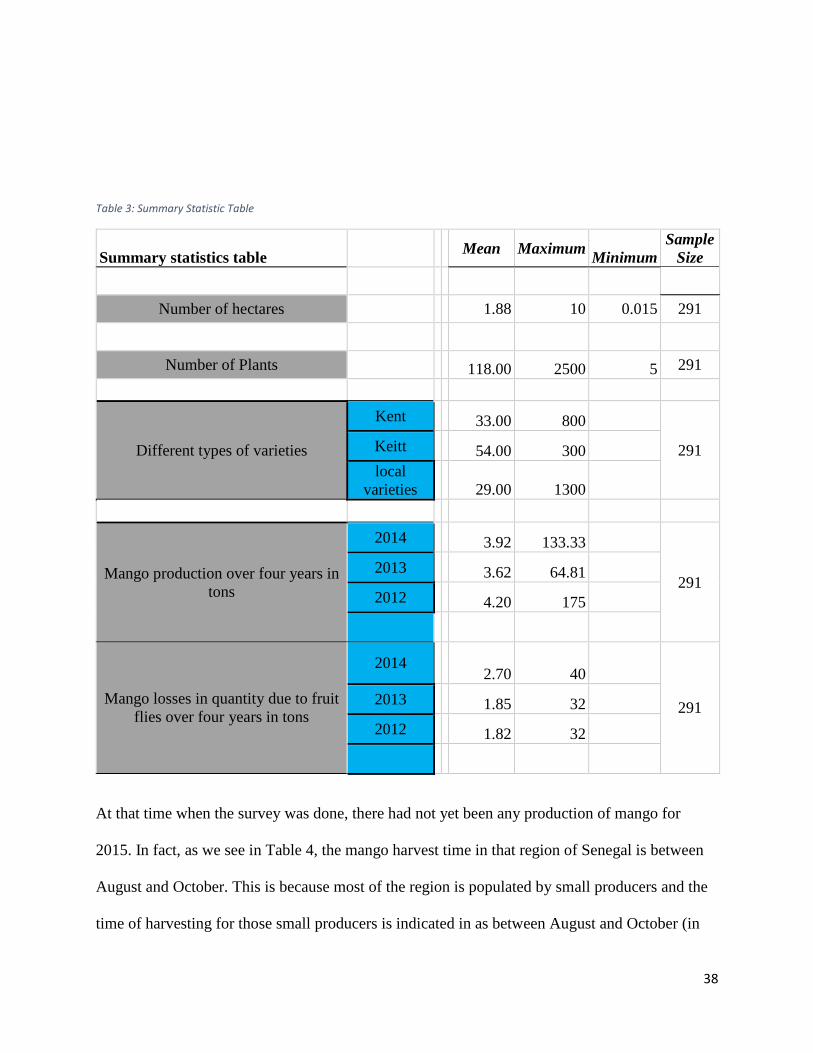
there is one producer with only 0.01 hectare and only 5 mango trees. Table 3provides summary
statistics for key variables
Descriptive statistics on mean, maximum, and minimum are given for key variables. The mean
of the number of hectares among all people surveyed is 1.9 with a standard deviation of 1.4. The
number of plants on average is 116 for all varieties, with 33 plants for the Kent variety, 54 for
the variety Keitt, and 29 for all the local varieties. These associated with standard deviations for
the variety types are 82.0, 63.8, and 98.5, respectively. On average, the quantity of mango
produced was 3.92 tons in 2014, 3.62 tons in 2013, and 4.2 tons in 2012. The respective standard
deviations are 6.11, 4.41, and 10.58 for each year mentioned. For 2014, the mean losses due to
fruit flies were 2.70 tons with a standard deviation of 4.48. For 2013, losses were 1.85 tons with
a 3.11 standard deviation. For 2012, losses were 1.82 tons and a standard deviation of 3.62.
The next two columns of the table show us the maximum and the minimum of each
variable in the survey. Maximum orchard size is 10 hectares and minimum size is 0.015 hectares.
The number of mango plants varies from 5 to 2,500 mango trees. By variety, the Kent variety has
a minimum and maximum of 0 and 800, respectively. The Keitt variety has a minimum and
maximum of 0 and 300 mango trees, respectively. For the local varieties the minimum and
maximum are 0 and 1,300 trees, respectively.
38
Table 3: Summary Statistic Table
Summary statistics table Mean Maximum
Minimum
Sample
Size
Number of hectares 1.88 10 0.015 291
Number of Plants 118.00 2500 5 291
Different types of varieties
Kent 33.00 800
291 Keitt 54.00 300
local
varieties 29.00 1300
Mango production over four years in
tons
2014 3.92 133.33
291 2013 3.62 64.81
2012 4.20 175
Mango losses in quantity due to fruit
flies over four years in tons
2014 2.70 40
291 2013 1.85 32
2012 1.82 32
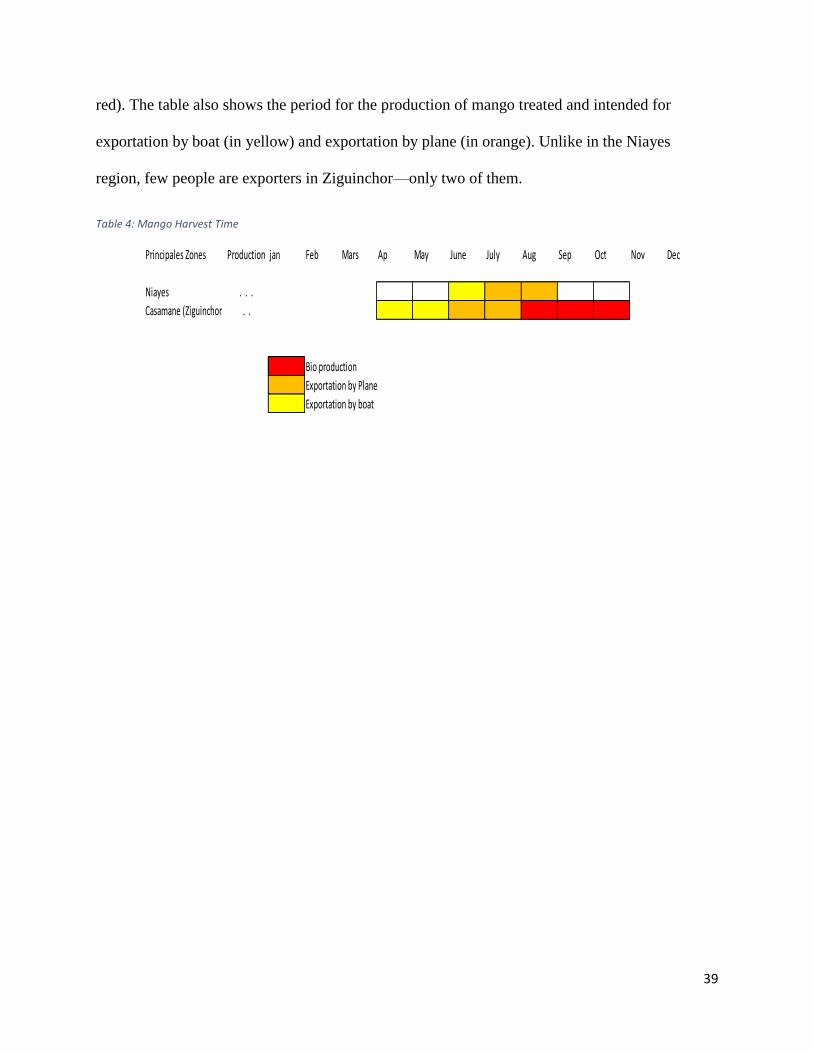
At that time when the survey was done, there had not yet been any production of mango for
2015. In fact, as we see in Table 4, the mango harvest time in that region of Senegal is between
August and October. This is because most of the region is populated by small producers and the
time of harvesting for those small producers is indicated in as between August and October (in
39
red). The table also shows the period for the production of mango treated and intended for
exportation by boat (in yellow) and exportation by plane (in orange). Unlike in the Niayes
region, few people are exporters in Ziguinchor—only two of them.
Table 4: Mango Harvest Time
Principales Zones Production jan Feb Mars Ap May June July Aug Sep Oct Nov Dec
Niayes . . .
Casamane (Ziguinchor . .
Bio production
Exportation by Plane
Exportation by boat
40
CHAPTERV RESULTS
5.1 INTRODUCTION In this chapter, the estimates of the total loss of income encountered by producers are
presented, followed by a discussion of village losses and their cause. Finally, we present the
ordinary least squared (OLS) regression and the results of a fixed effects panel data model in
order to identify key variables associated with producer losses. The chapter concludes with a
discussion of the OLS and panel data findings.
5.2 LOSS ESTIMATES The losses from mean yield decreases will be presented in general for the whole sample
that represents the region. Losses will then be presented for each village chosen for the survey.
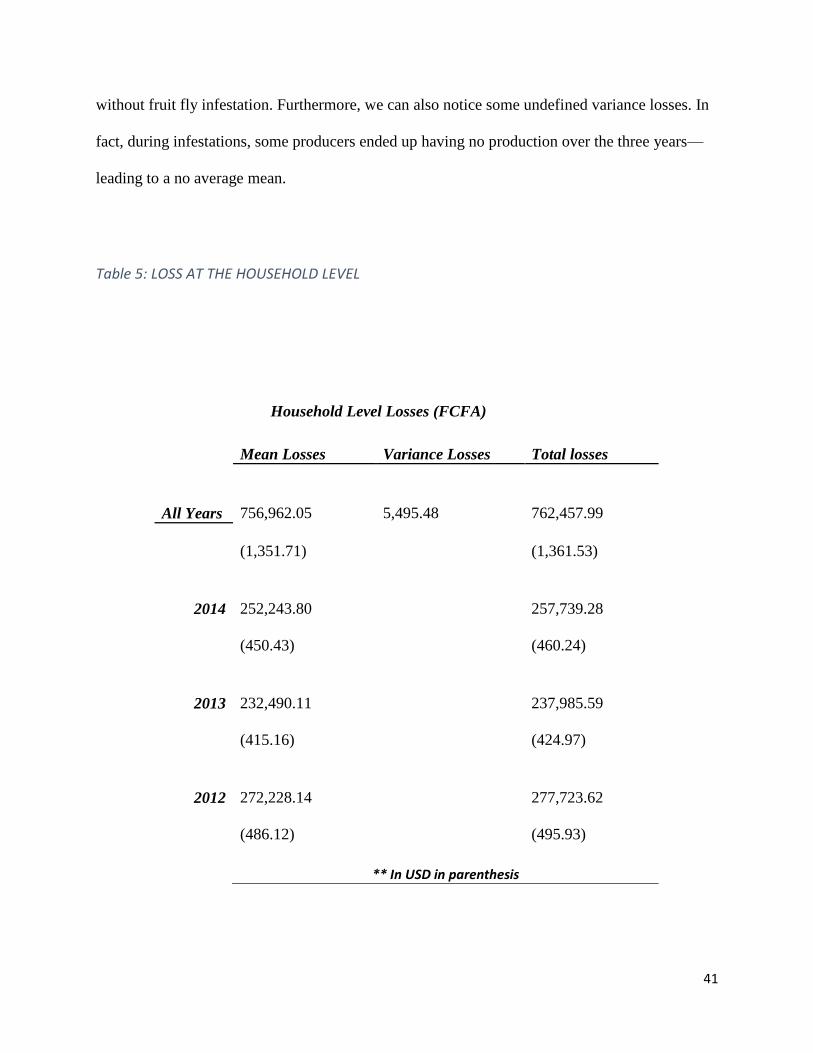
As we can see in Table 5, the types of losses present at the household level include losses
from mean yield decreases, variance losses, and total losses. For all years, the variance losses
represent 2.2% of the total yield losses from fruit fly infestations. Based on the total loss for all
years, the mean losses represent 97.8%. These numbers show that the losses are more important
in regards to mean losses than variances losses.
In order to have more information, we break down the mean yield and variance losses by
year. Losses are greater in 2012 compared to 2013 and 2014, while the variance losses by
calculate remain stable. However, we notice a reduction in mean yield losses in 2013 and an
increase again in 2014. The decrease from 2012 to 2013 represents 14.4%, followed by an
increase of 7.8% between years 2013 and 2014.
At the individual household level, we can notice instances of zero variance losses. This is
due to a small change in the CV between production with fruit fly infestation and production
41
without fruit fly infestation. Furthermore, we can also notice some undefined variance losses. In
fact, during infestations, some producers ended up having no production over the three years—
leading to a no average mean.
Table 5: LOSS AT THE HOUSEHOLD LEVEL
Household Level Losses (FCFA)
Mean Losses Variance Losses Total losses
All Years
756,962.05
5,495.48
762,457.99
(1,351.71)
(1,361.53)
2014
252,243.80
257,739.28
(450.43)
(460.24)
2013
232,490.11
237,985.59
(415.16)
(424.97)
2012
272,228.14
277,723.62
(486.12)
(495.93)
** In USD in parenthesis
42
Table 6 shows the aggregate mean losses within different villages chosen for the survey,
including the different mean losses by village and variance losses for each village. Thus, as
expected, we noticed that villages with the higher acreage per household had higher losses. This
suggests that losses are greater for larger farms, since they are supposed to have the highest
number of mango trees. In fact, as shown in the table, the surveyed households representing the
village of Boulome registered the highest losses with a total number of acreage reaching 31.5
hectares in total. The surveyed households in the village of Abene followed with an acreage of
24.98 hectares. Surveyed households in villages that faced the lowest losses were those ones in
the villages of of Nyiassia, Baline and Elana. These household occupy 11.62 hectares, 11
hectares, and 20 hectares in acreages, respectively.
However, some surveyed total surveyed household in some villages have high hectarage,
but not high losses. In fact, surveyed households representing villages like Kabiline,
Magangouleuck, Djinacky (which have a total area of 26.5 ha, 22 ha, and 24.13 ha respectively)
had lower losses than certain villages with lower hectares. For instance, the surveyed household
representing the village of Tambacoumba with a low area (15.5 ha) had a higher loss than certain
villages with high areas like those villages cited previously. This contradiction is due on the fact
that, in Ziguichor, villages with high areasa does not mean that they have a higher mango
production or high number of plants. Since the infestation event, villagers tend to trade mango
trees for other types of plants, which has in turn reduced the number of mango plants in certain
big orchards. Such diversification of their orchards leads to a certain decrease of the losses.
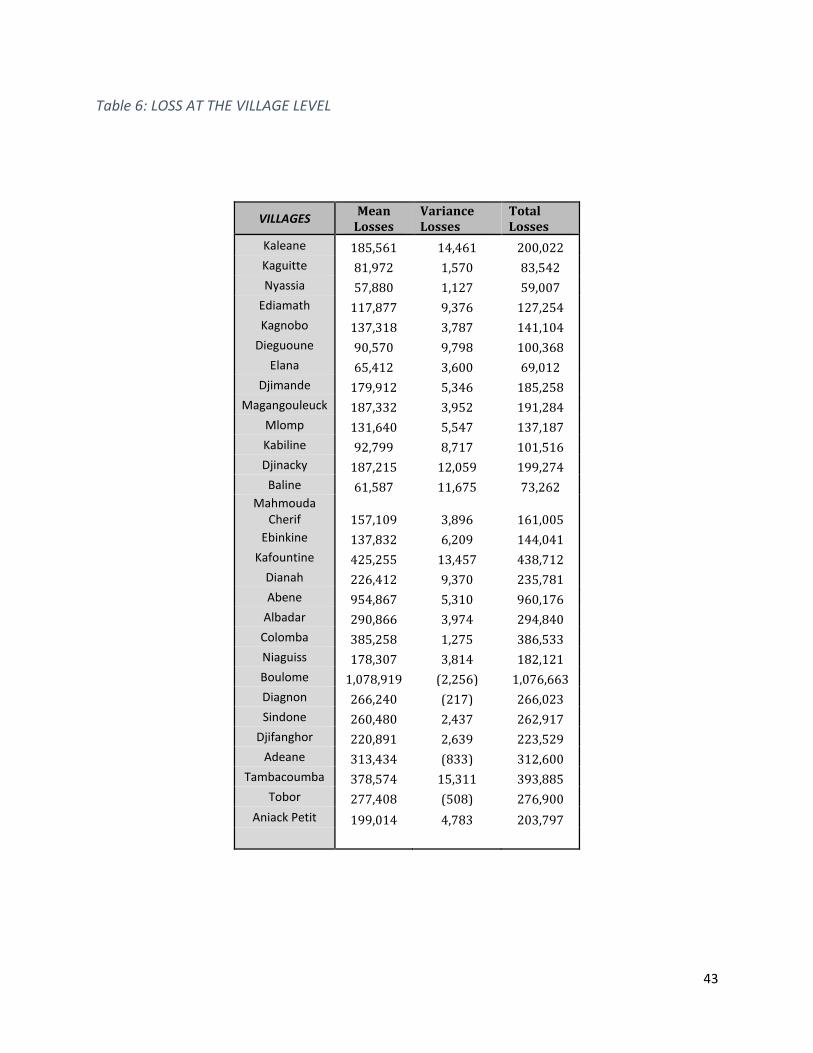
43
Table 6: LOSS AT THE VILLAGE LEVEL
VILLAGES Mean
Losses Variance Losses
Total Losses
Kaleane 185,561 14,461 200,022
Kaguitte 81,972 1,570 83,542
Nyassia 57,880 1,127 59,007
Ediamath 117,877 9,376 127,254
Kagnobo 137,318 3,787 141,104
Dieguoune 90,570 9,798 100,368
Elana 65,412 3,600 69,012
Djimande 179,912 5,346 185,258
Magangouleuck 187,332 3,952 191,284
Mlomp 131,640 5,547 137,187
Kabiline 92,799 8,717 101,516
Djinacky 187,215 12,059 199,274
Baline 61,587 11,675 73,262 Mahmouda
Cherif 157,109 3,896 161,005
Ebinkine 137,832 6,209 144,041
Kafountine 425,255 13,457 438,712
Dianah 226,412 9,370 235,781
Abene 954,867 5,310 960,176
Albadar 290,866 3,974 294,840
Colomba 385,258 1,275 386,533
Niaguiss 178,307 3,814 182,121
Boulome 1,078,919 (2,256) 1,076,663
Diagnon 266,240 (217) 266,023
Sindone 260,480 2,437 262,917
Djifanghor 220,891 2,639 223,529
Adeane 313,434 (833) 312,600
Tambacoumba 378,574 15,311 393,885
Tobor 277,408 (508) 276,900
Aniack Petit 199,014 4,783 203,797
44
In summary, the losses encountered by producers are significant. Based on the survey
done by ANDS, ESPS_2, 2011, the average income of the population of the Ziguinchor
(Casamance) is around 1,509,377.39 CFA (US$2,695.32). In term of this study, after surveying
30 villages, total average losses for over 291 people come down to 257,973 CFA (US$460.67).
Losses represent 17.09% of the total average income for the population in Ziguichor
(Casamance).
5.3 ECONOMETRICS ANALYSIS OF LOSSES An ordinary least square (OLS) regression was conducted in order to determine the
household characteristics associated with high levels of losses across years. In Table 7, we notice
that number of hectares, Keiit, production, and number of plants are all significant factors.
First, we noticed that the number of hectares is statistically significant at the p=0.01 level.
This infers that the greater the number of hectares of the mango plantation, the greater the losses.
In fact, the increase of one unit of area leads to an increase of loss by 14.9% from one year to the
next. Even if we try to express the losses in term of magnitude (1.151), indeed, the increase of the
number of hectares means that the number of mango plants is proportionally going to increase.
Therefore, the probability of the number of plants or products infested will go up.
The data also shows that “Keiit” is significant as well, meaning that the greater the
number of plants of Keiit, the more the losses increase—by 0.283% (1.002) per unit. After
controlling for the number of hectares, we noticed some additional losses that were related with
the increase of density of the Keiit variety. Thus, we might say that there is direct correlation
between Keiit and the number of hectares. However, during the survey, we found that this was
not the case. For the producers, having a big orchard does not mean that he will have a higher
1 Losses = Expo (�̂�)
45
number of mango plants such as Keiit. Sometimes, farmers, in order to reduce their risks, will
diversify and apply multi-cropping methods. Thus, this often results in some of them having a
big orchard with a low number of mango plants (all varieties) while other farmers with small
orchards having a greater number of mango plants.
From the survey, we also noticed that the production is significant. The results show that
the more the production goes up, the more the losses increase as well. In fact, when the
production goes up by one ton, the loss follows the same trend and goes up by 4.52% (1.047).
Again, this is after controlling for area, implying that for more intensive production, producers
will experience greater losses. However, the number of plants have a negative effect on the
losses. In fact, the more one has plants in an orchard, after controlling all other variables, the less
producers are going to face losses. The results show that a one-unit increase of the number of
plants means that the losses are going to decrease by 0.095% from one year to the next.
Furthermore, we run an OLS for the losses due to the production variability with the
same variables. We notice that number of hectares is the only variable that is significant at
p=0.01. It shows that the more the number of hectare goes up the more the losses from variability
goes down.
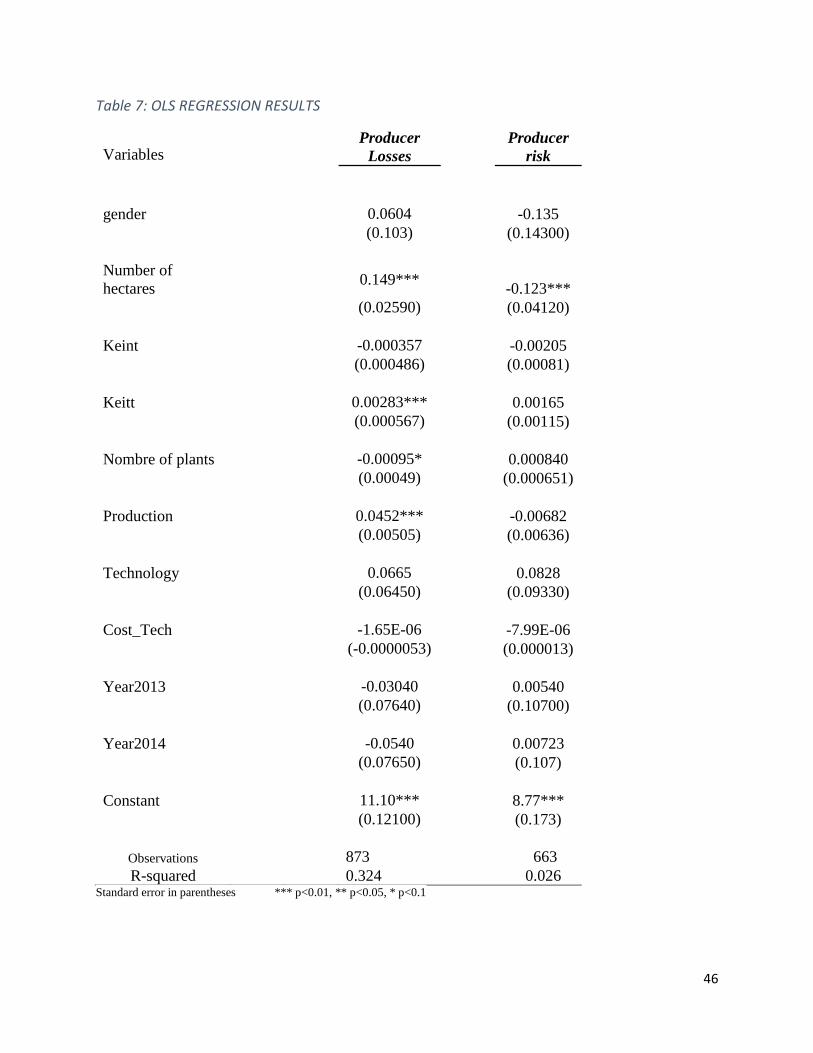
46
Table 7: OLS REGRESSION RESULTS
Variables
Producer
Losses
Producer
risk
gender 0.0604 -0.135
(0.103) (0.14300)
Number of
hectares 0.149***
-0.123***
(0.02590) (0.04120)
Keint -0.000357 -0.00205
(0.000486) (0.00081)
Keitt 0.00283*** 0.00165
(0.000567) (0.00115)
Nombre of plants -0.00095* 0.000840
(0.00049) (0.000651)
Production 0.0452*** -0.00682
(0.00505) (0.00636)
Technology 0.0665 0.0828
(0.06450) (0.09330)
Cost_Tech -1.65E-06 -7.99E-06
(-0.0000053) (0.000013)
Year2013 -0.03040 0.00540
(0.07640) (0.10700)
Year2014 -0.0540 0.00723
(0.07650) (0.107)
Constant 11.10*** 8.77***
(0.12100) (0.173)
Observations 873 663
R-squared 0.324 0.026 Standard error in parentheses *** p<0.01, ** p<0.05, * p<0.1
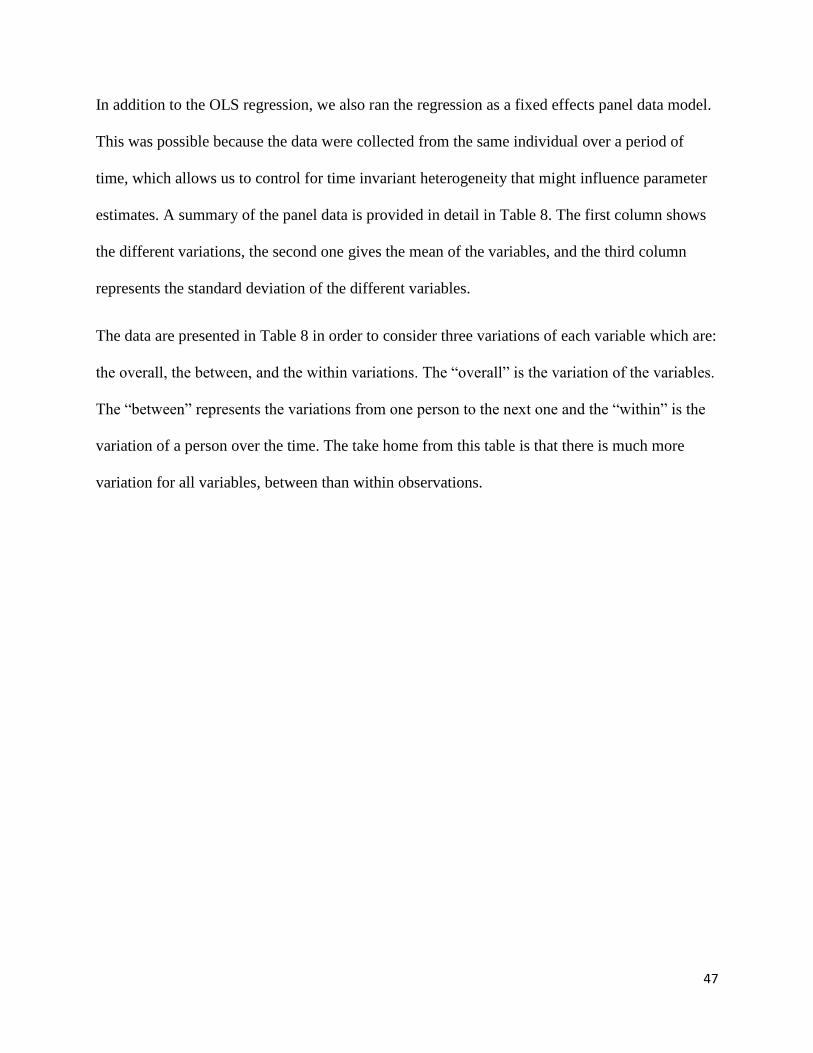
47
In addition to the OLS regression, we also ran the regression as a fixed effects panel data model.
This was possible because the data were collected from the same individual over a period of
time, which allows us to control for time invariant heterogeneity that might influence parameter
estimates. A summary of the panel data is provided in detail in Table 8. The first column shows
the different variations, the second one gives the mean of the variables, and the third column
represents the standard deviation of the different variables.
The data are presented in Table 8 in order to consider three variations of each variable which are:
the overall, the between, and the within variations. The “overall” is the variation of the variables.
The “between” represents the variations from one person to the next one and the “within” is the
variation of a person over the time. The take home from this table is that there is much more
variation for all variables, between than within observations.
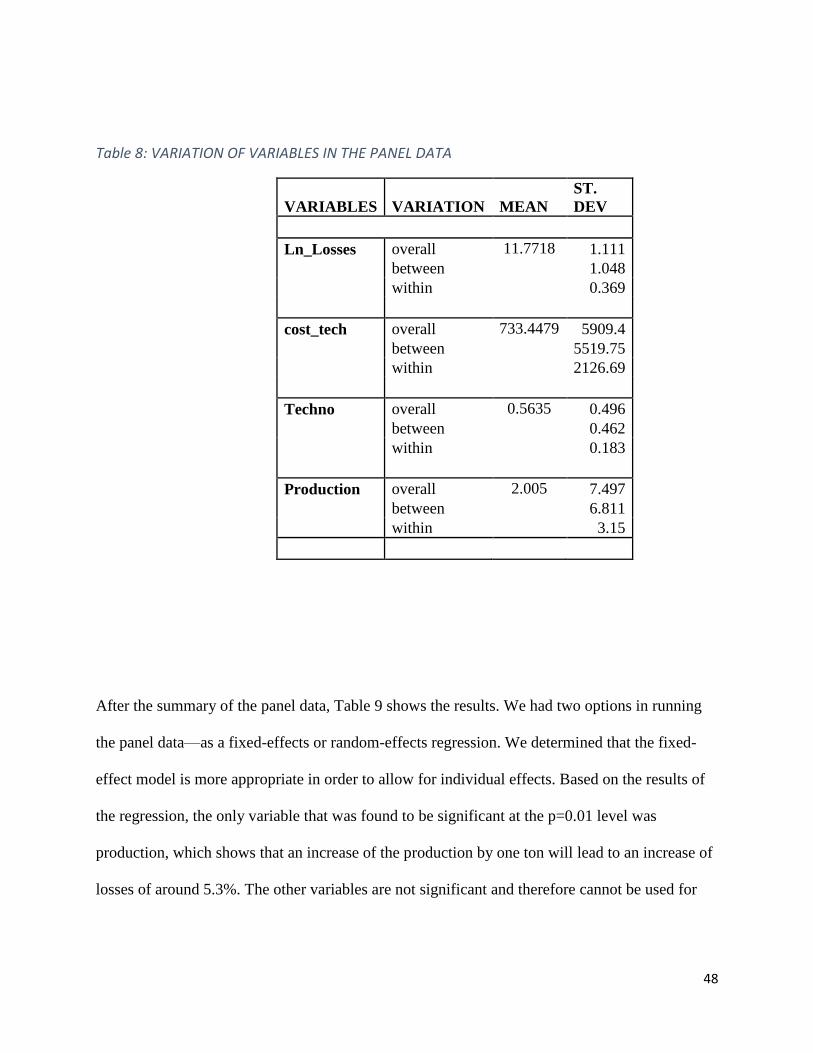
48
Table 8: VARIATION OF VARIABLES IN THE PANEL DATA
After the summary of the panel data, Table 9 shows the results. We had two options in running
the panel data—as a fixed-effects or random-effects regression. We determined that the fixed-
effect model is more appropriate in order to allow for individual effects. Based on the results of
the regression, the only variable that was found to be significant at the p=0.01 level was
production, which shows that an increase of the production by one ton will lead to an increase of
losses of around 5.3%. The other variables are not significant and therefore cannot be used for
VARIABLES VARIATION MEAN
ST.
DEV
Ln_Losses overall 11.7718 1.111
between 1.048
within 0.369
cost_tech overall 733.4479 5909.4
between 5519.75
within 2126.69
Techno overall 0.5635 0.496
between 0.462
within 0.183
Production overall 2.005 7.497
between 6.811
within 3.15
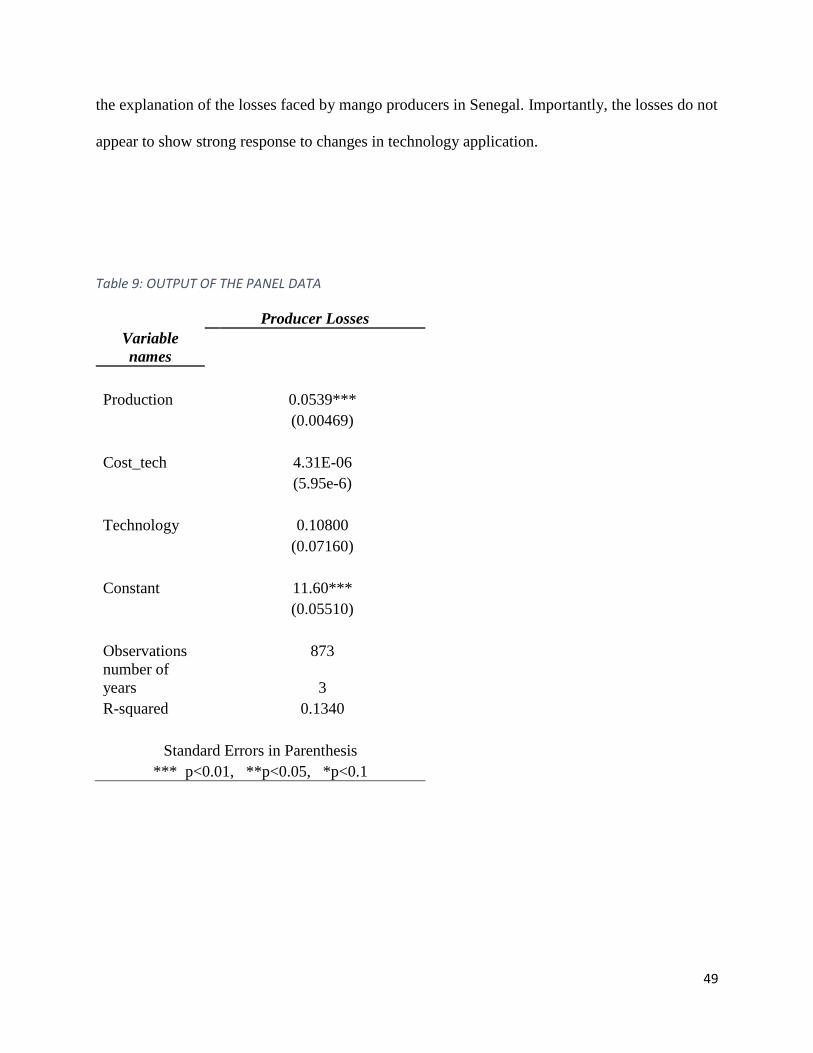
49
the explanation of the losses faced by mango producers in Senegal. Importantly, the losses do not
appear to show strong response to changes in technology application.
Table 9: OUTPUT OF THE PANEL DATA
Producer Losses
Variable
names
Production 0.0539***
(0.00469)
Cost_tech 4.31E-06
(5.95e-6)
Technology 0.10800
(0.07160)
Constant 11.60***
(0.05510)
Observations 873
number of
years 3
R-squared 0.1340
Standard Errors in Parenthesis
*** p<0.01, **p<0.05, *p<0.1
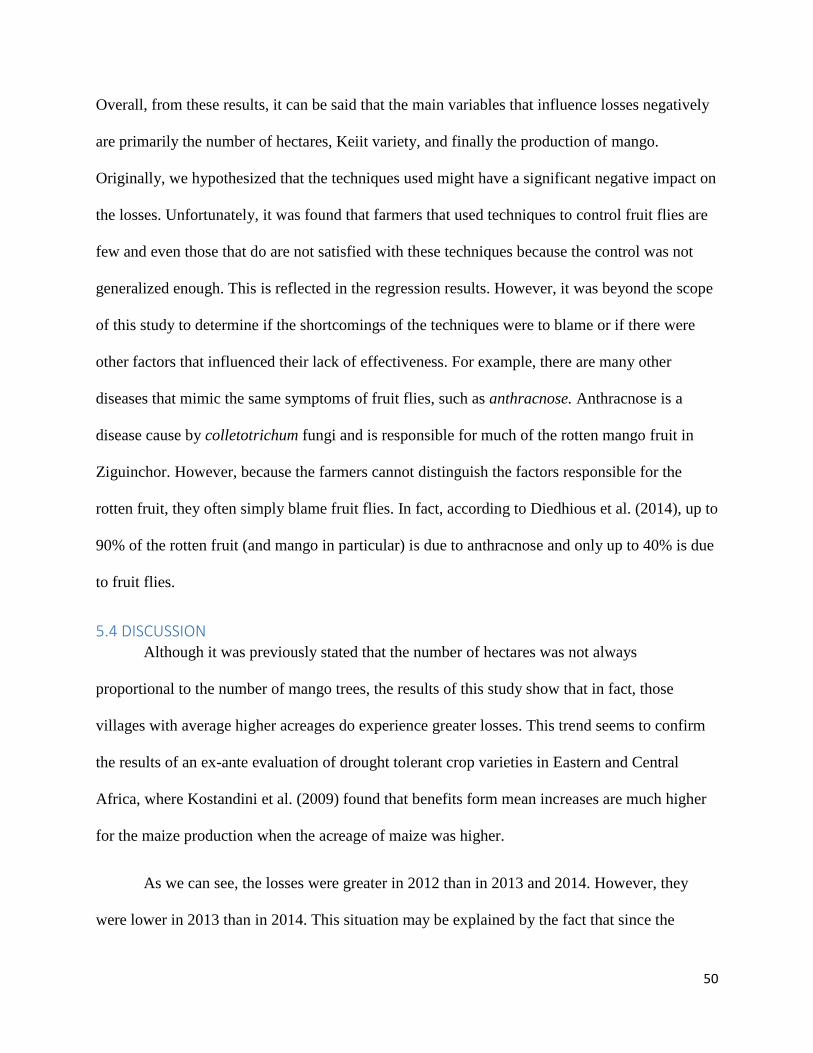
50
Overall, from these results, it can be said that the main variables that influence losses negatively
are primarily the number of hectares, Keiit variety, and finally the production of mango.
Originally, we hypothesized that the techniques used might have a significant negative impact on
the losses. Unfortunately, it was found that farmers that used techniques to control fruit flies are
few and even those that do are not satisfied with these techniques because the control was not
generalized enough. This is reflected in the regression results. However, it was beyond the scope
of this study to determine if the shortcomings of the techniques were to blame or if there were
other factors that influenced their lack of effectiveness. For example, there are many other
diseases that mimic the same symptoms of fruit flies, such as anthracnose. Anthracnose is a
disease cause by colletotrichum fungi and is responsible for much of the rotten mango fruit in
Ziguinchor. However, because the farmers cannot distinguish the factors responsible for the
rotten fruit, they often simply blame fruit flies. In fact, according to Diedhious et al. (2014), up to
90% of the rotten fruit (and mango in particular) is due to anthracnose and only up to 40% is due
to fruit flies.
5.4 DISCUSSION Although it was previously stated that the number of hectares was not always
proportional to the number of mango trees, the results of this study show that in fact, those
villages with average higher acreages do experience greater losses. This trend seems to confirm
the results of an ex-ante evaluation of drought tolerant crop varieties in Eastern and Central
Africa, where Kostandini et al. (2009) found that benefits form mean increases are much higher
for the maize production when the acreage of maize was higher.
As we can see, the losses were greater in 2012 than in 2013 and 2014. However, they
were lower in 2013 than in 2014. This situation may be explained by the fact that since the
51
appearance of fruit fly in Senegal in 2004, farmers or producers did not have efficient methods to
control fruit fly infestations, causing losses each year to be inconsistent. In fact, during the
interviews, some of the producers were not aware of what other causes may be contributing to
the destruction of mango production. In general, they also mentioned that the only new element
that has been noticed within the last years are the flies. In almost all parts of the country, fruit fly
infestation is likely to result in higher averages of losses. Moreover, farmers that suffer from
losses are the ones with high production. So, the results of this study suggest that the greater the
production is, the greater the losses are. As it was shown in the regression, the Keitt variety tends
to increase losses as well. In fact, according to Ndiaye et al. (2008), the population of fruit fly is
more pronounced at the peak of the rainy season (June –August). Keiit mango are late season
variety cultivars (Vayssieres et al, 2009). Therefore, it will be evident that when there is a high
mango production with Keitt variety, the losses are going to became greater because the
proliferation and fruit fly infestation will match with the maturation of that variety.
External efforts by the Senegalese government may also be contributing to the variation
in losses from year to year. In 2012, the Direction de la Protection de Vegetaux (DVP ‒ Plant
Protection Directorate) in Senegal conducted an experiment on the effectiveness of the BAT and
MAT pest control in the south in Ziguinchor. They chose several different zones of mango
production in order to conduct their experiment. They implemented combined BAT and MAT
efforts in selected orchards. Thus, the following year, in those orchards where the methods were
implemented, the farmers and producers noticed a net decrease of losses compared to the
previous years—and especial compared to the losses from 2012. One main point of the trial is
that farmers only had to pay a cost of 100 FCFA (equivalent to US$0.17) to be included. This
means that the trial of the application of these methods at the time had a very low cost, and

52
increased the number of orchards who could participate. The experiment ended and DPV set up a
cost for farmers to purchase BAT and MAT techniques for the following years.
However, for this study and according to the survey, the results suggest that control
technologies are not particularly effective in reducing losses. The expectations would be to have
a negative relationship between technologies and losses. As reported by other studies, techniques
like MAT and BAT technologies are efficient in controlling fruit fly infestation in some
countries—but it is not the case in the south of Senegal and especially not in Ziguinchor. For
instance, in Pakistan it was found that MAT protected mango orchards at a rate of 100% (or 0%
infestation of orchards that are not protected against 9% fruit fly infestation for unprotected
orchard) (Stonehouse et al. ,2001). As another example, a study was conducted in northern
Senegal to compare the effectiveness of the home-made BAT implanted in the village of Notto
and methyl eugenol used for the MAT in the village of Niague, 6km away. The results of the
study showed that the BAT technique was able to control up to 83% of the flies in Notto.
However, a combination of these two technique might prove to be even more efficient (M.
Ndiaye et al., 2008).
However, it may be that the effort to use these techniques to control fruit fly infestation is
not enough in southern Senegal. As other studies have indicated, the number of fruit flies was not
reduced at the level to stop proliferation. In fact, a study conducted in Okinawa Island, Japan
mentioned that until the number of male flies caught in monitor traps was reduced to 1/100 of
that before control, there was no detectable reduction in infestation level of host fruits (Koyama
et al., 1984). Another aspect of the losses is that the control of fruit fly infestation was not
generalized. In fact, in the same region having treated areas and non-treated areas is not an
efficient way to control fruit flies. As stipulated earlier, 90% of mango farmers in Senegal are
53
small producers. Thus, their mango production is primarily intended for domestic consumption.
The willingness of farmers to continue to DPV method was low because the costs set up by DPV
made the control technology unaffordable to farmers. As we can see from the results of the data,
losses increased again in 2014 because of lack of treatment.The IPM do not have any effects on
this project. Thus the surpluses of producers and consumers will not be developed in this part of
the paper because they do not have significance.
54
CHAPTER VI CONCLUSION The mango is an important fruit for rural areas and is an important source of income for
farmers particularly in southern Senegal. However, mango producers in that area are facing a
multitude of problems, among the most significant of which is fruit fly infestation. Fruit flies are
a serious pest in Senegal because they cause terrible losses at the farm level. In fact, the results of
this study suggest that the average income loss due to fruit fly is about 17.09% of the average
household income of one person in Ziguinchor.
This study shows that main source of losses come from the mean losses compared to the
risk losses due to the variability of the production. In fact, the variance losses for each year is
represents only 2% of the total losses. The results also suggest that fruit fly infestation can be an
important part of the losses among producers, especially for mean losses in Ziguinchor
(Casamance). The results suggest that villages facing higher loss are typically the ones with high
average acreage, but they also have a high density of plants and use the Keitt variety of mango.
Over the last few years, the Senegalese government has been promoting an intensification
of the value chain of mango due to the growth of this sector. In fact, as previously mentioned, the
production of mango has increased significantly. However, this study suggests that losses
increase with the intensification of the production. In other words, the greater the production, the
greater the losses. With no-control of fruit fly infestation, losses will always be greater with the
intensification of the production in this sector. Thus, methods should be used to control fruit fly
infestation if the sector is to intensify production
There are several ways to control fruit fly infestation in Senegal (e.g. BAT, MAT, and
sometimes mystical ways). However, from our study, we found that those control techniques do
not appear to be important in controlling fruit fly infestation in Ziguinchor; based on the survey,
55
control techniques are not significant. In other part of Senegal, like northern Senegal, these
techniques do seem to be effective in controlling fruit fly infestation.
There are several policies that should be taken in account. In fact, the study conducted by
the DPV was only done in some areas and not made available to the whole region of Ziguinchor
(Casamance). Therefore, these techniques might not efficient because the fruit fly infestation in
unprotected areas might continue to affect protected farms. In order to be efficient in terms of
controlling fruit fly infestations, a collective action of decision makers and farmers is needed.
The fight should be a common fight, not only a fight that should be done in certain areas.
Finally, there are several limitations for this study. One important characteristic of the
data is that much of the information collected was based primarily on the subjective recall of the
individuals that were surveyed. The technique that was used to help producers recall productions
was to give them a threshold (e.g. the year when they produced the most) and get them to recall
the productions of other years based on the threshold year. Another section of this survey asked
about the different techniques used to control the infestation of fruit flies and the cost with
respect to techniques (see Appendix for the survey instruments).
Another limitation of this method is that there may also have been bias in the responses
of the producers. For example, some of the producers may not have relayed completely accurate
information regarding income because they thought that we were some type of tax agent. Others
may have had the idea that we were an aid organization and hoped that, by giving biased data,
they would be part of some program and would benefit from an intervention and/or funds. These
response biases among others could have potentially affected our estimates in terms of
underestimating or overestimation the impact of fruit flies on mango.
56
As a final limitation of this study, we used the average price of mango. In the future, it
would be more interesting if we studied losses based on the price of each variety. In fact, Keitt
and Kent varieties are more valuable than the local varieties. Therefore, using a common price
would not reflect the real losses faced by farmers having more Keitt or Kent varieties than local
varieties.

57
BIBLIOGRAPHY
Alston, J. M., Norton, G. W., & Pardey, P. G. (1995). Science under scarcity.CAB International.
Wallingford, Oxon, UK.
Allwood, A. J., Vueti, E. T., Leblanc, L., & Bull, R. (2002). Eradication of introduced
Bactrocera species (Diptera: Tephritidae) in Nauru using male annihilation and protein
bait application techniques. Veitch, CR and MN Clout. Turning the tide: the eradication
of invasive species. IUCN Species Specialist Group. IUCN, Gland Switzerland and
Cambridge, UK (see http://www. issg. org/Eradicat. html), 19-25.
ANDS, ESPS_2, 2011, Enquete de suivi de la pauvrete au Senegal.
Bennett, R. M., Ismael, Y., Kambhampati, U., & Morse, S. (2005). Economic impact of
genetically modified cotton in India. AgBioForum, 7, 23-26.
Birkhaeuser, D., Evenson, R. E., & Feder, G. (1991). The economic impact of agricultural
extension: A review. Economic Development and Cultural Change, 39(3), 607-650.
Boys, K., M. Faye, J. Fulton, and J. Lowenberg-DeBoer. (2007). The economic impact of
cowpea research in Senegal: an ex post analysis with disadoption. Agricultural
Economics, 36(3), 363-375.
Clarke, A. R., Armstrong, K. F., Carmichael, A. E., Milne, J. R., Raghu, S., Roderick, G. K.,
Yeates, D. K. (2005). Invasive phytophagous pests arising through a recent tropical
evolutionary radiation: The Bactrocera dorsalis complex of fruit flies. Annual Review of
Entomology, 50, 293-319.
Coleman, J. R., & Jones, C. (1992). Measuring welfare changes from commodity price
stabilization in small open economies. International Economics Department, the World
Bank.
Currie, J. M., Murphy, J. A., & Schmitz, A. (1971). The concept of economic surplus and its use
in economic analysis. The Economic Journal, 81(324), 741-799.
De Groote, H. (2002). Maize yield losses from stemborers in Kenya.International Journal of
Tropical Insect Science, 22(02), 89-96.
Diouf, Omar. (2009). Project “Increasing incomes and food security of small farmers in West
and Central Africa through exports of organic and fair-trade tropical products.”
GCP/RAF/404/GER.
Drew, R. A. I., Tsuruta, K., & White, I. M. (2005) A new species of pest fruit fly (Diptera:
Tephritidae: Dacinae) from Sri Lanka and Africa. African Entomology, 13, 149-154.

58
Ekesi, S., & Billah, M. K. (2006). A field guide to the management of economically important
tephritid fruit flies in Africa. Nairobi: ICIPE Science Press.
Ekesi, S., Nderitu, P. W., & Rwomushana, I. (2006). Field infestation, life history and
demographic parameters of the fruit fly Bactrocera invadens (Diptera: Tephritidae) in
Africa. Bulletin of entomological research, 96(04), 379-386.
Follett, P. A., & L. G. Neven. (2006). Current trends in quarantine entomology. Annual Review
of Entomology, 51, 359-385.
Frank, R., Braun, H. E., Ripley, B. D., & Clegg, B. S. (1990). Contamination of rural ponds with
pesticide, 1971–85, Ontario, Canada. Bulletin of Environmental Contamination and
Toxicology, 44, 401-409.
González, A. (2014). Amélioration de la compétitivité de la mangue Sénégalaise. Speech,
International Trade Centre. Accessed 31 May 2016,
http://www.intracen.org/news/Amelioration-de-la-competitivite-de-la-mangue-
Senegalaise/.
Heisey, P. W., & Morris, M. L. (2006). Economic impact of water-limited conditions on cereal
grain production. Drought adaptation in cereals. Haworth Press Inc, Binghampton, 17-
48. Heisey, P. W., & Morris, M. L. (2006). Economic impact of water-limited conditions
on cereal grain production. Drought adaptation in cereals. Haworth Press Inc,
Binghampton, 17-48.
Harrison, G. W., Humphrey, S. J., & Verschoor, A. (2010). Choice under uncertainty: evidence
from Ethiopia, India and Uganda*. The Economic Journal, 120(543), 80-104.
Charness, G., & Viceisza, A. (2012). Comprehension and risk elicitation in the field: Evidence
from rural Senegal. Available at https://ideas.repec.org/p/fpr/ifprid/1135
Josling, T., Roberts, D., & Orden, D. (2003). Food regulation and trade: Towards a safe and
open global system. Washington, D.C.: Institute for International Economics.
Kabubo-Mariara, J., & Karanja, F. K. (2007). The economic impact of climate change on
Kenyan crop agriculture: A Ricardian approach. Global and Planetary Change, 57(3),
319-330.
Kostandini, G., Mills, B., & Mykerezi, E. (2011). Ex Ante Evaluation of Drought‐Tolerant
Varieties in Eastern and Central Africa. Journal of Agricultural Economics, 62(1), 172-
206.
Koyama, J., Teruya, T., & Tanaka, K. (1984). Eradication of the oriental fruit fly (Diptera:
Tephritidae) from the Okinawa Islands by a male annihilation method. Journal of
Economic Entomology, 77(2), 468-472.
59
Kristjanson, P. M., Swallow, B. M., Rowlands, G. J., Kruska, R. L., & De Leeuw, P. N. (1999).
Measuring the costs of African animal trypanosomosis, the potential benefits of control
and returns to research. Agricultural Systems, 59(1), 79-98.
Laajimi, Abderraouf, et al. "Analyzing supply response of fruit tree products in Tunisia: The case
of peaches." Agricultural Economics Review 9.1 (2008): 24.
Lux, S. A., Copeland, R. S., White, I. M., Manrakhan, A. & Billah, M. K. (2003). A new
invasive fruit fly species from the Bactrocera dorsalis (Hendel) group detected in East
Africa. Insect Science and its Application, 23, 355-360.
Leroux, M., & Sagna, P. (2000). Le climat. Jeune Afrique, 16-19.
Matthews, G., Wiles, T. & Baleguel, P. (2003). A survey of pesticide application in Cameroon.
Crop Protection, 22, 707-714.
Marwat, N.K., Hussain, N. and Khan, A. (l992). Suppression of infestation. FAO Expert
Consultation on Progress and Problems Dams spp. by male annihilation in guava orchard.
I’akistat, J. Zool.
Mohyuddin, A.I. and Mahmood, R. (1993) Integrated control of mango pests in Pakistan. Acta
Horticuh. 341, 467.
Mills, B. (Ed.). (1998). Agricultural research priority setting: information investments for
improved use of resources (No. C033. 037). International Service for National
Agricultural Research.
Mills, B., & Kamau, M. (1998). Methods for prioritizing research options. Agricultural research
priority setting: Information investments for improved use of resources. International
Service for National Agricultural Research (ISNAR), The Hague, NL, 53-69.
Mwatawala, M. W., White, I. M., Maerere, A. P., Senkondo, F. J. & De Meyer, M. (2004). A
new invasive Bactrocera species (Diptera: Tephritidae) in Tanzania. African Entomology,
12, 154-156.
Naseem, A., & Singla, R. (2013). Ex Ante Economic Impact Analysis of Novel Traits in
Canola. Journal of Agricultural and Resource Economics,38(2), 248-268.
Ndiaye, M., Dieng, E. O., & Delhove, G. (2008). Population dynamics and on-farm fruit fly
integrated pest management in mango orchards in the natural area of Niayes in Senegal.
Pest Management in Horticultural Ecosystems, 14(1), 1-8.
Ndiaye, O., Vayssières, J. F., Rey, J. Y., & Diatta, P. (2012). Seasonality and range of fruit fly
(Diptera: Tephritidae) host plants in orchards in Niayes and the Thiès Plateau (Senegal).
Fruits, 67, 311-333.

60
Ndzana Abanda F. X., Quilici S., Vayssières J.-F., Kouodiekong L., Woin N. (2008). Inventaire
des espèces de mouches des fruits sur goyave dans la région de Yaoundé au
Cameroun. Fruits, 63, 19-26.
Newbery, D. M., & Stiglitz, J. E. (1981). The theory of commodity price stabilization; a study in
the economics of risk.
Norton, G. W., & Mullen, J. (1994). Economic evaluation of integrated pest management
programs: A literature review. Blacksburg: Virginia Cooperative Extension.
Oerke, E. C. (2006). Crop losses to pests. Journal of Agricultural Science, 144, 31-43.
Pimentel, D., Zuniga, R., & Morrison, D. (2005). “Update on the environmental and economic
costs associated with alien-invasive species in the United States.” Ecological Economics,
52, 273-288.
Rwomushana, I., Ekesi, S., Gordon, I., & Ogol, C. (2008). Host plants and hosts plant preference
studies for Bactrocera invadens (Diptera: Tephritidae) in Kenya, a new invasive fruit fly
species in Africa. Annals of Entomological Society of America, 101, 331-340.
Stonehouse, J., Mahmood, R., Poswal, A., Mumford, J., Baloch, K. N., Chaudhary, Z. M., ... &
Huggett, D. (2002). Farm field assessments of fruit flies (Diptera: Tephritidae) in
Pakistan: distribution, damage and control. Crop Protection, 21(8), 661-669.
Thompson, A. K. (1996). Post-harvest technology of fruit and vegetables. Blackwill Science,
LtdVayssières, J. F., Vannière, H., Barry, O., Hanne, A. M., Korie, S., Niassy, A., ... &
Delhove, G. (2011). Preliminary inventory of fruit fly species (Diptera, Tephritidae) in
mango orchards in the Niayes region, Senegal, in 2004. Fruits, 66(02), 91-107.
Togola, A., Seck, P. A., Glitho, I. A., Diagne, A., Adda, C., Toure, A., & Nwilene, F. E. (2013).
Economic losses from insect pest infestation on rice stored on-farm in Benin. Journal of
Applied Sciences, 13(2), 278.
Yesuf, M., & Bluffstone, R. A. (2009). Poverty, risk aversion, and path dependence in low-
income countries: Experimental evidence from Ethiopia.American Journal of
Agricultural Economics, 91(4), 1022-1037.

61
APPENDIX
BASELINE SURVEY FOR PRODUCERS
Interview Questionnaire #___________
1. Household Number: __________________________________________
2. Respondent’s Name: __________________________________________
3. Gender: M F
4. Village ___________________________________________________
5. Interviewer ______________________________________________________
6. Date of Interview __________________________________________________________
7. GPS references
Latitude: _______________ Longitude: _________________ Altitude________________
8. How many hectares have your plantation? _______________________________________
9. How many trees do you have in your plantation? ____________________________________
10. How many of those trees are producing?
What are those varieties that are grown in this orchard?
Kent Keitt local varieties others
11. What is the number of trees for each variety?
Kent ___________________________
Keitt _____________________________
Local varieties __________________________
Other _______________________________
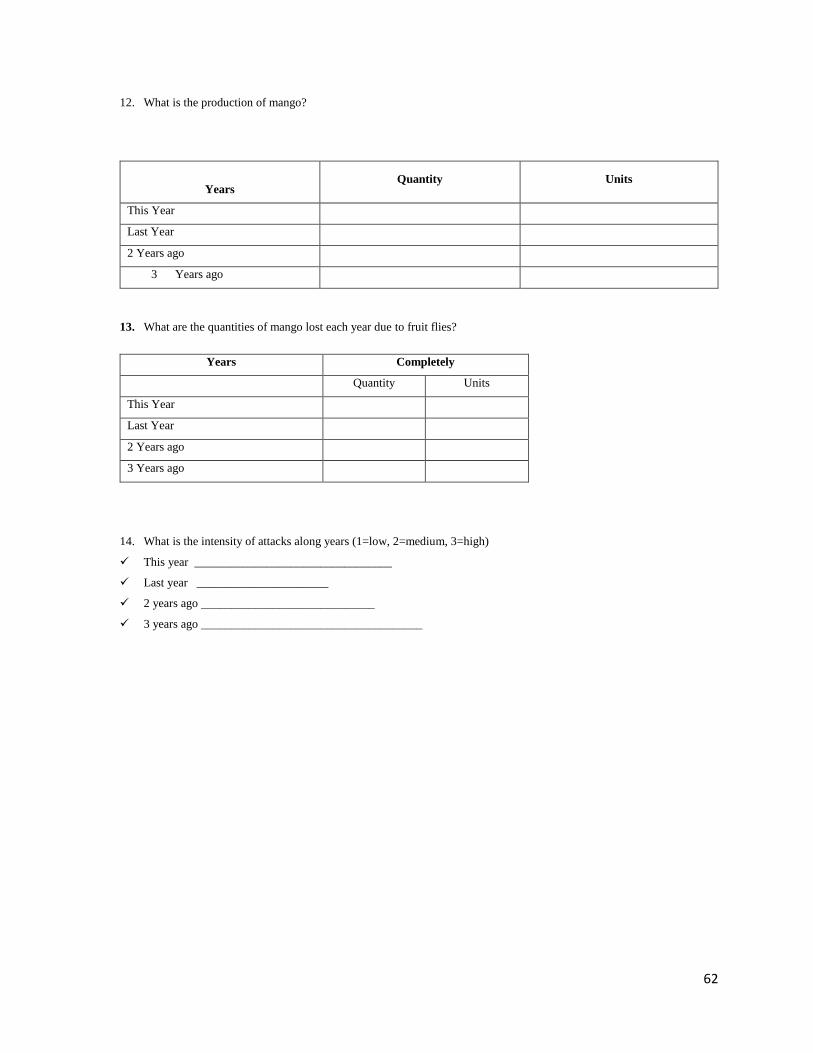
62
12. What is the production of mango?
Years Quantity Units
This Year
Last Year
2 Years ago
3 Years ago
13. What are the quantities of mango lost each year due to fruit flies?
Years Completely
Quantity Units
This Year
Last Year
2 Years ago
3 Years ago
14. What is the intensity of attacks along years (1=low, 2=medium, 3=high)
This year _________________________________
Last year ______________________
2 years ago _____________________________
3 years ago _____________________________________

63
15. What do you do when there is attack of fruit flies?
This year :_________________________________________________________________
Last year: __________________________________________________________________
2 years ago________________________________________________________________
3 years ago: ___________________________________________________________________
16. What is you estimated gain due to each techniques
Technics Percent of fruits gained Cost
17. What is the price of mangos estimated to be good and to be deteriorated but can be sold?
YEARS HEALTHY
Price Units
Recommended