Jean-Bernard CaenDEXIA Head of Economic Capital and Strategy
Ariel, March 19, 2009
Economic Capital: A Coherent and Neutral Risk
Metrics for Assessing Performance
2 ©JB Caen 2009 & +
This document presents the point of view of its author, which may differ from DEXIA’s. It supports an oral
presentation and is incomplete without it. This support is
protected by copyright laws.
Disclaimer
3 ©JB Caen 2009 & +
The three parts of my presentation
1. The competing financial management frameworks
of Financial Institutions
2. Specific benefits of the Economic Capital framework
3. Implementation: The seven founding guidelines
4 ©JB Caen 2009 & +
The management of Financial Institutions is based
upon several competing frameworks
� Four competing frameworks
ACCOUNTING
REGULATORY
RATING AGENCIES
ECONOMIC
� Each framework has its own objective and underlying assumptions
� The Economic Framework is the widest and the more complex
● Meaning that it MAY provide a better representation of reality IF it canbe calibrated and fed with adequate data
● In the meantime, at least, it contributes asking the right questions, and notably it revisits the link between RISK, RETURN and CAPITAL
5 ©JB Caen 2009 & +
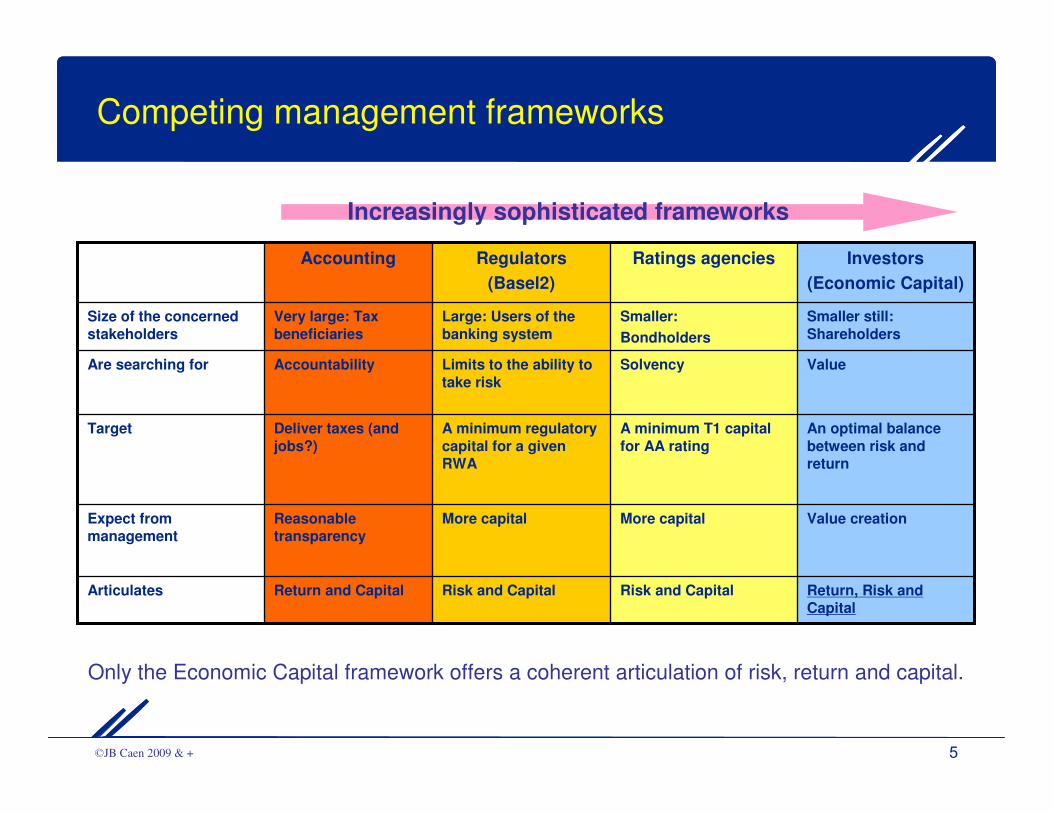
Competing management frameworks
Value creationMore capitalMore capitalReasonable transparency
Expect from management
Return, Risk and Capital
Risk and CapitalRisk and CapitalReturn and CapitalArticulates
Smaller still:
Shareholders
Smaller:
Bondholders
Large: Users of the
banking system
Very large: Tax
beneficiaries
Size of the concerned
stakeholders
Deliver taxes (and
jobs?)
Accountability
Accounting
An optimal balance
between risk and return
A minimum T1 capital
for AA rating
A minimum regulatory
capital for a given RWA
Target
ValueSolvencyLimits to the ability to
take risk
Are searching for
Investors
(Economic Capital)
Ratings agenciesRegulators
(Basel2)
Increasingly sophisticated frameworks
Only the Economic Capital framework offers a coherent articulation of risk, return and capital.
6 ©JB Caen 2009 & +
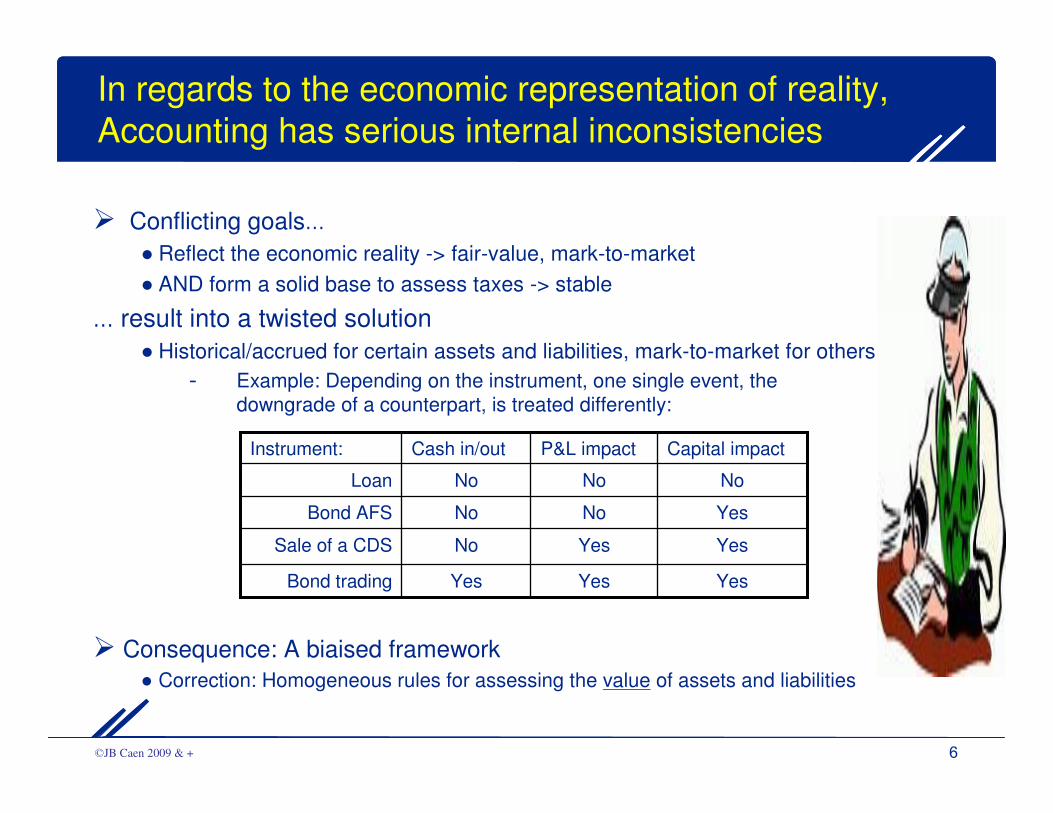
In regards to the economic representation of reality,
Accounting has serious internal inconsistencies
� Conflicting goals…
● Reflect the economic reality -> fair-value, mark-to-market
● AND form a solid base to assess taxes -> stable
… result into a twisted solution
● Historical/accrued for certain assets and liabilities, mark-to-market for others
- Example: Depending on the instrument, one single event, the
downgrade of a counterpart, is treated differently:
� Consequence: A biaised framework
● Correction: Homogeneous rules for assessing the value of assets and liabilities
Yes
Yes
No
No
P&L impact
YesYesBond trading
YesNoSale of a CDS
YesNoBond AFS
NoNoLoan
Capital impactCash in/outInstrument:
7 ©JB Caen 2009 & +
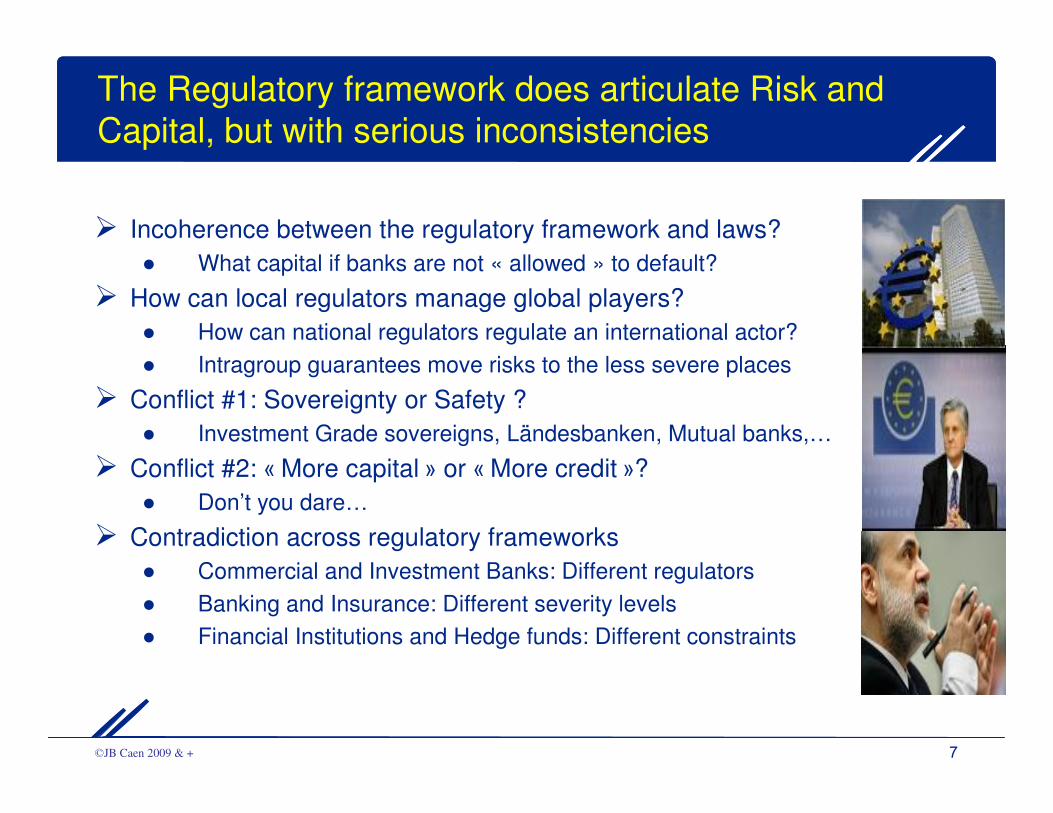
The Regulatory framework does articulate Risk and
Capital, but with serious inconsistencies
� Incoherence between the regulatory framework and laws?
● What capital if banks are not « allowed » to default?
� How can local regulators manage global players?
● How can national regulators regulate an international actor?
● Intragroup guarantees move risks to the less severe places
� Conflict #1: Sovereignty or Safety ?
● Investment Grade sovereigns, Ländesbanken, Mutual banks,…
� Conflict #2: « More capital » or « More credit »?
● Don’t you dare…
� Contradiction across regulatory frameworks
● Commercial and Investment Banks: Different regulators
● Banking and Insurance: Different severity levels
● Financial Institutions and Hedge funds: Different constraints
8 ©JB Caen 2009 & +
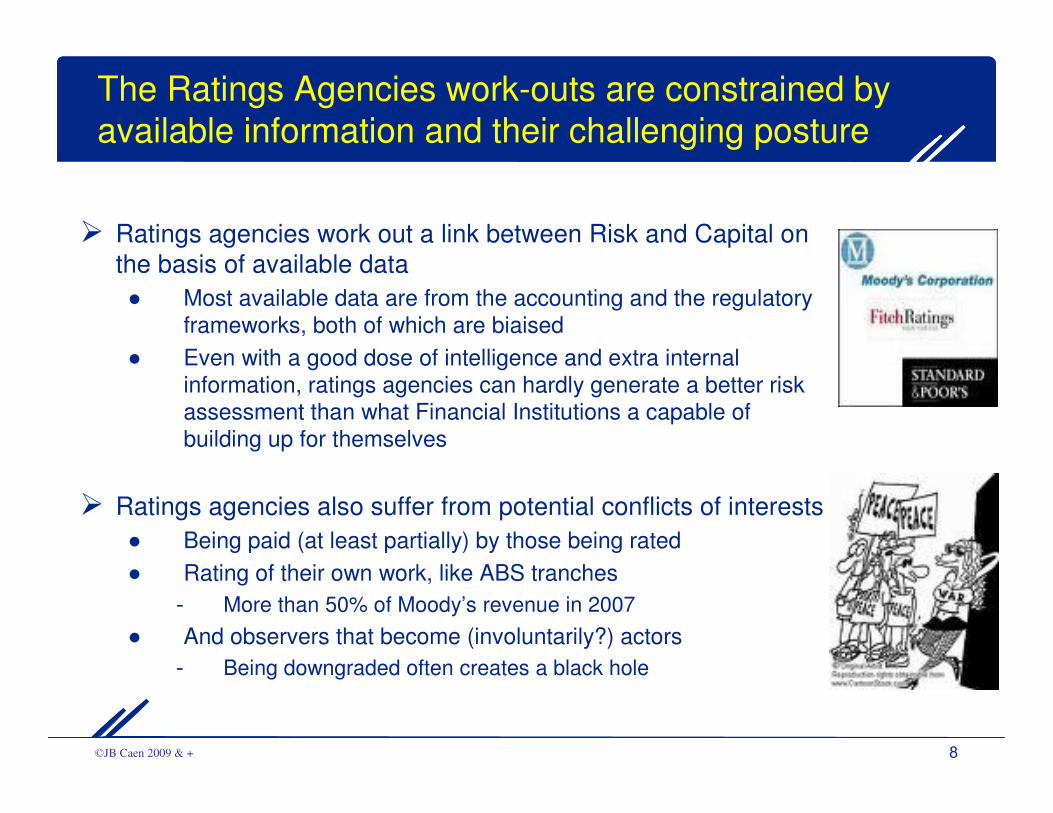
The Ratings Agencies work-outs are constrained by
available information and their challenging posture
� Ratings agencies work out a link between Risk and Capital on
the basis of available data
● Most available data are from the accounting and the regulatoryframeworks, both of which are biaised
● Even with a good dose of intelligence and extra internalinformation, ratings agencies can hardly generate a better riskassessment than what Financial Institutions a capable of building up for themselves
� Ratings agencies also suffer from potential conflicts of interests
● Being paid (at least partially) by those being rated
● Rating of their own work, like ABS tranches
- More than 50% of Moody’s revenue in 2007
● And observers that become (involuntarily?) actors
- Being downgraded often creates a black hole
9 ©JB Caen 2009 & +
There are currently two major risk metrics available
� Regulatory Capital is simple and applies to a restrictive perimeter
● Banking perimeter only
● Focused on well known risks; largely ignores less obvious risks
● Simplified models; for instance ignores concentrations
● Pro-cyclical by construction
� Economic Capital has a wider scope and depth but it requiresmodels and data that may not be available
● Consolidated rather than banking perimeter
● Aims at covering all risks
● Methodology that can identify concentration
- more data needed
● Through the cycle
10 ©JB Caen 2009 & +
What risk metric for management purposes?
� The regulatory framework can be understood as a minimum standard for
those enterprises that want to be recognised as a bank
● Prove the ability to classify and rate those who want to borrow money
� The economic framework is what each institution should build up to measure
and agregate all potential risks across all activities, as well as they can do
● Meaning all risks across all activities are to be identified
- Structured products, hidden obligations, pension funds,…
● Meaning using risk models AND knowing their limitations
- Constant volatility models; distribution assessment (binomial,…);
applicability (return to the mean FX different from IR);…
● Meaning the disposal of databases to describe reality
- Data definition, completeness, freshness, reliability
� Endogeneous risk assessment « confidence » remains quite limited
� Moment of truth:
ON WHICH RISKS ARE YOU READY TO BET YOUR CAPITAL?
11 ©JB Caen 2009 & +
Plan
1. The competing financial management frameworks
of Financial Institutions
2. Specific benefits of the Economic Capital framework
3. Implementation: The seven founding guidelines
12 ©JB Caen 2009 & +
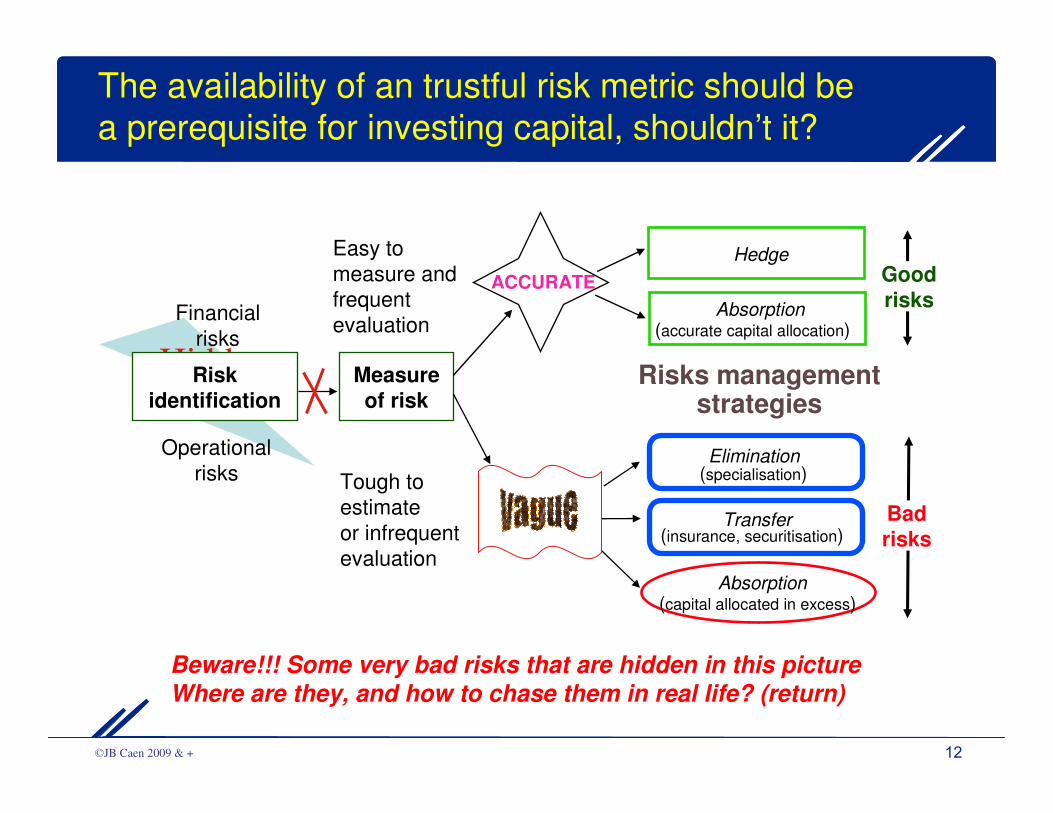
Hidden
risks
The availability of an trustful risk metric should be
a prerequisite for investing capital, shouldn’t it?
Measureof risk
Easy to
measure and
frequent
evaluation
Tough to
estimate
or infrequent
evaluation
Badrisks
GoodrisksAbsorption
(accurate capital allocation)
Transfer(insurance, securitisation)
Elimination(specialisation)
Hedge
Absorption(capital allocated in excess)
Riskidentification
Financial
risks
Operational
risks
Risks management strategies
ACCURATE
Beware!!! Some very bad risks that are hidden in this pictureWhere are they, and how to chase them in real life? (return)
13 ©JB Caen 2009 & +
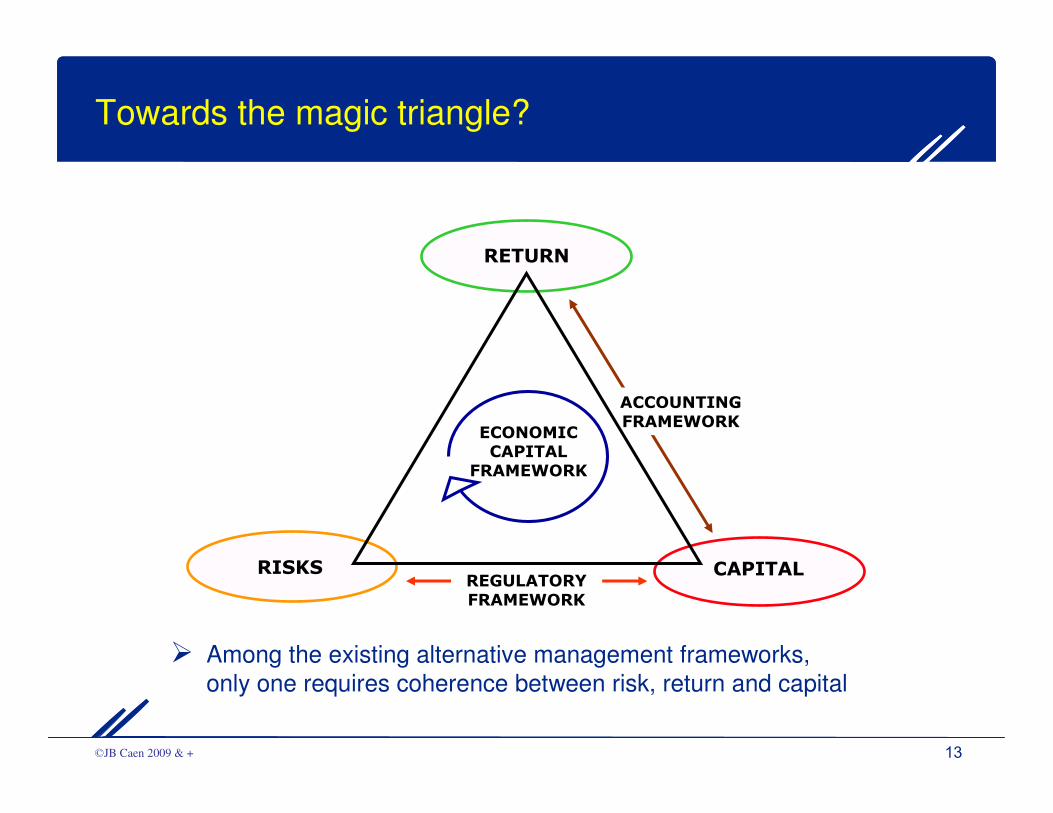
Towards the magic triangle?
� Among the existing alternative management frameworks,
only one requires coherence between risk, return and capital
CAPITAL
RETURN
RISKS
ECONOMIC CAPITAL
FRAMEWORK
ACCOUNTINGFRAMEWORK
REGULATORY FRAMEWORK
14 ©JB Caen 2009 & +
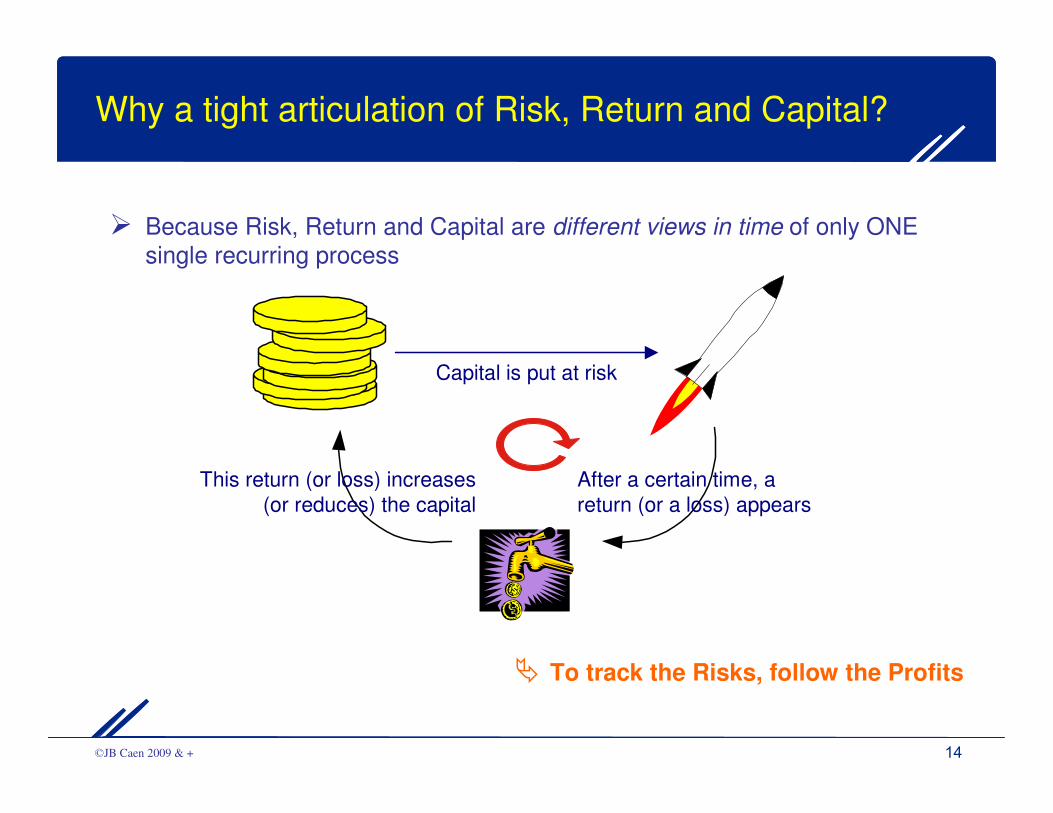
� Because Risk, Return and Capital are different views in time of only ONE
single recurring process
� To track the Risks, follow the Profits
Why a tight articulation of Risk, Return and Capital?
Capital is put at risk
After a certain time, a
return (or a loss) appears
This return (or loss) increases
(or reduces) the capital
15 ©JB Caen 2009 & +
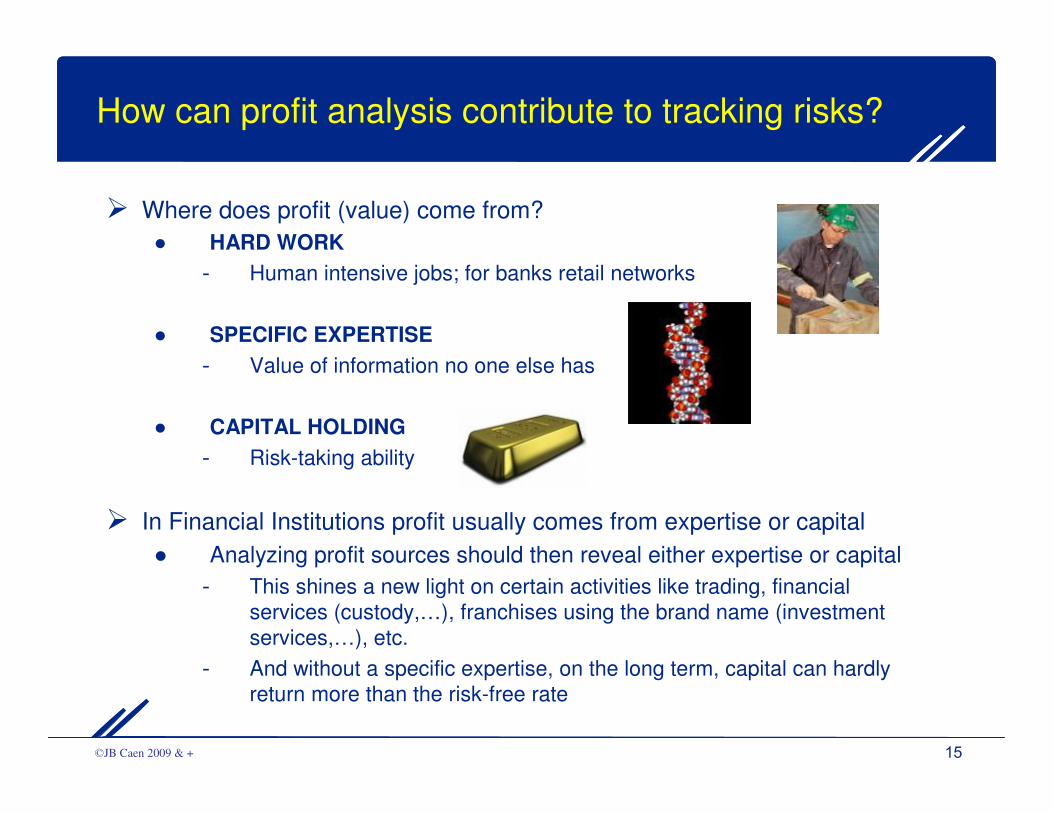
How can profit analysis contribute to tracking risks?
� Where does profit (value) come from?
● HARD WORK
- Human intensive jobs; for banks retail networks
● SPECIFIC EXPERTISE
- Value of information no one else has
● CAPITAL HOLDING
- Risk-taking ability
� In Financial Institutions profit usually comes from expertise or capital
● Analyzing profit sources should then reveal either expertise or capital
- This shines a new light on certain activities like trading, financial
services (custody,…), franchises using the brand name (investment
services,…), etc.
- And without a specific expertise, on the long term, capital can hardly
return more than the risk-free rate
16 ©JB Caen 2009 & +
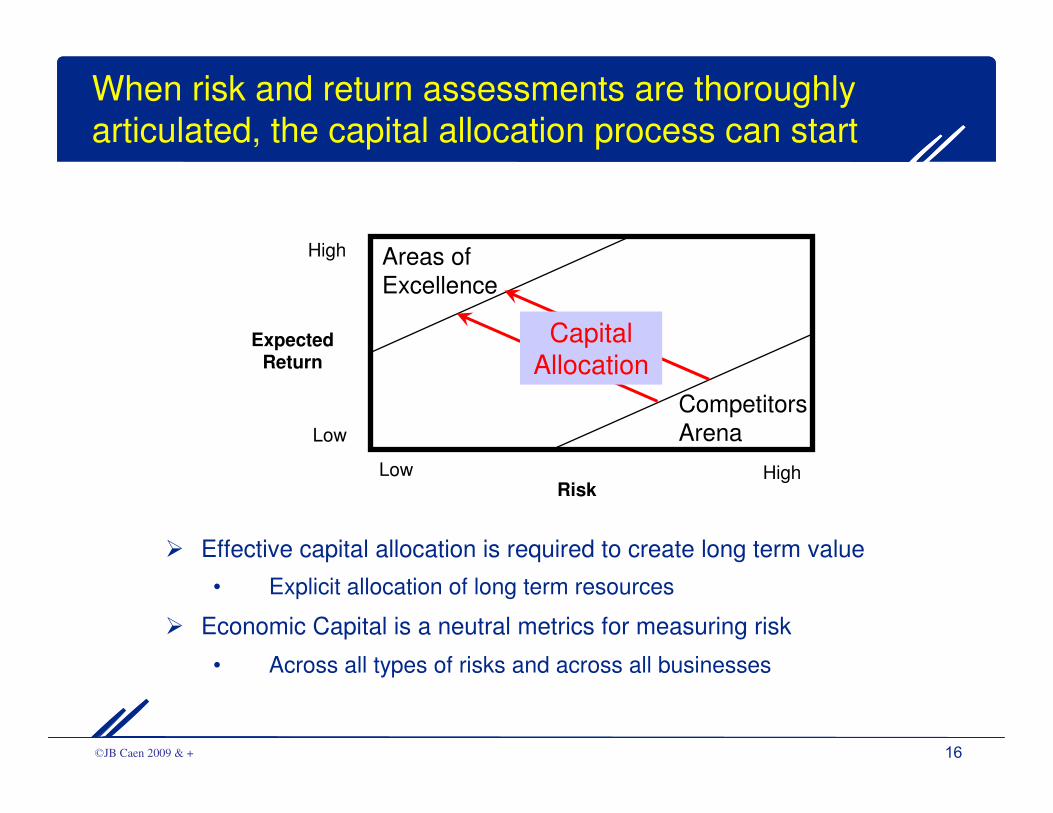
When risk and return assessments are thoroughly
articulated, the capital allocation process can start
High
Expected Return
Low
Areas of
Excellence
Competitors
Arena
HighLowRisk
CapitalAllocation
� Effective capital allocation is required to create long term value
• Explicit allocation of long term resources
� Economic Capital is a neutral metrics for measuring risk
• Across all types of risks and across all businesses
17 ©JB Caen 2009 & +
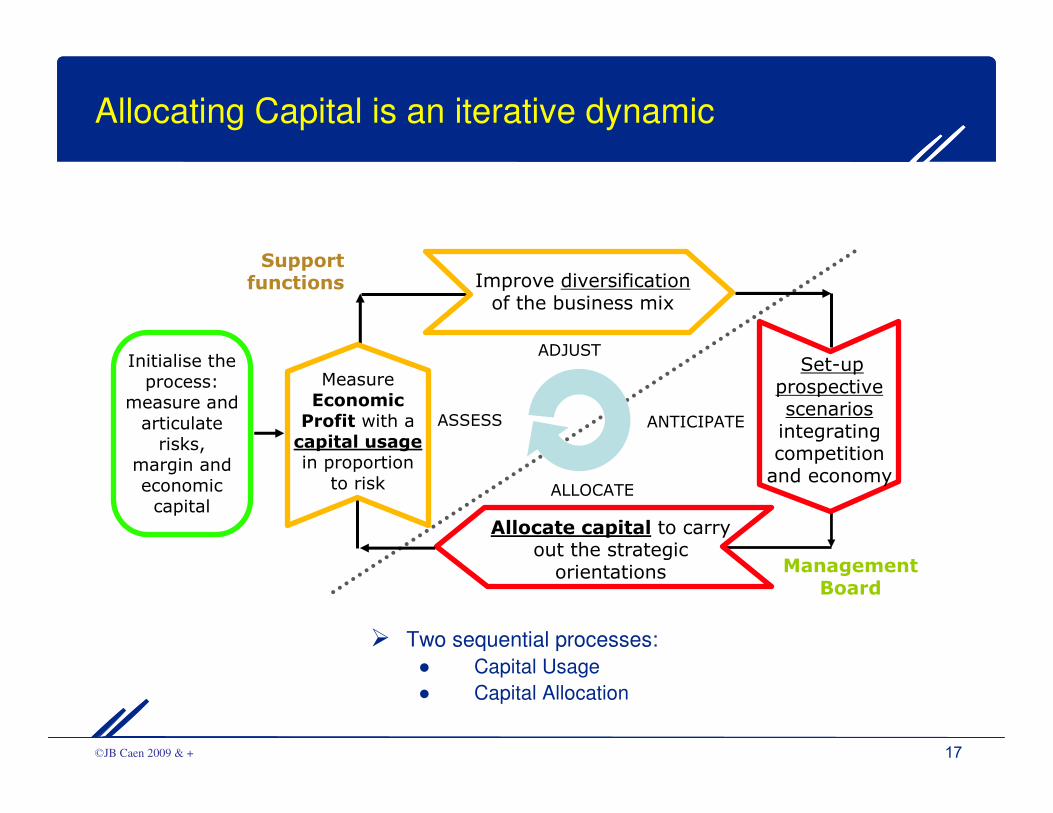
Allocating Capital is an iterative dynamic
� Two sequential processes:
● Capital Usage
● Capital Allocation
Initialise the process:
measure and
articulate risks,
margin andeconomic capital
Support functions
Management Board
ALLOCATE
Allocate capital to carry out the strategicorientations
Set-up prospective scenariosintegrating competition and economy
ANTICIPATE
ADJUST
ASSESS
Improve diversificationof the business mix
MeasureEconomic Profit with a capital usagein proportion
to risk
18 ©JB Caen 2009 & +
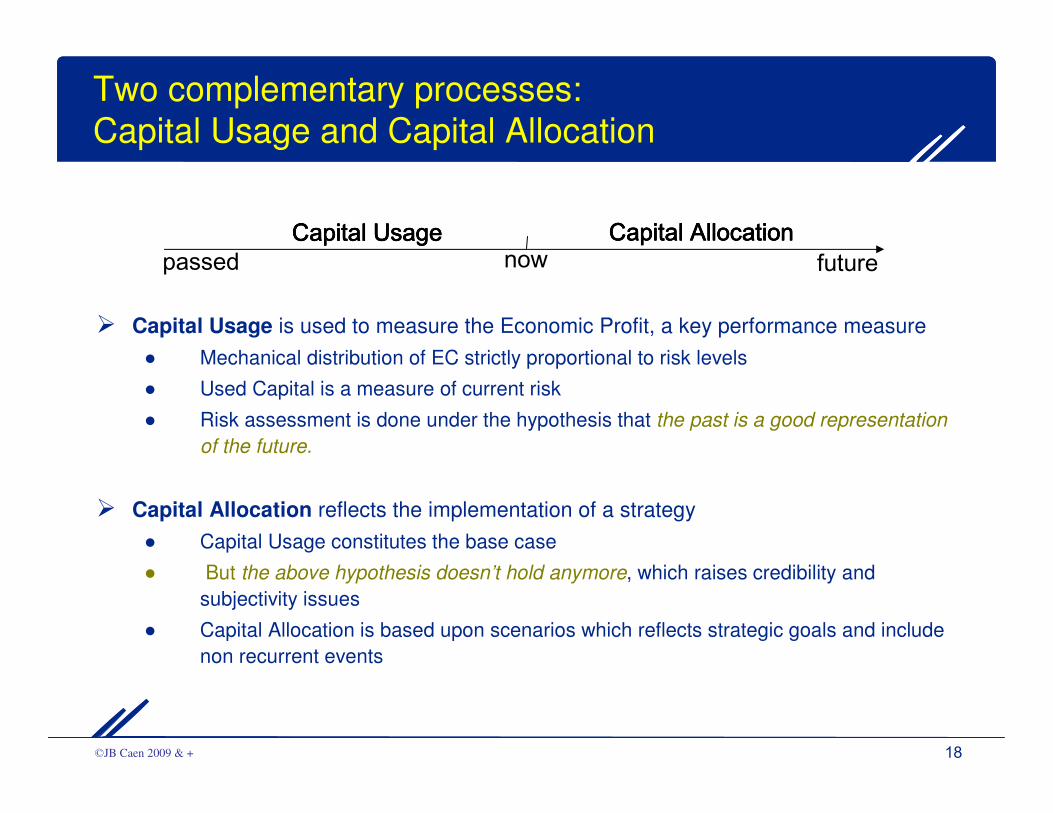
Two complementary processes:
Capital Usage and Capital Allocation
� Capital Usage is used to measure the Economic Profit, a key performance measure
● Mechanical distribution of EC strictly proportional to risk levels
● Used Capital is a measure of current risk
● Risk assessment is done under the hypothesis that the past is a good representation
of the future.
� Capital Allocation reflects the implementation of a strategy
● Capital Usage constitutes the base case
● But the above hypothesis doesn’t hold anymore, which raises credibility and
subjectivity issues
● Capital Allocation is based upon scenarios which reflects strategic goals and include
non recurrent events
passed futurenowCapital UsageCapital UsageCapital UsageCapital Usage Capital AllocationCapital AllocationCapital AllocationCapital Allocation
19 ©JB Caen 2009 & +
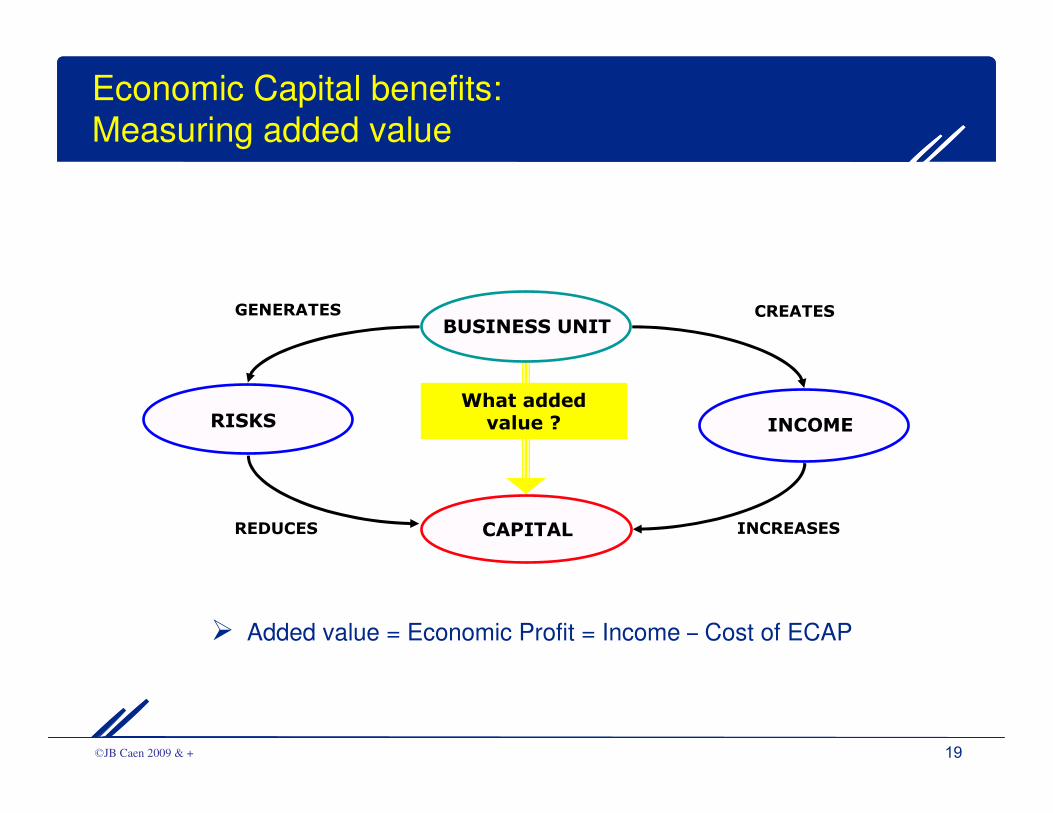
Economic Capital benefits:Measuring added value
� Added value = Economic Profit = Income – Cost of ECAP
What added value ?
INCREASESCAPITALREDUCES
BUSINESS UNITCREATES
INCOMERISKS
GENERATES
20 ©JB Caen 2009 & +
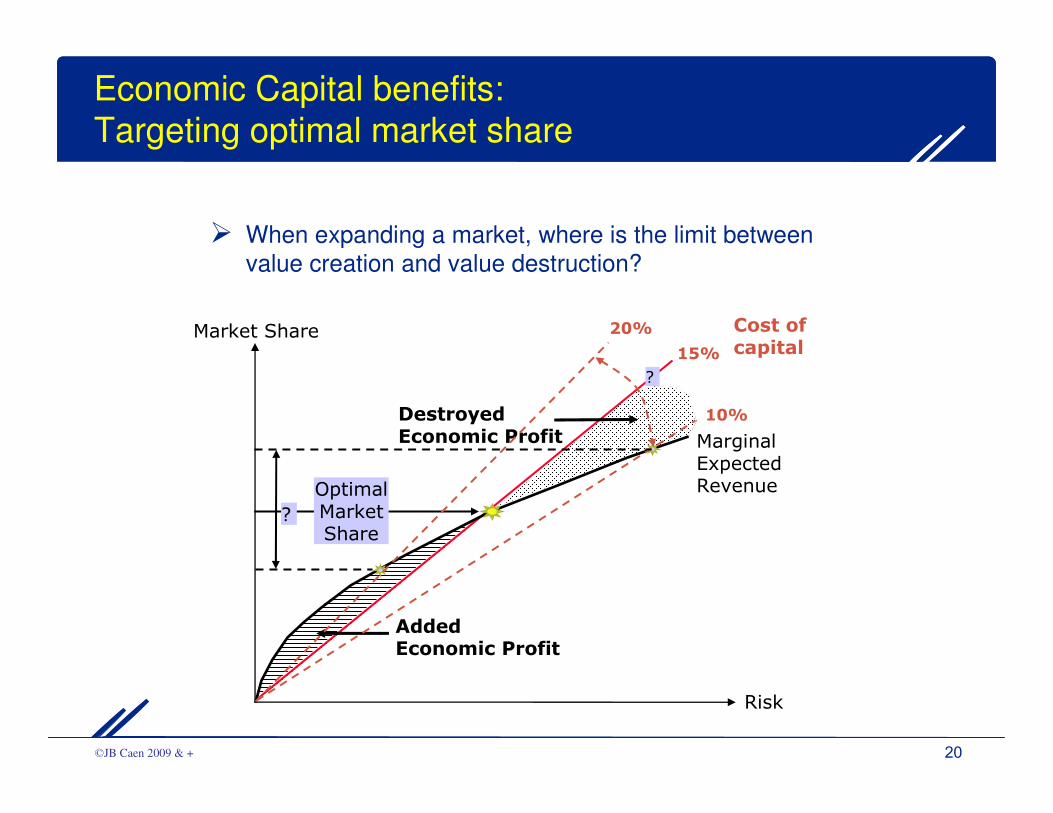
Economic Capital benefits:
Targeting optimal market share
Destroyed Economic Profit
Risk
Market Share Cost of capital
Marginal Expected RevenueOptimal
Market Share
15%
?
10%
20%
?
Added Economic Profit
� When expanding a market, where is the limit between
value creation and value destruction?
21 ©JB Caen 2009 & +
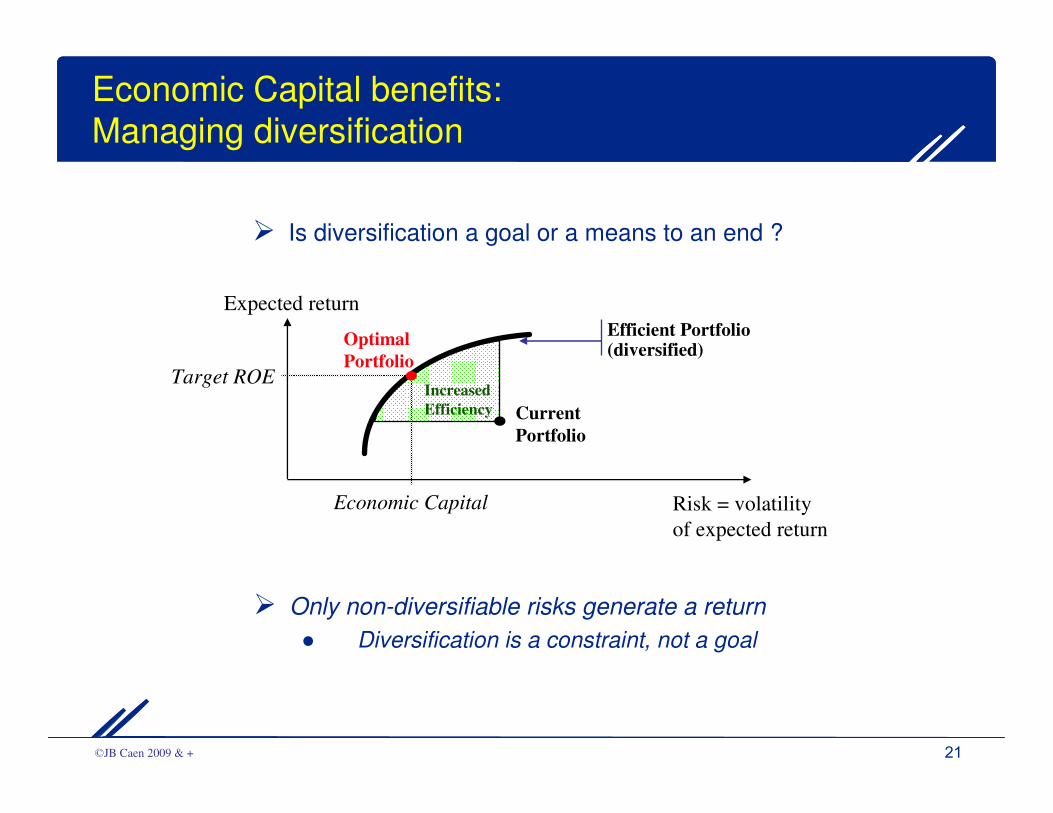
Economic Capital benefits:
Managing diversification
� Only non-diversifiable risks generate a return
● Diversification is a constraint, not a goal
Expected return
Risk = volatility
of expected return
Efficient Portfolio(diversified)
Current
Portfolio
Increased
Efficiency
Target ROE
Optimal
Portfolio
Economic Capital
� Is diversification a goal or a means to an end ?
22 ©JB Caen 2009 & +
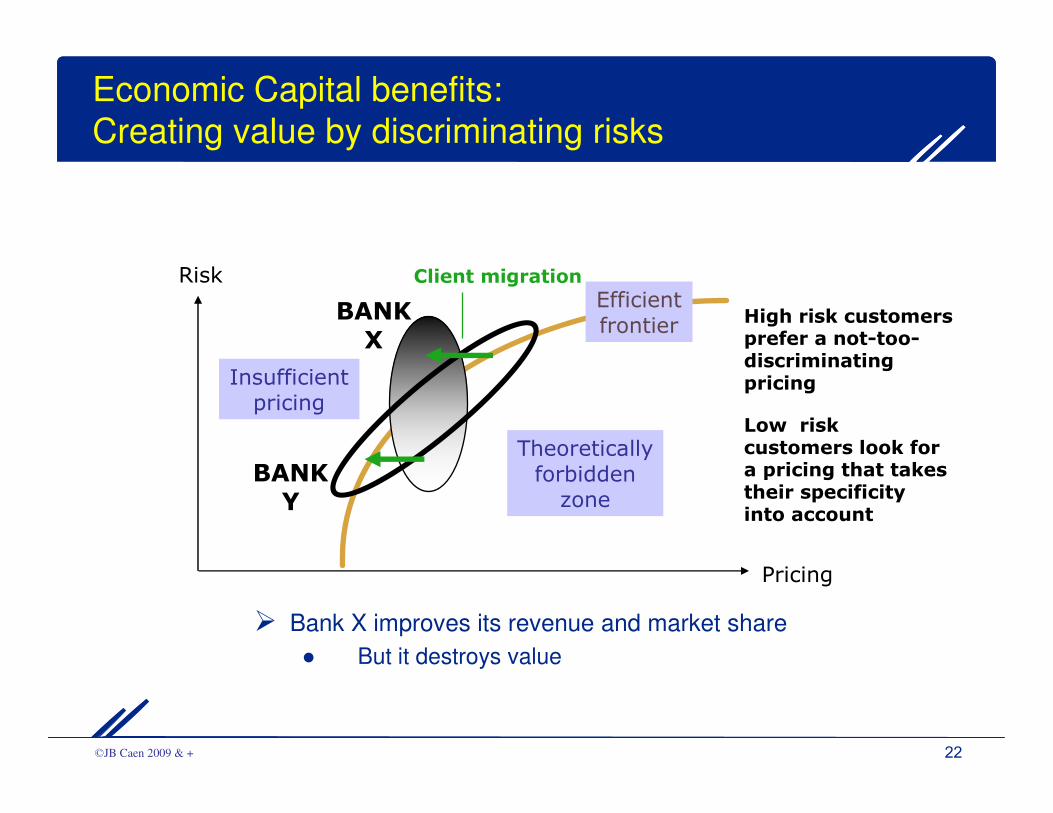
Economic Capital benefits:
Creating value by discriminating risks
� Bank X improves its revenue and market share
● But it destroys value
Insufficient pricing
BANKX
BANKY
Efficientfrontier
Theoretically forbidden zone
Risk
Pricing
High risk customers prefer a not-too-discriminating pricing
Low risk customers look for a pricing that takes their specificity into account
Client migration
23 ©JB Caen 2009 & +
Plan
1. The competing financial management frameworks
of Financial Institutions
2. Specific benefits of the Economic Capital framework
3. Implementation: The seven founding guidelines
24 ©JB Caen 2009 & +
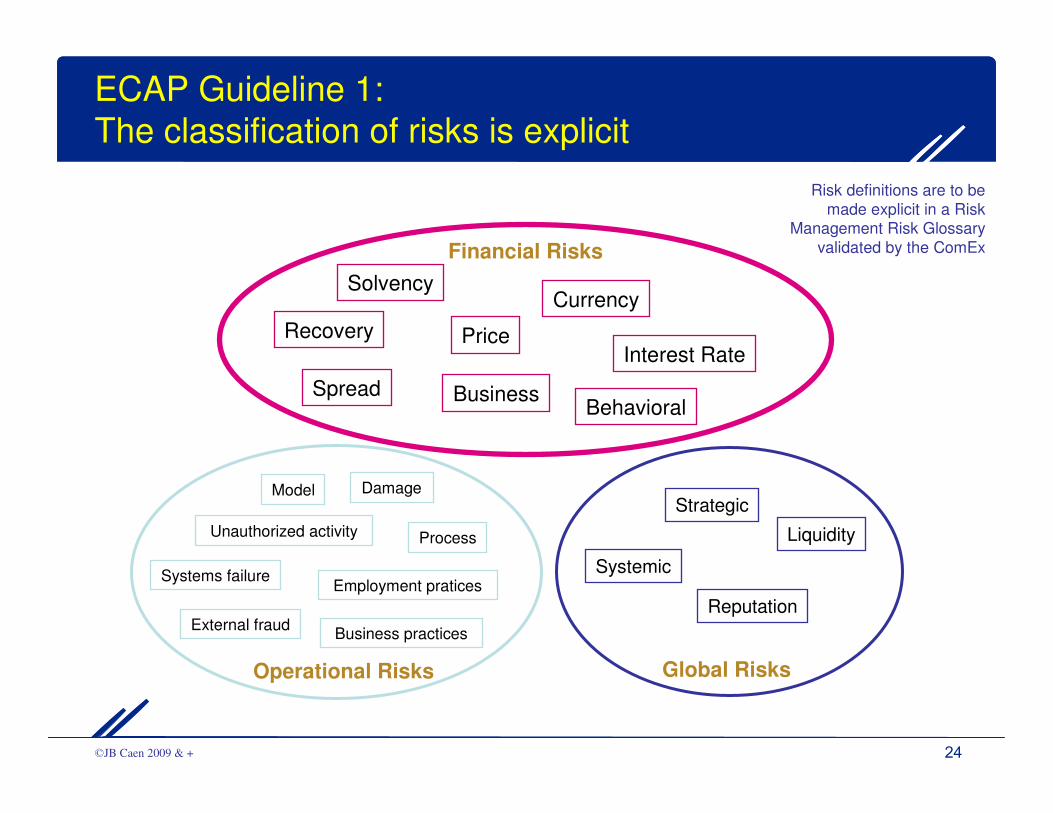
ECAP Guideline 1:
The classification of risks is explicit
Financial Risks
Operational Risks
Strategic
Global Risks
Systemic
Reputation
Liquidity
Price
SolvencyCurrency
Interest Rate
BehavioralBusiness
Risk definitions are to be
made explicit in a Risk Management Risk Glossary
validated by the ComEx
External fraud
Model
Unauthorized activity Process
Systems failureEmployment pratices
Business practices
Damage
Spread
Recovery
25 ©JB Caen 2009 & +
ECAP Guideline 2: Each Business Unit
benefits from its own risk-taking
� The capital allocation process aims at managing the bank as a holding of
businesses
● Each BU puts its capital at risk and collects the resulting return
- Otherwise, it is not a BU !
● Each BU creates value from one or several sources of expertise
- The bank segmentation should result into BUs as independant as possible
- To avoid complex reallocations of revenues, costs and risks
- And facilitate the management of diversification
26 ©JB Caen 2009 & +
ECAP Guideline 3
Risk Capital is a measure of risk
� Risks are Unexpected Losses
� Potential losses are measured as:
� Potential losses = Exposure * Risk factor
� Exposures are economic values of assets or liabilities
- In Economic value, either Market or Fair value
� Risk factors are usually external random variables
- Characterized by risk parameters such as a distribution function, a
mathematical expectancy (ĒĒĒĒ) and a standard deviation (σσσσ)
� Expected Loss (EL) = Exposure * ĒĒĒĒ of the risk factor
� Expected Losses ARE NOT RISKS but provisions
� Unexpected Loss (UL) = Exposure * σσσσ of the risk factor (* severity factor)
� Risk Capital = Unexpected Loss at a given IC and time-horizon
- These IC and time-horizon are unique and firm-wide
- Risk Capital is a calibrated measure of risk
27 ©JB Caen 2009 & +
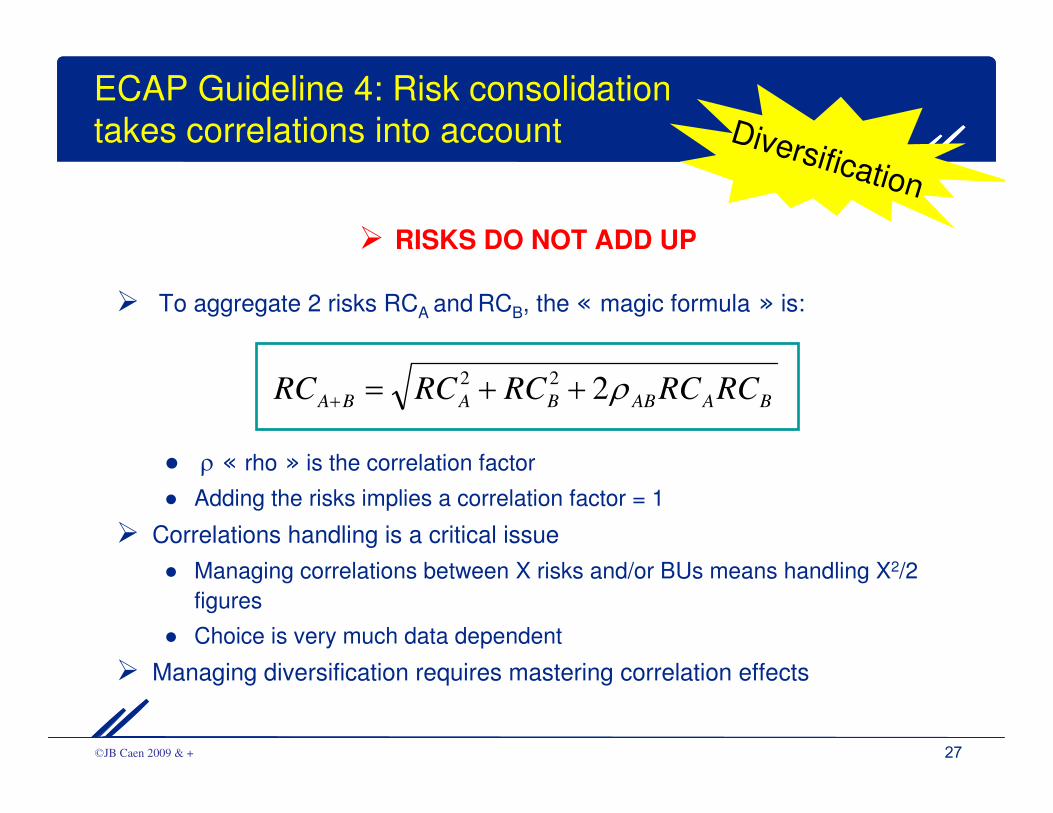
ECAP Guideline 4: Risk consolidation
takes correlations into account
� RISKS DO NOT ADD UP
� To aggregate 2 risks RCA and RCB, the « magic formula » is:
● ρ « rho » is the correlation factor
● Adding the risks implies a correlation factor = 1
� Correlations handling is a critical issue
● Managing correlations between X risks and/or BUs means handling X2/2
figures
● Choice is very much data dependent
� Managing diversification requires mastering correlation effects
BAABBABA RCRCRCRCRC ρ222 ++=+
Diversification
28 ©JB Caen 2009 & +
ECAP Guideline 5: Risk aversion is the same at all levels of decision-making
� To avoid cross-subsidization, all activities should work with the same level of
safety.
● Equal to the level of safety of DEXIA as a whole.
� This level of safety is adequately measured by the probability of DEXIA facing
an Unexpected Loss larger or equal than its Economic Capital.
● … at a given horizon.
� This probability level is, at any given time,
�AN INVARIANT ACROSS THE BANK.
It quantifies the risk aversion to be applied at all levels of decision-making.
UL depends upon the resulting Interval of Confidence
� The July 7th, 2004 Management Board has set Dexia IC at 99,97% at 1-year
time horizon.
Solidarity
29 ©JB Caen 2009 & +
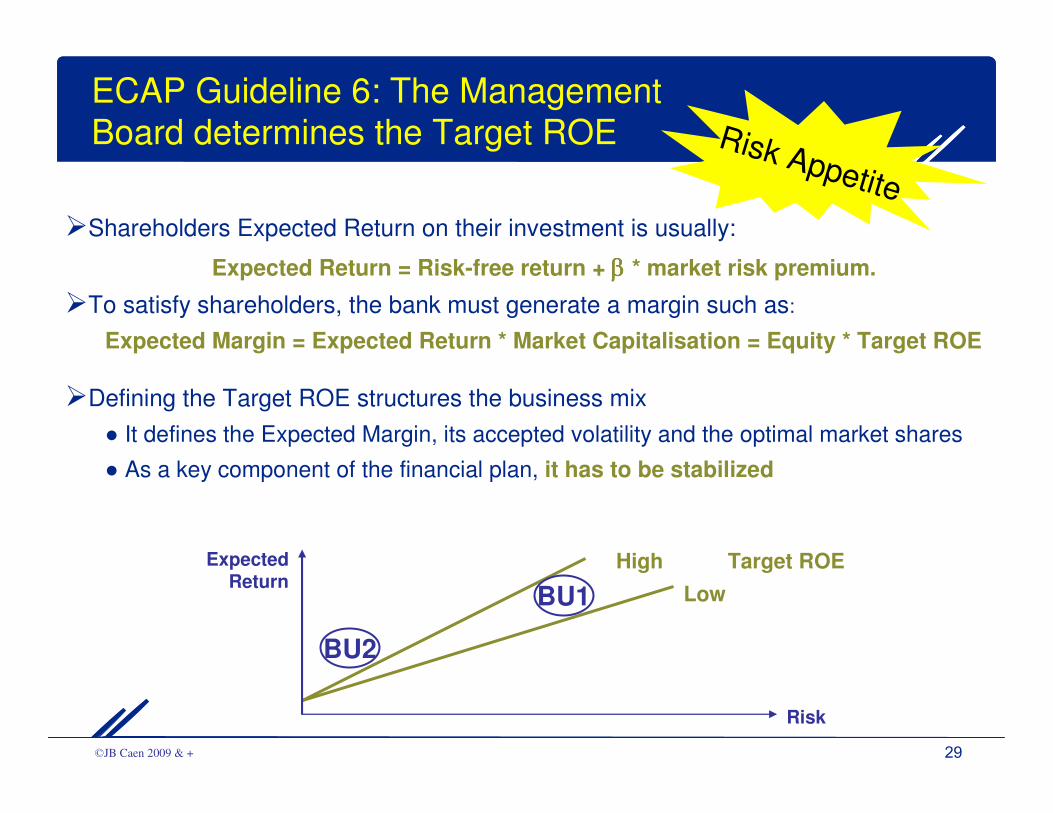
ECAP Guideline 6: The Management Board determines the Target ROE
�Shareholders Expected Return on their investment is usually:
Expected Return = Risk-free return + ββββ * market risk premium.
�To satisfy shareholders, the bank must generate a margin such as:
Expected Margin = Expected Return * Market Capitalisation = Equity * Target ROE
�Defining the Target ROE structures the business mix
● It defines the Expected Margin, its accepted volatility and the optimal market shares
● As a key component of the financial plan, it has to be stabilized
Target ROEHigh
Low
Expected Return
Risk
BU1
BU2
Risk Appetite
30 ©JB Caen 2009 & +
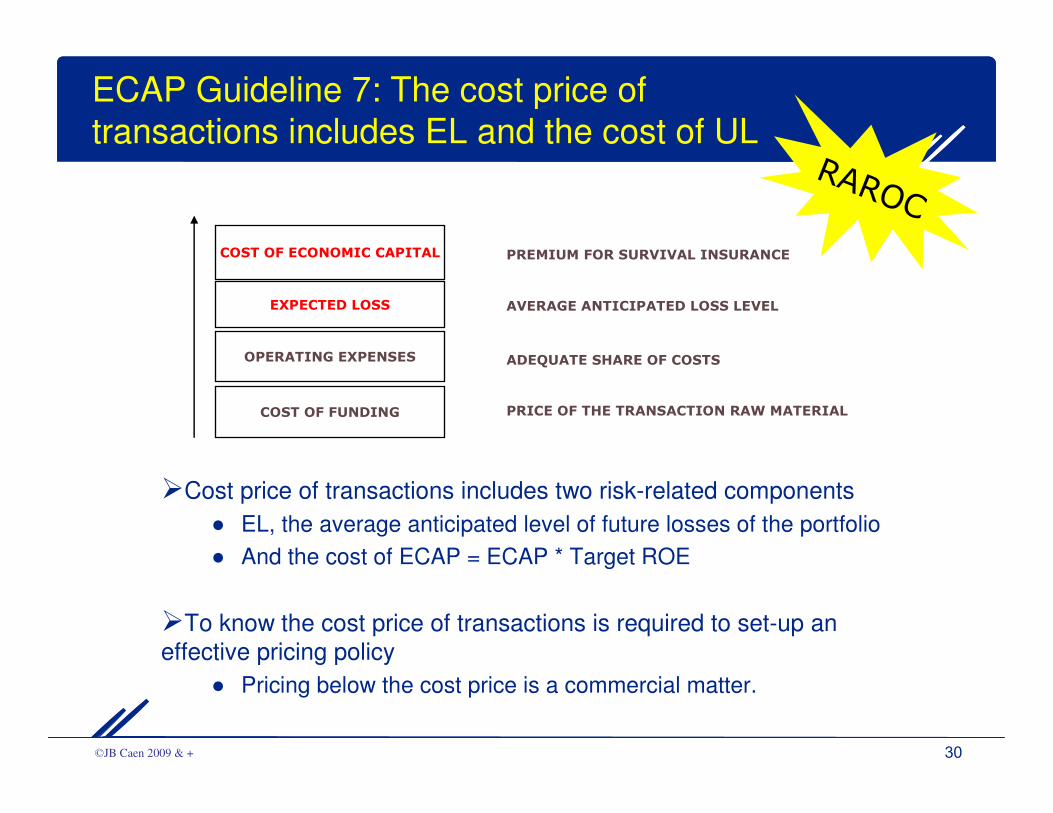
ECAP Guideline 7: The cost price of
transactions includes EL and the cost of UL
�Cost price of transactions includes two risk-related components
● EL, the average anticipated level of future losses of the portfolio
● And the cost of ECAP = ECAP * Target ROE
�To know the cost price of transactions is required to set-up an
effective pricing policy
● Pricing below the cost price is a commercial matter.
COST OF ECONOMIC CAPITAL
EXPECTED LOSS
OPERATING EXPENSES
COST OF FUNDING PRICE OF THE TRANSACTION RAW MATERIAL
ADEQUATE SHARE OF COSTS
AVERAGE ANTICIPATED LOSS LEVEL
PREMIUM FOR SURVIVAL INSURANCE
RAROC
31 ©JB Caen 2009 & +
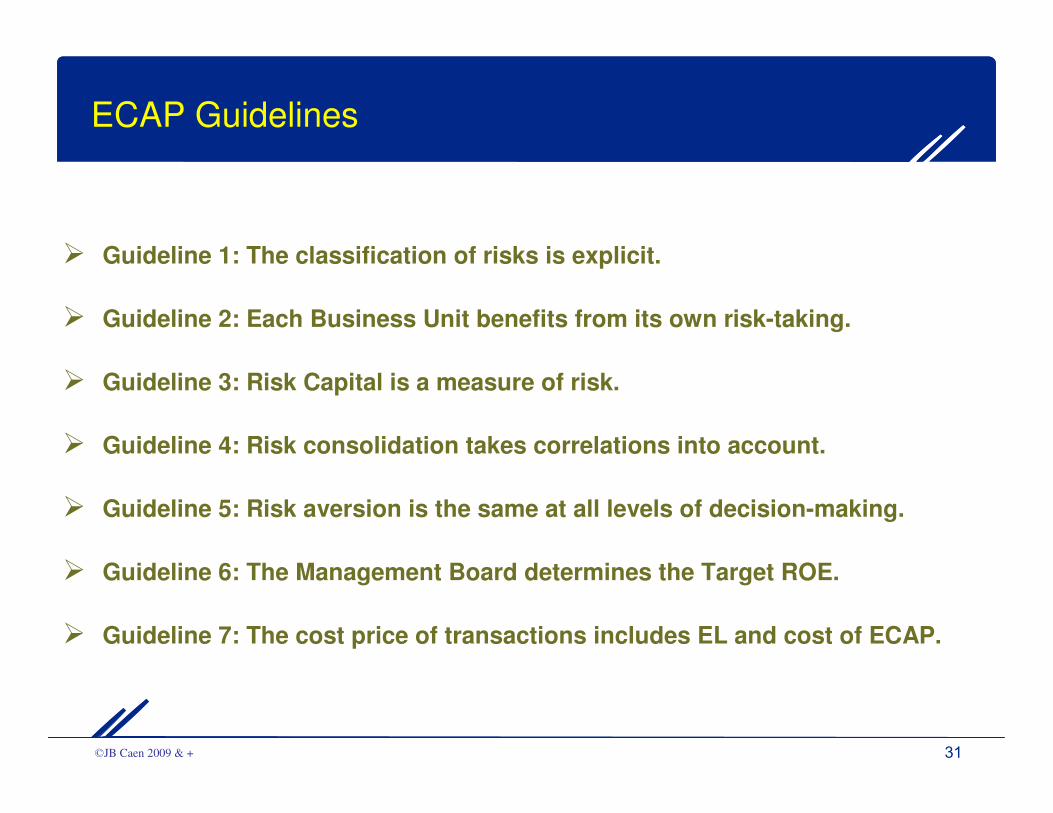
ECAP Guidelines
� Guideline 1: The classification of risks is explicit.
� Guideline 2: Each Business Unit benefits from its own risk-taking.
� Guideline 3: Risk Capital is a measure of risk.
� Guideline 4: Risk consolidation takes correlations into account.
� Guideline 5: Risk aversion is the same at all levels of decision-making.
� Guideline 6: The Management Board determines the Target ROE.
� Guideline 7: The cost price of transactions includes EL and cost of ECAP.
32 ©JB Caen 2009 & +
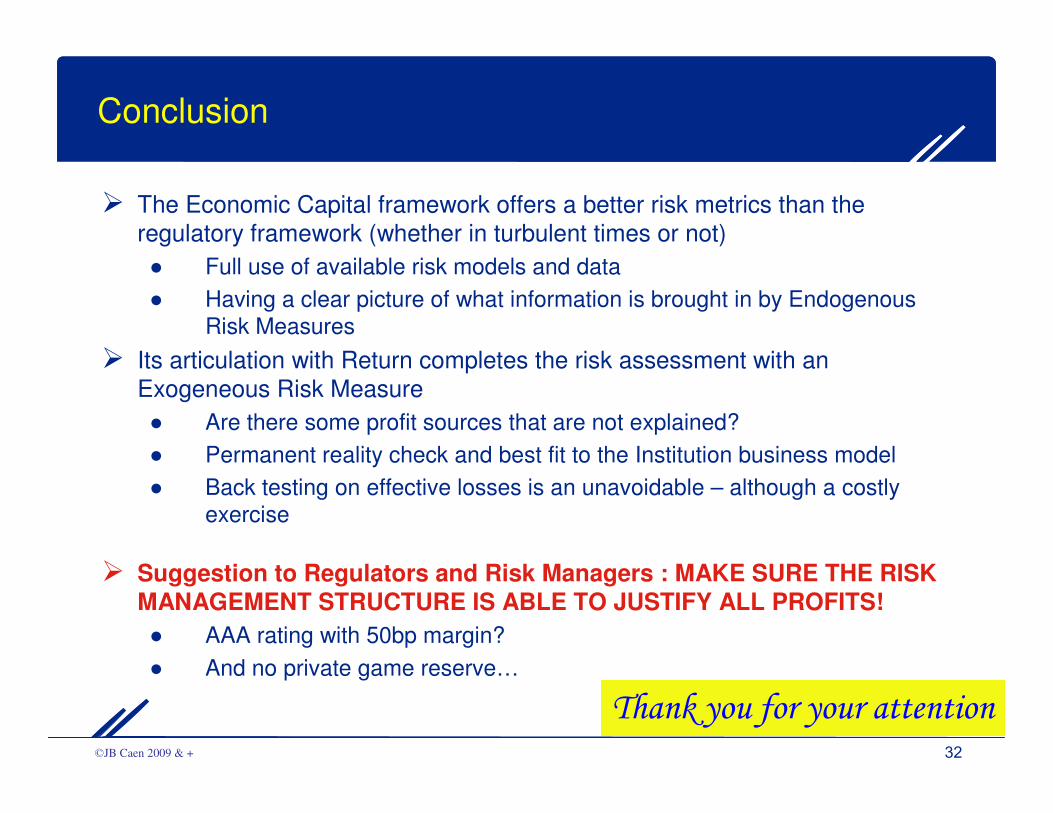
Conclusion
� The Economic Capital framework offers a better risk metrics than the
regulatory framework (whether in turbulent times or not)
● Full use of available risk models and data
● Having a clear picture of what information is brought in by EndogenousRisk Measures
� Its articulation with Return completes the risk assessment with an
Exogeneous Risk Measure
● Are there some profit sources that are not explained?
● Permanent reality check and best fit to the Institution business model
● Back testing on effective losses is an unavoidable – although a costlyexercise
� Suggestion to Regulators and Risk Managers : MAKE SURE THE RISK MANAGEMENT STRUCTURE IS ABLE TO JUSTIFY ALL PROFITS!
● AAA rating with 50bp margin?
● And no private game reserve…
Thank you for your attention
Recommended