ERFEvaluationReport2011 Page1of25
EarlyReadingFirstAnnualEvaluationReportEnhancedLanguageandLiteracySuccessProject
Year3:2010‐2011SchoolYear
SandraJoWilson,Ph.D.RachaelTanner‐Smith,M.A.
PeabodyResearchInstitute,VanderbiltUniversityIntroductionTheMetropolitanNashvillePublicSchools/VanderbiltUniversityEarlyReadingFirstproject,EnhancedLanguageandLiteracySuccess(ELLS),contractswithSandraWilson,AssociateDirectorofthePeabodyResearchInstituteatVanderbiltUniversity,andRachaelTanner‐Smith,ResearchCoordinator,toconductanindependentevaluationoftheprogram.Theevaluationhasfocusedontwoaspectsoftheprogram:(1)anevaluationofcurriculumimplementation,and(2)detailedassessmentsofchildoutcomes.ThisaddendumtotheAnnualPerformanceReportfor2010‐2011willprovideinformationaboutbothoftheseaspectsoftheevaluation.EvaluationofCurriculumImplementationTheEnhancedLanguageandLiteracySuccess(ELLS)projectbeganclassroomimplementationinJanuary,2009intenprekindergartenclassroomshousedinfiveelementaryschoolsintheMetropolitanNashvillearea.InYear2(2009‐2010)oftheproject,twoteacherslefttheirschoolswhilefivenewteachersjoinedtheproject.InYear3(2010‐2011),oneteacherleftherschoolandwasreplacedwithanewteacher.InYears2and3,atotalofthirteenteachersparticipatedintheELLSproject.ForYear3,twoobservationswereplannedforeachclassroom,oneintheFallof2010andoneintheSpringof2011.Oneteacherateachofthetimepointswasnotavailableforobservation.TheresultsforYear3thusrepresentobservationdatafrom12classroomsin7schools.TheFallobservationoccurredbetweenSeptemberandNovember,2010.TheSpringobservationoccurredbetweenMarchandMay,2011.Weobservedtheclassroomsusingthreeinstruments.ThefirstinstrumentwasamodifiedversionoftheOWLCurriculumImplementationChecklistsuppliedwiththeOWLcurriculum.Second,weusedanobservationalsystemcalledtheNarrativeRecord,whichrecordsthetypesandtimingofclassroom“episodes.”Theepisodesarecodedfortheamountoftimeeachoccurred,scoredforOWLcurriculumcontent,andratedforclassinvolvementandteacherinstructionalquality.Third,weusedtheEarlyLanguageandLiteracyObservation(ELLCO)PreKToolandtheLiteracyEnvironmentChecklistfromtheEarlyLanguageandLiteracyClassroomObservationToolkit.

ERFEvaluationReport2011 Page2of25
OWLCurriculumImplementationChecklistAnimplementationchecklistisprovidedwiththeOWLcurriculum,whichwemodifiedintwowaysfortheEarlyLanguageandLiteracySuccess(ELLS)project:(1)toincludemorespecificdetailaboutsomeaspectsofthecurriculumthatwerenotincludedintheoriginalversion;and,(2)toincludeitemsaboutsomeoftheadditionalwritingactivitiesthatwereimplementedassupplementstotheOWLcurriculum.Thechecklisthas10sections,eachcoveringanaspectoftheOWLcurriculumoracomponentoftheELLSprogram.Theteacherswereratedonwhethertheydeliveredthecomponentornot,andonthequalityofthedelivery.Followingisashortdescriptionofthecriticalfeaturesofeachcurriculumcomponent.
MorningMeeting:teachersareexpectedtodemonstratetheactivitiesplannedforCentersTimethatday,makeconnectionstothecurriculumunit,anddefineandusethecurriculumvocabulary.
Interactivewriting,groupsettings:theELLSprojectsupplementstheOWLCurriculumbyaddingactivitiesthatfocusonchildren’sdevelopingwritingskills.Teachersareexpectedtowriteduringlargegroupactivities,todrawattentiontowriting,andencouragechildrentoparticipateininteractivewriting.
CentersTime:observerslookforopencentersthatarestockedwithappropriatematerials;childrenshouldbeallowedtomovebetweencenters,andteachersshouldhaveasystemformanagingthechildren’smovementbetweencenters.Inaddition,teachersareexpectedtohavesustainedinteractionswithchildrenandusecurriculumvocabulary.
WritinginCenters:thisisanELLSprojectsupplementtotheOWLCurriculum;teachersareexpectedtoincorporatewritingintocenteractivities,invitechildrentoparticipateinwriting,anddemonstratethepurposesandmeaningofwriting.
StoryTime:teachersareexpectedtoreadprescribedOWLCurriculumbooksasrecommendedinthecurriculummanual;teachersshoulddefineandusevocabulary,respondtoquestions,andencouragethoughtfuldiscussion.
Songs,WordPlay,&Letters(SWPL):thiscomponentofthecurriculumisfocusedonphonologicalawarenessskills.Teachersareexpectedtohavematerialspreparedandmonitorandmanagechildren’sattentionduringthissegment.Observersalsolookforteacherstoencouragechildparticipationandfollowthetasksprescribedinthecurriculummanual.
SmallGroups:teachersandaidesareexpectedtocreateaseriesofrotatingsmallgroupseachdaythatencouragelearningandindividualdevelopment;observerslookforfunctional,orderlygroups,connectionsbetweensmallgroupactivitiesandthecurrenttheme,hands‐onactivitiesforallstudents,andanenvironmentthatencourageschildren’squestionsandexpressiveness.
Let’sFindOutAboutIt/Let’sTalkAboutIt:thissegmentofthecurriculumfocusesoninquiryandsocialskillsdevelopment.Observerslookforconnectionstothecurrenttheme,andforteacherstohelpchildrenmakeobservationsandexpressideas.
AdaptationsforELLsorSpecialNeedsChildren:forteacherswithEnglish‐languagelearnersorspecialneedschildren,observersdetermineifteachersareawareof

ERFEvaluationReport2011 Page3of25
studentswhomightrequireadaptationsandgaugeteachers’skillinmakingnecessaryadaptations.
Transitions:transitionsshouldbewellorganizedandharmonious,andusedforeducationalpurposeswhenpossible.
Table1showstheaveragecurriculumfidelityscoresforallthreeprojectyears.Thetableshowseachobservationaveragedacrosstheteachersobservedatthattime,alongwiththenumberofpointspossibleforeachcurriculumcomponent.Inthethirdyear,allcurriculumcomponentswereobservedintheclassroomsthatwereobserved,butnotallteacherswereabletosuccessfullyimplementallcomponentsofthecurriculumonthedaytheywereobserved.Increasesinfidelitywereobservedinallcurriculumareasfromthefirstprojectyear,thoughthefinalMorningMeetingscorewaslowerintheSpringofYear3thanitwasinYear1.IncreasesinfidelitywerenotedbetweenFallandSpringinYear3onthefollowingcurriculumareas:StoryTimeandSupportforELLs.
Table1.AverageCurriculumImplementationScoresforEachCurriculumArea
Y1:(n=10)
Y2:Fall(n=13)
Y2:Spring(n=13)
Y3:Fall(n=12)
Y3:Spring(n=12)
PointsPossible
MorningMeeting 7.1 7.2 8.1 7.7 6.4 11
Writing:inGroups 4.7 7.2 8.7 8.3 8.3 9
CentersTime 18.3 21.0 22.0 19.7 19.4 24
WritinginCenters 10.9 12.8 12.8 12.9 12.9 18
StoryTime 23.3 26.8 28.9 26.8 28.9 30
Songs,WordPlay&Letters 14.6 16.3 17.5 17.2 16.8 19
SmallGroups 19.1 31.8 32.2 35 30 42
Let’sTalk/FindOutAboutIt 6.4 8.6 8.2 10.8 10.3 12
Support&AdaptationsforELLs* 3.0 3.7 3.7 2.9 3.3 4
Transitions 3.8 4.5 5.6 5.3 4.6 6*InYear1only6of10teachershadELLstudents.InYear2,onlysevenofthe13teachershadELLstudents.InYear3only9of12teachersobservedhadELLstudents.TheremainingteacherswerenotratedontheELLitems.
Summary/Conclusions:ImplementationRatings Thefollowingstrengthswerenoted:
WritinginGroupSettings,StoryTime,Songs,WordPlay&Letters,Let’sTalk/FindOutAboutItandSupportforELLssegmentswereimplementedwiththehighestfidelityofallthecurriculumcomponents.
ImplementationfidelityincreasedfromYear2toYear3onLet’sTalk/FindOutAboutIt.

ERFEvaluationReport2011 Page4of25
ImplementationfidelityincreasedfromFalltoSpringinYear3onStoryTimeandSupportforELLs.
Thefollowingareaswerenotedasareasforimprovement:
TeachershadthemostdifficultywiththeMorningMeeting,CentersandSmallGroupssegments.
Implementationfidelitydeclinedinsomeareasbythefinalobservation.
ERFEvaluationReport2011 Page5of25
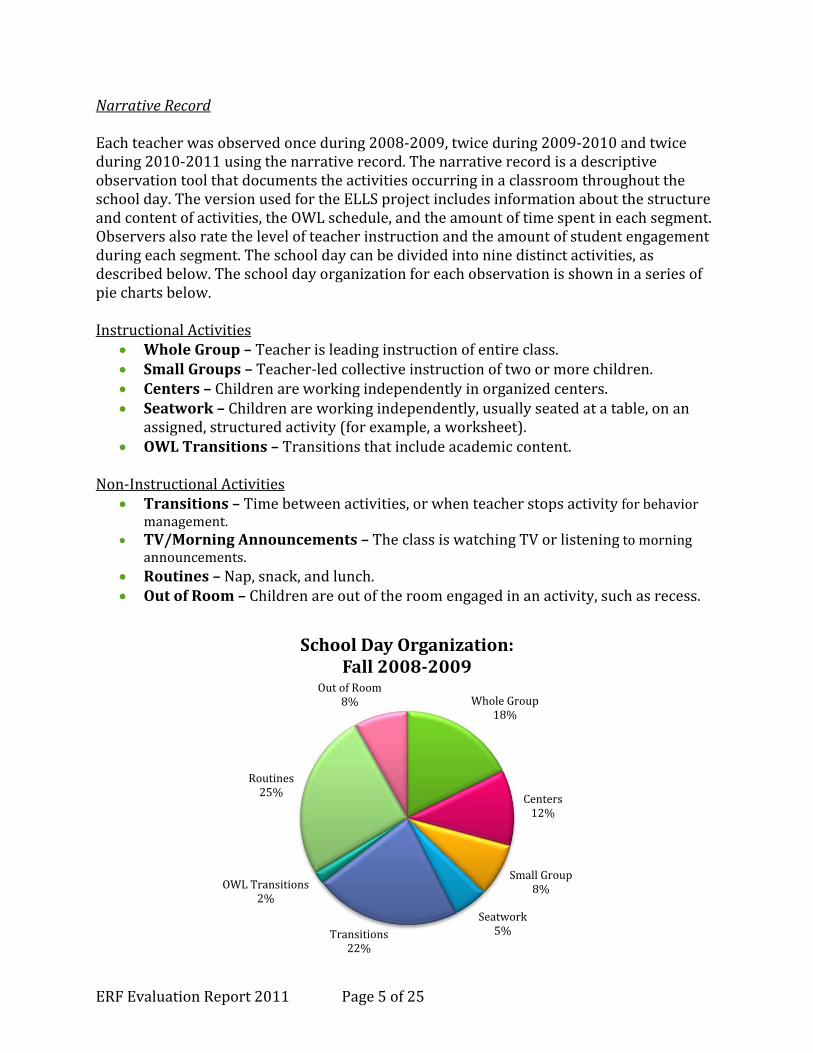
NarrativeRecordEachteacherwasobservedonceduring2008‐2009,twiceduring2009‐2010andtwiceduring2010‐2011usingthenarrativerecord.Thenarrativerecordisadescriptiveobservationtoolthatdocumentstheactivitiesoccurringinaclassroomthroughouttheschoolday.TheversionusedfortheELLSprojectincludesinformationaboutthestructureandcontentofactivities,theOWLschedule,andtheamountoftimespentineachsegment.Observersalsoratethelevelofteacherinstructionandtheamountofstudentengagementduringeachsegment.Theschooldaycanbedividedintoninedistinctactivities,asdescribedbelow.Theschooldayorganizationforeachobservationisshowninaseriesofpiechartsbelow.InstructionalActivities
WholeGroup–Teacherisleadinginstructionofentireclass. SmallGroups–Teacher‐ledcollectiveinstructionoftwoormorechildren. Centers–Childrenareworkingindependentlyinorganizedcenters. Seatwork–Childrenareworkingindependently,usuallyseatedatatable,onan
assigned,structuredactivity(forexample,aworksheet). OWLTransitions–Transitionsthatincludeacademiccontent.
Non‐InstructionalActivities
Transitions–Timebetweenactivities,orwhenteacherstopsactivityforbehaviormanagement.
TV/MorningAnnouncements–TheclassiswatchingTVorlisteningtomorningannouncements.
Routines–Nap,snack,andlunch. OutofRoom–Childrenareoutoftheroomengagedinanactivity,suchasrecess.
WholeGroup18%
Centers12%
SmallGroup8%
Seatwork5%Transitions
22%
OWLTransitions2%
Routines25%
OutofRoom8%
SchoolDayOrganization:Fall2008‐2009

ERFEvaluationReport2011 Page6of25
WholeGroup20%
Centers12%
SmallGroup6%
Seatwork3%
Transitions19%
OWLTransitions
2%
TV/Announce‐ments2%
Routines27%
OutofRoom9%
SchoolDayOrganization:Fall2009‐2010
WholeGroup24%
Centers12%
SmallGroup7%Seatwork
4%Transitions
14%
OWLTransitions
8%
Routines23%
OutofRoom8%
SchoolDayOrganization:Spring2009‐2010
WholeGroup24%
Centers14%
SmallGroups4%
Seatwork1%
Transitions19%
OWLTransitions
6%
OutofRoom6%
Routines26%
SchoolDayOrganization:Fall2010‐2011
WholeGroup23%
Centers12%
SmallGroups8%
Seatwork2%
Transitions18%
OWLTransitions
3%
OutofRoom8%
Routines26%
SchoolDayOrganizationSpring2010‐2011

ERFEvaluationReport2011 Page7of25
Figure1belowshowstheaverageproportionoftheschooldayspentdeliveringtheOWLcurriculumcomponentsacrosstheteachers.Eachdifferentcoloredbarrepresentsoneofthefiveobservationsconductedoverthethreeprojectyears.InYear3,teachersspentlesstimeinCentersandmoretimeinSmallGroups,incontrasttothetwoearlieryears.TeachersalsoincreasedStoryTimeinYear3fromthepreviousyears.Thenon‐OWLtimewasreducedfromthepreviousyears,thoughtransitiontimedidincreaseinYear3.AttheendofYear2,oneareawhereincreaseswereencouragedwasinSmallGroups,andtheteachersappearedtobequiteresponsivetothatsuggestion.
Figure1
0
10
20
30
40
50
60
70
80
90
100
PercentofSchoolDay
PercentofSchoolDayineachOWLComponent
2008‐2009‐1
2009‐2010‐1
2009‐2010‐2
2010‐2011‐1
2010‐2011‐2

ERFEvaluationReport2011 Page8of25
Figure2showstheaveragelevelofclassroominvolvementfortheSpring2010‐2011observationacrossthevariousclassroomactivities,andtheaveragelevelofteacherinstructionduringthoseactivities.Bothclassroominvolvementandteacherinstructionallevelareratedona5‐pointscale,withhigherscoresindicatingmoreinvolvementorinstruction.Theanchorsforthe5‐pointscalesareshownbelow.ClassroomInvolvement0=Low
Noinvolvementortotaldisorder. Routines,outofroom,and
transitionswithoutinstructionalcontentareautomaticallyscoredlow.
1=Mediumlow Childrenshowlackofinterestand
littleengagement,lookdistractedorbored.
2=Medium Averageinvolvement,childrenare
listeningorparticipating,interestcanwane,butcomesbacktotask
3=Mediumhigh Consistentengagementandinterest,
eagerexpressions.4=High
Intenseconcentration,consistentactiveengagementandinterestfromalloralmostallchildren.
TeacherInstructionalLevel0=Non‐AcademicInstruction
Non‐academicvideos,transitions,behaviorcorrection;noinstructionoccuring.
Meals,recess,nap,&transitionsw/oinstructionalcontentareautomaticallyscored0.
1=Low: Monitorsactivitieswithoutengagingchildren;no
specificlearning/academicskillbeingtaught;asksrhetoricalquestionswithoutwaitingfortheanswer.
2=Basic Instructionisfocusedonbasicacademiccontentor
skills.Readsw/oaskingquestionsoraskingquestionswithpre‐setanswers.
3=SomeInference Instructioninbasicskillswithsomeinference.Asks
someopen‐ended&someclose‐endedquestions.4=HighInference
Instructionw/sustainedlevelofreflection.Teacherhelpschildrenmakeconnectionsb/wconcepts;fourormoreopen‐endedquestions.
Figure2
2.102.36 2.23
1.55
2.61 2.73 2.602.36
0.00
1.00
2.00
3.00
4.00
WholeGroup Centers SmallGroups Seatwork
AverageClassroomInvolvementandTeacherInstructionalLevelbyActivityType:Spring
2010‐2011
TeacherInstructionalLevel ClassroomInvolvement

ERFEvaluationReport2011 Page9of25
Ingeneral,childrenweremoderatelyengagedthroughouttheschoolday,andweremostengagedduringinstructionalsegmentssuchasWholeGroup,Centers,andSmallGroups.Theywereleastengagedduringseatwork,aswouldbeexpected.ThehighestclassroominvolvementwasnotedduringCenterstime,whenchildrenareallowedtochooseactivitiesmoreindependently.Teacherinstructionallevelsweremodestoverall.Summary/Conclusions:NarrativeRecordThefollowingstrengthswerenoted:
WholeGroupinstructionisasignificantcomponentoftheOWLcurriculumandteachersconsistentlyusedalargeportionoftheschooldayinthewholegroupformat.
ClassroomInvolvementwashighestduringCentersTimeandTeacherInstructionalLevelswerehighestduringCentersTime.
Thefollowingareaswerenotedasareasforimprovement:
InYear3,transitiontimeswereincreasedoverthelowachievedattheendofYear2.
AlthoughTeacherInstructionalLevelswereadequate,therearemanyopportunitiesforteacherstoincorporatehigherlevelsofinstructionintotheiractivities,byaskingmoreopen‐endedandinferentialquestions.Higherlevelsofinstructionwouldbeexpectedtoincreasestudentengagementandstudentlearning.

ERFEvaluationReport2011 Page10of25
EarlyLanguageandLiteracyClassroomObservation
InadditiontotheELLCOPreKTOOLthatwasrequiredforERFevaluations,weelectedtocontinuetousetheLiteracyEnvironmentChecklist(LEC)portionfromthepreviousversionoftheELLCOaswell.BecausetheLiteracyEnvironmentChecklisthasbeenusedinERFprogramsinthepast,wedecidedtocontinuetousetheinstrumenttoretainsomecomparabilitywithotherprojects.Wepresentresultsforbothobservationsinthissection.Theaveragescoresoverthethreeprojectyearsfortheteachers(outof5totalpoints)ontheELLCOPreKToolGeneralClassroomEnvironmentScaleareshowninFigure3.Eachitemisscoredona5‐pointscale,rangingfromdeficient(1)toexemplary(5).Themiddleofthescaleisconsideredbasic(3).TheGeneralClassroomEnvironmentScaleiscomprisedoftwocomponents,ClassroomStructureandCurriculum.ClassroomStructurereferstothephysicalorganizationofclassroom,qualityanddisplayoflearningmaterialsintheroom,existenceandenforcementofmanagementstrategies,andappropriatenessofstaff/childratioandstaff/childinteractions.TheCurriculumcomponentfocusesonevidenceofacohesivecurriculum,opportunitiesforchildchoiceandinitiative,andrecognitionofandattentiontodiversity.
Figure3
InYear1,thescoresontheGeneralClassroomEnvironmentsubscaleanditstwocomponentscales,ClassroomStructureandCurriculum,fellgenerallyinthemiddlerangeofthescale,slightlyabovethebasiclevelofquality.InYear2,increaseswereobservedinbothClassroomStructureandCurriculum,withteachersaveragingbetweenstrongandexemplaryqualitybytheendofYear2.AttheendofYear3,anincreasewasseeninClassroomStructure.TeachersfellslightlyontheCurriculumscale.OverallteachersaveragedbetweenstrongandexemplaryqualityattheendofYear3.
3.6 3.5 3.6
4.2 4.1 4.24.4 4.4 4.4
4.2 4.1 4.24.5
4.04.3
1
1.5
2
2.5
3
3.5
4
4.5
5
ClassroomStructure Curriculum GeneralClassroomEnvironmentSubscale
EarlyLanguage&LiteracyClassroomObservationGeneralClassroomEnvironmentSubscale
Year1
Year2‐Visit1
Year2‐Visit2
Year3‐Visit1
Year3‐Visit2

ERFEvaluationReport2011 Page11of25
TheaveragescoresacrossthethreeobservationsfortheparticipatingteachersontheLanguage&LiteracysubscaleareshownbelowinFigure4.Asabove,allitemsarescoredona5‐pointscale,rangingfrom1=deficientto5=exemplary.TheLanguageandLiteracySubscalehasthreecomponents:LanguageEnvironment,BooksandBookReading,andPrintandEarlyWriting.TheLanguageEnvironmentcomponentisscoredforteacher/childconversations,opportunitiesforextendedindividualconversation,effortstobuildchildren’svocabulary,andattentiontoaspectsofphonologicalawareness.TheBooksandBookReadingcomponentisscoredontheorganizationofbookarea,thepresenceofbooksrepresentinganarrayofabilitylevelsandcontent,theuseofbookstopromotelearning,theexistenceofbookreadingactivities,andtheuseofbookreadingsasengagingandinstructionalactivities.ThePrintandEarlyWritingcomponentisscoredonthefollowingcomponents:Childrenareprovidedmaterialsandactivitiestodevelopwritingskills,teachersencouragechildwritinginmeaningfulways,andteachersfocusonenvironmentalprint.
Figure4
InYear1,thescoresontheLanguageandLiteracysubscale,anditscomponentparts,weresimilartothosefortheGeneralClassroomEnvironmentsubscaleandfellslightlyabovethebasiclevelofimplementation.InYear2,increaseswereobservedinallthreeareas,withthelargestgainsevidentintheLanguageEnvironmentarea.BytheendofYear2,teacherswereatthebasiclevelwithregardtoBooksandBookReadingandPrintandEarlyWriting,butexhibitedstrongqualitywithregardtotheLanguageEnvironment.InYear3,increaseswereobservedinallthreeareaswiththelargestgainsintheBooks&BookReadingarea.OverallteachersaveragedbetweenstrongandexemplaryqualityattheendofYear3.
3.6
3.1
2.6
3.1
4.1
3.6
2.9
3.5
4.3
3.5
3.2
3.7
4.0
4.5
4.1 4.24.1
4.4
4.04.2
1
1.5
2
2.5
3
3.5
4
4.5
5
LanguageEnvironment
Books&BookReading
Print&EarlyWriting
Language&LiteracySubscale
EarlyLanguage&LiteracyClassroomObservationLanguage&LiteracySubscale
Year1
Year2‐Visit1
Year2‐Visit2
Year3‐Visit1
Year3‐Visit2

ERFEvaluationReport2011 Page12of25
ELLCO:LiteracyEnvironmentChecklistTheLiteracyEnvironmentChecklistcontainsfivecomponents: BookArea:bookareaisdistinct,orderly,andincludessoftmaterials. BookSelection:Booksrepresentarangeofdifficultylevels. BookUse:Booksarepresentinthescience,dramaticplay,blocks,andbookcenters,
andbookrecordingsareused. WritingMaterials:Alphabetisvisible,wordcardsusedtosupportnamewriting,
writingtemplatesandtoolsareavailable(includingvarietyofpaperandwritingutensils),adistinctwritingareaexistsandisavailableduringcentertime.
WritingAroundtheRoom:Evidenceofteacherdictation,bigbookuse,full‐groupliteracyactivities,writingdisplays,writingtoolsindramaticplay(asbothtoolsandprops),alphabetpuzzlesandwordpuzzlesarepresent.
TheresultsfortheLiteracyEnvironmentChecklistareshowninFigure5.Becausethesubscalesareeachscaleddifferently,theresultsarepresentedinpercentageform.Thefigureshowsthepercentofpossiblepointsachievedoneachsubscale,averagedacrosstheteachers.Overall,teachersexhibitedgainsfromYear1toYear2ineverycomponentoftheLiteracyEnvironment.TheyachievedhighscoresontheBookArea,BookSelection,andWritingMaterialssubscales,buthaveroomforimprovementintheotherareas,especiallyintermsofBookUseandWritingAroundtheRoom.
Figure5
80
91
49
73
35
97
73
97
62
80
94
70
9298
69
93
60
97 99
82
96
73
0
10
20
30
40
50
60
70
80
90
100
BookArea BookSelection BookUse WritingMaterials WritingAroundtheRoom
PercentofTotalPossiblePoints
LiteracyEnvironmentChecklistPercentofTotalPossiblePoints
Year1 Year2‐Visit1 Year2‐Visit2 Year3‐Visit1 Year3‐Visit2

ERFEvaluationReport2011 Page13of25
Summary/Conclusions:EarlyLanguageandLiteracyClassroomObservationThefollowingstrengthswerenoted:
TeacherscoresremainedstableongeneralclassroomenvironmentitemsoftheELLCO,improvedonlanguageandliteracyitemsoftheELLCOandremainedstableontheLiteracyEnvironmentChecklist.
TeachersmadethelargestgainsintheareasofBooks&BooksReadingandPrint&EarlyWriting.
Teachers’classroomsweregenerallyhighestintermsmaterials;i.e.,teachershavecreatedclassroomsthathavethenecessaryhighqualityrawmaterials.
Overallcomponents,noteacherhadapoorclassroomenvironmentonanyscale.Thefollowingareaswerenotedasareasforimprovement:
TeacherscontinuehavethemostroomforimprovementontheBookUseandWritingAroundtheRoomsubscalesoftheLiteracyEnvironmentChecklist.
Classroomsarewellstructuredandhavealltherightrawmaterials,butteacherscancontinuetofindwaystoapplythoserawmaterialstohelpingchildrenlearn.

ERFEvaluationReport2011 Page14of25
EvaluationofChildOutcomesWenowturntoanexaminationofthechildachievementoutcomesfortheELLSproject.Table2belowshowsthenumberofparticipatingchildrenineachofthethreeprojectyears.InYear3,therewere278childrenwhoenrolledinoneofourthirteenpreschoolclassroomsatsomepointduringtheschoolyear.Ofthesestudents,21wereenrolledafterJanuary1,2011andreceivedposttestsbutnotpretests.Twenty(20)studentswerepretestedintheFallbutwithdrewatsomepointduringtheschoolyearandwerenotposttested.Elevenchildrenenrolledandwithdrewbeforeanyassessmentscouldbecollected.Thus,thereare226childrenwhowereenrolledformorethansixmonthsintheparticipatingpreschoolclassroomsandwhohadatleastoneassessmentcollectedateachtimepoint.Threechildrenwereslightlyover‐age(bornafterOctober1),butareincludedinthesampleherebecausetheirbirthdayswerewithindaysofthecutoff.Weexcludedthestudentswhohadonlyapretestoraposttest.Afewstudentsrefusedpartsofanassessment.Allfiguresreportedbelowarebasedon220‐226studentswhowerepresentinpreschoolforatleast6monthsandcompletedatleastoneassessment.
Table2.Numberofschools,classroomsandchildrenintheELLSProject
2008‐2009 2009‐2010 2010‐2011
Numberofpreschoolclassrooms 10 13 13
Numberofschools 5 7 7
Numberofchildrenassessedatpretest 187 249 246
Numberofchildrenassessedatposttest 181 229 247
Numberofchildrenwithbothassessments 179 219 226
InstrumentationSeveralstandardizedtestswereusedtoassessthelanguageandliteracyskillsofthechildren.ReceptivevocabularywasassessedusingthePeabodyPictureVocabularyTestIV.Inaddition,foursubtestsoftheWoodcock‐JohnsonAchievementBatterywereused:(1)Letter‐Word,whichassessesletterandwordrecognition;(2)PictureVocabulary,ameasureofexpressivevocabulary;(3)OralComprehension,whichmeasureschildren’sabilitytounderstandorallanguage;and(4)Spelling,ameasureofearlywriting,inwhichchildrencopysimpleshapesandletters,andwriteselectedlettersandwords.ThePhonologicalAwarenessLiteracyScreening(PALS)instrumentwasalsogiventoassessupperandlowercaseletterrecognition,beginningsoundawareness,rhymeawareness,andconceptsofprint.Finally,theWriteStart!Assessmentwasalsogiven;itisameasureofearlywritingdevelopedbyDeborahRoweandCarinNeitzel,twooftheinvestigatorsontheELLSproject.FortheSpanishspeakingchildren,wecollectedtheExpressiveOneWordPictureVocabularyTestinSpanish.Thiswasintendedtoexaminewhetherchildren’sSpanishproficiencydecreasedastheylearnedEnglish.

ERFEvaluationReport2011 Page15of25
Inthefirstprojectyear,thepretestassessmentsonthechildrenwerecollectedassoonaspossibleafteragreementsweremadewiththelocalschooldistrict,beginninginNovember,2008.Allpretestswerecompletedbymid‐December,2008.Posttestsweregiveninthespring,betweenMarch30,2009andMay5,2009.Inthesecondprojectyear,wewereabletobeginpretestassessmentsearlierintheFall.Allbut10childrenweretestedbetweenSeptember2andOctober28,2009.Theadditional10childrenwerelateenrolleesandweretestedassoonastheyenteredpreschool.TheSpringposttestsfortheYear2childrenwerecollectedbetweenMarch23andMay15,2010.ForYear3,FallassessmentswereconductedbetweenSeptember20,2010andNovember10,2010.SpringassessmentswereconductedbetweenMarch21,2011andMay17,2011.DemographicinformationforallchildrenissummarizedinTable3.InYear3,thesamplewasaboutfouryears,5monthsofageatthepretest,andwasnearlycomprisedofslightlymorefemalesthanmales.ThelargestethnicgroupwasAfricanAmerican,comprisingabout45%ofthesample.About33%ofthestudentswereHispanic.Asmallgroupofchildrenwerefromrecentimmigrantfamilies,frompartsoftheMiddleEastandAfrica.About45%ofthestudentswereEnglish‐languagelearners.
Table3.Demographics
Variable 2008‐2009 2009‐2010 2010‐2011
n % n % n %
Male 85 47% 127 51% 104 46%
Female 96 53% 122 49% 122 54%
ELL 43 24% 111 45% 100 44%
NotELL 138 76% 138 55% 126 56%
Black/AfricanAmerican 119 66% 119 48% 108 48%
Hispanic/Latino 27 15% 87 35% 75 33%
Caucasian 13 7% 17 7% 16 7%
Arabic 10 6% 19 8% 22 10%
African 9 5% 3 1% 3 1%
Asian/AsianAmerican 3 2% 1 .004% 2 1%
Other ‐ ‐ 3 1% ‐ ‐
Ageatpretest 4.7years 56m 4.4years 53m 4.5years 54m
Ageatposttest 5.3years 63m 5.0years 60m 5.1years 61m

ERFEvaluationReport2011 Page16of25
ResultsontheStandardizedTestsChildren’saveragescoresonallassessmentsareshowninTable4.ThePPVT,theSpanishPictureVocabulary,andtheWoodcockJohnsonsubtestsareshownasstandardscores,withanormedaverageof100andstandarddeviationof15.Theothertestsareshownasthenumberofitemscorrect:26itemsfortheUpperCaseletterknowledge,and10itemseachforBeginningSounds,PrintConcepts,andRhymeAwareness.Year1studentsmadesignificantgainsoverthepreschoolyearonallassessments.FallPreKtoFallKgainsweresignificantonallassessmentsexceptSpelling.SpringPreKtoFallKsummerlearninglosswasnon‐significantonallmeasurescollectedinKindergarten.Themagnitudeoflossoverthesummerforthefirstyearchildren,ifany,wasminimal.Overall,studentsbeganYear2atlowerachievementlevelsthanthestudentsinYear1.ThereweremoreELLstudentsintheprojectinYear2,andtheirEnglishproficiencywasquitelowattheFallpretest.ThisresultedintheloweraverageoverallforYear2.GainsweresignificantfromthebeginningtotheendofpreschoolforYear2childrenonallmeasurescollectedinEnglish.FallPreKtoFallKgainswerealsosignificant.Summerlosswasnegligible,iftherewasanyatall,fortheYear2students.
Table4.MeanScoresonAllChildAssessments
Year1 Year2 Year3
MeasureFallPreK
SpringPreK FallK
FallPreK
SpringPreK FallK
FallPreK
SpringPreK
PPVT 81.2 86.3* 87.7† 73.1 85.3* 88.6† 75.6 85.1*LetterWord 97.0 101.2* 99.3† 91.0 102.3* 101.0† 93.4 102.2*Spelling 92.1 94.2* 91.5† 83.6 90.6* 93.1† 85.4 90.7*PictureVocab. 91.2 94.0* 94.1† 81.7 90.6* 90.7† 80.6 87.6*OralComp. 89.4 91.2* 92.9† 85.2 88.3* 89.9† 84.8 87.7*UpperCase 11.0 18.0* ‐ 7.0 19.7* ‐ 9.2 19.6*BeginningSounds 5.7 7.5* ‐ 3.4 7.5* ‐ 5.5 7.0*PrintConcepts 4.9 6.1* ‐ 3.7 6.2* ‐ 4.6 6.0*RhymeAwareness 4.4 5.7* ‐ 4.8 6.8* ‐ 4.9 5.7*SpanishVocab. ‐ ‐ ‐ 75.4 75.0x ‐ 73.9 73.8**p<.05;gainsarestatisticallysignificant.†p<.05;FallPreKtoFallKgainsstatisticallysigni icant. Year3studentshadsimilarpretestscoresasthegroupofstudentsenteringpreKinYear2.TheYear3studentsmadesignificantgainsonallassessmentsconductedinEnglishfromthebeginningtotheendofpreschool.TheFall‐SpringchangeontheSpanishPictureVocabularytestwasnotstatisticallysignificantfortheYear2orYear3students.Thisfindingwasnotunexpected.TheSpanishtestisusedintheevaluationtoidentifywhetherELLstudentslosetheirSpanishproficiencyastheybegintolearnEnglish.ThoughaveragestandardscoresontheSpanishPictureVocabularytestarelow(SpringYear1andYear2averages=75and74,respectively),thechildren’sscoresdidnotdeclineovertheirpreschoolyear,agoodresult
ERFEvaluationReport2011 Page17of25
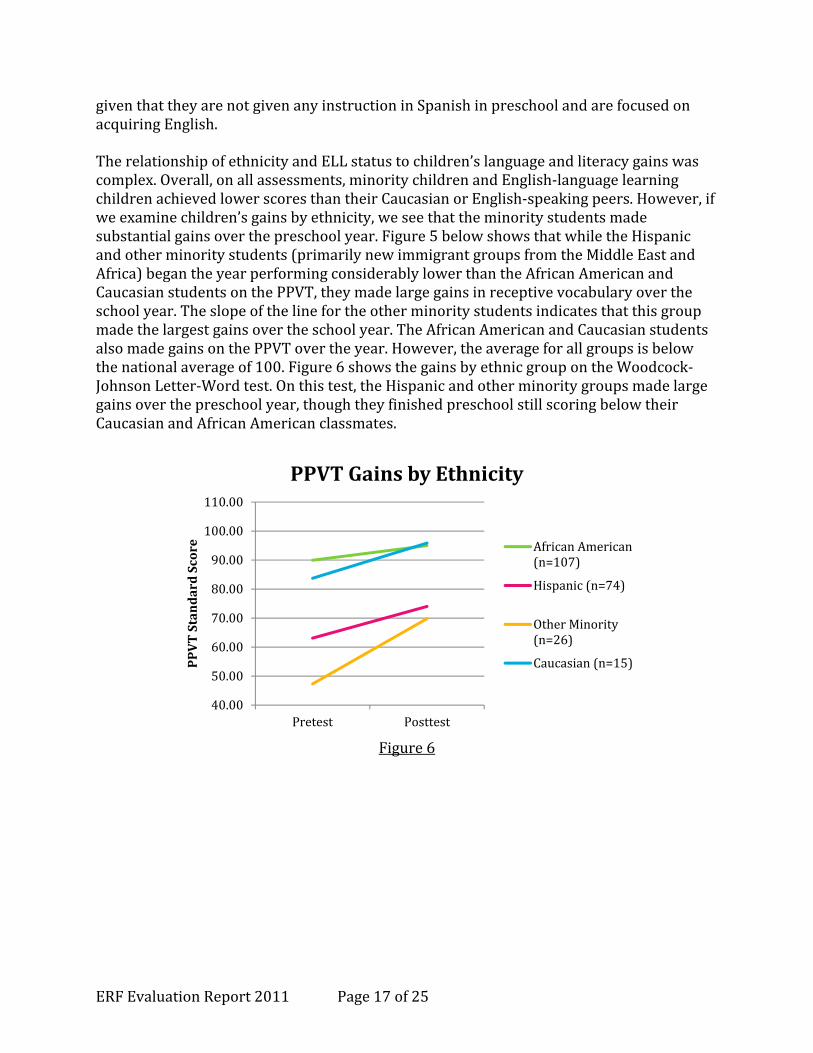
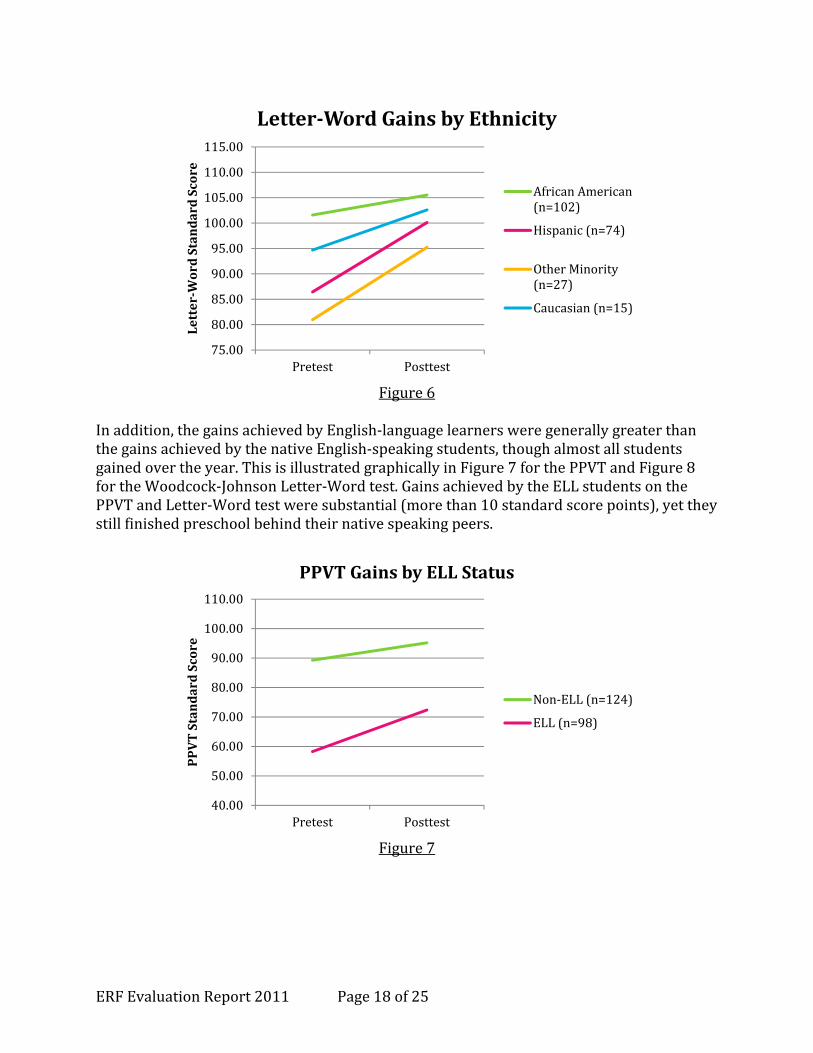
giventhattheyarenotgivenanyinstructioninSpanishinpreschoolandarefocusedonacquiringEnglish. TherelationshipofethnicityandELLstatustochildren’slanguageandliteracygainswascomplex.Overall,onallassessments,minoritychildrenandEnglish‐languagelearningchildrenachievedlowerscoresthantheirCaucasianorEnglish‐speakingpeers.However,ifweexaminechildren’sgainsbyethnicity,weseethattheminoritystudentsmadesubstantialgainsoverthepreschoolyear.Figure5belowshowsthatwhiletheHispanicandotherminoritystudents(primarilynewimmigrantgroupsfromtheMiddleEastandAfrica)begantheyearperformingconsiderablylowerthantheAfricanAmericanandCaucasianstudentsonthePPVT,theymadelargegainsinreceptivevocabularyovertheschoolyear.Theslopeofthelinefortheotherminoritystudentsindicatesthatthisgroupmadethelargestgainsovertheschoolyear.TheAfricanAmericanandCaucasianstudentsalsomadegainsonthePPVTovertheyear.However,theaverageforallgroupsisbelowthenationalaverageof100.Figure6showsthegainsbyethnicgroupontheWoodcock‐JohnsonLetter‐Wordtest.Onthistest,theHispanicandotherminoritygroupsmadelargegainsoverthepreschoolyear,thoughtheyfinishedpreschoolstillscoringbelowtheirCaucasianandAfricanAmericanclassmates.
Figure6
40.00
50.00
60.00
70.00
80.00
90.00
100.00
110.00
Pretest Posttest
PPVTStandardScore
PPVTGainsbyEthnicity
AfricanAmerican(n=107)
Hispanic(n=74)
OtherMinority(n=26)
Caucasian(n=15)
ERFEvaluationReport2011 Page18of25
Figure6
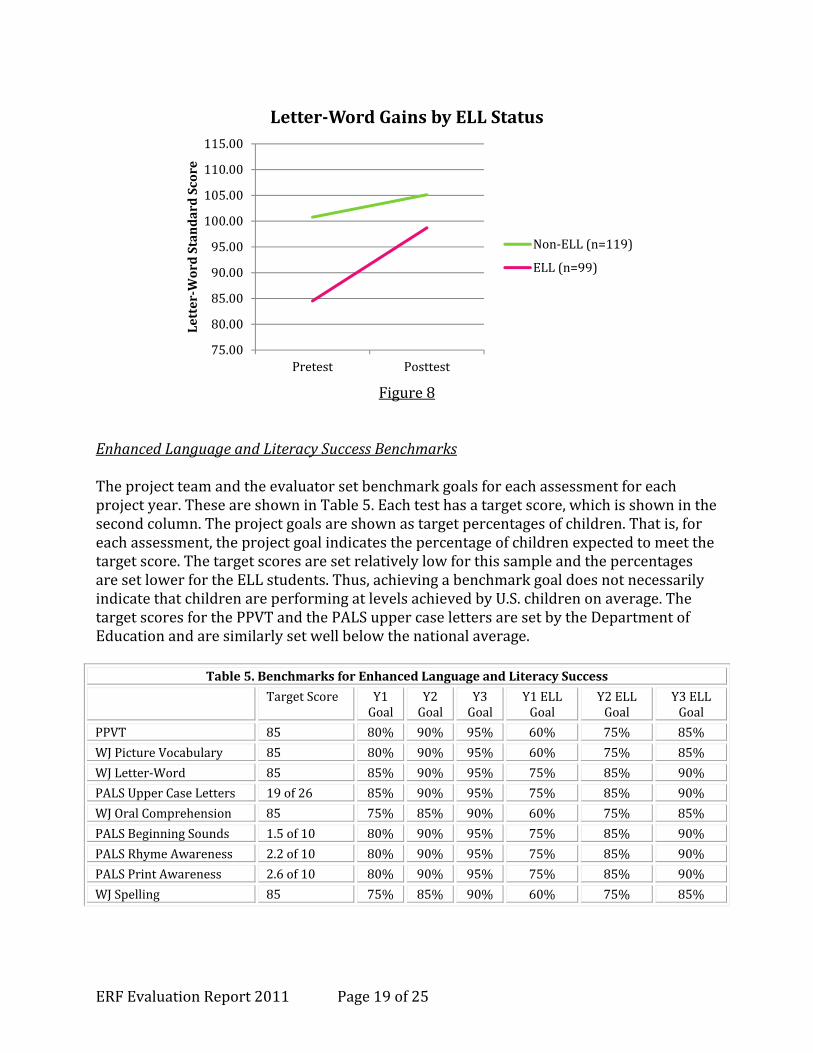
Inaddition,thegainsachievedbyEnglish‐languagelearnersweregenerallygreaterthanthegainsachievedbythenativeEnglish‐speakingstudents,thoughalmostallstudentsgainedovertheyear.ThisisillustratedgraphicallyinFigure7forthePPVTandFigure8fortheWoodcock‐JohnsonLetter‐Wordtest.GainsachievedbytheELLstudentsonthePPVTandLetter‐Wordtestweresubstantial(morethan10standardscorepoints),yettheystillfinishedpreschoolbehindtheirnativespeakingpeers.
Figure7
75.00
80.00
85.00
90.00
95.00
100.00
105.00
110.00
115.00
Pretest Posttest
Letter‐WordStandardScore
Letter‐WordGainsbyEthnicity
AfricanAmerican(n=102)
Hispanic(n=74)
OtherMinority(n=27)
Caucasian(n=15)
40.00
50.00
60.00
70.00
80.00
90.00
100.00
110.00
Pretest Posttest
PPVTStandardScore
PPVTGainsbyELLStatus
Non‐ELL(n=124)
ELL(n=98)
ERFEvaluationReport2011 Page19of25
Figure8
EnhancedLanguageandLiteracySuccessBenchmarksTheprojectteamandtheevaluatorsetbenchmarkgoalsforeachassessmentforeachprojectyear.TheseareshowninTable5.Eachtesthasatargetscore,whichisshowninthesecondcolumn.Theprojectgoalsareshownastargetpercentagesofchildren.Thatis,foreachassessment,theprojectgoalindicatesthepercentageofchildrenexpectedtomeetthetargetscore.ThetargetscoresaresetrelativelylowforthissampleandthepercentagesaresetlowerfortheELLstudents.Thus,achievingabenchmarkgoaldoesnotnecessarilyindicatethatchildrenareperformingatlevelsachievedbyU.S.childrenonaverage.ThetargetscoresforthePPVTandthePALSuppercaselettersaresetbytheDepartmentofEducationandaresimilarlysetwellbelowthenationalaverage.
Table5.BenchmarksforEnhancedLanguageandLiteracySuccess
TargetScore Y1Goal
Y2Goal
Y3Goal
Y1ELLGoal
Y2ELLGoal
Y3ELLGoal
PPVT 85 80% 90% 95% 60% 75% 85%
WJPictureVocabulary 85 80% 90% 95% 60% 75% 85%
WJLetter‐Word 85 85% 90% 95% 75% 85% 90%
PALSUpperCaseLetters 19of26 85% 90% 95% 75% 85% 90%
WJOralComprehension 85 75% 85% 90% 60% 75% 85%
PALSBeginningSounds 1.5of10 80% 90% 95% 75% 85% 90%
PALSRhymeAwareness 2.2of10 80% 90% 95% 75% 85% 90%
PALSPrintAwareness 2.6of10 80% 90% 95% 75% 85% 90%
WJSpelling 85 75% 85% 90% 60% 75% 85%
75.00
80.00
85.00
90.00
95.00
100.00
105.00
110.00
115.00
Pretest Posttest
Letter‐WordStandardScore
Letter‐WordGainsbyELLStatus
Non‐ELL(n=119)
ELL(n=99)

ERFEvaluationReport2011 Page20of25
Figures9and10showthepercentagesofchildrenmeetingtheYear3projectbenchmarksintheSpringoftheirPreKyear.Figure9showsalltheparticipatingstudentsandFigure10showstheELLstudents.Thebarsineachfigureindicatethepercentageofchildrenwhometthetargetscoreforeachtest.Theblackbarbellsshowthetargetpercentagessetbytheevaluatorandprojectteamatthebeginningoftheproject.Ifthelowerbarinthefiguremeetsthebarbell,thenthebenchmarktargetforthatassessmentwasmet.Ifthelowerbarfallsbelowthebarbell,thebenchmarktargetwasnotmetfortheyear.Inspiteofthesubstantialandsignificantgainsmadebythepreschoolchildren,benchmarktargetsweremetforonlyonetest:theWoodcockJohnsonLetter‐Wordtest.TheELLstudentsmettwobenchmarks:Letter‐WordandPrintAwareness.StudentsoverallhavethemostroomforimprovementonthePPVTandontheWoodcockJohnsonPictureVocabularyandOralComprehensiontests.ELLstudentsalsostruggledwiththePPVTandtheWoodcockJohnsonPictureVocabularyandOralComprehensiontests.
Figure9
5162 56
95
7067
92
6580
0102030405060708090100
PercentM
eetingBenchmark
PercentofChildrenMeetingProjectBenchmarks:2010‐2011SchoolYear
PercentatorAboveBenchmark PercentBelowBenchmark

ERFEvaluationReport2011 Page21of25
Figure10
WriteStart!ResultsTheWriteStart!assessmentwasdesignedtoassesschildren’semergingwritingskills.Children’sdrawingandwritingsamplesarescoredforprintform,letter‐soundcorrespondence,andwhetherchildrencandemonstratethepurposesofprintandwriting.Thechildrenareaskedtodrawapictureofthemselves,writetheirnames,andwriteacaptionthatdescribeswhattheyaredoinginaphotograph.Children’sself‐drawingswerescoredusingalistof20bodyparts.TheaveragenumberofbodypartsdrawnforboysandgirlsatthebeginningandendofPreKisshowninFigure15.BothboysandgirlswereabletocreatemorecomplexdrawingsattheendofPreK.Thesegainswerestatisticallysignificantforbothboysandgirls.Girlsgenerallyperformedslightlybetteronthistaskthanboys.
17 20 14
92
6255
87
5574
0102030405060708090100
PercentMeetingBenchmark
PercentofELLChildrenMeetingProjectBenchmarks:2010‐2011SchoolYear
PercentatorAboveBenchmark PercentBelowBenchmark

ERFEvaluationReport2011 Page22of25
Figure11
ChildrenwerealsoaskedtowritetheirnamesaspartoftheWriteStart!task.Thewrittenproductswerescoredforavarietyofcomponents.Below,wepresenttheresultsfornamewritingcompleteness,whichwasscoredintermsofthenumberoffirstnamelettersthatthechildrenwereabletoproduce.Figures12aand12bshowtheproportionsofchildrenateachlevelofnamewritingcompletenessforthefallandspringassessments.Inthefallofpreschool,about23%ofthechildrenwereabletoproduceallofthelettersintheirfirstname.But,27%ofthechildrenwereunabletoproduceanylettersatall.Bytheendofpreschool,only2.5%ofthechildrenproducednoletters,and72%ofthechildrencouldproducealloftheirnameletters,asubstantialimprovement.
78910
02468101214161820
Boys Girls
NumberofBodyPartsDrawn
FallandSpringSelf‐DrawingResults
Fall Spring

ERFEvaluationReport2011 Page23of25
Figure12a
Figure12b
NoLettersPresent28%
HalforFewerLettersPresent
38%
MorethanHalfLettersPresent
12%
AllLettersPresent23%
NameWritingCompletenessPretest
NoLettersPresent3% HalforFewer
LettersPresent10%
MorethanHalfLettersPresent15%
AllLettersPresent72%
NameWritingCompletenessPosttest

ERFEvaluationReport2011 Page24of25
Inadditiontothenamewritingtask,thechildrenalsowrotecaptionsdescribingwhattheyweredoinginaphotographthatwastakenduringtheschoolday.Thesecaptionswerescoredonavarietyofelements.Onescoringareafocusedonprintform(i.e.,thevisualcharacteristicsoftheirmarks).Figure13illustratesthechangesoverthepreschoolyearforprintform.Somechildrenwereunabletomakeanylettersorletter‐likeformsandgenerallyscribbledormadedrawings.TherewerefewersuchchildrenintheSpring.OtherswereabletocreateinventedlettersintheFall,buttherewerealsofewerofthesechildrenintheSpring.Themostadvancedchildrenproducedatleastsomeconventionallettersand,inafewcases,letter‐soundcorrespondence.Thefirsttwogroupsofbarshavefewerchildrenattheposttestthanatthepretest,whilethelasttwosetsofbarshavemoreorthesamenumberofchildrenattheposttestthanatthepretest.Thisindicatesthatchildren’swrittenmessageswereincreasinginsophisticationoverthepreschoolyear.Theincreasefrom10%ofchildrenabletocreatesomeletter‐soundcorrespondenceto37%ofchildrenwithletter‐soundcorrespondenceattheposttestisnoteworthy.
Figure13
14
30
46
107 10
4637
0102030405060708090100
Drawings&Scribbles
Inventedlettersandletter‐like
forms
Atleastsomeconventional
letters
Letter‐Soundcorrespondence
PercentofChildren
PhotoLabelingLetterForm
Pretest Posttest

ERFEvaluationReport2011 Page25of25
ConclusionsOverall,thethirdyearoftheEnhancedLanguageandLiteracySuccessprojectmettheexpectationsoftheprojectteam,especiallywithregardtoincreasedperformancebytheteachers.Allteacherswereimplementingmostaspectsofthecurriculum,andclassroomenvironmentsweregenerallyexemplary.Overthethreeprojectyears,theteachershavemadesubstantialchangesintheirclassroomsandtheirteachingpractices.Implementationfidelityimprovedfromthefirstprojectyearinallareasofthecurriculum.Theteachershavebeenremarkablyresponsivetothedata‐drivenfeedbackgeneratedbytheevaluation,andtheymadeimprovementsinYear3intheamountoftimespentinStoryTimeandSmallGroups.Areasforfutureimprovementeffortscouldinvolvereducingtransitiontimesintheclassroomsandencouragingteacherstohavemorecomplexinstructionalinteractionswiththestudents.Thestudentparticipantsmadelargeandstatisticallysignificantgainsoverthepreschoolyearonallassessments,thoughprojectbenchmarkswereonlyachievedontheLetter‐Wordtest.ChildrengenerallyperformedbetterontheassessmentsofbasicliteracyskillssuchastheLetter‐WordandSpellingtestsoftheWoodcockJohnsonthantheydidonthemoreadvancedlanguagemeasureslikethevocabularyandoralcomprehensiontests.ThechildrenreceivedthelowestscoresoverallonthePPVT,andtheWoodcockJohnsonPictureVocabularyandOralComprehensiontests.ChildrenalsohaddifficultywiththetwophonologicalawarenesstasksonthePALSassessment,theRhymeAwarenessandBeginningSoundstasks.Manystudentswerenotabletoprogresspastthepracticeitemsonthesetasksandthuscouldnotbescored.Nevertheless,thestudentsmadesubstantialprogressovertheirpreschoolyearinallaspectsoflanguageandliteracy.TheELLstudentsachievedlargegainsoverthepreschoolyearonallassessments.
Recommended