
EARLY ADOPTION OF ACCOUNTING STANDARDS IN THE BANKING INDUSTRY
BY
I-LING WANG
DISSERTATION
Submitted in partial fulfillment of the requirements for the degree of Doctor of Philosophy in Accountancy
in the Graduate College of the University of Illinois at Urbana-Champaign, 2011
Urbana, Illinois Doctoral Committee:
Professor Theodore Sougiannis, Chair Assistant Professor Jianxin Gong, Director of Research Assistant Professor Ganapathi S Narayanamoorthy Assistant Professor Raghunathan Venugopalan Associate Professor George Deltas

ii
ABSTRACT
I investigate whether U.S. bank holding companies choose early adoption of accounting
standards to better access external financing. Both economic intuition and theories suggest that
banks are motivated to take measures such as information disclosure to better access capital
markets. Examining accounting standards from January 1995 to March 2008 that allowed for
early adoption, I find that banks with lower profitability and higher risk profiles are more likely
to choose early adoption. This evidence is consistent with a bank’s incentive to better access
external financing. In addition, the results suggest a counter-signaling effect of early-adoption
decisions. I further find that banks are more likely to choose early adoption for the purpose of
having better access to external financing when the income effects of accounting standards are ex
ante undetermined or when only disclosures are required. I provide evidence that banks vary
their early-adoption decisions according to several accounting standard characteristics, such as
the income effects of accounting standards, standard type (financial versus non-financial), and
standard complexity. Finally, early adopters generally experience higher fund growth than
matched late adopters during economic expansions when banks are most motivated to attract
more funds.

iii
ACKNOWLEDGEMENT
I am indebted to my dissertation chair, Theodore Sougiannis, for his great support and invaluable
guidance throughout the dissertation process. In addition, I would like to thank the members of
my dissertation committee, George Deltas, James Gong, Ganapathi Narayanamoorthy, and
Raghunathan Venugopalan for their much appreciated and helpful feedback. I also thank Rashad
Abdel-khalik, Clara Chen, Yoon Ju Kang, Walied Keshk, Mark Peecher, Paul Polinski, Stephen
Rowe, Paula Sanders, Padmakumar Sivadasan, Brian White, Steve Wu, Flora Zhou, Hui Zhou,
and Aaron Zimbelman for their useful comments and encouragement. Special thanks to Andrew
Cheng for his assistance in collecting the data set, helpful feedback, and support. Finally, I thank
my family for their great support and encouragement in the pursuit of my doctoral degree.

iv
TABLE OF CONTENTS
CHAPTER 1: INTRODUCTION ............................................................................................... 1
CHAPTER 2: RELATED PRIOR LITERATURE AND HYPOTHESIS DEVELOPMENT ... 6
CHAPTER 3: LIKELIHOOD OF EARLY ADOPTING ACCOUNTING STANDARDS .... 12
CHAPTER 4: ADDITIONAL ANALYSES ............................................................................ 27
CHAPTER 5: SUMMARY AND CONCLUDING REMARKS ............................................. 30
REFERENCES ......................................................................................................................... 32
APPENDIX A. ACCOUNTING STANDARDS FROM JANUARY 1995 TO MARCH 2008
................................................................................................................................................... 37
APPENDIX B. LOGIT MODEL FOR EARLY ADOPTION DECISIONS ........................... 39
1
CHAPTER 1
INTRODUCTION
Early adoption of accounting standards (hereafter, early adoption) is an area that has been
investigated by several research studies. These studies have focused on different reasons behind
early adoption that encompass both contracting and information disclosure paradigms. Under the
contracting paradigm, the reasons found to be associated with early-adoption decisions include
maximizing accounting-based compensation bonuses, avoiding violations of debt covenants, and
minimizing political costs (e.g., Ayres 1986; Scott 1991; Sami and Welsh 1992; Ali and Kumar
1994). Under the information disclosure paradigm, Amir and Ziv (1997a, b) provide evidence
that early adoption can be an information signal to capital markets. They theoretically and
empirically show that managers use both early adoption and financial statement recognition to
disclose favorable information about previously unreported post-retirement liabilities. In addition,
they find that these firms experience a positive stock market reaction to their early-adoption
announcements, a finding consistent with managers choosing to early adopt the standard to
reveal low post-retirement liabilities relative to the market’s expectation. None of the studies
mentioned above include financial firms in their analysis, because these firms are regulated and
have radically different operations from non-financial firms (Scott 1991). Thus, early adoption
by banks is a largely un-researched area.
I attempt to fill the gap by examining early-adoption decisions of U.S. bank holding
companies (hereafter, BHCs or banks) on accounting standards, issued in the period from
January 1995 to March 2008 which allowed for early adoption.1 Economic intuition and theories
suggest that a crucial determinant of a bank’s performance is its access to financing.
Theoretically, information disclosure has been associated with better access to capital markets
(see Healy and Palepu (2001) for a review). I extend the information disclosure paradigm further
by investigating whether the incentive to better access external financing is a motivation for
banks to early adopt accounting standards. To my knowledge, this motivation has not yet been
investigated in the early adoption context. As such, it is appealing to study whether the external-
1 A bank holding company is defined as “A company that owns and/or controls one or more U.S. banks or one that owns, or has controlling interest in, one or more banks. A bank holding company may also own another bank holding company, which in turn owns or controls a bank.” (source: http://www.ffiec.gov/) The choice of the sample period is discussed in footnote 13.

2
financing motivation is important in explaining a bank’s early-adoption decisions because early
adoption is a form of information disclosure where new information is revealed through
recognition and/or disclosure. In addition, the majority of the accounting standard
pronouncements allowing for early adoption during 1995-2008 were related to financial
instruments. Because financial instruments are extensively used in banking activities, the
banking industry is an ideal sample to study the early adoption of these accounting
pronouncements.
To date, Beatty (1995) is the only paper that examines BHCs’ early-adoption decisions.
She finds that a bank’s motivation to increase regulatory capital is important in explaining its
decision to early adopt SFAS No. 115, which deals with accounting for investment securities.
My study adds to Beatty (1995) in the following ways. First, Beatty examines whether banks
early adopt to increase their regulatory capital through unrealized gains in investment securities
portfolios. In contrast, this study investigates whether banks early adopt accounting standards to
disclose information and thus to better access external financing in the form of either debt or
equity capital. Second, this study investigates several accounting standards that allow for early
adoption, whereas Beatty (1995) and prior studies examine only one standard at a time. The
multiple-standards setting enables me to examine whether the income effects of accounting
standards and standard-specific characteristics influence banks’ decisions to early adopt.2
Raising funds in capital markets is essential to banks, yet not all banks choose to early
adopt during the sample period of this study. This observation suggests that banks vary in their
capability/needs to raise funds externally, ceteris paribus. Existing theoretical and empirical
voluntary disclosure research suggests that firm profitability is associated with a firm’s
motivation for disclosure, such as conveying good news and having better access to external
financing. For a firm’s incentive to convey good news, a vast majority of voluntary disclosure
theories suggest that firms are more likely to choose disclosure to reduce adverse selection costs
due to information asymmetry as their private information becomes more favorable (e.g.,
Verrecchia 1983; Dye 1986; Darrough and Stoughton 1990). Empirical studies show mixed
results. While some studies document a positive association between firm profitability and
2 In this study, I focus on the association between bank characteristics and banks’ external financing incentive, and the effect of that association on early-adoption decisions. Therefore, the multiple-standard-setting enables a powerful test and generalizability of the results. A drawback of this setting is that I am unable to “customize” an early-adoption decision model for each accounting standard and I leave this issue for future research.

3
management earnings forecasts (e.g., Lev and Penman 1990; Lang and Lundholm 1993, 2000),
other studies argue and document that firms choose to disclose preemptive bad news in earnings-
related disclosures when facing potential litigation costs or management reputation costs (e.g.,
Skinner 1994; Cao and Narayanamoorthy 2011). For a firm’s incentive to better access external
financing, recent disclosure studies have suggested a negative association between firm
profitability and voluntary disclosure (e.g., Francis, Khurana, and Pereira 2005; Suijs 2007).
These studies argue that high profit firms have few concerns about acquiring funds in capital
markets because they are financially healthy. They can either generate funds through internal
growth or raise funds externally with low cost of capital without additional disclosure. On the
other hand, low profit firms have limited ability to generate funds internally and thus are
relatively reliant on external financing. High profit firms, therefore, are not as motivated as low
profit firms to choose disclosure to gain better access to external financing. Taken together, the
above discussion suggests that bank profitability is an important determinant of the likelihood of
early adoption. It is, however, an empirical issue whether a bank’s incentive to better access
external financing dominates other reasons in their early-adoption decisions.
Besides profitability, voluntary disclosure studies also investigate the association between
firm risk and a firm’s incentive to better access external financing. Empirical studies suggest that
non-financial firms can better access external financing through voluntary disclosure by lowering
the cost of capital (e.g., Botosan 1997; Sengupta 1998; Botosan and Plumlee 2002). Lang and
Lundholm (1993) argue that if firm performance variability proxies for information asymmetry
between investors and managers, riskier firms are more likely to choose disclosure to reduce
adverse selection costs due to information asymmetry. Consequently, risky firms can better
access external financing with lower cost of capital through voluntary disclosure than without
such disclosure. Suijs (2007) theoretically suggests that the likelihood of disclosure increases
with the uncertainty in firms’ future performance (i.e. firm risk profiles). The above discussion
suggests that the likelihood of early adoption is positively associated with bank risk profiles.
I use logit regressions to test the association of early-adoption decisions with bank
profitability and bank risk profiles by examining the early-adoption decisions of 486 U.S. BHCs
for 16 accounting standards. I find a negative relationship between the likelihood of early
adoption and bank profitability. In addition, I find a positive relationship between the likelihood
of early adoption and bank risk profiles. Standardizing the coefficients on explanatory variables,

4
I find that a one-standard-deviation decrease in bank profitability increases the odds ratio (early
adoption to late adoption) by 47%. A one-standard-deviation increase in interest rate risk on the
investment portfolios, credit risk on the loan portfolios, the notional amount of derivative
exposures, and the operational risk increases the odds ratio by 19%, 23%, 13%, and 14%,
respectively. Further analysis shows that the predictions are best supported in the contexts of
early-adoption decisions on accounting standards with ex ante undetermined income effects and
with only disclosure requirements. Moreover, banks are more likely to choose to adopt early
accounting standards related to financial instruments or with low standard complexity for the
purpose of better accessing capital markets.
In summary, the above findings indirectly support the assertion that early-adoption
decisions are based on gaining better access to external financing. To provide ex post evidence
on a bank’s incentive to better raise funds in capital markets, I examine whether early bank
adopters generally experience higher growth of funds than their matched late bank adopters
between the standard issue date and its effective date (i.e., the testing period) after controlling for
bank profitability. It is also worth noting that a bank’s financing strategies may change with
macroeconomic conditions. For instance, during economic expansions, the market demand for
loans increases and therefore banks’ demand for funds also increases. On the other hand, the
market demand for loans decreases during economic contractions and therefore banks are less
motivated to expand sources of funds. Consequently, I expect early adopters to experience higher
growth of funds than matched late adopters during economic expansions. The results show that
early adopters generally experience a higher growth of funds than matched late adopters in
testing periods that take place during economic expansions. Further analysis shows that the
major source of funds contributing to the growth is short-term liabilities other than deposits.
This paper extends and complements prior early-adoption studies in several ways. First,
this paper introduces incentives to better access external financing as a new reason to early adopt.
To the best of my knowledge, this is the first paper to utilize a large set of early-adoption data of
BHCs and systematically examine BHCs’ early-adoption decisions. Early adoption of accounting
standards is rare for banks, with the rate of early adoption ranging from zero to 19%. Despite this
rarity, the ex post evidence in this study on early-adopters’ immediate improvement in accessing
capital markets reinforces the idea that banks’ incentive to better access external financing is
important in explaining their early-adoption decisions. Second, by analyzing adoption of

5
multiple standards, this study provides evidence of variations in early-adoption decisions given
different income effects of accounting standards, standard types (financial versus non-financial),
and standard complexity. Finally, the evidence of negatively associated bank profitability and
positively associated bank risk profiles with early-adoption decisions suggests a counter-
signaling effect (e.g., Feltovich, Harbaugh, and To 2002) of early-adoption decisions. The
signaling theory suggests that high quality firms undertake costly actions to signal their superior
quality and separate themselves from low quality firms (e.g., Spence 1973, 2002; Morris 1987).
Therefore, qualified signals distinguish two types of firms: low or high quality firms. When
additional noisy information on firms’ quality is available, the counter-signaling theory suggests
that high quality firms choose not to signal their quality or counter-signal to separate themselves
from medium quality firms. Medium quality firms, on the other hand, choose to signal to
separate themselves from low quality firms. Therefore, in a counter-signaling equilibrium, three
types of firms are identified: low, medium, or high quality firms. Prior accounting research on
accounting choice has applied the signaling theory to explain managers’ decisions but the results
do not always concur with the theory (e.g., Eakin and Gramlich 2000; Aboody, Barth, Kasznik
2004). This study is the first to identify counter-signaling effects of early-adoption decisions
because it documents that early-adopting banks are not necessarily the less risky and the most
profitable. As banks are closely scrutinized by bank regulators, maintaining growth in
profitability and practicing sound risk management are of utmost importance to banks’
operations. Hence, implications about a bank’s future financial performance may be gathered by
analyzing its early-adoption decisions over time.
The remainder of this paper is organized as follows. Chapter 2 reviews related early
adoption literature and develops the hypotheses. Chapter 3 describes the empirical predictions
and research design, and presents findings. Chapter 4 proceeds with additional analyses. Chapter
5 summarizes and concludes.

6
CHAPTER 2
RELATED PRIOR LITERATURE AND HYPOTHESIS DEVELOPMENT
2.1 Related Prior Literature
Extant work on the selection of time for which mandatory accounting standards are
adopted (i.e., early adoption or adoption timing) focuses on issues such as motivations for early
adoption (e.g., Ayres 1986; Scott 1991; Langer and Lev 1993; Ali and Kumar 1994; Amir and
Livnat 1996; Gujarathi and Hoskin 2003), and economic consequences or stock market reactions
to early adoption (e.g., Lee and Stiner 1993; Beatty 1995; Amir and Ziv 1997a, b). The first
application of the positive theory of accounting (Watts and Zimmerman 1986) to management’s
choice of adoption date of an accounting standard appears in Ayres (1986). That study examines
the existence of systematic differences between early and late adopters of the new foreign
currency translation accounting standard, SFAS No. 52 (FASB 1981), and finds results
consistent with the debt and compensation contracting, and political costs hypotheses.
Scott (1991), Langer and Lev (1993), and Ali and Kumar (1994) examine managerial
motives for choosing the adoption timing of the new standard on pension accounting, SFAS No.
87 (FASB 1985). Scott (1991) examines and documents the influence of political costs,
management compensation contracts, and the magnitude of the income effect of the adoption on
the adoption-timing choice. In the context of examining FASB’s justification for an extended
adoption period, Langer and Lev (1993) show that a motive to increase reported earnings
consistently distinguishes early versus late adopters. Ali and Kumar (1994) complement the
literature by studying interactions between firm characteristics and the magnitude of the income
effect of the adoption in explaining the adoption-timing choice. They find that including
interactions enhances the explanatory power of the adoption-timing choice model.
Gujarathi and Hoskin (2003) investigate factors that affect economic incentives to early
adopt the new accounting standard on income taxes, SFAS No. 96 (FASB 1987). Their results
are consistent with the political cost hypothesis and the debt and compensation contract
hypotheses in explaining early adoption decisions and the choice of the transition method.
Similar to Ali and Kumar (1994), they also document higher explanatory power of the early
adoption model with interactions between the income effect of the adoption and other testing
variables.
7
Amir and Livnat (1996) study a manager’s motives to early adopt the new accounting
standard on postretirement benefits other than pensions, SFAS No. 106 (FASB 1990). By
comparing early and late adopters, they show that firms early adopt the standard to correct the
market’s perception of the magnitude of the postretirement benefit obligation (PRB) as lower. In
addition, they show that firms early adopt the standard in the quarter with the lowest earnings
and delay adoption to negotiate a plan amendment. Amir and Ziv (1997b) develop a theoretical
model that shows how firms use adoption timing and recognition/disclosure choices to convey
their private information to the market (assuming managers have private information about the
valuation effects of a standard). In their companion paper, Amir and Ziv (1997a) empirically
document the predictions from Amir and Ziv (1997b) in the context of early adopting SFAS No.
106. Specifically, they find that, on average, early adopters experience more extreme changes in
earnings during the adoption year (compensation contract hypothesis), carry smaller PRB at the
mandatory adoption date, and are less likely to renegotiate their contracts. In addition, they find
that early adopters generally experience positive market reactions to their adoption
announcements and perform better than late adopters during the five years prior to the mandatory
adoption date.
Beatty (1995) is the only study that examines the determinants of the early-adoption
decisions by the banking industry. She finds that BHCs choose early adoption of SFAS No. 115
(FASB 1993) to increase regulatory equity. The standard requires available-for-sale securities to
be fair-valued, with the changes in fair values to be charged to an equity account as unrealized
gains or losses. Most banks have net unrealized gains in their investment portfolios when the
standard is issued. Therefore, early adopting the standard provides an opportunity for banks to
increase their regulatory capital because net unrealized gains could be included in the calculation
of regulatory capital.3 She finds that early-adopting BHCs are characterized as having low
leverage ratio and high ROE, and managing their securities portfolios in the past to increase
reported equity. In addition, she examines the changes in investment behavior between early and
late adopters of SFAS No. 115. According to her findings, early adopters reduce the proportion
of investment securities to assets and the maturity of the investment securities held due to the
3 The effect of the standard on Tier 1 capital, however, was excluded by the Federal Reserve Board three quarters after the standard became mandatorily effective in November 1994 (Beatty 1995).
8
attempts to reduce regulatory capital costs as potential volatility in recognized fair values and in
the regulatory capital ratios increases.
As shown above, most studies on why managers choose to early adopt accounting
standards are based on a contractual framework. Generally, the studies find that a manager’s
motives for early adoption are consistent with the debt and compensation contract hypotheses
and the political cost hypothesis. However, there are few empirical investigations into the
informational effect on early-adoption decisions. In addition, the literature is short of evidence
on the banking industry.
This paper complements the current early-adoption literature by examining BHCs’
incentive to early adopt accounting standards to disclose information and thus better access
external financing. I consider banks’ incentives to early adopt accounting standards from an
information disclosure perspective for the following reason. In some sense, banks are no
different from other firms in terms of their goals to maximize firm values. Banks enjoy the
economies of scale in the acquisition/production of information about borrowers and have
expertise in taking deposits and making loans to individuals and businesses (Berger, Herring, and
Szego 1995). Banks are subject, however, to bank regulatory supervisions. They need to
maintain adequate capital and show the bank regulators their capability of effectively managing
bank balance sheets and related risks.4 Under regulations, banks have every incentive to stay
well-capitalized for economic benefits such as less regulatory scrutiny and more operational
flexibility. In addition, it is often costly to raise equity capital quickly if the banks are not well
capitalized (Beatty et al. 1996; Furlong and Kwan 2007). The above discussion clarifies that
maintaining capital and managing risk are essential to banks. To this end, banks have the
incentives to disclose information for the purpose of better accessing capital markets.
4 The supervisory rating system for bank holding companies is known as BOPEC (Bank subsidiaries, Other nonbank subsidiaries, Parent company, Earnings, and Capital adequacy) (Hirtle and Lopez 1999). Although the Federal Reserve emphasized risk management in its supervisory processes, this component was not directly reflected in the name of BOPEC. Therefore, in December 2004, the Federal Reserve revised the rating system as RFI/C(D) (Risk Management (R); Financial Condition (F); potential Impact (I) of the parent company and nondepository subsidiaries (collectively nondepository entities) on the subsidiary depository institution(s); Composite rating (C) based on an evaluation and rating of its managerial and financial condition and an assessment of future potential risk to its subsidiary depository institution(s); Depository Institution (D)). The revised rating system became effective on January 1, 2005 (Federal Reserve Board 2004).

9
2.2 Incentive to Better Access External Financing
Extant disclosure theories and empirical research suggest that firms are motivated to
disclose information voluntarily to better access external financing (e.g., Leland and Pyle 1977;
Myers and Majluf 1984; Ruland, Tung, and George 1990; Frankel, McNichols, and Wilson 1995;
Lang and Lundholm 2000; Francis, Khurana, and Pereira 2005; Suijs 2007). Empirical studies
also show that firms experience lower costs of debt and equity capital with more disclosure (e.g.,
Botosan 1997; Sengupta 1998; Botosan and Plumlee 2002; Francis, Khurana, and Pereira 2005).
Because banks need to raise funds in capital markets, they are motivated to have better access to
external financing with voluntary disclosure.
Banks may vary in their capability or needs of raising funds externally. Therefore, the net
expected benefits/costs of voluntary disclosure for the purpose of having better access to external
financing differ according to bank characteristics. Prior voluntary disclosure research suggests
that firm profitability is associated with a firm’s disclosure decisions. Specifically, firm
profitability may proxy for a firm’s incentive to convey favorable information and to better
access external financing. For firms’ incentive to convey favorable information, prevalent
disclosure theories and empirical studies suggest that firms are more likely to choose disclosure
to reduce information asymmetry as their private information becomes more favorable (e.g.,
Verrecchia 1983; Dye 1986; Darrough and Stoughton 1990; Lev and Penman 1990; Lang and
Lundholm 1993, 2000). A general explanation for the theoretical prediction and empirical
findings is non-zero disclosure costs. On the other hand, some empirical studies argue and
document that firms choose to disclose preemptive bad news to minimize potential litigation
liability or management reputation costs (e.g., Skinner 1994; Cao and Narayanamoorthy 2011).
For a firm’s incentive to better access external financing, prior studies suggest that firm
profitability is negatively associated with a firm’s incentive to better access external financing
and thus negatively with voluntary disclosure. Francis, Khurana, and Pereira (2005) argue that
the cost of external financing is particularly important for firms with limited internal cash flows;
those firms are motivated to make voluntary disclosures to lower the cost of capital. Intuitively,
firms can either generate cash flows internally or acquire capital externally to fund their
operations or investments. Low profit firms, however, have limited ability to generate cash flows
internally, and thus making the cost of external financing particularly important to them.
Therefore, low profit firms are relatively motivated to choose disclosure compared to high profit

10
firms to lower the cost of external financing. Suijs (2007) models how a firm varies its voluntary
disclosure policy to acquire more capital from an investor when the firm is uncertain how the
investor will respond to the disclosure. The model suggests a partial disclosure equilibrium
where a firm hides high profit and discloses low profit. The intuition is that a high profit firm can
easily raise funds in capital markets without disclosure compared to a low profit firm. As a result,
low profit firms are more motivated than high profit firms to choose voluntary disclosure.
In summary, the preceding discussion suggests an association between voluntary
disclosure and firm profitability. Albeit the results conflict from extant empirical studies on the
association between firm disclosure and firm profitability, they still support the idea that
voluntary disclosures arise when the expected benefits exceed costs. Consequently, whether
banks’ incentive to better access external financing dominates in their early-adoption decisions
remains an empirical issue. I hypothesize bank profitability in an alternative form as follows:
H1: The likelihood of early adoption is negatively related to bank profitability.
Voluntary disclosure research also motivates the association between firm risk and a
firm’s incentive to better access external financing. In an empirical study, Lang and Lundholm
(1993) argue if firm performance variability (i.e., firm risk) proxies for information asymmetry
between investors and managers, firms with high performance variability are more likely to
choose disclosure to relieve information asymmetry. Moreover, studies find that firms can
improve external financing with voluntary disclosure by lowering costs of debt and equity capital
(e.g., Botosan 1997; Sengupta 1998; Botosan and Plumlee 2002). The discussion therefore
implies a positive association between firm risk profiles and voluntary disclosure. In addition,
Suijs (2007) theoretically suggests that the likelihood of disclosure increases with the uncertainty
in firms’ future performance (i.e. firm risk profiles). The intuition is that when uncertainty in
firms’ future performance increases, less risky investment targets such as a risk-free asset
become more and more attractive to investors in the absence of disclosure. Consequently, riskier
firms, which experience relatively high profits compared to the return of the risk-free asset, are
more likely to choose disclosure to attract investors’ capital away from the risk-free asset.5
Because early adoption is a form of voluntary disclosure, banks with higher risk profiles are
5 In a similar note, Jung and Kwon (1988, p. 151) suggest that the disclosure threshold is lower (i.e., more likely to disclose) when uncertainty in firm value is higher under the assumption that the market is unsure whether managers indeed possess information.

11
more likely to choose early adoption to better access external financing. I hypothesize bank risk
profiles in an alternative form as follows:
H2: The likelihood of early adoption is positively related to bank risk profiles.
The above leads to an intriguing issue questioning whether a bank that chooses early
adoption can better access external financing ex post than if it does not choose early adoption.
Consequently, I hypothesize better access to external financing in an alternative form as follows:
H3: A bank that chooses early adoption can better access external financing than if
it does not choose early adoption.
12
CHAPTER 3
LIKELIHOOD OF EARLY ADOPTING ACCOUNTING STANDARDS
3.1 Empirical Predictions
In the previous section, I illustrate a bank manager’s motive for early adoption to provide
information and to obtain better access to capital markets. Now, I describe the test variables used
to study these incremental benefits/costs to early adoption. I explain other control variables
which are commonly used in prior literature. Finally, I discuss the variables used to control for
accounting standard characteristics which represent incremental costs and benefits to
management when they decide to early adopt an accounting standard.
3.1.1 Test Variables
The first set of test variables relate to bank profitability. The proxy for bank profitability
is NIM, the ratio of net interest income to total assets adjusted for the average NIM of peer banks
at the first quarter-end after the adoption of a new standard.6 I expect a negative relationship
between early adoption and NIM, as discussed in section 2.2. To examine whether banks’
incentive to disclose preemptive bad news drives the negative relationship instead of their
incentive to better access external financing, I include an indicator variable BADNEWS.
BADNEWS is equal to 1 if NIM is less than zero and 0 otherwise. I predict a negative relationship
between early adoption and BADNEWS if the concern for potential litigation liability and
management reputation costs is not an issue in banks’ early-adoption decisions. I also examine
whether high-profit banks are more likely to choose early adoption when they are more certain of
receiving a positive response to the disclosure as suggested by Suijs (2007). That is, to examine
whether the negative relationship between early adoption and NIM is moderated as the level of
response certainty increases, I include a proxy for response certainty and interact it with NIM.
Response certainty, RPCERTAINTY, is measured by the percentage of times that a bank’s net
interest margin is greater than the average net interest margin of peer banks during the past
6 A primary objective in asset-liability management for banks is managing net interest margin (NIM). It measures how well banks minimize interest paying to liabilities (e.g., deposits and long-term debts) while maximizing interests receiving from assets (e.g., loans) to produce consistent growth in the loan portfolio and shareholder earnings (Demirgüç-Kunt and Huizinga 1999). I adjust the net interest margin for the average net interest margin of peer banks to remove the effect of the macroeconomic conditions specific to the time period. This adjusted measure also proxies for the information not yet expected by the market. A drawback of this measure is that the time-series property of the profitability measure of a bank is not controlled for. I also use ROA instead of NIM, and the results are qualitatively the same.

13
twelve quarters before the announcement date of an accounting standard.7 A higher level of
response certainty means that a bank is more certain of receiving a positive response following
the disclosure of its performance. Therefore, conditional on knowing its performance, a bank is
more likely to disclose its profitability when it is more certain of receiving a positive response
following the disclosure. Consequently, I predict a positive relationship between early adoption
and RPCERTAINTY as well as NIM_RPCERTAINTY (an interaction term between NIM and
RPCERTAINTY).
The second set of predictions relates to bank risk profiles (i.e., interest rate risk, credit
risk, exposures and credit risk on derivatives, and operational risk on noninterest income). I
predict that banks with higher risk profiles are more likely to early adopt an accounting standard.
I evaluate bank risk profiles in four dimensions: (1) interest rate risk, (2) credit risk, (3)
exposures and credit risk on derivatives, and (4) operational risk. All risk proxies are adjusted for
the corresponding average risk proxies of peer banks except for indicator variables. This
adjustment controls the effect of macroeconomic conditions on banks’ risk management or risk-
taking behavior. The following paragraphs provide detailed discussions on the proxies chosen.
The two proxies for interest rate risk are AFSOFINV, the ratio of available-for-sale
securities (excluding equity securities) to total investment securities, and CONTRACT, an
indicator variable equal to 1 if the bank holds interest rate derivative contracts and 0 otherwise.
Banks with higher proportion of available-for-sale securities out of total investment securities
have greater financial flexibility in managing interest rate risk and thus have lower interest rate
risk (e.g., Beatty 1995; Hodder, Kohlbeck, and McAnally 2002; Papiernik, Meier, and Rozen
2004). Therefore, this paper expects a negative relationship between early adoption and
AFSOFINV. Banks can hold derivative contracts to manage interest rate risk or to speculate (e.g.,
Chen, Liu, and Ryan 2008). Thus, I do not predict the sign of CONTRACT.
The proxy for credit risk on loan portfolios is LOANRISK, the ratio of the allowance for
loan losses to average loans. It measures the amount of buffer the bank management creates for
the whole loan portfolios in case of future write-offs (e.g., Joyce 1996). Banks with a higher ratio
of loan loss allowance to average loans are associated with lower credit risk and higher loan
7 The results are similar regardless of the length of period the response certainty is measured (ranging from 4 quarters to 20 quarters). The average profitability of peer banks is chosen as a benchmark because it is a legitimate proxy for the investors’ prior expectations of a bank’s profitability. Although analysts’ EPS forecasts can be another benchmark used to construct response certainty, doing so would reduce more than half of the sample observations. Therefore, I choose to use the average net interest margin of peer banks as a benchmark.

14
quality (Eccher, Ramesh, and Thiagarajan 1996, p. 103). Therefore, I expect a negative
relationship between early adoption and LOANRISK.
The proxy for exposures of derivatives is EXPOSUREDER, the ratio of the gross notional
amount of derivative contracts other than purchased options to total assets. Derivative contracts
such as futures, forward contracts, written options, and swaps have no particular limits on the
exposures. The financial exposures of purchased options, however, are limited to their book
values accounted for in the financial statements (Nissim and Penman 2007). The proxy for credit
risk of derivatives is CREDITRISKDER, an indicator variable equal to 1 if the gross notional
amount of over-the-counter (OTC) derivative contracts is greater than that of exchange-traded
derivative contracts and 0 otherwise. Exchange-traded derivative contracts such as futures and
exchange-traded options have trivial credit risk because the exchanges act as the counterparty to
each contract (Nissim and Penman 2007). As a result, banks with greater proportion of OTC
derivative contracts relative to exchange-traded derivative contracts are positively associated
with credit risk on derivative contracts. Therefore, I expect a positive relationship between early
adoption and EXPOSUREDER/CREDITRISKDER.
The proxy for operational risk is NONINTCHG, the average quarterly growth in
noninterest income over the past six quarters. Noninterest income has become an increasingly
important source of revenues in the banking industry. However, noninterest income growth is
much more volatile than the net interest income growth, largely due to volatile trading revenues.
In addition, it is shown that the higher the share of income derived from noninterest activities,
the lower the risk-adjusted returns and the higher the insolvency risk (e.g., Stiroh 2004).
Therefore, banks with a higher share of income derived from noninterest activities are positively
associated with higher operational risk. I expect a positive relationship between early adoption
and NONINTCHG.
3.1.2 Control Variables
I control for several variables used in prior early adoption literature. In particular, I
control for bank size, SIZE, the logarithm of total interest and noninterest income. The effect of
size is most commonly attributed to political visibility (e.g., Ayres 1986; Moyer 1990; Scott
1991; Ali and Kumar 1994). However, differences in accounting choices between large and
small firms could be due to other reasons (e.g., Trombley 1989). For example, size can also
proxy for compliance costs (e.g., Ball and Foster 1982; Sami and Welsh 1992; Langer and Lev

15
1993). In the context of government regulations, Ball and Foster (1982) suggest that the
compliance costs could decrease in firm size. Sami and Welsh (1992) suggest that large firms are
more likely to have the necessary resources to adopt an accounting standard early if information
production costs associated with adoption are high. Prior studies also document that size is
positively associated with firms’ litigation risk which in turn influences firms’ disclosure
decisions (e.g., Cao and Narayanamoorthy 2011). Therefore, I do not predict a sign on the
relationship between early adoption and SIZE.
I use LEVERAGE, the ratio of total liabilities to total assets, as a proxy for banks’
propensity to access capital markets (e.g., Aboody, Barth, and Kasznik 2004). The easier it is for
banks to access capital markets, the lower the benefits associated with early adoption of an
accounting standard. On the other hand, Cao and Narayanamoorthy (2011) show that leverage
ratio is positively associated with firms’ litigation risk and that the likelihood of voluntary
disclosure increases in litigation risk. Thus, I do not predict a sign on the relationship between
early adoption and LEVERAGE.8
I use DROE as a proxy for bank management’s incentives to delay early adoption of
income-increasing accounting standards to maximize current and future compensation (e.g., Ali
and Kumar 1994; Gujarathi and Hoskin 2003). DROE is an indicator variable equal to 1 if a
BHC’s return on equity (ROE) falls in the highest or lowest quartiles of the ROE distribution for
the sample BHCs and 0 otherwise. NIEFF is coded as 1 if the income effect of adoption is
expected to be positive, -1 if negative, and 0 if the direction of the income effect is undetermined
or if there is no income effect of adoption (e.g., Ali and Kumar 1994; Gujarathi and Hoskin
2003). I expect a positive relationship between early adoption and NIEFF. To test the conditional
effect of DROE on the likelihood of early adoption, an interaction term is created, DROE_NIEFF,
between DROE and NIEFF. Managers of banks with extreme ROE are less likely to early adopt
an income-increasing accounting standard, as it is less likely to make a difference in the
calculation of bonus compensation (e.g., Gujarathi and Hoskin 2003). Therefore, I expect a
negative relationship between early adoption and DROE_NIEFF and do not predict the sign of
the relationship between the likelihood of early adoption and DROE.
8 The debt ratio may also proxy for the tightness of existing debt covenants (Aboody, Barth, and Kasznik 2004). However, it is not feasible to test the debt covenant hypothesis without a discussion on the income effect of the adoption and thus the effect on debt contracting costs. Therefore, I do not predict the sign of the relationship between early adoption and leverage if leverage is viewed as a proxy for the tightness of existing debt covenants.

16
While early-adoption decisions on various accounting standards seem independent from
each other, some consistency in the adoption policy of each bank over time may exist. Therefore,
a bank that chose early adoption of previously issued accounting standards will likely continue to
choose early adoption of a new accounting standard. To control for the consistency in the
adoption policy, I construct a variable, CULTURE, which measures the percentage of times that
a bank chose to early adopt accounting standards issued in prior periods. I predict that a bank is
more likely to early adopt a new accounting standard when CULTURE is higher.9
Market competition may be another important consideration factor. First, market
competition may explain the negative relationship between bank profitability and early adoption.
Specifically, banks which operate in highly concentrated markets (i.e., with monopoly power)
tend to have high profitability. On the other hand, banks that operate in competitive markets tend
to have lower profitability than those that operate with monopoly power. This information
suggests a positive relationship between profitability and market concentration; therefore, there
is possibly a correlated omitted variable problem. To relieve the problem, I include a measure of
market concentration (MKTHERF) in the early-adoption decision model. MKTHERF is
calculated as the sum of squared market shares in terms of total revenues (i.e., total net interest
income and noninterest income) of all BHCs in population operating in the same geographic
region.10 Second, market concentration itself may also contribute to early-adoption decisions. In
particular, voluntary disclosure literature suggests that proprietary costs may keep firms from
making disclosure (e.g., Verrecchia 1983; Graham, Harvey, and Rajgopal 2005). One commonly
used measure of proprietary costs is the level of market concentration. Several empirical studies
in the voluntary disclosure literature suggest a positive relationship between the level of
proprietary costs associated with information disclosure and the level of market concentration
(e.g., Scott 1994; Botosan and Harris 2000; Sengupta 2004). However, the results on this
relationship are often mixed. Given the above discussion, I do not predict a sign on MKTHERF.
9 I also construct another variable which considers a bank’s historical adoption pattern regarding similar types of accounting standards. However, including this variable in the early-adoption decision model reduces the total sample observations by half and the coefficient on this variable is not statistically significant. 10 Following Moyer (1990), I consider five geographic regions: Eastern, Southeast, Midwest, Southwest, and West. I construct another market concentration measure based on 13 Federal Reserve Districts: Boston, New York, Philadelphia, Cleveland, Richmond, Atlanta, Chicago, St. Louis, Minneapolis, Kansas City, Dallas, San Francisco, and Washington, D.C. The last way to classify markets is that I assume large BHCs (total assets greater than $10 billion) operate at a national level whereas small (total assets less than $1 billion) or mid-sized BHCs (total assets between $1 billion and $10 billion) operate in local or regional markets. The results are qualitatively the same.
17
3.1.3 Accounting Standard Characteristics
The FASB issued 16 accounting standards from January 1995 to March 2008 that
allowed reporting entities to early adopt those pronouncements. All of these standards are fair-
value related. Topics of these standards relate to leases, servicing assets and liabilities, stock
compensation, retirement benefits, derivatives and hedging, intangibles, asset retirement, exit or
disposal cost obligations, fair value measurements and disclosures, and financial instruments.
The diversity in standard characteristics given in this set of sample accounting standards enables
me to examine features representing costs and benefits that discourage or encourage early
adoption across standards. Inclusion of these costs and benefits in the analyses yields a more
complete picture of banks’ early adoption behavior. Out of 16 accounting standards, five are
expected to have definitive income-decreasing effects, two with definitive income-increasing
effects, five with ex ante undetermined income effects, and four with no income effects (i.e. only
disclosure requirements). Three standards prompt changes in the calculation of regulatory capital.
An overview of the sample accounting standards examined in this paper is provided in Appendix
I.
I control for three dimensions of standard characteristics: (1) disclosure requirements, (2)
impact on the calculation of regulatory capital, and (3) implementation costs. Disclosure
requirements speak to whether an accounting standard requires only footnote disclosure or
recognition in financial statements proper. Prior studies have shown that financial statement
users place less weight on disclosures in footnotes than those in financial statements because
footnote disclosures are only subject to a standard audit (e.g., Titman and Trueman 1986; Amir
and Ziv 1997a, b). Consequently, firms benefit less from early adopting a disclosure-only
accounting standard than from early adopting an accounting standard that requires recognition.
The proxy used is DISCLOSURE, an indicator variable equal to 1 if the accounting standard only
requires disclosures and 0 otherwise. I expect a negative relationship between early adoption and
DISCLOSURE.
New accounting standards may lead to changes in the calculation of regulatory core
capital under bank regulators’ discretion.11 Banks have every incentive to stay well-capitalized.
11 Since the Financial Institutions Reform, Recovery and Enforcement Act of 1989, banks have been required to adopt generally accepted accounting principles (GAAP) (Furlong and Kwan 2007). In addition, the Federal Deposit Insurance Corporation Improvement Act of 1991 (FDICIA) requires that regulatory accounting standards be at least as strict as GAAP (Beatty, Chamberlain, and Magliolo 1996; Ramesh and Revsine 2001). In situations where
18
For example, banks that are classified as well-capitalized are subject to less regulatory scrutiny,
obtain more operational flexibility, and face fewer restrictions on financial activities in which
they could engage. They also enjoy expedient treatment in certain transactions where regulatory
approval is needed such as mergers and acquisitions. In addition, it is often costly to raise equity
capital quickly if banks are not well capitalized. A bank is expected to hold a buffer of capital to
limit the chances of falling below the well-capitalized cutoff (Beatty, Chamberlain, and Magliolo
1996; Furlong and Kwan 2007, p. 10). Hence, I expect that banks are more (less) likely to early
adopt accounting standards that lead to positive (undetermined) changes in the calculation of
regulatory capital under bank regulators’ discretion for the benefit of adjusting their capital to an
optimal level. The proxy used is REG_POS (REG_UN), an indicator variable equal to 1 if the
pronouncement of an accounting standard could lead to positive (undetermined) changes in the
calculation of regulatory capital and 0 otherwise. I expect a positive relationship between early
adoption and REG_POS as bank management can utilize the changes in the calculation of
regulatory capital to adjust their capital to an optimal level. I expect a negative relationship
between early adoption and REG_UN as the benefit of adjusting banks’ capital to an optimal
level is less clear to bank management.
Implementation costs speak to the continuing move by the FASB toward a principles-
based approach. The FASB intends to smoothly converge to the International Financial
Reporting Standards (IFRSs) and to reduce complexity in accounting standards and firm costs of
applying new accounting standards (Choi and McCarthy 2003; Schipper 2003).12 Therefore, I
predict that it is more costly for banks to early adopt a more complex standard than a less
complex one. I use PAGE, the number of pages of a sample accounting standard as issued to
proxy for standard complexity. I expect a negative relation between early adoption and PAGE
because it is more costly to early adopt an accounting standard with greater complexity.
3.2 Research Design and Descriptive Statistics
To test the predictions discussed in the previous subsection, I estimate the following logit
model using maximum likelihood estimation:
concerns about the calculation of regulatory capital exist with the implementation of new accounting pronouncements, bank regulators develop interim capital rules as they see fit in a timely fashion and publish them in Federal Register. 12 A principles-based accounting framework is subject to some criticisms, however. One is that the framework allows more professional judgment made by managers and auditors. Hence, it is essential to “strengthen enforcement while reduce the incidence of litigation over accounting treatments” (Schipper 2003).
19
EARLYij = ∑ β0N9N=1 YEARNi + β1NIMij + β2RPCERTAINTYij + β3NIM_RPCERTAINTYij
+ β4BADNEWSij + β5AFSOFINVij + β6CONTRACTij + β7LOANRISKij
+ β8EXPOSUREDERij + β9CREDITRISKDERij + β10NONINTCHGij
+ β11SIZEij + β12LEVERAGEij + β13DROEij + β14NIEFFj + β15DROE_NIEFFij
+ β16MKTHERFij + β17CULTUREij + β18DISCLOSUREj + β19REG_POSj
+ β20REG_UNj + β21PAGEj + εij. (1)
The dependent variable, EARLYij, is equal to 1 if BHC i early adopted the accounting standard j
and 0 otherwise. YEARN is an indicator variable equal to 1 if the accounting standard was issued
in year N and 0 otherwise. I include year fixed effects to control for the effects of
macroeconomic conditions surrounding the pronouncements of accounting standards. All other
variables are discussed in the previous subsection and defined in Appendix II.
In order to examine whether income effects of accounting standards affect banks’ early-
adoption decisions for the purpose of having better access to external financing, I estimate the
following logit model separately for accounting standards with (1) income-decreasing effects, (2)
income-increasing effects, (3) ex ante undetermined income effects, and (4) only disclosure
requirements:
EARLYij = β0 + β1NIMij + β2RPCERTAINTYij + β3NIM_RPCERTAINTYij
+ β4BADNEWSij + β5AFSOFINVij + β6CONTRACTij + β7LOANRISKij
+ β8EXPOSUREDERij + β9CREDITRISKDERij + β10NONINTCHGij
+ β11SIZEij + β12LEVERAGEij + β13DROEij + β14MKTHERFij + β15CULTUREij
+ εij. (2)
Table 1 describes the procedures used in reaching the final sample. The total number of
BHCs listed in the Bank Regulatory data base during 1995-2008 is 9,293. To hand collect the
adoption status of each sample accounting standard disclosed in 10Q/10K filings for each BHC,
all 10Qs/10Ks filed by banks between 1994 and 2008 were researched using the Morningstar
Document Research data base.13 A total of 581 BHCs filed 10Qs/10Ks during the period. The
13 The 10Qs and 10Ks are only available in electronic files starting on January 1, 1994. Therefore, the earliest accounting standard allowing for early adoption that I could attend to with a complete adoption period (i.e., a period starting from a standard announcement date to a standard effective date) is SFAS No. 121, “Accounting for the impairment of long-lived assets and for long-lived assets to be disposed of”, which was issued in March 1995 and effective on and after December 15, 1995. The sample period ends in March 2008 because SFAS No. 161, “Disclosures about derivative instruments and hedging activities—an amendment of SFAS No. 133”, was the most
20
total available number of BHC-standard observations is 5,218, which is less than expected (i.e.,
581 BHCs × 16 accounting standards = 9,296 BHC-standard observations) due to two reasons.
First, not every BHC provides a discussion on the adoption status of each sample accounting
standard in its filings. Second, some BHCs only file 10Q/Ks up to some point in time during the
sample period. As a final step, observations without the required information from the Bank
Regulatory data base are eliminated to calculate all independent variables at the bank level. This
action yields a final sample of 3,822 BHC-standard observations (486 unique BHCs).
Table 2 presents the sample distribution by bank size (small, mid-sized, and large) and
early adoption status of each sample accounting standard. Small BHCs is the biggest group of the
total sample (52.2%), followed by mid-sized BHCs (36.9%) and large BHCs (10.9%). On
average, 3.3% of small BHCs, 3.8% of mid-sized BHCs, and 10.8% of large BHCs choose to
early adopt sample accounting standards. Differences in early adoption rates exist between peers
and between standards. For example, no large BHCs early adopted SFAS No. 133 (FASB 1998)
while 20% of small BHCs and 15% of mid-sized BHCs chose to early adopt the standard. SFAS
No. 123R (FASB 2004) presents another extreme case, as only 0.8% of small BHCs chose early
adoption. As to SFAS No. 157 (FASB 2006), 16.7% of large BHCs chose to early adopt the
standard, while approximately 5% of small and mid-sized BHCs chose early adoption. Finally,
the results reveal that no BHCs chose to early adopt the following four accounting standards:
SFAS No. 123 (FASB 1995), SFAS No. 132 (FASB 1998), SFAS No. 144 (FASB 2001), and
SFAS No. 132R (FASB 2003). There is a lack of cross-sectional variation in early adoption of
other standards as well. To consider the effects on the inferences, I keep BHC-standard
observations related to five accounting standards with the most early-adoption cases and estimate
the early-adoption decision model. A brief discussion is provided in section 4.
Table 3, panel A presents descriptive statistics for the variables used in the analyses. In
general, approximately 4.3% of BHC-standard observations choose early adoption. NIM
distributes with no skew and a mean close to zero (i.e., -0.03%). RPCERTAINTY ranges from 0
to 1 and distributes with a mean of 0.405 (median = 0.391). This data shows that, on average, the
sample banks are not highly certain of receiving a positive response following the disclosure of
their performance (e.g., 10Q/K filings). Approximately 59% of total sample observations are
recent accounting standard allowing for early adoption at the time when I researched 10Qs and 10Ks for banks’ early-adoption decisions.

21
experiencing low performance relative to peer banks. The statistics of AFSOFINV show that
approximately 75% of the BHC-standard observations hold more of the total investment
portfolios in available-for-sale securities than their peer banks. Approximately 37% of the BHC-
standard observations are involved with interest rate related derivative contracts. The mean of the
adjusted ratio of loan loss allowance to average loans, LOANRISK, is approximately -0.2%.
EXPOSUREDER ranges from -.029 to 44.520, which shows diverse bank derivative activities
even after adjusted for the derivative activities of peer banks. The results show that 38% of the
banks hold more OTC than exchange-traded derivative contracts. SIZE distributes with positive
skew and dispersion, ranging from 7.867 to 18.880. The mean of LEVERAGE is 0.908, which is
expected for the banking industry. More than half of the observations are within one standard
deviation around the mean of LEVERAGE. The mean of DROE is approximately 0.5 by
construction. Finally, MKTHERF ranges from 0.023 to 0.363, which suggests widely-varied
market competition in which banks operate (from unconcentrated to high concentration).
Table 3, panel B compares the variables used in the analyses between early and late bank
adopters by using t-tests and Wilcoxon tests for differences in means and medians. Most
differences are significant and consistent with predictions. For example, consistent with
predictions, NIM is significantly smaller for early bank adopters than for late bank adopters for
both mean and median at the 1% level. In addition, AFSOFINV is significantly smaller while
EXPOSUREDER and CREDITRISKDER are significantly greater for early adopters than for late
adopters.
3.3 Primary Findings Related to Likelihood of Early Adopting Accounting Standards
Table 4 shows the results from estimating equation (1). Model (1) and model (2) are
subsets of equation (1) because including NONINTCHG and CULTURE in the model would lead
to a total loss of 459 observations in estimation. Model (3) is the full model as specified in
equation (1). In general, the results are consistent with the predictions. Because the results for
model (1), model (2), and model (3) are similar, the following discusses the results based on
model (3) more in depth.
Relating to H1, NIM is significantly and negatively related to the likelihood of early
adoption (p-value = .008). This result indicates that more profitable banks with fewer concerns
about attracting funds from capital providers are less likely to early adopt an accounting standard.
To examine whether the level of response certainty moderates this negative relationship, I
22
include RPCERTAINTY and NIM_RPCERTAINTY. NIM_RPCERTAINTY is significant (p-value
= .022), while RPCERTAINTY is insignificant. The standardized coefficient on NIM shows that a
one standard-deviation increase in NIM while holding RPCERTAINTY at zero decreases the odds
ratio (early adoption to late adoption) by 46.6%. BADNEWS is significant with predicted sign in
every model. This data implies that a bank’s incentive to disclose preemptive bad news in early
adoption does not drive the negative relationship between early adoption and bank profitability.
In general, H1 is supported by the results.
Relating to H2, all measures for bank risk profiles except CREDITRISKDER are
significant with predicted signs. In particular, AFSOFINV and LOANRISK are significantly and
negatively associated with the likelihood of early adoption (p-value = .008 and .031,
respectively). This data indicates that banks with lower interest rate risk on investment portfolios
and credit risk on loan portfolios are less likely to early adopt an accounting standard. Also as
predicted, the coefficients on EXPOSUREDER and NONINTCHG are significantly and
positively associated with the likelihood of early adoption (p-value = .005 and .000, respectively).
This finding denotes that banks with greater derivative exposure and higher operational risk are
more likely to choose early adoption. The coefficient on CONTRACT is different from zero (p-
value = .023), which indicates that holding interest-rate-related derivative contracts is also
associated with the likelihood of early adoption. The standardized coefficients on AFSOFINV
and LOANRISK suggest that a one standard-deviation increase in each variable decreases the
odds ratio by 19.1% and 23.3%, respectively. On the other hand, a one standard-deviation
increase in EXPOSUREDER and NONINTCHG increases the odds ratio by 12.7% and 13.9%,
respectively. Therefore, H2 is supported by the results.
Relating to accounting standard characteristics that encourage/discourage early adoption,
as predicted, a positive impact on the calculation of regulatory capital, REG_POS, and an
undetermined impact on the calculation of regulatory capital, REG_UN, are significant with
predicted signs (p-value = .000 and .010, respectively). Therefore, banks are more likely to early
adopt a standard that provides an opportunity for them to increase regulatory capital to an
optimal level than a standard that does not, but less likely to early adopt a standard that can
23
impact banks’ capital either upwardly or downwardly. Lastly, no support is found for
DISCLOSURE and PAGE (p-value = .126 and .151, respectively).14
Relating to the control variables, SIZE is significantly different from zero in model (1)
and model (2) (p-value = .027 and .062, respectively). It does lose significance when the model
includes CULTURE in model (3). LEVERAGE is not significant in any cases. Similar to SIZE,
DROE_NIEFF is significantly and negatively related to the likelihood of early adoption in model
(1) and model (2) (p-value = .027 and .029, respectively). This finding signifies that managers of
banks with ROE in the extreme quartiles are less likely to early adopt an income-increasing
standard because the adoption is unlikely to make a difference in the bonus compensation
calculation. However, DROE_NIEFF is no longer significant in model (3) where CULTURE is
included. Both DROE and NIEFF are not significantly different from zero in any models. The
insignificant results may suggest that these commonly used variables have less power in
explaining banks’ early-adoption decisions than other industrial firms’ early-adoption decisions.
Lastly, market concentration (MKTHERF) is not statistically significant in any cases, but a
bank’s past early-adoption policy (CULTURE) is significantly and positively associated with
early adoption (p-value = .006).
Table 5 shows the results from estimating equation (2) given different income effects of
accounting standards. Relating to bank profitability, the likelihood of early adoption is
significantly and negatively related to NIM under three scenarios: when the income effects of
accounting standards are increasing or ex ante undetermined, and when accounting standards
only require disclosure (p-value = .049, .004 and .001, respectively). The negative relationship is
moderated by RPCERTAINTY in the latter two cases (p-value = .008 and .000, respectively).15
The main effect of RPCERTAINTY is insignificant under the scenario of ex ante undetermined
income effects but significantly negative under the scenario of only disclosure requirements.
NIM is not significant in explaining early-adoption decisions on accounting standards with
14 DISCLOSURE is significant with the opposite predicted sign in model (1) and model (2). One possible explanation is that accounting standards with only disclosure requirements may incur low contracting costs and regulatory costs relative to standards with income effects. Therefore, banks are more willing to choose to early adopt an accounting standard with only disclosure requirements than with income effects for the purpose of having better access to external financing. Although PAGE is insignificant in model (3), it is significant with predicted sign in model (1) and model (2). 15 Note that the negative relationship between early adoption and bank profitability is not moderated by RPCERTAINTY when I only consider accounting standards with income-increasing effects. Therefore, the documented negative relationship is also consistent with the political costs hypothesis that highly profitable firms tend not to early adopt an accounting standard with income-increasing effects.

24
income-decreasing effects. The main effect of RPCERTAINTY is significant with predicted sign
(p-value = .046), whereas NIM_RPCERTAINTY is insignificant. BADNEWS is significant with
predicted sign under every scenario except the scenario of accounting standards with income-
decreasing effects. The results suggest that banks are less likely to choose early adoption when
they experience relatively bad performance. However, in the context of income-increasing
accounting standards, the negative relationship is also consistent with the argument that banks
with relatively bad performance are less likely to early adopt income-increasing accounting
standards so to minimize their potential litigation costs.
Relating to bank risk profiles, AFSOFINV is only significant with predicted sign when
used to explain early-adoption decisions on accounting standards with ex ante undetermined
income effects. LOANRISK is significant with predicted sign in two scenarios: accounting
standards with income-decreasing effects and with only disclosure requirements.
EXPOSUREDER is significant with predicted sign when used to explain accounting standards
with undetermined income effects, but is significant with the opposite predicted sign when used
to explain accounting standards with income-increasing effects. CREDITRISKDER is not
significant in any cases. NONINTCHG is only significant with predicted sign when used to
explain early-adoption decisions with only disclosure requirements. In contrast, it is significant
with the opposite predicted sign when used to explain early-adoption decisions on accounting
standards with income-decreasing effects and with ex ante undetermined income effects.
Relating to the control variables, SIZE is significantly related to the likelihood of early
adoption when used to explain accounting standards with income-decreasing and income-
increasing effects (p-value = .010 and .026). In particular, the findings that the likelihood of early
adoption is positively associated with SIZE in the context of income-increasing accounting
standards are not uncommon. For example, Scott (1991), Sami and Welsh (1992), and Ali and
Kumar (1994) all find a positive relationship between early adoption and firm size for an
income-increasing standard (i.e., SFAS No. 87, pension accounting). LEVERAGE is significantly
related to early-adoption decisions on accounting standards with income-decreasing effects or
with ex ante undetermined income effects (p-value = .022 and .021, respectively). DROE is
significantly and negatively related to early-adoption decisions on accounting standards with
income-increasing effects. MKTHERF is only statistically significant when used to explain early-
adoption decisions on accounting standards with income-increasing effects and with only
25
disclosure requirements. Finally, banks’ past early-adoption policy (CULTURE) is significantly
and positively associated with early adoption in various scenarios except accounting standards
with income-decreasing effects.
Taken together, the results show that banks are more likely to choose early adoption of
accounting standards with ex ante undetermined income effects and with only disclosure
requirements for the purpose of better accessing external financing.
3.4 Comparisons of the Financing Activities between Early and Late Adopters
The previous subsection provides evidence on bank profitability and bank risk profiles in
explaining early-adoption decisions. As bank profitability and risk profiles characterize banks’
motivation for information disclosure and thus better access to external financing, it merits
examining whether early bank adopters do ex post experience higher growth of funds. In this
subsection, I examine my third hypothesis during the period between the issued date and the
effective date of an accounting standard (i.e., the testing period).
Both H1 and the results suggest that banks with high profitability are less likely to
voluntarily disclose information because they have few concerns about raising funds.
Consequently, it is likely that late bank adopters with high profitability experience comparable
financing activity growth without early adoption to those of early bank adopters. To address this
issue, I match each early adopter to a late adopter with comparable profitability based on the net
interest margin measured at the most recent quarter-end before standard announcement dates. In
addition, banks’ financing strategies may change with the macroeconomic conditions in general.
For instance, loan demands increase during economic expansions and hence banks’ demand for
funds also increases. On the other hand, loan demands decrease during economic contractions
and hence banks’ demand for fund also decreases. I therefore expect early adopters to experience
higher growth of funds than matched late adopters during the testing periods that are in economic
expansions.
Figure 1 compares early adopters and matched late adopters in the growth of funds
attributed to changes in deposits, changes in liabilities other than deposits, and changes in
preferred and common stock and related surplus during the testing periods.16 For better
illustration, I separately show the growth of funds of banks during the testing periods that take
16 Liabilities other than deposits include federal funds purchased and securities sold under agreements to repurchase, trading liabilities, other borrowed money, subordinated notes and debentures, and other liabilities.
26
place in economic expansions and economic contractions. Panel (a) displays the growth of funds
during the testing periods in economic expansions, while panel (b) exhibits growth during the
testing periods in economic contractions. Panel (a) shows that, in general, regardless of the
income effects of accounting standards, early bank adopters experience higher growth of funds
than their matched counterparts. On the other hand, panel (b) does not show any particular trend
in the growth of funds between early adopters and matched late adopters as expected. In terms of
economic significance, the differences in the growth of funds (scaled by total assets) between
early adopters and matched late adopters range from -0.8% to 4.9% during the testing periods
that are in economic expansions. The difference is only statistically significant when comparing
early adopters and their matched counterparts altogether during all testing periods in economic
expansions (one-tailed p-value = .080).
Further analysis suggests that the growth of liabilities other than deposits mainly accounts
for the total growth of funds of early adopters during testing periods that take place in economic
expansions observed in figure 1. In terms of economic significance, the differences in the growth
of liabilities other than deposits (scaled by total assets) between early adopters and matched late
adopters range from 0.7% to 3.9%. In terms of statistical significance, the differences are
significant in the cases of early adoption of SFAS No. 122, SFAS No. 133, SFAS No. 156, and
SFAS No. 157 (one-tailed p-values = .050, .054, .071, and .019, respectively). As for equity
capital (i.e., changes in preferred and common stock and related surplus), there does not seem to
be a particular trend in the growth of capital between early adopters and matched late adopters
during the testing periods in either economic expansions or economic contractions. The
differences between early adopters and their matched counterparts are not statistically significant
in any case of early adoption. This result suggests that in general, raising equity capital is costly
for banks and therefore does not serve as the main driver of the total growth of banks’ funds. In
summary, early-adopting banks appear to experience higher growth of funds than matched late-
adopting banks during the testing periods that take place in economic expansions. Hence, H3 is
supported by the results.
27
CHAPTER 4
ADDITIONAL ANALYSES
This chapter presents two additional analyses to evaluate the robustness of the findings.
The first set of analysis considers the effects of differences in the banking operations between
small, mid-sized, and large banks on early-adoption decisions. In the second set of analysis, I
investigate the issue of insufficient cross-sectional variations in adoption cases as identified in
subsection 3.2.
To analyze the first set, I estimate the early-adoption decision model separately for small,
mid-sized, and large BHCs. I conduct this analysis because the banking operations can differ
between various bank sizes. Although the testing variables are adjusted for the average measures
of peer banks, the remaining variations in the testing variables can still be attributable to
differences in banking operations between small, mid-sized, and large BHCs. Table 6 panel A
presents the results. In general, the predictions are still supported for small and mid-sized BHCs.
The major exception of the results is shown for the large BHC group; specifically, the
relationship between bank profitability and early adoption becomes positive but only marginally
significant (p-value = .087). One plausible explanation is that the information environment of
large banks is likely to be transparent. As a result, banks’ uncertainty about how investors will
respond to the disclosure is not a major concern. Therefore, large and highly profitable banks are
more likely to early adopt accounting standards.
Also worth noting, large banks are more likely to choose to early adopt accounting
standards with relatively high standard complexity. To examine how banks’ early-adoption
decisions vary with standard complexity, I classify 16 accounting standards into three levels of
complexity based on the number of pages of a standard: low, medium, and high complexity.17
Instead of using PAGE, I use two dummy variables denoting low and high standard complexity
in the early-adoption decision model. The results in table 6 panel B suggest that large banks are
more likely to early adopt standards with relatively high complexity. On the other hand, small
banks are more (less) likely to early adopt standards with relatively low (high) complexity.
17 Accounting standards with low complexity include SFAS No. 122, SFAS No. 132, SFAS No. 146, SFAS No. 155, and SFAS No. 161. Accounting standards with medium complexity include SFAS No. 121, SFAS No. 142, SFAS No. 143, SFAS No. 144, SFAS No. 132R, and SFAS No. 159. Accounting standards with high complexity include SFAS No. 123, SFAS No. 133, SFAS No. 123R, SFAS No. 156, and SFAS No. 157.
28
Standard complexity, however, does not seem to affect mid-sized banks’ early-adoption
decisions. One plausible explanation for the results is that large banks are more likely than small
banks to engage in highly-complex transactions. They are also more likely than small banks to be
subject to bank regulators’ encouragement to choose to early adopt standards which improve
disclosures related to complex transactions. In addition, large banks are able to dedicate more
resources than small banks to implement new and complex standards. Consequently, large banks
are more likely to early adopt accounting standards with higher standard complexity. Evidence
that small banks are more (less) likely to choose to early adopt accounting standards with low
(high) complexity than with medium complexity is also consistent with the argument that small
banks engage in transactions with low complexity. Therefore, for the purpose of information
disclosure, it is conceivable that small banks tend to early adopt standards with low complexity
than with high complexity.
As mentioned in section 3.2, many of the accounting standards examined in this paper do
not have sufficient cross-sectional variations in the number of early-adoption cases. To examine
the potential effect on the inferences of the results, I keep BHC-standard observations related to
SFAS No. 122, SFAS No. 133, SFAS No. 156, SFAS No. 157, and SFAS No. 159 in the
estimation. These five standards are chosen because they contain the most early-adoption cases. I
estimate the early-adoption decision model in a pooled regression for all five accounting
standards. In general, the untabulated results are similar to those presented in table 4. In
particular, the negative relationship between NIM and the likelihood of early adoption still holds.
The negative relationship is moderated by the level of response certainty, RPCERTAINTY,
similar to the results documented in table 4. In addition, the results support the prediction that
banks with greater risk profiles are more likely to early adopt accounting standards. The results
using ROA instead of NIM as a bank profitability measure are qualitatively the same.18
It is important to note that firms that choose to early adopt SFAS No. 159 also needs to
early adopt SFAS No. 157. In the sample observations, 21 banks that chose to early adopt SFAS
No. 157 also early adopted SFAS No. 159 and vice versa (i.e., a total of 21 BHCs). Therefore, it
is possible that early adoption of SFAS No. 157 reflects the needs for banks to early adopt SFAS
18 I also estimate the early-adoption decision model separately for (1) accounting standards related to financial instruments (i.e., SFAS No. 122, SFAS No. 133, SFAS No. 155, SFAS No. 156, SFAS No. 157, SFAS No. 159, and SFAS No. 161) and (2) all other accounting standards examined in this study. The results suggest that a bank’s incentive to better access external financing predominantly explains a bank’s early-adoption decisions on accounting standards related to financial instruments but not on all other accounting standards.

29
No. 159. I estimate the early-adoption model in a pooled regression by using only SFAS No. 122,
SFAS No. 133, and SFAS No. 156. The results are qualitatively the same.19
In summary, these additional analyses concur with the inferences made in the previous
section. Specifically, bank profitability and bank risk profiles are significantly associated with
the likelihood of early adoption. In various cases, the documented negative relationship between
bank profitability and early adoption is moderated by the level of response certainty. In addition,
standard complexity is of importance in small and large banks’ early-adoption decisions. Future
research could consider incentives or factors specific to each accounting standard.
19 All untabulated results are available upon request.
30
CHAPTER 5
SUMMARY AND CONCLUDING REMARKS
I investigate whether U.S. bank holding companies choose to early adopt accounting
standards to provide new information and better access capital markets. In particular, I examine
whether the likelihood of early adoption is negatively associated with bank profitability and
positively associated with bank risk profiles. The set of the accounting standards employed in
this study were issued from January 1995 to March 2008.
I find that the likelihood of early adoption is significantly and negatively related to bank
profitability, which is proxied by the net interest margin. Furthermore, I discover that the
likelihood of early adoption is significantly and positively related to bank risk profiles, which are
proxied by the interest rate risk on the investment portfolios, the credit risk on the loan portfolios,
derivative exposures, and the operational risk. Conditional on the income effects of accounting
standards, the predictions are best supported when using bank profitability and risk profiles to
explain early-adoption decision on accounting standards with ex ante undetermined income
effects and with only disclosure requirements. Finally, the results indicate that early adopters
experience higher growth of funds than matched late adopters during the periods between the
issued dates and the effective dates of accounting standards, particularly in economic expansions.
This finding reinforces the idea that banks voluntarily disclose information for the purpose of
having better access to external financing in the context of early adoption.
This study appeals to both academic and practical audiences. From an academic
perspective, my paper complements the existing early-adoption literature by providing an
additional motivation for early adoption. This motivation power is at its greatest when used to
explain early-adoption decisions on accounting standards with ex ante undetermined effects and
with only disclosure requirements. This study complements the line of research in managers’
voluntary disclosure decisions for capital market reasons in the context of banks’ early-adoption
decisions (Healy and Palepu 2001, p.420). My research may also interest financial statement
preparers and users. The results in this study suggest that implications about a firm’s future
performance may be gathered by analyzing a firm’s early-adoption decisions over time. With the
counter-signaling role in the early-adoption decisions, firms may think twice when evaluating
early adoption of accounting standards. In a follow-up paper, I examine whether a bank’s early-

31
adoption behavior have implications on future bank performance. Future research may examine
conditions under which early-adoption behavior better implies firms’ future performances or it
may consider whether the motive for early adoption to provide new information and thus better
access capital markets applies in other industries.
32
REFERENCES
Aboody, D., M. E. Barth, and R. Kasznik. 2004. Firms’ Voluntary Recognition of Stock-Based Compensation Expense. Journal of Accounting Research 42(2): 123-150.
Ali, A. and K. R. Kumar. 1994. The magnitudes of financial statement effects and accounting choice: The case of the adoption of SFAS 87. Journal of Accounting and Economics 18: 89-114.
Amir, E., and J. Livnat. 1996. Multiperiod Analysis of Adoption Motives: The Case of SFAS No. 106. The Accounting Review 71(4): 539-553.
Amir, E., and A. Ziv. 1997a. Recognition, disclosure or delay: Timing the adoption of SFAS 106. Journal of Accounting Research 35(1): 61-81.
Amir, E., and A. Ziv. 1997b. Economic consequences of alternative adoption rules for new accounting standards. Contemporary Accounting Research 14(3): 543-568.
Ayres, F. L. 1986. Characteristics of Firms Electing Early Adoption of SFAS 52. Journal of Accounting and Economics 8(2): 143-158.
Ball, R. and G. Foster. 1982. Corporate Financial Reporting: A Methodological Review of Empirical Research. Journal of Accounting Research 20(Supplement): 161-234.
Beatty, A. 1995. The Effects of Fair Value Accounting on Investment Portfolio Management: How Fair Is It? Review Federal Reserve Bank of St. Louis 77 (January/February): 25-38.
Beatty, A., S. Chamberlain, and J. Magliolo. 1996. An empirical analysis of the economic implications of fair value accounting for investment securities. Journal of Accounting and Economics 22: 43-77.
Berger, A. N., R. J. Herring, and G. P. Szego. 1995. The role of capital in financial institutions. Journal of Banking & Finance 19: 393-430.
Botosan, C. 1997. Disclosure Level and the Cost of Equity Capital. The Accounting Review 20: 323-349.
Botosan, C. A. and M. S. Harris. 2000. Motivations for a Change in Disclosure Frequency and its Consequences: An Examination of Voluntary Quarterly Segment Disclosures. Journal of Accounting Research 38(2): 329-353.
Botosan, C. and M. Plumlee. 2002. A Re-examination of Disclosure Level and the Expected Cost of Equity Capital. Journal of Accounting Research 40: 21-40.
Cao, Z. and G. S. Narayanamoorthy. 2011. The Effect of Litigation Risk on Management Earnings Forecasts. Contemporary Accounting Research 28(1): 125-173.
Chen, W., C. Liu, and S. G. Ryan. 2008. Characteristics of Securitizations that Determine Issuers’ Retention of the Risks of the Securitized Assets. The Accounting Review 83(5): 1181-1215.
Choi, Yeong C. and Irene N. McCarthy. 2003. FASB proposes principles-based approach to US standards setting. Bank Accounting & Finance 16.2: 5-11.
Darrough, M. N. and N. M. Stoughton. 1990. Financial Disclosure Policy in an Entry Game. Journal of Accounting and Economics 12: 219-243.

33
Demirgüç-Kunt, Ash and Harry Huizinga. 1999. Determinants of Commercial Bank Interest Margins and Profitability: Some International Evidence. World Bank Economic Review 13(2): 379-408.
Dye, R. A. 1986. Proprietary and Nonproprietary Disclosures. The Journal of Business 59(2): 331-366.
Eakin, C. F. and J. D. Gramlich. 2000. Insider Trading and the Early Adoption of SFAS 96: A Test of the Signaling Hypothesis. Advances in Accounting 17: 111-133.
Eccher, Elizabeth A., K. Ramesh, and S. Ramu Thiagarajan. 1996. Fair value disclosures by bank holding companies. Journal of Accounting and Economics 22: 79-117.
Federal Reserve Board (FRB). 2004. Bank Holding Company Rating System. Supervisory Letter SR 04-18.
Feltovich, N., R. Harbaugh, and T. To. 2002. Too Cool for School? Signalling and Countersignalling. The RAND Journal of Economics 33(4): 630-649.
Financial Accounting Standards Board (FASB). Accounting for the Impairment of Long-Lived Assets and for Long-Lived Assets to Be Disposed Of. SFAS No. 121. Norwalk, CT: FASB, 1995.
FASB. Accounting for Mortgage Servicing Rights—an amendment of FASB Statement No. 65. SFAS No. 122. Norwalk, CT: FASB, 1995.
FASB. Accounting for Stock-Based Compensation. SFAS No. 123. Norwalk, CT: FASB, 1995. FASB. Employers’ Disclosures about Pensions and Other Postretirement Benefits—an
amendment of FASB Statements No. 87, 88, and 106. SFAS No. 132. Norwalk, CT: FASB, 1998.
FASB. Accounting for Derivative Instruments and Hedging Activities. SFAS No. 133. Norwalk, CT: FASB, 1998.
FASB. Goodwill and Other Intangible Assets. SFAS No. 142. Norwalk, CT: FASB, 2001. FASB. Accounting for Asset Retirement Obligations. SFAS No. 143. Norwalk, CT: FASB, 2001. FASB. Accounting for the Impairment or Disposal of Long-Lived Assets. SFAS No. 144.
Norwalk, CT: FASB, 2001. FASB. Accounting for Costs Associated with Exit or Disposal Activities. SFAS No. 146.
Norwalk, CT: FASB, 2002. FASB. Employers’ Disclosures about Pensions and Other Postretirement Benefits—an
amendment of FASB Statements No. 87, 88, and 106. SFAS No. 132R. Norwalk, CT: FASB, 2003.
FASB. Share-Based Payment. SFAS No. 123R. Norwalk, CT: FASB, 2004. FASB. Accounting for Certain Hybrid Financial Instruments—an amendment of FASB
Statements No. 133 and 140. SFAS No. 155. Norwalk, CT: FASB, 2006. FASB. Accounting for Servicing of Financial Assets—an amendment of FASB Statement No. 140.
SFAS No. 156. Norwalk, CT: FASB, 2006. FASB. Fair Value Measurements. SFAS No. 157. Norwalk, CT: FASB, 2006.

34
FASB. The Fair Value Option for Financial Assets and Financial Liabilities—Including an amendment of FASB Statement No. 115. SFAS No. 159. Norwalk, CT: FASB, 2007.
FASB. Disclosures about Derivative Instruments and Hedging Activities—an amendment of FASB Statement No. 133. SFAS No. 161. Norwalk, CT: FASB, 2008.
Francis, J. R., I. K. Khurana, and R. Pereira. 2005. Disclosure Incentives and Effects of Capital around the World. The Accounting Review 80(4): 1125-1162.
Frankel, R., M. McNichols, and G. P. Wilson. 1995. Discretionary Disclosure and External Financing. The Accounting Review 70(1): 135-150.
Furlong, F. T. and S. H. Kwan. 2007. Safe and sound banking twenty years later: What was proposed and what has been adopted. Federal Reserve Bank of Atlanta Economic Review (First and Second Quarter): 1-23.
Graham, J. R., C. R. Harvey, and S. Rajgopal. 2005. The Economic Implications of Corporate Financial Reporting. Journal of Accounting and Economics 40: 3-73.
Gujarathi, M. R. and R. E. Hoskin. 2003. Modeling the Early Adoption Decision: The Case of SFAS 96. Review of Accounting & Finance 2(4): 63-86.
Healy, Paul M., and Krishna G. Palepu. 2001. Information asymmetry, corporate disclosure, and the capital markets: A review of the empirical disclosure literature. Journal of Accounting and Economics 31: 405-440.
Hirtle, B. J., and J. A. Lopez. 1999. Frequency of Bank Examinations. FRBNY Economic Policy Review April: 1-19.
Hodder, L., M. Kohlbeck, and M. L. McAnally. 2002. Accounting Choices and Risk Management: SFAS No. 115 and U.S. Bank Holding Companies. Contemporary Accounting Research 19(2): 225-270.
Joyce, W. B. 1996. Management of Loan Loss Reserves by Commercial Bankers—Part 1. The Journal of Bank Cost & Management Accounting 9(3).
Jung, W. and Y. K. Kwon. 1988. Disclosure When the Market Is Unsure of Information Endowment of Managers. Journal of Accounting Research 26(1): 146-153.
Lang, M. and R. Lundholm. 1993. Cross-Sectional Determinants of Analyst Ratings of Corporate Disclosures. Journal of Accounting Research 31(2): 246-271.
Lang, M. and R. Lundholm. 2000. Voluntary Disclosure and Equity Offerings: Reducing Information Asymmetry or Hyping the Stock? Contemporary Accounting Research 17(4): 623-662.
Langer, R. and B. Lev. 1993. The FASB’s Policy of Extended Adoption for New Standards: An Examination of FAS No. 87. The Accounting Review 68(3): 515-533.
Lee, I. and F. M. Stiner, Jr. 1993. Stock Market Reactions to SFAS No. 96: Evidence from Early Bank Adopters. The Financial Review 28(4): 469-491.
Leland, H. and D. Pyle. 1977. Informational Asymmetries, Financial Structure, and Financial Intermediation. Journal of Finance 32: 371-387.
Morris, R. D. 1987. Signalling, Agency Theory and Accounting Policy Choice. Accounting and Business Research 18(69): 47-56.

35
Moyer, S. 1990. Capital Adequacy Ratio Regulations and Accounting Choices in Commercial Banks. Journal of Accounting and Economics 13: 123-154.
Myers, S. and N. Majluf. 1984. Corporate Financing and Investment Decisions When Firms Have Information that Investors Do Not Have. Journal of Financial Economics 32: 187-221.
Nissim, D. and S. Penman. 2007. Fair Value Accounting in the Banking Industry. Columbia Business School, Center for Excellence in Accounting and Security Analysis, Occasional Paper Series.
Papiernik, J. C., H. H. Meier, and E. S. Rozen. 2004. Effects of Fair-Value Accounting on Securities Portfolio Restructuring. Bank Accounting & Finance 18, 19-25.
Ramesh, K. and L. Revsine. 2001. The effects of regulatory and contracting costs on banks’ choice of accounting method for other postretirement employee benefits. Journal of Accounting and Economics 30: 159-186.
Ruland, W., S. Tung, and N. E. George. 1990. Factors Associated with the Disclosure of Managers’ Forecasts. The Accounting Review 65(3): 710-721.
Sami, H. and M. J. Welsh. 1992. Characteristics of Early and Late Adopters of Pension Accounting Standard SFAS No. 87. Contemporary Accounting Research 9(1): 212-236.
Schipper, K. 2003. Principles-based accounting standards. Accounting Horizons 17(1): 61-72. Scott, T. W. 1991. Pension disclosures under SFAS No. 87: Theory and evidence. Contemporary
Accounting Research 8(1): 62-81. Scott, T. W. 1994. Incentives and Disincentives for Financial Disclosure: Voluntary Disclosure
of Defined Benefit Pension Plan Information by Canadian Firms. The Accounting Review 69(1): 26-43.
Sengupta, P. 1998. Corporate Disclosure Quality and the Cost of Debt. The Accounting Review 73: 459-474.
Sengupta, P. 2004. Disclosure Timing: Determinants of Quarterly Earnings Release Dates. Journal of Accounting and Public Policy 23: 457-482.
Skinner, D. J. 1994. Why Firms Voluntarily Disclose Bad News. Journal of Accounting Research 32(1): 38-60.
Spence, M. 1973. Job Market Signaling. Quarterly Journal of Economics 87(3): 355-374. Spence, M. 2002. Signaling in Retrospect and the Informational Structure of Markets. The
American Economic Review 92(3): 434-459. Stiroh, K. J. 2004. Diversification in Banking: Is Noninterest Income the Answer? Journal of
Money, Credit, and Banking 36(5): 853-882. Suijs, J. 2007. Voluntary disclosure of information when firms are uncertain of investor response.
Journal of Accounting and Economics 43: 391-410. Titman, S., and B. Trueman. 1986. Information Quality and the Valuation of New Issues.
Journal of Accounting and Economics 8(2): 159-172. Trombley, M.A. 1989. Accounting Method Choice in the Software Industry: Characteristics of
Firms Electing Early Adoption of SFAS 86. The Accounting Review 64(3): 529-538.

36
Verrecchia, R. E. 1983. Discretionary Disclosure. Journal of Accounting and Economics 5: 179-194.
Watts, R. and J. Zimmerman. 1986. Positive Accounting Theory. Prentice-Hall, Englewood Cliffs, NJ.
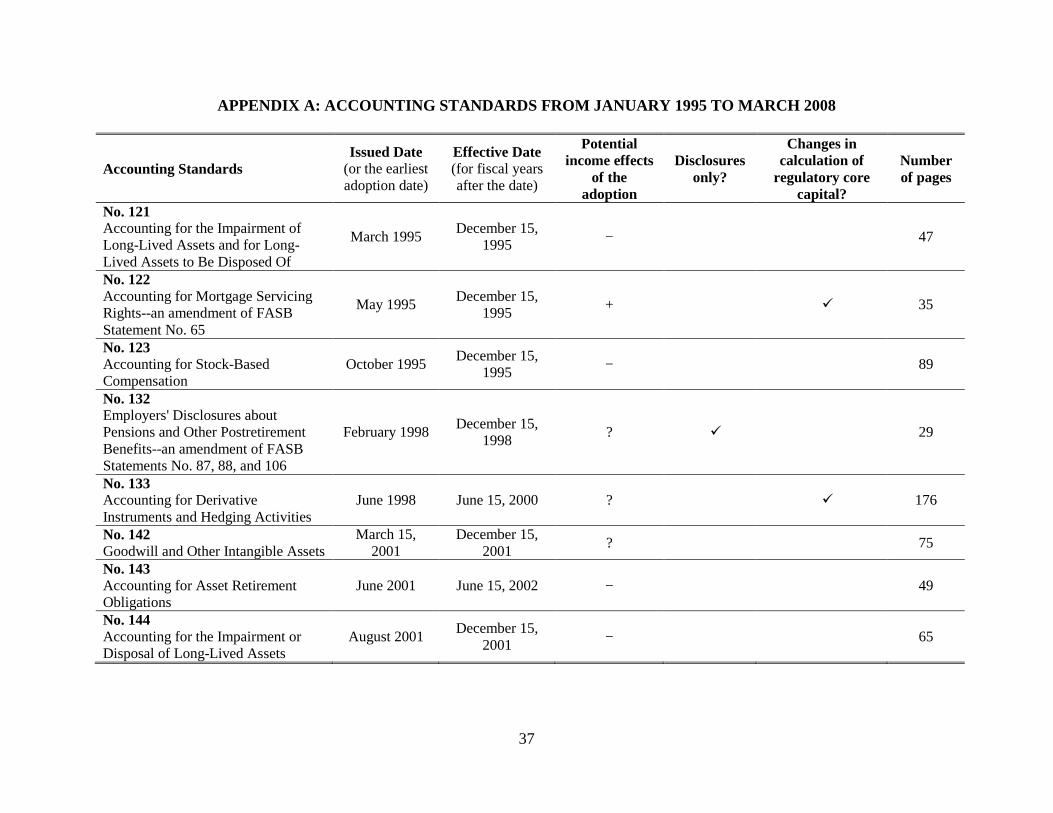
37
APPENDIX A: ACCOUNTING STANDARDS FROM JANUARY 1995 TO MARCH 2008
Accounting Standards Issued Date
(or the earliest adoption date)
Effective Date (for fiscal years after the date)
Potential income effects
of the adoption
Disclosures only?
Changes in calculation of
regulatory core capital?
Number of pages
No. 121 Accounting for the Impairment of Long-Lived Assets and for Long-Lived Assets to Be Disposed Of
March 1995 December 15,
1995 − 47
No. 122 Accounting for Mortgage Servicing Rights--an amendment of FASB Statement No. 65
May 1995 December 15,
1995 + � 35
No. 123 Accounting for Stock-Based Compensation
October 1995 December 15,
1995 − 89
No. 132 Employers' Disclosures about Pensions and Other Postretirement Benefits--an amendment of FASB Statements No. 87, 88, and 106
February 1998 December 15,
1998 ? � 29
No. 133 Accounting for Derivative Instruments and Hedging Activities
June 1998 June 15, 2000 ? � 176
No. 142 Goodwill and Other Intangible Assets
March 15, 2001
December 15, 2001
? 75
No. 143 Accounting for Asset Retirement Obligations
June 2001 June 15, 2002 − 49
No. 144 Accounting for the Impairment or Disposal of Long-Lived Assets
August 2001 December 15,
2001 − 65
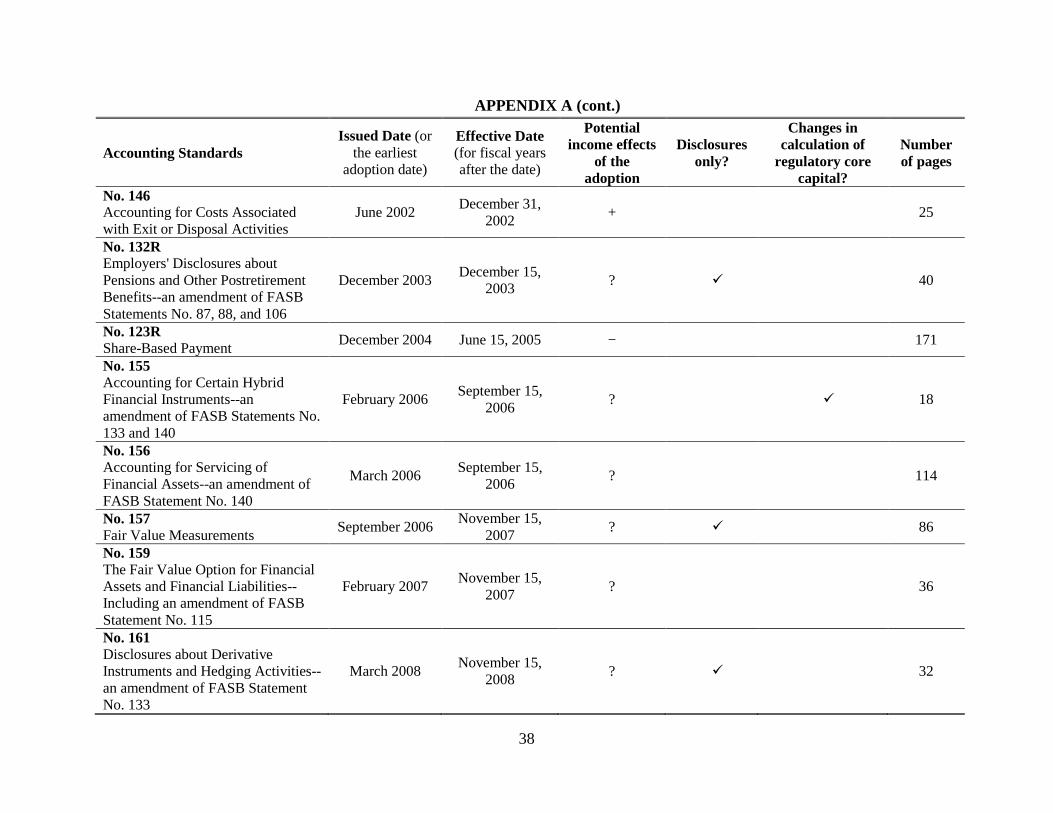
38
APPENDIX A (cont.)
Accounting Standards Issued Date (or
the earliest adoption date)
Effective Date (for fiscal years after the date)
Potential income effects
of the adoption
Disclosures only?
Changes in calculation of
regulatory core capital?
Number of pages
No. 146 Accounting for Costs Associated with Exit or Disposal Activities
June 2002 December 31,
2002 + 25
No. 132R Employers' Disclosures about Pensions and Other Postretirement Benefits--an amendment of FASB Statements No. 87, 88, and 106
December 2003 December 15,
2003 ? � 40
No. 123R Share-Based Payment
December 2004 June 15, 2005 − 171
No. 155 Accounting for Certain Hybrid Financial Instruments--an amendment of FASB Statements No. 133 and 140
February 2006 September 15,
2006 ? � 18
No. 156 Accounting for Servicing of Financial Assets--an amendment of FASB Statement No. 140
March 2006 September 15,
2006 ? 114
No. 157 Fair Value Measurements
September 2006 November 15,
2007 ? � 86
No. 159 The Fair Value Option for Financial Assets and Financial Liabilities--Including an amendment of FASB Statement No. 115
February 2007 November 15,
2007 ? 36
No. 161 Disclosures about Derivative Instruments and Hedging Activities--an amendment of FASB Statement No. 133
March 2008 November 15,
2008 ? � 32

39
APPENDIX B: LOGIT MODEL FOR EARLY ADOPTION DECISION S
Variable Name Variable Definition Dependent variable
EARLY An indicator variable that equals 1 if BHCs early adopted accounting standards and 0 otherwise. Early adoption information is obtained from 10Q/Ks. BHCs may not discuss all accounting standards examined in this paper in their 10Q/Ks. Therefore, only BHC-standard observations with available discussion on the pertinent accounting standards are included in the initial sample.
Test variables
Hypothesis 1—Profitability:
NIM NIM is measured by the net interest income (BHCK4074) divided by total assets (BHCK2170) (net interest margin) at the first quarter-end after the adoption of a new accounting standard and adjusted for the average net interest margin of peer banks.
RPCERTAINTY The percentage of times that a bank’s net interest margin is greater than the average net interest margin of peer banks during the past 12 quarters before the announcement date of an accounting standard.
NIM_RPCERTAINTY An interaction term between NIM and RPCERTAINTY.
BADNEWS An indicator variable equal to 1 if NIM is less than zero and 0 otherwise.
Hypothesis 2—Risk profiles:
(a) Interest rate risk
AFSOFINV The proportion of available-for-sale securities (excluding equity securities) out of total investment securities, adjusted for the average AFSOFINV of peer banks. Total investment securities are the sum of available-for-sale securities (BHCK1773) and held-to-maturity securities (BHCK1754).
CONTRACT An indicator variable equal to 1 if a BHC holds interest rate derivative contracts and 0 otherwise.
(b) Credit risk
LOANRISK The ratio of the allowance for loan and lease losses at the quarter-end (BHCK3123) to average quarterly loans and leases (BHCK3516), adjusted for the average LOANRISK of peer banks.
(c) Exposures and credit risk of derivatives
EXPOSUREDER The level of exposure to derivative contracts (EXPOSUREDER) is measured by the ratio of the gross notional amount of derivative contracts other than purchased options (i.e. futures contracts, forward contracts, written options, and swaps) to total assets (BHCK2170), adjusted for the average EXPOSUREDER of peer banks.

40
APPENDIX B (cont.)
Variable Name Variable Definition CREDITRISKDER An indicator variable that equals 1 if the gross notional amount of over-the-
counter derivative contracts (i.e. forwards, over-the-counter options, and swaps) is greater than that of exchange-traded derivative contracts (i.e. futures contracts and exchange-traded options) and 0 otherwise.
(d) Operational risk
NONINTCHG Average quarterly growth in noninterest income (BHCK4079) over the past six quarters, adjusted for the average NONINTCHG of peer banks during the same period.
Control variables
SIZE The logarithm of total revenues. Total revenues are defined as the sum of total interest income (BHCK4107) and total noninterest income (BHCK4079).
LEVERAGE Total liabilities (BHCK2948) divided by total assets (BHCK2170).
DROE DROE is an indicator variable that equals 1 if a BHC’s ROE falls in the highest or lowest quartiles of the ROE distribution for the sample BHCs during a benchmark quarter and 0 otherwise. ROE is calculated as income (loss) before income taxes and extraordinary items, and other adjustments (BHCK4301) divided by the last quarter-end total equity capital (BHCK3210).
NIEFF The variable is coded as 1 if adoption of a sample accounting standard is expected to have a positive effect on income, -1 if a negative effect on income is expected, and 0 if either a positive, a negative or no direct effect on income is possible.
DROE_NIEFF An interaction term between DROE and NIEFF.
MKTHERF MKTHERF is measured by the sum of the squared market shares (based on total interest income and total noninterest income) of banks operating in the same geographic region; five geographic regions are identified: Eastern, Southeast, Midwest, Southwest, and West.
CULTURE CULTURE is measured by the percentage of times that a bank chose early adoption before making the current early-adoption decision on a new accounting standard.
DISCLOSURE An indicator variable that equals 1 if an accounting standard only requires disclosures and 0 otherwise.
REG_POS An indicator variable that equals 1 if the pronouncement of an accounting standard could lead to changes in the rule of Tier 1 capital calculation and a positive effect on Tier 1 capital; 0 otherwise.
REG_UN An indicator variable that equals 1 if the pronouncement of an accounting standard could lead to changes in the rule of Tier 1 capital calculation and an undetermined effect on Tier 1 capital; 0 otherwise.
PAGE The number of pages of a sample accounting standard as issued.
Note: All variables are measured at the latest quarter-end or for the latest quarter (the benchmark quarter) before standard announcement dates, unless otherwise mentioned. For example, all variables are measured for the fourth quarter in 2005 or at the end of the fourth quarter in 2005 for FAS 156, which was announced in March 2006.
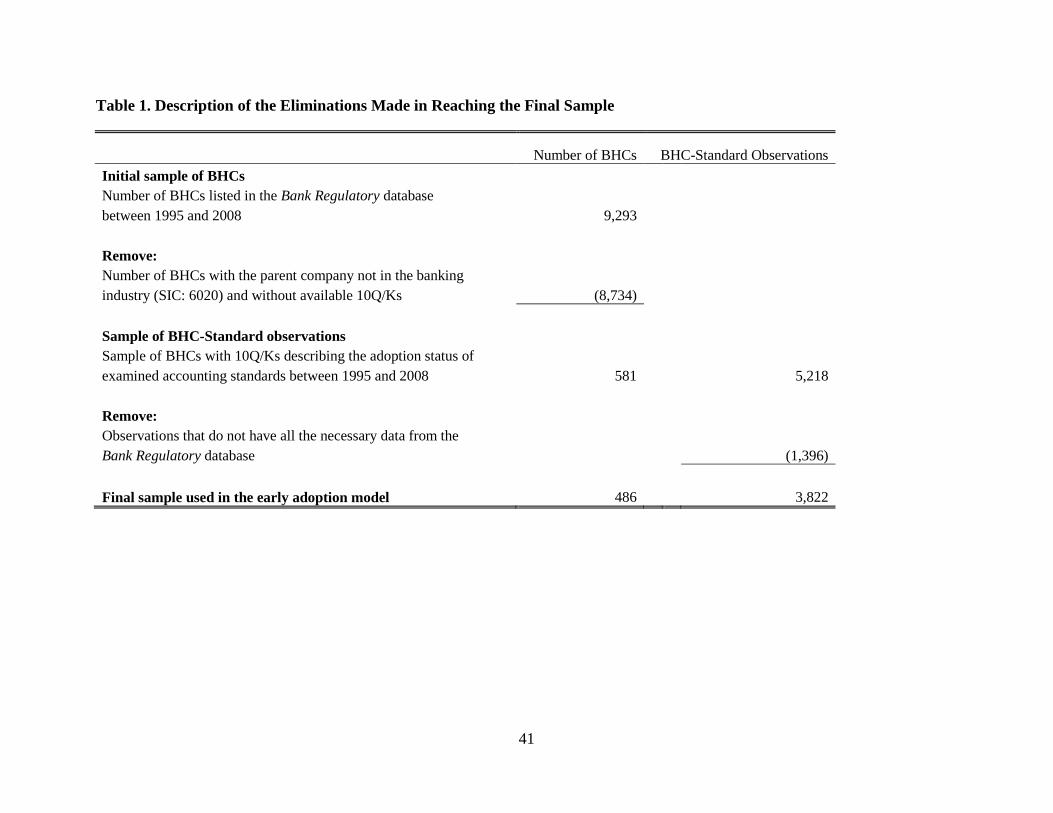
41
Table 1. Description of the Eliminations Made in Reaching the Final Sample
Number of BHCs BHC-Standard Observations
Initial sample of BHCs Number of BHCs listed in the Bank Regulatory database between 1995 and 2008 9,293
Remove: Number of BHCs with the parent company not in the banking industry (SIC: 6020) and without available 10Q/Ks (8,734)
Sample of BHC-Standard observations Sample of BHCs with 10Q/Ks describing the adoption status of examined accounting standards between 1995 and 2008 581 5,218
Remove: Observations that do not have all the necessary data from the Bank Regulatory database (1,396)
Final sample used in the early adoption model 486 3,822
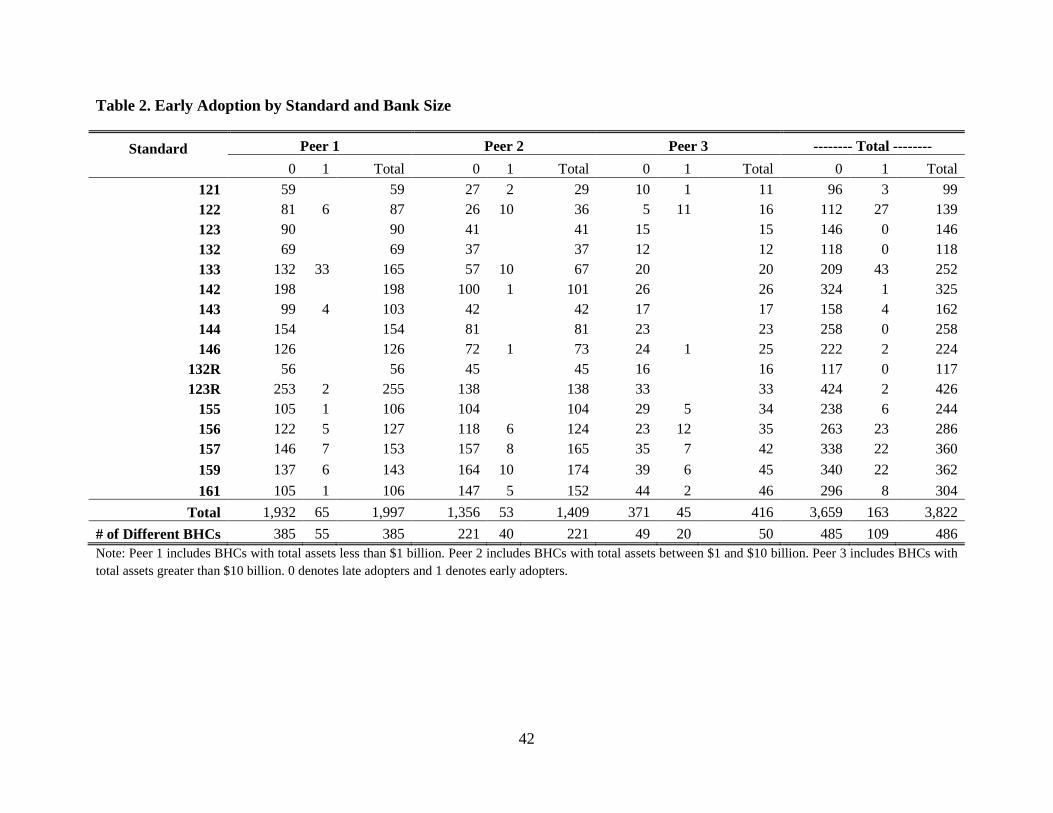
42
Table 2. Early Adoption by Standard and Bank Size
Standard Peer 1 Peer 2 Peer 3 -------- Total --------
0 1 Total 0 1 Total 0 1 Total 0 1 Total
121 59 59 27 2 29 10 1 11 96 3 99 122 81 6 87 26 10 36 5 11 16 112 27 139 123 90 90 41 41 15 15 146 0 146 132 69 69 37 37 12 12 118 0 118 133 132 33 165 57 10 67 20 20 209 43 252 142 198 198 100 1 101 26 26 324 1 325 143 99 4 103 42 42 17 17 158 4 162 144 154 154 81 81 23 23 258 0 258 146 126 126 72 1 73 24 1 25 222 2 224
132R 56 56 45 45 16 16 117 0 117 123R 253 2 255 138 138 33 33 424 2 426
155 105 1 106 104 104 29 5 34 238 6 244 156 122 5 127 118 6 124 23 12 35 263 23 286 157 146 7 153 157 8 165 35 7 42 338 22 360
159 137 6 143 164 10 174 39 6 45 340 22 362
161 105 1 106 147 5 152 44 2 46 296 8 304
Total 1,932 65 1,997 1,356 53 1,409 371 45 416 3,659 163 3,822
# of Different BHCs 385 55 385 221 40 221 49 20 50 485 109 486 Note: Peer 1 includes BHCs with total assets less than $1 billion. Peer 2 includes BHCs with total assets between $1 and $10 billion. Peer 3 includes BHCs with total assets greater than $10 billion. 0 denotes late adopters and 1 denotes early adopters.
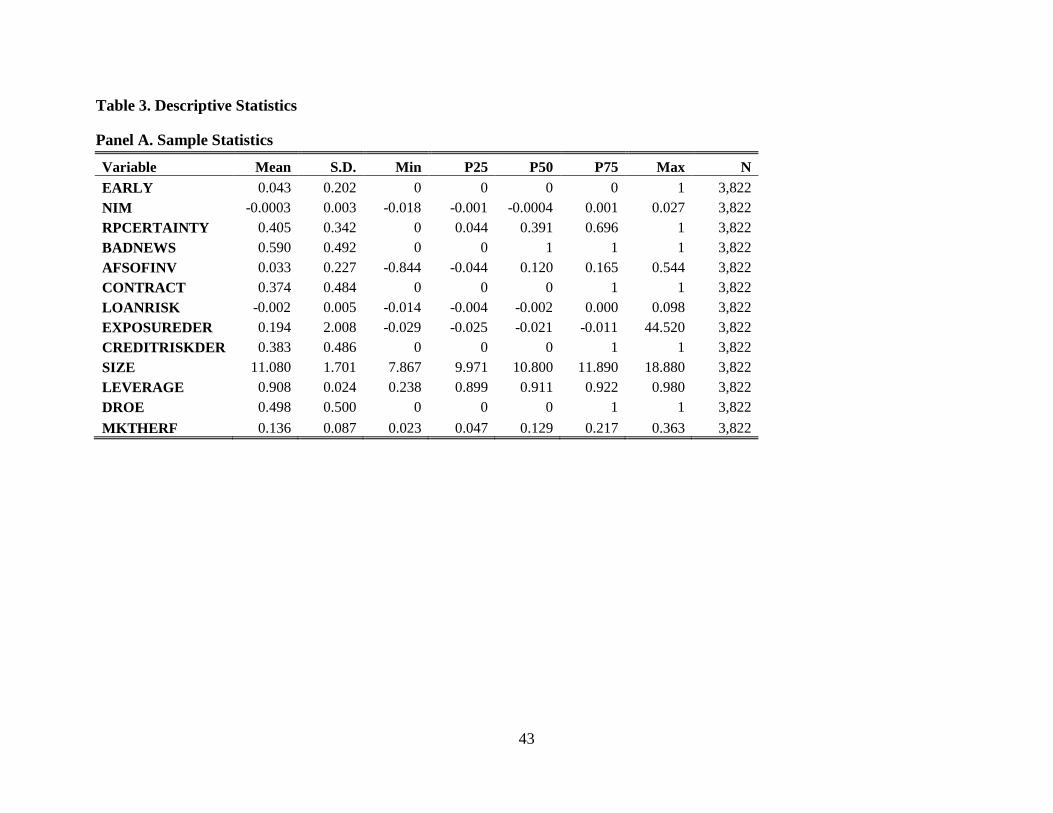
43
Table 3. Descriptive Statistics
Panel A. Sample Statistics
Variable Mean S.D. Min P25 P50 P75 Max N EARLY 0.043 0.202 0 0 0 0 1 3,822 NIM -0.0003 0.003 -0.018 -0.001 -0.0004 0.001 0.027 3,822 RPCERTAINTY 0.405 0.342 0 0.044 0.391 0.696 1 3,822 BADNEWS 0.590 0.492 0 0 1 1 1 3,822 AFSOFINV 0.033 0.227 -0.844 -0.044 0.120 0.165 0.544 3,822 CONTRACT 0.374 0.484 0 0 0 1 1 3,822 LOANRISK -0.002 0.005 -0.014 -0.004 -0.002 0.000 0.098 3,822 EXPOSUREDER 0.194 2.008 -0.029 -0.025 -0.021 -0.011 44.520 3,822 CREDITRISKDER 0.383 0.486 0 0 0 1 1 3,822 SIZE 11.080 1.701 7.867 9.971 10.800 11.890 18.880 3,822 LEVERAGE 0.908 0.024 0.238 0.899 0.911 0.922 0.980 3,822 DROE 0.498 0.500 0 0 0 1 1 3,822
MKTHERF 0.136 0.087 0.023 0.047 0.129 0.217 0.363 3,822
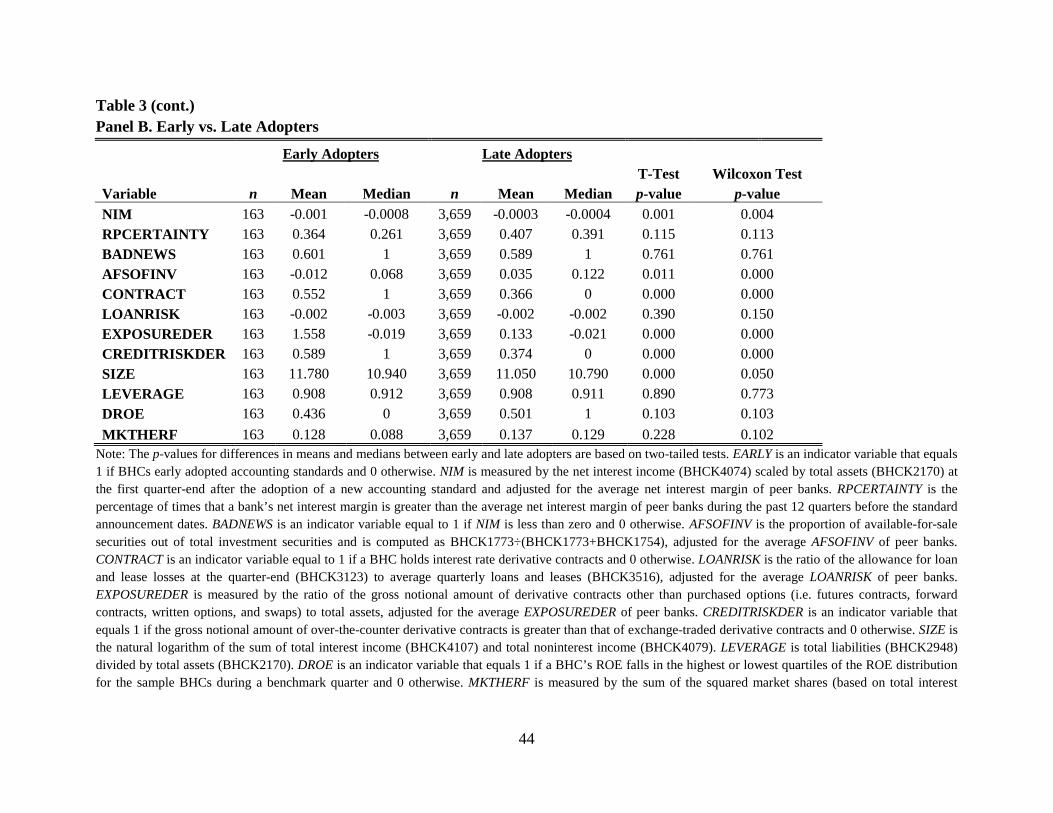
44
Table 3 (cont.) Panel B. Early vs. Late Adopters
Early Adopters Late Adopters T-Test Wilcoxon Test
Variable n Mean Median n Mean Median p-value p-value NIM 163 -0.001 -0.0008 3,659 -0.0003 -0.0004 0.001 0.004 RPCERTAINTY 163 0.364 0.261 3,659 0.407 0.391 0.115 0.113 BADNEWS 163 0.601 1 3,659 0.589 1 0.761 0.761 AFSOFINV 163 -0.012 0.068 3,659 0.035 0.122 0.011 0.000 CONTRACT 163 0.552 1 3,659 0.366 0 0.000 0.000 LOANRISK 163 -0.002 -0.003 3,659 -0.002 -0.002 0.390 0.150 EXPOSUREDER 163 1.558 -0.019 3,659 0.133 -0.021 0.000 0.000 CREDITRISKDER 163 0.589 1 3,659 0.374 0 0.000 0.000 SIZE 163 11.780 10.940 3,659 11.050 10.790 0.000 0.050 LEVERAGE 163 0.908 0.912 3,659 0.908 0.911 0.890 0.773 DROE 163 0.436 0 3,659 0.501 1 0.103 0.103
MKTHERF 163 0.128 0.088 3,659 0.137 0.129 0.228 0.102 Note: The p-values for differences in means and medians between early and late adopters are based on two-tailed tests. EARLY is an indicator variable that equals 1 if BHCs early adopted accounting standards and 0 otherwise. NIM is measured by the net interest income (BHCK4074) scaled by total assets (BHCK2170) at the first quarter-end after the adoption of a new accounting standard and adjusted for the average net interest margin of peer banks. RPCERTAINTY is the percentage of times that a bank’s net interest margin is greater than the average net interest margin of peer banks during the past 12 quarters before the standard announcement dates. BADNEWS is an indicator variable equal to 1 if NIM is less than zero and 0 otherwise. AFSOFINV is the proportion of available-for-sale securities out of total investment securities and is computed as BHCK1773÷(BHCK1773+BHCK1754), adjusted for the average AFSOFINV of peer banks. CONTRACT is an indicator variable equal to 1 if a BHC holds interest rate derivative contracts and 0 otherwise. LOANRISK is the ratio of the allowance for loan and lease losses at the quarter-end (BHCK3123) to average quarterly loans and leases (BHCK3516), adjusted for the average LOANRISK of peer banks. EXPOSUREDER is measured by the ratio of the gross notional amount of derivative contracts other than purchased options (i.e. futures contracts, forward contracts, written options, and swaps) to total assets, adjusted for the average EXPOSUREDER of peer banks. CREDITRISKDER is an indicator variable that equals 1 if the gross notional amount of over-the-counter derivative contracts is greater than that of exchange-traded derivative contracts and 0 otherwise. SIZE is the natural logarithm of the sum of total interest income (BHCK4107) and total noninterest income (BHCK4079). LEVERAGE is total liabilities (BHCK2948) divided by total assets (BHCK2170). DROE is an indicator variable that equals 1 if a BHC’s ROE falls in the highest or lowest quartiles of the ROE distribution for the sample BHCs during a benchmark quarter and 0 otherwise. MKTHERF is measured by the sum of the squared market shares (based on total interest

45
income and total noninterest income) of banks operating in the same geographic region; five geographic regions are identified: Eastern, Southeast, Midwest, Southwest, and West.
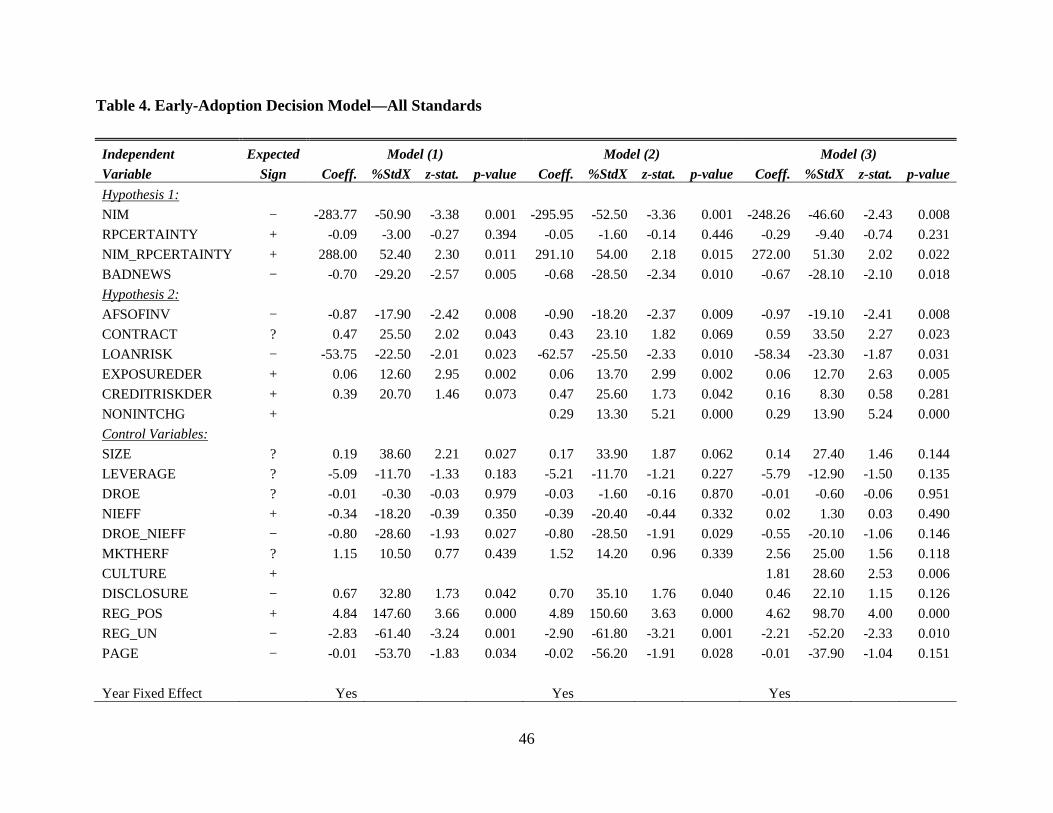
46
Table 4. Early-Adoption Decision Model—All Standards
Independent Expected Model (1) Model (2) Model (3) Variable Sign Coeff. %StdX z-stat. p-value Coeff. %StdX z-stat. p-value Coeff. %StdX z-stat. p-value
Hypothesis 1:
NIM − -283.77 -50.90 -3.38 0.001 -295.95 -52.50 -3.36 0.001 -248.26 -46.60 -2.43 0.008
RPCERTAINTY + -0.09 -3.00 -0.27 0.394 -0.05 -1.60 -0.14 0.446 -0.29 -9.40 -0.74 0.231
NIM_RPCERTAINTY + 288.00 52.40 2.30 0.011 291.10 54.00 2.18 0.015 272.00 51.30 2.02 0.022
BADNEWS − -0.70 -29.20 -2.57 0.005 -0.68 -28.50 -2.34 0.010 -0.67 -28.10 -2.10 0.018
Hypothesis 2:
AFSOFINV − -0.87 -17.90 -2.42 0.008 -0.90 -18.20 -2.37 0.009 -0.97 -19.10 -2.41 0.008
CONTRACT ? 0.47 25.50 2.02 0.043 0.43 23.10 1.82 0.069 0.59 33.50 2.27 0.023
LOANRISK − -53.75 -22.50 -2.01 0.023 -62.57 -25.50 -2.33 0.010 -58.34 -23.30 -1.87 0.031
EXPOSUREDER + 0.06 12.60 2.95 0.002 0.06 13.70 2.99 0.002 0.06 12.70 2.63 0.005
CREDITRISKDER + 0.39 20.70 1.46 0.073 0.47 25.60 1.73 0.042 0.16 8.30 0.58 0.281
NONINTCHG + 0.29 13.30 5.21 0.000 0.29 13.90 5.24 0.000
Control Variables:
SIZE ? 0.19 38.60 2.21 0.027 0.17 33.90 1.87 0.062 0.14 27.40 1.46 0.144
LEVERAGE ? -5.09 -11.70 -1.33 0.183 -5.21 -11.70 -1.21 0.227 -5.79 -12.90 -1.50 0.135
DROE ? -0.01 -0.30 -0.03 0.979 -0.03 -1.60 -0.16 0.870 -0.01 -0.60 -0.06 0.951
NIEFF + -0.34 -18.20 -0.39 0.350 -0.39 -20.40 -0.44 0.332 0.02 1.30 0.03 0.490
DROE_NIEFF − -0.80 -28.60 -1.93 0.027 -0.80 -28.50 -1.91 0.029 -0.55 -20.10 -1.06 0.146
MKTHERF ? 1.15 10.50 0.77 0.439 1.52 14.20 0.96 0.339 2.56 25.00 1.56 0.118
CULTURE + 1.81 28.60 2.53 0.006
DISCLOSURE − 0.67 32.80 1.73 0.042 0.70 35.10 1.76 0.040 0.46 22.10 1.15 0.126
REG_POS + 4.84 147.60 3.66 0.000 4.89 150.60 3.63 0.000 4.62 98.70 4.00 0.000
REG_UN − -2.83 -61.40 -3.24 0.001 -2.90 -61.80 -3.21 0.001 -2.21 -52.20 -2.33 0.010
PAGE − -0.01 -53.70 -1.83 0.034 -0.02 -56.20 -1.91 0.028 -0.01 -37.90 -1.04 0.151
Year Fixed Effect Yes Yes Yes
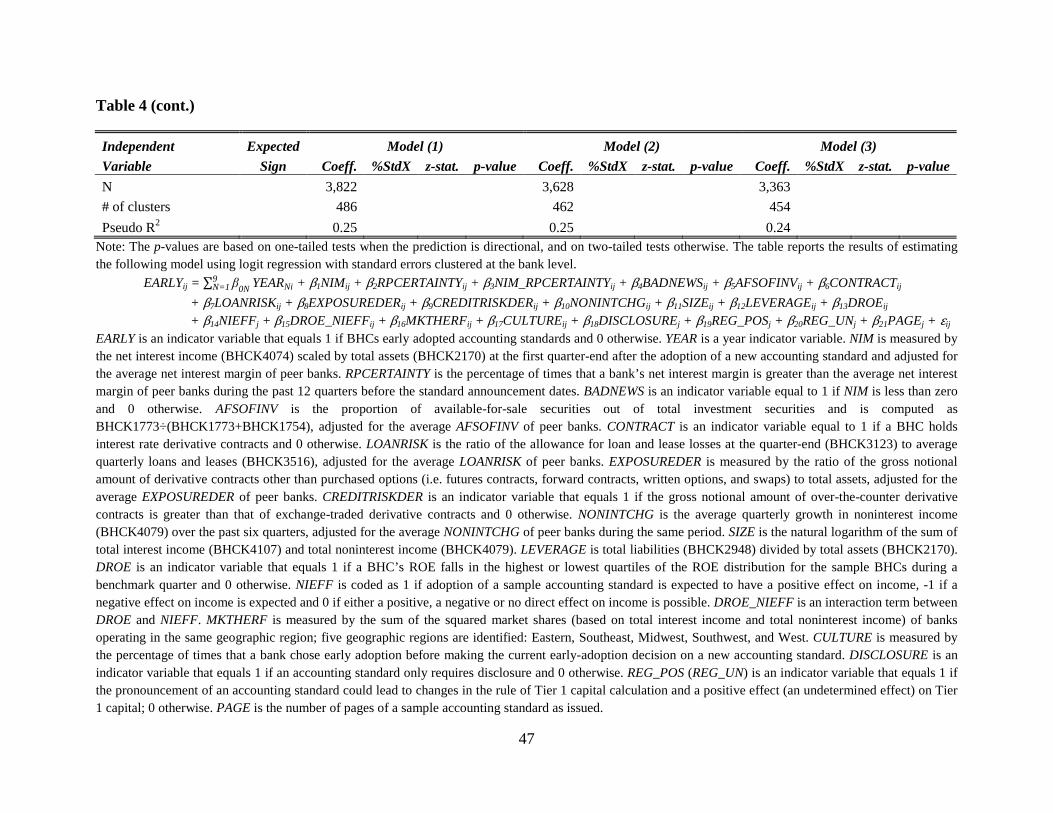
47
Table 4 (cont.)
Independent Expected Model (1) Model (2) Model (3) Variable Sign Coeff. %StdX z-stat. p-value Coeff. %StdX z-stat. p-value Coeff. %StdX z-stat. p-value
N 3,822 3,628 3,363
# of clusters 486 462 454
Pseudo R2 0.25 0.25 0.24 Note: The p-values are based on one-tailed tests when the prediction is directional, and on two-tailed tests otherwise. The table reports the results of estimating the following model using logit regression with standard errors clustered at the bank level.
EARLYij = ∑ β0N9N=1 YEARNi + β1NIMij + β2RPCERTAINTYij + β3NIM_RPCERTAINTYij + β4BADNEWSij + β5AFSOFINVij + β6CONTRACTij
+ β7LOANRISKij + β8EXPOSUREDERij + β9CREDITRISKDERij + β10NONINTCHGij + β11SIZEij + β12LEVERAGEij + β13DROEij + β14NIEFFj + β15DROE_NIEFFij + β16MKTHERFij + β17CULTUREij + β18DISCLOSUREj + β19REG_POSj + β20REG_UNj + β21PAGEj + εij
EARLY is an indicator variable that equals 1 if BHCs early adopted accounting standards and 0 otherwise. YEAR is a year indicator variable. NIM is measured by the net interest income (BHCK4074) scaled by total assets (BHCK2170) at the first quarter-end after the adoption of a new accounting standard and adjusted for the average net interest margin of peer banks. RPCERTAINTY is the percentage of times that a bank’s net interest margin is greater than the average net interest margin of peer banks during the past 12 quarters before the standard announcement dates. BADNEWS is an indicator variable equal to 1 if NIM is less than zero and 0 otherwise. AFSOFINV is the proportion of available-for-sale securities out of total investment securities and is computed as BHCK1773÷(BHCK1773+BHCK1754), adjusted for the average AFSOFINV of peer banks. CONTRACT is an indicator variable equal to 1 if a BHC holds interest rate derivative contracts and 0 otherwise. LOANRISK is the ratio of the allowance for loan and lease losses at the quarter-end (BHCK3123) to average quarterly loans and leases (BHCK3516), adjusted for the average LOANRISK of peer banks. EXPOSUREDER is measured by the ratio of the gross notional amount of derivative contracts other than purchased options (i.e. futures contracts, forward contracts, written options, and swaps) to total assets, adjusted for the average EXPOSUREDER of peer banks. CREDITRISKDER is an indicator variable that equals 1 if the gross notional amount of over-the-counter derivative contracts is greater than that of exchange-traded derivative contracts and 0 otherwise. NONINTCHG is the average quarterly growth in noninterest income (BHCK4079) over the past six quarters, adjusted for the average NONINTCHG of peer banks during the same period. SIZE is the natural logarithm of the sum of total interest income (BHCK4107) and total noninterest income (BHCK4079). LEVERAGE is total liabilities (BHCK2948) divided by total assets (BHCK2170). DROE is an indicator variable that equals 1 if a BHC’s ROE falls in the highest or lowest quartiles of the ROE distribution for the sample BHCs during a benchmark quarter and 0 otherwise. NIEFF is coded as 1 if adoption of a sample accounting standard is expected to have a positive effect on income, -1 if a negative effect on income is expected and 0 if either a positive, a negative or no direct effect on income is possible. DROE_NIEFF is an interaction term between DROE and NIEFF. MKTHERF is measured by the sum of the squared market shares (based on total interest income and total noninterest income) of banks operating in the same geographic region; five geographic regions are identified: Eastern, Southeast, Midwest, Southwest, and West. CULTURE is measured by the percentage of times that a bank chose early adoption before making the current early-adoption decision on a new accounting standard. DISCLOSURE is an indicator variable that equals 1 if an accounting standard only requires disclosure and 0 otherwise. REG_POS (REG_UN) is an indicator variable that equals 1 if the pronouncement of an accounting standard could lead to changes in the rule of Tier 1 capital calculation and a positive effect (an undetermined effect) on Tier 1 capital; 0 otherwise. PAGE is the number of pages of a sample accounting standard as issued.
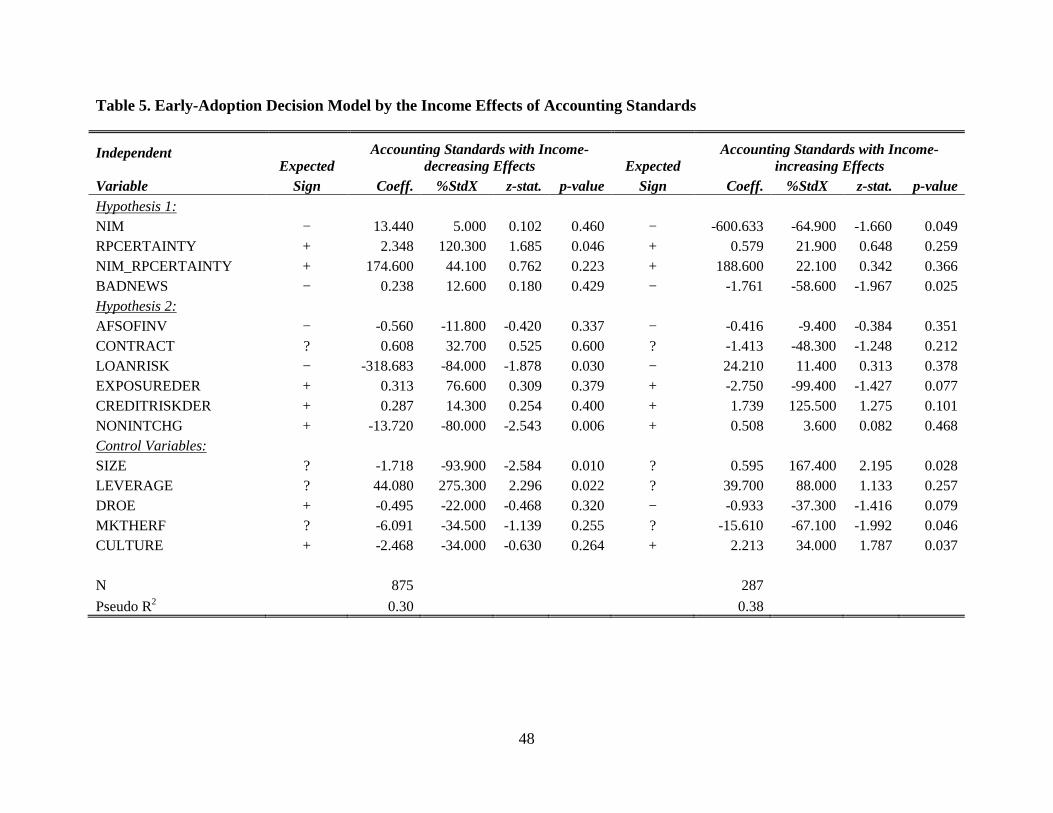
48
Table 5. Early-Adoption Decision Model by the Income Effects of Accounting Standards
Independent Expected
Accounting Standards with Income-decreasing Effects Expected
Accounting Standards with Income-increasing Effects
Variable Sign Coeff. %StdX z-stat. p-value Sign Coeff. %StdX z-stat. p-value Hypothesis 1: NIM − 13.440 5.000 0.102 0.460 − -600.633 -64.900 -1.660 0.049 RPCERTAINTY + 2.348 120.300 1.685 0.046 + 0.579 21.900 0.648 0.259 NIM_RPCERTAINTY + 174.600 44.100 0.762 0.223 + 188.600 22.100 0.342 0.366 BADNEWS − 0.238 12.600 0.180 0.429 − -1.761 -58.600 -1.967 0.025 Hypothesis 2: AFSOFINV − -0.560 -11.800 -0.420 0.337 − -0.416 -9.400 -0.384 0.351 CONTRACT ? 0.608 32.700 0.525 0.600 ? -1.413 -48.300 -1.248 0.212 LOANRISK − -318.683 -84.000 -1.878 0.030 − 24.210 11.400 0.313 0.378 EXPOSUREDER + 0.313 76.600 0.309 0.379 + -2.750 -99.400 -1.427 0.077 CREDITRISKDER + 0.287 14.300 0.254 0.400 + 1.739 125.500 1.275 0.101 NONINTCHG + -13.720 -80.000 -2.543 0.006 + 0.508 3.600 0.082 0.468 Control Variables: SIZE ? -1.718 -93.900 -2.584 0.010 ? 0.595 167.400 2.195 0.028 LEVERAGE ? 44.080 275.300 2.296 0.022 ? 39.700 88.000 1.133 0.257 DROE + -0.495 -22.000 -0.468 0.320 − -0.933 -37.300 -1.416 0.079 MKTHERF ? -6.091 -34.500 -1.139 0.255 ? -15.610 -67.100 -1.992 0.046 CULTURE + -2.468 -34.000 -0.630 0.264 + 2.213 34.000 1.787 0.037
N 875 287
Pseudo R2 0.30 0.38
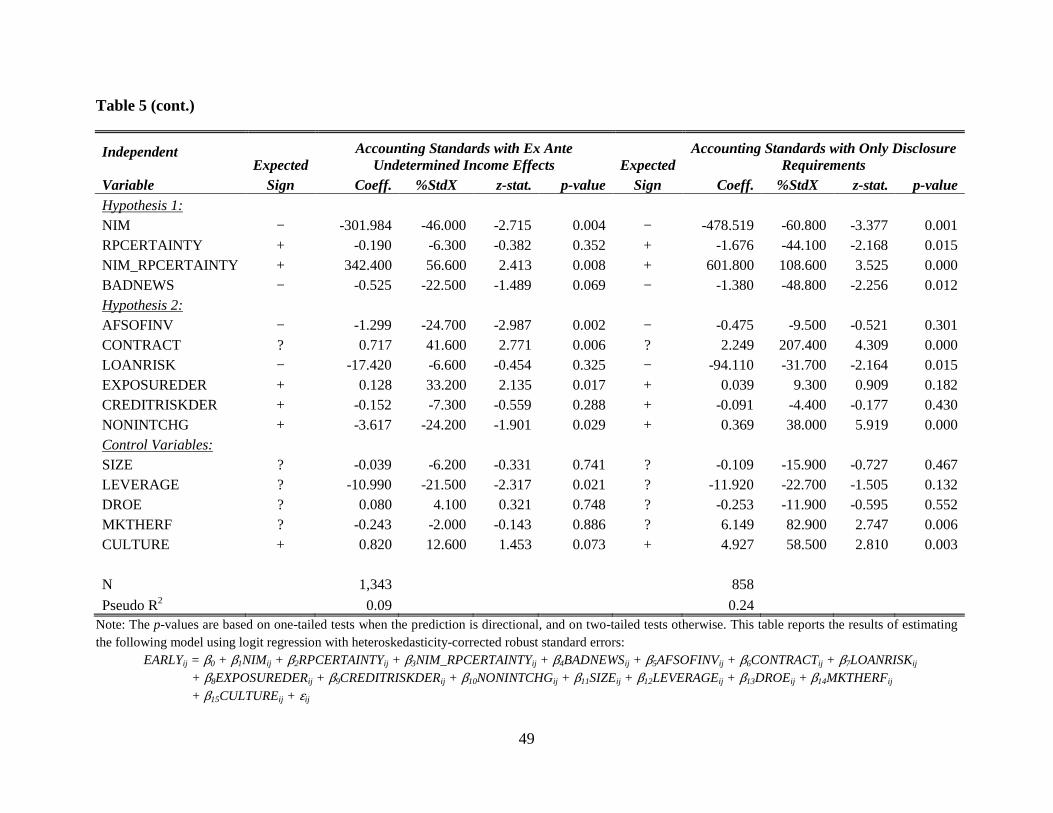
49
Table 5 (cont.)
Independent Expected
Accounting Standards with Ex Ante Undetermined Income Effects Expected
Accounting Standards with Only Disclosure Requirements
Variable Sign Coeff. %StdX z-stat. p-value Sign Coeff. %StdX z-stat. p-value Hypothesis 1: NIM − -301.984 -46.000 -2.715 0.004 − -478.519 -60.800 -3.377 0.001 RPCERTAINTY + -0.190 -6.300 -0.382 0.352 + -1.676 -44.100 -2.168 0.015 NIM_RPCERTAINTY + 342.400 56.600 2.413 0.008 + 601.800 108.600 3.525 0.000 BADNEWS − -0.525 -22.500 -1.489 0.069 − -1.380 -48.800 -2.256 0.012 Hypothesis 2: AFSOFINV − -1.299 -24.700 -2.987 0.002 − -0.475 -9.500 -0.521 0.301 CONTRACT ? 0.717 41.600 2.771 0.006 ? 2.249 207.400 4.309 0.000 LOANRISK − -17.420 -6.600 -0.454 0.325 − -94.110 -31.700 -2.164 0.015 EXPOSUREDER + 0.128 33.200 2.135 0.017 + 0.039 9.300 0.909 0.182 CREDITRISKDER + -0.152 -7.300 -0.559 0.288 + -0.091 -4.400 -0.177 0.430 NONINTCHG + -3.617 -24.200 -1.901 0.029 + 0.369 38.000 5.919 0.000 Control Variables: SIZE ? -0.039 -6.200 -0.331 0.741 ? -0.109 -15.900 -0.727 0.467 LEVERAGE ? -10.990 -21.500 -2.317 0.021 ? -11.920 -22.700 -1.505 0.132 DROE ? 0.080 4.100 0.321 0.748 ? -0.253 -11.900 -0.595 0.552 MKTHERF ? -0.243 -2.000 -0.143 0.886 ? 6.149 82.900 2.747 0.006 CULTURE + 0.820 12.600 1.453 0.073 + 4.927 58.500 2.810 0.003
N 1,343 858
Pseudo R2 0.09 0.24 Note: The p-values are based on one-tailed tests when the prediction is directional, and on two-tailed tests otherwise. This table reports the results of estimating the following model using logit regression with heteroskedasticity-corrected robust standard errors:
EARLYij = β0 + β1NIMij + β2RPCERTAINTYij + β3NIM_RPCERTAINTYij + β4BADNEWSij + β5AFSOFINVij + β6CONTRACTij + β7LOANRISKij + β8EXPOSUREDERij + β9CREDITRISKDERij + β10NONINTCHGij + β11SIZEij + β12LEVERAGEij + β13DROEij + β14MKTHERFij + β15CULTUREij + εij

50
EARLY is an indicator variable that equals 1 if BHCs early adopted accounting standards and 0 otherwise. NIM is measured by the net interest income (BHCK4074) scaled by total assets (BHCK2170) at the first quarter-end after the adoption of a new accounting standard and adjusted for the average net interest margin of peer banks. RPCERTAINTY is the percentage of times that a bank’s net interest margin is greater than the average net interest margin of peer banks during the past 12 quarters before the standard announcement dates. BADNEWS is an indicator variable equal to 1 if NIM is less than zero and 0 otherwise. AFSOFINV is the proportion of available-for-sale securities out of total investment securities and is computed as BHCK1773÷(BHCK1773+BHCK1754), adjusted for the average AFSOFINV of peer banks. CONTRACT is an indicator variable equal to 1 if a BHC holds interest rate derivative contracts and 0 otherwise. LOANRISK is the ratio of the allowance for loan and lease losses at the quarter-end (BHCK3123) to average quarterly loans and leases (BHCK3516), adjusted for the average LOANRISK of peer banks. EXPOSUREDER is measured by the ratio of the gross notional amount of derivative contracts other than purchased options (i.e. futures contracts, forward contracts, written options, and swaps) to total assets, adjusted for the average EXPOSUREDER of peer banks. CREDITRISKDER is an indicator variable that equals 1 if the gross notional amount of over-the-counter derivative contracts is greater than that of exchange-traded derivative contracts and 0 otherwise. NONINTCHG is the average quarterly growth in noninterest income (BHCK4079) over the past six quarters, adjusted for the average NONINTCHG of peer banks during the same period. SIZE is the natural logarithm of the sum of total interest income (BHCK4107) and total noninterest income (BHCK4079). LEVERAGE is total liabilities (BHCK2948) divided by total assets (BHCK2170). DROE is an indicator variable that equals 1 if a BHC’s ROE falls in the highest or lowest quartiles of the ROE distribution for the sample BHCs during a benchmark quarter and 0 otherwise. MKTHERF is measured by the sum of the squared market shares (based on total interest income and total noninterest income) of banks operating in the same geographic region; five geographic regions are identified: Eastern, Southeast, Midwest, Southwest, and West. CULTURE is measured by the percentage of times that a bank chose early adoption before making the current early-adoption decision on a new accounting standard. Accounting standards with income-decreasing effect include SFAS No. 121, SFAS No. 123, SFAS No. 143, SFAS No. 144, and SFAS No. 123R. Accounting standards with income-increasing effect include SFAS No. 122 and SFAS No. 146. Accounting standards with undetermined income effect include SFAS No. 133, SFAS No. 142, SFAS No. 155, SFAS No. 156, and SFAS No. 159. Accounting standards with disclosure requirements include SFAS No. 132, SFAS No. 132R, SFAS No. 157, and SFAS No. 161.

51
Table 6. Additional Analysis
Panel A. Early-Adoption Decision Model by Bank Size
Independent Expected Small BHCs Mid-sized BHCs Large BHCs Variable Sign Coeff. p-value Coeff. p-value Coeff. p-value Hypothesis 1: NIM − -213.381 0.045 -668.938 0.000 325.900 0.087 RPCERTAINTY + -0.217 0.373 -0.505 0.261 -1.543 0.082 NIM_RPCERTAINTY + 487.900 0.005 527.900 0.015 -420.230 0.180 BADNEWS − -0.424 0.175 -1.508 0.004 -0.779 0.148 Hypothesis 2: AFSOFINV − -0.851 0.045 -1.270 0.054 -1.063 0.244 CONTRACT ? 0.581 0.180 1.150 0.011 1.118 0.226 LOANRISK − -80.340 0.100 -63.900 0.130 -216.001 0.008 EXPOSUREDER + -18.230 0.061 -12.000 0.015 0.051 0.107 CREDITRISKDER + 0.619 0.115 0.329 0.236 NONINTCHG + -5.970 0.006 0.485 0.000 -11.280 0.003 Control Variables: SIZE ? -0.081 0.832 -0.066 0.860 0.895 0.001 LEVERAGE ? 4.690 0.244 -4.832 0.580 -22.200 0.314 DROE ? -0.309 0.425 0.561 0.140 -0.040 0.930 NIEFF + -15.330 0.000 2.686 0.006 2.292 0.000 DROE_NIEFF − -0.285 0.353 -1.535 0.047 0.095 0.463 MKTHERF ? -0.024 0.994 6.908 0.009 0.453 0.922 CULTURE + 0.980 0.226 3.549 0.016 0.914 0.203 DISCLOSURE − 0.873 0.139 -0.063 0.416 0.327 0.178 REG_POS + 31.590 0.000 4.089 0.001 4.566 0.000 REG_UN − -3.029 0.035 -15.230 0.000 0.574 0.121 PAGE − -0.016 0.123 -0.002 0.416 0.016 0.000
Year Fixed Effect Yes Yes Yes
N 1,643 1,325 395 # of clusters 336 215 49
Pseudo R2 0.27 0.34 0.37
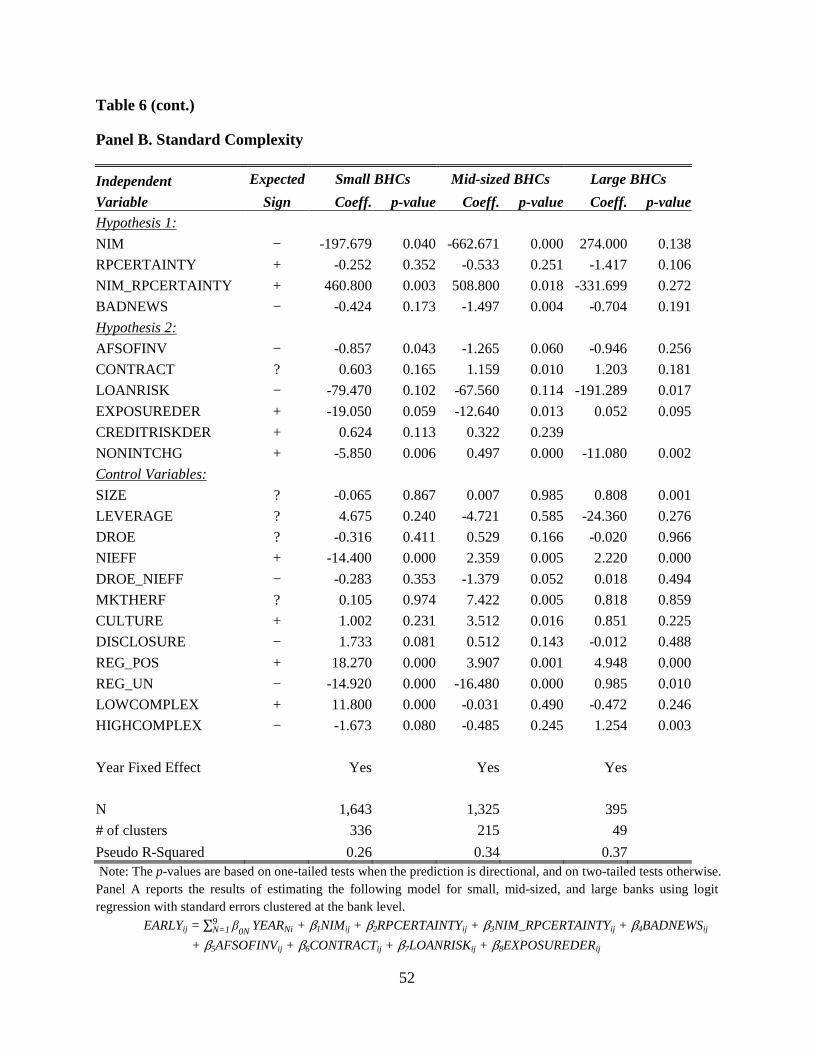
52
Table 6 (cont.)
Panel B. Standard Complexity
Independent Expected Small BHCs Mid-sized BHCs Large BHCs
Variable Sign Coeff. p-value Coeff. p-value Coeff. p-value Hypothesis 1:
NIM − -197.679 0.040 -662.671 0.000 274.000 0.138
RPCERTAINTY + -0.252 0.352 -0.533 0.251 -1.417 0.106
NIM_RPCERTAINTY + 460.800 0.003 508.800 0.018 -331.699 0.272
BADNEWS − -0.424 0.173 -1.497 0.004 -0.704 0.191
Hypothesis 2:
AFSOFINV − -0.857 0.043 -1.265 0.060 -0.946 0.256
CONTRACT ? 0.603 0.165 1.159 0.010 1.203 0.181
LOANRISK − -79.470 0.102 -67.560 0.114 -191.289 0.017
EXPOSUREDER + -19.050 0.059 -12.640 0.013 0.052 0.095
CREDITRISKDER + 0.624 0.113 0.322 0.239
NONINTCHG + -5.850 0.006 0.497 0.000 -11.080 0.002
Control Variables:
SIZE ? -0.065 0.867 0.007 0.985 0.808 0.001
LEVERAGE ? 4.675 0.240 -4.721 0.585 -24.360 0.276
DROE ? -0.316 0.411 0.529 0.166 -0.020 0.966
NIEFF + -14.400 0.000 2.359 0.005 2.220 0.000
DROE_NIEFF − -0.283 0.353 -1.379 0.052 0.018 0.494
MKTHERF ? 0.105 0.974 7.422 0.005 0.818 0.859
CULTURE + 1.002 0.231 3.512 0.016 0.851 0.225
DISCLOSURE − 1.733 0.081 0.512 0.143 -0.012 0.488
REG_POS + 18.270 0.000 3.907 0.001 4.948 0.000
REG_UN − -14.920 0.000 -16.480 0.000 0.985 0.010
LOWCOMPLEX + 11.800 0.000 -0.031 0.490 -0.472 0.246
HIGHCOMPLEX − -1.673 0.080 -0.485 0.245 1.254 0.003
Year Fixed Effect Yes Yes Yes
N 1,643 1,325 395
# of clusters 336 215 49
Pseudo R-Squared 0.26 0.34 0.37 Note: The p-values are based on one-tailed tests when the prediction is directional, and on two-tailed tests otherwise. Panel A reports the results of estimating the following model for small, mid-sized, and large banks using logit regression with standard errors clustered at the bank level.
EARLYij = ∑ β0N9N=1 YEARNi + β1NIMij + β2RPCERTAINTYij + β3NIM_RPCERTAINTYij + β4BADNEWSij
+ β5AFSOFINVij + β6CONTRACTij + β7LOANRISKij + β8EXPOSUREDERij

53
+ β9CREDITRISKDERij + β10NONINTCHGij + β11SIZEij + β12LEVERAGEij + β13DROEij
+ β14NIEFFj + β15DROE_NIEFFij + β16MKTHERFij + β17CULTUREij + β18DISCLOSUREj + β19REG_POSj + β20REG_UNj + β21PAGEj + εij
Panel B reports the results of estimating the following model for small, mid-sized, and large banks using logit regression with standard errors clustered at the bank level.
EARLYij = ∑ β0N9N=1 YEARNi + β1NIMij + β2RPCERTAINTYij + β3NIM_RPCERTAINTYij + β4BADNEWSij
+ β5AFSOFINVij + β6CONTRACTij + β7LOANRISKij + β8EXPOSUREDERij + β9CREDITRISKDERij + β10NONINTCHGij + β11SIZEij + β12LEVERAGEij + β13DROEij
+ β14NIEFFj + β15DROE_NIEFFij + β16MKTHERFij + β17CULTUREij + β18DISCLOSUREj + β19REG_POSj + β20REG_UNj + β21LOWCOMPLEXj + β22HIGHCOMPLEXj + εij
EARLY is an indicator variable that equals 1 if BHCs early adopted accounting standards and 0 otherwise. YEAR is a year indicator variable. NIM is measured by the net interest income (BHCK4074) scaled by total assets (BHCK2170) at the first quarter-end after the adoption of a new accounting standard and adjusted for the average net interest margin of peer banks. RPCERTAINTY is the percentage of times that a bank’s net interest margin is greater than the average net interest margin of peer banks during the past 12 quarters before the standard announcement dates. BADNEWS is an indicator variable equal to 1 if NIM is less than zero and 0 otherwise. AFSOFINV is the proportion of available-for-sale securities out of total investment securities and is computed as BHCK1773÷(BHCK1773+BHCK1754), adjusted for the average AFSOFINV of peer banks. CONTRACT is an indicator variable equal to 1 if a BHC holds interest rate derivative contracts and 0 otherwise. LOANRISK is the ratio of the allowance for loan and lease losses at the quarter-end (BHCK3123) to average quarterly loans and leases (BHCK3516), adjusted for the average LOANRISK of peer banks. EXPOSUREDER is measured by the ratio of the gross notional amount of derivative contracts other than purchased options (i.e. futures contracts, forward contracts, written options, and swaps) to total assets, adjusted for the average EXPOSUREDER of peer banks. CREDITRISKDER is an indicator variable that equals 1 if the gross notional amount of over-the-counter derivative contracts is greater than that of exchange-traded derivative contracts and 0 otherwise. NONINTCHG is the average quarterly growth in noninterest income (BHCK4079) over the past six quarters, adjusted for the average NONINTCHG of peer banks during the same period. SIZE is the natural logarithm of the sum of total interest income (BHCK4107) and total noninterest income (BHCK4079). LEVERAGE is total liabilities (BHCK2948) divided by total assets (BHCK2170). DROE is an indicator variable that equals 1 if a BHC’s ROE falls in the highest or lowest quartiles of the ROE distribution for the sample BHCs during a benchmark quarter and 0 otherwise. NIEFF is coded as 1 if adoption of a sample accounting standard is expected to have a positive effect on income, -1 if a negative effect on income is expected and 0 if either a positive, a negative or no direct effect on income is possible. DROE_NIEFF is an interaction term between DROE and NIEFF. MKTHERF is measured by the sum of the squared market shares (based on total interest income and total noninterest income) of banks operating in the same geographic region; five geographic regions are identified: Eastern, Southeast, Midwest, Southwest, and West. CULTURE is measured by the percentage of times that a bank chose early adoption before making the current early-adoption decision on a new accounting standard. DISCLOSURE is an indicator variable that equals 1 if an accounting standard only requires disclosure and 0 otherwise. REG_POS (REG_UN) is an indicator variable that equals 1 if the pronouncement of an accounting standard could lead to changes in the rule of Tier 1 capital calculation and a positive effect (an undetermined effect) on Tier 1 capital; 0 otherwise. PAGE is the number of pages of a sample accounting standard as issued. LOWCOMPLEX is an indicator variable which equals 1 if early-adoption decisions are on SFAS No. 122, SFAS No. 132, SFAS No. 146, SFAS No. 155, or SFAS No. 161, and 0 otherwise. HIGHCOMPLEX is an indicator variable which equals 1 if early-adoption decisions are on SFAS No. 123, SFAS No. 133, SFAS No. 123R, SFAS No. 156, or SFAS No. 157, and 0 otherwise.
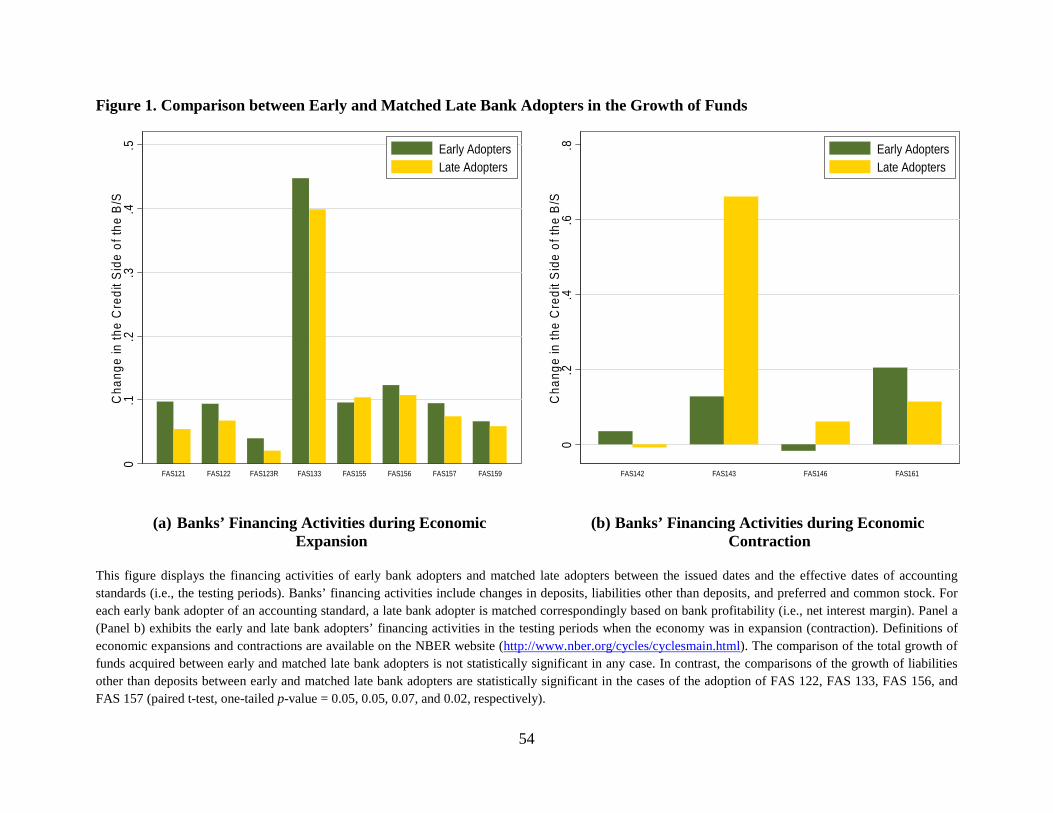
54
Figure 1. Comparison between Early and Matched Late Bank Adopters in the Growth of Funds
(a) Banks’ Financing Activities during Economic Expansion
(b) Banks’ Financing Activities during Economic Contraction
This figure displays the financing activities of early bank adopters and matched late adopters between the issued dates and the effective dates of accounting standards (i.e., the testing periods). Banks’ financing activities include changes in deposits, liabilities other than deposits, and preferred and common stock. For each early bank adopter of an accounting standard, a late bank adopter is matched correspondingly based on bank profitability (i.e., net interest margin). Panel a (Panel b) exhibits the early and late bank adopters’ financing activities in the testing periods when the economy was in expansion (contraction). Definitions of economic expansions and contractions are available on the NBER website (http://www.nber.org/cycles/cyclesmain.html). The comparison of the total growth of funds acquired between early and matched late bank adopters is not statistically significant in any case. In contrast, the comparisons of the growth of liabilities other than deposits between early and matched late bank adopters are statistically significant in the cases of the adoption of FAS 122, FAS 133, FAS 156, and FAS 157 (paired t-test, one-tailed p-value = 0.05, 0.05, 0.07, and 0.02, respectively).
0.1
.2.3
.4.5
Cha
nge
in th
e C
redi
t Sid
e of
the
B/S
FAS121 FAS122 FAS123R FAS133 FAS155 FAS156 FAS157 FAS159
Early AdoptersLate Adopters
0.2
.4.6
.8C
hang
e in
the
Cre
dit S
ide
of th
e B
/S
FAS142 FAS143 FAS146 FAS161
Early AdoptersLate Adopters
Recommended