E-MOBILITY GAME CHANGERS:
autonomous driving & e-cars,
new mobility services and
e-infrastructure
Prof. dr. Milan Prokin
University of Belgrade
Faculty of Electrical Engineering
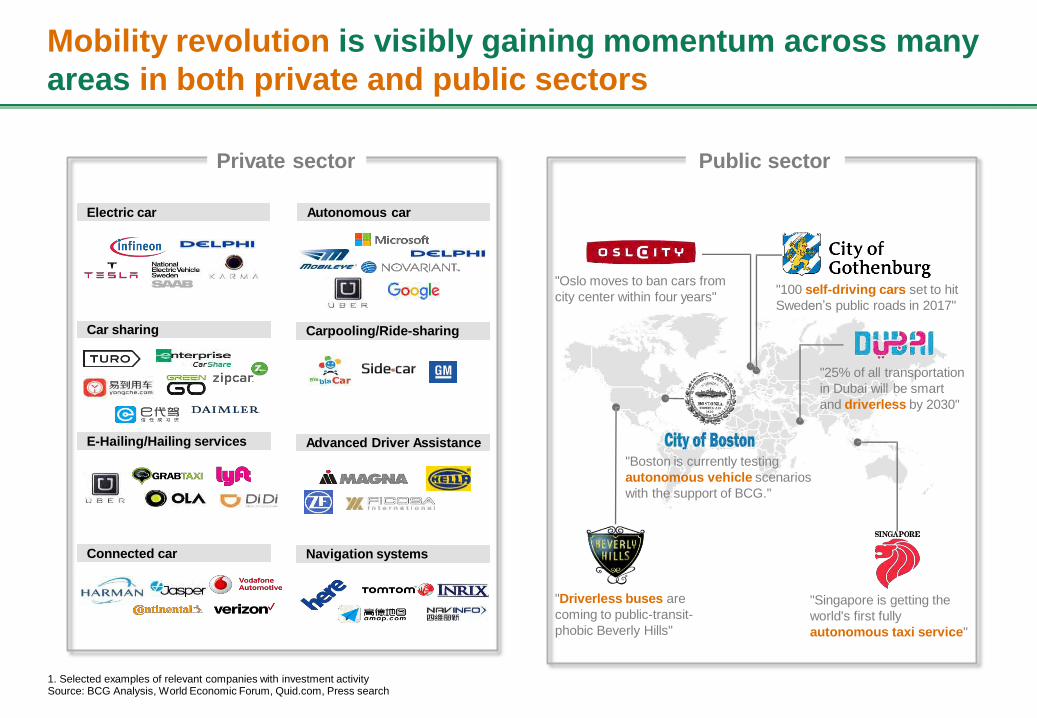
Mobility revolution is visibly gaining momentum across many
areas in both private and public sectors
Private sector
"100 self-driving cars set to hit
Sweden’s public roads in 2017"
"Oslo moves to ban cars from
city center within four years"
"Singapore is getting the
world's first fully
autonomous taxi service"
"25% of all transportation
in Dubai will be smart
and driverless by 2030"
"Driverless buses are
coming to public-transit-
phobic Beverly Hills"
1. Selected examples of relevant companies with investment activity Source: BCG Analysis, World Economic Forum, Quid.com, Press search
E-Hailing/Hailing services
Carpooling/Ride-sharing
Navigation systemsConnected car
Car sharing
Advanced Driver Assistance
"Boston is currently testing
autonomous vehicle scenarios
with the support of BCG."
Autonomous carElectric car
Public sector
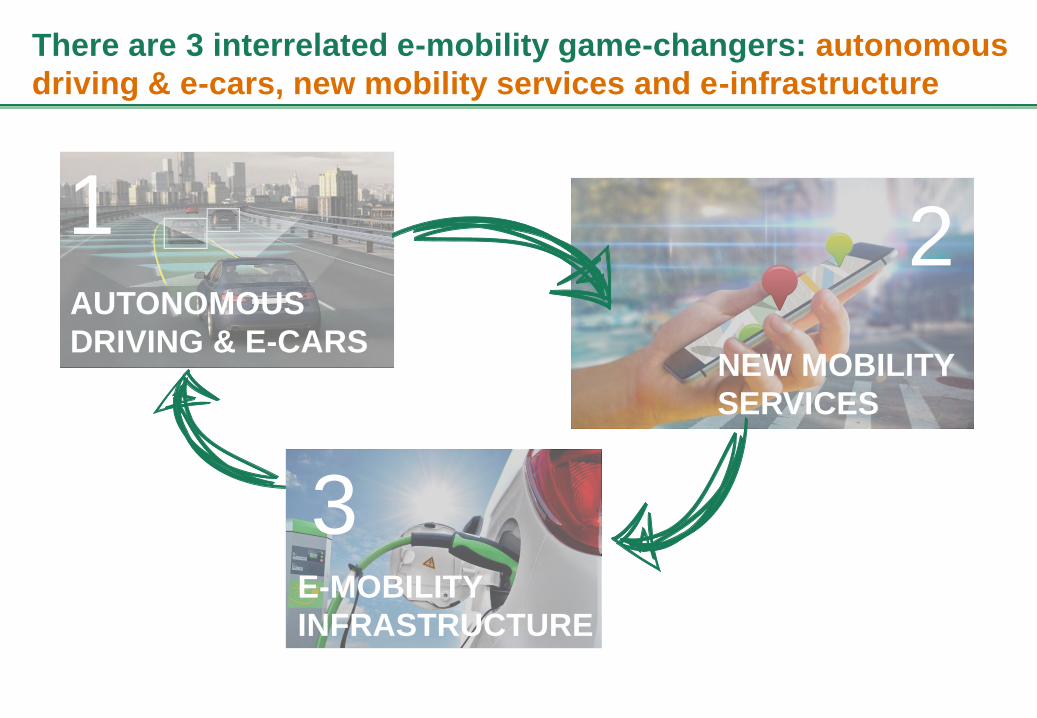
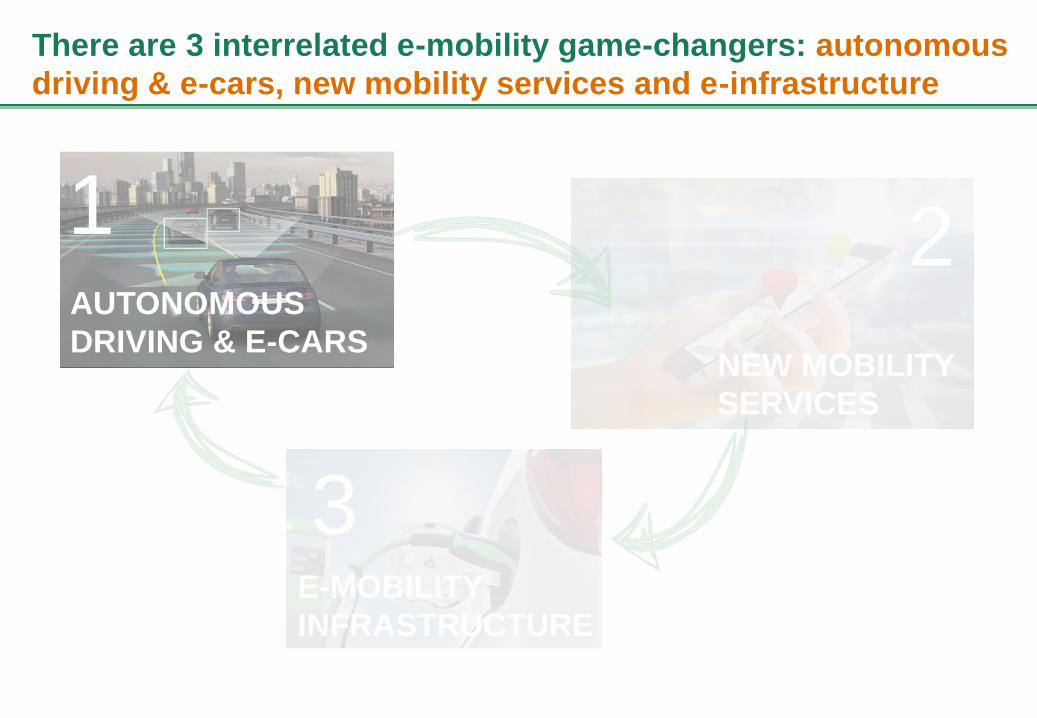
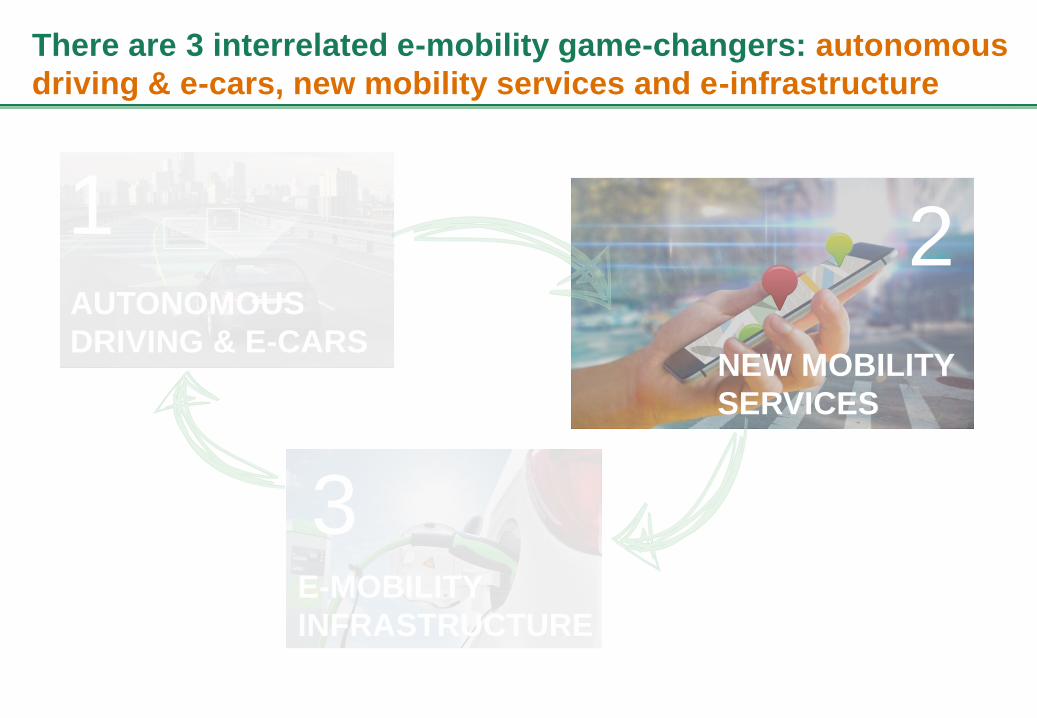
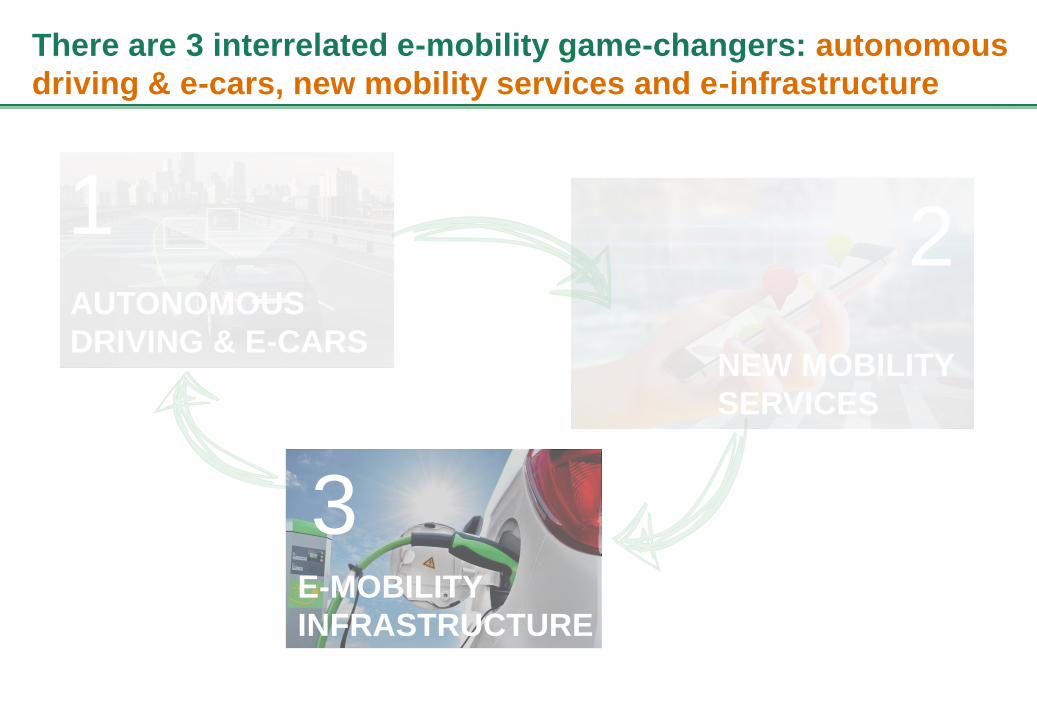
There are 3 interrelated e-mobility game-changers: autonomous
driving & e-cars, new mobility services and e-infrastructure
AUTONOMOUS
DRIVING & E-CARSNEW MOBILITY
SERVICES
E-MOBILITY
INFRASTRUCTURE
1 2
3
AUTONOMOUS
DRIVING & E-CARSNEW MOBILITY
SERVICES
E-MOBILITY
INFRASTRUCTURE
1 2
3
There are 3 interrelated e-mobility game-changers: autonomous
driving & e-cars, new mobility services and e-infrastructure
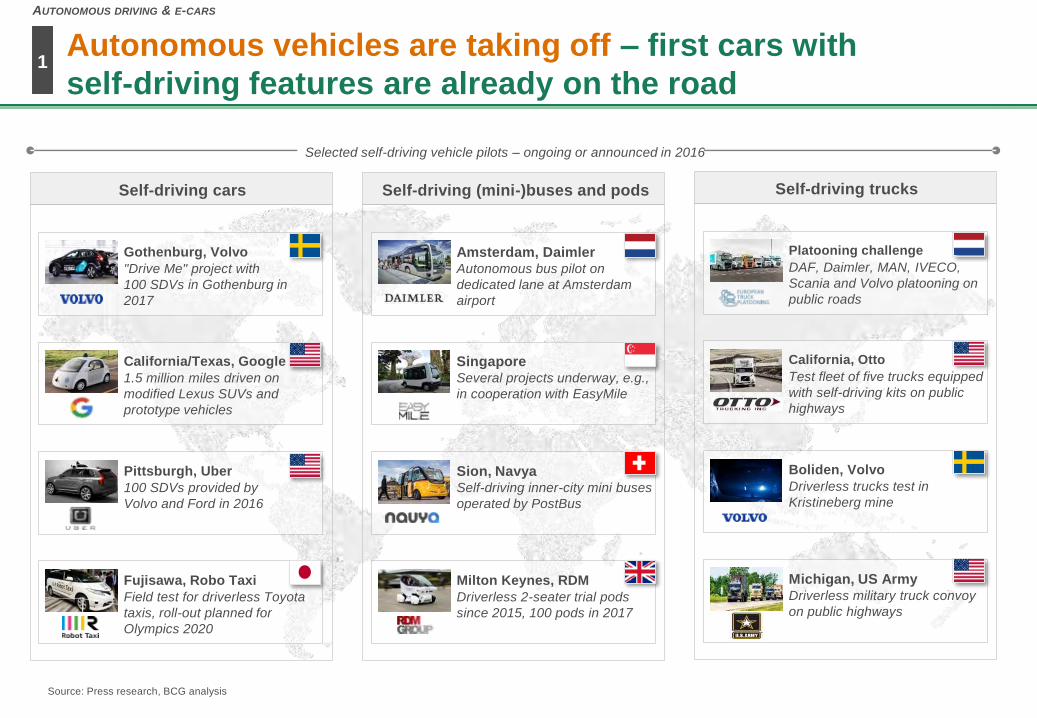
Autonomous vehicles are taking off – first cars with
self-driving features are already on the road
Source: Press research, BCG analysis
Gothenburg, Volvo
"Drive Me" project with
100 SDVs in Gothenburg in
2017
California/Texas, Google
1.5 million miles driven on
modified Lexus SUVs and
prototype vehicles
Pittsburgh, Uber
100 SDVs provided by
Volvo and Ford in 2016
Fujisawa, Robo Taxi
Field test for driverless Toyota
taxis, roll-out planned for
Olympics 2020
Self-driving cars
Amsterdam, DaimlerAutonomous bus pilot on
dedicated lane at Amsterdam
airport
SingaporeSeveral projects underway, e.g.,
in cooperation with EasyMile
Sion, NavyaSelf-driving inner-city mini buses
operated by PostBus
Milton Keynes, RDM
Driverless 2-seater trial pods
since 2015, 100 pods in 2017
Self-driving (mini-)buses and pods
Platooning challenge
DAF, Daimler, MAN, IVECO,
Scania and Volvo platooning on
public roads
California, Otto
Test fleet of five trucks equipped
with self-driving kits on public
highways
Boliden, Volvo
Driverless trucks test in
Kristineberg mine
Michigan, US ArmyDriverless military truck convoy
on public highways
Self-driving trucks
1
AUTONOMOUS DRIVING & E-CARS
Selected self-driving vehicle pilots – ongoing or announced in 2016
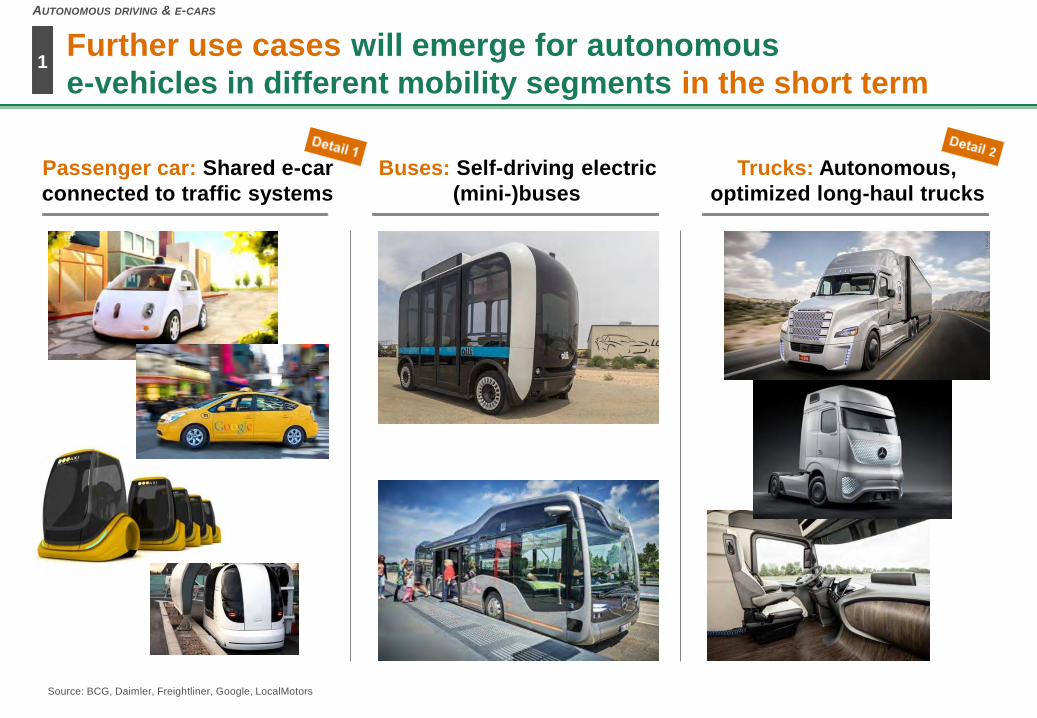
Further use cases will emerge for autonomous
e-vehicles in different mobility segments in the short term
Passenger car: Shared e-car
connected to traffic systems
Trucks: Autonomous,
optimized long-haul trucks
Buses: Self-driving electric
(mini-)buses
Source: BCG, Daimler, Freightliner, Google, LocalMotors
1
AUTONOMOUS DRIVING & E-CARS
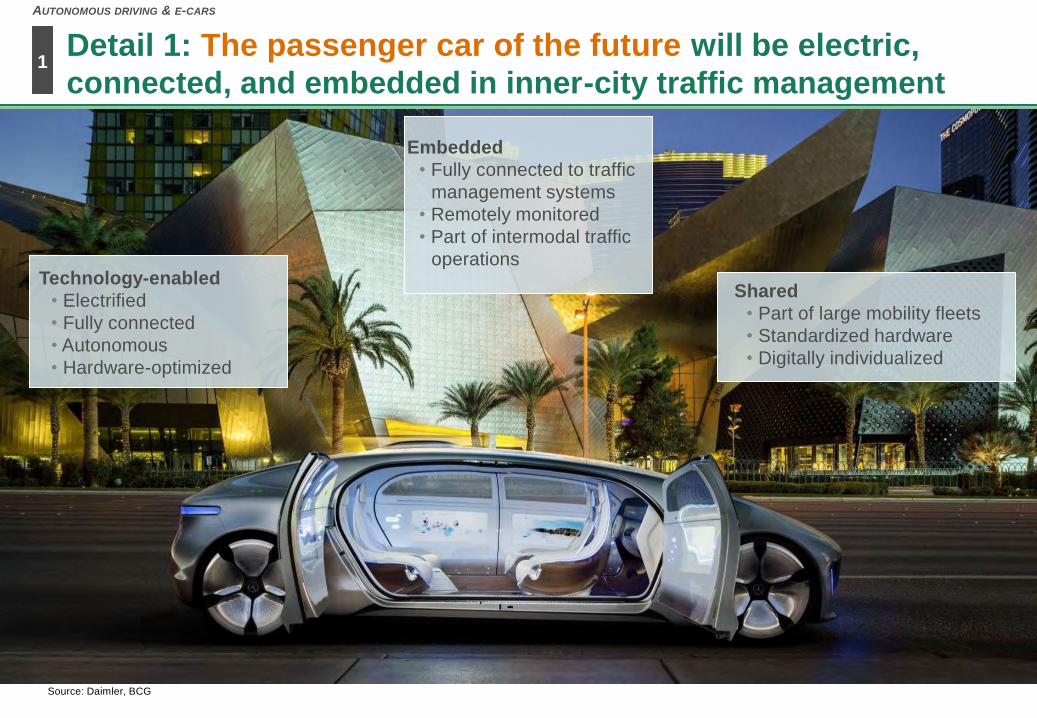
Detail 1: The passenger car of the future will be electric,
connected, and embedded in inner-city traffic management
Technology-enabled
• Electrified
• Fully connected
• Autonomous
• Hardware-optimized
Source: Daimler, BCG
1
AUTONOMOUS DRIVING & E-CARS
Shared
• Part of large mobility fleets
• Standardized hardware
• Digitally individualized
Embedded
• Fully connected to traffic
management systems
• Remotely monitored
• Part of intermodal traffic
operations
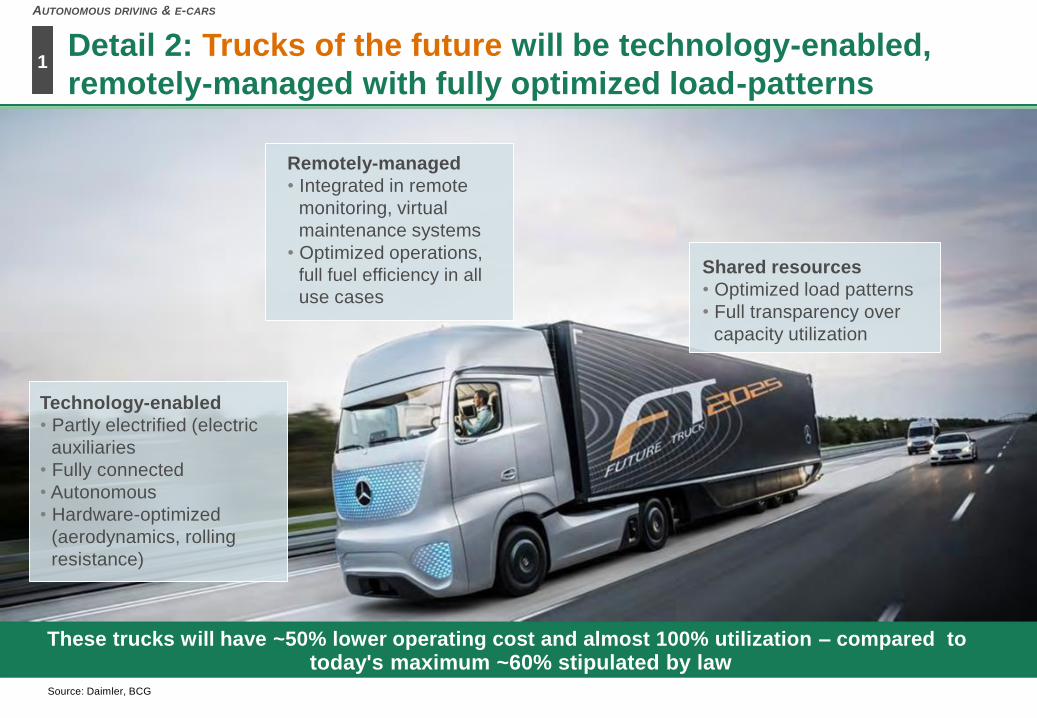
Detail 2: Trucks of the future will be technology-enabled,
remotely-managed with fully optimized load-patterns
Source: Daimler, BCG
1
AUTONOMOUS DRIVING & E-CARS
These trucks will have ~50% lower operating cost and almost 100% utilization – compared totoday's maximum ~60% stipulated by law
Remotely-managed
• Integrated in remote
monitoring, virtual
maintenance systems
• Optimized operations,
full fuel efficiency in all
use cases
Technology-enabled
• Partly electrified (electric
auxiliaries
• Fully connected
• Autonomous
• Hardware-optimized
(aerodynamics, rolling
resistance)
Shared resources
• Optimized load patterns
• Full transparency over
capacity utilization
$710/kWh
$195/kWh$200/kWh
$150/kWh$125/kWh $100/kWh
$360/kWh
$200/kWh
US DOE
Morgan Stanley
Goldman Sachs
Hyundai
BMW
Average (excl. outliers)
Umicore
LG*
Adv. Autom. Batteries
Macquarie
Avicenne
GM*
Tesla
UBS*
Bloomberg
RW Baird
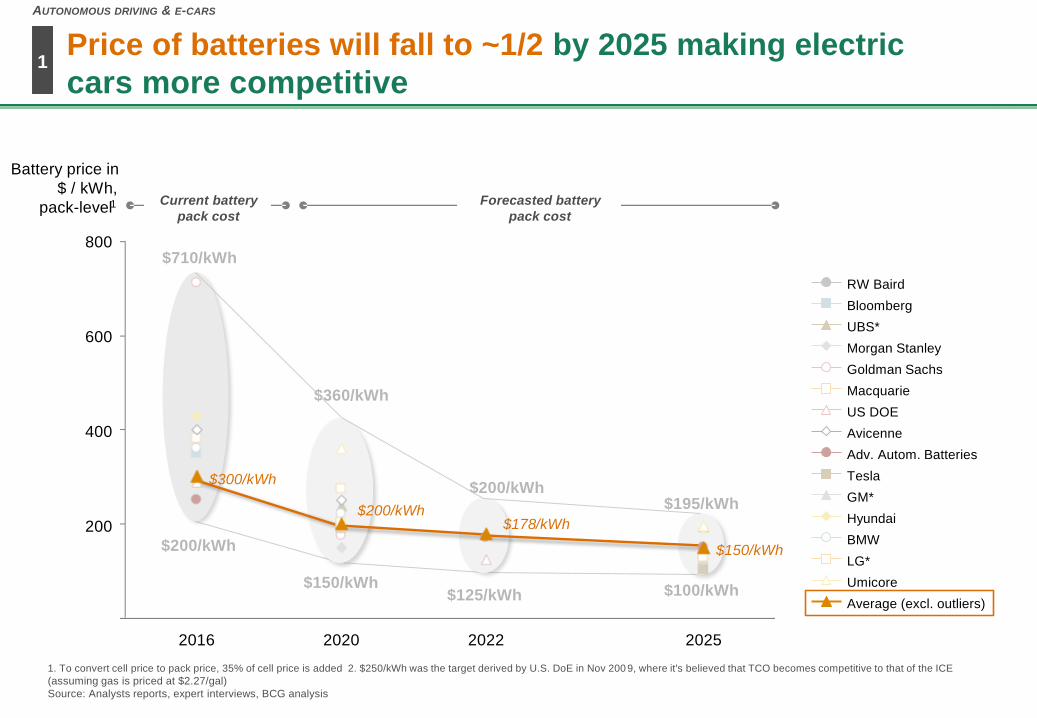
Price of batteries will fall to ~1/2 by 2025 making electric
cars more competitive
1. To convert cell price to pack price, 35% of cell price is added 2. $250/kWh was the target derived by U.S. DoE in Nov 200 9, where it's believed that TCO becomes competitive to that of the ICE
(assuming gas is priced at $2.27/gal)
Source: Analysts reports, expert interviews, BCG analysis
Current battery
pack cost
Forecasted battery
pack cost
1
AUTONOMOUS DRIVING & E-CARS
600
800
400
200
2025
$150/kWh
$300/kWh
2016
$200/kWh
2020
$178/kWh
2022
Battery price in
$ / kWh,
pack-level 1
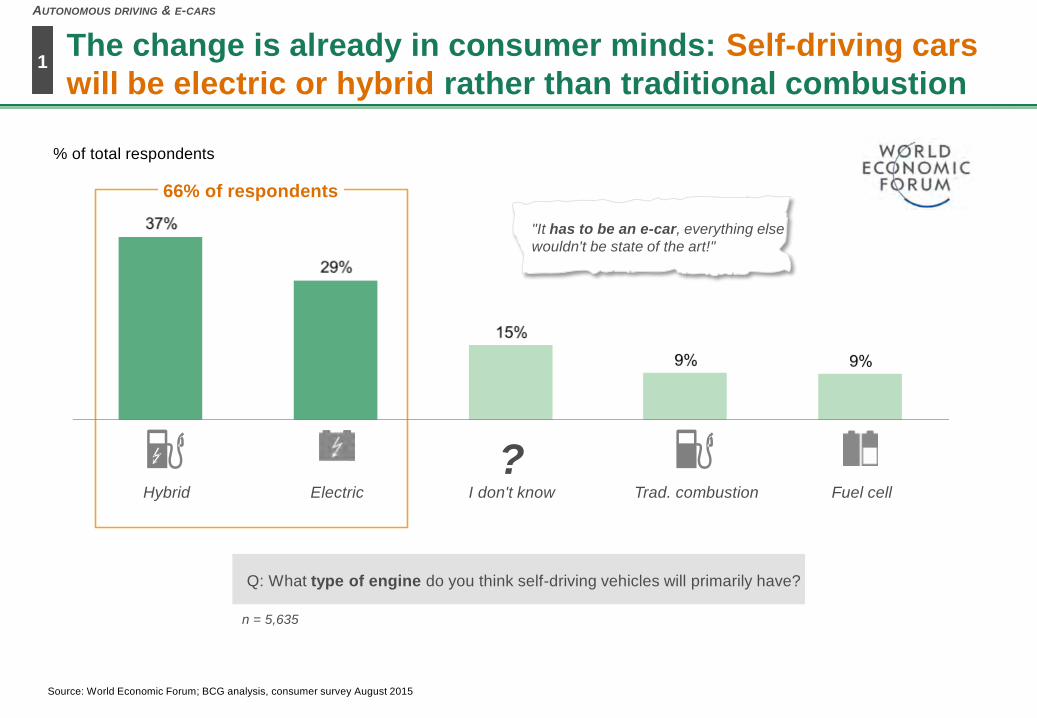
The change is already in consumer minds: Self-driving cars
will be electric or hybrid rather than traditional combustion
Q: What type of engine do you think self-driving vehicles will primarily have?
n = 5,635
% of total respondents
Hybrid
?Electric I don't know Fuel cellTrad. combustion
66% of respondents
"It has to be an e-car, everything else
wouldn't be state of the art!"
Source: World Economic Forum; BCG analysis, consumer survey August 2015
1
AUTONOMOUS DRIVING & E-CARS
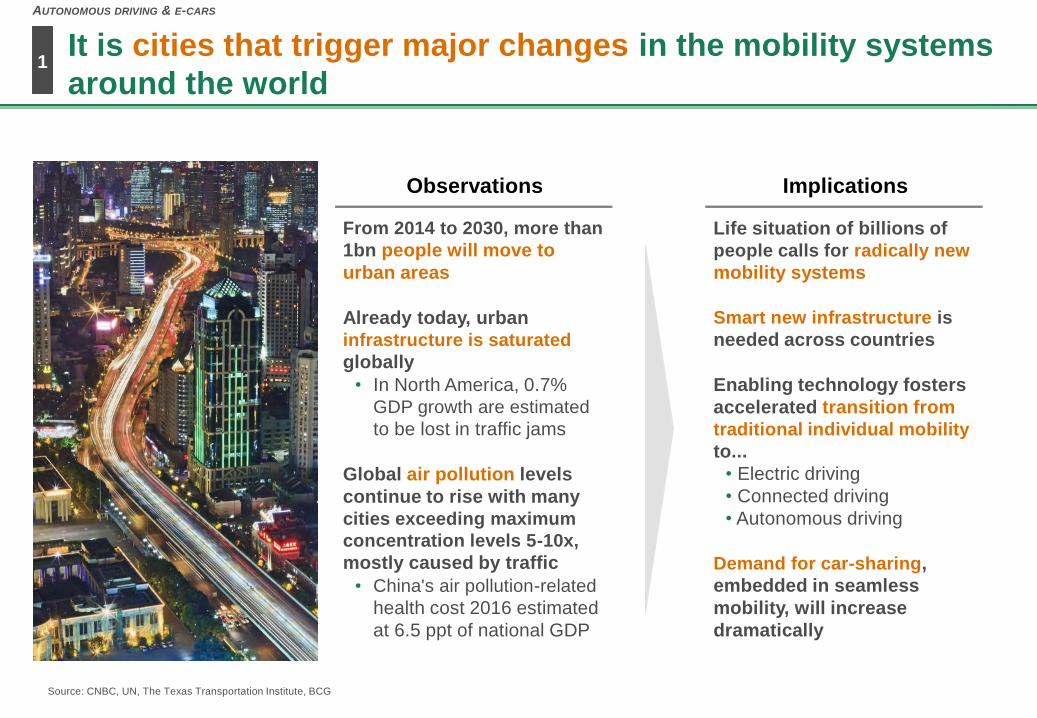
It is cities that trigger major changes in the mobility systems
around the world
Observations
From 2014 to 2030, more than
1bn people will move to
urban areas
Already today, urban
infrastructure is saturated
globally
• In North America, 0.7%
GDP growth are estimated
to be lost in traffic jams
Global air pollution levels
continue to rise with many
cities exceeding maximum
concentration levels 5-10x,
mostly caused by traffic
• China's air pollution-related
health cost 2016 estimated
at 6.5 ppt of national GDP
Implications
Life situation of billions of
people calls for radically new
mobility systems
Smart new infrastructure is
needed across countries
Enabling technology fosters
accelerated transition from
traditional individual mobility
to...
• Electric driving
• Connected driving
• Autonomous driving
Demand for car-sharing,
embedded in seamless
mobility, will increase
dramatically
Source: CNBC, UN, The Texas Transportation Institute, BCG
1
AUTONOMOUS DRIVING & E-CARS
1
AUTONOMOUS DRIVING & E-CARS
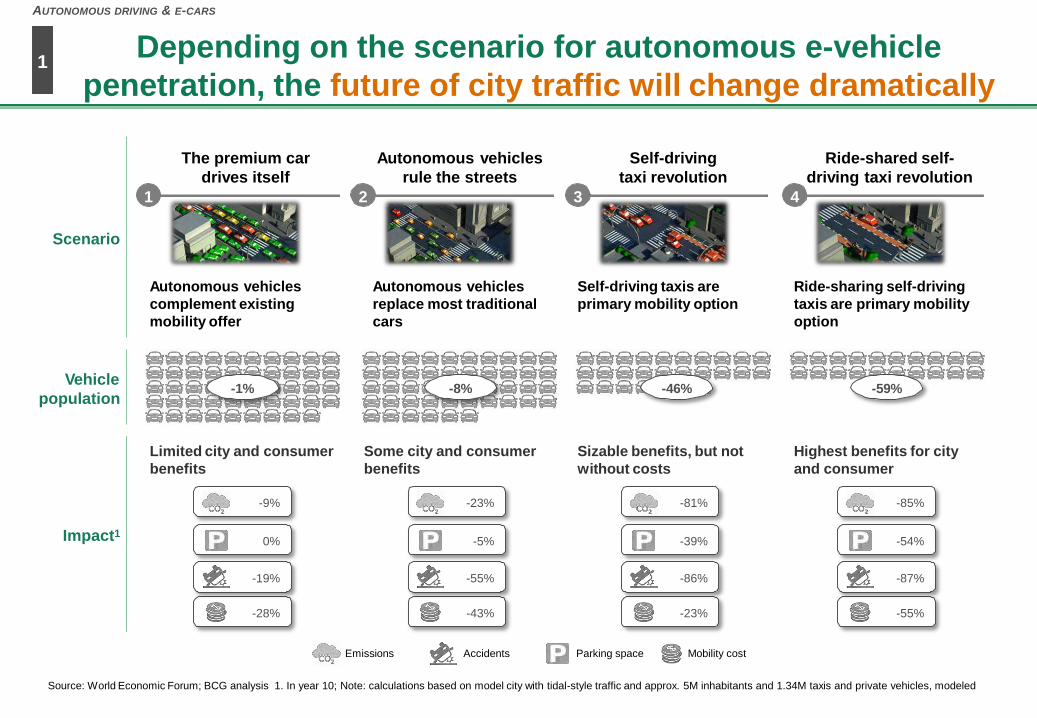
Emissions Accidents Parking space Mobility cost
Source: World Economic Forum; BCG analysis 1. In year 10; Note: calculations based on model city with tidal-style traffic and approx. 5M inhabitants and 1.34M taxis and private vehicles, modeled
Autonomous vehicles
complement existing
mobility offer
Autonomous vehicles
replace most traditional
cars
Self-driving taxis are
primary mobility option
Ride-sharing self-driving
taxis are primary mobility
option
The premium car
drives itself
1
Autonomous vehicles
rule the streets
2
Self-driving
taxi revolution
Ride-shared self-
driving taxi revolution
43
Vehicle
population
Impact1
Limited city and consumer
benefits
Some city and consumer
benefits
Sizable benefits, but not
without costs
Highest benefits for city
and consumer
-28%
-19%
0%
-9%
-1% -8% -59%-46%
-43%
-55%
-5%
-23%
-23%
-86%
-39%
-81%
-55%
-87%
-54%
-85%
Scenario
Depending on the scenario for autonomous e-vehicle
penetration, the future of city traffic will change dramatically
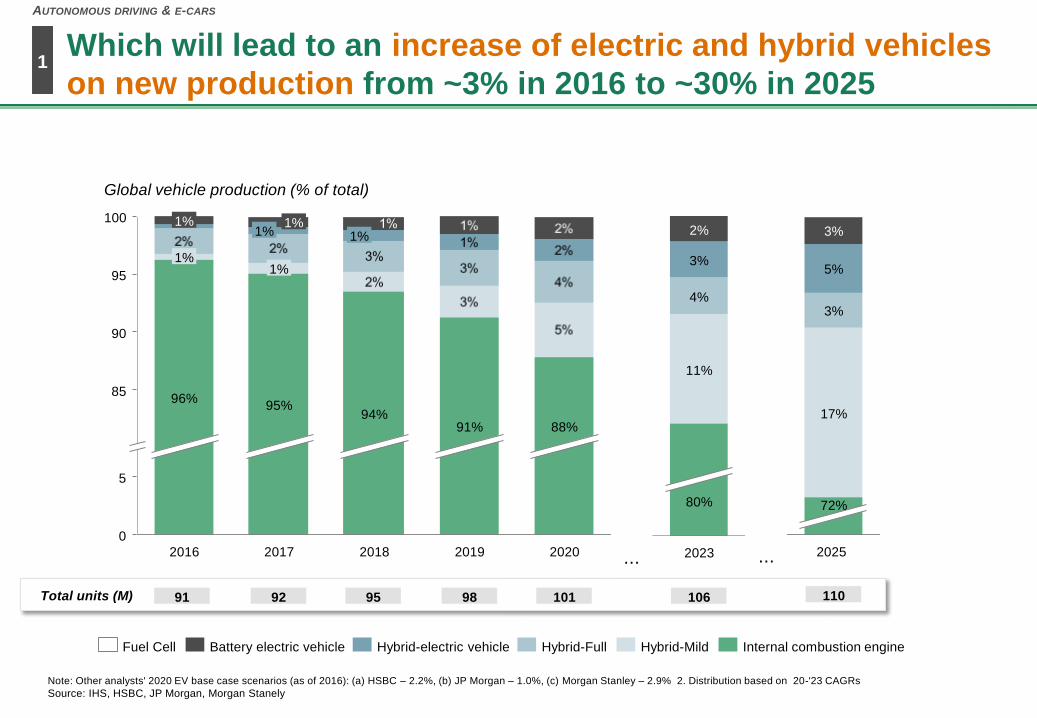
Which will lead to an increase of electric and hybrid vehicles
on new production from ~3% in 2016 to ~30% in 2025
100
95
90
0
5
85
2018
Global vehicle production (% of total)
91%
2019
88%94%
2020
1%
2016
1%
2017
96%
1%
95%
1%
1% 1%
Note: Other analysts' 2020 EV base case scenarios (as of 2016): (a) HSBC – 2.2%, (b) JP Morgan – 1.0%, (c) Morgan Stanley – 2.9% 2. Distribution based on 20-'23 CAGRs
Source: IHS, HSBC, JP Morgan, Morgan Stanely
10198959291Total units (M)
2023
80%
11%
4%
3%
2%
...
106
Hybrid-electric vehicle Hybrid-FullFuel Cell Battery electric vehicle Hybrid-Mild Internal combustion engine
72%
5%
3%
17%
2025
3%
110
...
1
AUTONOMOUS DRIVING & E-CARS
AUTONOMOUS
DRIVING & E-CARSNEW MOBILITY
SERVICES
E-MOBILITY
INFRASTRUCTURE
1 2
3
There are 3 interrelated e-mobility game-changers: autonomous
driving & e-cars, new mobility services and e-infrastructure
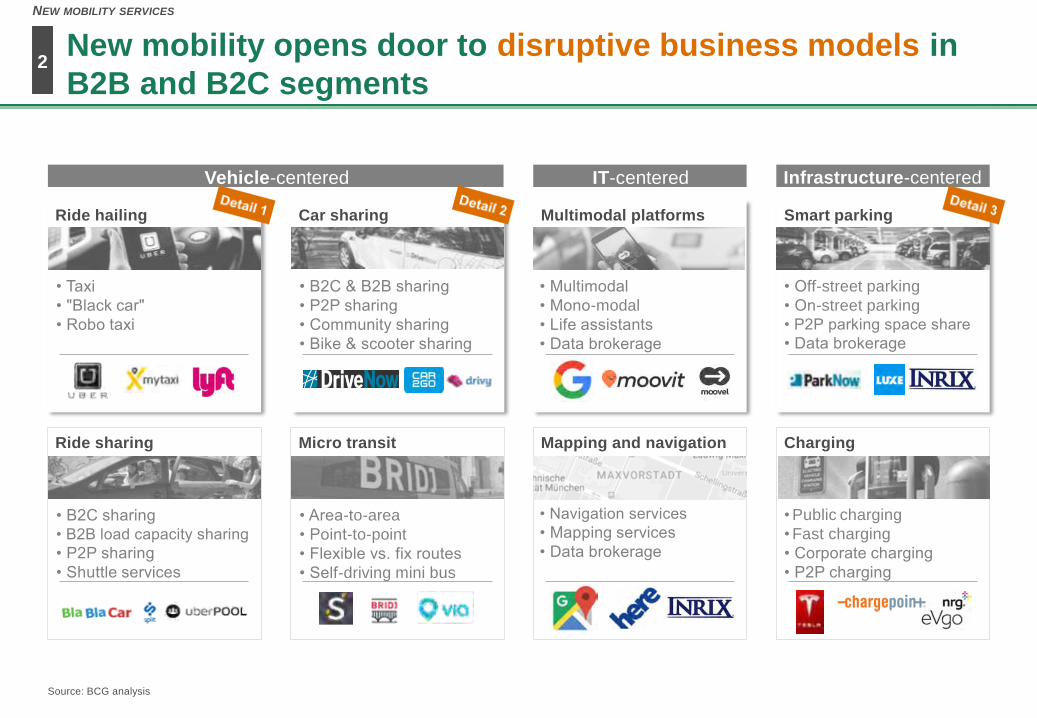
New mobility opens door to disruptive business models in
B2B and B2C segments
Car sharing
Ride sharing
Ride hailing
Micro transit
Multimodal platforms Smart parking
Charging
Vehicle-centered IT-centered Infrastructure-centered
• B2C & B2B sharing
• P2P sharing
• Community sharing
• Bike & scooter sharing
• Taxi
• "Black car"
• Robo taxi
• Multimodal
• Mono-modal
• Life assistants
• Data brokerage
• Off-street parking
• On-street parking
• P2P parking space share
• Data brokerage
•
•
Public charging
Fast charging
• Corporate charging
• P2P charging
• B2C sharing
• B2B load capacity sharing
• P2P sharing
• Shuttle services
• Area-to-area
• Point-to-point
• Flexible vs. fix routes
• Self-driving mini bus
Mapping and navigation
• Navigation services
• Mapping services
• Data brokerage
Source: BCG analysis
2
NEW MOBILITY SERVICES
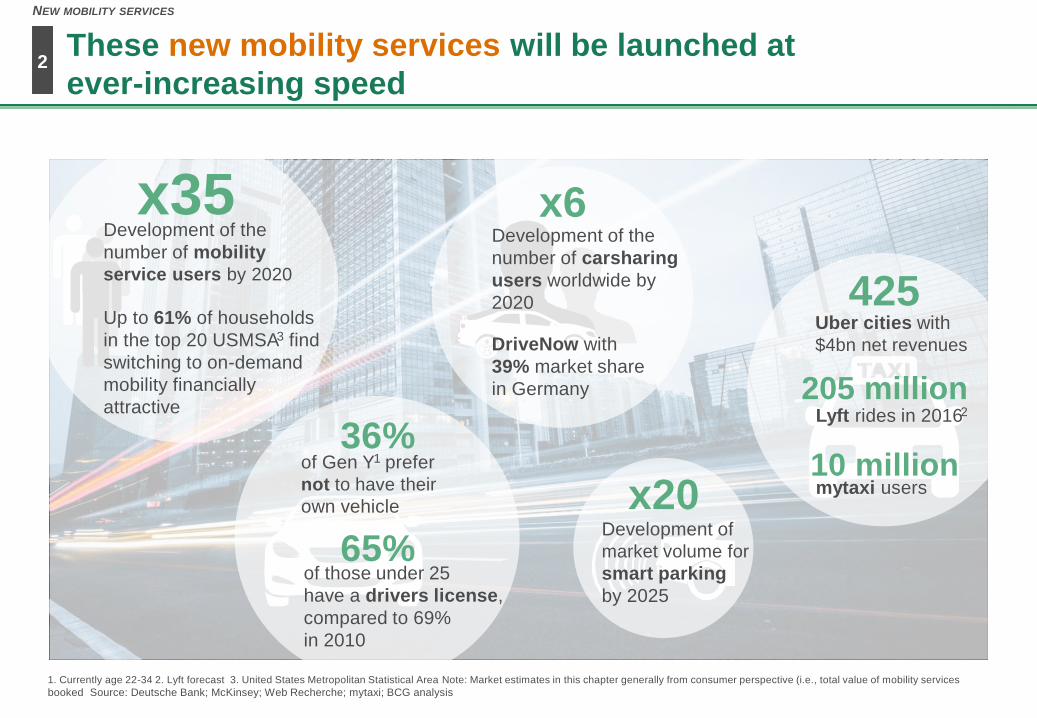
These new mobility services will be launched at
ever-increasing speed
x20
x6x35
Development of
market volume for
smart parking
by 2025
36%of Gen Y prefer
not to have their
own vehicle
1
65%of those under 25
have a drivers license,
compared to 69%
in 2010
1. Currently age 22-34 2. Lyft forecast 3. United States Metropolitan Statistical Area Note: Market estimates in this chapter generally from consumer perspective (i.e., total value of mobility services
booked Source: Deutsche Bank; McKinsey; Web Recherche; mytaxi; BCG analysis
425Uber cities with
$4bn net revenues
10 millionmytaxi users
205 millionLyft rides in 2016 2
Development of the
number of carsharing
users worldwide by
2020
DriveNow with
39% market share
in Germany
Development of the
number of mobility
service users by 2020
Up to 61% of households
in the top 20 USMSA find
switching to on-demand
mobility financially
attractive
3
2
NEW MOBILITY SERVICES
1. UBS, 2015, Could "ride-on-demand" end car ownership? Key model assumptions: Average monthly revenue generated by each driver for the "ride-on-demand" operator is €1,000 (average of San
Francisco, NYC, Paris, London, HK) on the basis of a shift of 8 hours and an idle time between trips of 15 minutes 2. Estima te based on 2015 revenues of Uber, Lyft, Gett and Didi (C4 ratio: 80%,
CAGR 15'-17': 30%) Source: UBS, Project Armstrong, BCG analysis
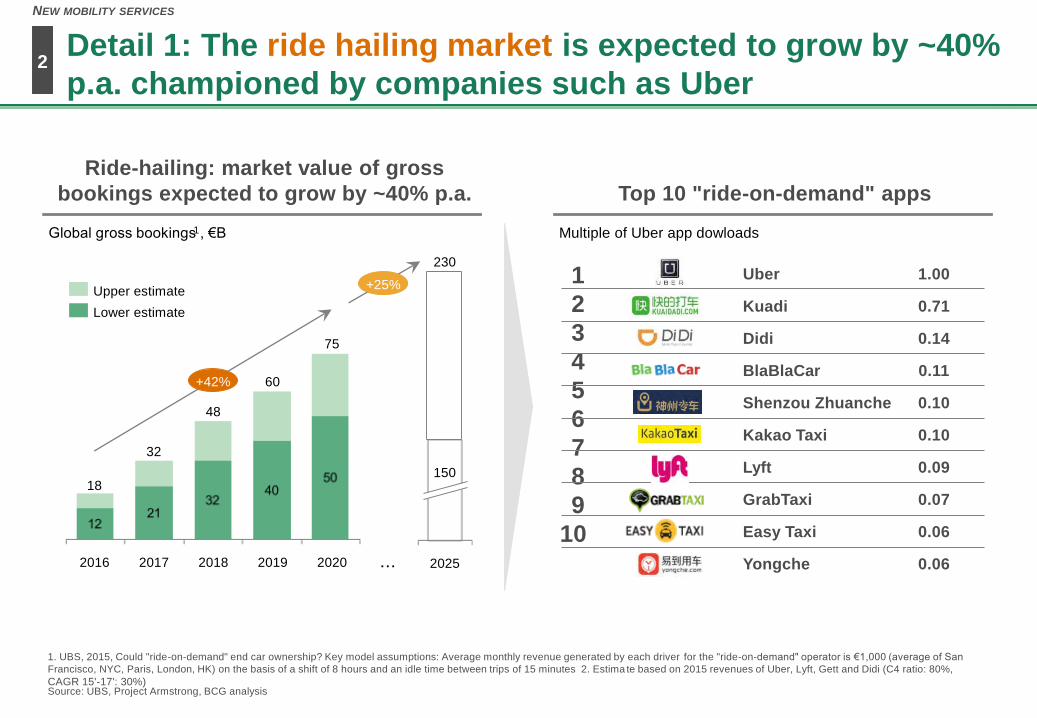
Ride-hailing: market value of gross
bookings expected to grow by ~40% p.a. Top 10 "ride-on-demand" apps
Detail 1: The ride hailing market is expected to grow by ~40%
p.a. championed by companies such as Uber2
NEW MOBILITY SERVICES
Uber
Kuadi
Didi
BlaBlaCar
Shenzou Zhuanche
Kakao Taxi
Lyft
GrabTaxi
Easy Taxi
Yongche
1.00
0.71
0.14
0.11
0.10
0.10
0.09
0.07
0.06
0.06
1
2
3
4
5
6
7
8
9
102016
+42%
75
2019
60
32
2017
18
2020
48
2018
230
150
2025
Upper estimate
Lower estimate
...
+25%
Global gross bookings , €B1 Multiple of Uber app dowloads
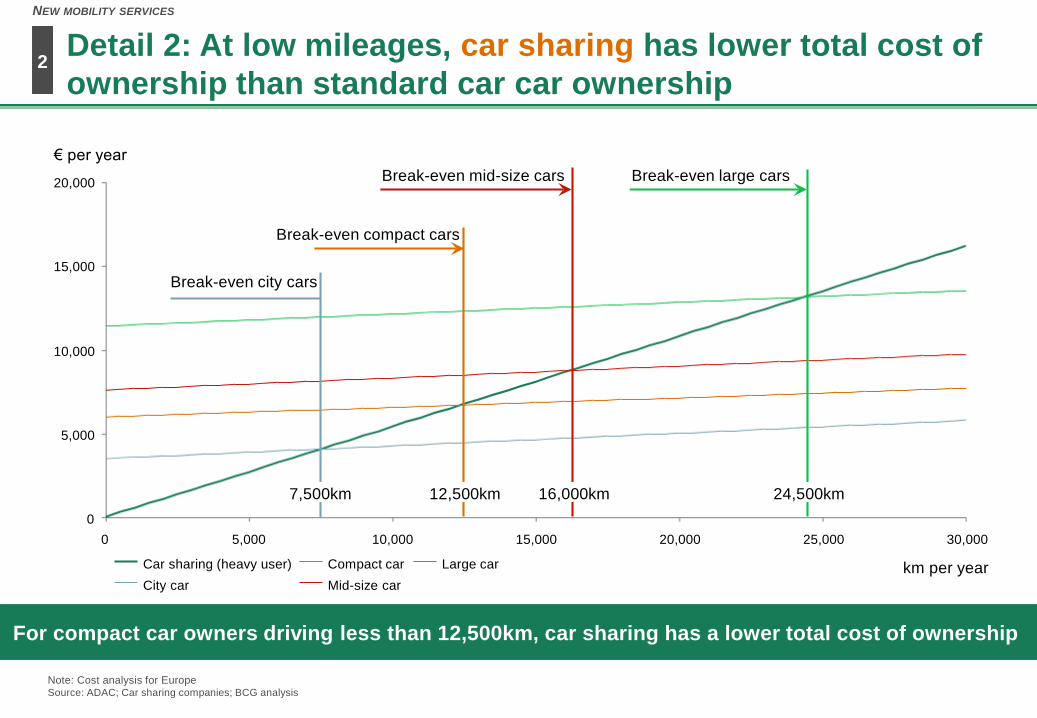
Detail 2: At low mileages, car sharing has lower total cost of
ownership than standard car car ownership
15,000
10,000
5,000
0
0
20,000
10,000 20,000 30,00025,0005,000 15,000
€ per year
km per yearLarge carCar sharing (heavy user) Compact car
City car Mid-size car
Break-even city cars
Break-even compact cars
Break-even mid-size cars Break-even large cars
Note: Cost analysis for EuropeSource: ADAC; Car sharing companies; BCG analysis
For compact car owners driving less than 12,500km, car sharing has a lower total cost of ownership
7,500km 12,500km 16,000km 24,500km
2
NEW MOBILITY SERVICES
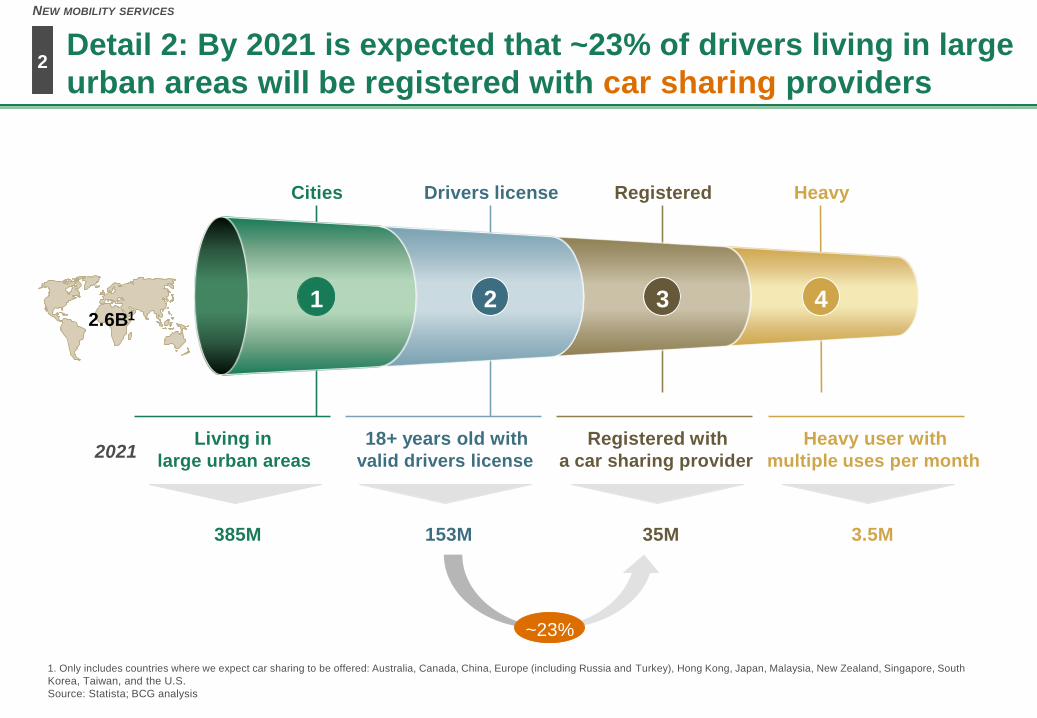
Detail 2: By 2021 is expected that ~23% of drivers living in large
urban areas will be registered with car sharing providers
Living in
large urban areas
Cities Drivers license Registered Heavy
1 2 3 4
18+ years old with
valid drivers license
Registered with
a car sharing provider
Heavy user with
multiple uses per month
1. Only includes countries where we expect car sharing to be offered: Australia, Canada, China, Europe (including Russia and Turkey), Hong Kong, Japan, Malaysia, New Zealand, Singapore, South
Korea, Taiwan, and the U.S.
Source: Statista; BCG analysis
385M 153M 35M 3.5M
2.6B 1
2021
2
NEW MOBILITY SERVICES
~23%
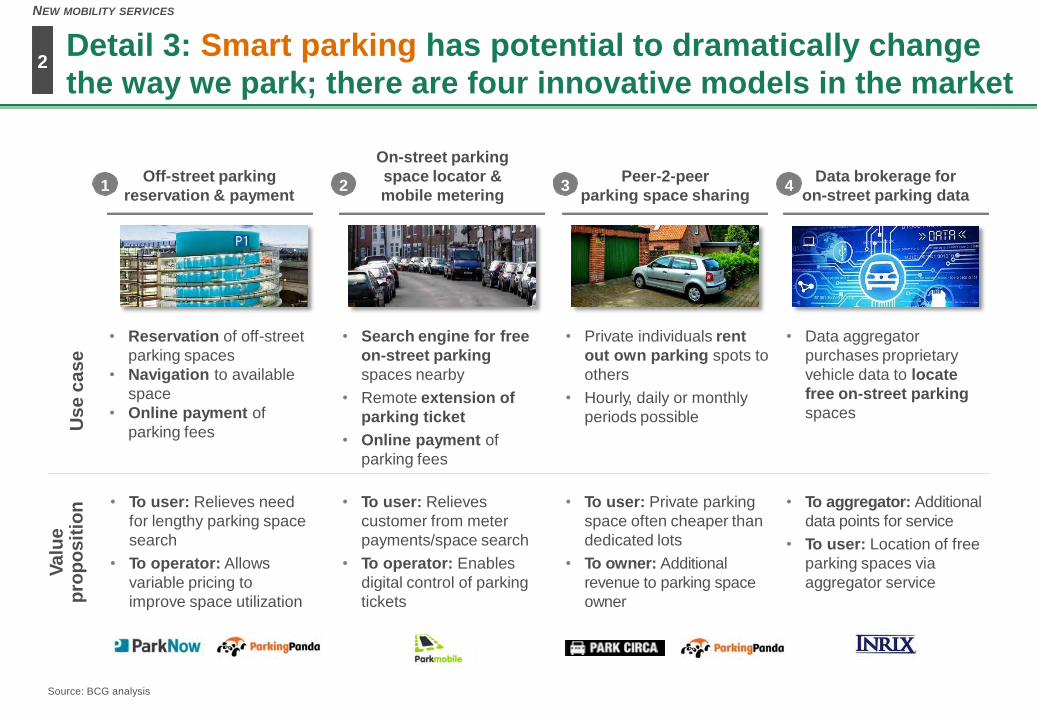
Detail 3: Smart parking has potential to dramatically change
the way we park; there are four innovative models in the market
Source: BCG analysis
2
NEW MOBILITY SERVICES
Off-street parking
reservation & payment
On-street parking
space locator &
mobile metering
Peer-2-peer
parking space sharing
Use
case
Valu
ep
rop
os
itio
n
• Reservation of off-street
parking spaces
• Navigation to available
space
• Online payment of
parking fees
• Search engine for free
on-street parking
spaces nearby
• Remote extension of
parking ticket
• Online payment of
parking fees
• Private individuals rent
out own parking spots to
others
• Hourly, daily or monthly
periods possible
• To user: Relieves need
for lengthy parking space
search
• To operator: Allows
variable pricing to
improve space utilization
• To user: Relieves
customer from meter
payments/space search
• To operator: Enables
digital control of parking
tickets
• To user: Private parking
space often cheaper than
dedicated lots
• To owner: Additional
revenue to parking space
owner
Data brokerage for
on-street parking data
• Data aggregator
purchases proprietary
vehicle data to locate
free on-street parking
spaces
• To aggregator: Additional
data points for service
• To user: Location of free
parking spaces via
aggregator service
1 2 3 4
AUTONOMOUS
DRIVING & E-CARSNEW MOBILITY
SERVICES
E-MOBILITY
INFRASTRUCTURE
1 2
3
There are 3 interrelated e-mobility game-changers: autonomous
driving & e-cars, new mobility services and e-infrastructure
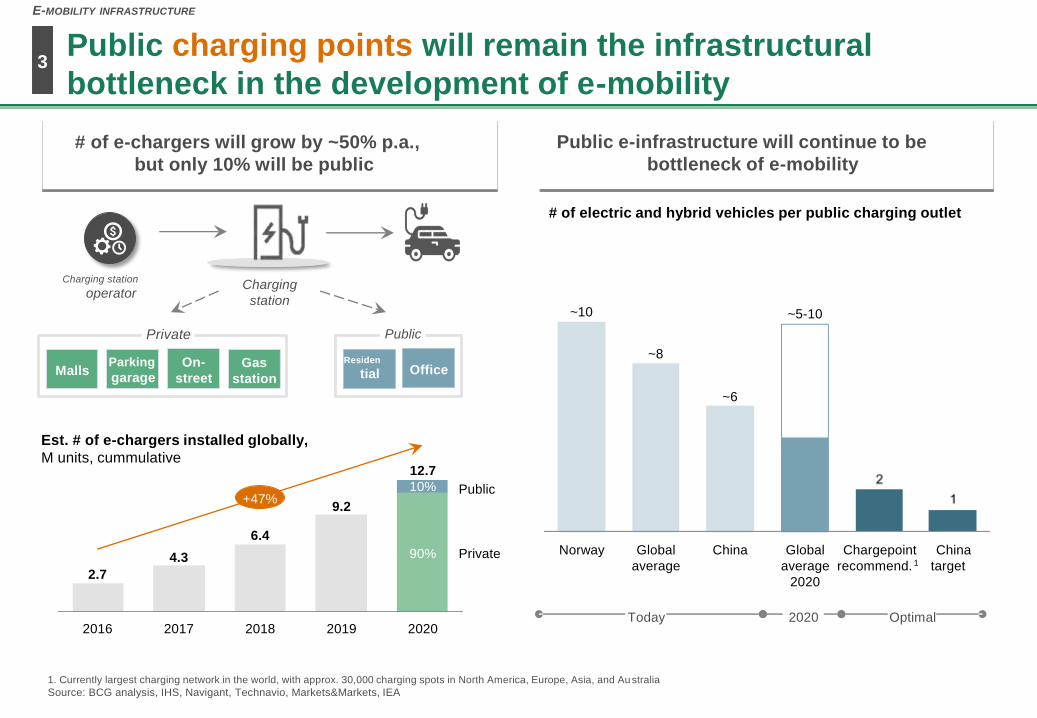
Public charging points will remain the infrastructural
bottleneck in the development of e-mobility
+47%
Private
Public
2020
12.7
10%
90%
2019
9.2
2018
6.4
2017
4.3
2016
2.7
Public e-infrastructure will continue to be
bottleneck of e-mobility
1. Currently largest charging network in the world, with approx. 30,000 charging spots in North America, Europe, Asia, and Au stralia
Source: BCG analysis, IHS, Navigant, Technavio, Markets&Markets, IEA
# of e-chargers will grow by ~50% p.a.,
but only 10% will be public
3
E-MOBILITY INFRASTRUCTURE
Est. # of e-chargers installed globally,
M units, cummulative
MallsParking
garageOn-
streetGas
station
Private
Charging station
operatorCharging
station
Residen
tial Office
Public
~6
Global
average
~8
Norway
~10
China
average recommend. target
2020
Chargepoint1
Global
~5-10
China
# of electric and hybrid vehicles per public charging outlet
Today 2020 Optimal
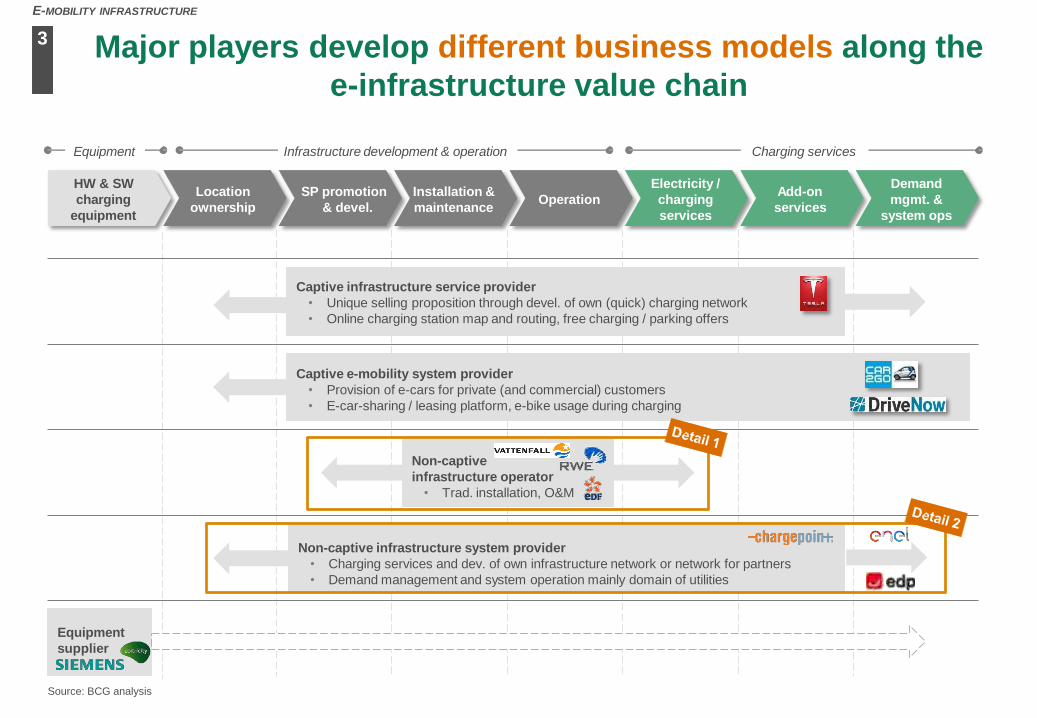
Major players develop different business models along the
e-infrastructure value chain
HW & SW
charging
equipment
Location
ownership
SP promotion
& devel.
Installation &
maintenanceOperation
Electricity /
charging
services
Add-on
services
Demand
mgmt. &
system ops
Charging servicesInfrastructure development & operationEquipment
Captive infrastructure service provider
• Unique selling proposition through devel. of own (quick) charging network
• Online charging station map and routing, free charging / parking offers
Captive e-mobility system provider
• Provision of e-cars for private (and commercial) customers
• E-car-sharing / leasing platform, e-bike usage during charging
Non-captive
infrastructure operator
• Trad. installation, O&M
Non-captive infrastructure system provider
• Charging services and dev. of own infrastructure network or network for partners
• Demand management and system operation mainly domain of utilities
Equipment
supplier
3
E-MOBILITY INFRASTRUCTURE
Source: BCG analysis
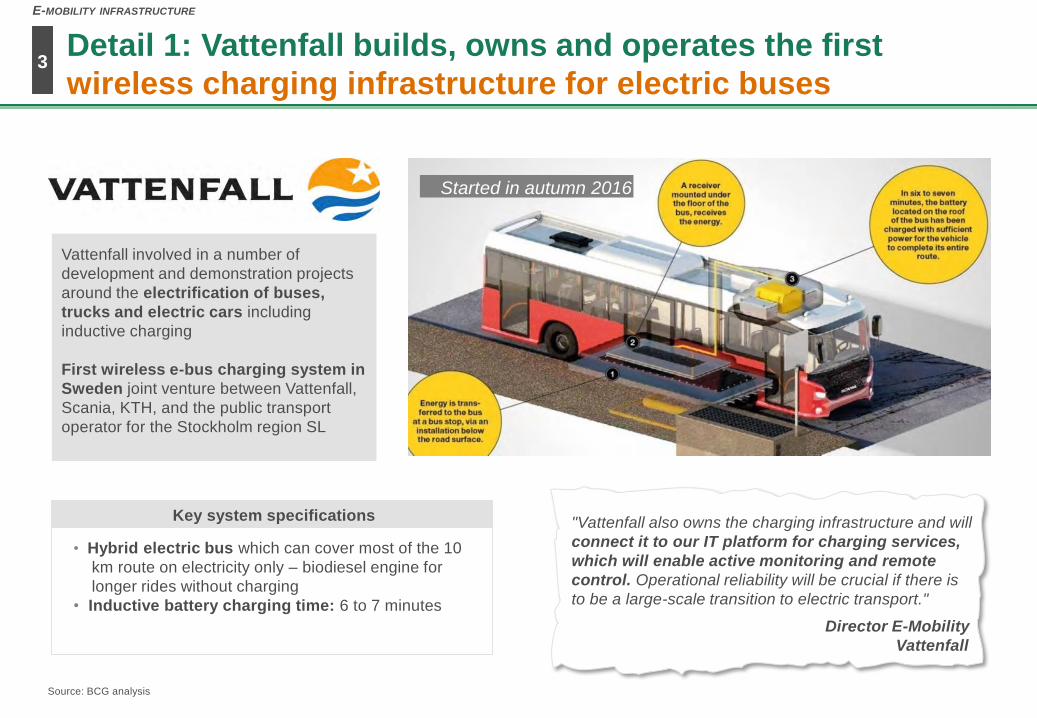
Detail 1: Vattenfall builds, owns and operates the first
wireless charging infrastructure for electric buses
"Vattenfall also owns the charging infrastructure and will
connect it to our IT platform for charging services,
which will enable active monitoring and remote
control. Operational reliability will be crucial if there is
to be a large-scale transition to electric transport."
Director E-Mobility
Vattenfall
Vattenfall involved in a number of
development and demonstration projects
around the electrification of buses,
trucks and electric cars including
inductive charging
First wireless e-bus charging system in
Sweden joint venture between Vattenfall,
Scania, KTH, and the public transport
operator for the Stockholm region SL
• Hybrid electric bus which can cover most of the 10
km route on electricity only – biodiesel engine for
longer rides without charging
• Inductive battery charging time: 6 to 7 minutes
Key system specifications
Started in autumn 2016
Source: BCG analysis
3
E-MOBILITY INFRASTRUCTURE
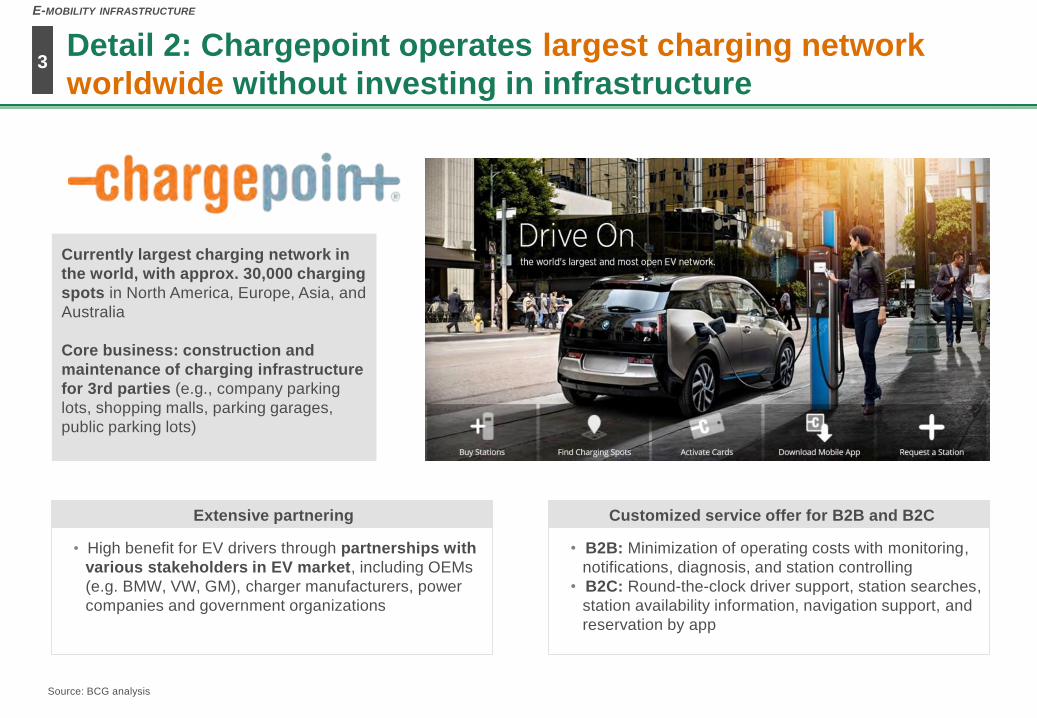
Detail 2: Chargepoint operates largest charging network
worldwide without investing in infrastructure
• High benefit for EV drivers through partnerships with
various stakeholders in EV market, including OEMs
(e.g. BMW, VW, GM), charger manufacturers, power
companies and government organizations
• B2B: Minimization of operating costs with monitoring,
notifications, diagnosis, and station controlling
• B2C: Round-the-clock driver support, station searches,
station availability information, navigation support, and
reservation by app
Currently largest charging network in
the world, with approx. 30,000 charging
spots in North America, Europe, Asia, and
Australia
Core business: construction and
maintenance of charging infrastructure
for 3rd parties (e.g., company parking
lots, shopping malls, parking garages,
public parking lots)
Extensive partnering Customized service offer for B2B and B2C
Source: BCG analysis
3
E-MOBILITY INFRASTRUCTURE
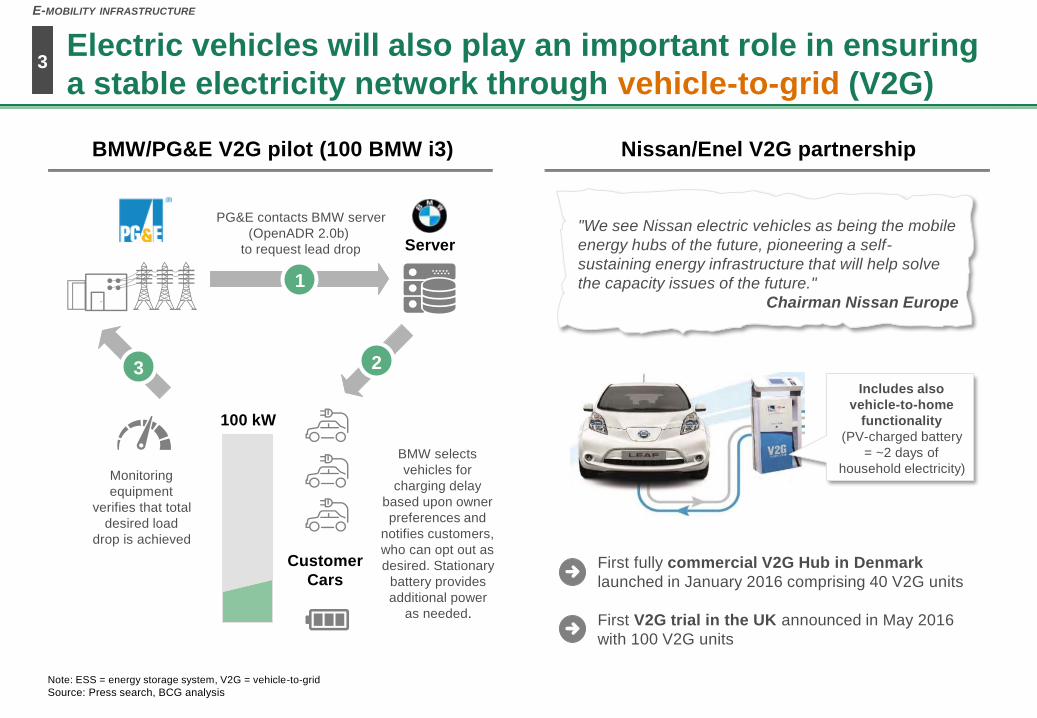
Electric vehicles will also play an important role in ensuring
a stable electricity network through vehicle-to-grid (V2G)
Note: ESS = energy storage system, V2G = vehicle-to-grid
Source: Press search, BCG analysis
BMW/PG&E V2G pilot (100 BMW i3)
1
23
PG&E contacts BMW server
(OpenADR 2.0b)
to request lead drop Server
Monitoring
equipment
verifies that total
desired load
drop is achieved
BMW selects
vehicles for
charging delay
based upon owner
preferences and
notifies customers,
who can opt out as
desired. Stationary
battery provides
additional power
as needed.
Customer
Cars
100 kW
Nissan/Enel V2G partnership
First fully commercial V2G Hub in Denmark
launched in January 2016 comprising 40 V2G units
First V2G trial in the UK announced in May 2016
with 100 V2G units
"We see Nissan electric vehicles as being the mobile
energy hubs of the future, pioneering a self-
sustaining energy infrastructure that will help solve
the capacity issues of the future."
Chairman Nissan Europe
Includes also
vehicle-to-home
functionality
(PV-charged battery
= ~2 days of
household electricity)
3
E-MOBILITY INFRASTRUCTURE
3
E-MOBILITY INFRASTRUCTURE
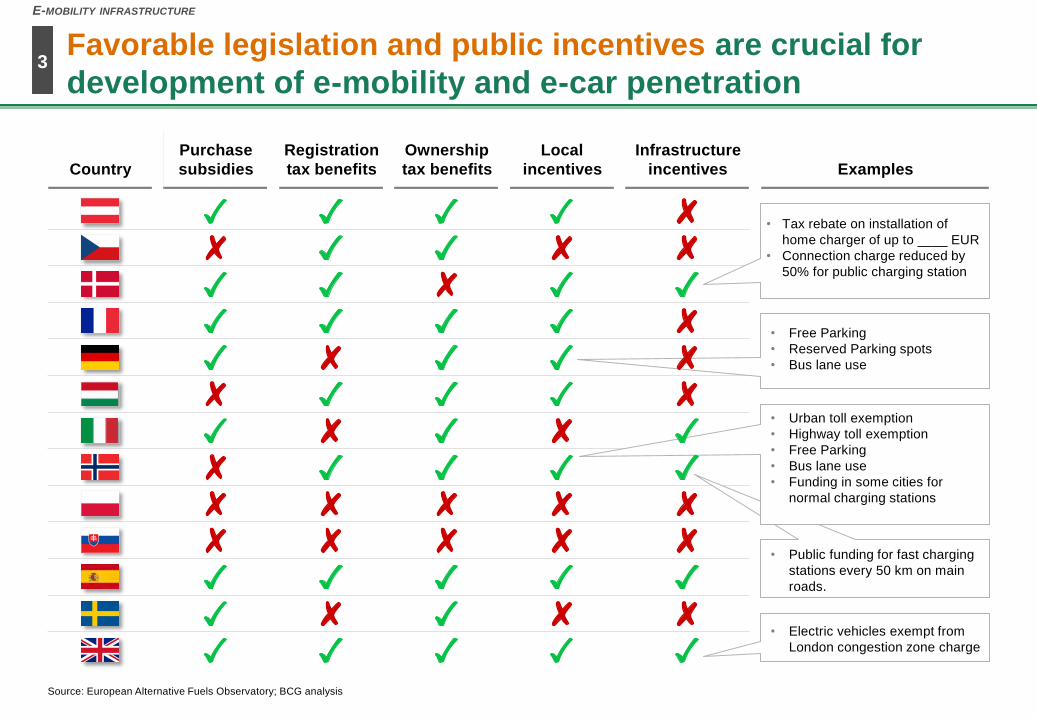
Favorable legislation and public incentives are crucial for
development of e-mobility and e-car penetration
Source: European Alternative Fuels Observatory; BCG analysis
Country
Purchase
subsidies
Registration
tax benefits
Local
incentives
Ownership
tax benefits
Infrastructure
incentives Examples
•
•
•
Free Parking
Reserved Parking spots
Bus lane use
• Public funding for fast charging
stations every 50 km on main
roads.
• Electric vehicles exempt from
London congestion zone charge
•
•
•
•
•
Urban toll exemption
Highway toll exemption
Free Parking
Bus lane use
Funding in some cities for
normal charging stations
Tax rebate on installation of
home charger of up to ____ EUR
Connection charge reduced by
50% for public charging station
•
•
Recommended