i
Dyes Removal from Synthetic and Real Textile Wastewater by Magnetic
nanoadsorbents
by
Nedal Marei
Samah Abu-Ghayadah
Suha Shihab
Supervisor
Dr. Nashaat N. Nassar
A Graduation Project Submitted to the Department of Chemical Engineering in Partial
Fulfillment of the Requirements for the Degree of Bachelor in Chemical Engineering
Department of Chemical Engineering
An-Najah National University
Nablus, Palestine
December 6, 2013
Copyright Marei et al
i
ABSTRACT
The presence of dyestuffs in wastewater poses an environmental concern since these
organic contaminants are toxic to aquatic and non-aquatic life. In addition, these
contaminants are difficult to remove or biodegrade, which poses a challenge to the
conventional wastewater treatment techniques.
Iron-oxide nanoparticles are attractive for wastewater treatment for two important
reasons. First, nanoadsorbents can remove contaminants from wastewater rapidly.
Second, this type of iron oxide could be separated easily using magnet after finishing
treatment process. In this project we aim at investigating the effectiveness of the
magnetic iron oxide NPs in the removal of large organic contaminants (dyes) from real
textile wastewater. This study provides valuable insight on the effect of NPs toward the
treatment and recyclability of textile wastewater and two different types of model dyes
crystal violet (CV), bromocresol green (BCG) and methylene red (MR) which is crucial
for the textile industry. In this study, a batch-contact-time method is used for the
treatment of a real textile wastewater sample obtained from a local factory in the city
of Nablus. The effects of different experimental parameters such as contact time, initial
concentration, solution pH, and coexisting anions on dye removal are investigated.
Results showed that dye adsorption was fast, and equilibrium for CV, BCG, MR and
real wastewater was achieved respectively within 10, 60,50 and 90 min. The adsorption
equilibrium data fit very well to Langmuir and Freundlich adsorption isotherm models.
The thermodynamics studies indicated that the adsorption was spontaneous,
endothermic and physical in nature. The desorption and regeneration studies have
proven that nanoparticles can be employed repeatedly without impacting its adsorption
capacity. Therefore, magnetic nanoparticles are recommended as fast, effective and
inexpensive adsorbents for rapid removal and recovery of contaminants from
wastewater effluents, like textile industry.
ii
ACKNOWLEDGMENT
First we thank Allah for granting us knowledge and patience to conduct this project
successfully. The help and support of the following individuals and departments are
highly appreciated, without their support this work would not have been possible.
We would like to express our fervent gratitude to Dr. Nashaat N. Nassar for his support,
guidance, invaluable suggestions, and for being a constant source of encouragement as
the research supervisor for this project.
We really appreciate the help of all the staff members of the Department of Chemical
Engineering, namely: Dr. Abdelrahim Abusafa for his early assistance on the
department UV-Vis spectrophotometer, Mr. Yusuf Ratrout and Ms. Hanaa Rabaya'ah
for their help in the laboratory space and Ms. Hamees Tbaileh for helping in the TOC
and COD tests.
Dr. Ahmad Abu Obaid from the Department of Chemistry for providing the model dyes,
and Dr. Nafez Dwikat from the Department of Chemistry for his assistance in the UV-
vis and AA analysis.
Last, but certainly not least, our great thanks, gratitude and love to our parents and to
all friends for their support, and their sincere encouragement.
Note: The report has been revised more than 11 times with the supervisor and this is
v12.
iii
TABLE OF CONTENT
ABSTRACT .................................................................................................................... i
ACKNOWLEDGMENT................................................................................................ ii
TABLE OF CONTENT ............................................................................................... iii
NOMENCLATURE ...................................................................................................... v
LIST OF FIGURES ...................................................................................................... vi
LIST OF TABLES ....................................................................................................... vii
CHAPTER ONE ............................................................................................................ 7
LITERATURE REVIEW .............................................................................................. 1
1.1 World water challenges ........................................................................................ 1
1.2 Water Shortages in Palestine ................................................................................ 2
1.3 Textile dyes and their environmental concern. .................................................... 4
1.3.1 Dyes typical removal techniques ................................................................... 5
1.4 Magnetic nanoadsorbents ..................................................................................... 7
CHAPTER TWO ......................................................................................................... 10
OBJECTIVES .............................................................................................................. 10
2.1 General objectives .............................................................................................. 10
2.2 Specific objectives.............................................................................................. 10
CHAPTER THREE ..................................................................................................... 11
EXPERIMENTAL WORK .......................................................................................... 11
3.1 Materials ........................................................................................................... 11
3.1.1 Adsorbates ................................................................................................... 11
3.1.2 Adsorbent..................................................................................................... 12
3.2 Precursors ........................................................................................................... 12
3.3. Dye characterization and adsorption measurement ........................................... 13
3.3.1 UV-vis spectrophotometry .......................................................................... 13
3.3.2 Atomic absorption spectrometer (AA) ........................................................ 13
3.3.3 Digital reactor block (DRB) for chemical oxygen demand (COD)
Measurements ....................................................................................................... 13
3.3.5 Simple magnet ............................................................................................. 14
3.4 Experimental procedure ..................................................................................... 14
3.4.1 Types of dyes ............................................................................................... 15
iv
3.4.2 Effect of contact time .................................................................................. 16
3.4.3 Effect of solution pH ................................................................................... 16
3.4.4 Effect of Temperature .................................................................................. 16
3.5 Application of Nanoparticles to real wastewater (RWW) .............................. 16
CHAPTER FOUR ........................................................................................................ 18
MODELING ................................................................................................................ 18
4.1 Adsorption kinetics test ...................................................................................... 18
4.2 Adsorption isotherms ......................................................................................... 19
4.3 Thermodynamic studies ..................................................................................... 19
CHAPTER FIVE ......................................................................................................... 22
RESULTS AND DISCUSSION .................................................................................. 22
5.1 Model dyes ............................................................................................................. 22
5.1.1 Effect of contact time (adsorption kinetics) ................................................ 22
5.1.2 Effect of solution pH ................................................................................... 25
5.1.2 Effect of temperatures ................................................................................. 26
5.1.3 Thermodynamic studies ............................................................................... 31
5.2 Application of nanoparticles to real textile wastewater (RWW) ........................... 34
5.2.1 Effect of contact time .................................................................................. 34
5.2.2 pH test .......................................................................................................... 35
5.2.3 Effect of temperature ................................................................................... 36
5.2.4 Thermodynamic study ................................................................................. 37
5.2.5 Effect of contaminants ................................................................................. 39
CHAPTER SIX ............................................................................................................ 40
6.1 Conclusions ........................................................................................................ 40
6.1.1 Dyes removal ............................................................................................... 40
6.1.2 Real wastewater RWW ................................................................................ 40
6.2 Recommendations for Future Work ................................................................... 42
References .................................................................................................................... 43
v
NOMENCLATURE
BCG: bromcresol green dye
C: concentration of dyes and containments in the solution at any time (mg/L)
Cads: amount of dyes and containments adsorbed onto the nanoparticles (mg/L)
Ce: equilibrium concentration of dyes and containments in the solution(mg/L)
Co: initial concentration of dyes and containments in the solution(mg/L)
CV: crystal violet dye
K:adsorption equilibrium constant (dimensionless)
KF: Freundlich isotherm constant (mmol/g)(L/mmol)1/n
1/n: Freundlich heterogeneity factor (unitless)
KL: Langmuir isotherm constant (L/mmol)
M: mass of nanoparticles (g)
MR: methylene red dye
MMC: million meters cubic
Qe: amount of dyes and containments adsorbed at equilibrium time(mg/g)
Qm: maximum adsorption capacity of dyes and containments(mg/g)
Qt: amount of dyes and containments adsorbed at any time (mg/g)
R: ideal gas constant (R = 8.314 J/mol.K)
RWW: real textile wastewatrer obtained from AL-Aqad Company, Nablus.
G: standard Gibbs free energy change (kJ/mol)
H: standard enthalpy change (kJ/mol)
S: standard entropy change ( J/mol.K)
vi
LIST OF FIGURES
Figure 1.1: Percentages of water consumption in Palestine for the year of 2012. Data obtained from
authority of Palestinian water (Authority of Palestinian water, 2012) ……...…………………………….3
Figure 3.1: RWW dyes harvested after adsorption using magnet. Photo taken by Nidal Marie in May
2013 ...………………………………………………………………………………………………......15
Figure 5. 1: Effect of contact time on the adsorptive removal of a) BCG b) MR c) CV by -Fe2O3
nanoparticles …...……………………………………………................................................................24
Figure 5.2: Schemitic adsorption mechanism of dye molecules onto different surfaces of adsorbents
a)activated carbon b) . nanoadsorbent …………………………………………………………………..25
Figure 5.3: Effect of pH on the adsorptive removal of different dyes from wastewater by -Fe2O3
nanoparticles …………………………………………………………………………………………...26
Figure 5.4: Effect of temperature of CV dye and plot of Freundlich and Langmuir model for at different
temperature ………………………………………………………………………………………….….28
Figure 5.5: Effect of temperature of MR dye and plot of Freundlich and Langmuir model for at different
temperature ………….…………………………...……………….…………………………….………29
Figure 5.6: Effect of temperature of BCG dye and plot of Freundlich and Langmuir model for at different
temperature ……………………..………………………………………………………………………30
Figure 5.7: Van’t Hoff plot for the endothermic adsorption of a) CV dye b) BCG dye c) MR dye
……………………………………………………………………...…………………………………...33
Figure 5.8: Effect of contact time on the adsorption removal of RWW by -Fe2O3 of nanoparticles …35
Figure 5.9: Effect pH on real wastewater with initial COD 2582 ppm onto 0.1 g of nanoparticles at 293
k. for 24h with 300 rpm shaking rate ………………………………………………………………….35
Figure 5.10: Isotherm test for RWW a) adsorption isotherm for real wastewater at different temperature
b) Langmuir adsorption isotherms of real waste water, symbols are experimental data, and the solid lines
are linearized Langmuir model c)Freundlich adsorption isotherms of RWW…………………………..36
Figure 5. 11: Van’t Hoff plot for the endothermic adsorption of RWW …………………..…………..38
vii
LIST OF TABLES
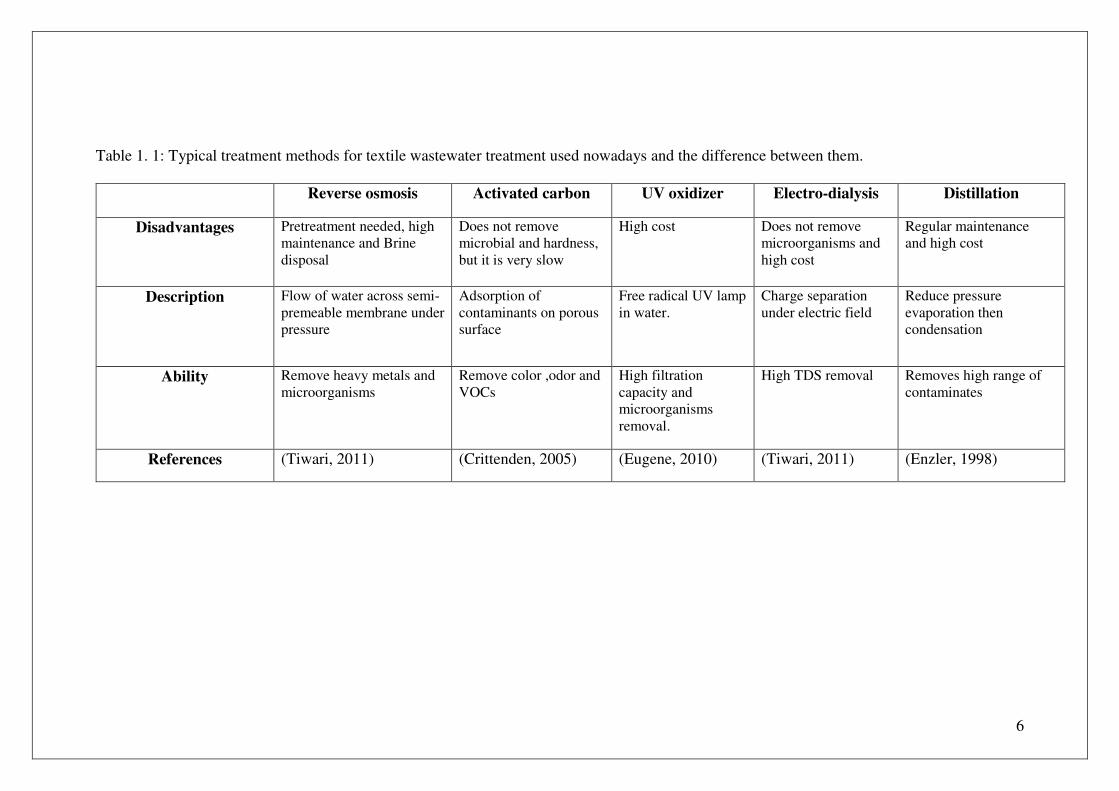
Table 1. 1: Typical treatment methods for textile wastewater treatment used nowadays and the
difference between them………………………………………………………………………………....6
Table 3.1: Model dyes used in this study and their properties as reported by the vendor……………...11
Table 3.2: Result of actual wastewater initial analytical tests………………………………………….12
Table 5.1: Estimated effect of contact time on the adsorption removal of BCG, MR and CV by -Fe2O3
nanoparticles ………………………………………………………………………………………...…24
Table 5.2: Isotherm models (Langmuir) estimated parameters at different temperature ………..……..30
Table 5.3: Isotherm models (Freundlich) estimated parameters at different temperature…………….. 31
Table 5.4 values of ∆G, ∆H and ∆S for CV, BCG and MR dyes adsorption at different temperature
…………………………………………………………………………………………………………..31
Table 5.5: Estimated pseudo -first- order and pseudo- second- order parameters using polymath …....34
Table 5.6: Langmuir and Freundlich isotherm parameters obtained at different temperatures and a pH
of 6.8 ………………………………………………...………………………...……………………….37
Table 5.7: values of G, H and S for RWW adsorption at pH 6.8 and different temperature .....38
1
CHAPTER ONE
LITERATURE REVIEW
In this chapter, a brief literature review of the literature on the major challenges facing
the water worldwide is presented. Water shortages in Palestine and its main
consumption as well as major industrial generators of wastewater are also discussed.
The commonly used wastewater treatment processes and techniques are reported, with
more emphasis on textile wastewater because it is considered as one of the main
consumer of fresh water and generator of the industrial wastewater in Palestine.
Discussion on the model dyes commonly used in the textile industry is presented. The
chapter also provides a brief literature review on the use of nanoparticles in water and
wastewater treatment as an alternate to the classical treatment technology currently
employed for textile wastewater.
1.1 World water challenges
There is no doubt that the world is facing formidable challenges in meeting the rising
demands of potable water as the available supplies of freshwater are decreasing due to
extended droughts, population growth, more stringent health-based regulations, and
competing demands from a variety of users (WWO, 2011). Moreover, increasing
pollution of groundwater and surface water from a wide variety of industrial, municipal,
and agricultural sources has seriously tainted water quality in these sources and
effectively reduced the supply of freshwater for human (EPA, 1990). Although the
nature of pollution problems may vary, they are typically due to inadequate sanitation,
algal blooms fertilized by the phosphorus and nitrogen contained in human and animal
wastes, detergents and fertilizers, pesticides, chemicals, heavy metals, salinity caused
2
by widespread and inefficient irrigation, and high sediment loads resulting from
upstream soil erosion (Nikulina et al.,1995).
Given the importance of potable water to people in both the developed and
developing countries, and taking into account concerns regarding the viability of
current practices of meeting the increasing demands of all water users, there is a clear
need for the development of innovative new technologies and materials whereby
challenges associated with the provision of safe potable water can be addressed (EPA,
1990). Although new approaches are continually being examined, these need to be
lower in overall cost, durable and more effective than current methods used for the
removal of contaminants from water, either in-situ or ex-situ water purification systems
(WWO, 2011).
1.2 Water Shortages in Palestine
Severe water shortages and water quality problems continue to negatively affect the
lives and livelihoods of millions of Palestinians living in the West Bank and Gaza Strip
(Ollgaard, 1998). Rather than the caused by environmental factors, both are attributable
to the discriminatory water policies and practices that Israel has instituted across the
occupied Palestinian territory over the last sixty years. Moreover, Palestinians water
consumption is very high in comparison with other countries, and with the limited
sources of fresh water (Authority, 2012) wastewater treatment and recyclability are of
paramount importance. For instance, at the end of 2010, more than 110 MMC of fresh
water consumed for industrial uses in Palestine, and about 200 MMC for human and
agricultural uses (Authority, 2012). Accordingly, these facts have led to an increased
demand on the treatment and recycling of industrial wastewater in order to meet current
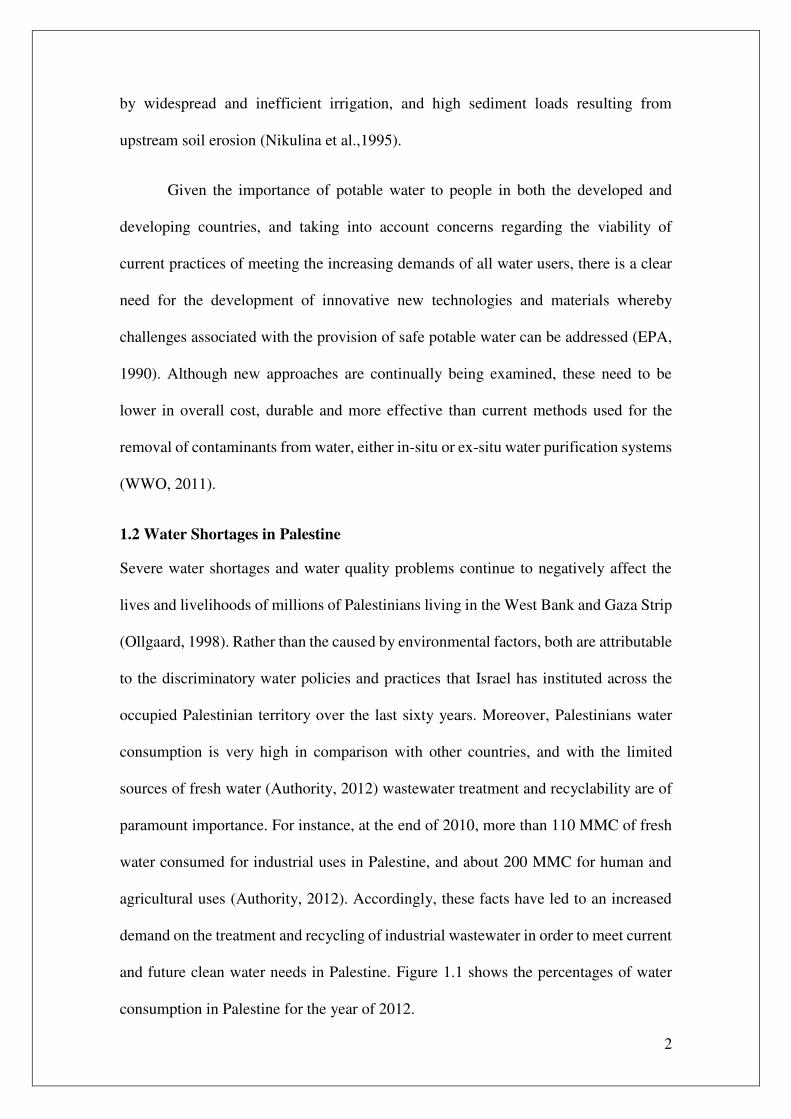
and future clean water needs in Palestine. Figure 1.1 shows the percentages of water
consumption in Palestine for the year of 2012.
3
Clearly, the major consumer is the agricultural sector followed by the industrial
sector. This is not surprising, as agriculture is the backbone of Palestinian economy.
However, recycling agricultural water is challenging as most of used water seeps
underground. On the other hand, the used industrial wastewater is significant and can
be easily recycled as they could be collected in settling tank or lagoon. In this project,
we are mainly focusing on textile wastewater treatment because of the difficulty of
treating this type of water in classical wastewater treatment station. It should be noted
here that this kind of water represents about 6% of the total consumption and that equals
17 MMC/year.
Figure 1.1: Percentages of water consumption in Palestine for the year of 2012. Data obtained
from Authority of Palestinian Water (Authority of Palestinian Water, 2012)
4
1.3 Textile dyes and their environmental concern.
Wastewater from the textile industry is a complex mixture of many polluting substances
ranging from organochlorine-based pesticides to heavy metals associated with dyes or
the dyeing process (Correia et al., 1994). Many dyes are visible in water at
concentrations as low as 1 mg/L and textile-processing wastewaters, typically with dye
content in the range of 10-200 mg/L (O'Neill et al., 1999) are therefore usually highly
colored and discharged in open waters presents an aesthetic problem. As dyes designed
to be chemically and photolytically stable, they are highly persistent in natural
environments. Major classes of synthetic dyes include azo, anthraquinon and triaryl-
methane dyes, and many of them are toxic or even carcinogenic compounds with long
turnover times. The majority of dyes pose a potential health hazard to all forms of life
(Prakash, 1993). These dyes may cause allergic responses, skin dermatoses, eczema (Su
and Horton, 1998), and may affect the liver, the lungs, the vasco-circulatory system,
the immune system and the reproductive system of experimental animals as well as
humans (Nikulina et al., 1995).
Synthetic dyes are extensively used in textile dyeing, paper printing, color
photography, pharmaceutical, food, cosmetics and other industries (Rafi et al., 1990).
Approximately, 10,000 different dyes and pigments are used industrially, and over
7x10⁵ tons of synthetic dyes are produced annually worldwide (Horton, 1998). In 1991,
the world production of dyes was estimated 668,000 tons (Ollgaard et al., 1998) of
which azo dyes contributed 70% (ETAD, 1997). During dying process, a substantial
amount of azo dye is lost in wastewater (Ollgaard et al., 1998). About 10-15% of dyes
were lost in effluent during dyeing process (Zollinger, 1987). With the increased use of
a wide variety of dyes, pollution caused by dyes wastewater is becoming increasingly
alarming (Ollgaard et al., 1998).
5
1.3.1 Dyes typical removal techniques
Dye or color is the first contaminant to be recognized in wastewater and has to be
removed before discharging into water bodies or on land. The removal of color from
wastewater is often more important than the removal of the soluble colorless organic
substances, which usually contribute the major fraction of the biochemical oxygen
demand (BOD) (Fewson, 1988; Seshadri et al, 1994). Many methods have been
reported for removing textile dyes from wastewater, among which are
coagulation/flocculation, precipitation, flotation, membrane filtration, adsorption by
activated carbon and low cost adsorbents, ion exchange, ion pair extraction, ultrasonic,
mineralization, electrolysis, advanced oxidation (chlorination, bleaching, ozonation,
Fenton oxidation and photocatalytic oxidation) and chemical reduction (Neemann,
2004). Biological treatment techniques were also used for color removal; including
bacterial and fungal biosorption and biodegradation in aerobic, anaerobic or combined
anaerobic/aerobic treatment processes (Cooper, 1993). The use of one individual
process may often not be sufficient to achieve complete decolorization. In addition,
most of the aforementioned methods are not always effective even from cost side or
quality in work and need a lot of processes to be applied in reality (Fewson, 1988).
Table 1.1 shows the most popular typical textile wastewater treatment methods used
nowadays and the difference between them.
6
Table 1. 1: Typical treatment methods for textile wastewater treatment used nowadays and the difference between them.
Reverse osmosis Activated carbon UV oxidizer Electro-dialysis Distillation
Disadvantages Pretreatment needed, high
maintenance and Brine
disposal
Does not remove
microbial and hardness,
but it is very slow
High cost Does not remove
microorganisms and
high cost
Regular maintenance
and high cost
Description Flow of water across semi-
premeable membrane under
pressure
Adsorption of
contaminants on porous
surface
Free radical UV lamp
in water.
Charge separation
under electric field
Reduce pressure
evaporation then
condensation
Ability Remove heavy metals and
microorganisms
Remove color ,odor and
VOCs
High filtration
capacity and
microorganisms
removal.
High TDS removal Removes high range of
contaminates
References (Tiwari, 2011) (Crittenden, 2005) (Eugene, 2010) (Tiwari, 2011) (Enzler, 1998)
7
As seen in Table 1.1, the available treatment technologies for textile wastewater is
limited as they are not cost efficient, time consuming and inefficient in meeting the
strict environmental regulations. It should be noted her that adsorption by activated
carbon is the most popular method worldwide for textile wastewater treatment, due to
their high adsorption capacity and affinity. However, adsorption by activated carbon
still facing a number of challenges; including time-consuming for achieving process
equilibrium due to high porosity and high capital and operating cost, in addition to the
huge amount of sludge waste generated from the spent adsorbents. Accordingly, the
search for a new technology or enhancing the available technology for textile
wastewater treatment is a must. In this project, we are mainly investigating the use of
magnetic nanoadsorbents for the adsorptive removal of dye from an actual textile
wastewater samples. To the best of our knowledge, this is the first time of applying
this technology for real textile wastewater treatment in Palestine. Since the treatment
is on the use of new technology on the basis of adsorption fundamental we thought to
provide a quick review on the adsorption method and pinpoint the uniqueness of our
nanoadsorbent technique. The use of nanoadsorbent technology for dye adsorption
removal was initiated by Nassar and coworkers (Nassar&Rngserd, 2012; Nassar,
2010a).
1.4 Magnetic nanoadsorbents
Magnetic nanoparticles are very effective as a separation medium for water purification
as they contain a number of key physio-chemical properties. They are known for their
high surface area to mass ratio which occurs as a result of decreasing the size of the
adsorbent particle from bulk to nanoscale dimensions (Savage, 2005). This property of
magnetic nanoparticles leads to the availability of a high number of atoms or molecules
on the surface available for contaminants thereby enhancing the adsorption capacities
8
and affinities (Anshup, 2009). Moreover, this large surface area coupled with their size,
electronic and catalytic properties provide unparalleled opportunities to develop more
efficient water purification adsorbents, catalysts and redox active media. Nanoparticles
can also be functionalized with various chemical groups to increase their affinity toward
a given compound (Savage et al., 2005). Lastly, since more adsorbent atoms/molecules
are present per unit mass of the adsorbent, less waste will be generated post treatment
as these atoms will be actively utilized for adsorption (Tiwari, 2011). Because of these
unique properties, nanoparticles have potential applications for the treatment of
wastewater and drinking water as well, and the value of their application to wastewater
treatment has grown rapidly (Nassar, 2012). Due their multi-functionalities and
magnetic properties, iron-oxide nanoparticles are the most commonly used adsorbent
and/or catalyst for wastewater remediation (Nassar, 2011). Furthermore, because iron
oxide is naturally occurring, inexpensive, and stable over a wide range of temperatures
and acidity levels, nanoparticles of iron oxide are advantageous over other metal oxides.
There have been numerous studies on the use of iron-oxide nanoparticles as catalysts
for degradation of contaminants, usually organic materials from wastewater, and as
adsorbents for adsorptive removal of pollutants, mainly metal ions or functionlized
organic compund from wastewater. (Nassar, 2011). The use of iron oxide
nanoadsorbent for dye adsorption removal from synthetic wastewater was first
introduced by Nassar and coworkers (Nassar 2010a, Nassar and Ringsred, 2011). In
their studies, Nassar and coworkers have used different types of dyes that vary in their
chemical structure, molecular weight and functionalities. The authors showed that iron
based nanoadsorbents are efficient and successful in removing different types of dyes
and heavy metals, provided the right solution pH and temperature.

9
In this study, we decide to use magnetic nanoadsorbents for the treatment of actual
textile wastewater samples obtained from a local textile factory. Before treating the real
sample, however different model dyes that having different molecular weight, structure
and functionalities were tested for adsorption onto magnetic nanoparticles in order to
understand the adsorption mechanism and behavior.
10
CHAPTER TWO
OBJECTIVES
2.1 General objectives
Earlier studies on nanoadsorbent technology examine the importance of the magnetic
nanoadsorbents in removing heavy metals and organic contaminants for synthetic
wastewater. Other researchers evaluated the unique properties of nanoadsorbents in
wastewater treatment. The objective of the present work is to employ nanoadsorbents
for actual textile wastewater treatment in Palestine for the first time.
2.2 Specific objectives
The specific objectives of this work were to:
1. Maximize the treatment efficiency and evaluate the effect of the following
variables on adsorption efficiency of -Fe2O3 nanoadsorbent:
a. Contact time (kinetics)
b. Initial concentration of dye
c. Dosage of nanoadsorbents
d. Solution pH
e. Temperature (thermodynamics)
f. Coexisting contaminants
2. Apply different adsorption isotherm model, to examine the effect of the above
variables on the adsorption capacity and affinity of nanoadsorbents.
3. Develop a kinetic model that is capable of descripting the adsorption kinetics.
4. Conduct a thermodynamic study for estimating the standard changes in Gibbs
free energy, enthalpy and entropy of adsorption.
11
CHAPTER THREE
EXPERIMENTAL WORK
This chapter describes the materials used, the characterization techniques employed,
and the experimental methodology and procedure applied in this study.
3.1 Materials
3.1.1 Adsorbates
Different model dyes having different molecular weight, structure and functionalities
were obtained from Sigma-Aldrich. Table 3.1 lists these different types of dyes used in
this study with their chemical properties and structure.
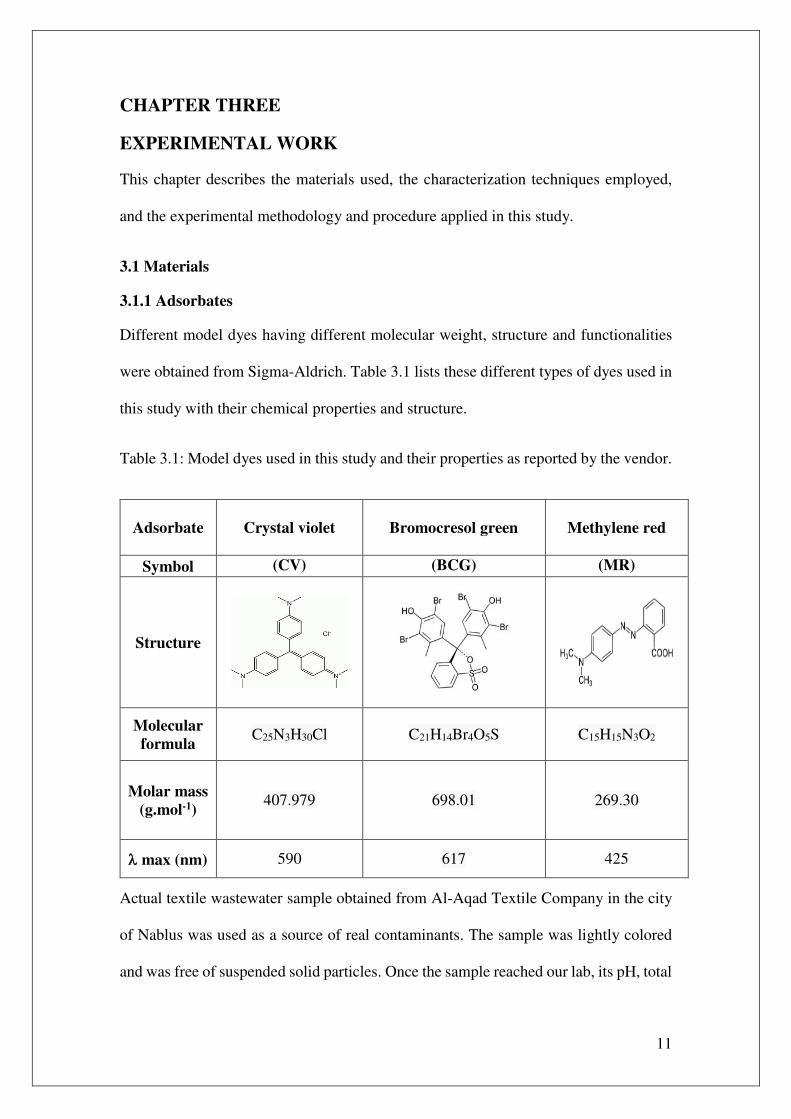
Table 3.1: Model dyes used in this study and their properties as reported by the vendor.
Actual textile wastewater sample obtained from Al-Aqad Textile Company in the city
of Nablus was used as a source of real contaminants. The sample was lightly colored
and was free of suspended solid particles. Once the sample reached our lab, its pH, total
Adsorbate
Crystal violet
Bromocresol green
Methylene red
Symbol (CV) (BCG) (MR)
Structure
Molecular
formula C25N3H30Cl C21H14Br4O5S C15H15N3O2
Molar mass
(g.mol-1) 407.979 698.01 269.30
max (nm) 590 617 425
12
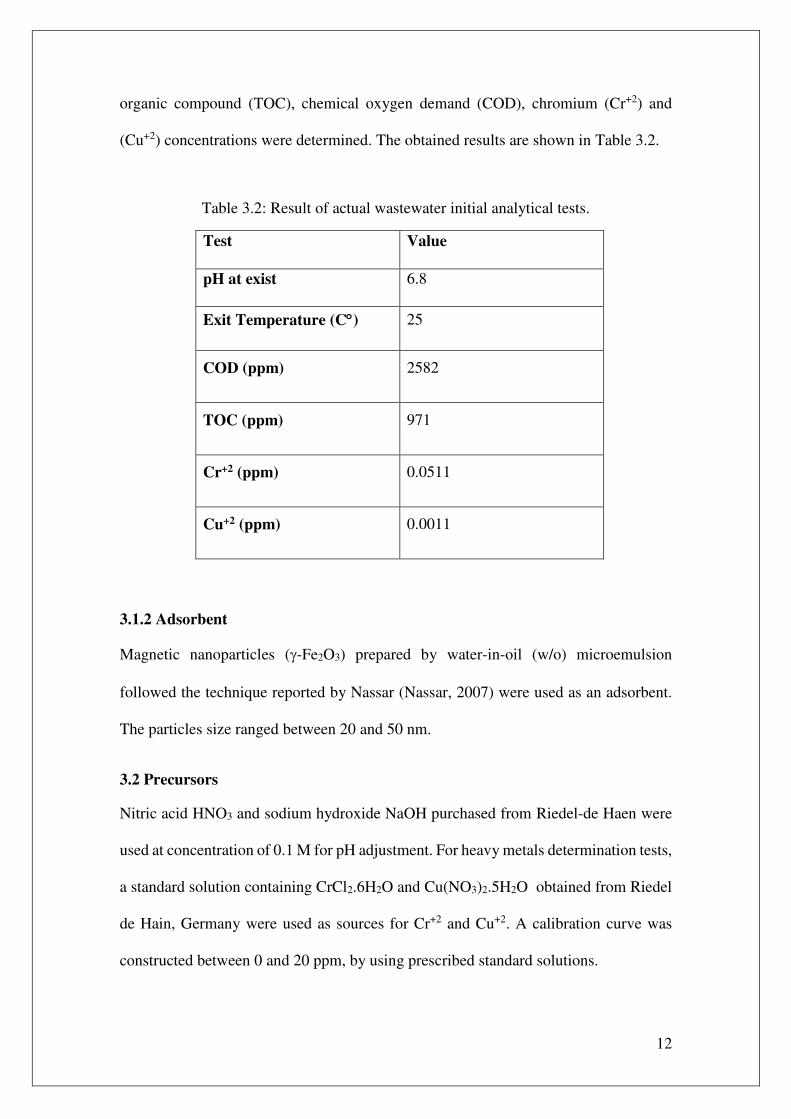
organic compound (TOC), chemical oxygen demand (COD), chromium (Cr+2) and
(Cu+2) concentrations were determined. The obtained results are shown in Table 3.2.
Table 3.2: Result of actual wastewater initial analytical tests.
Test Value
pH at exist 6.8
Exit Temperature (C) 25
COD (ppm) 2582
TOC (ppm) 971
Cr+2 (ppm) 0.0511
Cu+2 (ppm) 0.0011
3.1.2 Adsorbent
Magnetic nanoparticles (-Fe2O3) prepared by water-in-oil (w/o) microemulsion
followed the technique reported by Nassar (Nassar, 2007) were used as an adsorbent.
The particles size ranged between 20 and 50 nm.
3.2 Precursors
Nitric acid HNO3 and sodium hydroxide NaOH purchased from Riedel-de Haen were
used at concentration of 0.1 M for pH adjustment. For heavy metals determination tests,
a standard solution containing CrCl2.6H2O and Cu(NO3)2.5H2O obtained from Riedel
de Hain, Germany were used as sources for Cr+2 and Cu+2. A calibration curve was
constructed between 0 and 20 ppm, by using prescribed standard solutions.
13
3.3. Dye characterization and adsorption measurement
The following instruments were used to estimate the amount of adsorbed dye, solution
pH, heavy metal concentration and COD level.
3.3.1 UV-vis spectrophotometry
The UV-vis spectroscopy measurements were conducted using UV-VIS-NIR-3101PC
(Shimadzu). A range of wavelength between 200 and 700 nm was covered. Distilled
water was used as a blank during the UV measurements. All measurements were carried
out using quartz cells 10-mm width at temperature 25 C.
3.3.2 Atomic absorption spectrometer (AA)
AA measurements were performed using (iCE 3400, Scientific Thermo) for heavy
metals detecting Cr+2 and Cu+2 using standard solutions purchased from Riedel de Hain,
Germany.
3.3.3 Digital reactor block (DRB) for chemical oxygen demand (COD)
Measurements
COD measurements were performed following the USEPA method (USEPA, 2013)
using (Digital Reactor Block DRB 2000, HACH, Germany). COD sample was prepared
by adding 1 mL deionized water and 1 mL of supernatant (wastewater sample) to a
standard solution from HACH containing 65 wt% of H2SO4, HgSO4 and K2CrO7. Then
the solution was transferred to the DRB instrument for 2 h at 150 oC for COD
monitoring. Deionized water was used as a blank in this test.
3.3.4 pH meter
pH measurements were carried out using HANNA pH meter, model HI 8424.
14
3.3.5 Simple magnet
A simple kitchen magnet was used for separation and recovery of magnetic
nanoadsorbents from the solution.
3.4 Experimental procedure
Batch-mode adsorption method was employed in this study by exposing a specified
dried mass of nanoparticles to an aqueous solution containing a certain concentration
of a specified dye, unless otherwise specified. Then, the mixture was shaken for a
certain time at a pre-described temperature. In all experiments, the -Fe2O3
nanoparticles containing adsorbed dye were separated from the mixture by a magnet
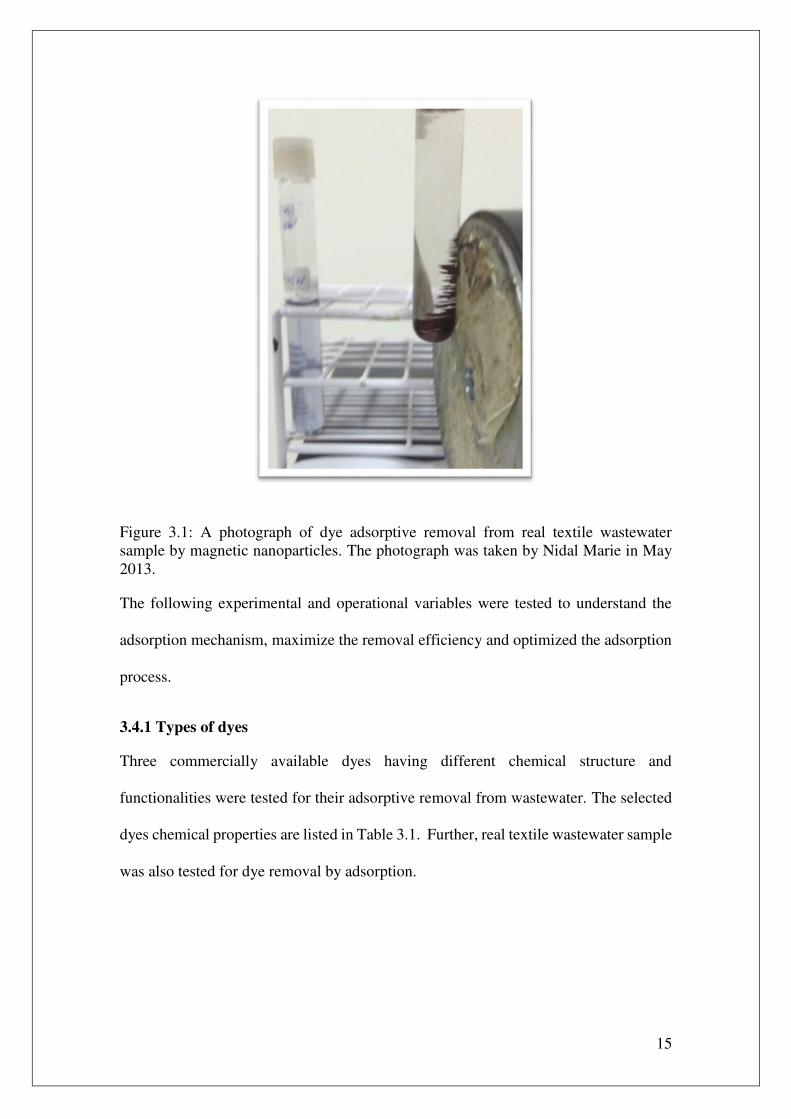
and the supernatant was decanted. Figure 3.1 shows a photograph presenting the
separation of nanoparticles from wastewater by a simple magnet. The residual
concentration of each dye in the solution was measured by UV-vis spectrophotometry
concentration of dye were measured at the specified wavelength (max). A calibration
curve of UV-vis absorbance at same wavelengths against the dyes concentration was
established, using prepared standard model solutions with known concentrations (i.e.,
0, 20, 50, 75, 100 ppm). UV-vis spectra of dyes in solution were selected on the basis
of the absorption linearity range. The adsorbed amount of dye (mg of dye/g of
nanoparticles) was determined by the mass balance in Equation (3.1):
= ��−� � (3.1)
where Co is the initial concentration of dye in the solution (mg/L), C is the final
concentration of dye in the supernatant (mg/L), V is the solution volume (L), and m is
the dry mass of -Fe2O3)nanoparticles (g). For equilibrium data, Ce replaces C, and Qe
replaces Q in Equation (3.1).
15
Figure 3.1: A photograph of dye adsorptive removal from real textile wastewater
sample by magnetic nanoparticles. The photograph was taken by Nidal Marie in May
2013.
The following experimental and operational variables were tested to understand the
adsorption mechanism, maximize the removal efficiency and optimized the adsorption
process.
3.4.1 Types of dyes
Three commercially available dyes having different chemical structure and
functionalities were tested for their adsorptive removal from wastewater. The selected
dyes chemical properties are listed in Table 3.1. Further, real textile wastewater sample
was also tested for dye removal by adsorption.
16
3.4.2 Effect of contact time
Typically, time-dependent adsorption process is conducted by exposing a certain
amount of nanoadsorbents to a solution containing a specified concentration of
pollutant for fixed preselected time intervals. In this study, 0.1 g of -Fe2O3
nanoparticles were added to 10 ml aqueous solution containing a 100 ppm
concentration of each dye at 293 K and a specified solution pH (i.e., pH solution for
CV = 10.94, 2.39 for BCG and 2.36 for MR). The mixture was shaken for 90 minutes,
unless otherwise noted. To determine the adsorption equilibrium time required for
saturation, samples were selected at different times during the 90 minutes and analyzed
for dye and contaminants concentration.
3.4.3 Effect of solution pH
For pH-dependent studies, model dyes and real wastewater dye adsorption pH
experiments were conducted at 293 K for a mixing time of 24 h for a pH range of 2 to
12. To adjust the pH of the solution, HNO3 or NaOH, was used.
3.4.4 Effect of Temperature
For the isotherm studies, 0.1 g of -Fe2O3 nanoparticles were added to a set of 10 mL
aqueous solution with model dye initial concentrations ranges between 0 and 400 mg/L
at different temperatures between 293 and 353 K for 24 h, at specified pH.
3.5 Application of Nanoparticles to Real wastewater (RWW)
After the successful achievement of the adsorption experiments on model dyes, the
procedure was employed to a real textile wastewater sample. Same procedure used for
model dye solutions were applied on real wastewater in all tests except for the case of
constant initial concentration of the sample was kept constant (TOC = 971 ppm) at pH
6.8. For isotherm experiment, different masses of -Fe2O3 nanoparticles from 0.02-0.25
17
g were added to a set of 10-mL test tubes containing real wastewater at TOC = 971 ppm
at pH 6.8. The mixer was left shaking for 24 h. After that, nanoparticles with adsorbed
dyes were separated by magnet and the supernatant was decanted like the model dyes,
the adsorbed amount of contaminants (mg contaminants/g of nanoparticles) was
determined by the mass balance in Equation (3.1)
18
CHAPTER FOUR
MODELING
This chapter introduces the mathematical models employed in this study and the
evaluation of their performance in describing the adsorption kinetics, isotherms, and
thermodynamic studies of dyes adsorptive removal from synthetic wastewater and
actual textile wastewater.
4.1 Adsorption kinetics test
Adsorption kinetics is one of the important factors that represent the efficiency of the
adsorption process. Modeling of the adsorption kinetics was achieved using Lagergren
pseudo first-order model Eq(4.1) (Ho, 2004) and pseudo-second-order model Eq(4.2)
(McKay, 1998).
��� = − � (4.1)
��� = − � (4.2)
where Qe and Qt are the amount of pollutant adsorbed onto the nanoadsorbents (mg/g)
at equilibrium and at any time, t (min), respectively, and k1 and k2 are the equilibrium
rate constants of first order and second order adsorption, respectively.
Nonlinear Chi-square analyses were conducted for comparing the best-fit-model, using
Equation (4.3) (Montgomery and Runger, 2006):
= ∑ � −� � 2� � (4.3)
where Qe and QeModel are the adsorbed amount of dye and contaminants obtained
experimentally and by model fitting, respectively. The lower value of the better for
fitting.
19
4.2 Adsorption isotherms
Adsorption isotherms are common models that compare adsorbent surface properties
and their adsorption capacity of pollutants. Several adsorption models are available for
interpreting the adsorption equilibrium data. The most commonly used models are the
Freundlich and Langmuir isotherms (Freundlich, 1906; Langmuir, 1916). In this study,
the shapes of the isotherms were fit to the Langmuir and Freundlich models, which are
expressed linearly in equations 4.4 and 4.5, respectively:
Log = Log � + � � (4.4)
�� = � ���� + �� �� (4.5)
where Qe is the amount of pollutant adsorbed onto the nanoadsorbents (mg/g), Ce is the
equilibrium concentration of pollutant in solution (mg/L), KF [(mg/g)(L/mg)1/n] and
1/n (unitless) are Freundlich constants. KF is roughly an indicator of the adsorption
capacity, and 1/n is an indicator for the degree of favorability of adsorption (adsorption
affinity). A larger KF value suggests to a greater adsorption capacity, and a lower 1/n
value indicates stronger adsorption strength. KL (L/mg) and Qmax (mg/g) are Langmuir
constants. KL is the equilibrium adsorption constant related to the affinity of binding
sites, and Qmax is the monolayer saturation capacity, representing the maximum amount
of pollutant adsorbed per unit weight of nanoadsorbents for complete monolayer
coverage (mg/g). Again, chi-square analyses (Equation 4.3) were also employed for
finding the goodness of fittings.
4.3 Thermodynamic studies
Temperature plays an important role on the adsorption process as the viscosity of the
solution decreases with temperature which results in an increase in the diffusion rate of
20
the adsorbate molecules across the external boundary layer, which in turn, increases the
adsorption capacity (Nassar, 2012). Moreover, changing the temperature alters the
equilibrium capacity of the adsorbent (Ngomsik, 2005). For instance, the adsorption
capacity will decrease upon increasing the temperature for an exothermic reaction;
while it will increase for an endothermic one (Nassar 2010). Hence, in this study,
thermodynamic studies were employed to better explain the adsorption reaction and to
provide more insights into the effect of temperature on adsorption. These
thermodynamic parameters are the changes in standard Gibbs free energy (G),
enthalpy (H), and entropy (S) during adsorption. G was estimated as follow
(Smith et al., 2005):
= − �� (4.6)
where R is the ideal gas constant (R = 8.314 J/mol.K), T is the temperature (Kelvin)
and K is the adsorption equilibrium constant (dimensionless). The adsorption
equilibrium constant was estimated from the Langmuir’s constant, using Equation (4.7)
(Nassar, 2010a, 2010b; Rudrake et al., 2009):
� = � ��� (4.7)
where KL is the equilibrium Langmuir constant (L/mmol) and Csolvent is the solvent
molar concentration (mM), which was estimated from the density and molecular weight
of water at the given temperature. H and S were estimated using the van’t Hoff
equation (Smith et al., 2005), which shows the dependence of the adsorption reaction
equilibrium constant on temperature, as follows:
ln = − �� + �� (4.8)

21
By plotting the experimental results as ln K against 1/T, H and S were obtained
from the slope and intercept of the best-fit line.
22
CHAPTER FIVE
RESULTS AND DISCUSSION
In this chapter, results of experiments for model dyes and real wastewater samples are
presented. The obtained data were fit to the Langmuir and adsorption isotherm and the
kinetic data were modeled using first pseudo order and second order models.
Thermodynamic studies of the adsorption process are presented as well.
5.1 Model dyes
In this section we are presenting the results pertaining to the effect of experimental and
operation conditions on the adsorptive removal of model dyes (i.e., CV, BCG, and MR)
by -Fe2O3 nanoparticles.
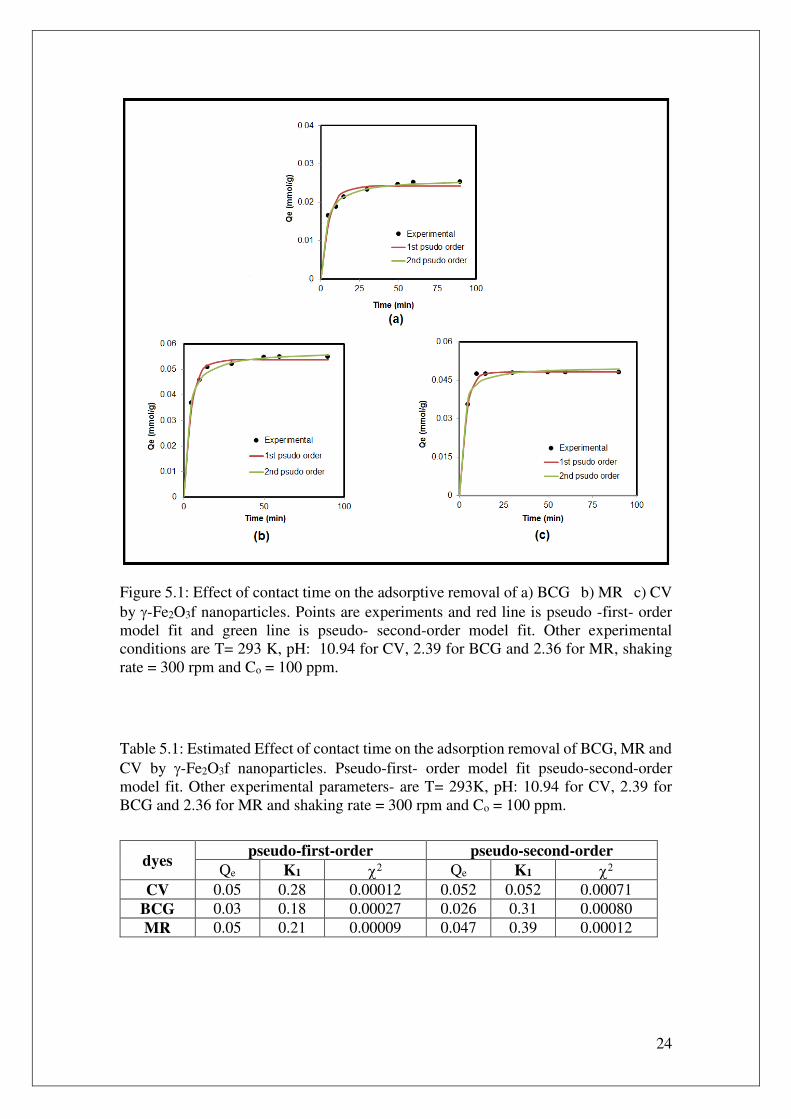
5.1.1 Effect of contact time (adsorption kinetics)
Adsorption kinetics is one of the important factors that represent the efficiency of the
adsorption process. Figure 5.1a-c shows the change in the amount adsorbed of different
dyes as a function of contact time. As seen, in all cases, the dye adsorption was fast, as
adsorption equilibrium was reached within 50 minutes or less. This is not surprising as
the selected nanoparticles are nonporous. Therefore, one would anticipate that external
adsorption is dominant and no intraparticle diffusion is available to retard the
adsorption rate (Nassar 2010, Nassar and Rigsred 2012). Unlike the classical adsorbents
such as activated carbon and activated alumina, where adsorption equilibrium time
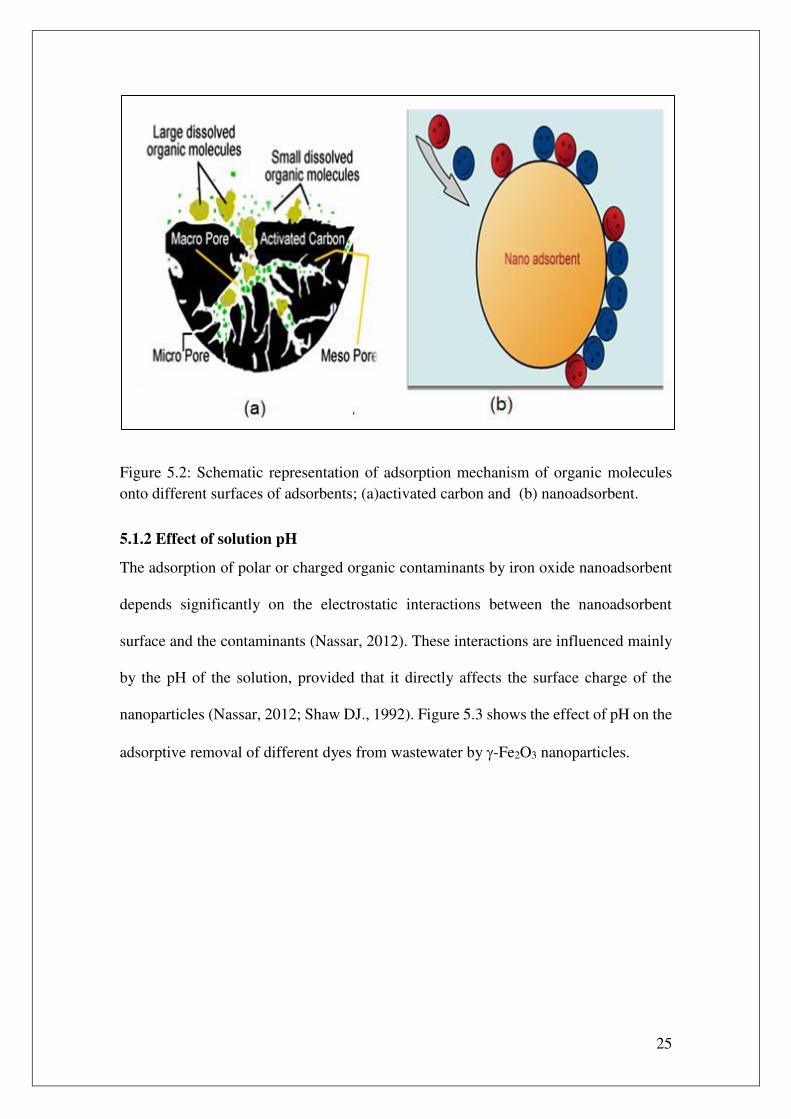
could take days (Crittenden, 2005). This illustrated schematically in Figure 5.2, which
shows a schematic representation for adsorption mechanism of dye molecules onto
different surfaces of adsorbents. Clearly, there will be more mass transfer resistances
for the case of porous adsorbent in comparison of non-porous nanoparticles. These
findings are in excellent agreement with those reported by Nassar and coworkers for
23
the removal of organic contaminants and heavy metals from wastewater by iron oxide
nanoparticles (Nassar 2010a, Nassar 2010b, Nassar 2012a, Nassar and Ringsred 2012).
To further investigate the kinetic mechanism that controls the adsorption process, the
experimental data were fitted to the Lagergren pseudo-first-order model (Ho 2004) and
pseudo-second-order model (Ho and McKay 1998) presented previously in Equations
4.1 and 4.2; respectively. Table 5.1 shows the estimated kinetic parameters pertaining
to the two models as obtained by the Polymath package. As shown in Figure 5.1a-c,
and on the basis of chi values presented in Table 5.1, both models fit well to the
experimental data with the pseudo-first-order model being the best fit for the model
dyes. This suggests that, owing to good degree of mixing and extent dispersion of
nanoparticles, adsorption is only affected by the film diffusion (Nassar and Ringsred
2012). It is worth noting here that the estimated theoretical values of Qe (i.e., by the
kinetic model) were in excellent agreement with the ones obtained experimentally, as
seen in Table 5.1.
24
Figure 5.1: Effect of contact time on the adsorptive removal of a) BCG b) MR c) CV
by -Fe2O3f nanoparticles. Points are experiments and red line is pseudo -first- order
model fit and green line is pseudo- second-order model fit. Other experimental
conditions are T= 293 K, pH: 10.94 for CV, 2.39 for BCG and 2.36 for MR, shaking
rate = 300 rpm and Co = 100 ppm.
Table 5.1: Estimated Effect of contact time on the adsorption removal of BCG, MR and
CV by -Fe2O3f nanoparticles. Pseudo-first- order model fit pseudo-second-order
model fit. Other experimental parameters- are T= 293K, pH: 10.94 for CV, 2.39 for
BCG and 2.36 for MR and shaking rate = 300 rpm and Co = 100 ppm.
dyes pseudo-first-order pseudo-second-order
Qe K1 Qe K1
CV 0.05 0.28 0.00012 0.052 0.052 0.00071
BCG 0.03 0.18 0.00027 0.026 0.31 0.00080
MR 0.05 0.21 0.00009 0.047 0.39 0.00012
25
Figure 5.2: Schematic representation of adsorption mechanism of organic molecules
onto different surfaces of adsorbents; (a)activated carbon and (b) nanoadsorbent.
5.1.2 Effect of solution pH
The adsorption of polar or charged organic contaminants by iron oxide nanoadsorbent
depends significantly on the electrostatic interactions between the nanoadsorbent
surface and the contaminants (Nassar, 2012). These interactions are influenced mainly
by the pH of the solution, provided that it directly affects the surface charge of the
nanoparticles (Nassar, 2012; Shaw DJ., 1992). Figure 5.3 shows the effect of pH on the
adsorptive removal of different dyes from wastewater by -Fe2O3 nanoparticles.
26
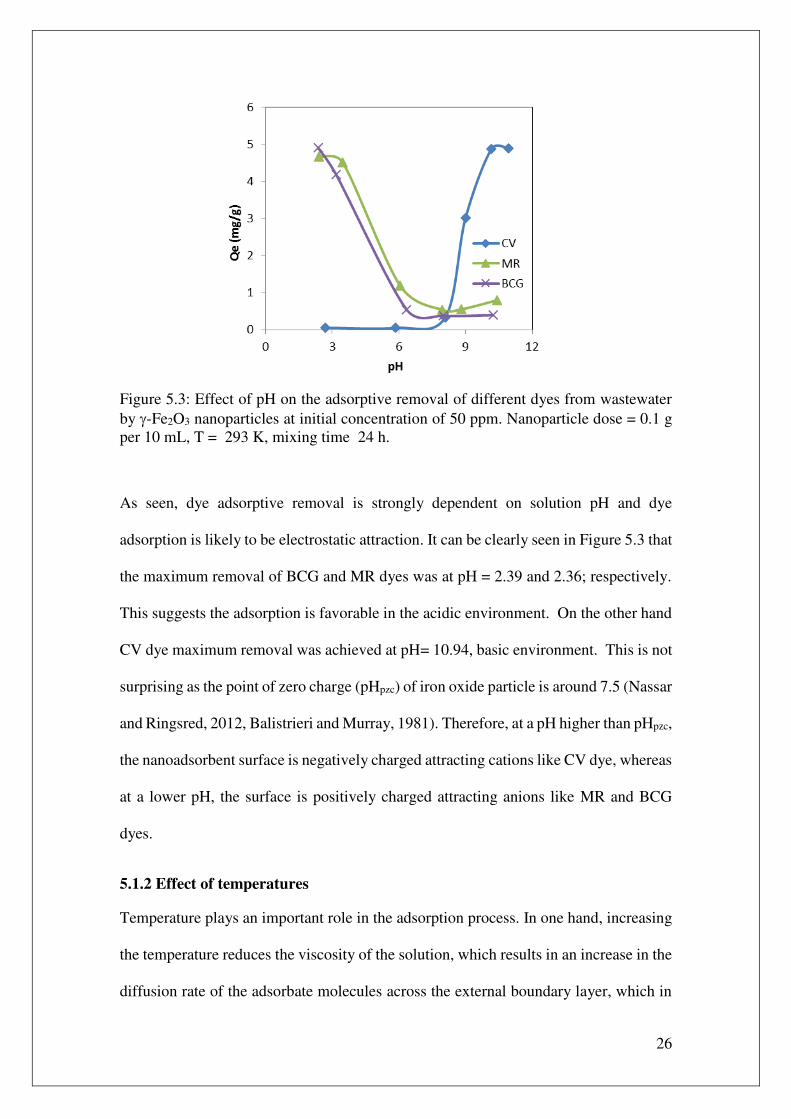
Figure 5.3: Effect of pH on the adsorptive removal of different dyes from wastewater
by -Fe2O3 nanoparticles at initial concentration of 50 ppm. Nanoparticle dose = 0.1 g
per 10 mL, T = 293 K, mixing time 24 h.
As seen, dye adsorptive removal is strongly dependent on solution pH and dye
adsorption is likely to be electrostatic attraction. It can be clearly seen in Figure 5.3 that
the maximum removal of BCG and MR dyes was at pH = 2.39 and 2.36; respectively.
This suggests the adsorption is favorable in the acidic environment. On the other hand
CV dye maximum removal was achieved at pH= 10.94, basic environment. This is not
surprising as the point of zero charge (pHpzc) of iron oxide particle is around 7.5 (Nassar
and Ringsred, 2012, Balistrieri and Murray, 1981). Therefore, at a pH higher than pHpzc,
the nanoadsorbent surface is negatively charged attracting cations like CV dye, whereas
at a lower pH, the surface is positively charged attracting anions like MR and BCG
dyes.
5.1.2 Effect of temperatures
Temperature plays an important role in the adsorption process. In one hand, increasing
the temperature reduces the viscosity of the solution, which results in an increase in the
diffusion rate of the adsorbate molecules across the external boundary layer, which in
27
turn, increases the adsorption capacity (Nassar 2010). On the other hand, changing the
temperature could alter the equilibrium capacity of the adsorbent (Ngomsik, 2005). In
this set of experiments, the effect of temperature on dye adsorptive removal was study
at solution temperature of 293, 328 and 353 K and the initial concentration of dyes was
in the range 0 to 0.8 mM.
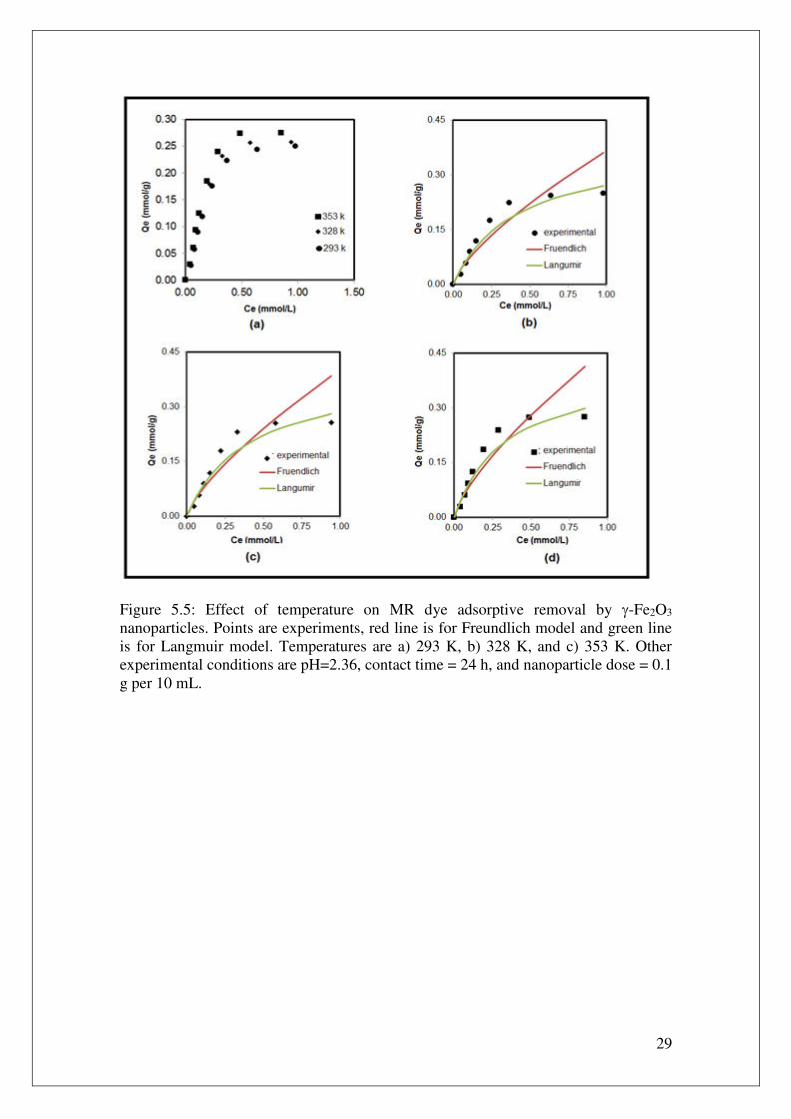
Figure 5.4 shows that CV adsorption at the preselected temperatures increased sharply
at low equilibrium concentration and started to level off as the equilibrium
concentration increased. This suggests that -Fe2O3 nanoparticles has good adsorption
affinity towards CV. In addition, increasing the solution temperature favored the
adsorption. This could be attributed to the increase in the mobility of CV molecules and
the subsequent increase in the number of molecules that could interact with the active
adsorption sites on the nanoparticle surface (Nassar, 2010b). Further, the increase of
adsorption with temperature indicates that the adsorption process is endothermic in
nature. Similar observations can be seen for MR and BCG dyes in Figures 5.5 and 5.6,
respectively. For all dyes tested in this study, the experimental adsorption isotherms
were fit to the Langmuir and Freundlich models. The estimated model parameters are
listed in Tables 5.2 and 5.3. The good fitting to the experimental data was indicated by
the low chi values and high relative coefficients (R2) in Tables 5.2 and 5.3. Clearly, for
all the dyes, the Langmuir model presented a better fitting to the experimental data.
This suggests that the selected nanoparticles portray a homogeneous surface where a
monolayer adsorption would occur.

28
Figure 5.4: Effect of temperature on CV dye adsorptive removal by -Fe2O3
nanoparticles. Points are experiments, red line is for Freundlich model and green line
is for Langmuir model. Temperatures are a) 293 K, b) 328 K, and c) 353 K. Other
experimental conditions are pH=10.94, contact time = 24 h, and nanoparticle dose =
0.1 g per 10 mL.
29
Figure 5.5: Effect of temperature on MR dye adsorptive removal by -Fe2O3
nanoparticles. Points are experiments, red line is for Freundlich model and green line
is for Langmuir model. Temperatures are a) 293 K, b) 328 K, and c) 353 K. Other
experimental conditions are pH=2.36, contact time = 24 h, and nanoparticle dose = 0.1
g per 10 mL.
30
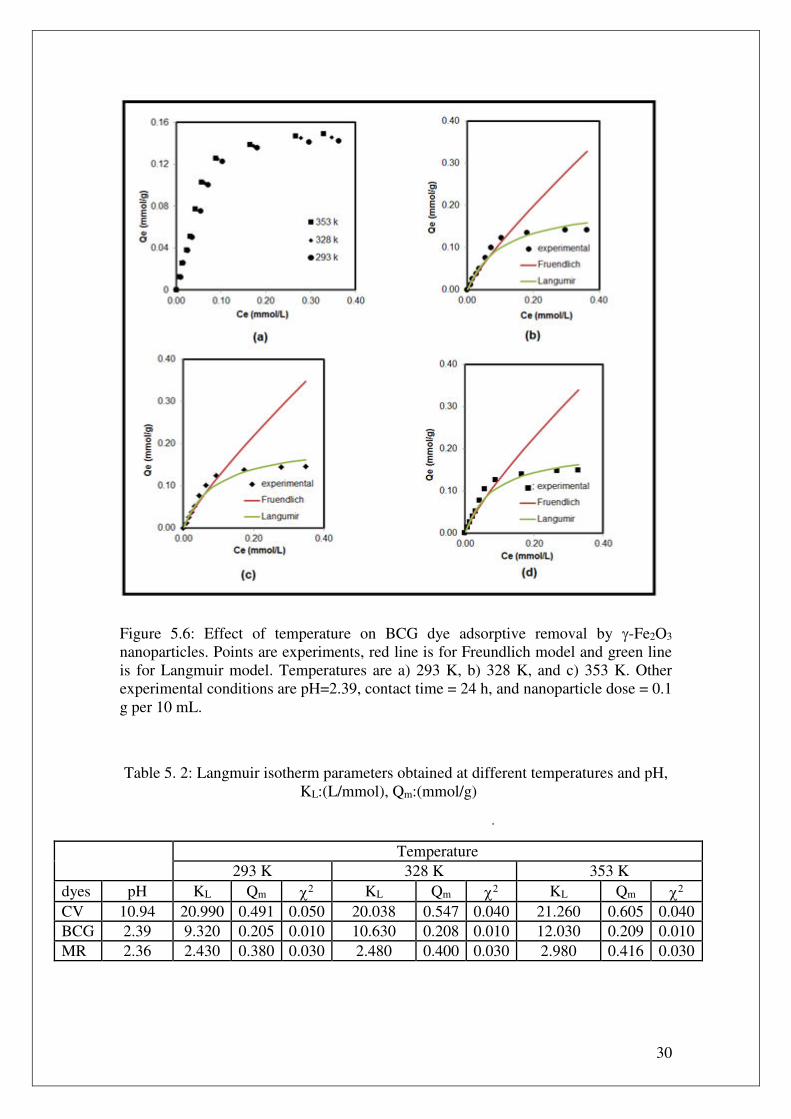
Figure 5.6: Effect of temperature on BCG dye adsorptive removal by -Fe2O3
nanoparticles. Points are experiments, red line is for Freundlich model and green line
is for Langmuir model. Temperatures are a) 293 K, b) 328 K, and c) 353 K. Other
experimental conditions are pH=2.39, contact time = 24 h, and nanoparticle dose = 0.1
g per 10 mL.
Table 5. 2: Langmuir isotherm parameters obtained at different temperatures and pH,
KL:(L/mmol), Qm:(mmol/g)
.
Temperature
293 K 328 K 353 K
dyes pH KL Qm KL Qm KL Qm
CV 10.94 20.990 0.491 0.050 20.038 0.547 0.040 21.260 0.605 0.040
BCG 2.39 9.320 0.205 0.010 10.630 0.208 0.010 12.030 0.209 0.010
MR 2.36 2.430 0.380 0.030 2.480 0.400 0.030 2.980 0.416 0.030
31
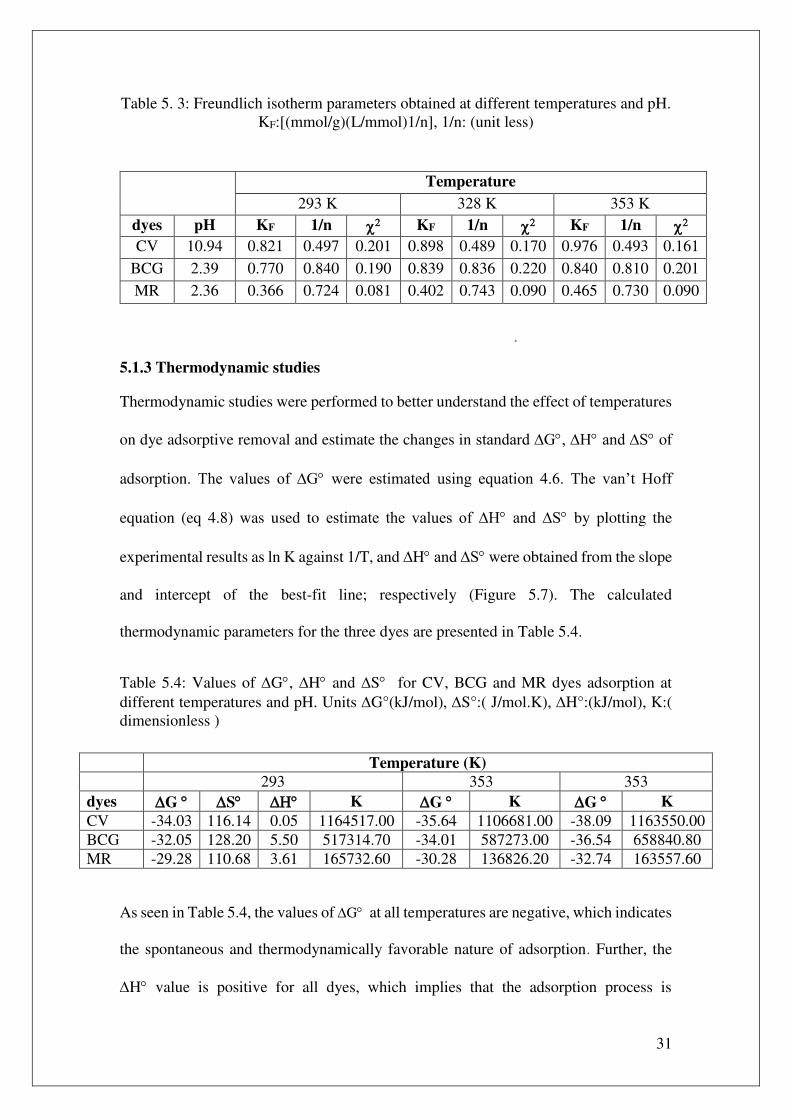
Table 5. 3: Freundlich isotherm parameters obtained at different temperatures and pH.
KF:[(mmol/g)(L/mmol)1/n], 1/n: (unit less)
Temperature
293 K 328 K 353 K
dyes pH KF 1/n KF 1/n KF 1/n
CV 10.94 0.821 0.497 0.201 0.898 0.489 0.170 0.976 0.493 0.161
BCG 2.39 0.770 0.840 0.190 0.839 0.836 0.220 0.840 0.810 0.201
MR 2.36 0.366 0.724 0.081 0.402 0.743 0.090 0.465 0.730 0.090
.
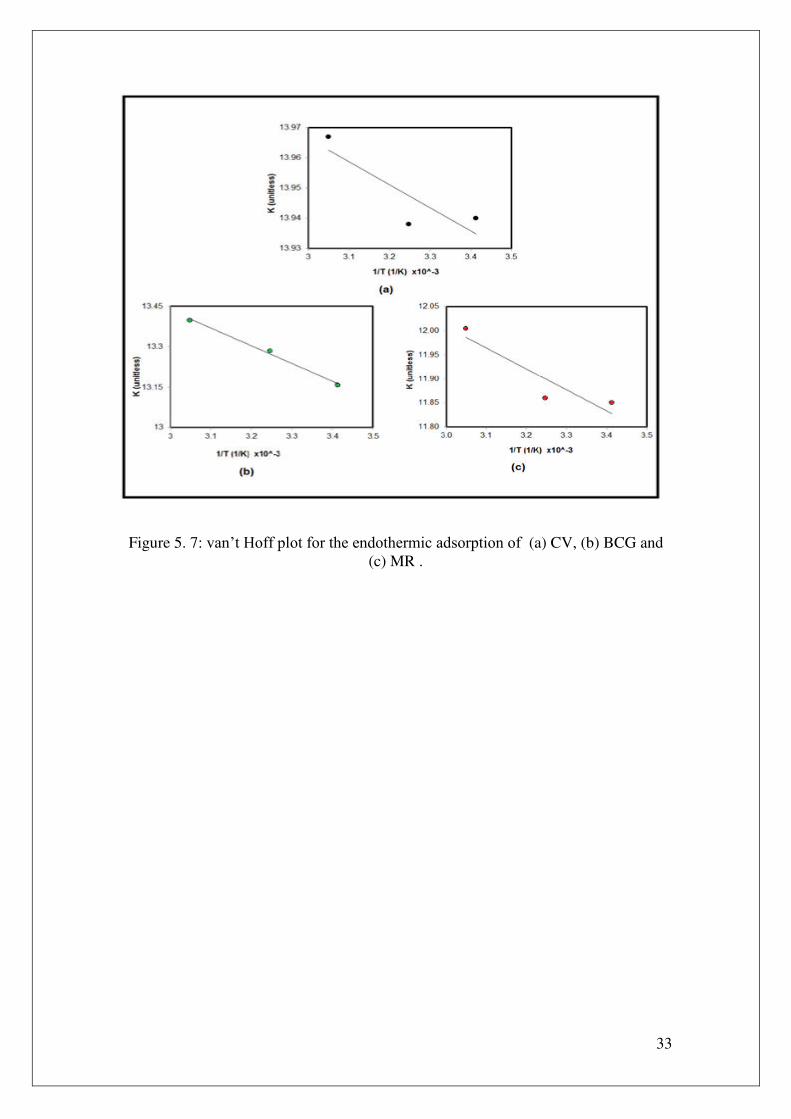
5.1.3 Thermodynamic studies
Thermodynamic studies were performed to better understand the effect of temperatures
on dye adsorptive removal and estimate the changes in standard ∆G, ∆H and ∆S of
adsorption. The values of ∆G were estimated using equation 4.6. The van’t Hoff
equation (eq 4.8) was used to estimate the values of ∆H and ∆S by plotting the
experimental results as ln K against 1/T, and ∆H and ∆S were obtained from the slope
and intercept of the best-fit line; respectively (Figure 5.7). The calculated
thermodynamic parameters for the three dyes are presented in Table 5.4.
Table 5.4: Values of ∆G, ∆H and ∆S for CV, BCG and MR dyes adsorption at
different temperatures and pH. Units G°(kJ/mol), S°:( J/mol.K), H°:(kJ/mol), K:(
dimensionless )
As seen in Table 5.4, the values of G at all temperatures are negative, which indicates
the spontaneous and thermodynamically favorable nature of adsorption. Further, the
H value is positive for all dyes, which implies that the adsorption process is
Temperature (K)
293 353 353
dyes G S K G K G K
CV -34.03 116.14 0.05 1164517.00 -35.64 1106681.00 -38.09 1163550.00
BCG -32.05 128.20 5.50 517314.70 -34.01 587273.00 -36.54 658840.80
MR -29.28 110.68 3.61 165732.60 -30.28 136826.20 -32.74 163557.60
32
endothermic in nature. The positive value of S may be attributed to the increase in
randomness at the solid–liquid interface, which results from the extra translational
entropy gained by the water molecules that were previously adsorbed onto the surface
of nanoparticles but then displaced by contaminants, leading to entropy generation
during dye adsorption. It should be noted that an adsorption reaction with G values
between - 20 kJ/mol and 0 kJ/mol indicates a spontaneous physical adsorption, while
an adsorption reaction with values between - 400 kJ/mol and - 80 kJ/mol indicates a
chemisorption, and values between -80 to -20, the adsorption process could be
attributed to a physical adsorption enhanced by a chemical effect (Yu et al., 2001). In
this study, the G values for all dyes were between – 29.28 kJ/mol and - 38.09 kJ/mol,
which suggests that the adsorption mechanism may be attributed to a physical
adsorption enhanced by a chemical effect (Yu et al., 2001). In addition, the fact that
H < 40 kJ/mol suggests a physical adsorption process (Yurdakoc, 2006). The findings
pertaining to the pH effect which confirms that adsorption mechanism is electrostatic.
33
Figure 5. 7: van’t Hoff plot for the endothermic adsorption of (a) CV, (b) BCG and
(c) MR .
34
5.2 Application of nanoparticles to real textile wastewater (RWW)
Because the nanoparticles were successfully tested for adsorptive removal of basic and
acidic dye from synthetic wastewater, hence the same procedure was employed for the
removal of dye from real textile wastewater. Thus, in this section the effect of contact
time, solution pH and temperatures on dye removal is presented. Further, the section
also presents the thermodynamic studies of dye adsorption from textile wastewater.
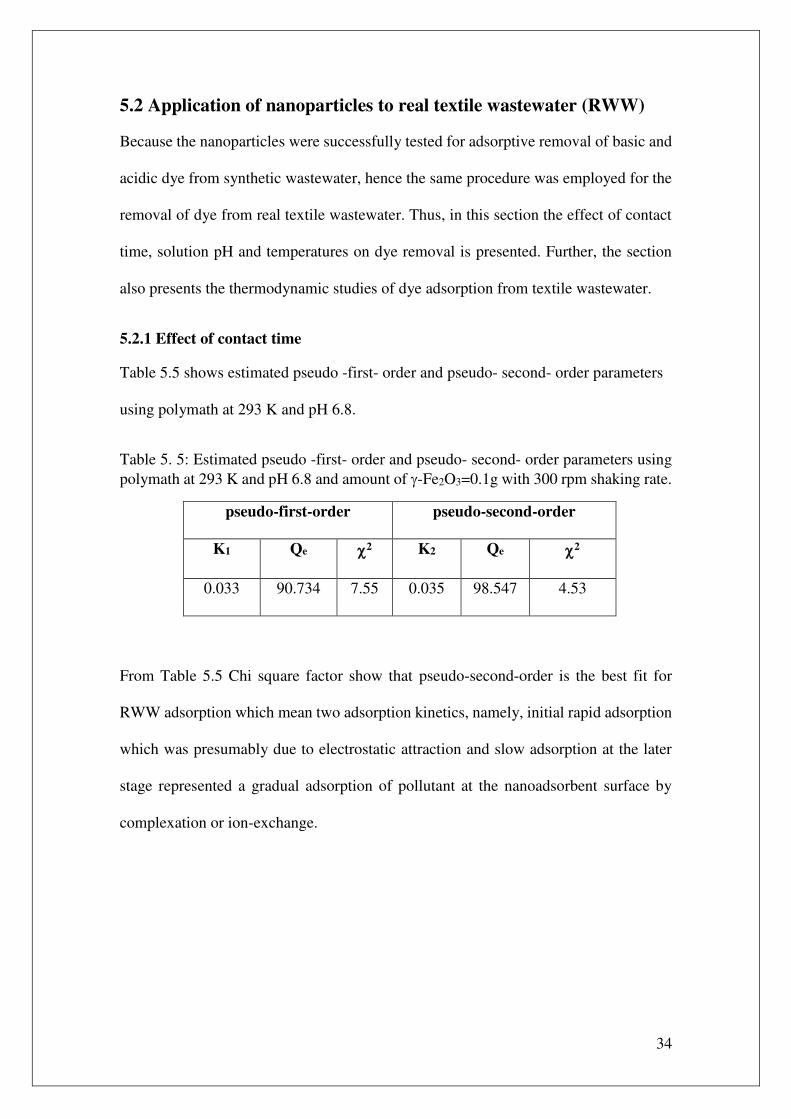
5.2.1 Effect of contact time
Table 5.5 shows estimated pseudo -first- order and pseudo- second- order parameters
using polymath at 293 K and pH 6.8.
Table 5. 5: Estimated pseudo -first- order and pseudo- second- order parameters using
polymath at 293 K and pH 6.8 and amount of -Fe2O3=0.1g with 300 rpm shaking rate.
pseudo-first-order pseudo-second-order
K1 Qe 2 K2 Qe 2
0.033 90.734 7.55 0.035 98.547 4.53
From Table 5.5 Chi square factor show that pseudo-second-order is the best fit for
RWW adsorption which mean two adsorption kinetics, namely, initial rapid adsorption
which was presumably due to electrostatic attraction and slow adsorption at the later
stage represented a gradual adsorption of pollutant at the nanoadsorbent surface by
complexation or ion-exchange.
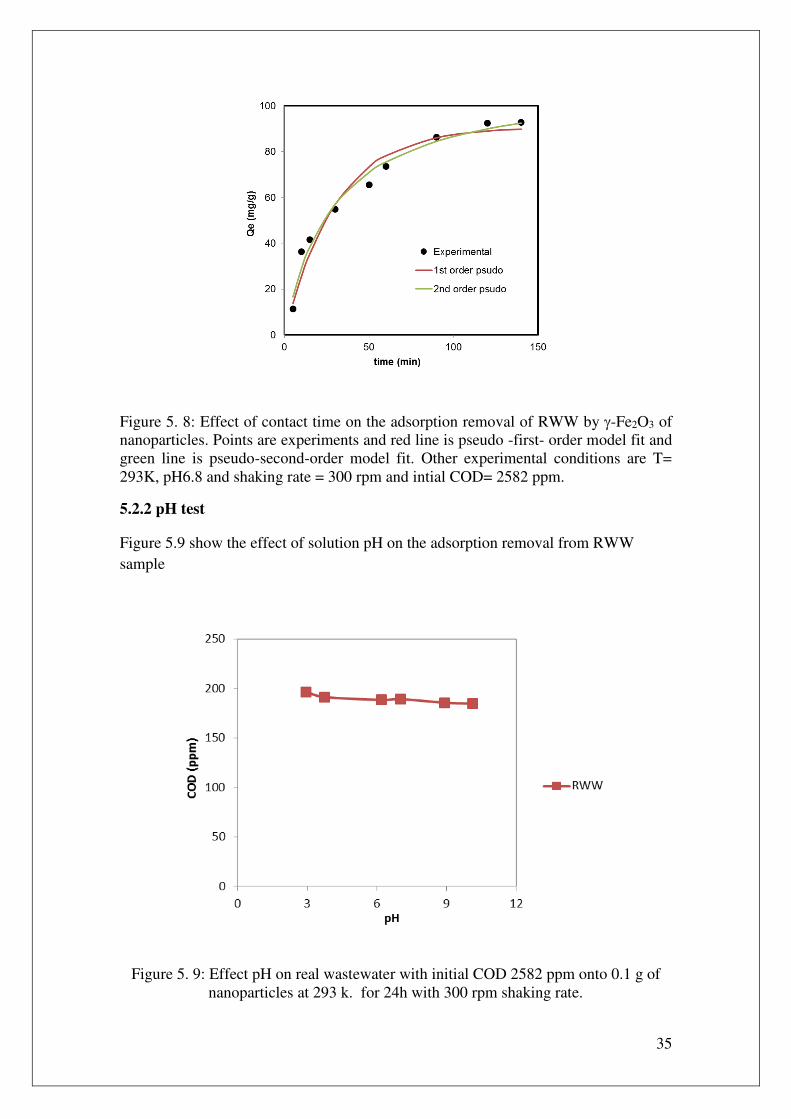
35
Figure 5. 8: Effect of contact time on the adsorption removal of RWW by -Fe2O3 of
nanoparticles. Points are experiments and red line is pseudo -first- order model fit and
green line is pseudo-second-order model fit. Other experimental conditions are T=
293K, pH6.8 and shaking rate = 300 rpm and intial COD= 2582 ppm.
5.2.2 pH test
Figure 5.9 show the effect of solution pH on the adsorption removal from RWW
sample
Figure 5. 9: Effect pH on real wastewater with initial COD 2582 ppm onto 0.1 g of
nanoparticles at 293 k. for 24h with 300 rpm shaking rate.
36
Due to their small size and large surface area, nanoparticles exhibit novel properties
which differ from those of bulk materials can act as multifunctional charge which mean
it can be positive in acidic solution and negative in basic solution and that what
happened with RWW as there is no change on adsorption with pH changes.
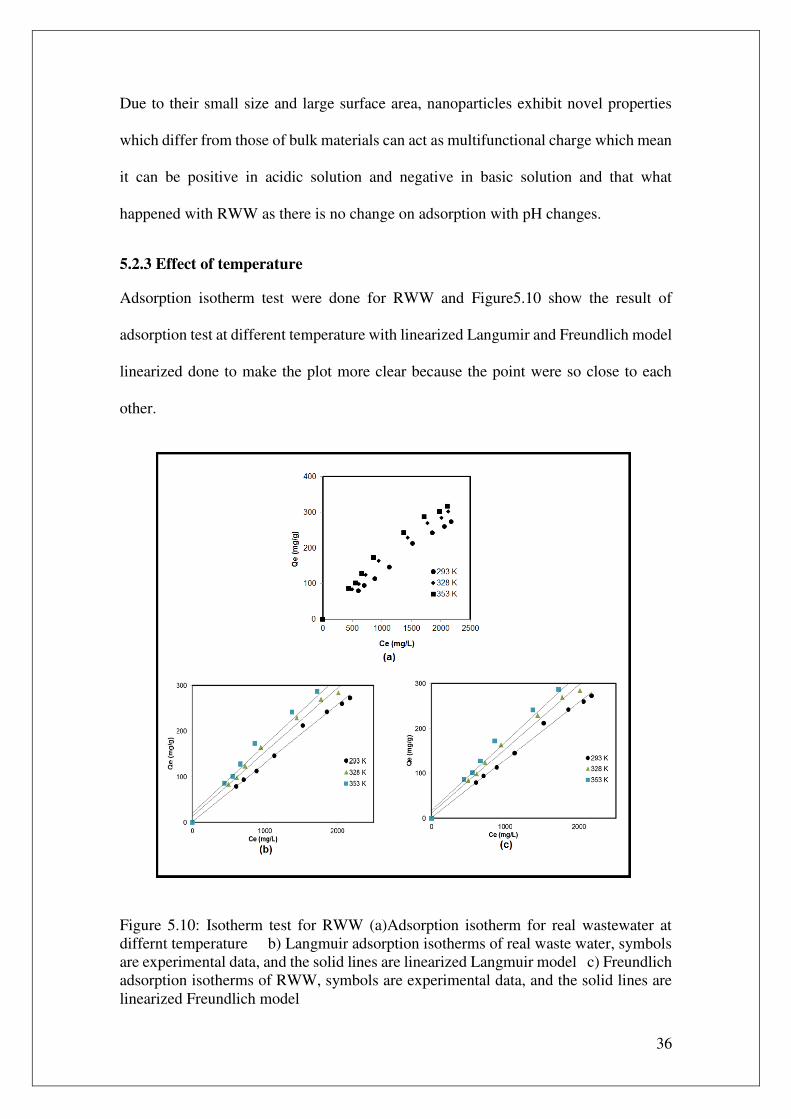
5.2.3 Effect of temperature
Adsorption isotherm test were done for RWW and Figure5.10 show the result of
adsorption test at different temperature with linearized Langumir and Freundlich model
linearized done to make the plot more clear because the point were so close to each
other.
Figure 5.10: Isotherm test for RWW (a)Adsorption isotherm for real wastewater at
differnt temperature b) Langmuir adsorption isotherms of real waste water, symbols
are experimental data, and the solid lines are linearized Langmuir model c) Freundlich
adsorption isotherms of RWW, symbols are experimental data, and the solid lines are
linearized Freundlich model
37
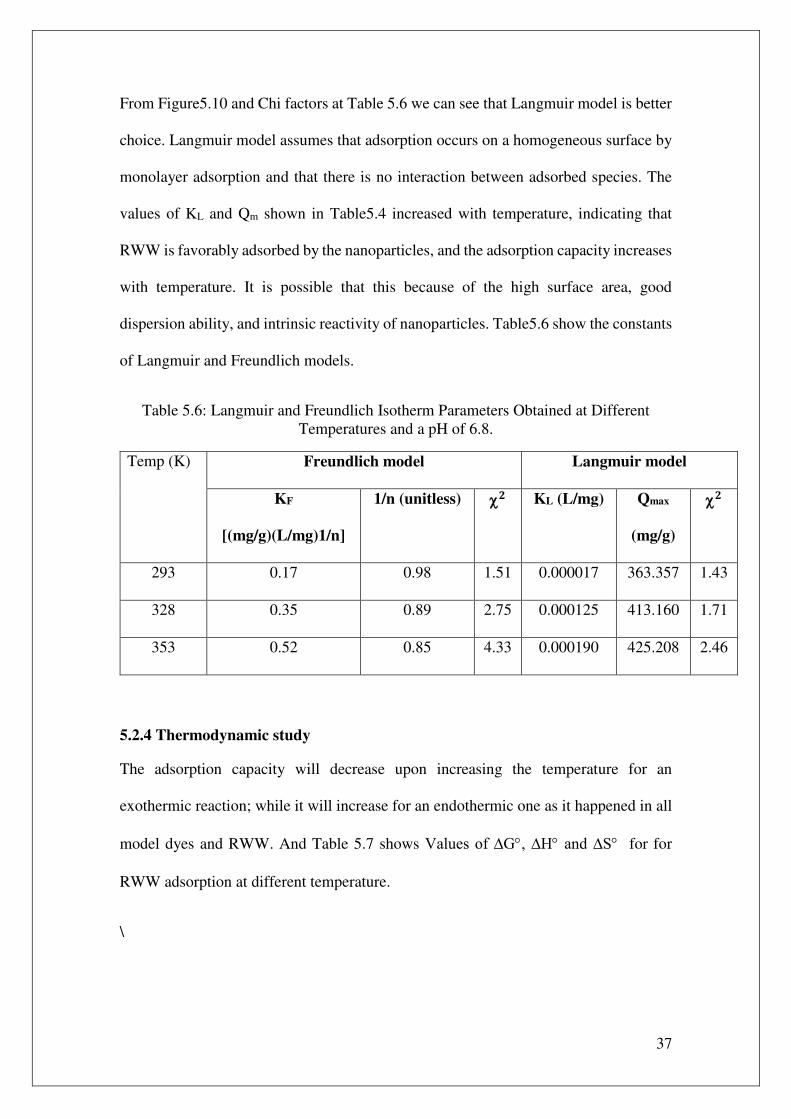
From Figure5.10 and Chi factors at Table 5.6 we can see that Langmuir model is better
choice. Langmuir model assumes that adsorption occurs on a homogeneous surface by
monolayer adsorption and that there is no interaction between adsorbed species. The
values of KL and Qm shown in Table5.4 increased with temperature, indicating that
RWW is favorably adsorbed by the nanoparticles, and the adsorption capacity increases
with temperature. It is possible that this because of the high surface area, good
dispersion ability, and intrinsic reactivity of nanoparticles. Table5.6 show the constants
of Langmuir and Freundlich models.
Table 5.6: Langmuir and Freundlich Isotherm Parameters Obtained at Different
Temperatures and a pH of 6.8.
Temp (K) Freundlich model Langmuir model
KF
[(mg/g)(L/mg)1/n]
1/n (unitless) � KL (L/mg) Qmax
(mg/g)
�
293 0.17 0.98 1.51 0.000017 363.357 1.43
328 0.35 0.89 2.75 0.000125 413.160 1.71
353 0.52 0.85 4.33 0.000190 425.208 2.46
5.2.4 Thermodynamic study
The adsorption capacity will decrease upon increasing the temperature for an
exothermic reaction; while it will increase for an endothermic one as it happened in all
model dyes and RWW. And Table 5.7 shows Values of ∆G, ∆H and ∆S for for
RWW adsorption at different temperature.
\
38
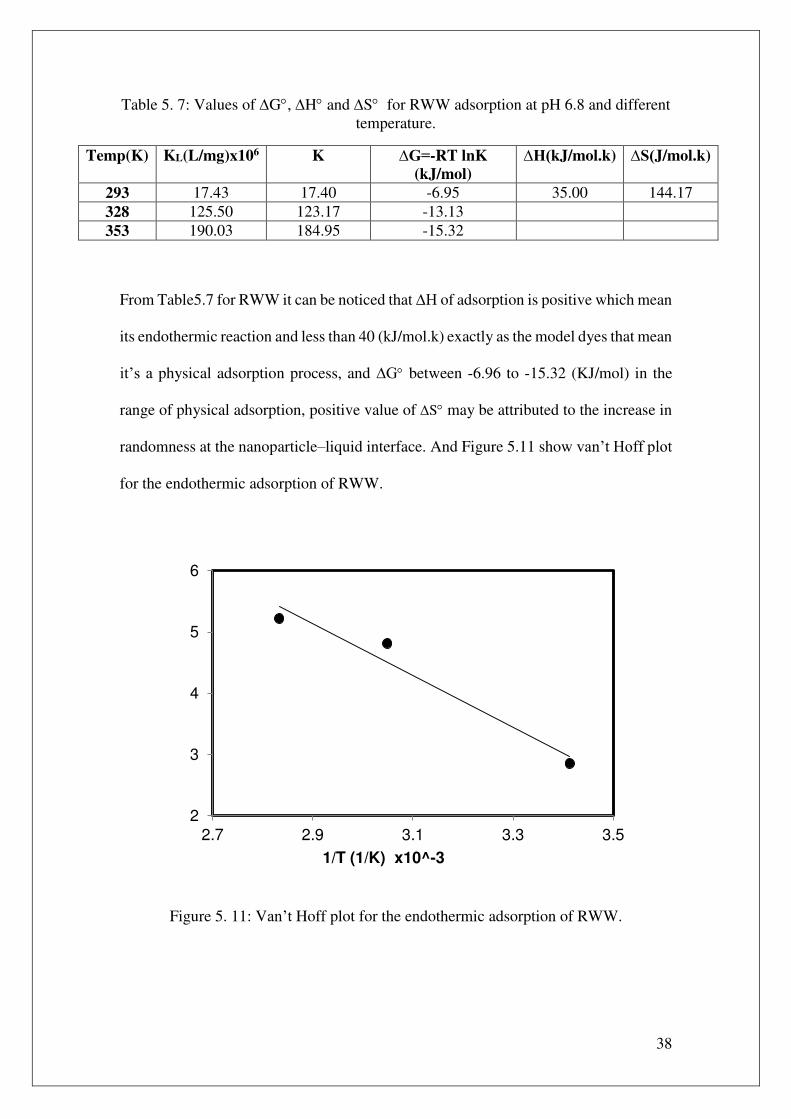
Table 5. 7: Values of G, H and S for RWW adsorption at pH 6.8 and different
temperature.
Temp(K) KL(L/mg)x106 K ∆G=-RT lnK
(kJ/mol)
∆H(kJ/mol.k) ∆S(J/mol.k)
293 17.43 17.40 -6.95 35.00 144.17
328 125.50 123.17 -13.13
353 190.03 184.95 -15.32
From Table5.7 for RWW it can be noticed that ∆H of adsorption is positive which mean
its endothermic reaction and less than 40 (kJ/mol.k) exactly as the model dyes that mean
it’s a physical adsorption process, and ∆G between -6.96 to -15.32 (KJ/mol) in the
range of physical adsorption, positive value of S may be attributed to the increase in
randomness at the nanoparticle–liquid interface. And Figure 5.11 show van’t Hoff plot
for the endothermic adsorption of RWW.
Figure 5. 11: Van’t Hoff plot for the endothermic adsorption of RWW.
2
3
4
5
6
2.7 2.9 3.1 3.3 3.5
1/T (1/K) x10^-3
39
5.2.5 Effect of contaminants
As wastewater effluent contains more than one pollutant, the presence of other
pollutants may interfere in the removal efficiency of an individual one. As a result, the
effect of coexisting pollutants should be addressed when conducting an adsorption
study. This test should give us good expression about the nature of the particles surface,
and if it can effect on the adsorption itself. RWW have been tested by A.A device for
heavy metal test Cr+2 found at 0.0511 ppm and after the adsorption become 0.0011 ppm
which mean that more than 97% of Cr+2 removed.
40
CHAPTER SIX
CONCLUSIONS AND RECOMMENDATION FOR FUTURE WORK
This chapter presents the conclusions of this study and highlights the recommendations
for future work.
6.1 Conclusions
In this work, the adsorption mechanism by magnetic nanoparticles applied on actual
textile wastewater and another different models of pure dyes.
6.1.1 Dyes removal
-Fe2O3 nanoadsorbents were employed successfully for the removal of different
model dyes (CV, MR and BCG). The adsorption rate was very fast and equilibrium was
achieved within times of less than 50 min. The adsorption is highly dependent on the
dye concentration, solution pH, and temperature. Lower solution pH ” <7 ” favored the
adsorption of anionic dyes such (MR and BCG) and higher pH “>7”for cationic dye
(CV). For all dyes the adsorption increased with increasing initial concentration and
increasing temperature. The adsorption isotherms were also determined and were
appropriately described by both the Langmuir and Freundlich models. The standard
enthalpy change, H, for the adsorption process were positive and less than <40
kJ/mol confirmed the endothermic and physical adsorption, while the standard Gibbs
free energy change in the range of -29.28 to -38.09 kJ/mol. This confirmed that the
adsorption mechanism may be attributed to a physical adsorption enhanced by a
chemical. The positive standard entropy change S confirmed the increase in
randomness at the solid solution interface.
6.1.2 Real wastewater RWW
Same type of nanoparticles were applied on the real wastewater obtained from Al-Aqad
Textile local factory. Again, the adsorption was fast and equilibrium was achieved in
41
less than 90 min, which slightly higher than the pure dyes we refer this to the multitude
of the component in the real wastewater which contain coexisting, contaminants and
dirt’s. The adsorption increased with increasing initial concentration and increasing
temperature. The adsorption fit very well with Langmuir model, confirm the
homogenous surface of nanoparticles. The thermodynamic study it was endothermic
where H, was positive. G were calculated to be in the range of -6.95 to -15.32
kJ/mol which indicates a spontaneous physical adsorption. Standard entropy S,
confirmed the increase in randomness at the solid solution interface too.
The study confirms that -Fe2O3 nanoparticles could be employed as an alternative
technology for the removal of color from textile wastewater effluent. This nanoparticles
technology is expected to be cost-effective as nanoparticles could be employed in-situ
or can be easily in corporation with the conventional treatment technology.
42
6.2 Recommendations for Future Work
Preparation of nanoparticles in-situ (i.e., in the real textile wastewater sample) could
be tested. This would favor the cost-effectiveness of the process.
Running the experiments in continuous flow mode (i.e., packed bed column) could
provide more valuable results and better understanding of the future application on
the integration of nanoparticle technology with the conventional wastewater
treatment processes.
Coupling the adsorption with photo-catalysis could be an interesting future study as
well. This would help in getting red of the adsorbed contaminants and regeneration
of the nanoparticles.
There exist other wastewater effluent from local industries like olive mill, tanneries
and stone cutting that could be treated with the nanoparticle technology.
Testing another type of nanoparticles could be advantageous for widen the
application of nanoparticles.
43
References
ANDREI A. Z. 2007. Ion exchange materials: properties and applications. Elsevier.
ISBN 978-0-08-044552-6.
ANLIKER, R. & MOSER, P. 1987. The limits of bioaccumulation of organic pigments
in fish: their relation to the partition coefficient and the solubility in water octanol.
Ecotoxicol. Environ. Saf, 13: 43-52.
Authority, Palestinian Water. 2012. Palestinian Water Sector: Status Summary Report
September 2012. Ramallah : Palestinian Water Authority, 2012.
B. DAWNEY & J.M. PEARCE 2012 “Optimizing Solar Water Disinfection (SODIS)
Method by Decreasing Turbidity with NaCl”, The Journal of Water, Sanitation, and Hygiene for Development .
BALISTRIERI, L. S. & MURRAY, J. W. 1981. The surface chemistry of goethite (a
FeOOH) in major ion seawater. American Journal of Science, 281, 788-806.
BANAT, I. M., NIGAM, P., SINGH, D., & MARCHANT, R. 1996. Microbial
decolorization of textiledye- containing effluents: A review. Bioresource Technology,
58, 217–227.
CHEN, J. & REGLI, S. 2002. "Disinfection Practices and Pathogen Inactivation in ICR
Surface Water Plants." Information Collection Rule Data Analysis. Denver: American
Water Works Association. McGuire, Michael J., McLain, Jennifer L. and Obolensky,
Alexa, eds. pp. 376-378. ISBN 1-58321-273-6
Christie J. G. 2003. Transport processes and separation process principles : (includes
unit operations) (4th ed. ed.). Upper Saddle River, NJ: Prentice Hall Professional
Technical Reference. ,0-13-101367-X.
COOPER, P. 1993. Removing color from dyehouse wastewaters - a critical review of
technology available. J. Soc. Dyers Col., 109: 97-101.
CORREIA, V.M., STEPHENSON, T. AND JUDD, S.J. (1994). Characterization of
textile wastewaters: a review. Environ. Technol. 15 (917-919).
CRITTENDEN J.C., RHODES TRUSSELL R., HAND D.W., HOWE K.J.,
TCHOBANOGLOUS G., 2005, Water treatment: Principles and design, 2nd edition,
John Wiley & Sons, Inc.
CRITTENDEN, J. C., et. al., eds. (2005). Water Treatment: Principles and Design. 2nd
Edition. Hoboken, NJ:Wiley. ISBN 0-471-11018-3
DREXLER, K. ERIC, I. 1986. Engines of Creation: The Coming Era of
Nanotechnology. Doubleday. ISBN 0-385-19973-2.
44
ENZLER, S.M. 1998. history-water-treatment. lenntech. [Online] 1998. [Cited: 4 5,
2013.] http://www.lenntech.com/history-water-treatment.html.
FEWSON, C.A. 1998. Biodegradation of xenobiotic and other persistent compounds:
causes of recalcitrance. Trends Biotechnol., 6 (148-153).
FREUNDLICH HMF. Uber die adsorption in losungen. Z. Phys. Chem., 1906; 57(A):
385–470
Health risks from drinking demineralised water. Rolling revision of the WHO
Guidelines for drinking-water quality. World Health Organization, Geneva, 2004
HU J., CHEN, G. & LO, I.M. 2006. Selective Removal of Heavy Metals from Industrial
Wastewater Using Maghemite Nanoparticle: Performance and Mechanisms. J. Environ.
Eng. 2006; 132(7): 709-715.
JASKOT, R.H. & COSTA D.L. 1994. Toxicity of an anthraquinone violet dye mixture
following inhalation exposure, intratracheal instillation gavage. Fundam. Appl.
Toxicol., 22 (103-112).
KAWAMURA, SUSUMU. 2000. Integrated Design and Operation of Water Treatment
Facilities. 2nd Edition. New York:Wiley. pp. 74-5, 104. ISBN 0-471-35093-1
KIELY, G. 1997. Environmental Engineering. McGraw Hill Europe. May 1997.pp.990
LANGMUIR, D.J. 1916 The constitution and fundamental properties of solids and
liquids. Part I. solids. J. American Chem. Society 1916; 38(11): 2221-2295.
LORENC-GRABOWSKA ,E. , GRA_ZYNA, G. 2007. Adsorption characteristics of
Congo Red on coalbased mesoporous activated carbon; Dyes and Pigments 74 (2007)
34-40
MIRANDA, M.L., Kim, M.A, HULL A., 2007. "Changes in Blood Lead Levels
Associated with Use of Chloramines in Water Treatment Systems" 03/13/2007.
Environmental Health Perspectives.
NASSAR, N. N. & RINGSRED, A. 2012. Rapid Adsorption of Methylene Blue from
Aqueous Solutions by Goethite Nanoadsorbents. Environmental Engineering Science,
29, 790-797.
NASSAR, N. N. 2010a. Kinetics, Mechanistic, Equilibrium, and Thermodynamic
Studies on the Adsorption of Acid Red Dye from Wastewater by γ-Fe2O3
Nanoadsorbents. Separation Science and Technology, 45, 1092-1103.
NASSAR, N. N. 2010b. Rapid removal and recovery of Pb(II) from wastewater by
magnetic nanoadsorbents. Journal of Hazardous Materials, 184, 538-546.
NASSAR, N. N. 2012a. Kinetics, equilibrium and thermodynamic studies on the
adsorptive removal of nickel, cadmium and cobalt from wastewater by
45
superparamagnetic iron oxide nanoadsorbents. The Canadian Journal of Chemical
Engineering, 90, 1231-1238.
NASSAR, N. N. 2012b. Iron Oxide Nanoadsorbents for Removal of Various Pollutants
from Wastewater: An Overview. In: BHATNAGAR, A. (ed.) Application of
Adsorbents for Water Pollution Control. Bentham Science Publishers.
NEEMANN, J. HULSEY, R. & DAVID, E.2004. “Controlling Bromate Formation During Ozonation with Chlorine and Ammonia.” Journal American Water Works Association.
NGOMSIK A, BEE A., DRAYE M, COTE G., AND CABUIL V. Magnetic nano-
andmicroparticles for metal removal and environmental applications: a review.
Comptes Rendus Chimie, 2005; 8(6-7): 963-970.
NIKULINA, G.L., DEVEIKIS, D.N AND PYSHNOV, G. (1995). Toxicity dynamics
of anionic dyes in air of a work place and long term effects after absorption through
skin. Med. Tr. Prom. Ekol., 6 (25-28).
O'NEILL, C., HAWKES, F.R., HAWKES, D.L., LOURENCO, N.D., PINHEIRO,
H.M. AND DELEE, W. (1999) Colour in textile effluents-sources, measurement,
discharge consents and simulation: a review. J. Chem.
PEREZ, J.M. (2007). Iron oxide nanoparticles: Hidden talent. Nat. Nanotechnol. 2, 535.
PRADEEP, ANSHUP T. 2011 Noble metal nanoparticles for water purification: A
critical review(2009):6448-49.Web.14Nov.2011.
<http://www.dstuns.iitm.ac.in/listpdf/181.pdf>.
PRAKASH, A. AND SOLANK, S. (1993). Sorption and desorption behavior of phenol
and chlorophenoles on guar derivatives: reclamation of textile effluents, Research and
Industry, 38 (35-93).
RAFI, F., FRANKLIN, W. AND CERNIGLIA, C.E. (1990). azoreductase activity of
anaerobic bacteria isolated from human intestinal microflora. Appl. Environ.
Microbiol., 56:2146-2151.
REEVES, T.G. (1986). "Water fluoridation: a manual for engineers and technicians"
(PDF). Centers for Disease Control.
ROSE, A. A. at al. (2006 February). "Solar disinfection of water for diarrhoeal
prevention in southern India". Arch Dis Child.
RUDRAKE, A., KARAN, K., AND HORTON, J.H. (2009). A combined QCM and
XPS investigation of asphaltene adsorption on metal surfaces. J. Colloid Interf. Sci.
332, 22.
SAVAGE, N. AND MAMADOU S. D. 2005. Nanomaterials and water purification: Opportunities and challenges. N.p.: Springer, 2005. 337-39. Print.
46
SHAW, D.J.1992 Introduction to colloid and surface chemistry. 1992: Oxford:
Butterworth- Heinemann.
SMITH, J.M., VANNESS, H.C., AND ABBOTT, M.M. (2005). Introduction to
Chemical Engineering Thermodynamics. New York: McGraw Hill.
SU, J.C. AND HORTON, J.J. (1998). Alergic contact dermatitis from azo dyes.
Autralas. J. Dermatol., 39 (1) 48-49.
T.EUGENE. (2010). Nanotechnology in water treatment applications. norfulk : caistar
acadimic press, 2010. 978-1-904455-66-0.
The World Water Organization . 2011. Water around the world report.
TIWARI, DHERMENDRA K., J. BEHARI, AND PRASENJIT SEN (2008)
"Application of Nanoparticles in Waste Water Treatment." World Applied Sciences
Journal 3 (3) (2008): 417-19. Web. 12 Nov. 2011.
<http://www.idosi.org/wasj/wasj3(3)/11.pdf>.
United States Environmental Protection Agency (EPA)(1990). Cincinnati, OH.
"Technologies for Upgrading Existing or Designing New Drinking Water Treatment
Facilities." Document no. EPA/625/4-89/023.
YU, Y., ZHUANG, Y.-Y., AND WANG, Z.-H. (2001). Adsorption of water-soluble
dye onto functionalized resin. J. Colloid Interf. Sci. 242, 288.
ZOLLINGER, H. (1987) Color Chemistry- Synthesis, Properties and Application of
Organic Dyes and Pigments. VCH New York, PP. 92-102.
Recommended