Drinking Water Quality Management Plan (DWQMP) report
2019-2020
SPID 491
Name South Burnett Regional Council
Address PO Box 336
Kingaroy QLD 4610
Telephone 07 4189 9100
Email [email protected]
Website www.southburnett.qld.gov.au
LGA covered by this plan South Burnett Regional Council
Water Supply Schemes covered by this plan Blackbutt, Kingaroy, Murgon, Nanango, Proston, Wondai, Yallakool, Boondooma Dam
2
Glossary of terms
ADWG 2011 Australian Drinking Water Guidelines (2011). Published by the National Health and Medical Research Council of Australia
DWQMP Drinking Water Quality Management Plan
E. coli Escherichia coli, a bacterium which is considered to indicate the presence of faecal contamination and therefore potential health risk
HACCP Hazard Analysis and Critical Control Points certification for protecting drinking water quality.
mg/L Milligrams per litre
SBRC South Burnett Regional Council
NTU Nephelometric Turbidity Units
MPN/100mL Most probable number per 100 millilitres
CFU/100mL Colony forming units per 100 millilitres
< Less than
> Greater than
WTP Water Treatment Plant
3
1. Introduction This report documents the performance of South Burnett Regional Council's drinking water service with respect to water quality and performance in implementing the actions detailed in the drinking water quality management plan (DWQMP) as required under the Water Supply (Safety and Reliability) Act 2008 (the Act).
The report assists the Regulator to determine whether the approved DWQMP and any approval conditions have been complied with and provides a mechanism for providers to report publicly on their performance in managing drinking water quality.
This report has been prepared in accordance with the Water Industry Regulatory Reform – drinking water quality management plan report factsheet published by the Department of Energy and Water Supply, Queensland, accessible at www.dews.qld.gov.au.
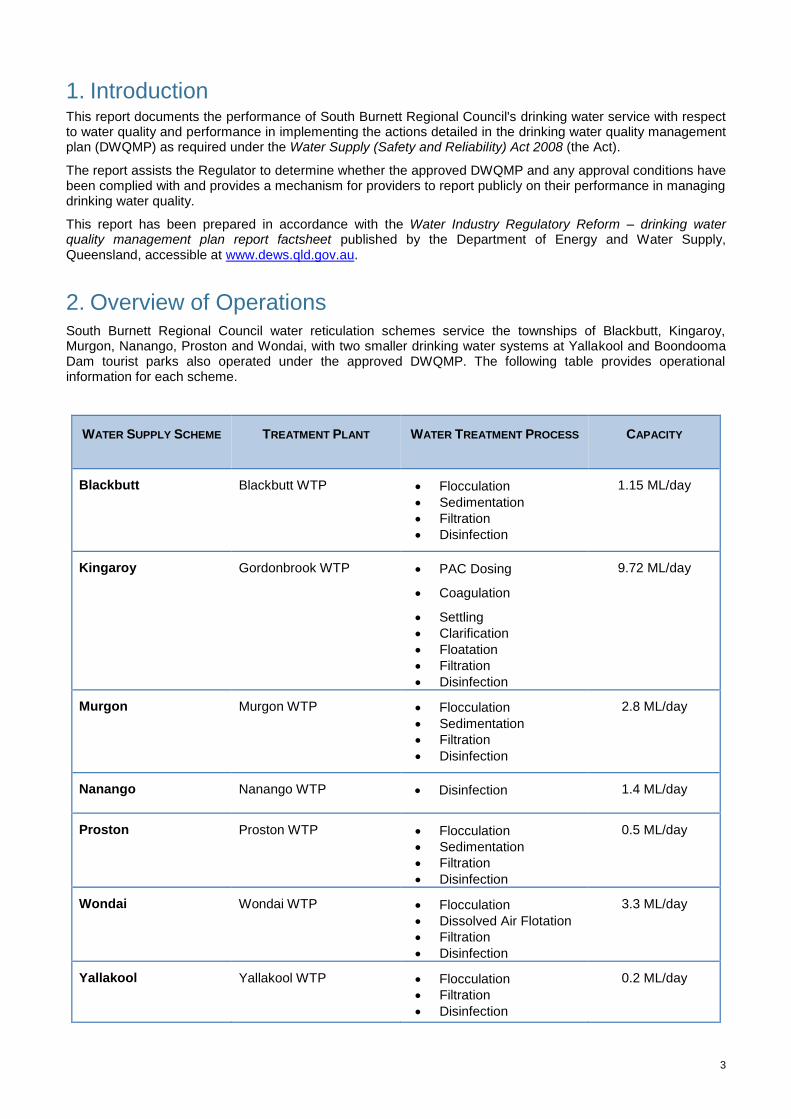
2. Overview of Operations South Burnett Regional Council water reticulation schemes service the townships of Blackbutt, Kingaroy, Murgon, Nanango, Proston and Wondai, with two smaller drinking water systems at Yallakool and Boondooma Dam tourist parks also operated under the approved DWQMP. The following table provides operational information for each scheme.
WATER SUPPLY SCHEME TREATMENT PLANT WATER TREATMENT PROCESS CAPACITY
Blackbutt Blackbutt WTP Flocculation
Sedimentation
Filtration
Disinfection
1.15 ML/day
Kingaroy Gordonbrook WTP PAC Dosing
Coagulation
Settling
Clarification
Floatation
Filtration
Disinfection
9.72 ML/day
Murgon Murgon WTP Flocculation
Sedimentation
Filtration
Disinfection
2.8 ML/day
Nanango Nanango WTP Disinfection 1.4 ML/day
Proston Proston WTP Flocculation
Sedimentation
Filtration
Disinfection
0.5 ML/day
Wondai Wondai WTP Flocculation
Dissolved Air Flotation
Filtration
Disinfection
3.3 ML/day
Yallakool Yallakool WTP Flocculation
Filtration
Disinfection
0.2 ML/day
4
Water is disinfected with chlorine (liquid sodium hypochlorite) before entering the reticulation system and is transferred from the treatment plants to storage reservoirs through the reticulation systems.
SBRC provided fluoridated water for five schemes, those being Blackbutt, Kingaroy, Murgon, Nanango and Wondai. However, Council voted to cease fluoridation of all water supplies from January 2013. The fluoride plants have been decommissioned, and no fluoride has been stored onsite since the decision to cease fluoridation.
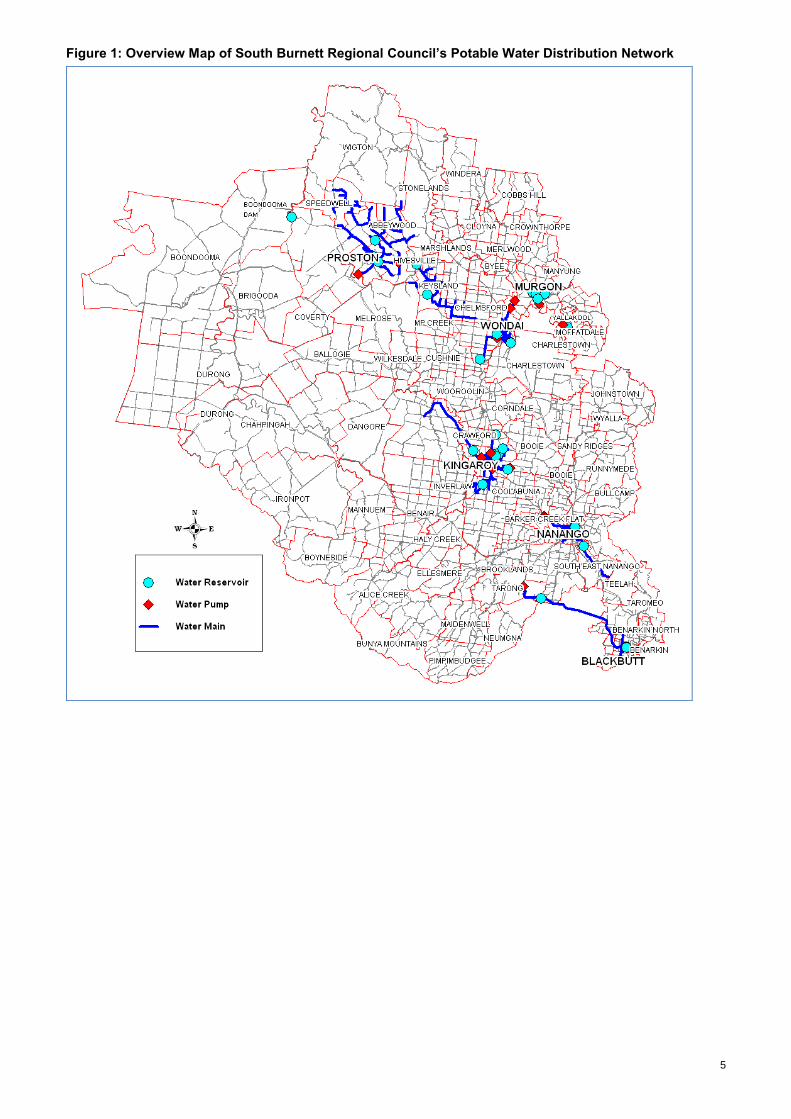
South Burnett Regional Council maintains in excess of 550 kilometres of water mains supplying approximately 9,730 properties through the South Burnett. The networks also comprise a total of 31 pump stations and 31 reservoirs with a total capacity of approximately 21.21 ML, and 10 re-chlorination stations. Figure 1 shows the extent of the South Burnett Regional Councils potable water distribution system; including areas serviced and the location of drinking water infrastructure.
Boondooma Dam Boondooma Dam WTP Flocculation
Sedimentation
Filtration
Disinfection
0.12 ML/day
5
Figure 1: Overview Map of South Burnett Regional Council’s Potable Water Distribution Network
6
3. Actions taken to implement the DWQMP
3.1 Progress in implementing the risk management improvement program.
All of the risks identified during the risk assessment workshop were reduced to either a low or medium level with the mitigation measures in place and risk reduction actions identified. Details of the outcomes of the propose risk reduction actions are detailed in Table 1.
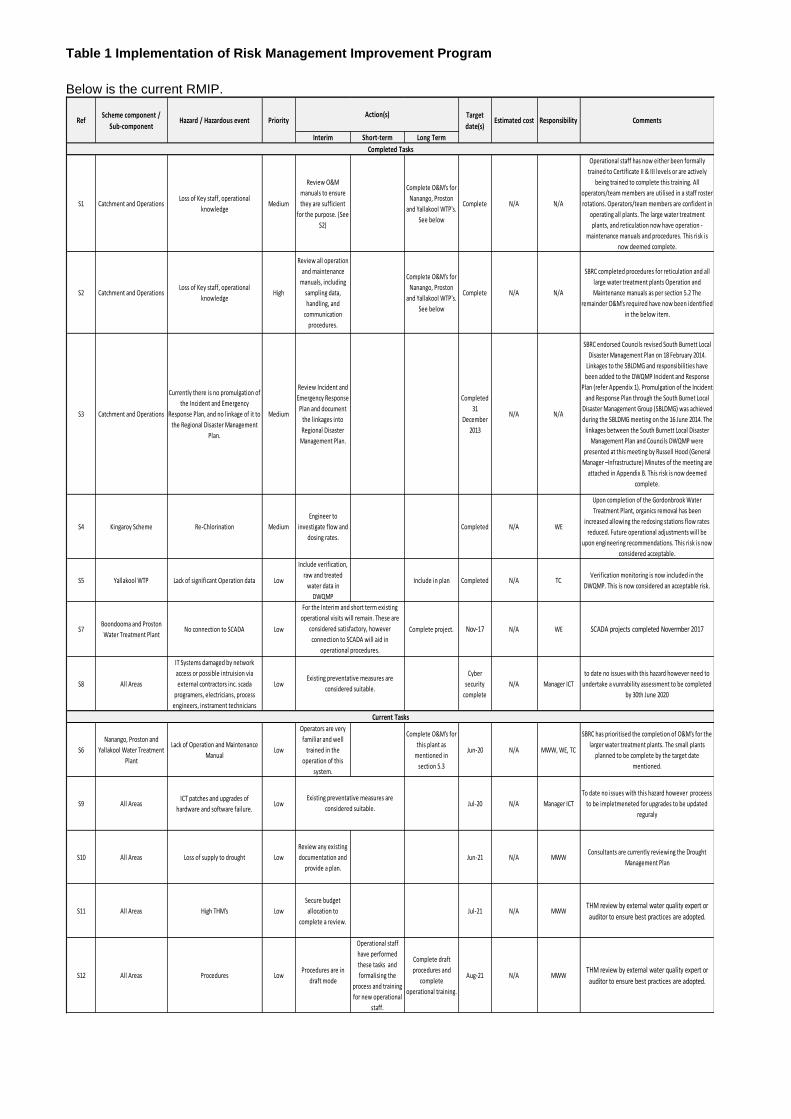
Table 1 Implementation of Risk Management Improvement Program
Below is the current RMIP.
Interim Short-term Long Term
S1 Catchment and OperationsLoss of Key staff, operational
knowledgeMedium
Review O&M
manuals to ensure
they are sufficient
for the purpose. (See
S2)
Complete O&M's for
Nanango, Proston
and Yallakool WTP's.
See below
Complete N/A N/A
Operational staff has now either been formally
trained to Certificate II & III levels or are actively
being trained to complete this training. All
operators/team members are utilised in a staff roster
rotations. Operators/team members are confident in
operating all plants. The large water treatment
plants, and reticulation now have operation -
maintenance manuals and procedures. This risk is
now deemed complete.
S2 Catchment and OperationsLoss of Key staff, operational
knowledgeHigh
Review all operation
and maintenance
manuals, including
sampling data,
handling, and
communication
procedures.
Complete O&M's for
Nanango, Proston
and Yallakool WTP's.
See below
Complete N/A N/A
SBRC completed procedures for reticulation and all
large water treatment plants Operation and
Maintenance manuals as per section 5.2 The
remainder O&M's required have now been identified
in the below item.
S3 Catchment and Operations
Currently there is no promulgation of
the Incident and Emergency
Response Plan, and no linkage of it to
the Regional Disaster Management
Plan.
Medium
Review Incident and
Emergency Response
Plan and document
the linkages into
Regional Disaster
Management Plan.
Completed
31
December
2013
N/A N/A
SBRC endorsed Councils revised South Burnett Local
Disaster Management Plan on 18 February 2014.
Linkages to the SBLDMG and responsibilities have
been added to the DWQMP Incident and Response
Plan (refer Appendix 1). Promulgation of the Incident
and Response Plan through the South Burnet Local
Disaster Management Group (SBLDMG) was achieved
during the SBLDMG meeting on the 16 June 2014. The
linkages between the South Burnett Local Disaster
Management Plan and Councils DWQMP were
presented at this meeting by Russell Hood (General
Manager –Infrastructure) Minutes of the meeting are
attached in Appendix B. This risk is now deemed
complete.
S4 Kingaroy Scheme Re-Chlorination Medium
Engineer to
investigate flow and
dosing rates.
Completed N/A WE
Upon completion of the Gordonbrook Water
Treatment Plant, organics removal has been
increased allowing the redosing stations flow rates
reduced. Future operational adjustments will be
upon engineering recommendations. This risk is now
considered acceptable.
S5 Yallakool WTP Lack of significant Operation data Low
Include verification,
raw and treated
water data in
DWQMP
Include in plan Completed N/A TCVerification monitoring is now included in the
DWQMP. This is now considered an acceptable risk.
S7Boondooma and Proston
Water Treatment PlantNo connection to SCADA Low Complete project. Nov-17 N/A WE SCADA projects completed Novermber 2017
S8 All Areas
IT Systems damaged by network
access or possible intruision via
external contractors inc. scada
programers, electricians, process
engineers, instrament technicians
Low
Cyber
security
complete
N/A Manager ICT
to date no issues with this hazard however need to
undertake a vunrability assessment to be completed
by 30th June 2020
S6
Nanango, Proston and
Yallakool Water Treatment
Plant
Lack of Operation and Maintenance
ManualLow
Operators are very
familiar and well
trained in the
operation of this
system.
Complete O&M's for
this plant as
mentioned in
section 5.3
Jun-20 N/A MWW, WE, TC
SBRC has prioritised the completion of O&M's for the
larger water treatment plants. The small plants
planned to be complete by the target date
mentioned.
S9 All AreasICT patches and upgrades of
hardware and software failure.Low Jul-20 N/A Manager ICT
To date no issues with this hazard however proceess
to be impletmeneted for upgrades to be updated
reguraly
S10 All Areas Loss of supply to drought Low
Review any existing
documentation and
provide a plan.
Jun-21 N/A MWWConsultants are currently reviewing the Drought
Management Plan
S11 All Areas High THM's Low
Secure budget
allocation to
complete a review.
Jul-21 N/A MWWTHM review by external water quality expert or
auditor to ensure best practices are adopted.
S12 All Areas Procedures LowProcedures are in
draft mode
Operational staff
have performed
these tasks and
formalising the
process and training
for new operational
staff.
Complete draft
procedures and
complete
operational training.
Aug-21 N/A MWWTHM review by external water quality expert or
auditor to ensure best practices are adopted.
Existing preventative measures are
considered suitable.
Existing preventative measures are
considered suitable.
Current Tasks
For the Interim and short term existing
operational visits will remain. These are
considered satisfactory, however
connection to SCADA will aid in
operational procedures.
Comments
Completed Tasks
Estimated cost ResponsibilityAction(s)
RefScheme component /
Sub-componentHazard / Hazardous event Priority
Target
date(s)
3.2 Amendments made to the DWQMP
Operational monitoring is conducted as per the DWQMP Version 7.1 2019. An increase in some additional water quality parameters have been implemented in a few locations. These minor changes have not influenced or required any changes to the risk evaluations.
3.2 Amendments made to the DWQMP Risk Management Improvement Program
Amendments made to the RMIP are currently under review.
4. Compliance with water quality criteria for drinking water The water quality criteria mean health guideline values in the most current Australian Drinking Water Guidelines, as well as the standards in the Public Health Regulation 2005.
Results from water quality analysis is located in Appendix A.
5. Notifications to the Regulator under sections 102 and 102A of the Act
This financial year there was one instances where the Regulator was notified under sections 102 or 102A of the Act. None of these notifications involved the detection of E. coli – an organism that may not directly represent a hazard to human health but indicates the presence of recent faecal contamination.
The non-compliance with water quality criteria caused by THM’s. None of these incidents required South Burnett Regional Council to issue a boil water or do not drink notice in the communities.
Non-compliances with the water quality criteria and corrective and preventive actions undertaken Incident Description: DWI-7-491-73 Kingaroy Scheme
The 1st non-compliance was detection of high THM’s detected 4/6/19 of 320 ug/L at the Taabinga Reservoir. Other reservoirs also had elevated levels. This incident carried into the reporting year 19/20.
Corrective and Preventative Actions: Disinfection residuals are continuing to be optimised to reduce disinfection by products. Water storage levels have been reduced in capacity to reduce water age in the networks. Due to drought conditions, a rise in Bromide levels in the raw water supply is resulting in elevated THM’s.
9
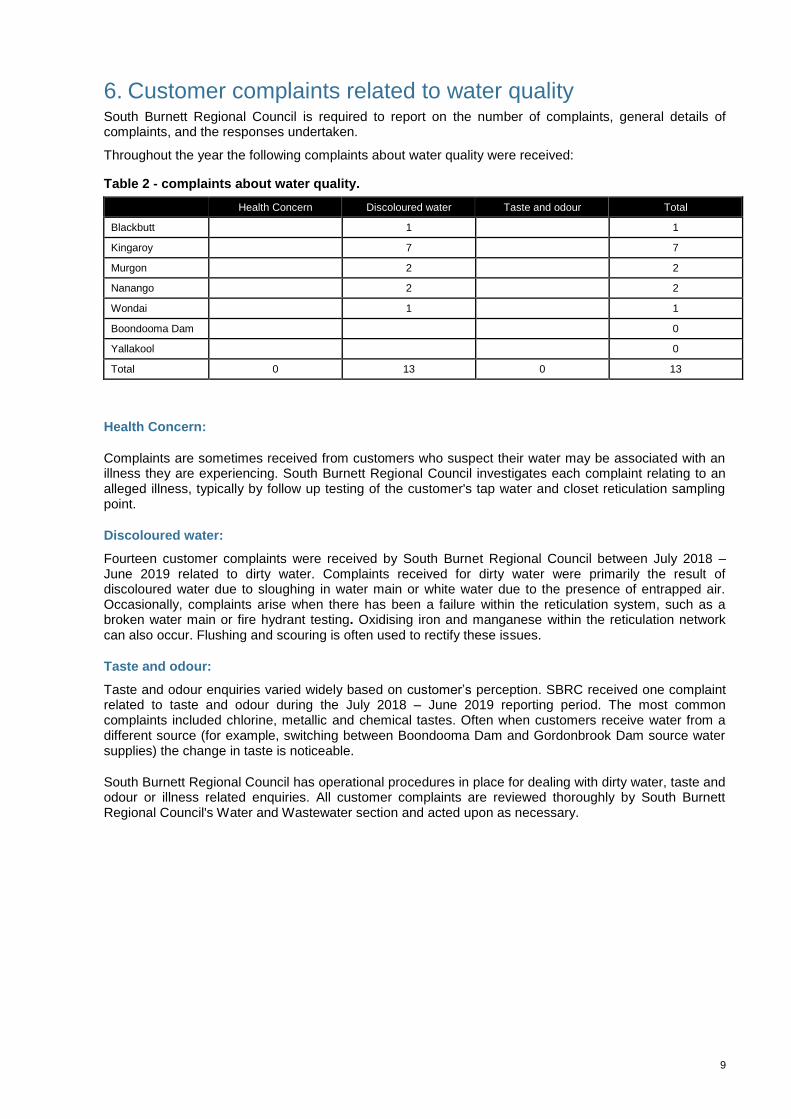
6. Customer complaints related to water quality South Burnett Regional Council is required to report on the number of complaints, general details of complaints, and the responses undertaken.
Throughout the year the following complaints about water quality were received:
Table 2 - complaints about water quality.
Health Concern Discoloured water Taste and odour Total
Blackbutt 1
1
Kingaroy 7 7
Murgon
2 2
Nanango 2
2
Wondai 1 1
Boondooma Dam 0
Yallakool 0
Total 0 13 0 13
Health Concern:
Complaints are sometimes received from customers who suspect their water may be associated with an illness they are experiencing. South Burnett Regional Council investigates each complaint relating to an alleged illness, typically by follow up testing of the customer's tap water and closet reticulation sampling point.
Discoloured water:
Fourteen customer complaints were received by South Burnet Regional Council between July 2018 – June 2019 related to dirty water. Complaints received for dirty water were primarily the result of discoloured water due to sloughing in water main or white water due to the presence of entrapped air. Occasionally, complaints arise when there has been a failure within the reticulation system, such as a broken water main or fire hydrant testing. Oxidising iron and manganese within the reticulation network can also occur. Flushing and scouring is often used to rectify these issues.
Taste and odour:
Taste and odour enquiries varied widely based on customer’s perception. SBRC received one complaint related to taste and odour during the July 2018 – June 2019 reporting period. The most common complaints included chlorine, metallic and chemical tastes. Often when customers receive water from a different source (for example, switching between Boondooma Dam and Gordonbrook Dam source water supplies) the change in taste is noticeable.
South Burnett Regional Council has operational procedures in place for dealing with dirty water, taste and odour or illness related enquiries. All customer complaints are reviewed thoroughly by South Burnett Regional Council's Water and Wastewater section and acted upon as necessary.
7. Findings and recommendations of the DWQMP auditor The current approved DWQMP is Version 7.1, 2019.
The regulated audit of South Burnett Regional Councils DWQMP was completed and given to the regulator by 30 January 2017. The next audit is due to be completed by 31 July 2021.
A report summarising South Burnett Regional Council’s progress in implementing the Risk Management Improvement Program “System” items references as S3 is complete and S1, S2 are still ongoing and must be provided to the regulator biannually.
DWQMP Version 1.7 2019 is the approved version by the regulator.
11
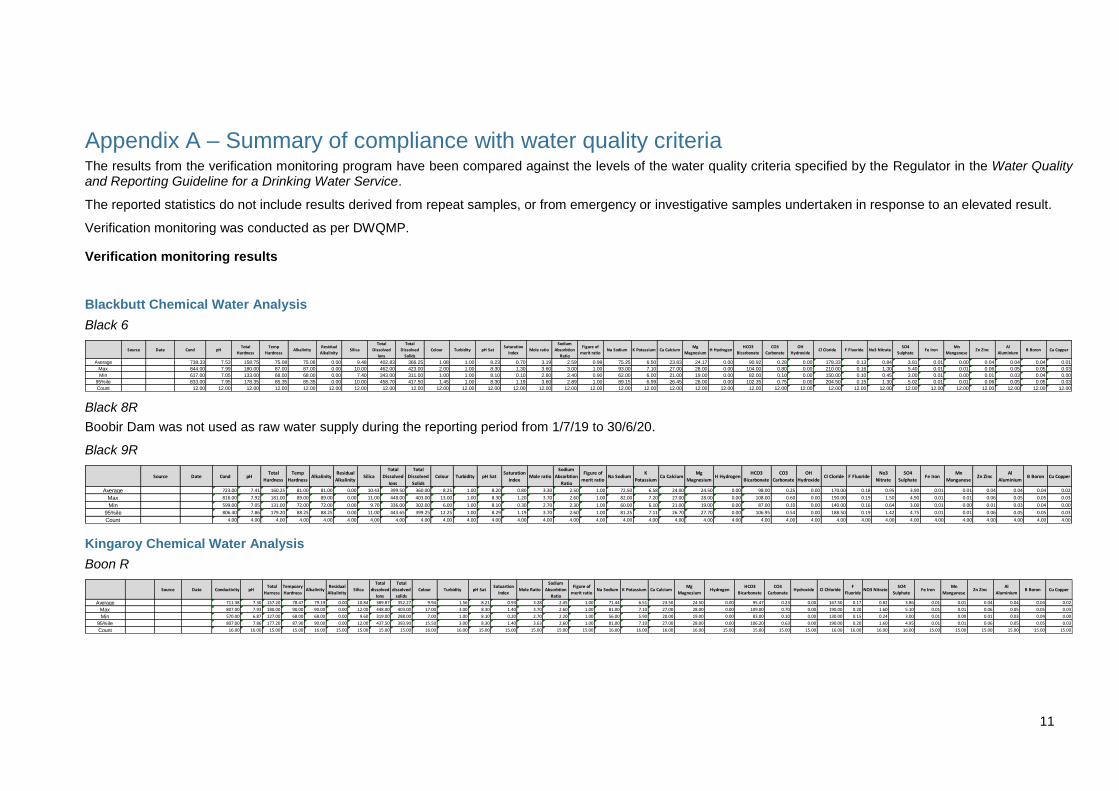
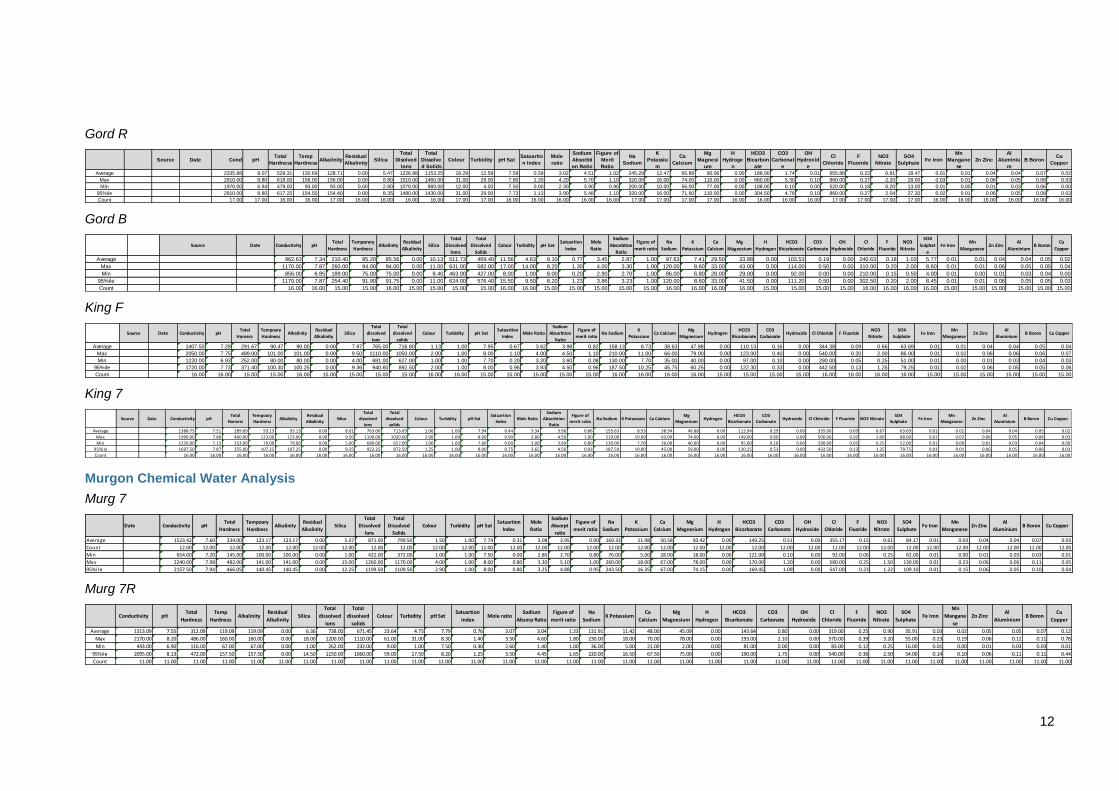
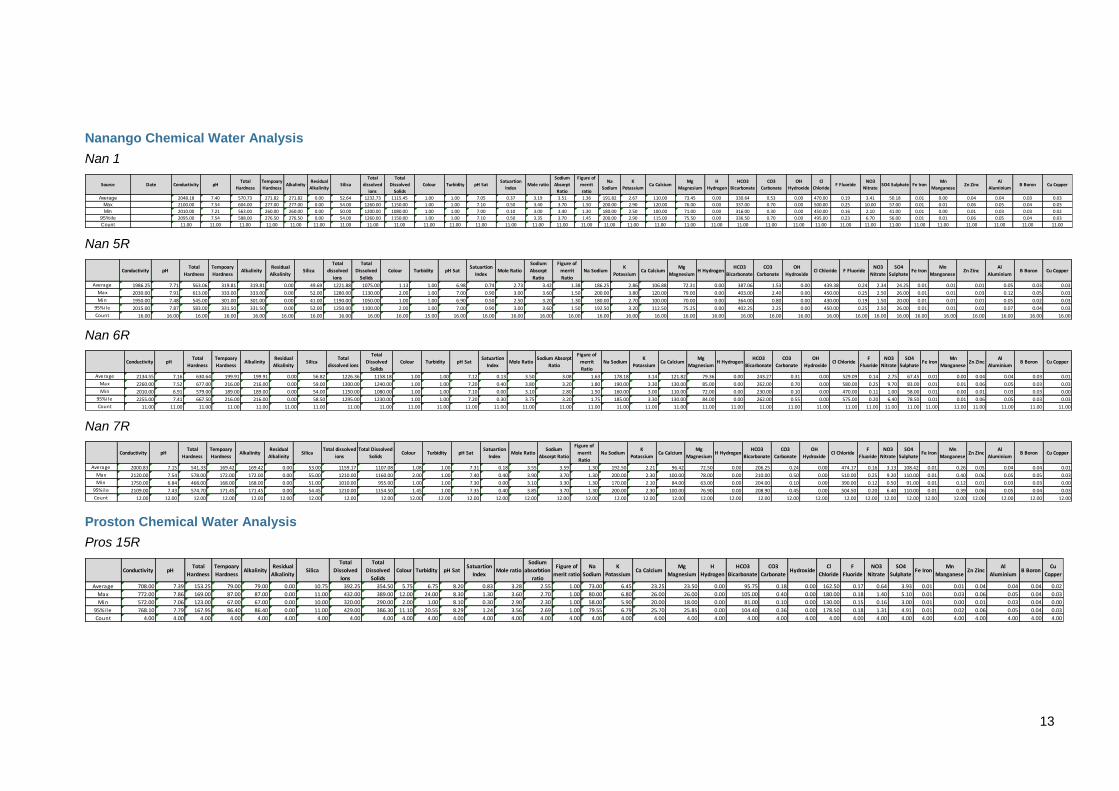
Appendix A – Summary of compliance with water quality criteria The results from the verification monitoring program have been compared against the levels of the water quality criteria specified by the Regulator in the Water Quality and Reporting Guideline for a Drinking Water Service.
The reported statistics do not include results derived from repeat samples, or from emergency or investigative samples undertaken in response to an elevated result.
Verification monitoring was conducted as per DWQMP.
Verification monitoring results
Blackbutt Chemical Water Analysis
Black 6
Source Date Cond pHTotal
Hardness
Temp
HardnessAlkalinity
Residual
AlkalinitySilica
Total
Dissolved
Ions
Total
Dissolved
Solids
Colour Turbidity pH SatSaturation
IndexMole ratio
Sodium
Absorbtion
Ratio
Figure of
merit ratioNa Sodium K Potassium Ca Calcium
Mg
MagnesiumH Hydrogen
HCO3
Bicarbonate
CO3
Carbonate
OH
HydroxideCl Cloride F Fluoride No3 Nitrate
SO4
SulphateFe Iron
Mn
ManganeseZn Zinc
Al
AluminiumB Boron Cu Copper
Average 738.33 7.53 158.75 75.08 75.08 0.00 9.48 402.83 366.25 1.08 1.00 8.23 0.70 3.19 2.59 0.99 75.25 6.50 23.83 24.17 0.00 90.92 0.28 0.00 178.33 0.13 0.84 3.81 0.01 0.00 0.04 0.04 0.04 0.01
Max 844.00 7.99 180.00 87.00 87.00 0.00 10.00 462.00 423.00 2.00 1.00 8.30 1.30 3.60 3.00 1.00 93.00 7.10 27.00 28.00 0.00 104.00 0.80 0.00 210.00 0.16 1.30 5.40 0.01 0.01 0.06 0.05 0.05 0.03
Min 617.00 7.05 133.00 68.00 68.00 0.00 7.40 343.00 311.00 1.00 1.00 8.10 0.10 2.60 2.40 0.90 62.00 6.00 21.00 19.00 0.00 82.00 0.10 0.00 150.00 0.10 0.45 3.00 0.01 0.00 0.01 0.03 0.04 0.00
95%ile 833.00 7.95 178.35 85.35 85.35 0.00 10.00 458.70 417.50 1.45 1.00 8.30 1.19 3.60 2.89 1.00 89.15 6.99 26.45 28.00 0.00 102.35 0.75 0.00 204.50 0.15 1.30 5.02 0.01 0.01 0.06 0.05 0.05 0.03
Count 12.00 12.00 12.00 12.00 12.00 12.00 12.00 12.00 12.00 12.00 12.00 12.00 12.00 12.00 12.00 12.00 12.00 12.00 12.00 12.00 12.00 12.00 12.00 12.00 12.00 12.00 12.00 12.00 12.00 12.00 12.00 12.00 12.00 12.00
Black 8R
Boobir Dam was not used as raw water supply during the reporting period from 1/7/19 to 30/6/20.
Black 9R
Source Date Cond pHTotal
Hardness
Temp
HardnessAlkalinity
Residual
AlkalinitySilica
Total
Dissolved
Ions
Total
Dissolved
Solids
Colour Turbidity pH SatSaturation
IndexMole ratio
Sodium
Absorbtion
Ratio
Figure of
merit ratioNa Sodium
K
PotassiumCa Calcium
Mg
MagnesiumH Hydrogen
HCO3
Bicarbonate
CO3
Carbonate
OH
HydroxideCl Cloride F Fluoride
No3
Nitrate
SO4
SulphateFe Iron
Mn
ManganeseZn Zinc
Al
AluminiumB Boron Cu Copper
Average 723.00 7.41 160.25 81.00 81.00 0.00 10.43 399.50 360.00 8.25 1.00 8.20 0.80 3.30 2.50 1.00 72.50 6.58 24.00 24.50 0.00 98.00 0.25 0.00 170.00 0.18 0.95 3.90 0.01 0.01 0.04 0.04 0.04 0.02
Max 816.00 7.92 181.00 89.00 89.00 0.00 11.00 448.00 403.00 13.00 1.00 8.30 1.20 3.70 2.60 1.00 82.00 7.20 27.00 28.00 0.00 108.00 0.60 0.00 190.00 0.19 1.50 4.90 0.01 0.01 0.06 0.05 0.05 0.03
Min 599.00 7.05 131.00 72.00 72.00 0.00 9.70 336.00 302.00 6.00 1.00 8.10 0.30 2.70 2.30 1.00 60.00 6.10 21.00 19.00 0.00 87.00 0.10 0.00 140.00 0.16 0.64 3.00 0.01 0.00 0.01 0.03 0.04 0.00
95%ile 806.40 7.86 179.20 88.25 88.25 0.00 11.00 443.65 399.25 12.25 1.00 8.29 1.19 3.70 2.60 1.00 81.25 7.11 26.70 27.70 0.00 106.95 0.54 0.00 188.50 0.19 1.42 4.75 0.01 0.01 0.06 0.05 0.05 0.03
Count 4.00 4.00 4.00 4.00 4.00 4.00 4.00 4.00 4.00 4.00 4.00 4.00 4.00 4.00 4.00 4.00 4.00 4.00 4.00 4.00 4.00 4.00 4.00 4.00 4.00 4.00 4.00 4.00 4.00 4.00 4.00 4.00 4.00 4.00
Kingaroy Chemical Water Analysis
Boon R
Source Date Conductivity pHTotal
Harness
Tempoary
HardnessAlkalinity
Residual
AlkalinitySilica
Total
dissolved
Ions
Total
dissolved
solids
Colour Turbidity pH SatSatuartion
IndexMole Ratio
Sodium
Absorbtion
Ratio
Figure of
merit ratioNa Sodium K Potassium Ca Calcium
Mg
MagnesiumHydrogen
HCO3
Bicarbonate
CO3
CarbonateHydroxide Cl Chloride
F
FluorideNO3 Nitrate
SO4
SulphateFe Iron
Mn
ManganeseZn Zinc
Al
AluminiumB Boron Cu Copper
Average 711.38 7.30 157.20 78.47 79.19 0.00 10.84 389.87 352.27 9.94 1.56 8.21 0.93 3.28 2.45 1.00 71.44 6.51 23.50 24.50 0.00 95.47 0.23 0.00 167.50 0.17 0.82 3.86 0.01 0.01 0.04 0.04 0.04 0.02
Max 807.00 7.93 180.00 90.00 90.00 0.00 12.00 448.00 403.00 17.00 3.00 8.30 1.40 3.70 2.60 1.00 81.00 7.10 27.00 28.00 0.00 109.00 0.70 0.00 190.00 0.20 1.60 5.10 0.01 0.01 0.06 0.05 0.05 0.03
Min 570.00 6.87 127.00 68.00 68.00 0.00 9.60 319.00 288.00 7.00 1.00 8.10 0.20 2.70 2.20 1.00 56.00 5.90 20.00 19.00 0.00 83.00 0.10 0.00 130.00 0.15 0.24 3.00 0.01 0.00 0.01 0.03 0.04 0.00
95%ile 807.00 7.86 177.20 87.90 90.00 0.00 12.00 437.50 393.90 15.50 3.00 8.30 1.40 3.63 2.60 1.00 81.00 7.10 27.00 28.00 0.00 106.20 0.63 0.00 190.00 0.20 1.60 4.95 0.01 0.01 0.06 0.05 0.05 0.03
Count 16.00 16.00 15.00 15.00 16.00 15.00 15.00 15.00 15.00 16.00 16.00 15.00 15.00 15.00 15.00 15.00 16.00 16.00 16.00 16.00 15.00 15.00 15.00 15.00 16.00 16.00 16.00 16.00 15.00 15.00 15.00 15.00 15.00 15.00
12
Gord R
Source Date Cond pHTotal
Hardness
Temp
HardnessAlkalinity
Residual
AlkalinitySilica
Total
Disolved
Ions
Total
Dissolve
d Solids
Colour Turbidity pH SatSatuartio
n Index
Mole
ratio
Sodium
Absorbti
on Ratio
Figure of
Merit
Ratio
Na
Sodium
K
Potassiu
m
Ca
Calcium
Mg
Magnesi
um
H
Hydroge
n
HCO3
Bicarbon
ate
CO3
Carbonat
e
OH
Hydroxid
e
Cl
Chloride
F
Fluoride
NO3
Nitrate
SO4
SulphateFe Iron
Mn
Mangane
se
Zn Zinc
Al
Aluminiu
m
B BoronCu
Copper
Average 2335.88 8.07 529.31 130.69 128.71 0.00 5.47 1226.88 1153.25 18.29 12.59 7.59 0.59 3.02 4.51 1.02 245.29 12.47 65.88 90.06 0.00 188.00 1.74 0.01 655.88 0.22 0.81 18.47 0.01 0.01 0.04 0.04 0.07 0.02
Max 2910.00 8.80 618.00 156.00 156.00 0.00 8.80 1510.00 1460.00 31.00 29.00 7.80 1.20 4.20 5.70 1.10 320.00 16.00 74.00 110.00 0.00 660.00 5.30 0.10 860.00 0.27 2.20 28.00 0.03 0.01 0.06 0.05 0.08 0.03
Min 1970.00 6.94 479.00 93.00 93.00 0.00 2.80 1070.00 983.00 12.00 4.00 7.50 0.00 2.30 3.90 0.90 200.00 10.00 56.00 77.00 0.00 108.00 0.10 0.00 520.00 0.18 0.20 13.00 0.01 0.00 0.01 0.03 0.06 0.00
95%ile 2910.00 8.80 617.25 154.50 154.40 0.00 8.35 1480.00 1430.00 31.00 29.00 7.73 1.13 3.90 5.48 1.10 320.00 16.00 71.60 110.00 0.00 304.50 4.78 0.10 860.00 0.27 2.04 27.20 0.02 0.01 0.06 0.05 0.08 0.03
Count 17.00 17.00 16.00 16.00 17.00 16.00 16.00 16.00 16.00 17.00 17.00 16.00 16.00 16.00 16.00 16.00 17.00 17.00 17.00 17.00 16.00 16.00 16.00 16.00 17.00 17.00 17.00 17.00 16.00 16.00 16.00 16.00 16.00 16.00
Gord B
Source Date Conductivity pHTotal
Hardness
Temporary
HardnessAlkalinity
Residual
AlkalinitySilica
Total
Dissolved
Irons
Total
Dissolved
Solids
Colour Turbidity pH SatSatuartion
Index
Mole
Ratio
Sodium
Absorbtion
Ratio
Figure of
merit ratio
Na
Sodium
K
Potassium
Ca
Calcium
Mg
Magnesium
H
Hydrogen
HCO3
Bicarbonate
CO3
Carbonate
OH
Hydroxide
Cl
Chloride
F
Fluoride
NO3
Nitrate
SO4
Sulphat
e
Fe IronMn
ManganeseZn Zinc
Al
AluminiumB Boron
Cu
Copper
Average 962.63 7.34 210.40 85.20 85.56 0.00 10.13 511.73 469.40 11.56 4.63 8.10 0.77 3.45 2.87 1.00 97.63 7.41 29.50 33.88 0.00 103.53 0.19 0.00 240.63 0.18 1.03 5.77 0.01 0.01 0.04 0.04 0.05 0.02
Max 1170.00 7.87 260.00 94.00 94.00 0.00 11.00 631.00 582.00 17.00 14.00 8.20 1.30 4.00 3.30 1.00 120.00 8.60 33.00 43.00 0.00 114.00 0.50 0.00 310.00 0.20 2.00 8.60 0.01 0.01 0.06 0.05 0.05 0.04
Min 856.00 6.85 189.00 75.00 75.00 0.00 8.40 463.00 427.00 8.00 1.00 8.00 0.20 2.90 2.70 1.00 86.00 6.80 28.00 29.00 0.00 92.00 0.00 0.00 210.00 0.15 0.50 4.00 0.01 0.00 0.01 0.03 0.04 0.00
95%ile 1170.00 7.87 254.40 91.90 91.75 0.00 11.00 624.00 576.40 15.50 9.50 8.20 1.23 3.86 3.23 1.00 120.00 8.60 33.00 41.50 0.00 111.20 0.50 0.00 302.50 0.20 2.00 8.45 0.01 0.01 0.06 0.05 0.05 0.03
Count 16.00 16.00 15.00 15.00 16.00 15.00 15.00 15.00 15.00 16.00 16.00 15.00 15.00 15.00 15.00 15.00 16.00 16.00 16.00 16.00 15.00 15.00 15.00 15.00 16.00 16.00 16.00 16.00 15.00 15.00 15.00 15.00 15.00 15.00
King F
Source Date Conductivity pHTotal
Harness
Tempoary
HardnessAlkalinity
Residual
AlkalinitySilica
Total
dissolved
Ions
Total
dissolved
solids
Colour Turbidity pH SatSatuartion
IndexMole Ratio
Sodium
Absorbtion
Ratio
Figure of
merit ratioNa Sodium
K
PotassiumCa Calcium
Mg
MagnesiumHydrogen
HCO3
Bicarbonate
CO3
CarbonateHydroxide Cl Chloride F Fluoride
NO3
Nitrate
SO4
SulphateFe Iron
Mn
ManganeseZn Zinc
Al
AluminiumB Boron Cu Copper
Average 1407.50 7.29 291.67 90.47 90.00 0.00 7.97 765.00 716.80 1.13 1.00 7.95 0.67 3.62 3.98 0.82 158.13 8.73 38.63 47.88 0.00 110.13 0.16 0.00 344.38 0.09 0.66 63.69 0.01 0.01 0.04 0.04 0.05 0.04
Max 2050.00 7.75 489.00 101.00 101.00 0.00 9.50 1110.00 1050.00 2.00 1.00 8.00 1.10 4.00 4.50 1.10 210.00 11.00 66.00 79.00 0.00 123.00 0.40 0.00 540.00 0.20 2.00 86.00 0.01 0.02 0.06 0.06 0.06 0.07
Min 1220.00 6.93 252.00 80.00 80.00 0.00 4.00 681.00 627.00 1.00 1.00 7.70 0.20 3.20 3.60 0.08 130.00 7.70 35.00 40.00 0.00 97.00 0.10 0.00 290.00 0.05 0.25 51.00 0.01 0.00 0.01 0.03 0.04 0.03
95%ile 1720.00 7.73 371.40 100.30 100.25 0.00 9.36 940.60 892.50 2.00 1.00 8.00 0.96 3.93 4.50 0.96 187.50 10.25 45.75 60.25 0.00 122.30 0.33 0.00 442.50 0.13 1.25 79.25 0.01 0.02 0.06 0.05 0.05 0.06
Count 16.00 16.00 15.00 15.00 16.00 15.00 15.00 15.00 15.00 16.00 16.00 15.00 15.00 15.00 15.00 15.00 16.00 16.00 16.00 16.00 15.00 15.00 15.00 15.00 16.00 16.00 16.00 16.00 15.00 15.00 15.00 15.00 15.00 15.00
King 7
Source Date Conductivity pHTotal
Harness
Tempoary
HardnessAlkalinity
Residual
AlkalinitySilica
Total
dissolved
Ions
Total
dissolved
solids
Colour Turbidity pH SatSatuartion
IndexMole Ratio
Sodium
Absorbtion
Ratio
Figure of
merit ratioNa Sodium K Potassium Ca Calcium
Mg
MagnesiumHydrogen
HCO3
Bicarbonate
CO3
CarbonateHydroxide Cl Chloride F Fluoride NO3 Nitrate
SO4
SulphateFe Iron
Mn
ManganeseZn Zinc
Al
AluminiumB Boron Cu Copper
Average 1388.75 7.51 289.69 93.13 93.13 0.00 8.01 763.00 713.69 1.06 1.00 7.94 0.44 3.34 3.98 0.86 155.63 8.53 38.94 46.88 0.00 112.94 0.29 0.00 335.00 0.09 0.67 63.69 0.01 0.01 0.04 0.04 0.05 0.02
Max 1990.00 7.88 460.00 123.00 123.00 0.00 9.50 1100.00 1030.00 2.00 1.00 8.00 0.90 3.80 4.50 1.00 210.00 10.00 63.00 74.00 0.00 149.00 0.60 0.00 500.00 0.20 2.00 88.00 0.01 0.02 0.06 0.05 0.06 0.03
Min 1220.00 7.13 253.00 79.00 79.00 0.00 5.00 680.00 627.00 1.00 1.00 7.60 0.00 3.00 3.60 0.80 130.00 7.70 36.00 40.00 0.00 95.00 0.10 0.00 290.00 0.05 0.25 52.00 0.01 0.00 0.01 0.03 0.04 0.00
95%ile 1697.50 7.87 355.00 107.25 107.25 0.00 9.35 922.25 872.50 1.25 1.00 8.00 0.75 3.65 4.50 0.93 187.50 10.00 45.00 59.00 0.00 130.25 0.53 0.00 432.50 0.13 1.25 79.75 0.01 0.01 0.06 0.05 0.06 0.03
Count 16.00 16.00 16.00 16.00 16.00 16.00 16.00 16.00 16.00 16.00 16.00 16.00 16.00 16.00 16.00 16.00 16.00 16.00 16.00 16.00 16.00 16.00 16.00 16.00 16.00 16.00 16.00 16.00 16.00 16.00 16.00 16.00 16.00 16.00
Murgon Chemical Water Analysis
Murg 7
Date Conductivity pHTotal
Hardness
Tempoary
HardnessAlkalinity
Residual
AlkalinitySilica
Total
Dissolved
Ions
Total
Dissolved
Solids
Colour Turbidity pH SatSatuartion
Index
Mole
Ratio
Sodium
Absorpt
ratio
Figure of
merit ratio
Na
Sodium
K
Potassium
Ca
Calcium
Mg
Magnesium
H
Hydrogen
HCO3
Bicarbonate
CO3
Carbonate
OH
Hydroxide
Cl
Chloride
F
Fluoride
NO3
Nitrate
SO4
SulphateFe Iron
Mn
ManganeseZn Zinc
Al
AluminiumB Boron Cu Copper
Average 1523.42 7.60 334.00 123.17 123.17 0.00 5.37 871.00 799.50 1.50 1.00 7.74 0.31 3.08 3.95 0.90 169.33 11.98 50.58 50.42 0.00 149.25 0.51 0.00 355.17 0.15 0.61 84.17 0.01 0.03 0.04 0.04 0.07 0.03
Count 12.00 12.00 12.00 12.00 12.00 12.00 12.00 12.00 12.00 12.00 12.00 12.00 12.00 12.00 12.00 12.00 12.00 12.00 12.00 12.00 12.00 12.00 12.00 12.00 12.00 12.00 12.00 12.00 12.00 12.00 12.00 12.00 12.00 12.00
Min 654.00 7.20 145.00 100.00 100.00 0.00 1.00 422.00 372.00 1.00 1.00 7.50 0.00 2.80 2.70 0.80 76.00 5.00 28.00 18.00 0.00 121.00 0.10 0.00 92.00 0.06 0.25 62.00 0.01 0.00 0.01 0.03 0.03 0.01
Max 2240.00 7.98 482.00 141.00 141.00 0.00 15.00 1260.00 1170.00 4.00 1.00 8.00 0.80 3.30 5.10 1.00 260.00 18.00 67.00 78.00 0.00 170.00 1.20 0.00 580.00 0.25 1.50 130.00 0.01 0.23 0.06 0.06 0.11 0.05
95%i le 2157.50 7.94 466.05 140.45 140.45 0.00 12.25 1199.50 1109.50 2.90 1.00 8.00 0.80 3.25 4.88 0.95 243.50 16.35 67.00 74.15 0.00 169.45 1.09 0.00 547.00 0.23 1.22 109.10 0.01 0.15 0.06 0.05 0.10 0.04
Murg 7R
Conductivity pHTotal
Hardness
Temp
HardnessAlkalinity
Residual
AlkalinitySilica
Total
dissolved
Ions
Total
dissolved
solids
Colour Turbidity pH SatSatuartion
IndexMole ratio
Sodium
Absorp Ratio
Figure of
merit ratio
Na
SodiumK Potassium
Ca
Calcium
Mg
Magnesium
H
Hydrogen
HCO3
Bicarbonate
CO3
Carbonate
OH
Hydroxide
Cl
Chloride
F
Fluoride
NO3
Nitrate
SO4
SulphateFe Iron
Mn
Mangane
se
Zn ZincAl
AluminiumB Boron
Cu
Copper
Average 1313.09 7.55 312.09 119.09 119.09 0.00 6.36 738.00 671.45 23.64 4.73 7.79 0.76 3.07 3.04 1.23 131.91 11.42 48.00 45.09 0.00 143.64 0.80 0.00 319.00 0.25 0.90 35.91 0.03 0.02 0.05 0.05 0.07 0.12
Max 2170.00 8.20 486.00 160.00 160.00 0.00 18.00 1200.00 1110.00 61.00 31.00 8.30 1.40 3.50 4.60 1.80 230.00 18.00 70.00 78.00 0.00 193.00 2.10 0.00 570.00 0.39 3.20 55.00 0.23 0.19 0.06 0.12 0.11 0.78
Min 443.00 6.90 116.00 67.00 67.00 0.00 1.00 262.00 232.00 9.00 1.00 7.50 0.30 2.60 1.40 1.00 36.00 5.00 21.00 2.00 0.00 81.00 0.00 0.00 83.00 0.12 0.25 16.00 0.01 0.00 0.01 0.03 0.03 0.01
95%ile 2095.00 8.13 472.00 157.50 157.50 0.00 14.50 1150.00 1060.00 59.00 17.50 8.20 1.25 3.50 4.45 1.65 220.00 16.50 67.50 75.00 0.00 190.00 1.75 0.00 540.00 0.36 2.50 54.00 0.14 0.10 0.06 0.11 0.11 0.44
Count 11.00 11.00 11.00 11.00 11.00 11.00 11.00 11.00 11.00 11.00 11.00 11.00 11.00 11.00 11.00 11.00 11.00 11.00 11.00 11.00 11.00 11.00 11.00 11.00 11.00 11.00 11.00 11.00 11.00 11.00 11.00 11.00 11.00 11.00
13
Nanango Chemical Water Analysis
Nan 1
Source Date Conductivity pHTotal
Hardness
Tempoary
HardnessAlkalinity
Residual
AlkalinitySilica
Total
dissolved
ions
Total
Dissolved
Solids
Colour Turbidity pH SatSatuartion
IndexMole ratio
Sodium
Absorpt
Ratio
Figure of
merrit
ratio
Na
Sodium
K
PotassiumCa Calcium
Mg
Magnesium
H
Hydrogen
HCO3
Bicarbonate
CO3
Carbonate
OH
Hydroxide
Cl
ChlorideF Fluoride
NO3
NitrateSO4 Sulphate Fe Iron
Mn
ManganeseZn Zinc
Al
AluminiumB Boron Cu Copper
Average 2048.18 7.40 570.73 271.82 271.82 0.00 52.64 1232.73 1115.45 1.00 1.00 7.05 0.37 3.19 3.51 1.36 191.82 2.67 110.00 73.45 0.00 330.64 0.53 0.00 470.00 0.19 3.41 50.18 0.01 0.00 0.04 0.04 0.03 0.03
Max 2100.00 7.54 604.00 277.00 277.00 0.00 54.00 1260.00 1150.00 1.00 1.00 7.10 0.50 3.40 3.70 1.50 200.00 2.90 120.00 76.00 0.00 337.00 0.70 0.00 500.00 0.25 10.00 57.00 0.01 0.01 0.06 0.05 0.04 0.03
Min 2010.00 7.21 563.00 260.00 260.00 0.00 50.00 1200.00 1080.00 1.00 1.00 7.00 0.10 3.00 3.40 1.30 180.00 2.50 100.00 71.00 0.00 316.00 0.30 0.00 450.00 0.16 2.10 41.00 0.01 0.00 0.01 0.03 0.03 0.02
95%ile 2095.00 7.54 588.00 276.50 276.50 0.00 54.00 1260.00 1150.00 1.00 1.00 7.10 0.50 3.35 3.70 1.45 200.00 2.90 115.00 75.50 0.00 336.50 0.70 0.00 495.00 0.23 6.70 56.00 0.01 0.01 0.06 0.05 0.04 0.03
Count 11.00 11.00 11.00 11.00 11.00 11.00 11.00 11.00 11.00 11.00 11.00 11.00 11.00 11.00 11.00 11.00 11.00 11.00 11.00 11.00 11.00 11.00 11.00 11.00 11.00 11.00 11.00 11.00 11.00 11.00 11.00 11.00 11.00 11.00
Nan 5R
Conductivity pHTotal
Hardness
Tempoary
HardnessAlkalinity
Residual
AlkalinitySilica
Total
dissolved
ions
Total
Dissolved
Solids
Colour Turbidity pH SatSatuartion
IndexMole Ratio
Sodium
Absorpt
Ratio
Figure of
merrit
Ratio
Na SodiumK
PotassiumCa Calcium
Mg
MagnesiumH Hydrogen
HCO3
Bicarbonate
CO3
Carbonate
OH
HydroxideCl Chloride F Fluoride
NO3
Nitrate
SO4
SulphateFe Iron
Mn
ManganeseZn Zinc
Al
AluminiumB Boron Cu Copper
Average 1986.25 7.71 563.06 319.81 319.81 0.00 49.69 1221.88 1075.00 1.13 1.00 6.98 0.74 2.73 3.42 1.38 186.25 2.86 106.88 72.31 0.00 387.06 1.53 0.00 439.38 0.24 2.34 24.25 0.01 0.01 0.01 0.05 0.03 0.03
Max 2030.00 7.91 613.00 333.00 333.00 0.00 52.00 1280.00 1130.00 2.00 1.00 7.00 0.90 3.00 3.60 1.50 200.00 3.80 120.00 79.00 0.00 403.00 2.40 0.00 450.00 0.25 2.50 26.00 0.01 0.01 0.03 0.12 0.05 0.03
Min 1950.00 7.48 545.00 301.00 301.00 0.00 41.00 1190.00 1050.00 1.00 1.00 6.90 0.50 2.50 3.20 1.30 180.00 2.70 100.00 70.00 0.00 364.00 0.80 0.00 430.00 0.19 1.50 20.00 0.01 0.01 0.01 0.05 0.02 0.03
95%i le 2015.00 7.87 583.00 331.50 331.50 0.00 52.00 1250.00 1100.00 2.00 1.00 7.00 0.90 3.00 3.60 1.50 192.50 3.20 112.50 75.25 0.00 402.25 2.25 0.00 450.00 0.25 2.50 26.00 0.01 0.01 0.02 0.07 0.04 0.03
Count 16.00 16.00 16.00 16.00 16.00 16.00 16.00 16.00 16.00 16.00 15.00 16.00 16.00 16.00 16.00 16.00 16.00 16.00 16.00 16.00 16.00 16.00 16.00 16.00 16.00 16.00 16.00 16.00 16.00 16.00 16.00 16.00 16.00 16.00
Nan 6R
Conductivity pHTotal
Hardness
Tempoary
HardnessAlkalinity
Residual
AlkalinitySilica
Total
dissolved ions
Total
Dissolved
Solids
Colour Turbidity pH SatSatuartion
IndexMole Ratio
Sodium Absorpt
Ratio
Figure of
merrit
Ratio
Na SodiumK
PotassiumCa Calcium
Mg
MagnesiumH Hydrogen
HCO3
Bicarbonate
CO3
Carbonate
OH
HydroxideCl Chloride
F
Fluoride
NO3
Nitrate
SO4
SulphateFe Iron
Mn
ManganeseZn Zinc
Al
AluminiumB Boron Cu Copper
Average 2134.55 7.16 630.64 199.91 199.91 0.00 56.82 1226.36 1158.18 1.00 1.00 7.12 0.13 3.50 3.08 1.63 178.18 3.14 121.82 79.36 0.00 243.27 0.31 0.00 529.09 0.14 2.75 67.45 0.01 0.00 0.04 0.04 0.03 0.01
Max 2260.00 7.52 677.00 216.00 216.00 0.00 59.00 1300.00 1240.00 1.00 1.00 7.20 0.40 3.80 3.20 1.80 190.00 3.30 130.00 85.00 0.00 262.00 0.70 0.00 580.00 0.25 9.70 83.00 0.01 0.01 0.06 0.05 0.03 0.03
Min 2010.00 6.91 579.00 189.00 189.00 0.00 54.00 1150.00 1080.00 1.00 1.00 7.10 0.00 3.10 2.80 1.50 160.00 3.00 110.00 72.00 0.00 230.00 0.10 0.00 470.00 0.11 1.00 58.00 0.01 0.00 0.01 0.03 0.03 0.00
95%i le 2255.00 7.41 667.50 216.00 216.00 0.00 58.50 1295.00 1230.00 1.00 1.00 7.20 0.30 3.75 3.20 1.75 185.00 3.30 130.00 84.00 0.00 262.00 0.55 0.00 575.00 0.20 6.40 78.50 0.01 0.01 0.06 0.05 0.03 0.03
Count 11.00 11.00 11.00 11.00 11.00 11.00 11.00 11.00 11.00 11.00 11.00 11.00 11.00 11.00 11.00 11.00 11.00 11.00 11.00 11.00 11.00 11.00 11.00 11.00 11.00 11.00 11.00 11.00 11.00 11.00 11.00 11.00 11.00 11.00
Nan 7R
Conductivity pHTotal
Hardness
Tempoary
HardnessAlkalinity
Residual
AlkalinitySilica
Total dissolved
ions
Total Dissolved
SolidsColour Turbidity pH Sat
Satuartion
IndexMole Ratio
Sodium
Absorpt Ratio
Figure of
merrit
Ratio
Na SodiumK
PotassiumCa Calcium
Mg
MagnesiumH Hydrogen
HCO3
Bicarbonate
CO3
Carbonate
OH
HydroxideCl Chloride
F
Fluoride
NO3
Nitrate
SO4
SulphateFe Iron
Mn
ManganeseZn Zinc
Al
AluminiumB Boron Cu Copper
Average 2000.83 7.15 541.33 169.42 169.42 0.00 53.00 1159.17 1107.08 1.08 1.00 7.31 0.18 3.55 3.59 1.30 192.50 2.21 96.42 72.50 0.00 206.25 0.24 0.00 474.17 0.16 3.13 108.42 0.01 0.26 0.05 0.04 0.04 0.01
Max 2120.00 7.54 578.00 172.00 172.00 0.00 55.00 1210.00 1160.00 2.00 1.00 7.40 0.40 3.90 3.70 1.30 200.00 2.30 100.00 78.00 0.00 210.00 0.50 0.00 510.00 0.25 9.20 110.00 0.01 0.40 0.06 0.05 0.05 0.03
Min 1750.00 6.84 468.00 168.00 168.00 0.00 51.00 1010.00 955.00 1.00 1.00 7.30 0.00 3.10 3.30 1.30 170.00 2.10 84.00 63.00 0.00 204.00 0.10 0.00 390.00 0.12 0.50 91.00 0.01 0.12 0.01 0.03 0.03 0.00
95%i le 2109.00 7.43 574.70 171.45 171.45 0.00 54.45 1210.00 1154.50 1.45 1.00 7.35 0.40 3.85 3.70 1.30 200.00 2.30 100.00 76.90 0.00 208.90 0.45 0.00 504.50 0.20 6.40 110.00 0.01 0.39 0.06 0.05 0.04 0.03
Count 12.00 12.00 12.00 12.00 12.00 12.00 12.00 12.00 12.00 12.00 12.00 12.00 12.00 12.00 12.00 12.00 12.00 12.00 12.00 12.00 12.00 12.00 12.00 12.00 12.00 12.00 12.00 12.00 12.00 12.00 12.00 12.00 12.00 12.00
Proston Chemical Water Analysis
Pros 15R
Conductivity pHTotal
Hardness
Tempoary
HardnessAlkalinity
Residual
AlkalinitySilica
Total
Dissolved
Ions
Total
Dissolved
Solids
Colour Turbidity pH SatSatuartion
IndexMole ratio
Sodium
absorbtion
ratio
Figure of
merit ratio
Na
Sodium
K
PotassiumCa Calcium
Mg
Magnesium
H
Hydrogen
HCO3
Bicarbonate
CO3
CarbonateHydroxide
Cl
Chloride
F
Fluoride
NO3
Nitrate
SO4
SulphateFe Iron
Mn
ManganeseZn Zinc
Al
AluminiumB Boron
Cu
Copper
Average 708.00 7.39 153.25 79.00 79.00 0.00 10.75 392.25 354.50 5.75 6.75 8.20 0.83 3.28 2.55 1.00 73.00 6.45 23.25 23.50 0.00 95.75 0.18 0.00 162.50 0.17 0.64 3.93 0.01 0.01 0.04 0.04 0.04 0.02
Max 772.00 7.86 169.00 87.00 87.00 0.00 11.00 432.00 389.00 12.00 24.00 8.30 1.30 3.60 2.70 1.00 80.00 6.80 26.00 26.00 0.00 105.00 0.40 0.00 180.00 0.18 1.40 5.10 0.01 0.03 0.06 0.05 0.04 0.03
Min 572.00 7.06 123.00 67.00 67.00 0.00 10.00 320.00 290.00 2.00 1.00 8.10 0.30 2.90 2.30 1.00 58.00 5.90 20.00 18.00 0.00 81.00 0.10 0.00 130.00 0.15 0.16 3.00 0.01 0.00 0.01 0.03 0.04 0.00
95%i le 768.10 7.79 167.95 86.40 86.40 0.00 11.00 429.00 386.30 11.10 20.55 8.29 1.24 3.56 2.69 1.00 79.55 6.79 25.70 25.85 0.00 104.40 0.36 0.00 178.50 0.18 1.31 4.91 0.01 0.02 0.06 0.05 0.04 0.03
Count 4.00 4.00 4.00 4.00 4.00 4.00 4.00 4.00 4.00 4.00 4.00 4.00 4.00 4.00 4.00 4.00 4.00 4.00 4.00 4.00 4.00 4.00 4.00 4.00 4.00 4.00 4.00 4.00 4.00 4.00 4.00 4.00 4.00 4.00
14
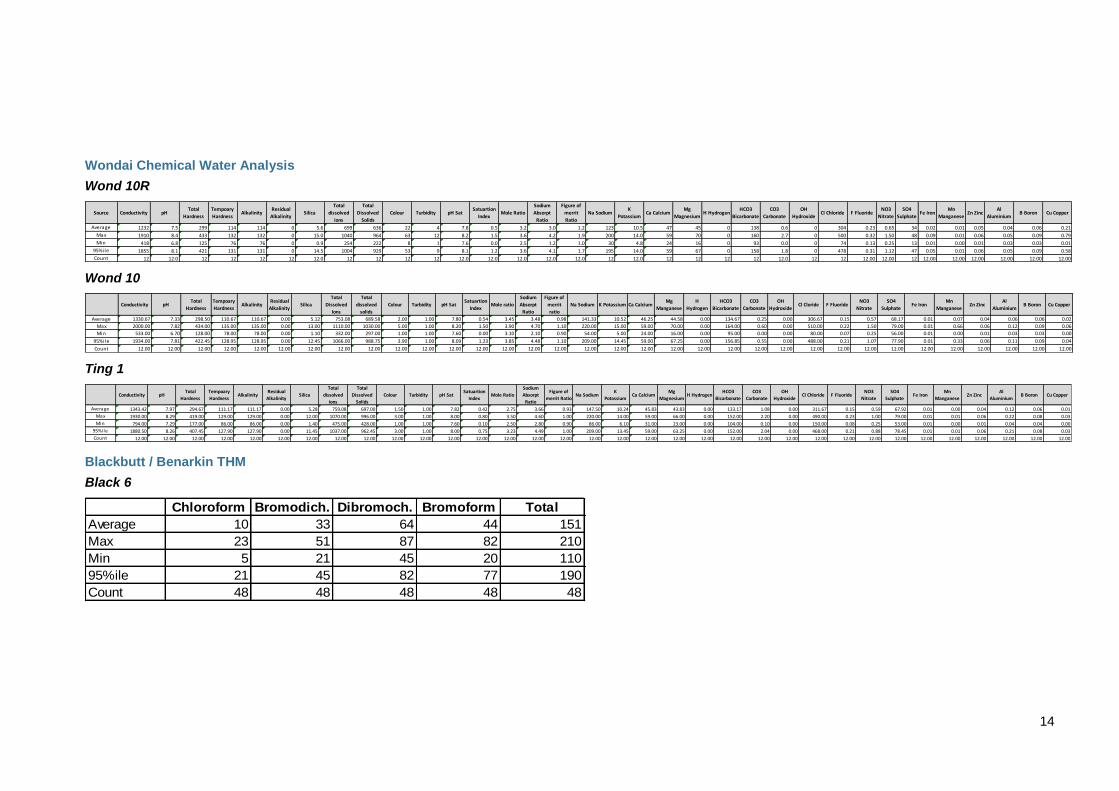
Wondai Chemical Water Analysis
Wond 10R
Source Conductivity pHTotal
Hardness
Tempoary
HardnessAlkalinity
Residual
AlkalinitySilica
Total
dissolved
ions
Total
Dissolved
Solids
Colour Turbidity pH SatSatuartion
IndexMole Ratio
Sodium
Absorpt
Ratio
Figure of
merrit
Ratio
Na SodiumK
PotassiumCa Calcium
Mg
MagnesiumH Hydrogen
HCO3
Bicarbonate
CO3
Carbonate
OH
HydroxideCl Chloride F Fluoride
NO3
Nitrate
SO4
SulphateFe Iron
Mn
ManganeseZn Zinc
Al
AluminiumB Boron Cu Copper
Average 1232 7.5 299 114 114 0 5.6 699 636 22 4 7.8 0.5 3.2 3.0 1.2 123 10.5 47 45 0 138 0.6 0 304 0.23 0.65 34 0.02 0.01 0.05 0.04 0.06 0.21
Max 1910 8.4 433 132 132 0 15.0 1040 964 63 12 8.2 1.5 3.6 4.2 1.9 200 14.0 59 70 0 160 2.7 0 500 0.32 1.50 48 0.09 0.01 0.06 0.05 0.09 0.79
Min 418 6.8 125 76 76 0 0.9 254 222 8 1 7.6 0.0 2.5 1.2 1.0 30 4.8 24 16 0 93 0.0 0 74 0.13 0.25 13 0.01 0.00 0.01 0.03 0.03 0.01
95%i le 1855 8.1 421 131 131 0 14.5 1004 929 53 9 8.1 1.2 3.6 4.1 1.7 195 14.0 59 67 0 158 1.8 0 478 0.31 1.12 47 0.05 0.01 0.06 0.05 0.09 0.58
Count 12 12.0 12 12 12 12 12.0 12 12 12 12 12.0 12.0 12.0 12.0 12.0 12 12.0 12 12 12 12 12.0 12 12 12.00 12.00 12 12.00 12.00 12.00 12.00 12.00 12.00
Wond 10
Conductivity pHTotal
Hardness
Tempoary
HardnessAlkalinity
Residual
AlkalinitySilica
Total
Dissolved
Ions
Total
dissolved
solids
Colour Turbidity pH SatSatuartion
IndexMole ratio
Sodium
Absorpt
Ratio
Figure of
merrit
ratio
Na Sodium K Potassium Ca CalciumMg
Manganese
H
Hydrogen
HCO3
Bicarbonate
CO3
Carbonate
OH
HydroxideCl Cloride F Fluoride
NO3
Nitrate
SO4
SulphateFe Iron
Mn
ManganeseZn Zinc
Al
AluminiumB Boron Cu Copper
Average 1330.67 7.33 298.50 110.67 110.67 0.00 5.12 753.08 689.58 2.00 1.00 7.80 0.54 3.45 3.48 0.98 141.33 10.52 46.25 44.58 0.00 134.67 0.25 0.00 306.67 0.15 0.57 68.17 0.01 0.07 0.04 0.06 0.06 0.02
Max 2000.00 7.82 434.00 135.00 135.00 0.00 13.00 1110.00 1030.00 5.00 1.00 8.20 1.50 3.90 4.70 1.10 220.00 15.00 59.00 70.00 0.00 164.00 0.60 0.00 510.00 0.22 1.50 79.00 0.01 0.66 0.06 0.12 0.09 0.06
Min 533.00 6.70 128.00 78.00 78.00 0.00 1.10 332.00 297.00 1.00 1.00 7.60 0.00 3.10 2.10 0.90 54.00 5.00 24.00 16.00 0.00 95.00 0.00 0.00 80.00 0.07 0.25 56.00 0.01 0.00 0.01 0.03 0.03 0.00
95%i le 1934.00 7.81 422.45 128.95 128.95 0.00 12.45 1066.00 988.75 3.90 1.00 8.09 1.23 3.85 4.48 1.10 209.00 14.45 59.00 67.25 0.00 156.85 0.55 0.00 488.00 0.21 1.07 77.90 0.01 0.33 0.06 0.11 0.09 0.04
Count 12.00 12.00 12.00 12.00 12.00 12.00 12.00 12.00 12.00 12.00 12.00 12.00 12.00 12.00 12.00 12.00 12.00 12.00 12.00 12.00 12.00 12.00 12.00 12.00 12.00 12.00 12.00 12.00 12.00 12.00 12.00 12.00 12.00 12.00
Ting 1
Conductivity pHTotal
Hardness
Tempoary
HardnessAlkalinity
Residual
AlkalinitySilica
Total
dissolved
ions
Total
Dissolved
Solids
Colour Turbidity pH SatSatuartion
IndexMole Ratio
Sodium
Absorpt
Ratio
Figure of
merrit RatioNa Sodium
K
PotassiumCa Calcium
Mg
MagnesiumH Hydrogen
HCO3
Bicarbonate
CO3
Carbonate
OH
HydroxideCl Chloride F Fluoride
NO3
Nitrate
SO4
SulphateFe Iron
Mn
ManganeseZn Zinc
Al
AluminiumB Boron Cu Copper
Average 1343.42 7.97 294.67 111.17 111.17 0.00 5.28 759.08 697.00 1.50 1.00 7.82 0.42 2.75 3.66 0.93 147.50 10.24 45.83 43.83 0.00 133.17 1.08 0.00 311.67 0.15 0.59 67.92 0.01 0.00 0.04 0.12 0.06 0.01
Max 1930.00 8.29 419.00 129.00 129.00 0.00 12.00 1070.00 996.00 3.00 1.00 8.00 0.80 3.50 4.60 1.00 220.00 14.00 59.00 66.00 0.00 152.00 2.20 0.00 490.00 0.23 1.00 79.00 0.01 0.01 0.06 0.22 0.08 0.03
Min 794.00 7.29 177.00 86.00 86.00 0.00 1.40 475.00 428.00 1.00 1.00 7.60 0.10 2.50 2.80 0.90 86.00 6.10 31.00 23.00 0.00 104.00 0.10 0.00 150.00 0.08 0.25 53.00 0.01 0.00 0.01 0.04 0.04 0.00
95%i le 1880.50 8.26 407.45 127.90 127.90 0.00 11.45 1037.00 962.45 3.00 1.00 8.00 0.75 3.23 4.49 1.00 209.00 13.45 59.00 63.25 0.00 152.00 2.04 0.00 468.00 0.21 0.88 78.45 0.01 0.01 0.06 0.21 0.08 0.03
Count 12.00 12.00 12.00 12.00 12.00 12.00 12.00 12.00 12.00 12.00 12.00 12.00 12.00 12.00 12.00 12.00 12.00 12.00 12.00 12.00 12.00 12.00 12.00 12.00 12.00 12.00 12.00 12.00 12.00 12.00 12.00 12.00 12.00 12.00
Blackbutt / Benarkin THM
Black 6
Chloroform Bromodich. Dibromoch. Bromoform Total
Average 10 33 64 44 151
Max 23 51 87 82 210
Min 5 21 45 20 110
95%ile 21 45 82 77 190
Count 48 48 48 48 48
15
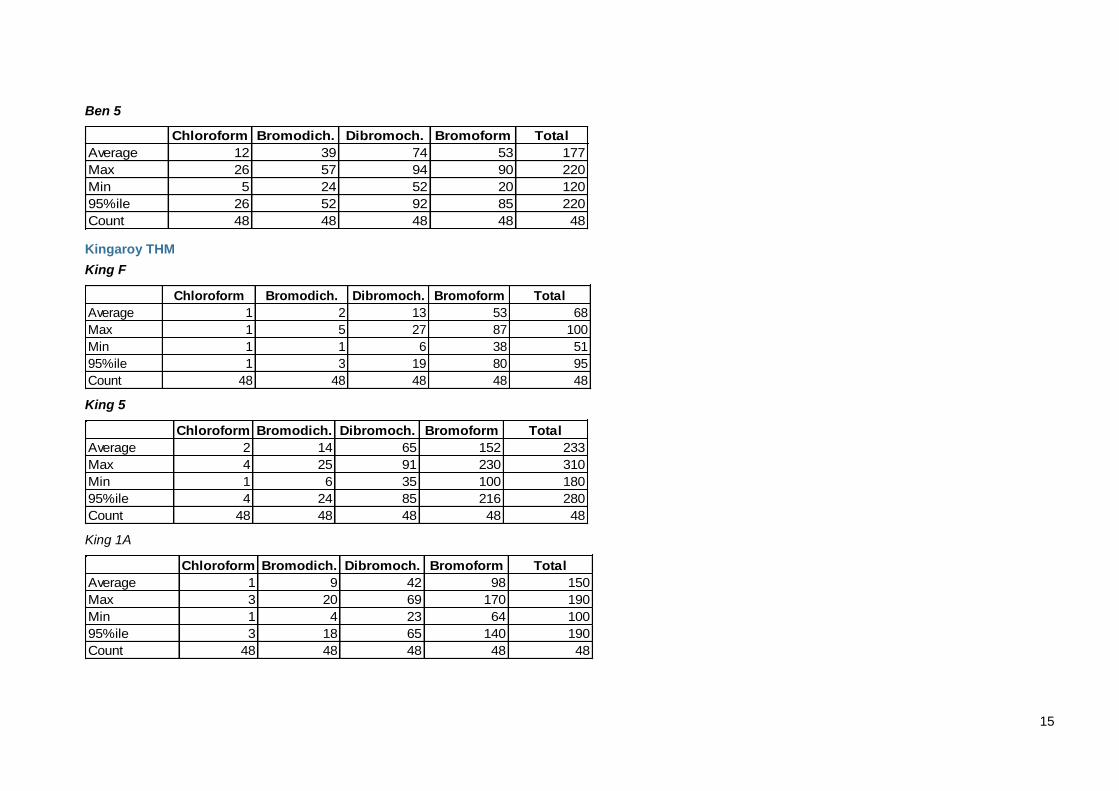
Ben 5
Chloroform Bromodich. Dibromoch. Bromoform Total
Average 12 39 74 53 177
Max 26 57 94 90 220
Min 5 24 52 20 120
95%ile 26 52 92 85 220
Count 48 48 48 48 48
Kingaroy THM
King F
Chloroform Bromodich. Dibromoch. Bromoform Total
Average 1 2 13 53 68
Max 1 5 27 87 100
Min 1 1 6 38 51
95%ile 1 3 19 80 95
Count 48 48 48 48 48
King 5
Chloroform Bromodich. Dibromoch. Bromoform Total
Average 2 14 65 152 233
Max 4 25 91 230 310
Min 1 6 35 100 180
95%ile 4 24 85 216 280
Count 48 48 48 48 48
King 1A
Chloroform Bromodich. Dibromoch. Bromoform Total
Average 1 9 42 98 150
Max 3 20 69 170 190
Min 1 4 23 64 100
95%ile 3 18 65 140 190
Count 48 48 48 48 48
16
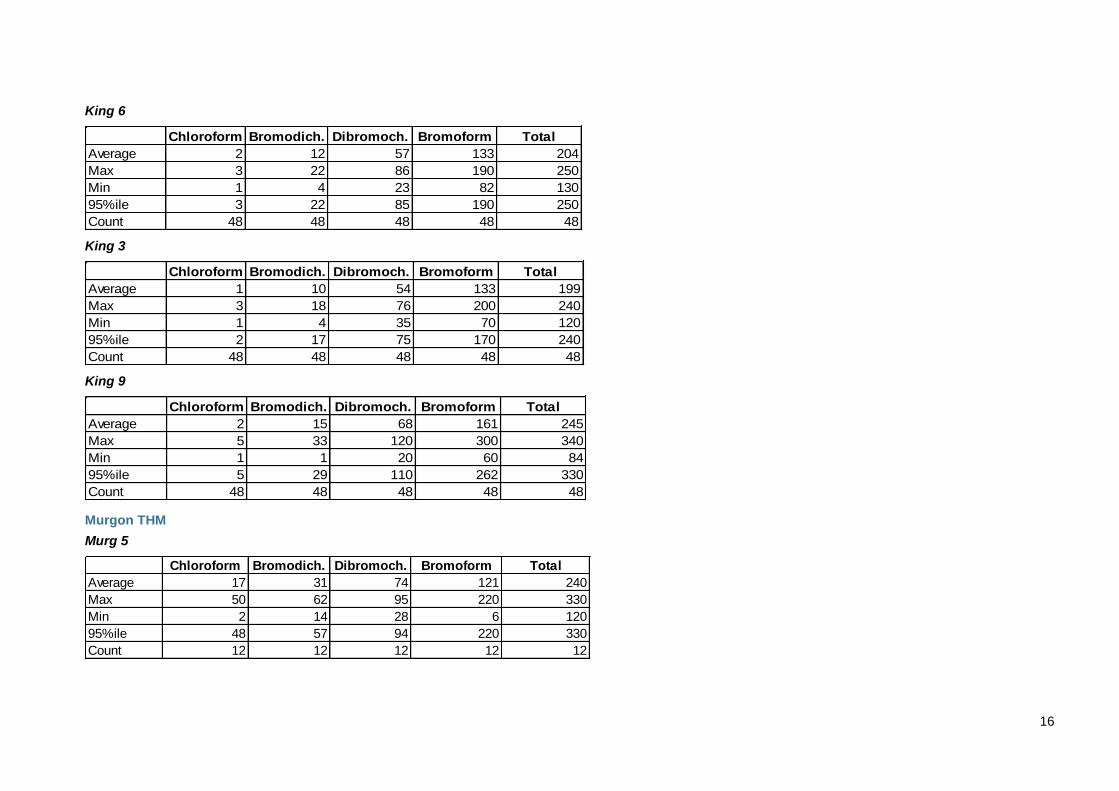
King 6
Chloroform Bromodich. Dibromoch. Bromoform Total
Average 2 12 57 133 204
Max 3 22 86 190 250
Min 1 4 23 82 130
95%ile 3 22 85 190 250
Count 48 48 48 48 48
King 3
Chloroform Bromodich. Dibromoch. Bromoform Total
Average 1 10 54 133 199
Max 3 18 76 200 240
Min 1 4 35 70 120
95%ile 2 17 75 170 240
Count 48 48 48 48 48
King 9
Chloroform Bromodich. Dibromoch. Bromoform Total
Average 2 15 68 161 245
Max 5 33 120 300 340
Min 1 1 20 60 84
95%ile 5 29 110 262 330
Count 48 48 48 48 48
Murgon THM
Murg 5
Chloroform Bromodich. Dibromoch. Bromoform Total
Average 17 31 74 121 240
Max 50 62 95 220 330
Min 2 14 28 6 120
95%ile 48 57 94 220 330
Count 12 12 12 12 12
17
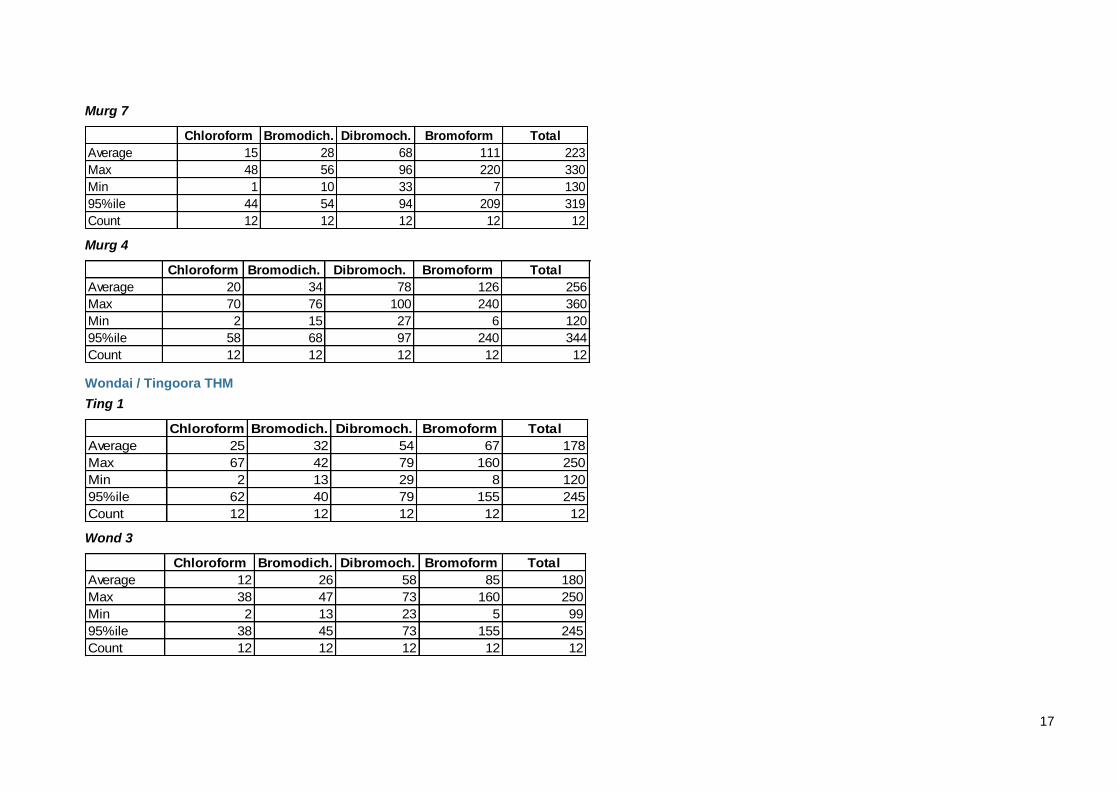
Murg 7
Chloroform Bromodich. Dibromoch. Bromoform Total
Average 15 28 68 111 223
Max 48 56 96 220 330
Min 1 10 33 7 130
95%ile 44 54 94 209 319
Count 12 12 12 12 12
Murg 4
Chloroform Bromodich. Dibromoch. Bromoform Total
Average 20 34 78 126 256
Max 70 76 100 240 360
Min 2 15 27 6 120
95%ile 58 68 97 240 344
Count 12 12 12 12 12
Wondai / Tingoora THM
Ting 1
Chloroform Bromodich. Dibromoch. Bromoform Total
Average 25 32 54 67 178
Max 67 42 79 160 250
Min 2 13 29 8 120
95%ile 62 40 79 155 245
Count 12 12 12 12 12
Wond 3
Chloroform Bromodich. Dibromoch. Bromoform Total
Average 12 26 58 85 180
Max 38 47 73 160 250
Min 2 13 23 5 99
95%ile 38 45 73 155 245
Count 12 12 12 12 12
18
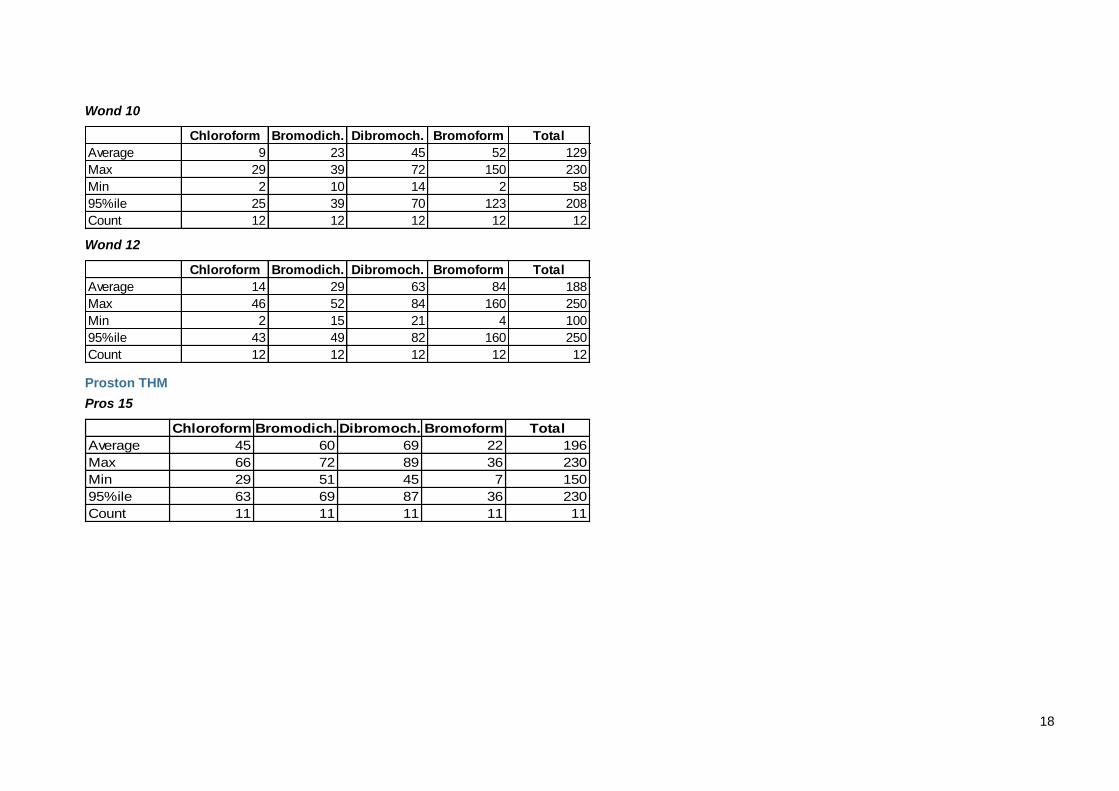
Wond 10
Chloroform Bromodich. Dibromoch. Bromoform Total
Average 9 23 45 52 129
Max 29 39 72 150 230
Min 2 10 14 2 58
95%ile 25 39 70 123 208
Count 12 12 12 12 12
Wond 12
Chloroform Bromodich. Dibromoch. Bromoform Total
Average 14 29 63 84 188
Max 46 52 84 160 250
Min 2 15 21 4 100
95%ile 43 49 82 160 250
Count 12 12 12 12 12
Proston THM
Pros 15
Chloroform Bromodich. Dibromoch. Bromoform Total
Average 45 60 69 22 196
Max 66 72 89 36 230
Min 29 51 45 7 150
95%ile 63 69 87 36 230
Count 11 11 11 11 11
19
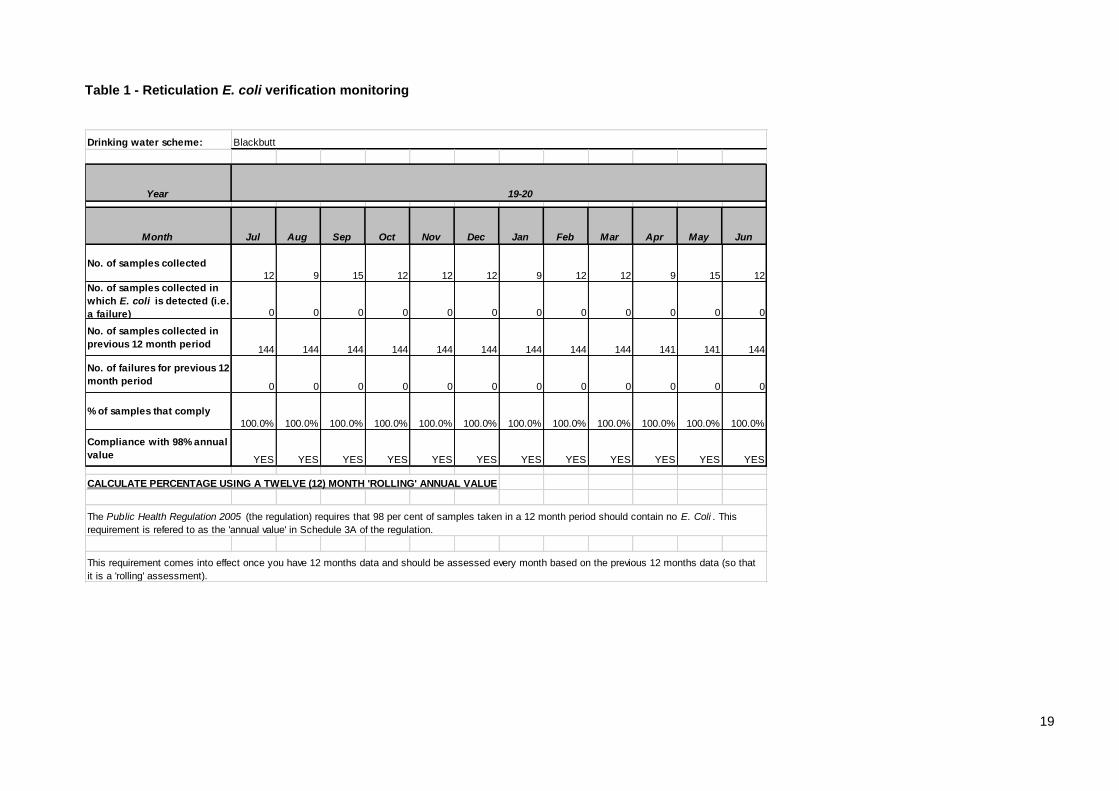
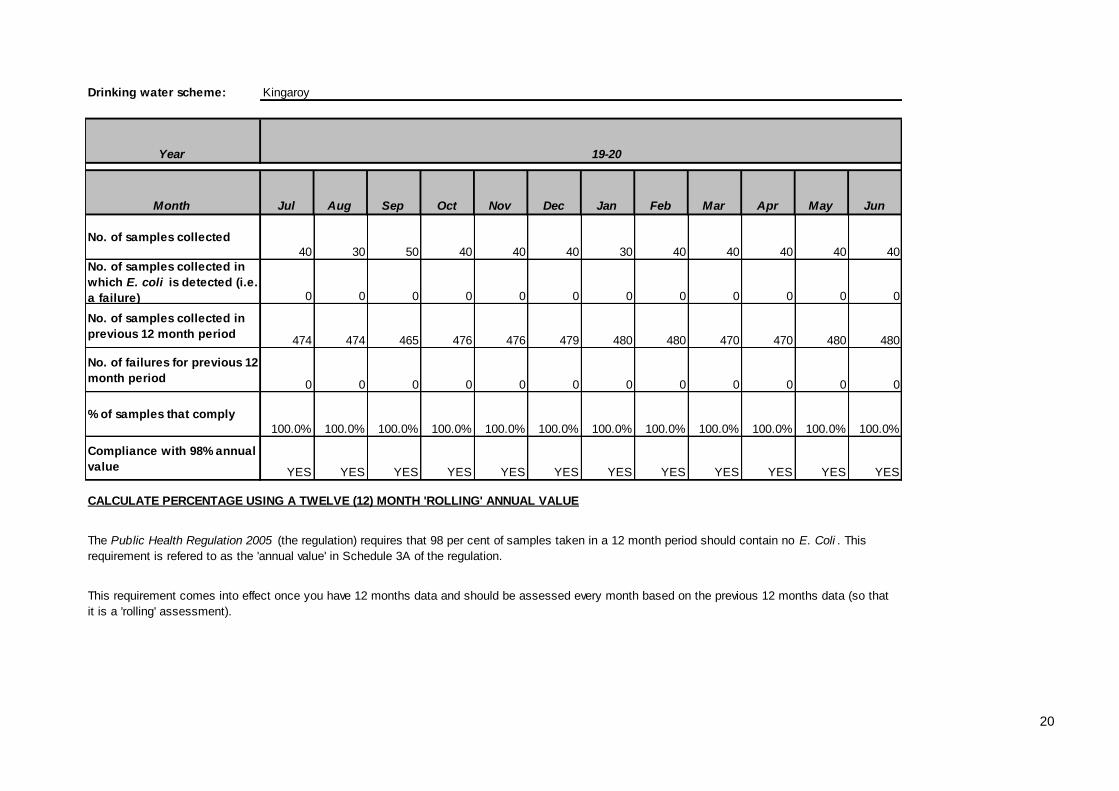
Table 1 - Reticulation E. coli verification monitoring
Drinking water scheme:
Year 19-20
Month Jul Aug Sep Oct Nov Dec Jan Feb Mar Apr May Jun
No. of samples collected
12 9 15 12 12 12 9 12 12 9 15 12
No. of samples collected in
which E. coli is detected (i.e.
a failure) 0 0 0 0 0 0 0 0 0 0 0 0
No. of samples collected in
previous 12 month period144 144 144 144 144 144 144 144 144 141 141 144
No. of failures for previous 12
month period0 0 0 0 0 0 0 0 0 0 0 0
% of samples that comply
100.0% 100.0% 100.0% 100.0% 100.0% 100.0% 100.0% 100.0% 100.0% 100.0% 100.0% 100.0%
Compliance with 98% annual
value YES YES YES YES YES YES YES YES YES YES YES YES
CALCULATE PERCENTAGE USING A TWELVE (12) MONTH 'ROLLING' ANNUAL VALUE
Blackbutt
The Public Health Regulation 2005 (the regulation) requires that 98 per cent of samples taken in a 12 month period should contain no E. Coli . This
requirement is refered to as the 'annual value' in Schedule 3A of the regulation.
This requirement comes into effect once you have 12 months data and should be assessed every month based on the previous 12 months data (so that
it is a 'rolling' assessment).
20
Drinking water scheme:
Year 19-20
Month Jul Aug Sep Oct Nov Dec Jan Feb Mar Apr May Jun
No. of samples collected
40 30 50 40 40 40 30 40 40 40 40 40
No. of samples collected in
which E. coli is detected (i.e.
a failure) 0 0 0 0 0 0 0 0 0 0 0 0
No. of samples collected in
previous 12 month period474 474 465 476 476 479 480 480 470 470 480 480
No. of failures for previous 12
month period0 0 0 0 0 0 0 0 0 0 0 0
% of samples that comply
100.0% 100.0% 100.0% 100.0% 100.0% 100.0% 100.0% 100.0% 100.0% 100.0% 100.0% 100.0%
Compliance with 98% annual
value YES YES YES YES YES YES YES YES YES YES YES YES
CALCULATE PERCENTAGE USING A TWELVE (12) MONTH 'ROLLING' ANNUAL VALUE
The Public Health Regulation 2005 (the regulation) requires that 98 per cent of samples taken in a 12 month period should contain no E. Coli . This
requirement is refered to as the 'annual value' in Schedule 3A of the regulation.
This requirement comes into effect once you have 12 months data and should be assessed every month based on the previous 12 months data (so that
it is a 'rolling' assessment).
Kingaroy

21
Drinking water scheme:
Year 19-20
Month Jul Aug Sep Oct Nov Dec Jan Feb Mar Apr May Jun
No. of samples collected
24 18 24 24 24 24 12 24 24 18 24 30
No. of samples collected in
which E. coli is detected (i.e.
a failure) 0 0 0 0 0 0 0 0 0 0 0 0
No. of samples collected in
previous 12 month period274 274 274 269 276 276 276 270 270 264 270 270
No. of failures for previous 12
month period0 0 0 0 0 0 0 0 0 0 0 0
% of samples that comply
100.0% 100.0% 100.0% 100.0% 100.0% 100.0% 100.0% 100.0% 100.0% 100.0% 100.0% 100.0%
Compliance with 98% annual
value YES YES YES YES YES YES YES YES YES YES YES YES
CALCULATE PERCENTAGE USING A TWELVE (12) MONTH 'ROLLING' ANNUAL VALUE
Murgon
The Public Health Regulation 2005 (the regulation) requires that 98 per cent of samples taken in a 12 month period should contain no E. Coli . This
requirement is refered to as the 'annual value' in Schedule 3A of the regulation.
This requirement comes into effect once you have 12 months data and should be assessed every month based on the previous 12 months data (so that
it is a 'rolling' assessment).

22
Drinking water scheme:
Year 19-20
Month Jul Aug Sep Oct Nov Dec Jan Feb Mar Apr May Jun
No. of samples collected
16 12 20 19 20 20 13 20 20 15 25 15
No. of samples collected in
which E. coli is detected (i.e.
a failure) 0 0 0 0 0 0 0 0 0 0 0 0
No. of samples collected in
previous 12 month period240 236 228 228 222 222 227 220 220 220 215 220
No. of failures for previous 12
month period0 0 0 0 0 0 0 0 0 0 0 0
% of samples that comply
100.0% 100.0% 100.0% 100.0% 100.0% 100.0% 100.0% 100.0% 100.0% 100.0% 100.0% 100.0%
Compliance with 98% annual
value YES YES YES YES YES YES YES YES YES YES YES YES
CALCULATE PERCENTAGE USING A TWELVE (12) MONTH 'ROLLING' ANNUAL VALUE
Nanango
The Public Health Regulation 2005 (the regulation) requires that 98 per cent of samples taken in a 12 month period should contain no E. Coli . This
requirement is refered to as the 'annual value' in Schedule 3A of the regulation.
This requirement comes into effect once you have 12 months data and should be assessed every month based on the previous 12 months data (so that
it is a 'rolling' assessment).

23
Drinking water scheme:
Year 19-20
Month Jul Aug Sep Oct Nov Dec Jan Feb Mar Apr May Jun
No. of samples collected
4 4 4 4 4 4 4 4 4 4 4 4
No. of samples collected in
which E. coli is detected (i.e.
a failure) 0 0 0 0 0 0 0 0 0 0 0 0
No. of samples collected in
previous 12 month period40 41 39 43 43 43 43 44 45 46 47 48
No. of failures for previous 12
month period0 0 0 0 0 0 0 0 0 0 0 0
% of samples that comply
100.0% 100.0% 100.0% 100.0% 100.0% 100.0% 100.0% 100.0% 100.0% 100.0% 100.0% 100.0%
Compliance with 98% annual
value YES YES YES YES YES YES YES YES YES YES YES YES
CALCULATE PERCENTAGE USING A TWELVE (12) MONTH 'ROLLING' ANNUAL VALUE
Proston
The Public Health Regulation 2005 (the regulation) requires that 98 per cent of samples taken in a 12 month period should contain no E. Coli . This
requirement is refered to as the 'annual value' in Schedule 3A of the regulation.
This requirement comes into effect once you have 12 months data and should be assessed every month based on the previous 12 months data (so that
it is a 'rolling' assessment).
24
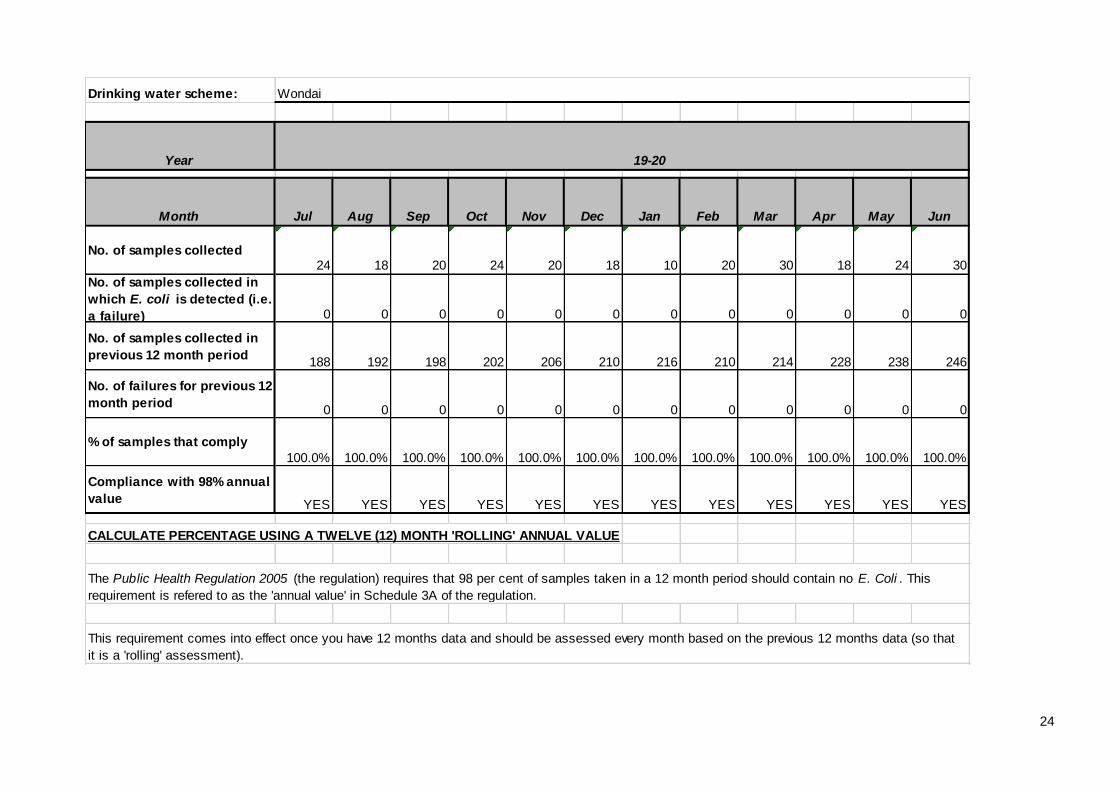
Drinking water scheme:
Year 19-20
Month Jul Aug Sep Oct Nov Dec Jan Feb Mar Apr May Jun
No. of samples collected24 18 20 24 20 18 10 20 30 18 24 30
No. of samples collected in
which E. coli is detected (i.e.
a failure) 0 0 0 0 0 0 0 0 0 0 0 0
No. of samples collected in
previous 12 month period188 192 198 202 206 210 216 210 214 228 238 246
No. of failures for previous 12
month period0 0 0 0 0 0 0 0 0 0 0 0
% of samples that comply
100.0% 100.0% 100.0% 100.0% 100.0% 100.0% 100.0% 100.0% 100.0% 100.0% 100.0% 100.0%
Compliance with 98% annual
value YES YES YES YES YES YES YES YES YES YES YES YES
CALCULATE PERCENTAGE USING A TWELVE (12) MONTH 'ROLLING' ANNUAL VALUE
Wondai
The Public Health Regulation 2005 (the regulation) requires that 98 per cent of samples taken in a 12 month period should contain no E. Coli . This
requirement is refered to as the 'annual value' in Schedule 3A of the regulation.
This requirement comes into effect once you have 12 months data and should be assessed every month based on the previous 12 months data (so that
it is a 'rolling' assessment).
25
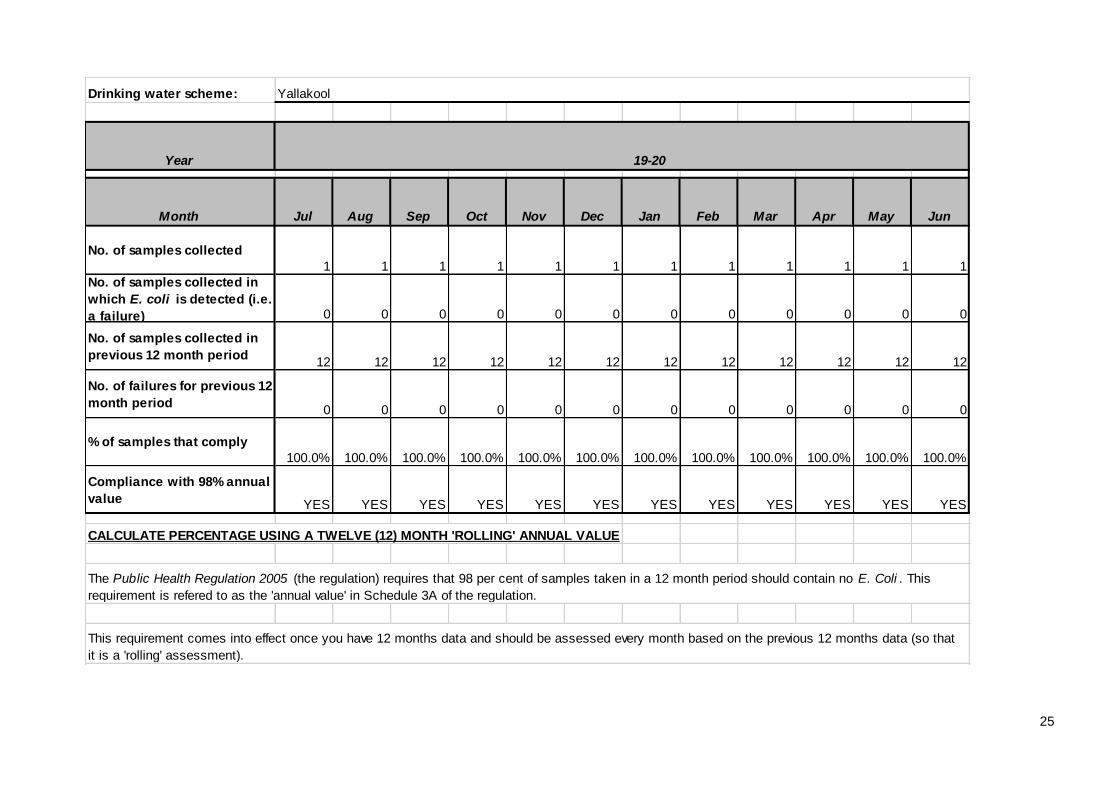
Drinking water scheme:
Year 19-20
Month Jul Aug Sep Oct Nov Dec Jan Feb Mar Apr May Jun
No. of samples collected
1 1 1 1 1 1 1 1 1 1 1 1
No. of samples collected in
which E. coli is detected (i.e.
a failure) 0 0 0 0 0 0 0 0 0 0 0 0
No. of samples collected in
previous 12 month period12 12 12 12 12 12 12 12 12 12 12 12
No. of failures for previous 12
month period0 0 0 0 0 0 0 0 0 0 0 0
% of samples that comply
100.0% 100.0% 100.0% 100.0% 100.0% 100.0% 100.0% 100.0% 100.0% 100.0% 100.0% 100.0%
Compliance with 98% annual
value YES YES YES YES YES YES YES YES YES YES YES YES
CALCULATE PERCENTAGE USING A TWELVE (12) MONTH 'ROLLING' ANNUAL VALUE
Yallakool
The Public Health Regulation 2005 (the regulation) requires that 98 per cent of samples taken in a 12 month period should contain no E. Coli . This
requirement is refered to as the 'annual value' in Schedule 3A of the regulation.
This requirement comes into effect once you have 12 months data and should be assessed every month based on the previous 12 months data (so that
it is a 'rolling' assessment).
Recommended