GCSEMATHEMATICSKEYTOPIC
PRACTICESHEETS
DRAWINGQUADRATICGRAPHS
(EDEXCELHIGHER)
ThesequestionsaresuitableforHigherTierstudents.
Allquestionsshouldbedonewithoutacalculator.
www.tutor2u.net/maths
SAM
PLE
RESOURCE

KeyTopicPracticeSheets DrawingQuadraticGraphs(EdexcelHigher)
Copyrighttutor2u2017 2
1 (a)Completethetableofvaluesfor𝑦 = 𝑥$ + 𝑥 − 1
𝑥 -4 -3 -2 -1 0 1 2
𝑦 11 1 -1 5
(2) (b)Onthegridbelow,drawthegraphof𝑦 = 𝑥$ + 𝑥 − 1forvaluesof𝑥from-4to2
(2)
(TotalforQuestion1is4marks)
SAM
PLE
RESOURCE
KeyTopicPracticeSheets DrawingQuadraticGraphs(EdexcelHigher)
Copyrighttutor2u2017 3
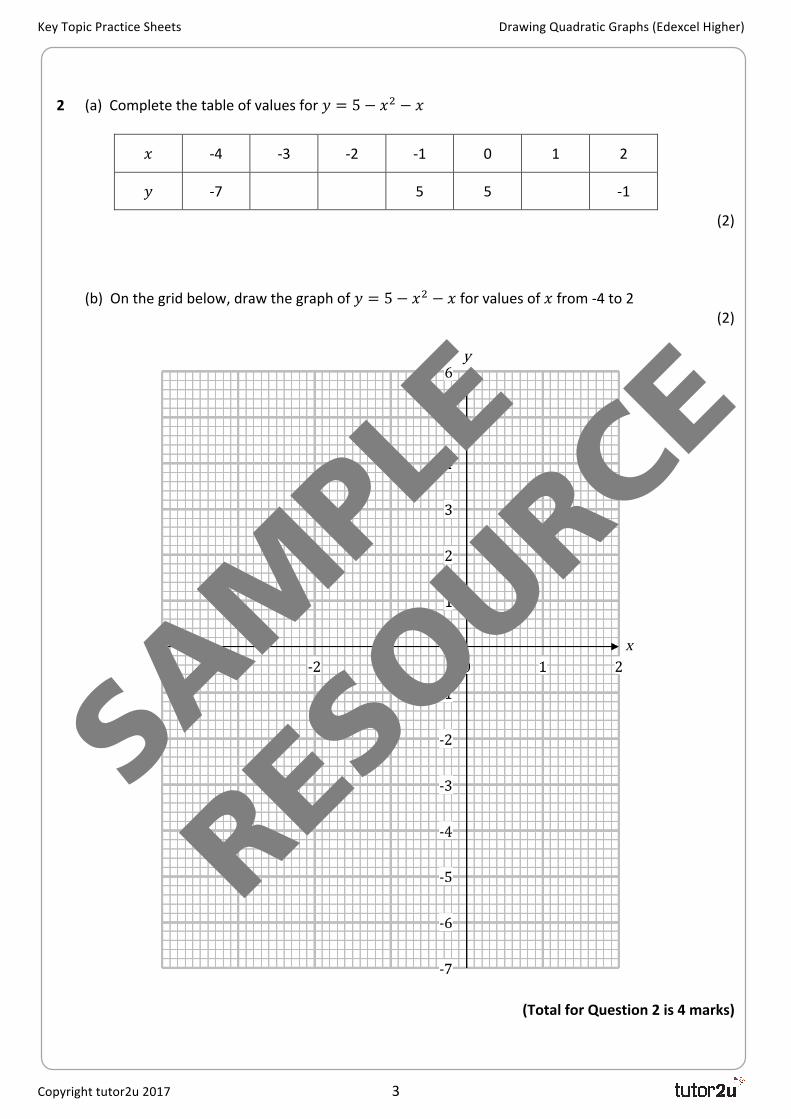
2 (a)Completethetableofvaluesfor𝑦 = 5 − 𝑥$ − 𝑥
𝑥 -4 -3 -2 -1 0 1 2
𝑦 -7 5 5 -1
(2) (b)Onthegridbelow,drawthegraphof𝑦 = 5 − 𝑥$ − 𝑥forvaluesof𝑥from-4to2
(2)
(TotalforQuestion2is4marks)
SAM
PLE
RESOURCE
KeyTopicPracticeSheets DrawingQuadraticGraphs(EdexcelHigher)
Copyrighttutor2u2017 4
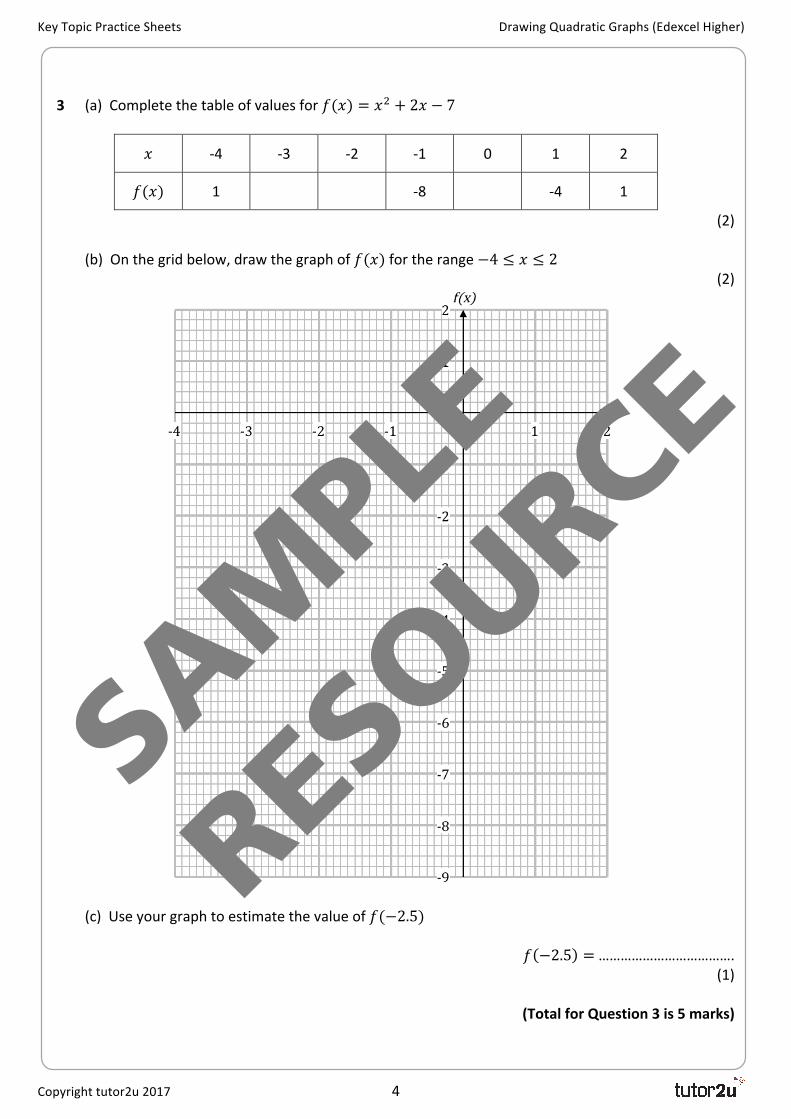
3 (a)Completethetableofvaluesfor𝑓(𝑥) = 𝑥$ + 2𝑥 − 7
𝑥 -4 -3 -2 -1 0 1 2
𝑓(𝑥) 1 -8 -4 1
(2) (b)Onthegridbelow,drawthegraphof𝑓(𝑥)fortherange−4 ≤ 𝑥 ≤ 2
(2)
(c)Useyourgraphtoestimatethevalueof𝑓(−2.5)
𝑓 −2.5 =……………………………….(1)
(TotalforQuestion3is5marks)
SAM
PLE
RESOURCE
KeyTopicPracticeSheets DrawingQuadraticGraphs(EdexcelHigher)
Copyrighttutor2u2017 5
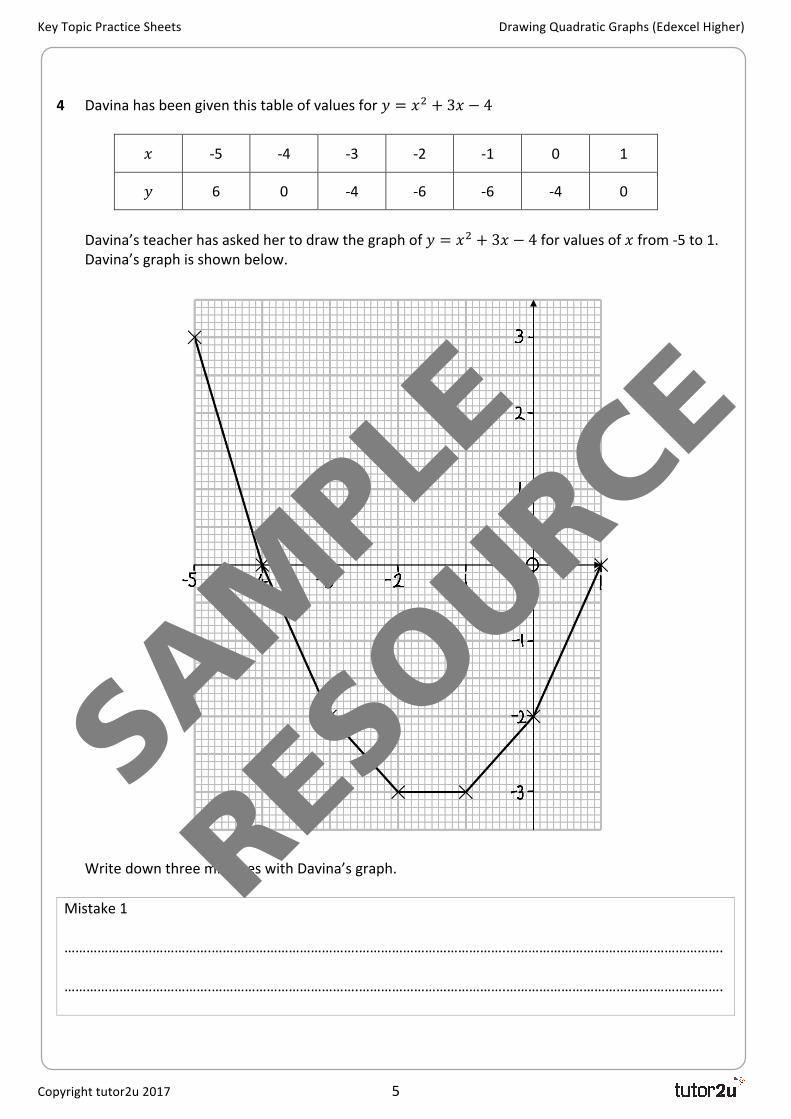
4 Davinahasbeengiventhistableofvaluesfor𝑦 = 𝑥$ + 3𝑥 − 4
𝑥 -5 -4 -3 -2 -1 0 1
𝑦 6 0 -4 -6 -6 -4 0
Davina’steacherhasaskedhertodrawthegraphof𝑦 = 𝑥$ + 3𝑥 − 4forvaluesof𝑥from-5to1. Davina’sgraphisshownbelow.
WritedownthreemistakeswithDavina’sgraph.Mistake1………………………………….………………………………….………………………………….………………………………….……………….………………………………….………………………………….………………………………….………………………………….……………….
SAM
PLE
RESOURCE

KeyTopicPracticeSheets DrawingQuadraticGraphs(EdexcelHigher)
Copyrighttutor2u2017 6
Mistake2………………………………….………………………………….………………………………….………………………………….……………….………………………………….………………………………….………………………………….………………………………….……………….Mistake3………………………………….………………………………….………………………………….………………………………….……………….………………………………….………………………………….………………………………….………………………………….……………….
(TotalforQuestion4is3marks)
SAM
PLE
RESOURCE

KeyTopicPracticeSheets DrawingQuadraticGraphs(EdexcelHigher)
Copyrighttutor2u2017 7
5 (a)Completethetableofvaluesfor𝑓(𝑥) = −𝑥$ + 4𝑥 − 3
𝑥 -1 0 1 2 3 4 5
𝑓(𝑥) -8 0 1 -3
(2) (b)Onthegridbelow,drawthegraphof𝑓(𝑥) = −𝑥$ + 4𝑥 − 3forvaluesof𝑥from-1to5
(2)
(c)Useyourgraphtoestimatethevaluesof𝑥when𝑓(𝑥) = −6
𝑥 =…………………………and…………………………(2)
(TotalforQuestion5is6marks)
SAM
PLE
RESOURCE
KeyTopicPracticeSheets DrawingQuadraticGraphs(EdexcelHigher)
Copyrighttutor2u2017 8
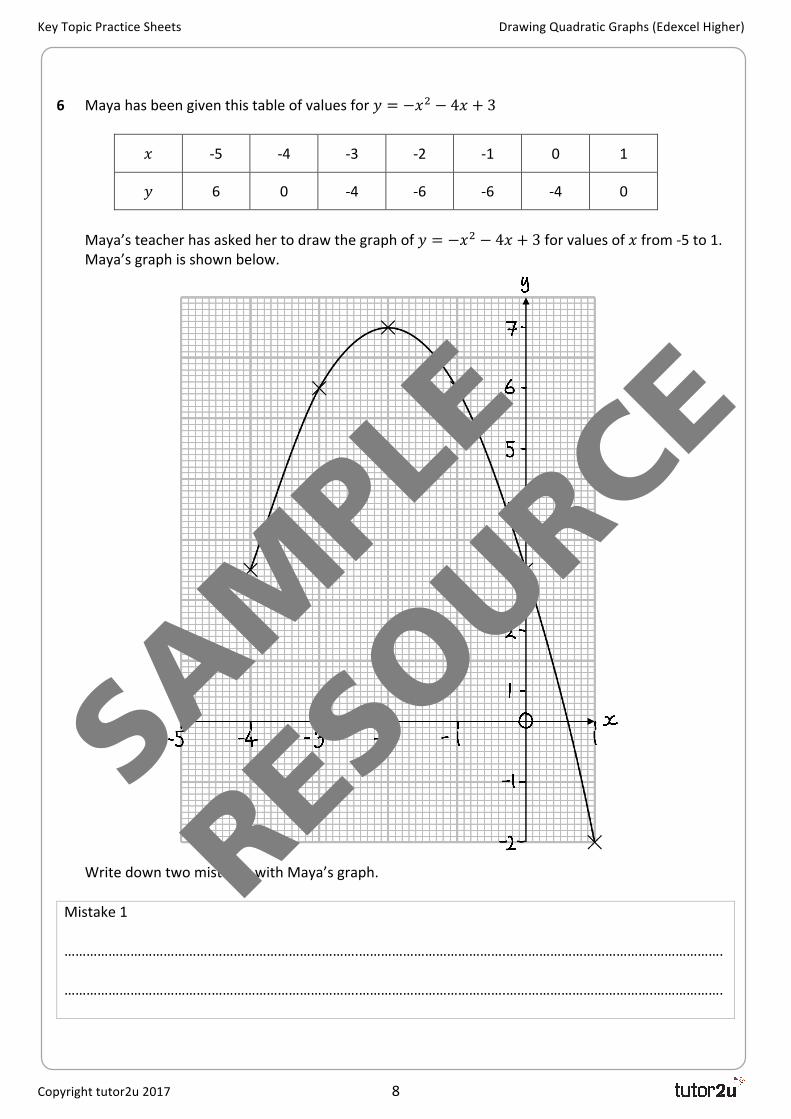
6 Mayahasbeengiventhistableofvaluesfor𝑦 = −𝑥$ − 4𝑥 + 3
𝑥 -5 -4 -3 -2 -1 0 1
𝑦 6 0 -4 -6 -6 -4 0
Maya’steacherhasaskedhertodrawthegraphof𝑦 = −𝑥$ − 4𝑥 + 3forvaluesof𝑥from-5to1. Maya’sgraphisshownbelow.
WritedowntwomistakeswithMaya’sgraph.Mistake1………………………………….………………………………….………………………………….………………………………….……………….………………………………….………………………………….………………………………….………………………………….……………….
SAM
PLE
RESOURCE
KeyTopicPracticeSheets DrawingQuadraticGraphs(EdexcelHigher)
Copyrighttutor2u2017 9
Mistake2………………………………….………………………………….………………………………….………………………………….……………….………………………………….………………………………….………………………………….………………………………….……………….
(TotalforQuestion6is2marks)
SAM
PLE
RESOURCE
KeyTopicPracticeSheets DrawingQuadraticGraphs(EdexcelHigher)
Copyrighttutor2u2017 10
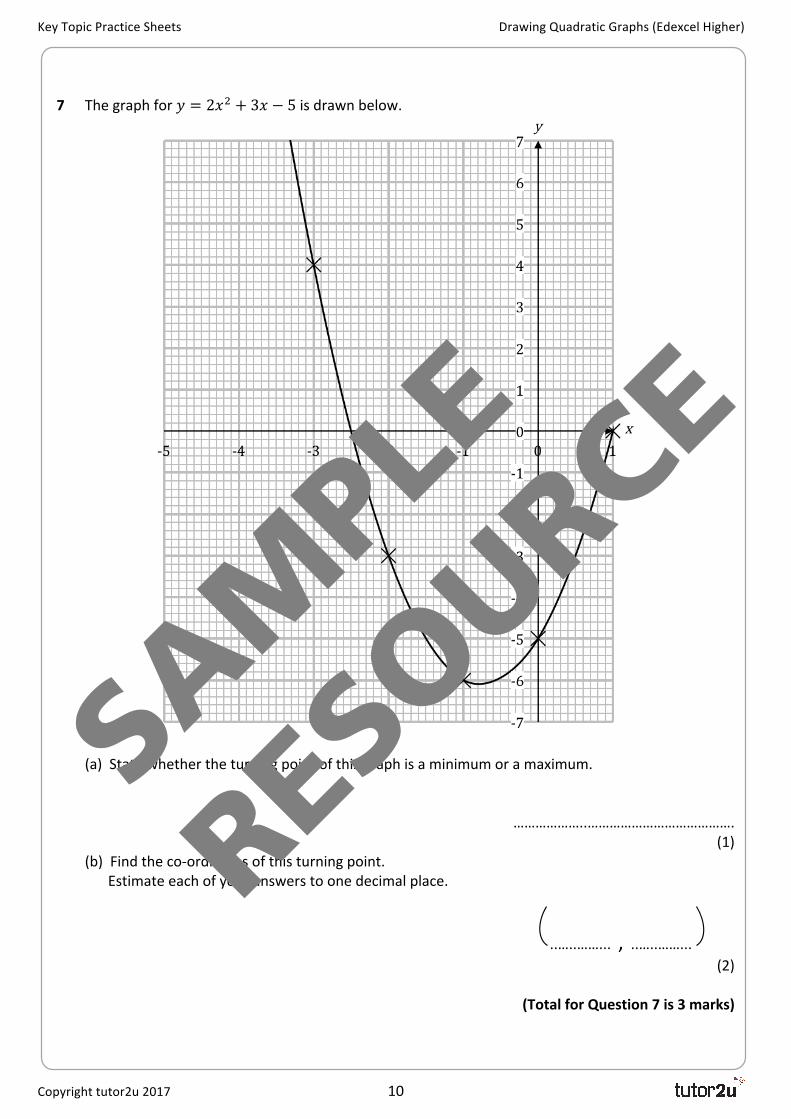
7 Thegraphfor𝑦 = 2𝑥$ + 3𝑥 − 5isdrawnbelow.
(a)Statewhethertheturningpointofthisgraphisaminimumoramaximum.
………………..………………………………….(1)
(b)Findtheco-ordinatesofthisturningpoint. Estimateeachofyouranswerstoonedecimalplace.
..…..……...,..…..……...
(2)
(TotalforQuestion7is3marks)
SAM
PLE
RESOURCE
KeyTopicPracticeSheets DrawingQuadraticGraphs(EdexcelHigher)
Copyrighttutor2u2017 11
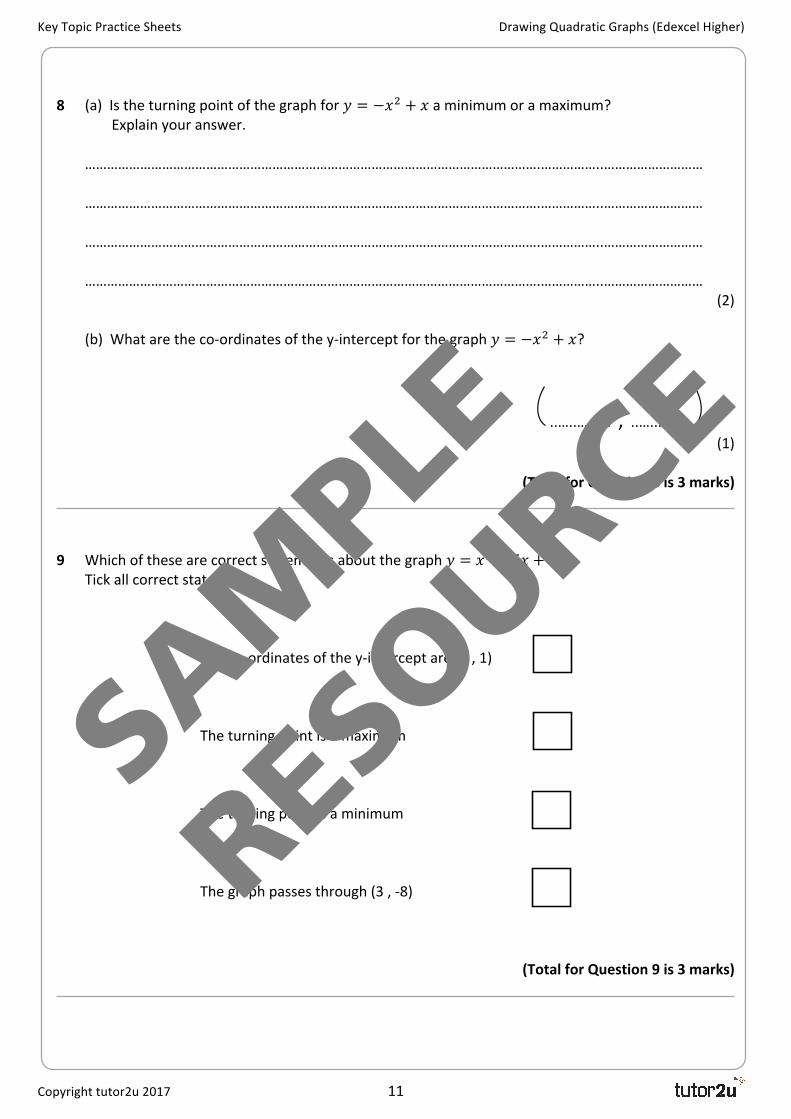
8 (a)Istheturningpointofthegraphfor𝑦 = −𝑥$ + 𝑥aminimumoramaximum? Explainyouranswer. …………………………………………………………………………………………………………….……………..……………………… …………………………………………………………………………………………………………….……………..……………………… …………………………………………………………………………………………………………….……………..……………………… …………………………………………………………………………………………………………….……………..………………………
(2) (b)Whataretheco-ordinatesofthey-interceptforthegraph𝑦 = −𝑥$ + 𝑥? ..…..……...,..…..……...
(1)
(TotalforQuestion8is3marks)
9 Whichofthesearecorrectstatementsaboutthegraph𝑦 = 𝑥$ − 5𝑥 + 1? Tickallcorrectstatements. Theco-ordinatesofthey-interceptare(0,1)
Theturningpointisamaximum Theturningpointisaminimum Thegraphpassesthrough(3,-8)
(TotalforQuestion9is3marks)
SAM
PLE
RESOURCE
KeyTopicPracticeSheets DrawingQuadraticGraphs(EdexcelHigher)
Copyrighttutor2u2017 12
10 Theturningpointofthegraph𝑦 = 𝑥$ − 6𝑥 + 10is(a,b) aandbareintegers. Explain,withtheuseofadiagramorotherwise,whytheturningpointofthegraphcannotlie betweenthecoordinates(5,5)and(7,17).
(TotalforQuestion10is3marks)
SA
MPL
E
RESOURCE
KeyTopicPracticeSheets DrawingQuadraticGraphs(EdexcelHigher)
Copyrighttutor2u2017 13
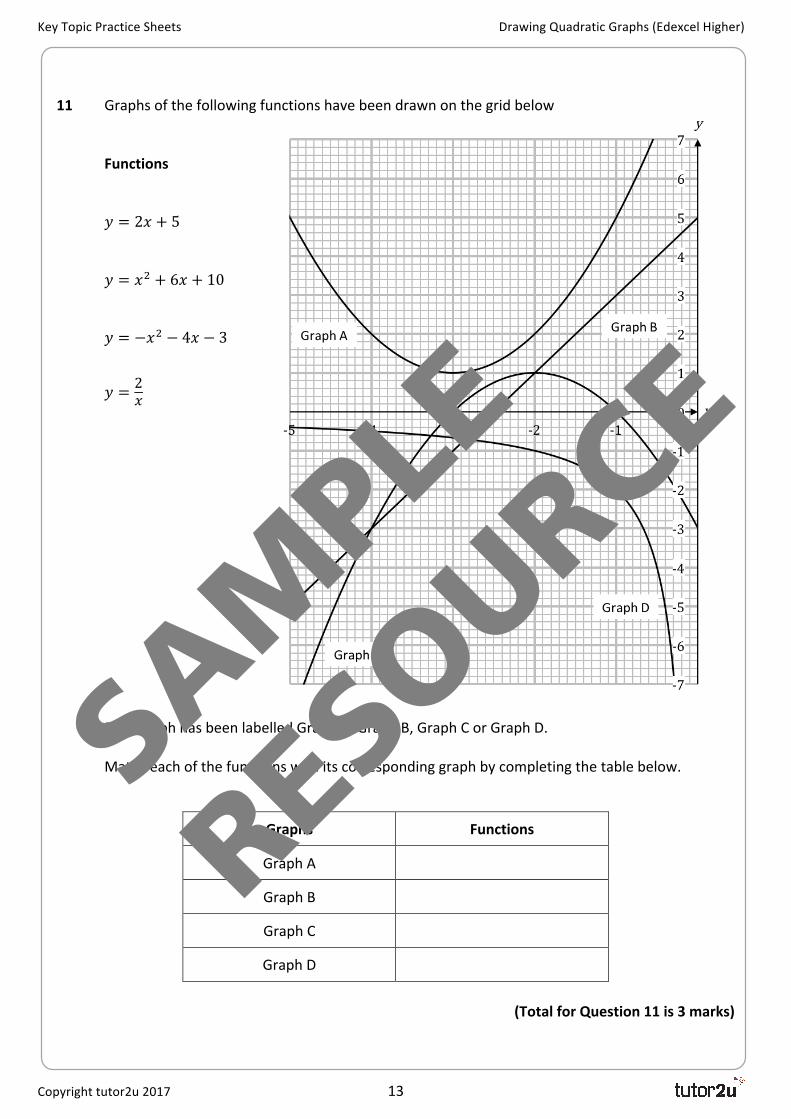
11 Graphsofthefollowingfunctionshavebeendrawnonthegridbelow
Functions
𝑦 = 2𝑥 + 5𝑦 = 𝑥$ + 6𝑥 + 10𝑦 = −𝑥$ − 4𝑥 − 3
𝑦 = 2𝑥
EachgraphhasbeenlabelledGraphA,GraphB,GraphCorGraphD.
Matcheachofthefunctionswithitscorrespondinggraphbycompletingthetablebelow.
Graphs Functions
GraphA
GraphB
GraphC
GraphD
(TotalforQuestion11is3marks)
SAM
PLE
RESOURCE

KeyTopicPracticeSheets DrawingQuadraticGraphs(EdexcelHigher)
Copyrighttutor2u2017 14
12 (a)Completethetableofvaluesfor𝑦 = 𝑥(3 − 𝑥)
𝑥 -2 -1 0 1 2 3 4
𝑦 -10 2 0 -4
(2) (b)Onthegridbelow,drawthegraphof𝑦 = 𝑥(3 − 𝑥)forvaluesof𝑥from-2to4
(2)
SAM
PLE
RESOURCE
KeyTopicPracticeSheets DrawingQuadraticGraphs(EdexcelHigher)
Copyrighttutor2u2017 15
(c)Bydrawingtheline𝑦 = 2𝑥 − 2onthesamegrid,solvetheequations
𝑦 = 3𝑥 − 𝑥$𝑦 = 2𝑥 − 2
𝑥 =………………………,𝑦 =………………………or𝑥 =………………………,𝑦 =………………………
(3)
(TotalforQuestion12is7marks)
SAM
PLE
RESOURCE

KeyTopicPracticeSheets DrawingQuadraticGraphs(EdexcelHigher)
Copyrighttutor2u2017 16
13 (a)Completethetableofvaluesfor𝑦 = 𝑥$ − 3𝑥 − 1
𝑥 -1 0 1 2 3 4 5
𝑦 -1 -1 3 9
(2) (b)Onthegridbelow,drawthegraphof𝑦 = 𝑥$ − 3𝑥 − 1forvaluesof𝑥from-1to5
(2)
SAM
PLE
RESOURCE
KeyTopicPracticeSheets DrawingQuadraticGraphs(EdexcelHigher)
Copyrighttutor2u2017 17
Thesolutionto𝑥$ − 3𝑥 − 1 < 2is𝑎 < 𝑥 < 𝑏 (c)Bydrawingtheline𝑦 = 2onthesamegrid,findestimatesforthevaluesof𝑎and𝑏. Giveyouranswerstoonedecimalplace.
𝑎 =………………………………….
𝑏 =………………………………….(3)
(TotalforQuestion13is7marks)
SAM
PLE
RESOURCE

KeyTopicPracticeSheets DrawingQuadraticGraphs(EdexcelHigher)
Copyrighttutor2u2017 18
14 (a)Drawthegraphfor𝑦 = 𝑥$ − 1onthegridbelowforvaluesintherange−3 < 𝑥 < 3
(4)
(b)Onthesamegrid,drawthegraphfor𝑥$ + 𝑦$ = 4
(2)
SAM
PLE
RESOURCE

KeyTopicPracticeSheets DrawingQuadraticGraphs(EdexcelHigher)
Copyrighttutor2u2017 19
(c)Usingyouranswerstoparts(a)and(b),estimatethesolutionstotheequations
𝑥$ + 𝑦$ = 4𝑦 = 𝑥$ − 1
𝑥 =………………………,𝑦 =………………………or𝑥 =………………………,𝑦 =………………………
(3)
(TotalforQuestion14is4marks)
SAM
PLE
RESOURCE
KeyTopicPracticeSheets DrawingQuadraticGraphs(EdexcelHigher)
Copyrighttutor2u2017 20
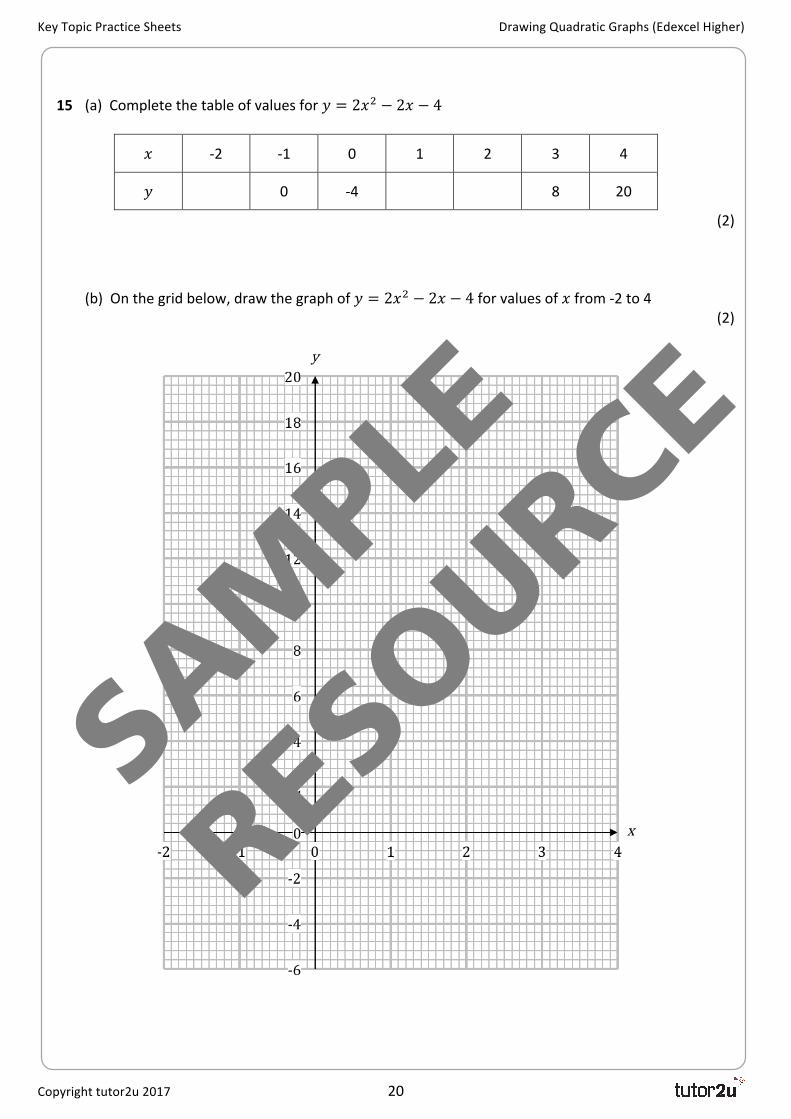
15 (a)Completethetableofvaluesfor𝑦 = 2𝑥$ − 2𝑥 − 4
𝑥 -2 -1 0 1 2 3 4
𝑦 0 -4 8 20
(2) (b)Onthegridbelow,drawthegraphof𝑦 = 2𝑥$ − 2𝑥 − 4forvaluesof𝑥from-2to4
(2)
SAM
PLE
RESOURCE
KeyTopicPracticeSheets DrawingQuadraticGraphs(EdexcelHigher)
Copyrighttutor2u2017 21
Useyourgraphtoanswerthefollowingquestions (c)Estimatethegradientofthecurveatthepoint(3,8)
Gradient=………………………………….(2)
(d)Estimatetheareaenclosedbetweenthecurveandthex-axis. Youmustshowallyourworkingout.
Area=………………………………….(4)
(TotalforQuestion15is10marks)
SAM
PLE
RESOURCE
Recommended

![DRAWING QUADRATIC GRAPHS 5r1]mg4g5k74lg (AQA HIGHER) · GCSE MATHEMATICS KEY TOPIC PRACTICE SHEETS DRAWING QUADRATIC GRAPHS (AQA HIGHER) These questions are suitable for Higher Tier](https://img.pdfslide.us/doc/110x75/5fc11505ba91c411ce57aa68/drawing-quadratic-graphs-5r1mg4g5k74lg-aqa-higher-gcse-mathematics-key-topic.jpg)