System analysis and performance assessment of the Royal Jordanian Air Cargo Warehouse
An undergraduate project in Industrial Engineering Presented to
The Faculty of Engineering Applied Science University
In Partial Fulfillment of the Requirements for the DegreeBachelor of Industrial Engineering
ByOmar Hussein “Ibrahim Ayesh”
Hamzeh Walid Nazzal
Supervised by:Dr. Lina Al-Qatawneh
Amman-JordanJanuary 2011
Abstract
2
As Industrial engineers our main scope is to analyze any system
and assess it for any malfunctions or improvements. The RJ air
cargo warehouse was available for us, and it was a golden chance
to do our thing, to analyze and assess. And to do that, first we
started to read and increase our knowledge about warehouses and
specially air cargo warehouse systems. So we can comprehend the
system and get some key indicators to measure the performance in
the system. Then we started to analyze the system in the RJ air
cargo warehouse. Illustrating the systems’ operations and the flow
of goods and information’s in a simple way, with a profound
analysis in the export area.
Their main concern was whether their labor power is enough or
not, so we choose a couple of key performance indicators and
started collecting data for each operator and interviewing their
supervisors. And that led us to provide a better assessment about
their operators. Eventually, most of them were well utilized and
productive except for “other carriers’ preparations” operator.
3
Acknowledgement
4

“The teacher if he is indeed wise does not teach you to enter the
house of his wisdom but rather leads you to the threshold of your
own mind.”Gobran Khalil Gobran.
To all the wise people that have helped us thank you. We are very
thankful to everyone who supported us, and enabled us to complete
our project effectively and moreover on time.
Mr. Mohannad Awwad, Mr. Ammar Obeidat, Mr. Yousef Al-
Massri, Mr. Tareq Sndeed, Mr. Omar Hmaid, Mr. Samer Jehad,
Fadi Ahmad and all the staff of the Royal Jordanian cargo
warehouse, thank you for your incredible support it has been a
pleasure working with you.
Special thanks to our supervisor Dr. Lina Al-Qatawneh for her
patience and support, she gave us moral support and guided us in
different matters regarding the topic. To all the teaching staff and
engineers in Applied Science University especially at Mechanical
and Industrial Department, thank you for your overall supports.
Last but not the least, we would like to thank our parents who
supported us in the hard time and guided us during difficulties and
Thank you much more, Than a greeting can say, Because you were
thoughtful, In such a nice way, I delicate this project in the
memory of my father and my brother, I wished you were here
5
Table of contents
6

Contents Page
Abstract..............................................................................................................2
Acknowledgement..............................................................................................4
Table of contents................................................................................................6
List of Figures......................................................................................................9
List of Tables.....................................................................................................13
1 Chapter one: Introduction.........................................................................................15
1.1 General Introduction................................................................................................16
1.2 Problem statement...................................................................................................18
1.3 Objective..................................................................................................................18
1.4 Methodology............................................................................................................19
1.5 Project report overview...........................................................................................20
2 Chapter two: Literature Review.................................................................................21
2.1 Air-Cargo supply chain...........................................................................................22
2.2 Warehouse System..................................................................................................24
2.3 Warehouse operations..............................................................................................25
2.4 Air cargo Warehouse Operations.............................................................................26
2.4.1 Export area...........................................................................................27
2.4.2 Import area...........................................................................................27
2.4.3 Unit load device (ULD).......................................................................28
2.5 Performance measurement.......................................................................................29
2.6 Warehouse Key Performance Indicators.................................................................30
2.7 Determine KPI.........................................................................................................31
2.7.1 Receiving.............................................................................................31
2.7.2 Put-away..............................................................................................32
2.7.3 Storage.................................................................................................32
2.7.4 Pick-n-Pack..........................................................................................32
2.7.5 Shipping...............................................................................................33
2.8 Labor productivity...................................................................................................34
3 Chapter Three: System Analysis of Royal Jordanian air cargo warehouse.................35
3.1 Royal Jordanian Warehouse....................................................................................36
3.2 Overview of the Royal Jordanian’s cargo terminal operations...............................36
3.3 Types of goods stored in RJ warehouse..................................................................50
3.4 Cargo Terminal capacity Analysis...........................................................................52
3.5 Cargo terminal handling system..............................................................................55
7
3.6 Warehouse human resources and operating times...................................................56
3.7 Profound RJ export area analysis............................................................................57
3.7.1 Sources of goods..................................................................................57
3.7.1.1 Transit shipments.........................................................................57
3.7.1.2 New shipments.............................................................................58
3.8 Operations at the export area...................................................................................59
3.8.1 Acceptance:.................................................................................................59
3.8.2 Put-Away and Inspection:..........................................................................60
3.8.3 Storage........................................................................................................60
3.8.4 Pick and Pack..............................................................................................61
3.8.5 Shipping......................................................................................................62
4 Chapter Four: Performance Assessment....................................................................63
4.1 Key Performance Indicators (KPIs)........................................................................64
4.2 Operators at export area...........................................................................................65
4.3 Types of collected data............................................................................................65
4.4 Period of data collected...........................................................................................66
4.5 Considerations and limitations................................................................................66
4.6 Performance assessment for the “Reception and Accounting” operator.................67
4.7 Performance assessment for the “Unloading and Weighting” operator..................73
4.8 Performance assessment for the “Put-away” operator.............................................77
4.9 Performance assessment for the “Storage (Yard)” operator....................................82
4.10........................................Performance assessment for the “Collect (Yard)” operator.................................................................................................................................87
4.11............................Performance assessment for the “Preparation RJ flights” operator.................................................................................................................................92
4.12..........Performance assessment for the “Preparation other carriers’ flights” operator.................................................................................................................................97
4.13...........................................Performance assessment for the “ETV system” operator...............................................................................................................................102
Discussion and Conclusions................................................................................104
Recommendations..............................................................................................107
References..........................................................................................................111
Appendix A.........................................................................................................113
8
List of Figures
9
Figure 2.1:The traditional air cargo system..................................23Figure 2.2: ULD types and their respective tag positions.............29Figure 3.1: RJ cargo warehouse layout.........................................37Figure 3.2 Flow diagram: The path taken by a good as it flows through import in warehouse........................................................41Figure 3.3: RJ import area specify operational area.....................42Figure 3.4 Flow diagram: The path taken by a good as it flows through export in warehouse.........................................................43Figure 3.5: RJ export area specify operational area......................44Figure 3.6: Land access Truck Transfer doors.............................53Figure 3.7: Elevating vehicle and ULD storage racks..................53Figure 3.8: Storage Racks.............................................................54Figure 3.9: Workstation................................................................54Figure 3.10: Cold room and freezer Room...................................54Figure 4.1: Reception and accounting operators utilization for week one.......................................................................................69Figure 4.2: Reception and accounting operators productivity for week one.......................................................................................69Figure 4.3: Reception and accounting operators utilization for week two.......................................................................................70Figure 4.4: Reception and accounting operators productivity for week two.......................................................................................71Figure 4.5: Utilization comparison for two weeks for the Reception and Accounting operator/s...........................................71Figure 4.6: Productivity comparison for two weeks for the Reception and Accounting operators............................................72Figure 4.7: Unloading and weighting operator’s utilization for week one.......................................................................................74Figure 4.8: Unloading and weighting operator’s productivity for week one.......................................................................................74Figure 4.9: Unloading and weighting operator’s utilization for week two.......................................................................................75Figure 4.10: Unloading and weighting operator’s productivity for week two.......................................................................................76Figure 4.11: Utilization comparison for two weeks for Unloading & weighing operators....................................................................76Figure 4.12: Productivity comparison for two weeks for Unloading & weighing operators..................................................77Figure 4.13: Put-away operator’s utilization for week one..........79Figure 4.14: Put-away operator’s productivity for week one.......79Figure 4.15: Put-away operator’s utilization for week two..........80
10

Figure 4.16: Put-away operator’s productivity for week two.......81Figure 4.17: Utilization comparison for two weeks for Put-away operators........................................................................................81Figure 4.18: Productivity comparison for two weeks for Put-away operators........................................................................................82Figure 4.19: Storage (Yard) operator’s utilization for week one..84Figure 4.20: Storage (Yard) operator’s productivity for week one......................................................................................................84Figure 4.21: Storage (Yard) operator’s utilization for week two. 85Figure 4.22: Storage (Yard) operator’s productivity for week two......................................................................................................86Figure 4.23: Utilization comparison for two weeks for Storage (Yard) operators............................................................................86Figure 4.24: Productivity comparison for two weeks for Storage (Yard) operators............................................................................87Figure 4.25: Collect (Yard) operator’s utilization for week one. .89Figure 4.26: Collect (Yard) operator’s productivity for week one......................................................................................................89Figure 4.27: Collect (Yard) operator’s utilization for week two. .90Figure 4.28: Collect (Yard) operator’s productivity for week two......................................................................................................90Figure 4.29: Utilization comparison for two weeks for Collect (Yard) operators............................................................................91Figure 4.30: Productivity comparison for two weeks for Collect (Yard) operators............................................................................91Figure 4.31: Preparation RJ flights operator’s utilization for week one.................................................................................................93Figure 4.32: Preparation RJ flights operator’s productivity for week one.......................................................................................94Figure 4.33: Preparation RJ flights operator’s utilization for week two................................................................................................95Figure 4.34: Preparation RJ flights operator’s productivity for week two.......................................................................................95Figure 4.35: Utilization comparison for two weeks for RJ Preparations operators...................................................................96Figure 4.36: Productivity comparison for two weeks for RJ Preparations operators...................................................................96Figure 4.37: Preparation other carriers’ flights operator’s utilization for week one................................................................98Figure 4.38: Preparation other carriers’ flights operator’s productivity for week one.............................................................99
11
Figure 4.39: Preparation other carriers’ flights operator’s utilization for week two..............................................................100Figure 4.40: Preparation other carriers’ flights operator’s productivity for week two...........................................................100Figure 4.41: Comparing the utilization for two weeks for other carriers Preparations operator/s..................................................101Figure 4.42: Productivity comparison for two weeks for other carriers Preparations operator/s..................................................101
12
List of Tables
13
Table 3.1: Export & Import Clearance Procedure at Royal Jordanian air cargo warehouse......................................................46Table 3.2: Special load codes.......................................................50Table 4.1: Operators’ classification according to operation’s type......................................................................................................65Table 4.2: Data collected and performance assessment for reception and accounting operator/s for week one.......................68Table 4.3: Data collected and performance assessment for reception and accounting operator/s in week two.........................70Table 4.4: Data collected and performance assessment for unloading and weighting operator in week one............................74Table 4.5: Data collected and performance assessment for unloading and weighting operator week two................................75Table 4.6: Data collected and performance assessment for Put-away operator in week one...........................................................78Table 4.7: Data collected and performance assessment for Put-away operator in week two...........................................................80Table 4.8: Data collected and performance assessment for Put-away operator/s in week one.........................................................83Table 4.9: Data collected and performance assessment for Storage (Yard) operator/s in week two......................................................85Table 4.10: Data collected and performance assessment for collect (Yard) operators in week one........................................................88Table 4.11: Data collected and performance assessment for collect (Yard) operator/s in week two......................................................90Table 4.12: Data collected and performance assessment for Preparation RJ flights operator/s in week one..............................93Table 4.13: Data collected and performance assessment for Preparation RJ flights operator/s in week two..............................94Table 4.14: Data collected and performance assessment for Preparation other carriers’ flights operators in week one.............98Table 4.15: Data collected and performance assessment for Preparation other carriers’ flights operator/s in week two............99Table 4.16: The operators’ average utilization and productivity for two weeks...................................................................................103
14
1 Chapter one: Introduction
15

1.1 General Introduction
Today’s modern society demands an advanced transportation
system to overcome distances, preferably in a fast, safe,
comfortable and reliable way (European Commission, 2003).
Distances might be a roadblock for people wanting to
socialize out of home, enjoy education, doing business and so
on. But not only individuals are daily on the road overcoming
the distance between the place they are and the place they want
to be; also raw materials, spare parts and finished goods are every
day on the move from one place to another enabling companies to
produce, assemble or sell their goods. These movements are
facilitated by companies offering transportation services. As
passengers and particularly goods rarely do move for the sake
of travelling, transportation services generally have a diverted
character because the demand for transport depends on underlying
reasons or final activities that makes transport necessary (De Wit,
Van Gent, 2001). Furthermore, the transportation industry consists
of two subsystems, one for passengers transport and one for cargo
transport.
Although these two subsystems are sometimes interrelated,
this thesis excludes the subsystem of passenger transport and
focuses on cargo transport, particularly on air cargo. Within the
transportation domain, several modes of transport can be
identified: road, rail, sea and air being important ones. In many
cases a combination of these modes is used to effectively
16
relocate. In air transport for instance, surface transport is needed
to reach the airport of origin and after arrival at the destination
airport surface transport is needed again to reach the final
destination. Therefore, air cargo is much more than just the
‘air’ component; isolation from other transport modes does not
make sense as interdepencies with other modes of transport
exists. Air cargo transport has an intermodal nature by
definition.
Compared to other transport modalities, air cargo has some
overall advantages and disadvantages. The overall advantages of
air cargo are the velocity of air cargo transport on medium and
long distances, high standards of safety, high reliability in cargo
transport and dense international flight networks. Overall
disadvantages are the expensiveness of air cargo, its lack of
applicability on short distances and the difficulty to obtain
economies of scale by cost digression due to the restraint
capacities of cargo vehicles (Uniconsult, 2005).
Royal Jordanian (RJ) air cargo warehouse is the only company in
Amman, Jordan that delivers and receives cargo in and out through
its airport. RJ cargo warehouse was built serving all air flight
companies and a lot of distributors through their offices which
located either within the cargo warehouse or the office in the
Second Circle in heart of Amman. Royal Jordanian Cargo flies to
over 60 destinations and 40 countries committed to providing the
best possible of most comprehensive and most convenient logistics
services to their customers. Their investments in the right
17
professional and administrative teams, as well as warehouse
technology allow them to best serve Jordan vision of logistics
services as their beacon to leading the way through best
performance, productivity, reliability and excellence.
As known, storage and movement of goods need controlling the
various warehouse operations. The benefits are significant if done
efficiently to provide the required level of customer service at the
lowest total cost.
In our work we mainly focus on the warehouse considering it as a
system. For the RJ air cargo, the warehouse is the main income
source that varies hugely with the degree of the utilization of its
operations/performance.
1.2 Problem statement
After interviewing the supervisors at the RJ cargo warehouse, their
main concern is the lack of man power. They need to check if the
number of operators is adequate to conduct different operations at
the cargo warehouse.
1.3 Objective
The fundamental objective of this study is to do system analysis
and performance assessment of the RJ Cargo Warehouse. This
objective is meant to be satisfied through a collection of mean
objectives which are:
18

1. The analysis of the role of a warehouse system and the
identification of the requirements that it should meet.
2. Knowing the key performance measurements that are used for
quantifying the utilization or efficiency of a manpower.
3. To assess if the number of operators is enough to achieve the
desired work.
1.4 Methodology
To achieve the main objective, the following methodology is used,
which consists of two parts:
System analysis of the RJ cargo warehouse.
Tools that are used in this part include:
o Interviewing the supervisors at the warehouse.
o Flowcharts.
o Data collection from record files.
o Direct observation.
Performance assessment of operators at RJ cargo warehouse.
Tools that are used in this part include:
o Actual data collection.
o Data collection from record files.
o Interviews with the supervisors at the warehouse.
o Key performance indicators for labor assessment.
19
o Graphs development using computer software.
1.5 Project report overview
The project report comprises the following chapters:
Chapter two: This chapter provides a brief literature review of
the following topics: air-cargo supply chain, air-cargo
warehouse operations, and performance assessment of air-cargo
warehouse operations.
Chapter three: This chapter provides a detail system analysis of
RJ air cargo warehouse and its main operations.
Chapter four: This chapter provides a detail assessment of labor
performance at the export area of the RJ cargo warehouse.
Chapter five: This chapter provides the main points of
discussion, conclusions and recommendations.
20
21
2 Chapter two: Literature Review
22
2.1 Air-Cargo supply chain
Moving large amounts of freight over great distances, as the air
cargo industry does on a daily basis, is a complex business that
involves many firms and requires ongoing coordination between
them, both with respect to the physical movement of goods and the
management and exchange of information. International air cargo,
by its very nature, involves companies that are located in different
time zones, languages, economic systems and cultures,
necessitating both in-depth local knowledge and the ability to
bridge these gaps on a global level. This complexity has resulting
in an industry with actors ranging from the very small and local to
the fully integrated and global in reach.
Traditionally, transporting a shipment from its origin at the origin
at the shipper’s factory or warehouse to its destination at the
consignee’s facility overseas involves at least five different air
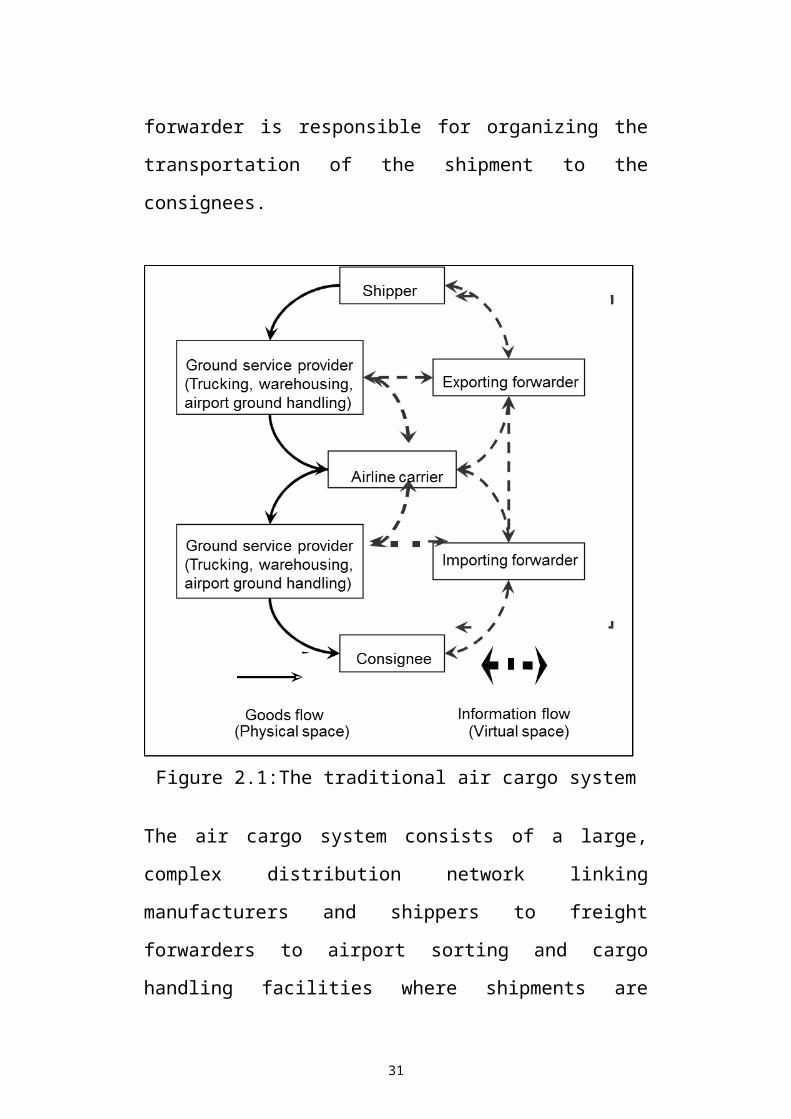
cargo intermediaries as shown in figure 2.1. The exporting shipper
contracts with a freight forwarder, who manages most aspects of
the transportation process. Freight forwarder then book cargo space
on air carriers for their shipments, in some cases on as ad-hoc basis
(makeshift solutions) depending on current demand for freight
capacity, in other cases through longer-term contracts with specific
carriers for certain cargo allotments. Once at the departure airport,
ground handling service providers, usually appointed by the
airlines, physically handle the cargo right up to loading it into the
aircraft. Most freight is transported in the cargo hold of regularly
23
scheduled passenger aircraft operated by the world’s large airlines,
but some airlines like Royal Jordanian operate a fleet of freighter
aircraft. At the destination airport, the reverse procedure takes
place, and after customs import formalities have been completed,
the importing freight forwarder is responsible for organizing the
transportation of the shipment to the consignees.
Figure 2.1:The traditional air cargo system
The air cargo system consists of a large, complex distribution
network linking manufacturers and shippers to freight forwarders
24
to airport sorting and cargo handling facilities where shipments are
loaded and unloaded from aircraft (Elias, 2007).
The airport forms an essential part of the air cargo supply chain,
because it is the physical site at which a modal transfer of transport
is made from the air mode to land mode. It is the point of
interaction between the airline and the user (Ashford et al., 1983).
Airports are divided into landside (parking lot, access roads, etc.)
and airside (all areas accessible to aircraft, including runways,
taxiways and ramps) areas.
2.2 Warehouse System
Warehouse is an essential component in the supply chain as it
provides material buffering along the chain, consolidation of
goods, and value added processing for customers (GU Et Al.,
2007). Hence, the performance of warehouse operations
significantly affects the productivity of the whole supply chain.
Warehouse resources, such as space, labor, and forklifts, need to be
allocated among different warehouse functions, and each function
needs to be carefully implemented, operated, and coordinated in
order to achieve desirable operations performance requirements in
terms of capacity, throughput, and service at the minimum resource
cost [1]. In doing this, decision-making processes in warehouse
operations need to be taken into account.
25
2.3 Warehouse operations
In classical research studies, logistics operations policies in
warehouse operations cover four key domains: storage, routing,
batching and zoning (Goetschalckx and Ashayeri, 1989).
(a) Storage: storage is an important warehouse function. Storage
assignment policy is about the rules and procedures for setting
and assigning Stock Keeping Unit (SKU) to storage locations.
There are five frequently used types of storage assignment
policies: random storage, closest open location storage,
dedicated storage, full turnover storage, and class based storage.
Each policy has its own special characteristics, advantages and
disadvantages. For example, a random storage assignment
policy enables high space utilization (or low space
requirement), but the travelling distance for order pick-up is
increased (Choe and Sharp, 1991). The selection of a storage
policy is based on the objectives (either to reduce material
handling cost or improve space utilization).
(b)Routing: the objective of a routing policy is to determine the
best sequence for picking up goods that have been ordered so as
to minimize the total material handling cost. The problem of
routing order pickers is actually a special case of the Traveling
Salesman Problem (TSP) (Lawer et al., 1995). The TSP in a
26
warehouse is special because of the aisle structure of the
possible travel paths.
(c) Batching: The essence of batching policy is to partition a set of
orders into a number of sub-sets, where the sub-sets orders will
be picked, packed and shipped by pickers in a specific time
window.
(d)Zoning: The concept of zoning entails partitioning the order
picking area into a number of zones. Each zone has a policy
involves determination of zone number, sizes and shape as well
as the allocation of SKUs within a warehouse system.
Therefore, decision criteria include the specification of SKUs
(such as weight, size, similarity and properties), layout of the
warehouse and the order pick-up policy. The advantages of
zoning are that it minimizes the problem of traffic congestion
and helps order pickers to become familiar with the location of
the items. Two methods are proposed are, progressive and
parallel zoning.
2.4 Air cargo Warehouse Operations
Air cargo is the “space-shrinking technology” par excellence,
enabling rapid global trade on a large scale. Most cargo facilities
are divided into an import area and an export area. The flow of
goods through the terminal is either from the airside to the landside
(terminating freights or connecting freights requiring the road feed
27

service), from the landside to the airside (originating freights or
connecting freights arriving from a road feeder service), or from
the airside to the airside via the terminal (connecting freights).
2.4.1 Export area
The export area is dedicated to receiving, processing and preparing
outbound freights, which refers to all shipment moving from an
outside customer, and going onto a flight. All freight arrives at the
cargo facility from the “landside export” area, either as bulk or as
shipper loaded unit device. The freight gets weighed and
dimensioned by the acceptance agent and stored at the appropriate
location depending on its flying time and destination. If items are
bulk, they ultimately go to the build-up area to be put in a Unit
Load Device (ULD) or are transported in a tub cart directly to the
airplane if this airplane is bulk loaded. ULDs are transported onto
roller system through the cargo facility and onto trailers to the
airside. All export shipments leave the warehouse via the “airside
export” doors.
2.4.2 Import area
The import area is dedicated to receiving, processing and releasing
inbound freights which refer to all shipments coming from a flight,
going to an outside customer. ULDs are transported the same way
between the airside and cargo facility (trailers). Bulk is unloaded
from the aircraft directly into tub carts. Everything brought back to
28
the cargo warehouse via the “airside import” area, is broken-down
when needed and stored until customer pick-up.
The movement of transiting goods (from one flight to another
flight) also goes through the warehouse. It is considered “import”
as it enters via the import airside, and becomes “export” as is it
processed in the cargo facility and moves to the export side before
exiting the warehouse through the “airside export” doors to reach
its next flight. The Export and Import clearance procedures are
summarized as shown in Table (3.1).
2.4.3 Unit load device (ULD)
Unit Load Devices (ULDs) play a vital part in ensuring that, as air-
cargo volumes increase, they are moved safely, quickly and cost-
effectively (IATA, 2002). ULD is the correct terminology used by
the air transport industry for containers and loading units that are
used for the carriage of cargo by air. It allows large quantities of
cargo to be bundled into large units. Pallets and nettings as well as
rigid containers are commonly used for freight transport by air.
Each ULD is required to have a marking that identify its type code,
maximum gross weight and actual tare weight (IATA, 2002).
Currently, technical specifications for unit load devices are set by
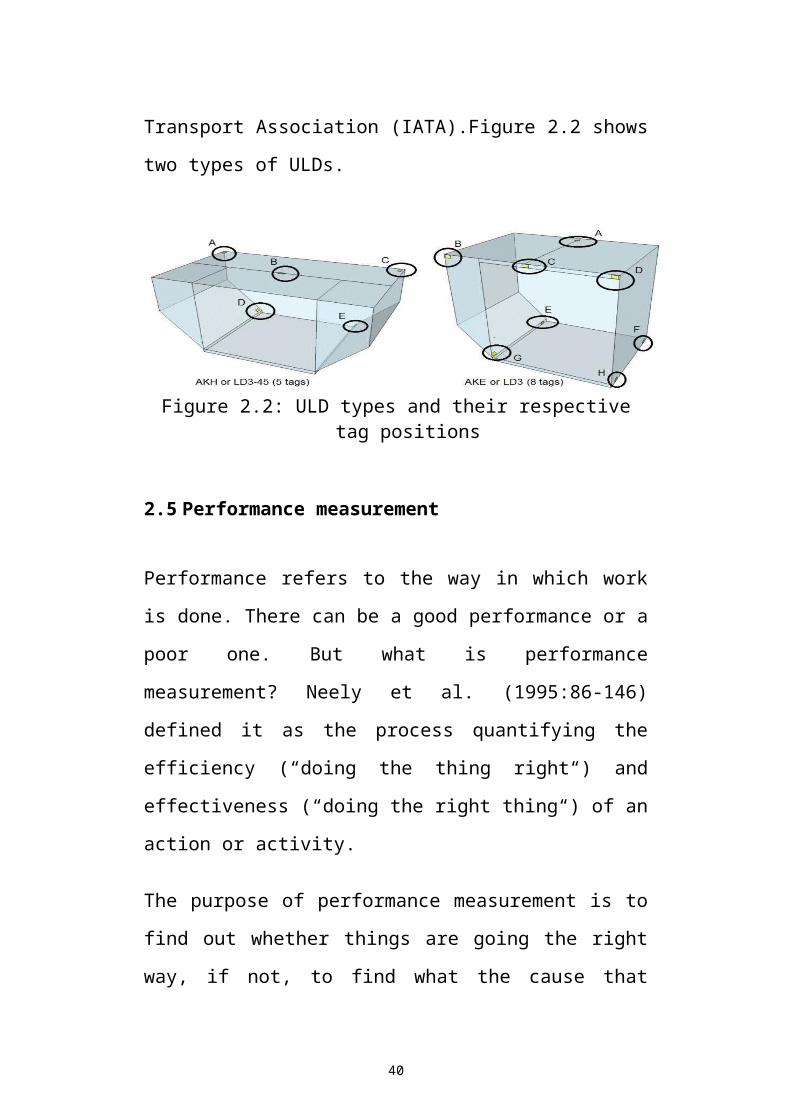
the International Air Transport Association (IATA).Figure 2.2
shows two types of ULDs.
29
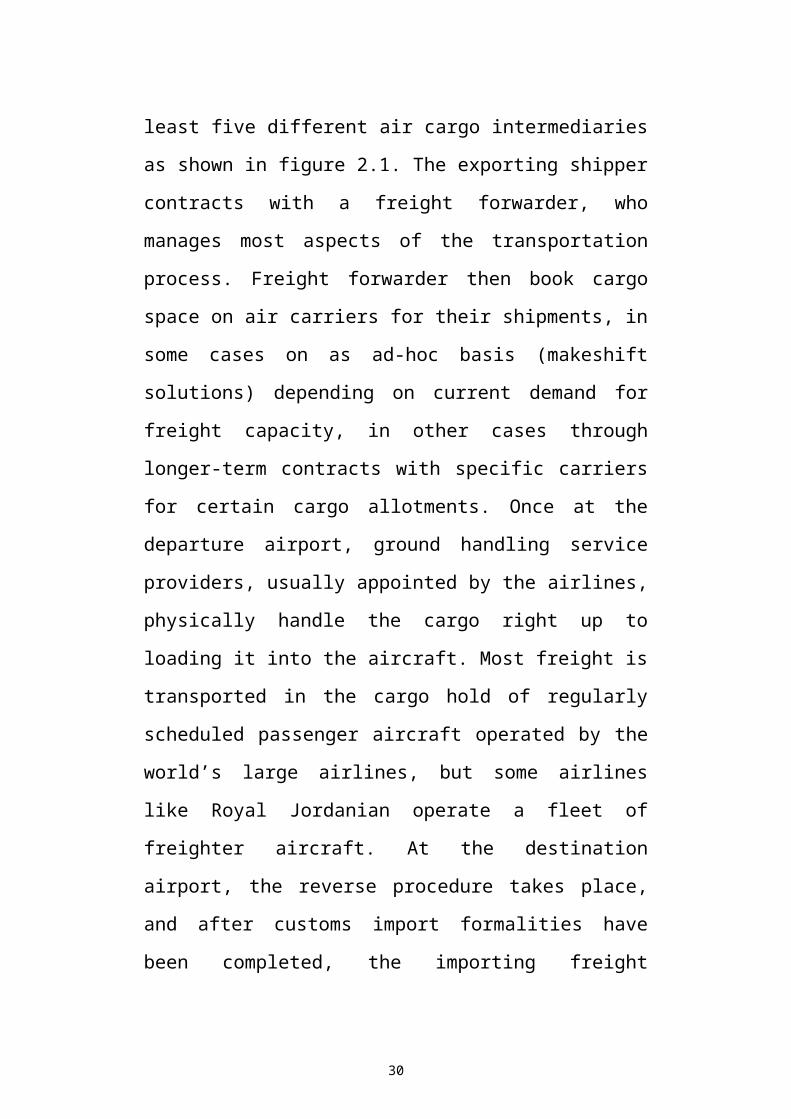
Figure 2.2: ULD types and their respective tag positions
2.5 Performance measurement
Performance refers to the way in which work is done. There can be
a good performance or a poor one. But what is performance
measurement? Neely et al. (1995:86-146) defined it as the process
quantifying the efficiency (“doing the thing right“) and
effectiveness (“doing the right thing“) of an action or activity.
The purpose of performance measurement is to find out whether
things are going the right way, if not, to find what the cause that
generated a poor performance was. After this step, solutions for
improving performance have to be found. There are several reasons
for measuring performance (Ackerman, 2003:1):
1. Improving performance;
2. Avoiding inconveniences before it is too late;
3. Monitoring customer relations;
4. Process and cost control;
5. Maintaining quality.
The main instruments for assessing performance are performance
indicators, also named Key Performance Indicator (KPI). They are
30
specific characteristics of the process which are measured in order
to describe if the process is realized according to pre-established
standards. The best way to use indicators is to compare process
values with normal, standard values. If there are poor results, poor
performance, in reality, improvements for the process have to be
made. Indicators are used basically for comparison with expected
values; they are the control system of the studied process.
The purpose of warehouse performance measurements is,
discovering the problems of the warehouse and solves them before
it is too late. It is a way to reduce costs by improving operations
that take place in a warehouse, and having low costs in an essential
feature of differentiating logistics firms.
2.6 Warehouse Key Performance Indicators
The performance indicator or key performance indicator (KPI) is a
measure of performance of the business in order to benchmark
(“comparing one’s business processes and performance metrics to
industry best practices from other industries.”) against the
competition and explore the possibility to improve in order to gain
competitive advantage (Vijay Sangam, 2010:8). Warehousing
function is a very critical within any supply chain. If the products
do not move seamlessly within supply chain business would face
serious service related challenges. Hence, it is necessary to drive
the performance of the warehouse through key performance
indicators.
31
2.7 Determine KPI
People, cost, space and systems drive the performance inside the
warehouse. Hence, generally warehouse KPIs are based on many
drivers and focused on activity in order micromanage the
performance. The following activities are common in any
warehouse:
1. Receiving;
2. Put-away;
3. Storage;
4. Pick-n-pack;
5. Shipping.
2.7.1 Receiving
Receiving process could include goods physically received at the
warehouse and inspection or cross-docked, to assure that quantity
and quality areas ordered, and to distribute the materials to storage
or to the organizational function requiring them.
The relevant KPIs for receiving function should include the
following:
4 Productivity - Volume received per man-hour;
5 Cycle time - Time taken to process a receipt
6 Utilization - Receiving dock door utilization %.
32
2.7.2 Put-away
Once receiving activity is completed, the accepted merchandize has
to be stored in a location that is convenient to retrieve for further
action (just reverse of order pick function).
The KPIs for put-away activity should include the following:
1. Productivity- Put-away per man- hour;
2. Utilization- utilization % of labor and equipment;
3. Cycle time- Time taken for each put-away.
2.7.3 Storage
It is the physical containment of merchandise while it is awaiting a
demand. Broadly there are two types of storage systems and they
are manual storage and the second one is automated and retrieval
system (AS/RS).
The KPIs for storage activity would include:
1. Productivity- Inventory per sq.foot;
2. Utilization- %Location and cube occupied;
3. Cycle time- Inventory days on hand.
2.7.4 Pick-n-Pack
It is the process of removing items from storage while it is awaiting
a demand. This activity is divided into two parts. First one deal
with case picking and the second one deal with small item picking.
Further case picking can be classified into three categories. The
33
first one is known as Pick-face palletizing where warehouse
operator palletizes at the pick-face as he/she traverses the picking
tour. The second one is downstream palletizing where case are
picked onto conveyors and sorted at the staging area. The third one
is direct loading where the cases were conveyed directly into the
truck.
Further, the small item picking can be classified into three
categories. The first one is known as picker-to-stock, where the
picker moves around to pick the cases. The second one is stock-to-
picker. In this case stock was sent to the stationed picker through
AS/RS machine. The third one is known as automated item
picking. In this process items are automatically dispensed into
shipping cartons or tote pans.
The KPIs for Pick-n-Pack activity would include:
1. Productivity- Order lines picked per hour;
2. Utilization- Picking labor and equipment utilization %;
3. Cycle time- Order Pick cycle time per order.
2.7.5 Shipping
Shipping is the last step in warehouse activity in handling shipping
goods to the customer or handling stock transfers.
The KPIs for shipping activity could include:
1. Productivity- Order process for shipping per man hour;
2. Utilization- Utilization of shipping docks in %;
34
3. Cycle time- shipping time (from the time order picking to
physically movement of the truck) per order.
2.8 Labor productivity
Productivity is commonly defined as a ratio of a volume measure
of output to a volume of input use. Labor productivity describes the
amount of output that is generated per worker each hour. The more
output produced per hour of work, the greater the level of
productivity. Productivity increases are generally accepted as a
sign that the economy is expanding. Technological advances and
increased worker efficiency are the two primary sources of
productivity improvements.
Calculating labor productivity is as follows:
1. Determine the total worker output within a given period of time.
The total output can be expressed in terms of monetary value, or
it can be expressed in terms of units produced.
2. Determine the total number of man hours that were dedicated to
production within the same period of time. The total number of
man hours should include not only the hours dedicated to the
manufacturing process but the management and oversight
process as well.
3. Divide the total output by the total number of man hours. The
result of the division will be an expression of labor productivity.
35
3 Chapter Three: System Analysis of Royal Jordanian air cargo warehouse
36
3.1 Royal Jordanian Warehouse
The warehouse building is built in 1983, and covers an area of
17,000m² of floor space, of which 4,500 m² is office space. The
building is 215m long and 79m wide. There is sufficient space to
expand the facilities by about 40%. The cargo facility is operated
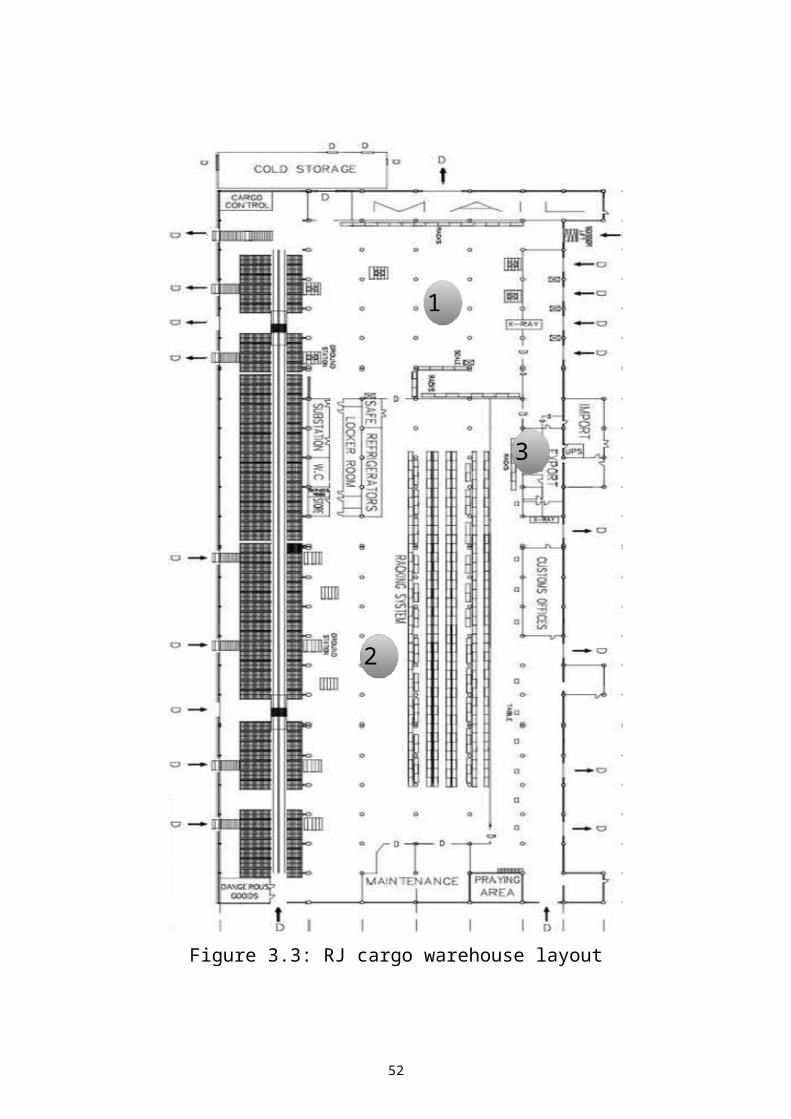
by a subsidiary of Royal Jordanian Airlines. Figure 3.1 presents the
layout of Royal Jordanian cargo facility, including most activity
areas (export, import, storage, build-up, break down, airside and
landside). Interference reading points are circled on the layout and
correspond to the following areas:
1. Export area;
2. Import area;
3. Office area.
3.2 Overview of the Royal Jordanian’s cargo terminal
operations
The terminal is divided into an import area and an export area. The
import area is dedicated to receiving, processing and releasing
inbound freights. The export area is dedicated to receiving,
processing and preparing outbound freights. The flow of goods
through the terminal is either from the airside to the landside
(terminating freights or connecting freights requiring the road feed
service) or from the landside to the airside (originating freights or
connecting freights arriving from a road feeder service), or from
the airside to the airside via the terminal (connecting freights).
37
1
2
3
Figure 3.3: RJ cargo warehouse layout
38
At the import level, freights on dollies or carts are transferred with
a tractor–trailer from the aircraft to the airside level of the cargo
terminal. Shipments on carts are transferred to the import bulk cart
break-down station where they are sorted, scanned, placed into a
roll box, conveyed and stored either in an AS/RS or in other
dedicated storage areas upon their retrieval (terminating goods) or
their preparation for transfer to build-up areas (connecting goods).
Shipments on containers or pallets (referred to as ULDs) are
introduced into the terminal throughout a manned operated and
computer-assisted airside transfer vehicle (ATV). From this point,
the ULDs may be transferred either to:
1. The road feeder service (RFS) dock area,
2. To the import ULDs storage area,
3. To the import ULDs breakdown area or to the export ULDs
storage.
A fully automated ULD handling system is used for this purpose. It
is equipped with such components as powered ULD conveyors for
moving ULDs to different transfer points, turntables for ensuring
that ULDs can be rotated or reoriented when changes in direction
are required, unmanned operated elevating transfer vehicles (ETV)
for ensuring ULDs storage, retrieval or transfer on multiple levels,
lowerable workstations for enabling safe build-up and break-down
processing, scissor lifts for ensuring transfer interface between
conveyors and road trucks with various heights at the RFS area,
forklifts for transporting goods between various transfer points,
transfer vehicles (TV) for enabling the interface in both ways
between either non-rollarized vehicles and the first conveyor
39
system set at the RFS area, between this last and the second
conveyor system set at the RFS area, or between the import area
and the export area.
After being stored in the import ULDs storage area, a ULD is
retrieved and transferred without breakdown processing either to a
customer, if terminating shipments (via the RFS dock or truck dock
pick area), or to the airside if connecting (via an ETV and an
ATV). A ULD may also be transferred to the ULD break-down
area where its contents are sorted by airway bill, scanned, placed
into a roll box, conveyed and stored into the AS/RS or other
storage areas upon their retrieval for releasing to a customer
(terminating goods), or transfer for preparation to the carts or
ULDs build-up areas (connecting goods). Receiving cargo from
other air-cargo warehouse company to the RJ warehouse and
unloading it to the breaking-area, the procedure of recognize the
goods is done manually by supervisor in getting goods type,
amount, size and writing it to papers. That procedure cannot do
automated as using Radio Frequency (RF) apparatus to avoid
receiving goods without receiving its information from outer air-
stations to the computer system of RJ which result that RF cannot
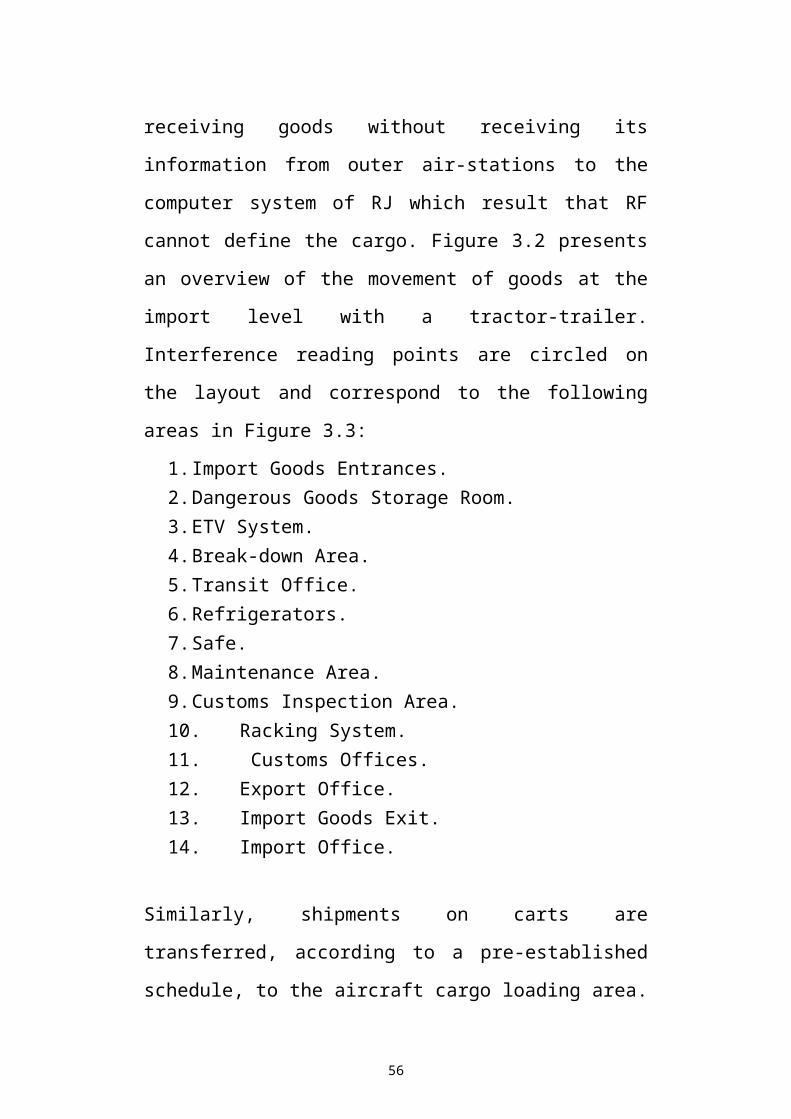
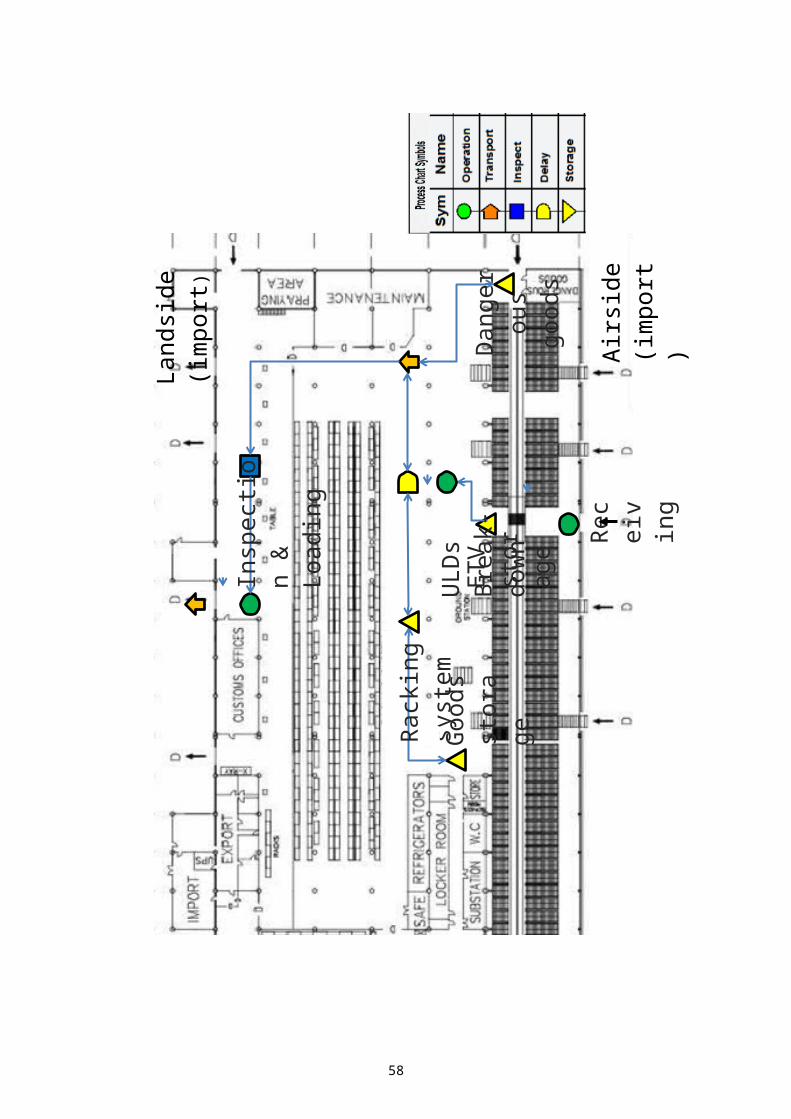
define the cargo. Figure 3.2 presents an overview of the movement
of goods at the import level with a tractor-trailer. Interference
reading points are circled on the layout and correspond to the
following areas in Figure 3.3:
1. Import Goods Entrances.2. Dangerous Goods Storage Room.3. ETV System.
40
4. Break-down Area.5. Transit Office.6. Refrigerators.7. Safe.8. Maintenance Area.9. Customs Inspection Area.10.Racking System.11. Customs Offices.12.Export Office.13.Import Goods Exit.14.Import Office.
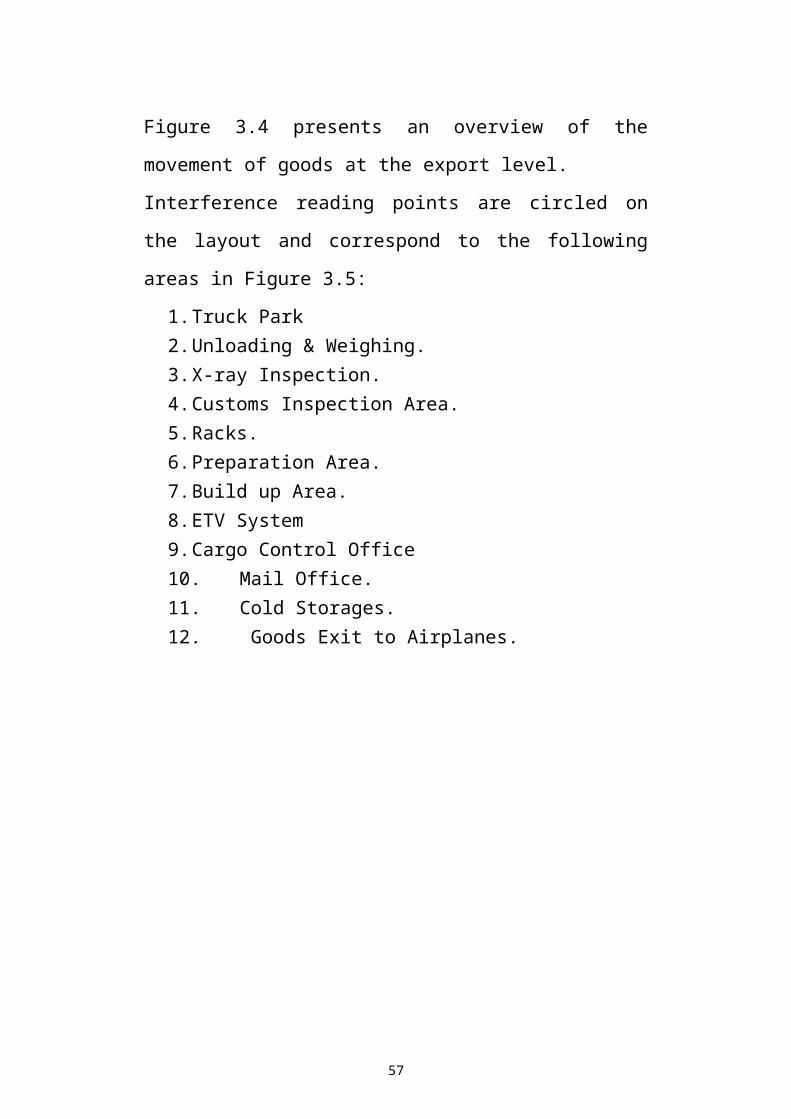
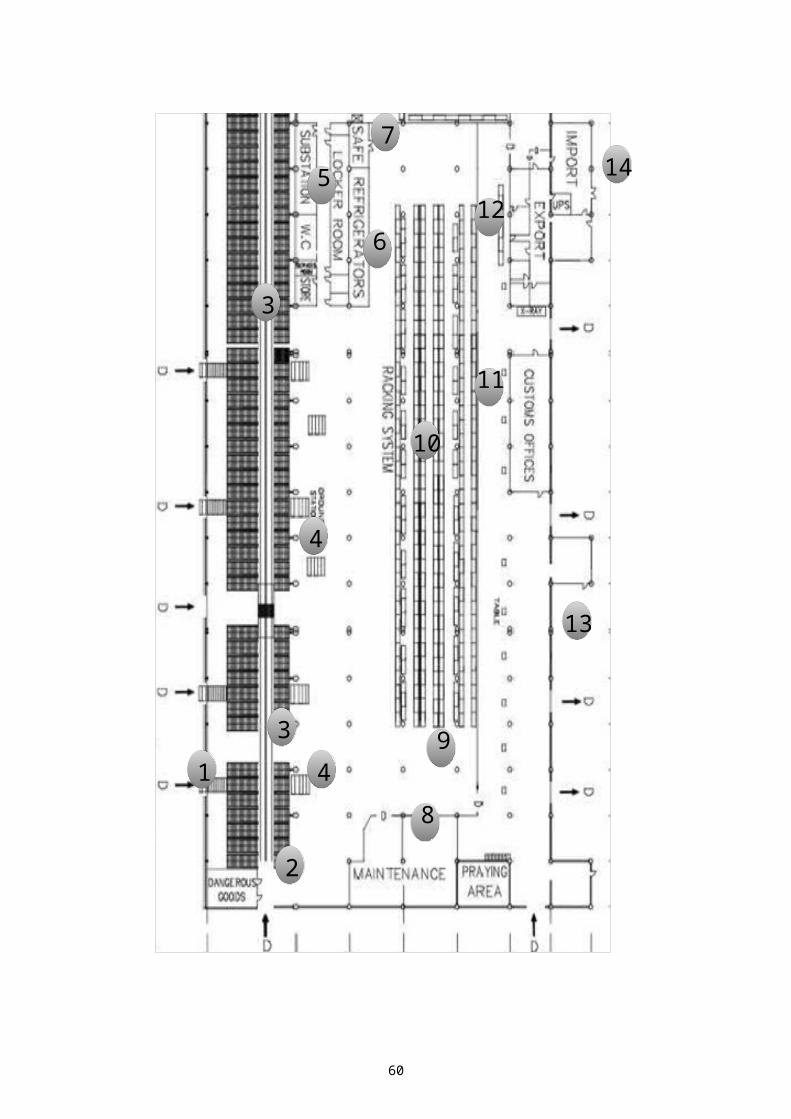
Similarly, shipments on carts are transferred, according to a pre-
established schedule, to the aircraft cargo loading area. Figure 3.4
presents an overview of the movement of goods at the export level.
Interference reading points are circled on the layout and correspond
to the following areas in Figure 3.5:
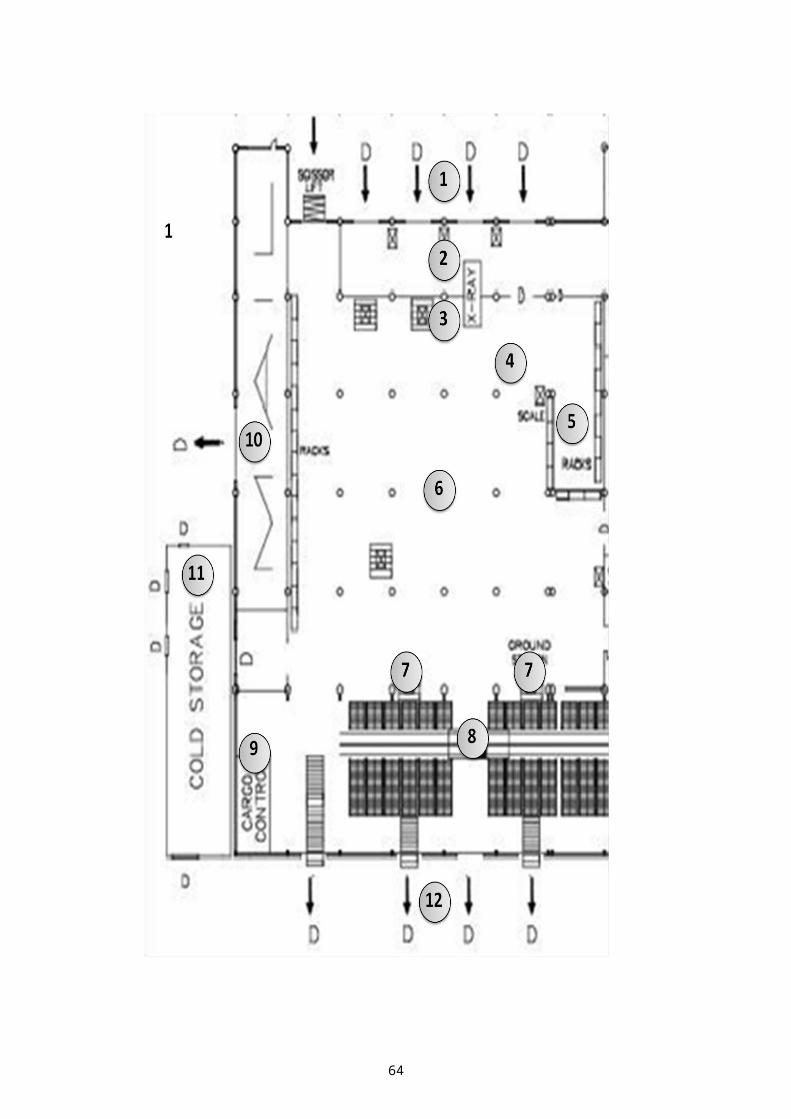
1. Truck Park2. Unloading & Weighing.3. X-ray Inspection.4. Customs Inspection Area.5. Racks.6. Preparation Area.7. Build up Area.8. ETV System9. Cargo Control Office10.Mail Office.11.Cold Storages.12. Goods Exit to Airplanes.
41
Figure 3.4 Flow diagram: The path taken by a good as it flows through import in warehouse
42
Air
side
(im
port
)
Lan
dsid
e(i
mpo
rt)
Rec
eiv
ing
ET
V
stor
ageUL
Ds
Bre
ak-
dow
n
Insp
ecti
on &
L
oadi
ng
Rac
king
sy
stem
Goo
ds
stor
age
Dan
gero
us g
oods
1
2
3
4
5
6
7
8
9
10
11
12
13
14
3
4
Figure 3.5: RJ import area specify operational area
43
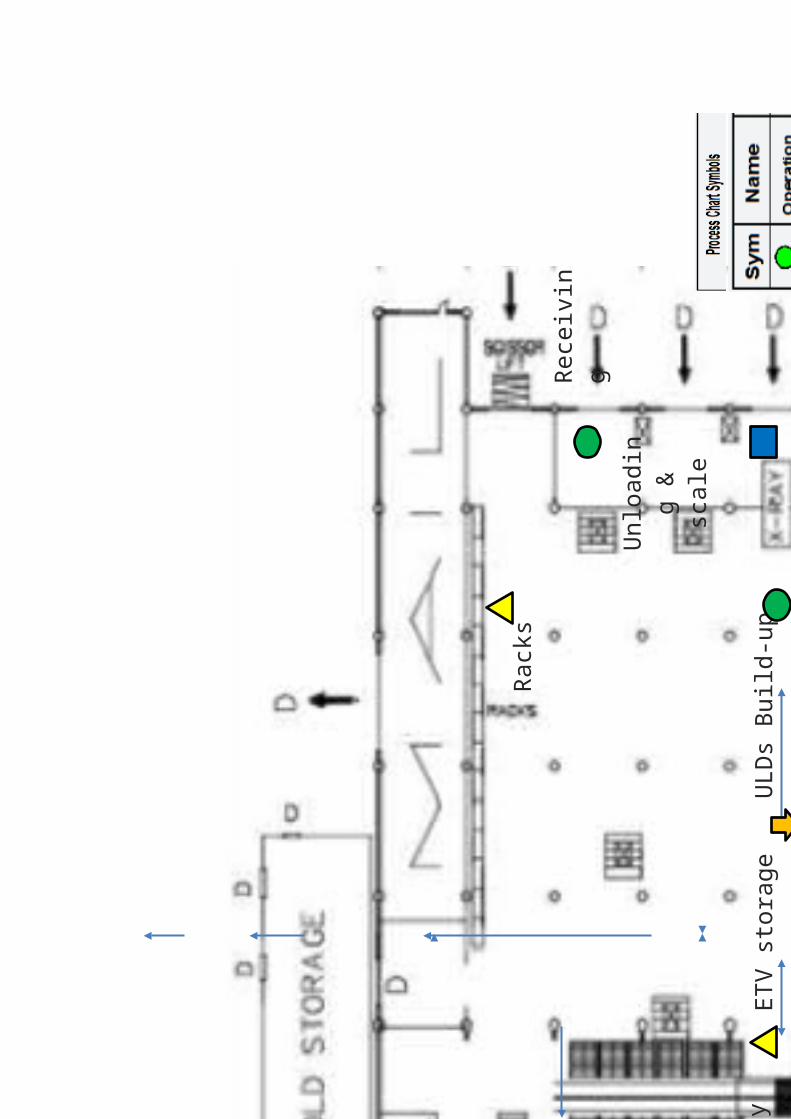
Figure 3.6 Flow diagram: The path taken by a good as it flows through export in warehouse
44
Air
side
(exp
ort)
Lan
dsid
e(ex
port
)
Rec
eivi
ngU
nloa
ding
&
sc
ale
UL
Ds
Bui
ld-
up
Sca
leR
acki
ng s
yste
m
bree
zew
ayE
TV
st
orag
eX
-Ray
Rac
ks Rac
ks
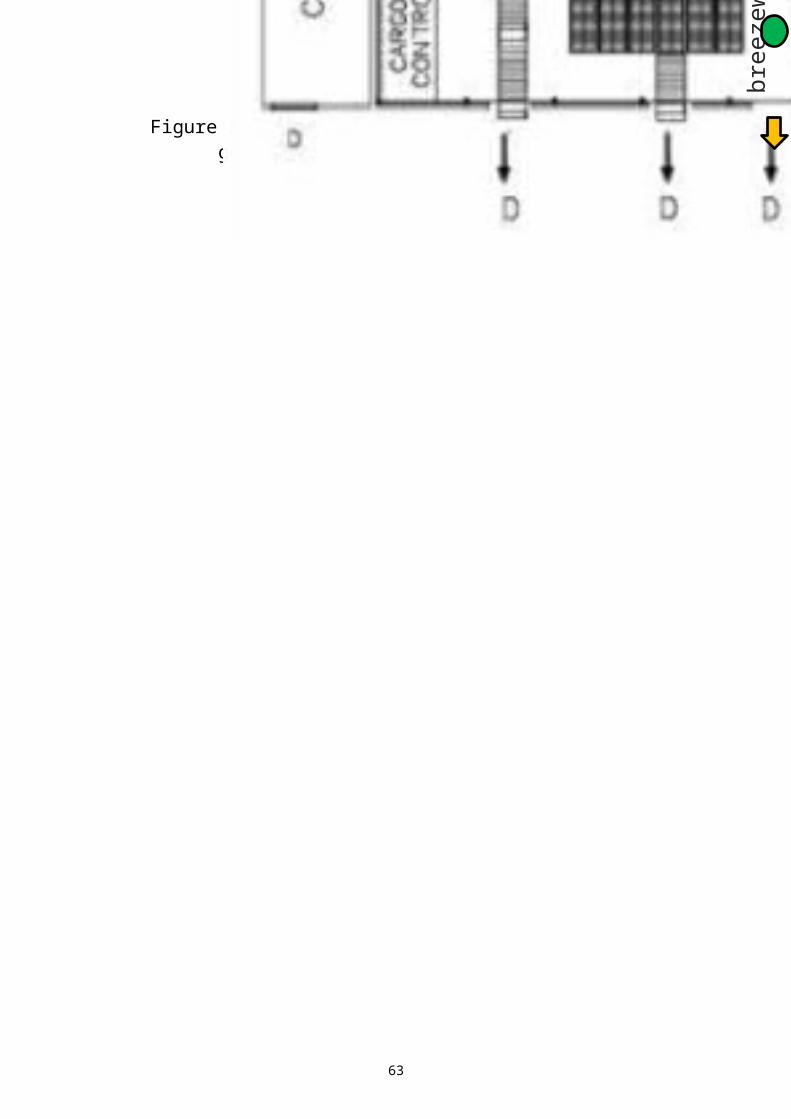
Figure 3.7: RJ export area specify operational area
45
At the export level, shipments are received either loose or in
ULD’s. Shipments in ULD’s may then be transferred from the RFS
area or the export truck acceptance area to the airside area either
directly or through the export storage area. A ULD handling
system is used for this purpose and is equipped with the same
components as described previously.
Shipments tendered loose are sent to the cart or to the ULD build-
up area either directly or after being stored and retrieved from the
AS/RS or from any other storage areas. In the first case, a small
package conveyor system is used and in the second case the same
system previously described is used. After completing the ULDs or
the cart break-down processing the shipments on ULDs are sent to
the airside area, either directly or after being stored and retrieved
from the export ULD storage. The ETVs are generally used for this
purpose. At the airside level, ULDs are placed on dollies
throughout an ATV and delivered to the aircraft staging area.
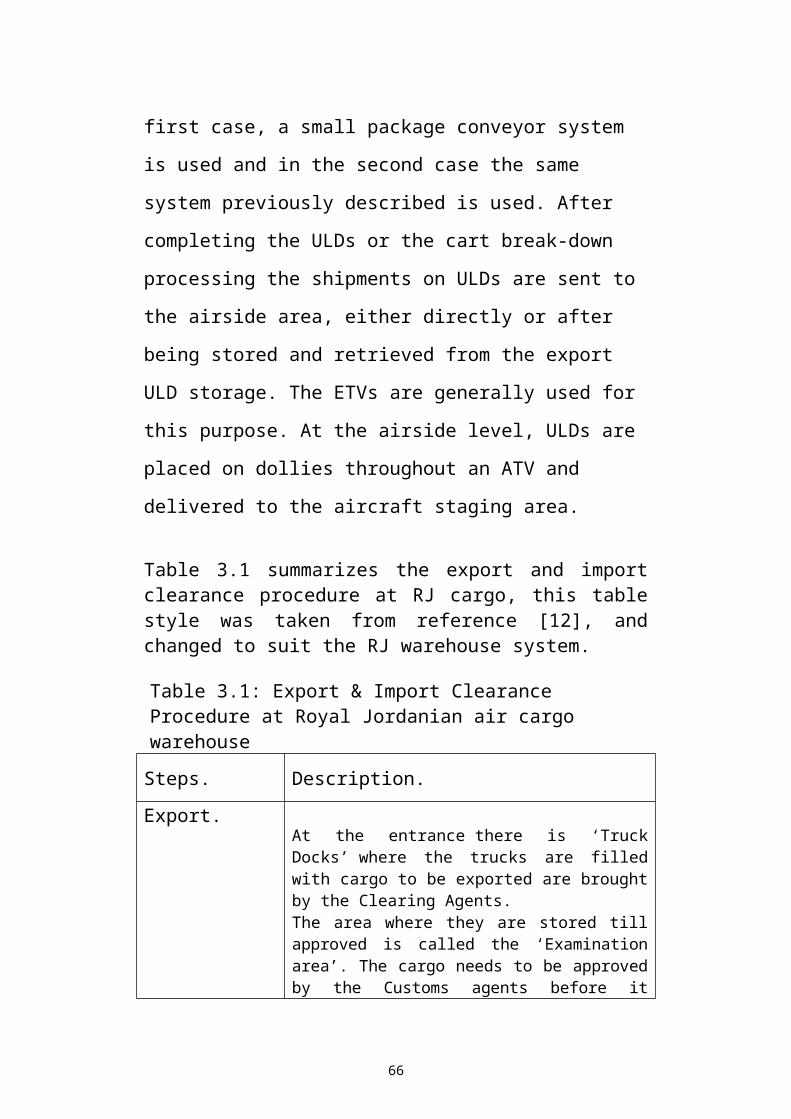
Table 3.1 summarizes the export and import clearance procedure at RJ cargo, this table style was taken from reference [12], and changed to suit the RJ warehouse system.
46
Table 3.1: Export & Import Clearance Procedure at Royal Jordanian air cargo warehouse
Steps. Description.
Export.
At the entrance there is ‘Truck Docks’ where the trucks are filled with cargo to be exported are brought by the Clearing Agents.The area where they are stored till approved is called the ‘Examination area’. The cargo needs to be approved by the Customs agents before it passes through. The freight to be paid by the exporting party is decided on the basis of the weight of the containers and the materials in it.Most of the airlines (through which the cargo is to be sent) have their offices located on the first floor of the warehouse. They should be informed and booked in advance for the sending of the cargo.
Clearance Procedure of Export.
After the cargo is received at the entrance of the warehouse, it is sent to the Custom’s for approval. They have to examine a minimum 10% of the cargo and can even call back the cargo form the bonded area to the examination area, in case they are suspicious.
It should adhere to the necessary packaging and labeling compliances. Packaging standards are different in case of dangerous goods such as explosives, chemicals, oxidizers, corrosives, etc.
It is necessary since certain items can be carried only in cargo aircraft and not otherwise.However, there are no separate charges that are levied for carrying such goods; just an indication of their nature.
These are decided on the basis of the IATA norms and mentioned on the entrance. Only after it is approved, it is send forward. From here, first it is passed through the X-Ray testing machines to check for any hazardous goods or materials present in it.
47
Table 3.1 (Continued);
Steps. Description.
Let Export Order.
After the Custom officers clear it, they give it the ‘Let Export’ order and hence the cargo is moved from the Examination area to the ‘Bonded area’.There also exists an ‘Export Storage Room’ which is used to store the valuable items such as currency, jewelers, etc.The export ship duty officer is responsible for the overall supervision of the shipment and export loading.
Loading Procedure.
The loading base for the cargo is of the standard size 125 X 85 inches. It can take up to 4.5 tons of cargo on an average. The maximum height of the cargo can be of 5 feet. The cargo is covered with a polythene sheet and the process of doing this is called ‘Lashing’. No loose movement of cargo is allowed. After the unit load Device (ULD) is loaded and passes on, it is stacked mechanically on to the racks and hence given a unique location number.
The location ticket is collected by the Elevated Transfer Vehicle (ETV) operator.
The ULD number as well as the destination needs to be noted down by the respective airlines.
Moreover, the airlines pay for all the loading, stacking, etc. and are also liable to may demurrage charges in case the process takes more than 48hrs.
Also, in case the cargo is lying in the warehouse for more than six weeks and there is no one to claim it, it is automatically transferred to the Special Disposal Cell.
48
Table 3.1 (Continued);
Steps. Description.
Off-Loading through Common Terminal.
All the cargo is off loaded through a common terminal.The most important fact to be noticed here is that if the cargo is not claimed by any airline within 48 hours, it is charged extra on per hour basis and the cost has to be borne by the Clearing Agent.The air cargo terminal exports up to 400-450 tones on a daily average and imports close to 350 tones. The usual Export items are readymade garments, carpets, leather, generic medicines, etc.
ULD
All the pallets and containers are known as ULDs. Each one of them is given a unique serial number, where the first two/three letters identify the series of the ULD; the center series is their serial number and the last few alphabets is the airline code. For e.g.: AKE62313DHL signifies that AKE is the series of the cargo, 62313 is its unique serial number and the last three signify DHL logistics
Freighter.Freighters: RJ is the common freighter and uses an Airbus 310 with a capacity of 45-50 tons. Whereas, a Boeing can take up to 100 tons in one go.
Cold Storage Facility.
Cold Storage Facility: There is also a cold storage facility at the exit of the warehouse for perishable goods.
The cargo within the aircraft is also maintained at a suitable temperature.
There were five cold storage cells here: Two of them were at 2degree Celsius and the other on -6degrees Celsius.
Table 3.1 (Continued);
49
Steps. Description.
Out of Charge.
Each of the shipment arriving at the import warehouse is given a Cargo manifest and an Airway Bill (AWB). After giving them these documents the shipment is inspected by the custom’s officers here however, no X -ray check is done for the import cargo as against the export cargo. After the customs’ approve the cargo, they issue an ‘Out of Charge’ slip for the same.
Segregation.
After checking the cargo, a Segregation sheet is prepared where we get a list of perishable/nonperishable, damaged/not damaged cargo. It is then cross checked with the manifest. Special office known as the ‘Ship Duty officer’ is responsible for feed all the data about the cargo according the manifest system.
Unloading.
The airlines, on the other hand, would simultaneously issue the delivery order to the consignee and inform him/her that the cargo has arrived. The freight charges can either be prepaid or paid later.
The unloading of the cargo has been outsourced to customer Cargo.
Export Storage Room
Similar to the Export Strong Room, there exists an Import storage Room where all valuable cargo is kept. Moreover, similar cold storage facilities exist here as well. At the exit, a location slip is issued and the good is tracked for the convenience of the consignee.Most of the cargo that arrives is from Europe, Gulf region, Hong Kong and Singapore. The major items for import are telecom equipments, machinery parts, chemicals, and electronic items.
50
3.3 Types of goods stored in RJ warehouse
The shipper is responsible for identifying and classifying all goods
intended for being transported by air, that’s why those goods must
properly classified, documented, certificated, described, packaged,
marked, labeled and in the condition for shipment required by
International Air Transport Association (IATA) Regulations. The
following Table (3.2) shows different types of goods usually stored
inside the warehouse and their special load codes.
Table 3.2: Special load codesGoods type Code
Aircraft spare parts required for aircraft
on ground
AOG
Live animals AVI
Foodstuffs for human or animal
consumption
EAT
Human remains in coffins HUM
Live human organ or fresh human blood LHO
Magnetized material MAG
Valuable cargo VAL
Miscellaneous dangerous goods RMD
Radioactive materials category RRW
Cryogenic Liquid RCL
Flammable Compressed Gas RFG
Non-Flammable Compressed Gas RNG
Oxidizer ROX
Corrosive RCM
Table 3. (Continued);
Goods type Code
51
Flammable Liquid RFL
Organic Peroxide ROP
Toxic RPB
Flammable Solid RFS
Infectious Substance RIS
Toxic Gas RPG
Oxidizer ROX
Dangerous When Wet RFW
Explosive 1.4S RXS
Spontaneously Combustible RSC
Company mail COM
Diplomatic mail DIP
Perishable cargo
a. flowers and plants)b. (meat and meat products)c. (fruits and vegetables)d. (fish and seafood)e. Other Perishable cargo
PEF/M/P/S/R
52
3.4 Cargo Terminal capacity Analysis
Warehouse capacity is defined as maximum number of goods that
can be produced during a certain period. The existing cargo
terminal is located some distance from the passenger terminals,
between the two taxiways connecting the parallel runways and an
aircraft maintenance facility. It is accessible by a separate road that
ties into the general airport access road at the first roundabout and
leads around the southern runway. Landside delivery and pickup
takes place through four truck ramps Figure 3.6 equally, four doors
connect it with the airside.
Material handling is defined as: “Providing the right amount of the
right material, in the right condition, at the right place, at the right
time, in the right position, in the right sequence, and for the right
cost, by using the right methods”. (Tompkins et al 2003)
The building infrastructure for cargo handling consists of:
• A manually operated Elevating Transfer Vehicle (ETV) which
runs along the airside wall of the building and services two pallet
staging racks with a capacity of 730 Pallet storage positions (see
Figure 3.7;
• Racks for in-bound and customs cleared storage Figure 3.8;
• Six build-up and breakdown workstations Figure 3.9;
•A bypass facility;
• Cold rooms and freezer rooms (448m²) Figure 3.10;
• Explosives storage (110m², outside the building) and:
• Radioactive goods storage (80m²).
53
Furthermore, the cargo building accommodates a total of 4,500m²
of office spaces which are included in the total floor space of
17,000m². Of these 4,500m², there are 1,500m² reserved for the
administration and facilitation of the cargo operation; the
remaining 3,000m² are occupied by cargo brokers and clearance
agents.
Figure 3.8: Land access Truck Transfer doors
Figure 3.9: Elevating vehicle and ULD storage racks
54
Figure 3.10: Storage Racks
Figure 3.11: Workstation
Figure 3.12: Cold room and freezer Room
55
The entire cargo facility is operated by RJ’s Cargo Division. Goods
exported consist mostly of textiles destined for Europe and Middle
East, agricultural products (to Europe) and pharmaceuticals (to
Middle East). Imports are dominated by industrial products.
Ground handling is also provided through RJ exclusively.
3.5 Cargo terminal handling system
Materials handling improves efficiency by making the logistics
system respond quickly and effectively to plant and customer
requirements. Material handling plays a key role in getting goods
to customer on time and in the proper quantities. General
objectives of material handling:
Increase effective capacity of warehouse.
Minimize aisle space.
Reduce number of times product is handling.
Develop effective working conditions.
Reduce movements involving manual labor.
Improve logistics service.
Reduce cost.
Queen Alia International Airport/Amman hosts state-of-the-art air
freight terminal where cargo is quickly and efficiently handled and
sped on its way, usually with same-day arrival to final destinations,
no matter where the point of origin.
56
The material handling system includes:
1.Capability for 360 aircraft pallet positions.
2.Two ETVs and 16 electric forklifts operating 24 hours, in
addition to five ultra-modern forklifts capable of operating in
narrow aisle racking systems.
3.Four pallet transporters.
4.A racking system with 7400 Pallet positions covering the Cargo
Export and Import areas.
5. Two converted Airbus 310-300 freighters and one leased
Boeing 737-200F form the basis of its cargo-only division,
which operates a number of scheduled flights.
3.6 Warehouse human resources and operating times
The terminal is currently run on three shifts with a total manpower
of some 160-170 operators.
Shifts are staffed as follows:
Shift A - 7 hours - (08:00 – 15:00): 29% of total time
Shift B - 8 hours - (15:00 – 23:00): 33% of total time
Shift C - 9 hours - (23:00 – 08:00): 38% of total time
Customs, on the other hand, has thus far been working one shift on
five days per week only. This has constituted a severe capacity
bottleneck. As a consequence, terminal operation has been
suffering under a severe backlog on the import side. For example,
57
cargo arriving on Cargolux flights at 3:00hrs is not processed until
the start of the customs shift in the morning. However, the morning
hours are also the time during which RJ’s all-cargo and long-
distance passenger flights arrive.
3.7 Profound RJ export area analysis
This section details the operations in export area, for the whole
process of goods and information’s. And describes the sources of
goods dealt with. This section is enhanced to provide deeper
information’s about the export area to make it easier to understand
the work done by each operator and be more familiar with it.
3.7.1 Sources of goods
There are two sources of goods that come to this area, as follow:
1. Transit shipments.
2. New shipments.
3.7.1.1 Transit shipments
Sometimes there are no direct flights from one country to another,
and has Jordan as a common spot, they send their shipments via
Jordan to their desired destinations. Or sometimes it happens that
some carriers (whether it is RJ or other carriers) give a better rate
for shipping some goods.
58

These shipments do not go through the whole process. They do not
have to go through the gate to unload, document, or inspect.
When the shipment arrives to the warehouse from the import area,
and the Air Waybill does not say that the final destination is
Amman-Jordan, this shipment is sent to the export area, via the
break-down operators from the import area by a forklift. The
operator allocates it in a proper place (fridge if it needs safe,
racks… etc.). Or it can stay on the ETV storage if it is ready to go
(especially if it is a big shipment), so there is no other work to be
done on it. Then the supervisor or the forklift operator from the
import area gives the shipment Air Waybill (from Appendix A
Figure A-5) to the cargo control. So it will be prepared with other
shipments with that flight.
These sources of goods will need the “preparation of the flight
operator/s” and “Yard collect operator” only.
3.7.1.2 New shipments
Three types of this source:
1. Maintenance (Spare parts for RJ airplanes);
2. Direct costumer on spot Agent on RJ flights;
3. Other carriers.
These types go through the whole process and starts new papers.
59
3.8 Operations at the export area
Various operations done in this area, starting when the shipment
arrives until it is shipped out. The operations are divided into 5
main types:
1. Acceptance.
2. Put-away and inspection.
3. Storage.
4. Pick and pack.
5. Shipping.
3.8.1 Acceptance:
This operation actually has two activities in RJ cargo warehouse; the first one is reception and accounting activity in export office, and the second one is weighing and unloading activity. These are connected together because the shipment will not be unloaded unless there is an approval from the export office by taking the “Shipment Discharge Form” (from Appendix A Figure A-4).
After the costumer gets “Shipment Discharge Form” from export
office and fills it with the number of bills, the weight and number
of pieces he has, the unloading operator starts unloading the truck
and weighs the shipment. Then the warehouse security and
unloading operator must sign on it approving that the numbers
written match the actual.
Then the costumer takes it to the export office and fills
“Instructions For Dispatch Of Goods Form” (from Appendix A
Figure A-3) manually (which contains of three pages, the white one
60
for export office, the yellow one for customs and the blue one for
transit office). Meanwhile, the unloading operator starts putting the
shipment on the X-Ray machines.
3.8.2 Put-Away and Inspection:
Put away operators starts putting the shipments on pallets and wait
until the specialized Jordanian army officers finish inspecting these
goods if it is acceptable to get on board according to IATA and
Jordanian Civil Aviation standards. Then after they sign the
“Instructions For Dispatch Of Goods Form” that it is approved to
go, put away operators move the shipment to examination zone.
Customs officers start examining the goods at least 10% of it. If it
is approved, they sign and take the yellow page of the form.
Inspection is not considered as a main operation because it is not
done by any of RJ operators, Inspection is done by specialized
Jordanian army officers, and Jordanian Customs officers.
3.8.3 Storage
The costumer takes the “Instructions for Dispatch of Goods Form”
and gives it to the export office. Who in turn give him the printed
Air Waybill (which contains four pages, one for Export office, one
for costumer, the other two goes with the shipment for the carrier
airlines and the consignee),The costumer use this paper to the
61
transit supervisor who in turn sends it to cargo control office with
other bills for the same flight.
The yard forklift operator weighs the shipment with and without
the pallet. And then he allocates the shipment and writes the
position on “Instructions For Dispatch Of Goods” (the Blue one)
Then he hand it to the transit supervisor.
He also fills the number of Air Waybills, number of pieces and the
weights with and without the pallets on “Export Goods
Weightings’ Form” (from Appendix A Figure A-1).
3.8.4 Pick and Pack
In this operation, they start to prepare for flights before 8 hours of
their departure.
The Yard Collect operator is mutual between RJ flights and
other carrier’s flights. He retrieves the goods from their places
and put them near the operator who prepares the flight.
The RJ flights supervisor prints out the “Flight Booking List”
(from Appendix A Figure A-2) at the beginning of his shift, and
tells the Yard collect operator of the position of the goods he
wants. The Preparation operators start preparing the flight
according to the sequence of the flight time.
62
The other carrier’s flights supervisor. Also does the same work
as the RJ supervisor. But with their own operator/s.
After picking all the shipments for the flight, the supervisor packs
it by covering the pallet with a net, or closes the ULD. The
supervisor then gives the clearance for the operator/s to put it on
the ETV storage racks by the automated transfer vehicle (ATV),
and then he acknowledges the cargo control that the shipment is
good to go.
3.8.5 Shipping
Before two to three hours of the flight departure, the cargo control
sends these papers to the ETV operator to prepare the shipment
near the gate so the terminal ground handling operators will load it
into the aircraft
63
4 Chapter Four: Performance Assessment
64
4.1 Key Performance Indicators (KPIs)
To measure the performance of labor in this system we used two
KPIs and they are utilization and productivity. Utilization is the
actual time that the operator actually works over the available time;
meanwhile productivity is the output (whether it is the number of
bills, total weights or the total pieces) over the actual time.
Choosing the output to calculate productivity for each operation is
determined based on the operators managers knowledge and our
observations.
According to the interview with the Quality Control Manager “Mr.
Mohannad Awwad” they desire to have 70% to 80% for their
operators’ Utilization. If the utilization is less than 65% this will
indicates that the distribution of their operators should be
reconsidered. Otherwise, if the utilization exceeds 85%, this will be
not preferable because that will cause operator fatigue, which also
indicates that they have shortage in that operation that might create
a bottle-nick in the process flow.
As the export manager Yosef Al-Masri informed us that the
acceptable productivity for “Reception & Accounting” operator/s is
around six to seven bills per hour. And the acceptable productivity
for the other six operators is 200 pieces per hour.
Labor performance assessment will be done for the following four
identified operations of the export area which are: reception and
65
accounting, unloading and weighing, put-away, pick and pack, and
storage.
4.2 Operators at export area
Operators at export area are classified according to the operations
done as shown in the following Table 4.1.
Table 4.3: Operators’ classification according to operation’s type
Operation Operators classifications
Acceptance
1. Reception and accounting
operator/s.
2. Unloading and weighing
operator/s
Put-away Put-away operator/s
Storage Storage (Yard) operator.
Pick and pack
1. Collect (yard) operator.
2. RJ flights preparations
operator/s
3. Other carriers flights
preparation operator/s
Shipping ETV systems operator/s.
4.3 Types of collected data
1. Number of operators per operation;
2. Available time;
3. Actual time;
4. Number of bills;
66
5. Total pieces;
6. Total weight.
4.4 Period of data collected
The period of the collected data is two weeks, starting from the 17 th
of December 2011 until the 30th of December 2011.
4.5 Considerations and limitations
Data for the number of bills, total pieces and total weights are
collected from the “Weighing export reports” which has been
filled by operators during the data collecting period. This data
will be used in the assessment of the seven type of operators
mentioned I Table 4.1.
Friday’s data for these four operations are not collected,
because they are not documented in the “Weighing export
reports”.
RJ preparation data are collected separately. Other carriers’
preparation data are also collected separately.
“Collect (Yard)” operator data is summed from the RJ and other
carriers’ preparations flights operators.
The data for the “ETV system” operator are not collected since
this operator is used by both import and export operations,
67
which make this data not useful for labor performance
assessment for export operations.
Data were collected only for shift A (8:00 – 15:00).
The available time and actual time for each operator was
collected from the “Study of Actual Time for Operators Form”
shown in Appendix A (Figure A-7). These forms were filled by
each operator for different operations for two weeks.
4.6 Performance assessment for the “Reception and Accounting” operator
Available time is the amount of time that the operator is available
whether he is working or not, he is being paid for these hours.
Available time is 7 hours for this shift multiplied by the number of
operators working in that shift for that operation. Ex: if there are 2
operators working on Sunday, the available time is 14 hours.
Actual time is the time that the operator/s is actually working and it
is calculated from the forms they filled. This is the time they were
actually working.
To measure the utilization we divided the actual time over the
available time for operator/s.
Utilization= actual timeavailable time
68
The Reception and Accounting department operators are mainly
doing paper works, so their productivity is not concerned with the
weight or the number of pieces that each bill contains. The main
factor that’s affecting the reception operators is how many bills
they cover through their shift. This is why we used the output of
their productivity as the total number of bills over the actual time
operating.
Productivity= totalbillsactual time
Table 4.2 shows number of operators, the time available, time
actual, number of bills, total weight, total number of pieces they
covered, utilization and productivity for “Reception and
Accounting” operator/s between the 17th of Dec 2011 until the 23rd
of Dec 2011.
Figure 4.1 shows the utilization for “Reception and Accounting”
operator/s between the 17th of Dec 2011 until the 23rd of Dec 2011.
Figure 4.2 shows the productivity for “Reception and Accounting”
operator/s between the 17th of Dec 2011 until the 23rd of Dec 2011.
Table 4.4: Data collected and performance assessment for reception and accounting operator/s for week one.
Saturday 17-Dec
Sunday 18-Dec
Monday 19-Dec
Tuesday 20-Dec
Wednesday 21-Dec
Thursday 22-Dec
Friday 23-Dec
Number of operators 1 2 2 2 2 2 1Time Available (Hrs) 7 14 14 14 14 14 7
69
Time Actual (Hrs) 5.92 8.32 9.84 9.66 10.82 8.2 -No. of Bills 40 38 55 55 63 39 -Total Weight (Kgs) 1634
820056
20196
12031
14995 22191
-
Total Pcs. 929 937 1959 563 314 1174 -Utilization (%) 84.57 59.4
370.2
969.0
077.29 58.57 -
Productivity (Bills/Hr)
6.76 4.57 5.59 5.69 5.82 4.76 -
Saturday 17-Dec
Sunday 18-Dec Monday 19-Dec
Tuesday 20-Dec
Wednesday 21-Dec
Thursday 22-Dec
0.00
10.00
20.00
30.00
40.00
50.00
60.00
70.00
80.00
90.00
Utilization (%)
Figure 4.13: Reception and accounting operators utilization for week one
Saturday 17-Dec
Sunday 18-Dec Monday 19-Dec
Tuesday 20-Dec
Wednesday 21-Dec
Thursday 22-Dec
0.00
1.00
2.00
3.00
4.00
5.00
6.00
7.00
8.00
Productivity (Bills/Hr)
Figure 4.14: Reception and accounting operators productivity for week one
Table 4.3 shows number of operators, the time available, time
actual, number of bills, total weight, total number of pieces they
70
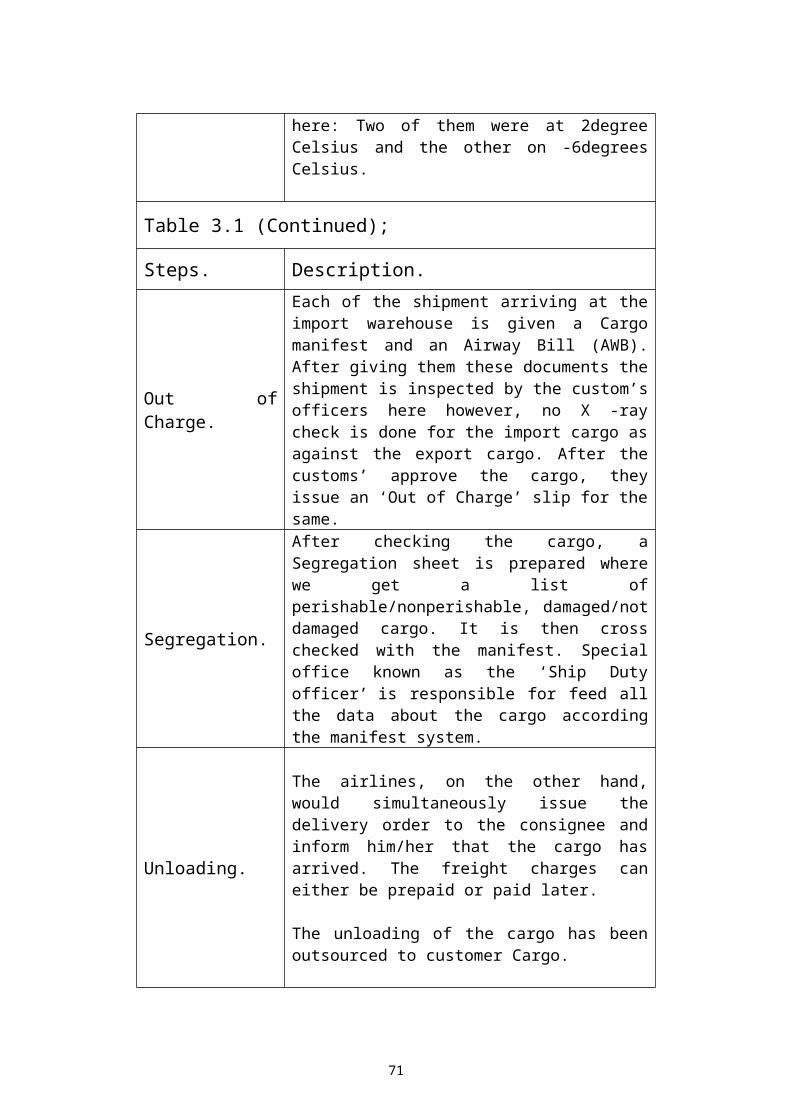
covered, utilization and productivity for “Reception and
Accounting” operator/s between the 24th of Dec 2011 until the 30rd
of Dec 2011.
Figure 4.3 shows the utilization for “Reception and Accounting”
operator/s between the 24th of Dec 2011 until the 30rd of Dec 2011.
Figure 4.4 shows the productivity for “Reception and Accounting”
operator/s between the 24th of Dec 2011 until the 30rd of Dec 2011.
Table 4.5: Data collected and performance assessment for reception and accounting operator/s in week two
Saturday24-Dec
Sunday25-Dec
Monday26-Dec
Tuesday27-Dec
Wednesday28-Dec
Thursday29-Dec
Friday30-Dec
Number of operators 1 2 2 2 2 2 1Time Available (Hrs) 7 14 14 14 14 14 7Time Actual (Hrs) 6.1 9.32 7.2 9.5 11.84 11 -No. of Bills 40 46 31 51 84 63 -Total Weight (Kgs) 2865
223461
12229
27591
30035 34330
-
Total Pcs. 4445 625 1176 2176 1113 2594 -Utilization (%) 87.1
466.5
751.4
367.8
684.57 78.57 -
Productivity (Bills/Hr)
6.56 4.94 4.31 5.37 7.09 5.73 -
71
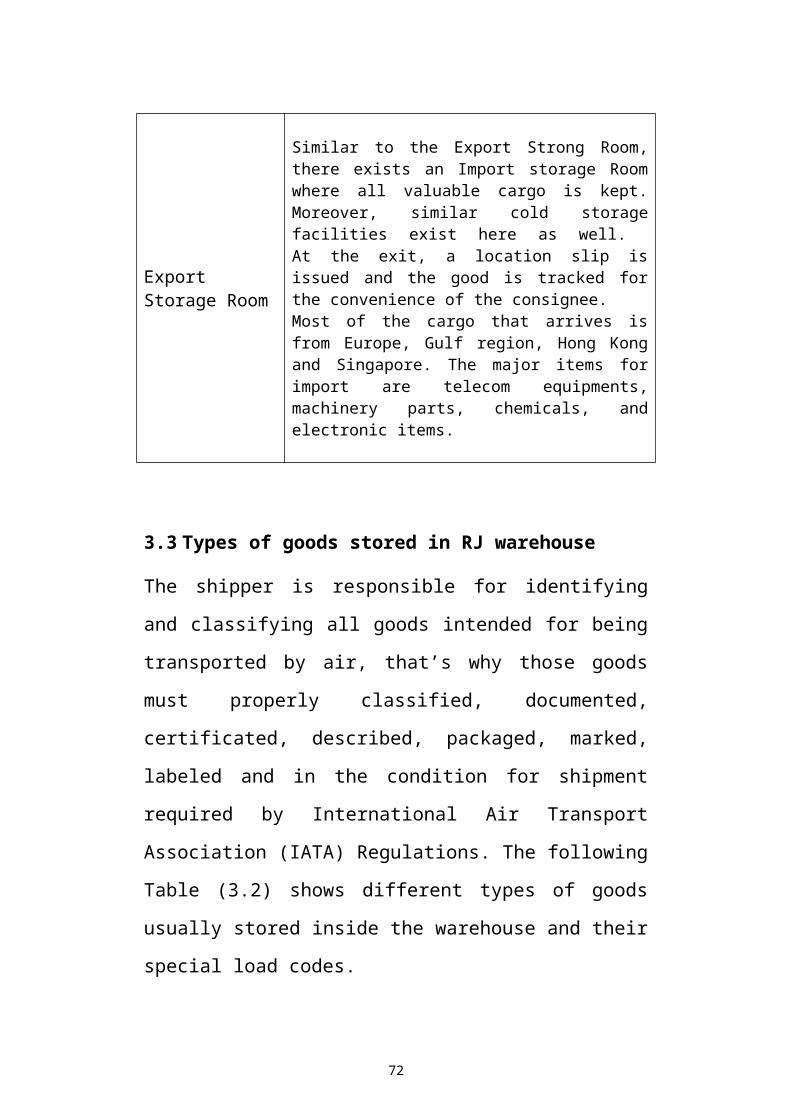
Saturday 24-Dec
Sunday 25-Dec Monday 26-Dec
Tuesday 27-Dec
Wednesday 28-Dec
Thursday 29-Dec
0.00
10.00
20.00
30.00
40.00
50.00
60.00
70.00
80.00
90.00
100.00
Utilization (%)
Figure 4.15: Reception and accounting operators utilization for week two
Saturday 24-Dec
Sunday 25-Dec Monday 26-Dec
Tuesday 27-Dec
Wednesday 28-Dec
Thursday 29-Dec
0.00
1.00
2.00
3.00
4.00
5.00
6.00
7.00
8.00
Productivity (Bills/Hr)
Figure 4.16: Reception and accounting operators productivity for week two
Comparison between week one and week two for the utilization
and productivity of Reception and accounting operator/s are shown
in Figure 4.5 and Figure 4.6 respectively.
72
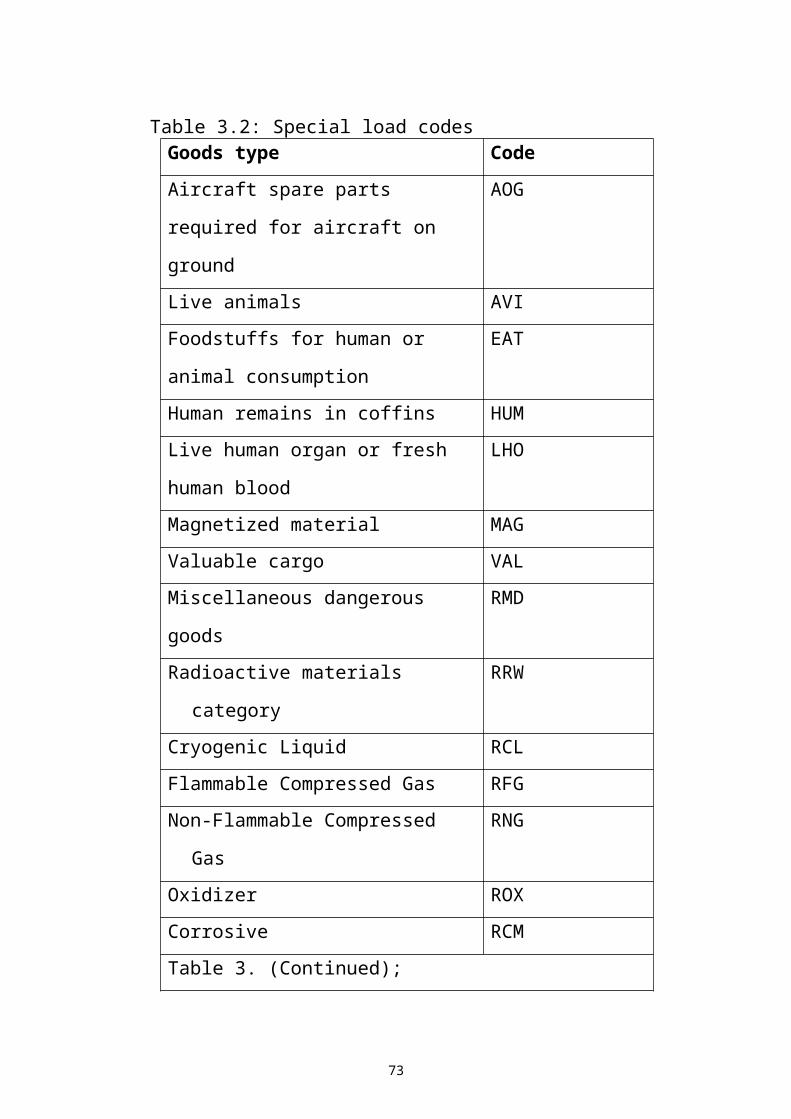
Saturday Sunday Monday Tuesday Wednesday Thursday Friday0.00
10.00
20.00
30.00
40.00
50.00
60.00
70.00
80.00
90.00
100.00
Week 1
Week 2
Utilization for Reception & Accounting(%)
Figure 4.17: Utilization comparison for two weeks for the Reception and Accounting operator/s
Saturday Sunday Monday Tuesday Wednesday Thursday0.00
1.00
2.00
3.00
4.00
5.00
6.00
7.00
8.00
Week 1
Week 2
Productivity for Reception & Accounting (Bills/Hr)
Figure 4.18: Productivity comparison for two weeks for the Reception and Accounting operators
This operator/s utilization is within the limit, except for one day
which was the 24th of Dec operator which was a day before
Christmas holiday. Usually for Saturday’s there is only one worker
for this task at “shift A” which increases the utilization. Monday
73
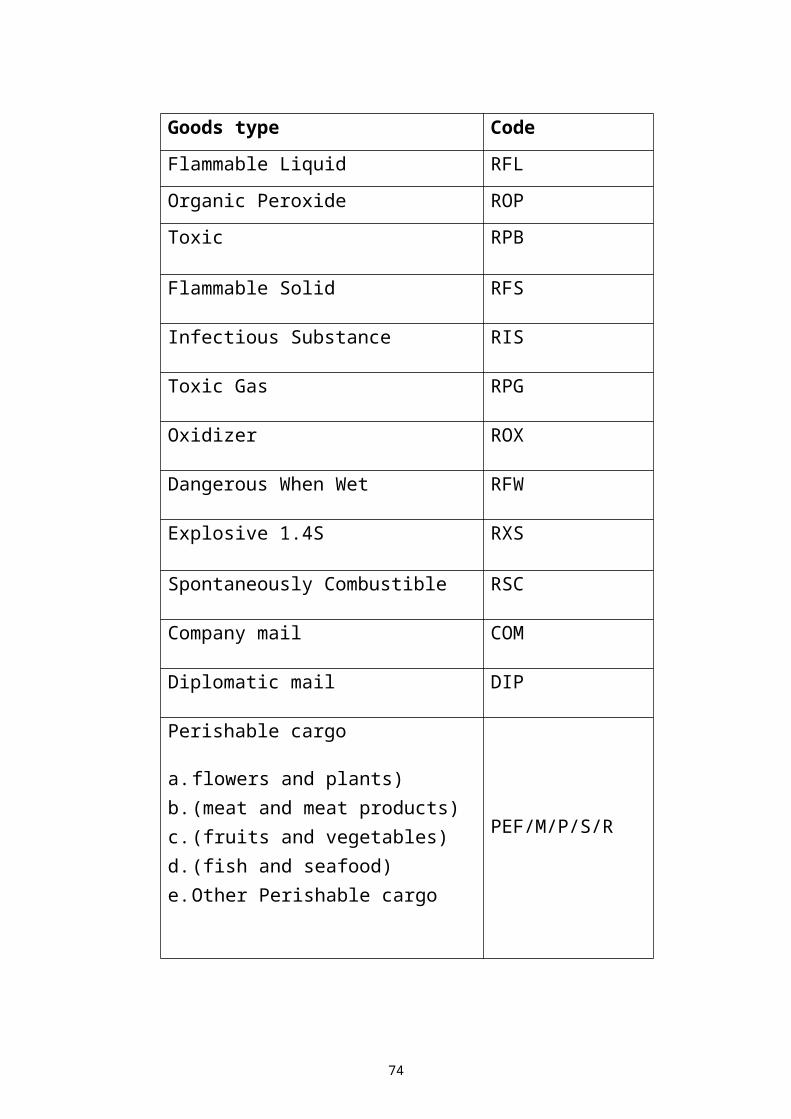
the 26th of December had lower utilization because Sunday was the
Christmas holiday and most businesses were on a break.
Wednesdays and Tuesdays operator/s utilization are acceptable.
These operator/s productivity is almost alike for the two weeks
with little differences.
4.7 Performance assessment for the “Unloading and Weighting” operator
To measure the utilization we divided the actual time over the
available time for each operator/s.
Utilization= actual timeavailable time
These operators manually unload and weigh the shipment so their
best indicator would be the number of pieces. Their productivity is
measured by dividing the total number of pieces over their actual
time.
Productivity= total piecesactual time
Table 4.4 shows number of operators, the time available, time
actual, number of bills, total weight, total number of pieces they
74
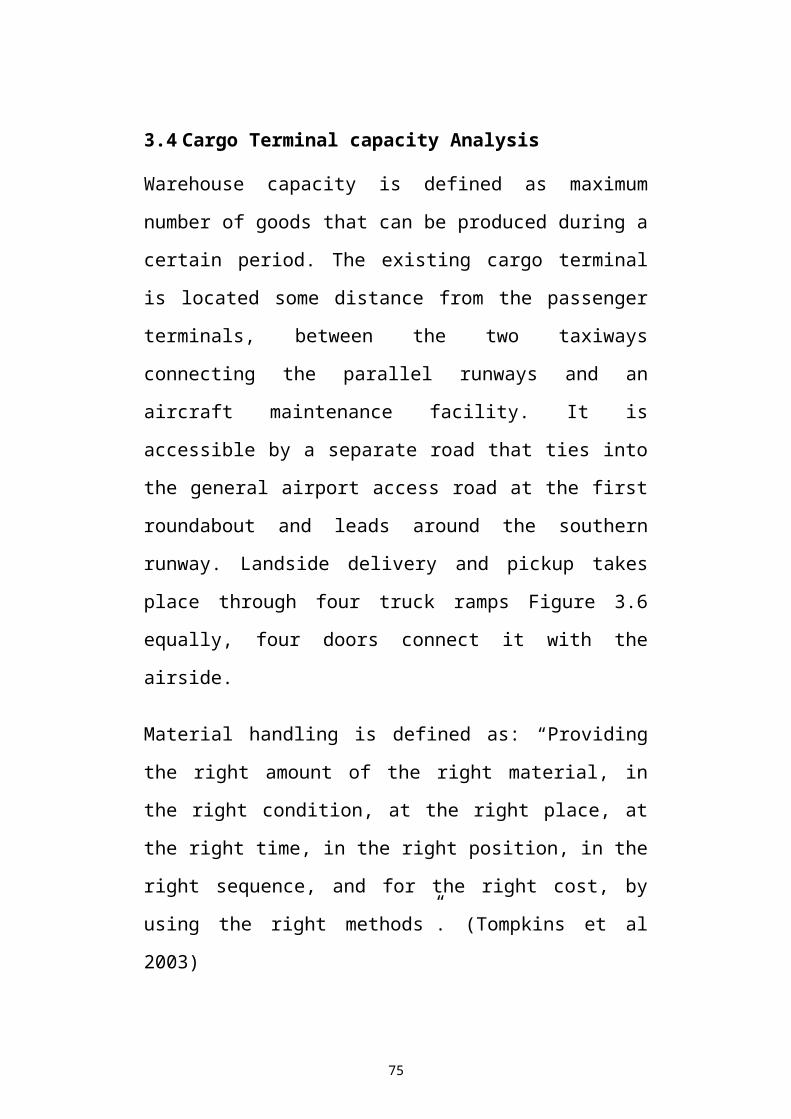
covered, utilization and productivity for “Unloading & Weighing”
operator/s between the 17th of Dec 2011 until the 23rd of Dec 2011.
Figure 4.7 shows the utilization for “Unloading & Weighing”
operator/s between the 17th of Dec 2011 until the 23rd of Dec 2011.
Figure 4.8 shows the productivity for “Unloading & Weighing”
operator/s between the 17th of Dec 2011 until the 23rd of Dec 2011.
Table 4.6: Data collected and performance assessment for unloading and weighting operator in week one
Saturday17-Dec
Sunday18-Dec
Monday19-Dec
Tuesday20-Dec
Wednesday21-Dec
Thursday22-Dec
Friday23-Dec
Number of operators 1 1 1 1 1 1 1Time Available (Hrs) 7 7 7 7 7 7 7Time Actual (Hrs) 4.83 4.83 5.67 4.41 3.92 4.58 -No. of Bills 40 38 55 55 63 39 -Total Weight (Kgs) 16348 2005
62019
61203
114995 2219
1-
Total Pcs. 929 937 1959 563 314 1174 -Utilization (%) 69.00 69.0
081.00 63.00 56.00 65.43 -
Productivity (Pcs./Hr)
192.34 194.0
345.5 127.66
80.10 256.33
-
75
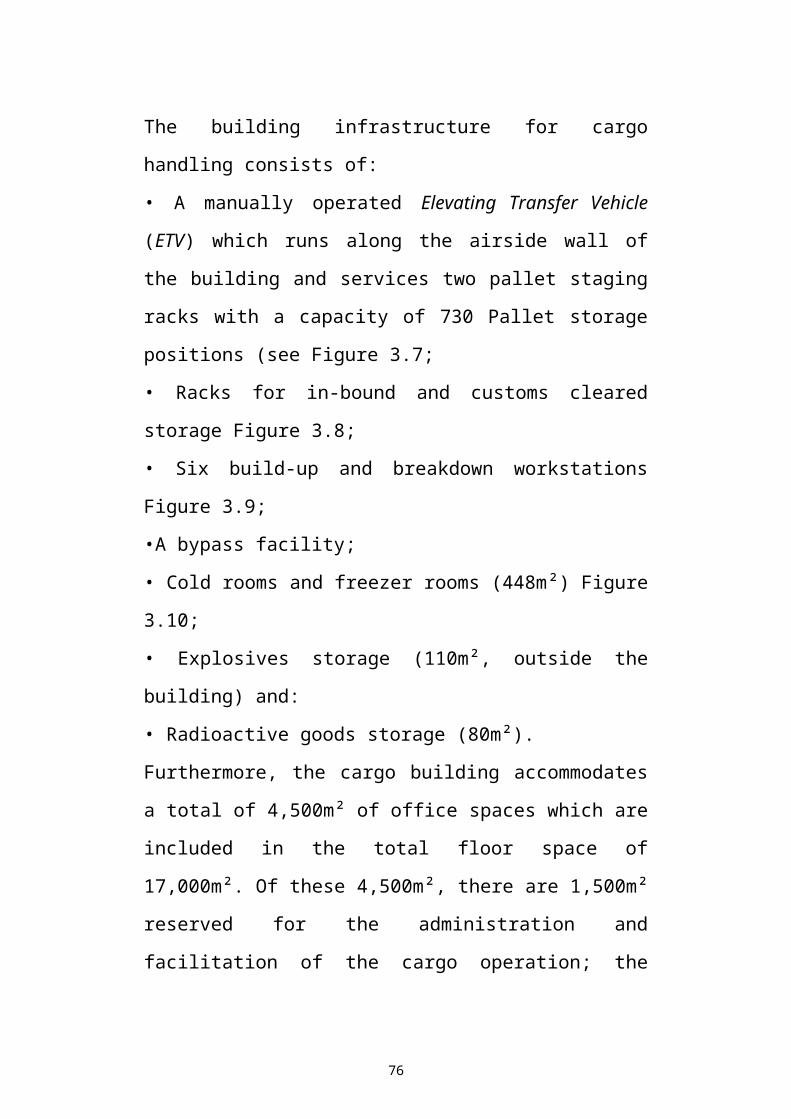
Saturday 17-Dec
Sunday 18-Dec Monday 19-Dec
Tuesday 20-Dec
Wednesday 21-Dec
Thursday 22-Dec
0.00
10.00
20.00
30.00
40.00
50.00
60.00
70.00
80.00
90.00
Utilization (%)
Figure 4.19: Unloading and weighting operator’s utilization for week one
Saturday 17-Dec
Sunday 18-Dec Monday 19-Dec
Tuesday 20-Dec
Wednesday 21-Dec
Thursday 22-Dec
0.00
50.00
100.00
150.00
200.00
250.00
300.00
350.00
400.00
Productivity (Pcs. /Hr)
Figure 4.20: Unloading and weighting operator’s productivity for week one
Table 4.5 shows number of operators, the time available, time
actual, number of bills, total weight, total number of pieces they
covered, utilization and productivity for “Unloading & Weighing”
operator/s between the 24th of Dec 2011 until the 30rd of Dec 2011.
Figure 4.9 shows the utilization for “Unloading & Weighing”
operator/s between the 24th of Dec 2011 until the 30rd of Dec 2011.
76
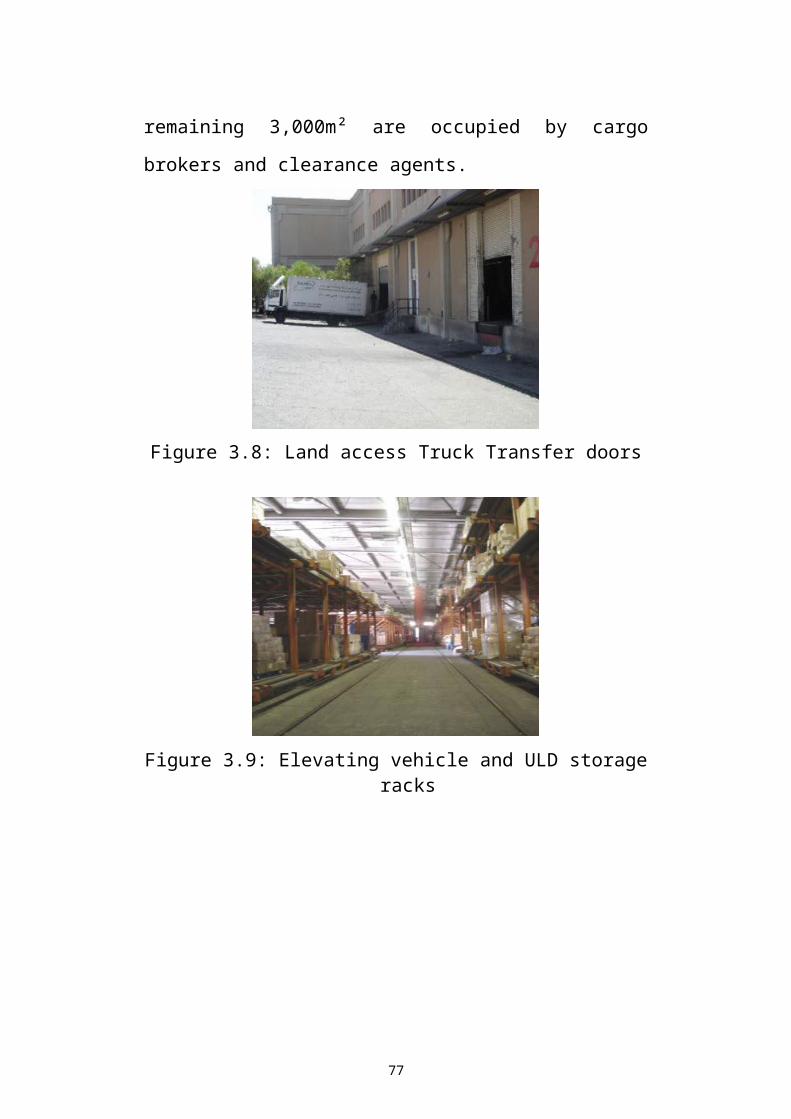
Figure 4.10 shows the productivity for “Unloading & Weighing”
operator/s between the 24th of Dec 2011 until the 30rd of Dec 2011.
Table 4.7: Data collected and performance assessment for unloading and weighting operator week two
Saturday24-Dec
Sunday25-Dec
Monday26-Dec
Tuesday27-Dec
Wednesday28-Dec
Thursday29 Dec
Friday30-Dec
Number of operators 1 1 1 1 1 1 1Time Available (Hrs) 7 7 7 7 7 7 7Time Actual (Hrs) 6.1 4.92 5.1 5.67 6.17 5.83 -No. of Bills 40 46 31 51 84 63 -Total Weight (Kgs) 2865
22346
11222
92759
130035 3433
0-
Total Pcs. 4445 625 1176 2176 1113 2594 -Utilization (%) 87.14 70.29 72.86 81.00 88.14 83.29 -Productivity (Pcs. /Hr) 728.6
9127.0
3230.5
9383.7
7180.39 444.9
4-
Saturday 24-Dec
Sunday 25-Dec Monday 26-Dec
Tuesday 27-Dec
Wednesday 28-Dec
Thursday 29-Dec
0.00
10.00
20.00
30.00
40.00
50.00
60.00
70.00
80.00
90.00
100.00
Utilization (%)
Figure 4.21: Unloading and weighting operator’s utilization for week two
77
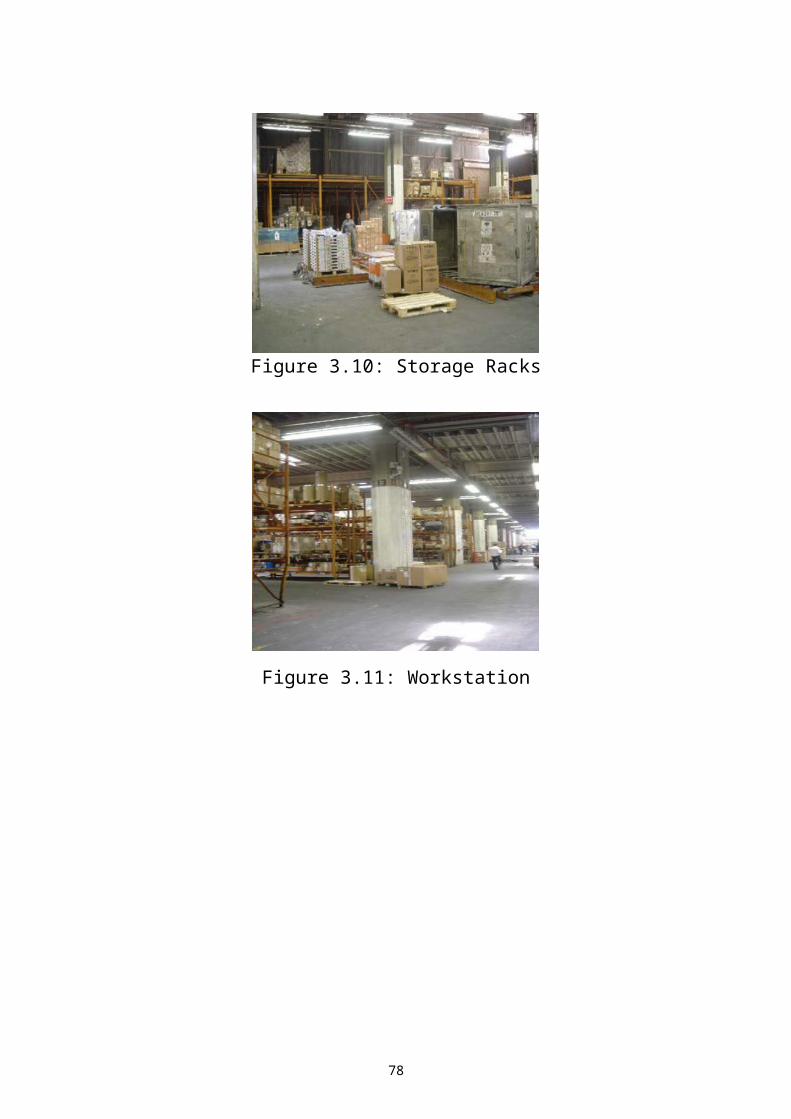
Saturday 24-Dec
Sunday 25-Dec Monday 26-Dec
Tuesday 27-Dec
Wednesday 28-Dec
Thursday 29-Dec
0.00
100.00
200.00
300.00
400.00
500.00
600.00
700.00
800.00
Productivity (Pcs. /Hr)
Figure 4.22: Unloading and weighting operator’s productivity for week two
Comparison between Week one and week two for the utilization
and productivity of Unloading and weighting operator/s are shown
in Figure 4.11 and Figure 4.12 respectively.
Saturday Sunday Monday Tuesday Wednesday Thursday0.00
10.00
20.00
30.00
40.00
50.00
60.00
70.00
80.00
90.00
100.00
Week 1
Week 2
Utilization for Unloading & Weighing (%)
Figure 4.23: Utilization comparison for two weeks for Unloading & weighing operators
78
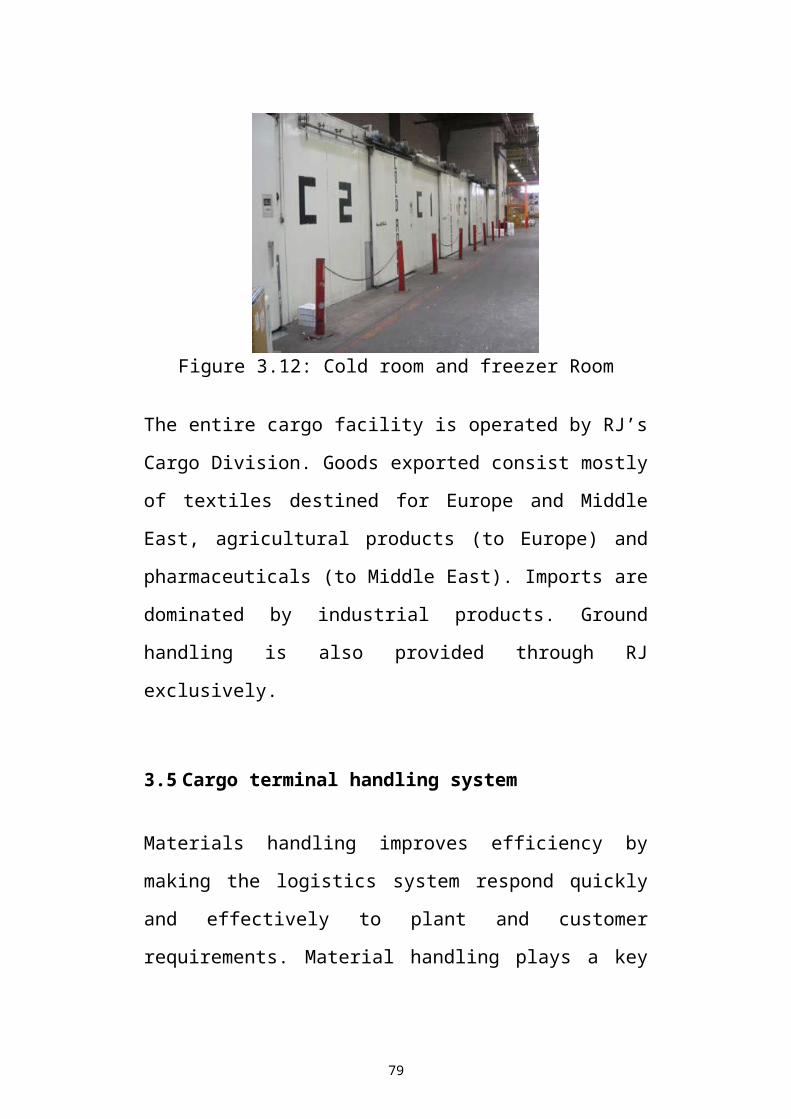
Saturday Sunday Monday Tuesday Wednesday Thursday0.00
100.00
200.00
300.00
400.00
500.00
600.00
700.00
800.00
Week 1
Week 2
Productivity for Unloading & Weighing (Pcs/Hr)
Figure 4.24: Productivity comparison for two weeks for Unloading & weighing operators
Unloading and Weighting operator works almost in an even uniform utilization except for few days, lower utilization days helps to recover from the lower ones.
Productivity for Saturday the 24th of Dec was very high Due to a medications shipment on that day which has small sizes.
The utilization for the workers is better for the second week rather than the first week.
The variability in the operators’ productivity is high due to the change of the number of pieces he covers which is out of his control.
4.8 Performance assessment for the “Put-away” operator
To measure the utilization we divided the actual time over the
available time for each operator/s.
Utilization= actual timeavailable time
79
These operators manually take the shipment from the X-ray
Machine and put it on pallets. From interviewing their supervisor,
their best indicator would be the total number of pieces. Their
productivity is measured by dividing the total number of pieces
over their actual time.
Productivity=total piecesactual time
Table 4.6 shows the number of operators, the time available, time
actual, number of bills, total weight, total number of pieces they
covered, utilization and productivity for “Put-away” operator/s
between the 17th of Dec 2011 until the 23rd of Dec 2011.
Figure 4.13 shows the utilization for “Put-away” operator/s
between the 17th of Dec 2011 until the 23rd of Dec 2011.
Figure 4.14 shows the productivity for “Put-away” operator/s
between the 17th of Dec 2011 until the 23rd of Dec 2011.
Table 4.8: Data collected and performance assessment for Put-away operator in week one
Saturday17-Dec
Sunday18-Dec
Monday19-Dec
Tuesday20-Dec
Wednesday21-Dec
Thursday22-Dec
Friday23-Dec
Number of operators 1 1 1 1 1 1 1Time Available (Hrs)
7 7 7 7 7 7 7Time Actual (Hrs) 4.92 5 5.83 4.67 3.58 4.67 -No. of Bills 40 38 55 55 63 39 -Total Weight (Kgs) 1634
820056
20196
12031
14995 22191
-
Total Pcs. 929 937 1959 563 314 1174 -Utilization (%) 70.2
971.4
383.2
966.7
151.14 66.71 -
Productivity (Pcs. /Hr)
188.82
187.4
336.02
120.56
87.71 251.39
-
80
Saturday 17-Dec
Sunday 18-Dec Monday 19-Dec
Tuesday 20-Dec
Wednesday 21-Dec
Thursday 22-Dec
0.00
10.00
20.00
30.00
40.00
50.00
60.00
70.00
80.00
90.00
Utilization (%)
Figure 4.25: Put-away operator’s utilization for week one
Saturday 17-Dec
Sunday 18-Dec Monday 19-Dec
Tuesday 20-Dec
Wednesday 21-Dec
Thursday 22-Dec
0.00
50.00
100.00
150.00
200.00
250.00
300.00
350.00
400.00
Productivity (Pcs. /Hr)
Figure 4.26: Put-away operator’s productivity for week one
Table 4.7 shows the number of operators, the time available, time
actual, number of bills, total weight, total number of pieces they
covered, utilization and productivity for “Put-away” operator/s
between the 24th of Dec 2011 until the 30rd of Dec 2011.
Figure 4.15 shows the utilization for “Put-away” operator/s
between the 24th of Dec 2011 until the 30rd of Dec 2011.
81
Figure 4.16 shows the productivity for “Put-away” operator/s
between the 24th of Dec 2011 until the 30rd of Dec 2011.
Table 4.9: Data collected and performance assessment for Put-away operator in week two
Saturday24-Dec
Sunday25-Dec
Monday26-Dec
Tuesday27-Dec
Wednesday28-Dec
Thursday29-Dec
Friday30-Dec
Number of operators 1 1 1 1 1 1 1Time Available (Hrs)
7 7 7 7 7 7 7Time Actual (Hrs) 6.1 4.58 5.25 5.83 5.1 6 -No. of Bills 40 46 31 51 84 63 -Total Weight (Kgs) 2865
223461
12229
27591
30035 34330
-
Total Pcs. 4445 625 1176 2176 1113 2594 -Utilization (%) 87.1
465.4
375.0
083.2
972.86 85.7
1-
Productivity (Pcs. /Hr)
728.69
136.46
224.00
373.24
218.24 432.33
-
Saturday 24-Dec
Sunday 25-Dec Monday 26-Dec
Tuesday 27-Dec
Wednesday 28-Dec
Thursday 29-Dec
0.00
10.00
20.00
30.00
40.00
50.00
60.00
70.00
80.00
90.00
100.00
Utilization (%)
Figure 4.27: Put-away operator’s utilization for week two
82
Saturday 24-Dec
Sunday 25-Dec Monday 26-Dec
Tuesday 27-Dec
Wednesday 28-Dec
Thursday 29-Dec
0.00
100.00
200.00
300.00
400.00
500.00
600.00
700.00
800.00
Productivity (Pcs. /Hr)
Figure 4.28: Put-away operator’s productivity for week two
Comparison between Week one and week two for the utilization
and productivity of Put-away operator/s are shown in Figure 4.17
and figure 4.18 respectively.
Saturday Sunday Monday Tuesday Wednesday Thursday0.00
10.00
20.00
30.00
40.00
50.00
60.00
70.00
80.00
90.00
100.00
Week 1
Week 2
Utilization for Put -away (%)
Figure 4.29: Utilization comparison for two weeks for Put-away operators
83
Saturday Sunday Monday Tuesday Wednesday Thursday0.00
100.00
200.00
300.00
400.00
500.00
600.00
700.00
800.00
Week 1
Week 2
Productivity for Put-away (Pcs/Hr)
Figure 4.30: Productivity comparison for two weeks for Put-away operators
Productivity for Saturday the 24th of Dec was very high Due to a medical supply shipment on that day which has small sizes.
The utilization for the workers is better for the second week rather than the first week. But throughout the two weeks, their utilization is within the limits, except for the 21st of Dec
The variability in the operators’ productivity is high due to the change of the number of pieces he covers which is out of his control.
Wednesday the 21st of Dec was the lowest in utilization and their productivity, because there was little work to be done.
4.9 Performance assessment for the “Storage (Yard)” operator
To measure the utilization we divided the actual time over the
available time for each operator/s.
84
Utilization= actual timeavailable time
The forklift operator for Storage (Yard) does not have any problem
with the weight of the shipment, or the number of bills, his only
matter is the number of pieces that he stores. This gives a better
indication on his productivity. Therefore, productivity is calculated
by the total number of pieces over the actual hours.
Productivity= total piecesactual time
Table 4.8 shows the number of operators, the time available, time
actual, number of bills, total weight, total number of pieces they
covered, utilization and productivity for “Storage (Yard) operator/s
between the 17th of Dec 2011 until the 23rd of Dec 2011
Figure 4.19 shows the utilization for “Storage (Yard)” operator/s
between the 17th of Dec 2011 until the 23rd of Dec 2011.
Figure 4.20 shows the productivity for “Storage (Yard)” operator/s
between the 17th of Dec 2011 until the 23rd of Dec 2011.
Table 4.10: Data collected and performance assessment for Put-away operator/s in week one
Saturday17-Dec
Sunday18-Dec
Monday19-Dec
Tuesday20-Dec
Wednesday21-Dec
Thursday22-Dec
Friday23-Dec
Time Available (Hrs)
7 7 7 7 7 7 7Time Actual (Hrs) 5.1 5.25 5.92 4.41 4.17 5.33 -No. of Bills 40 38 55 55 63 39 -Total Weight (Kgs) 1634
82005
62019
61203
114995 2219
1-
Total Pcs. 929 937 1959 563 314 1174 -
85
Utilization (%) 72.86
75.00
84.57
63.00
59.57 76.14 -
Productivity (Pcs./Hr)
182.16
178.48
330.91
127.66
75.30 220.26
-
Saturday 17-Dec
Sunday 18-Dec Monday 19-Dec
Tuesday 20-Dec
Wednesday 21-Dec
Thursday 22-Dec
0.00
10.00
20.00
30.00
40.00
50.00
60.00
70.00
80.00
90.00
Utilization (%)
Figure 4.31: Storage (Yard) operator’s utilization for week one
Saturday 17-Dec
Sunday 18-Dec Monday 19-Dec
Tuesday 20-Dec
Wednesday 21-Dec
Thursday 22-Dec
0.00
50.00
100.00
150.00
200.00
250.00
300.00
350.00
Productivity (Pcs. /Hr)
Figure 4.32: Storage (Yard) operator’s productivity for week one
Table 4.9 shows the number of operators, the time available, time
actual, number of bills, total weight, total number of pieces they
86
covered, utilization and productivity for “Storage (Yard)”
operator/s between the 24th of Dec 2011 until the 30rd of Dec 2011.
Figure 4.21 shows the utilization for “Storage (Yard)” operator/s
between the 24th of Dec 2011 until the 30rd of Dec 2011.
Figure 4.22 shows the productivity for “Storage (Yard)” operator/s
between the 24th of Dec 2011 until the 30rd of Dec 2011.
Table 4.11: Data collected and performance assessment for Storage (Yard) operator/s in week two
Saturday24-Dec
Sunday25-Dec
Monday26-Dec
Tuesday27-Dec
Wednesday28-Dec
Thursday29-Dec
Friday30-Dec
Number of operators 1 1 1 1 1 1 1Time Available (Hrs)
7 7 7 7 7 7 7Time Actual (Hrs) 6 4.92 5.17 5.5 5.92 6.1 -No. of Bills 40 46 31 51 84 63 -Total Weight (Kgs) 2865
22346
11222
92759
130035 3433
0-
Total Pcs. 4445 625 1176 2176 1113 2594 -Utilization (%) 85.7
170.2
973.8
678.5
784.57 87.14 -
Productivity (Pcs. /Hr)
740.83
127.03
227.47
395.64
188.01 425.25
-
87
Saturday 24-Dec
Sunday 25-Dec Monday 26-Dec
Tuesday 27-Dec
Wednesday 28-Dec
Thursday 29-Dec
0.00
10.00
20.00
30.00
40.00
50.00
60.00
70.00
80.00
90.00
100.00
Utilization (%)
Figure 4.33: Storage (Yard) operator’s utilization for week two
Saturday 24-Dec
Sunday 25-Dec Monday 26-Dec
Tuesday 27-Dec
Wednesday 28-Dec
Thursday 29-Dec
0.00
100.00
200.00
300.00
400.00
500.00
600.00
700.00
800.00
Productivity (Pcs. /Hr)
Figure 4.34: Storage (Yard) operator’s productivity for week two
Comparison between Week one and week two for the utilization
and productivity of Storage (Yard) operator/s are shown in Figure
4.23 and Figure 4.24 respectively.
88
Saturday Sunday Monday Tuesday Wednesday Thursday0.00
10.00
20.00
30.00
40.00
50.00
60.00
70.00
80.00
90.00
100.00
Week 1
Week 2
Utilization for Storage (Yard) (%)
Figure 4.35: Utilization comparison for two weeks for Storage (Yard) operators
Saturday Sunday Monday Tuesday Wednesday Thursday0.00
100.00
200.00
300.00
400.00
500.00
600.00
700.00
800.00
Week 1
Week 2
Productivity for Storage (Yard) (Pcs/Hr)
Figure 4.36: Productivity comparison for two weeks for Storage (Yard) operators
Productivity for Saturday the 24th of Dec was very high Due to a medical supply shipment on that day which has small sizes.
Storage (Yard) utilization for the two weeks has been acceptable except for the 21st of Wednesday.
89
The variability in the operators’ productivity is high due to the change of the number of pieces he covers which is out of his control.
Wednesday the 21st of Dec was the lowest in utilization and their productivity, because there was little work to be done.
4.10 Performance assessment for the “Collect (Yard)” operator
To measure the utilization we divided the actual time over the
available time for each operator/s.
Utilization= actual timeavailable time
The forklift operator for Collect (Yard) does not have any problem
with the weight of the shipment, or the number of bills, his only
matter is the number of pieces that he collects. This gives a better
indication on his productivity. Productivity is calculated by the
total number of pieces over the actual hours.
Productivity=total piecesactual time
Table 4.10 shows the number of operators, the time available, time
actual, number of bills, total weight, total number of pieces they
covered, utilization and productivity for “Collect (Yard)”
operator/s between the 17th of Dec 2011 until the 23rd of Dec 2011.
Figure 4.25 shows the utilization for “Collect (Yard)” operator/s
between the 17th of Dec 2011 until the 23rd of Dec 2011.
90
Figure 4.26 shows the productivity for “Collect (Yard)” operator/s
between the 17th of Dec 2011 until the 23rd of Dec 2011.
Table 4.12: Data collected and performance assessment for collect (Yard) operators in week one
Saturday17-Dec
Sunday18-Dec
Monday19-Dec
Tuesday20-Dec
Wednesday21-Dec
Thursday22-Dec
Friday23-Dec
Number of operators 1 1 1 1 1 1 1Time Available (Hrs)
7 7 7 7 7 7 7Time Actual (Hrs) 4.92 5.5 5.1 4.25 5.17 5.67 6.1No. of Bills 41 60 54 40 49 91 67Total Weight (Kgs) 1784
23090
72124
51298
617688 3699
65974
2Total Pcs. 2205 2438 1390 864 1317 1605 2701Utilization (%) 70.2
978.5
772.8
660.7
173.86 81.0
087.1
4Productivity (Pcs. /Hr)
448.17
443.27
272.55
203.29
254.74
283.07
442.79
Saturday 17-Dec
Sunday 18-Dec
Monday 19-Dec
Tuesday 20-Dec
Wednesday 21-Dec
Thursday 22-Dec
Friday 23-Dec
0.00
10.00
20.00
30.00
40.00
50.00
60.00
70.00
80.00
90.00
100.00
Utilization (%)
Figure 4.37: Collect (Yard) operator’s utilization for week one
91

Saturday 17-Dec
Sunday 18-Dec
Monday 19-Dec
Tuesday 20-Dec
Wednesday 21-Dec
Thursday 22-Dec
Friday 23-Dec
0.00
50.00
100.00
150.00
200.00
250.00
300.00
350.00
400.00
450.00
500.00
Productivity (Pcs. /Hr)
Figure 4.38: Collect (Yard) operator’s productivity for week one
Table 4.11shows the number of operators, the time available, time
actual, number of bills, total weight, total number of pieces they
covered, utilization and productivity for “Reception and
Accounting” operator/s between the 24th of Dec 2011 until the 30rd
of Dec 2011.
Figure 4.27 shows the utilization for “Collect (Yard)” operator/s
between the 24th of Dec 2011 until the 30rd of Dec 2011.
Figure 4.28 shows the productivity for “Collect (Yard)” operator/s
between the 24th of Dec 2011 until the 30rd of Dec 2011.
Table 4.13: Data collected and performance assessment for collect (Yard) operator/s in week two
Saturday24-Dec
Sunday25-Dec
Monday26-Dec
Tuesday27-Dec
Wednesday28-Dec
Thursday29-Dec
Friday30-Dec
Number of operators 1 1 1 1 1 1 1Time Available (Hrs)
7 7 7 7 7 7 7Time Actual (Hrs) 4.67 5.83 4.92 5.1 5.5 5.83 6.1No. of Bills 37 100 46 44 64 82 84Total Weight (Kgs) 1511
740908
17351
14666
42379 37879
49456
Total Pcs. 1491 196 1049 1325 1295 1519 216
92
8 2Utilization (%) 66.7
183.2
970.2
972.8
678.57 83.2
987.1
4Productivity (Pcs. /Hr)
319.3
337.5
213.2
260 235.4 260.55
354.4
Saturday 24-Dec
Sunday 25-Dec
Monday 26-Dec
Tuesday 27-Dec
Wednesday 28-Dec
Thursday 29-Dec
Friday 30-Dec
0.00
10.00
20.00
30.00
40.00
50.00
60.00
70.00
80.00
90.00
100.00
Utilization (%)
Figure 4.39: Collect (Yard) operator’s utilization for week two
Saturday 24-Dec
Sunday 25-Dec
Monday 26-Dec
Tuesday 27-Dec
Wednesday 28-Dec
Thursday 29-Dec
Friday 30-Dec
0.00
50.00
100.00
150.00
200.00
250.00
300.00
350.00
400.00
Productivity (Pcs. /Hr)
Figure 4.40: Collect (Yard) operator’s productivity for week two
Comparison between Week one and week two for the utilization
and productivity of Collect (Yard) operator/s are shown in Figure
4.29 and Figure 4.30 respectively.
93
Saturday Sunday Monday Tuesday Wednesday Thursday Friday0.00
10.00
20.00
30.00
40.00
50.00
60.00
70.00
80.00
90.00
100.00
Week 1
Week 2
Utilization for Collect (Yard) (%)
Figure 4.41: Utilization comparison for two weeks for Collect (Yard) operators
Saturday Sunday Monday Tuesday Wednesday Thursday Friday0.00
50.00
100.00
150.00
200.00
250.00
300.00
350.00
400.00
450.00
500.00
Week 1
Week 2
Productivity for Collect (Yard) (Pcs/Hr)
Figure 4.42: Productivity comparison for two weeks for Collect (Yard) operators
Usually for this operator mid-week days (Monday, Tuesday, Wednesday) are not that busy, due to less demand from RJ Flights Preparations and other carriers’ preparations flights.
Fridays have high utilization. If we had data about Storage (Yard) operator, we might say that he can help the Collect operator if he is
94
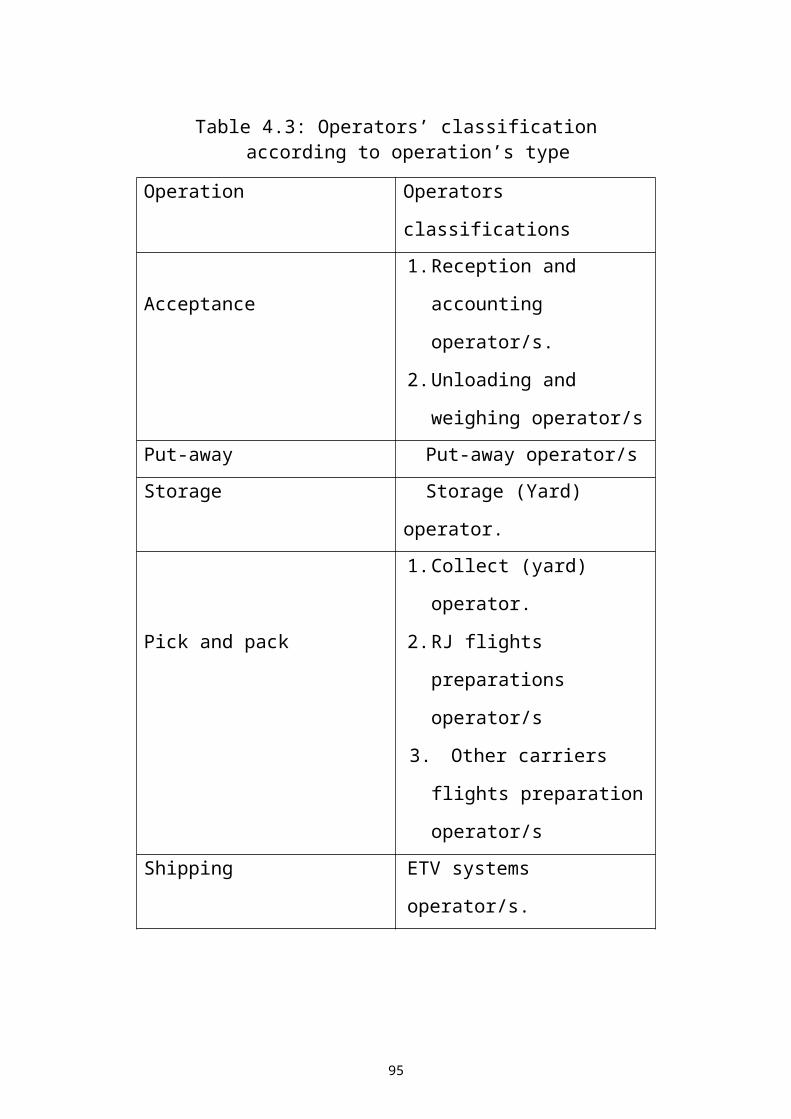
free. Or if he has also high utilization, there can be a third forklift operator to help both of them.
On Saturday the 17th of Dec has the high productivity because on that day there was an extra airplane (Cargo Lox) that’s heading to Algeria with medical supplements (other carriers)
4.11 Performance assessment for the “Preparation RJ flights” operator
To measure the utilization we divided the actual time over the
available time for each operator/s.
Utilization= actual timeavailabletime
Preparation workers are concerned with the number of pieces as
well as the number of bills and the number of RJ flights he has to
cover. However this operation worker/s productivity depends more
likely on the number of pieces. Their productivity is measured by
dividing the total number of pieces over their actual time.
Productivity= total piecesactual time
Table 4.12 shows the number of operators, the time available, time
actual, number of bills, total weight, total number of pieces they
covered, utilization and productivity for “RJ Preparations”
operator/s between the 17th of Dec 2011 until the 23rd of Dec 2011.
Figure 4.31 shows the utilization for “RJ Preparations” operator/s
between the 17th of Dec 2011 until the 23rd of Dec 2011.
95
Figure 4.32 shows the productivity for “RJ Preparations” operator/s
between the 17th of Dec 2011 until the 23rd of Dec 2011.
Table 4.14: Data collected and performance assessment for Preparation RJ flights operator/s in week one
Saturday17-Dec
Sunday18-Dec
Monday19-Dec
Tuesday20-Dec
Wednesday21-Dec
Thursday
22-Dec
Friday23-Dec
Number of operators
1 2 1 2 2 2 2Time Available (Hrs)
7 14 7 14 14 14 14Time Actual (Hrs)
5.92 9.66 5.66 8.32 9.5 11.34 11.2No. of Bills 36 49 46 32 37 68 62Total Weight (Kgs)
8595.1
22463.3
19358.6
12340.7
15701.3
24916.4
58648.9
Total Pcs. 264 1250 1144 813 1085 854 2610Utilization (%) 84.5
769.00 80.86 59.4
367.86 81.00 80.00
Productivity (Pcs. /Hr)
44.59
129.40
202.12
97.72
114.21
75.31 233.04
Saturday 17-Dec
Sunday 18-Dec
Monday 19-Dec
Tuesday 20-Dec
Wednesday 21-Dec
Thursday 22-Dec
Friday 23-Dec
0.00
10.00
20.00
30.00
40.00
50.00
60.00
70.00
80.00
90.00
Utilization (%)
Figure 4.43: Preparation RJ flights operator’s utilization for week one
96
Saturday 17-Dec
Sunday 18-Dec
Monday 19-Dec
Tuesday 20-Dec
Wednesday 21-Dec
Thursday 22-Dec
Friday 23-Dec
0.00
50.00
100.00
150.00
200.00
250.00
Productivity (Pcs. /Hr)
Figure 4.44: Preparation RJ flights operator’s productivity for week one
Table 4.13 shows the number of operators, the time available, time
actual, number of bills, total weight, total number of pieces they
covered, utilization and productivity for “RJ Preparations”
operator/s between the 24th of Dec 2011 until the 30rd of Dec 2011.
Figure 4.33 shows the utilization for “RJ Preparations” operator/s
between the 24th of Dec 2011 until the 30rd of Dec 2011.
Figure 4.34 shows the productivity for “RJ Preparations” operator/s
between the 24th of Dec 2011 until the 30rd of Dec 2011.
Table 4.15: Data collected and performance assessment for Preparation RJ flights operator/s in week two
Saturday24-Dec
Sunday25-Dec
Monday26-Dec
Tuesday27-Dec
Wednesday28-Dec
Thursday29-Dec
Friday30-Dec
Number of operators 1 2 1 2 2 2 2Time Available (Hrs) 7 14 7 14 14 14 14Time Actual (Hrs) 5.25 11.3
25.5 8.82 9.16 11.5 11.3
4No. of Bills 27 85 38 39 42 65 60Total Weight (Kgs) 5307. 2716 1015 1100 14525 2786 3981
97
2 4 2 6 8Total Pcs. 544 1113 345 795 752 1119 1667Utilization (%) 75.00 80.8
678.57 63.00 65.43 82.14 81.0
0Productivity (Pcs. /Hr) 103.6
298.3
262.73 90.14 82.10 97.30 147.
0
Saturday 24-Dec
Sunday 25-Dec
Monday 26-Dec
Tuesday 27-Dec
Wednesday 28-Dec
Thursday 29-Dec
Friday 30-Dec
0.00
10.00
20.00
30.00
40.00
50.00
60.00
70.00
80.00
90.00
Utilization (%)
Figure 4.45: Preparation RJ flights operator’s utilization for week two
Saturday 24-Dec
Sunday 25-Dec
Monday 26-Dec
Tuesday 27-Dec
Wednesday 28-Dec
Thursday 29-Dec
Friday 30-Dec
0.00
20.00
40.00
60.00
80.00
100.00
120.00
140.00
160.00
Productivity (Pcs. /Hr)
Figure 4.46: Preparation RJ flights operator’s productivity for week two
Comparison between Week one and week two for the utilization
and productivity of RJ Preparations operator/s are shown in Figure
4.35 and Figure 4.36 respectively.
98
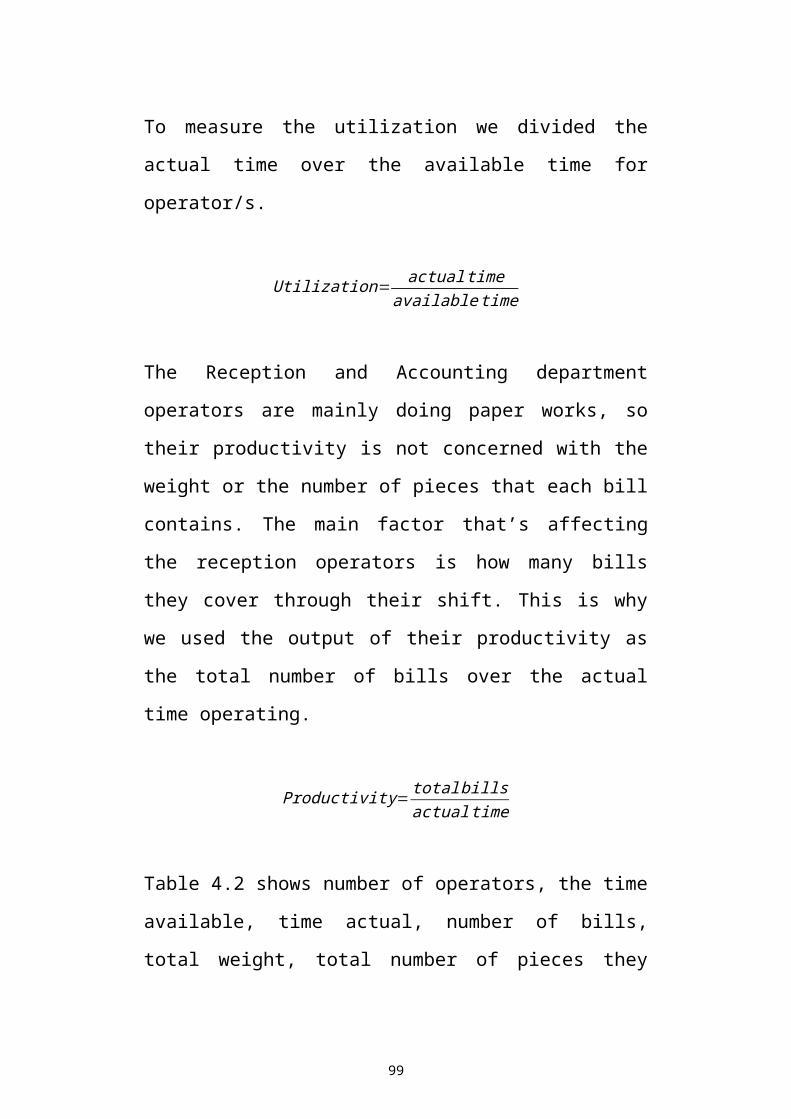
Saturday Sunday Monday Tuesday Wednesday Thursday Friday0.00
10.00
20.00
30.00
40.00
50.00
60.00
70.00
80.00
90.00
Week 1
Week 2
Utilization for RJ Pre. (%)
Figure 4.47: Utilization comparison for two weeks for RJ Preparations operators
Saturday Sunday Monday Tuesday Wednesday Thursday Friday0.00
50.00
100.00
150.00
200.00
250.00
Week 1
Week 2
Productivity for RJ Pre. (Pcs/Hr)
Figure 4.48: Productivity comparison for two weeks for RJ Preparations operators
RJ flights preparations operator/s has good utilization for six days
of the both weeks except Tuesday. So we might consider reducing
the number of operators on that day from two to one operator. Or
we can see if other carrier’s operator can provide some help.
99
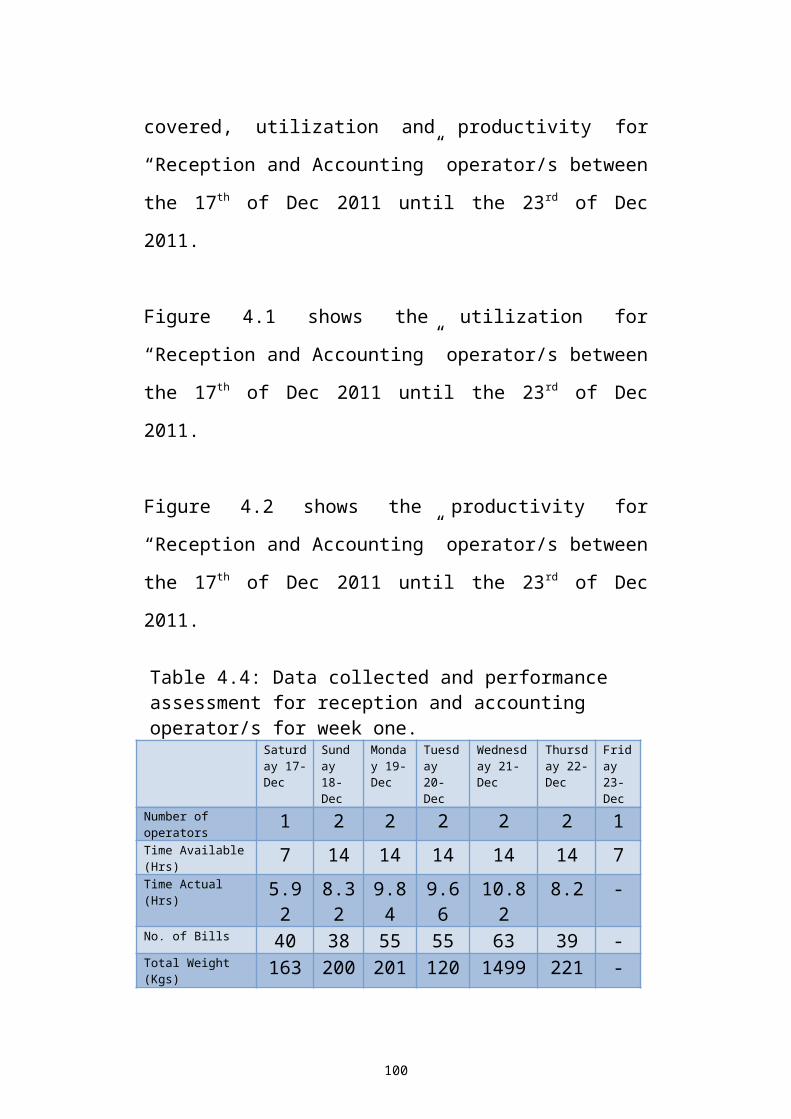
Monday the 19th of Dec and Friday the 22nd of Dec has the highest
productivity Even with that, their utilization still does not exceed
the limits.
The operator/s productivity except for those two days are good,
might rise on Friday and Sunday but has good range.
4.12 Performance assessment for the “Preparation other carriers’ flights” operator
To measure the utilization we divided the actual time over the
available time for each operator/s.
Utilization= actual timeavailable time
Preparation workers are concerned with the number of pieces as
well as the number of bills and the number of other carriers’ flights
he has to cover. However this operation worker/s productivity
depends more likely on the number of pieces. Their productivity is
measured by dividing the total number of pieces over their actual
time.
Productivity= total piecesactual time
Table 4.14 shows the number of operators, the time available, time
actual, number of bills, total weight, total number of pieces they
covered, utilization and productivity for “other carriers’ flights”
operator/s between the 17th of Dec 2011 until the 23rd of Dec 2011.
100
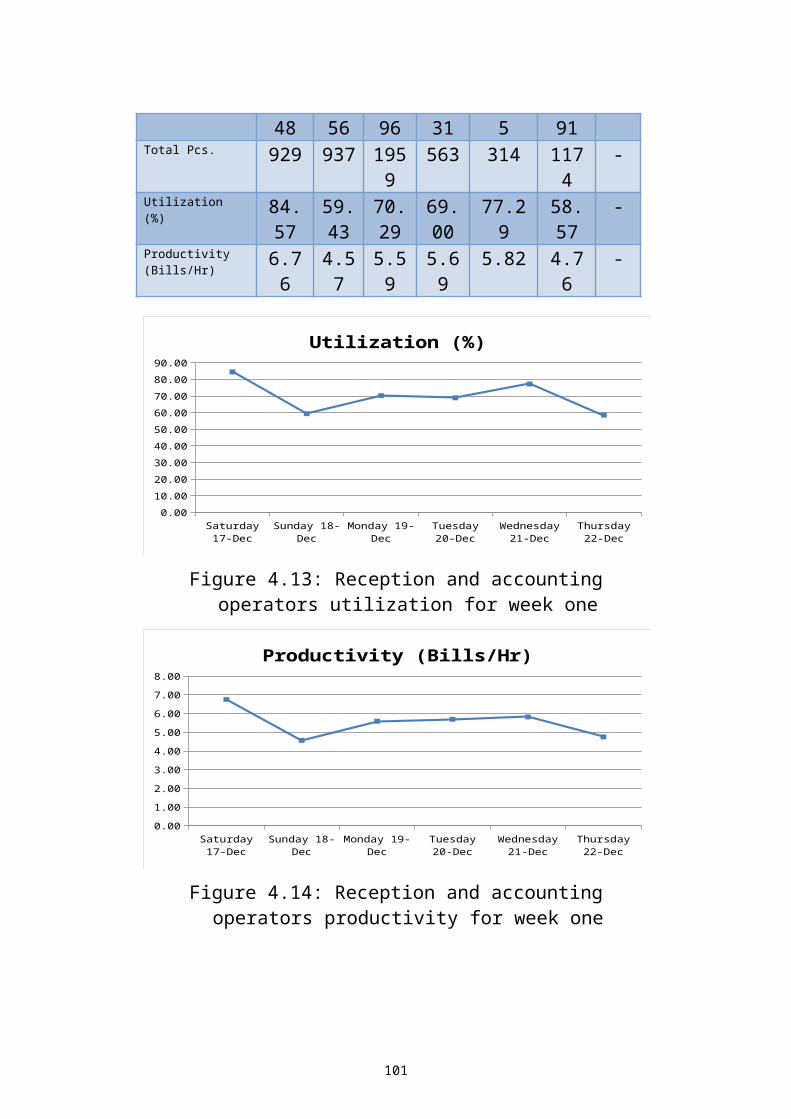
Figure 4.37 shows the utilization for “other carriers’ flights”
operator/s between 17th of Dec 2011 until the 23rd of Dec 2011.
Figure 4.38 shows the productivity for “other carriers’ flights”
operator/s between the 17th of Dec 2011 until the 23rd of Dec 2011.
Table 4.16: Data collected and performance assessment for Preparation other carriers’ flights operators in week one
Saturday17-Dec
Sunday18-Dec
Monday19-Dec
Tuesday20-Dec
Wednesday21-Dec
Thursday22-Dec
Friday23-Dec
Number of operators 1 1 1 1 1 1 1Time Available (Hrs) 5 5 5 5 5 5 5Time Actual (Hrs) 4.25 4 3 2 2.83 3.83 2No. of Bills 5 11 8 8 12 23 5Total Weight (Kgs) 9247 8444 1887 646 1987 1208
01093
Total Pcs. 1941 1188 246 51 232 751 91Utilization (%) 85.00 80.00 60.00 40.00 56.60 76.60 40.0
0Productivity (Pcs./Hr) 456.7
1297.0
082.00 25.50 81.98 196.0
845.5
0
101
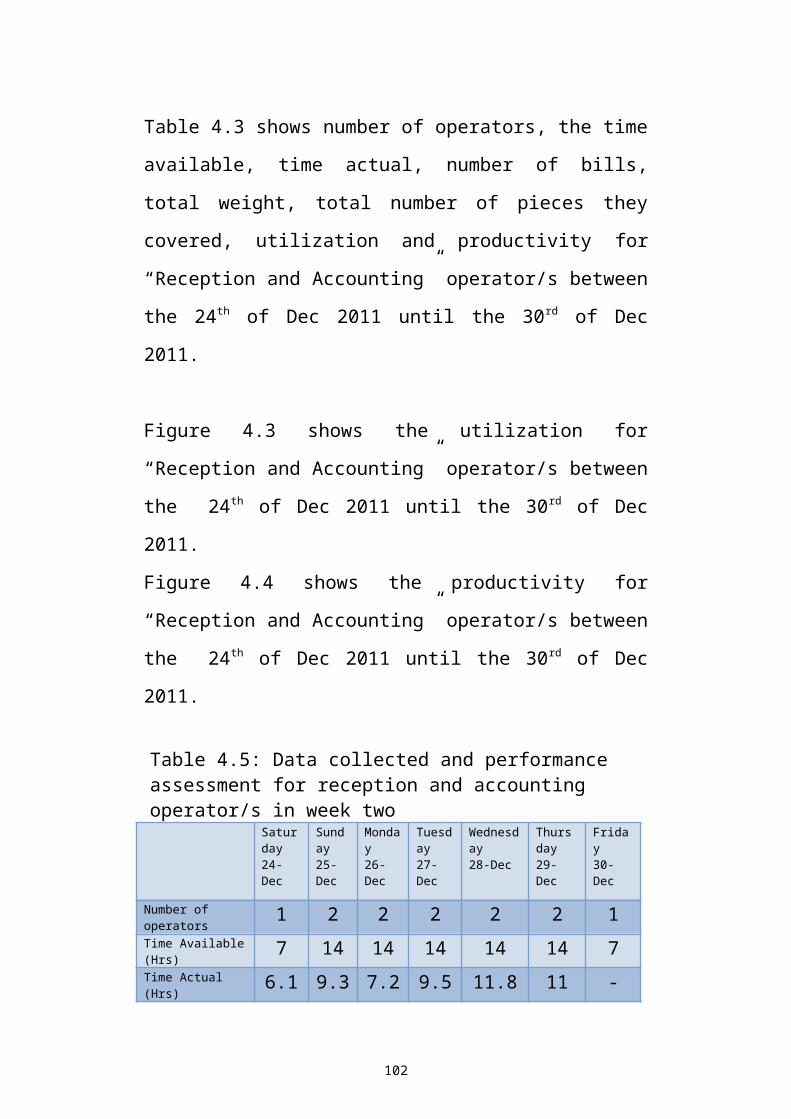
Saturday 17-Dec
Sunday 18-Dec
Monday 19-Dec
Tuesday 20-Dec
Wednesday 21-Dec
Thursday 22-Dec
Friday 23-Dec
0.00
10.00
20.00
30.00
40.00
50.00
60.00
70.00
80.00
90.00
Utilization (%)
Figure 4.49: Preparation other carriers’ flights operator’s utilization for week one
Saturday 17-Dec
Sunday 18-Dec
Monday 19-Dec
Tuesday 20-Dec
Wednesday 21-Dec
Thursday 22-Dec
Friday 23-Dec
0.00
50.00
100.00
150.00
200.00
250.00
300.00
350.00
400.00
450.00
500.00
Productivity (Pcs. /Hr)
Figure 4.50: Preparation other carriers’ flights operator’s productivity for week one
Table 4.15 shows the number of operators, the time available, time
actual, number of bills, total weight, total number of pieces they
covered, utilization and productivity for “other carriers’ flights”
operator/s between the 24th of Dec 2011 until the 30rd of Dec 2011.
102
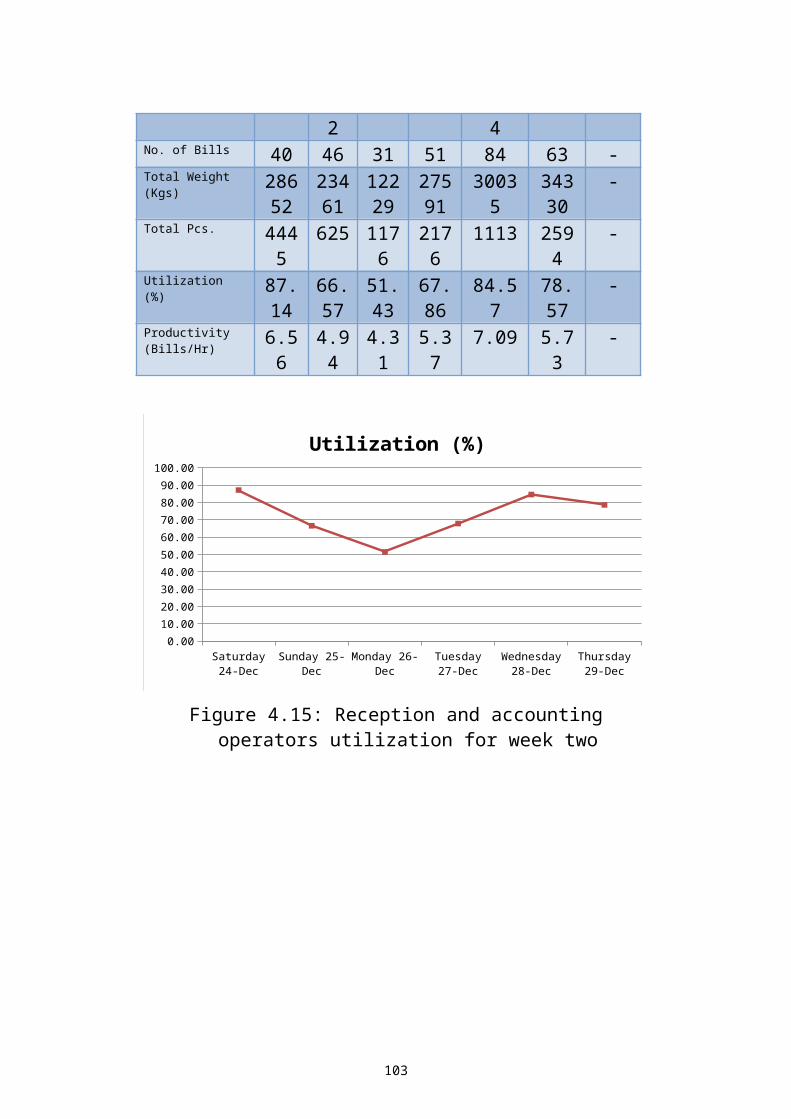
Figure 4.39 shows the utilization for “other carriers’ flights”
operator/s between the 24th of Dec 2011 until the 30rd of Dec 2011.
Figure 4.40 shows the productivity for “other carriers’ flights”
operator/s between the 24th of Dec 2011 until the 30rd of Dec 2011.
Table 4.17: Data collected and performance assessment for Preparation other carriers’ flights operator/s in week two
Saturday24-Dec
Sunday25-Dec
Monday26-Dec
Tuesday27-Dec
Wednesday28-Dec
Thursday29-Dec
Friday30-Dec
Number of operators 1 1 1 1 1 1 1Time Available (Hrs) 5 5 5 5 5 5 5Time Actual (Hrs) 3.33 3.5 3 2.83 4.1 3.67 3.83No. of Bills 10 15 8 5 22 17 24Total Weight (Kgs) 9810 1374
47199 3660 27854 1002
09638
Total Pcs. 947 855 704 530 543 400 495Utilization (%) 66.60 70.0
060.00 56.60 82.00 73.40 76.60
Productivity (Pcs. /Hr) 284.38
244.3
234.67
187.28
132.44 108.99
129.24
Saturday 24-Dec
Sunday 25-Dec
Monday 26-Dec
Tuesday 27-Dec
Wednesday 28-Dec
Thursday 29-Dec
Friday 30-Dec
0.00
10.00
20.00
30.00
40.00
50.00
60.00
70.00
80.00
90.00
Utilization (%)
Figure 4.51: Preparation other carriers’ flights operator’s utilization for week two
103
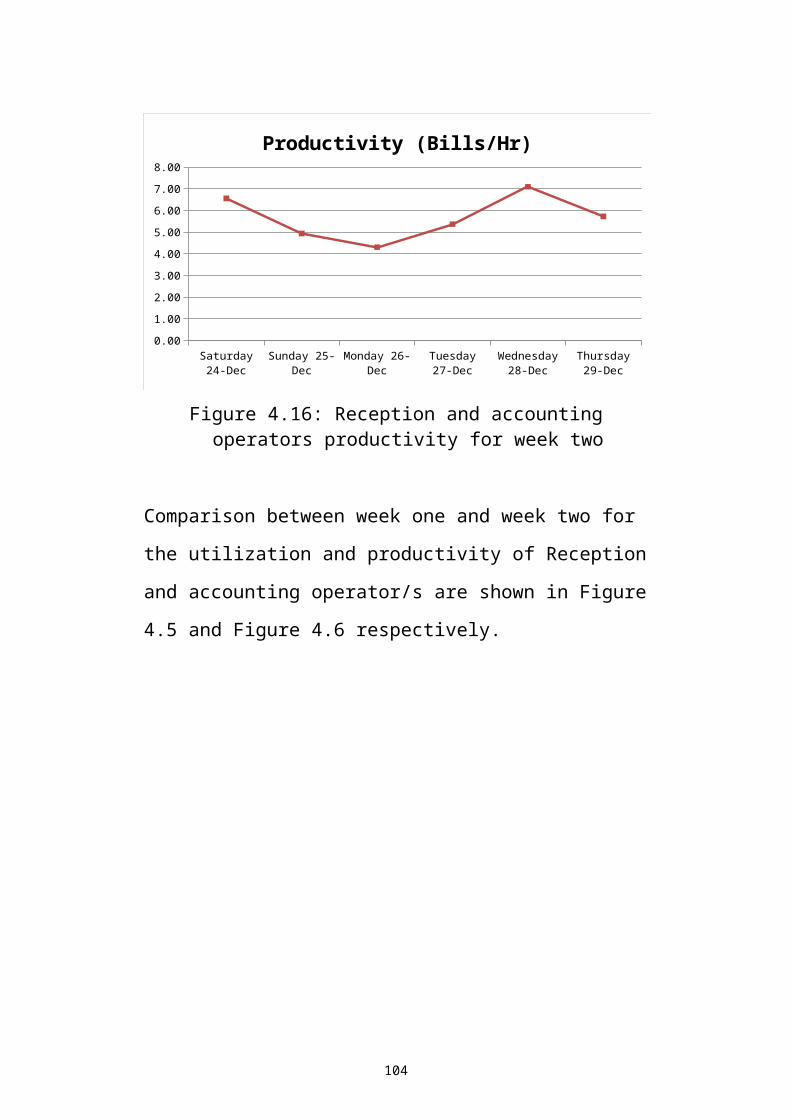
Saturday 24-Dec
Sunday 25-Dec
Monday 26-Dec
Tuesday 27-Dec
Wednesday 28-Dec
Thursday 29-Dec
Friday 30-Dec
0.00
50.00
100.00
150.00
200.00
250.00
300.00
Productivity (Pcs. /Hr)
Figure 4.52: Preparation other carriers’ flights operator’s productivity for week two
Comparison between Week one and week two for the utilization
and productivity of other carriers’ flights operator/s are shown in
Figure 4.41 and Figure 4.42 respectively.
Saturday Sunday Monday Tuesday Wednesday Thursday Friday0.00
10.00
20.00
30.00
40.00
50.00
60.00
70.00
80.00
90.00
Week 1
Week 2
Utilization for Other carriers Pre. (%)
Figure 4.53: Comparing the utilization for two weeks for other carriers Preparations operator/s
104
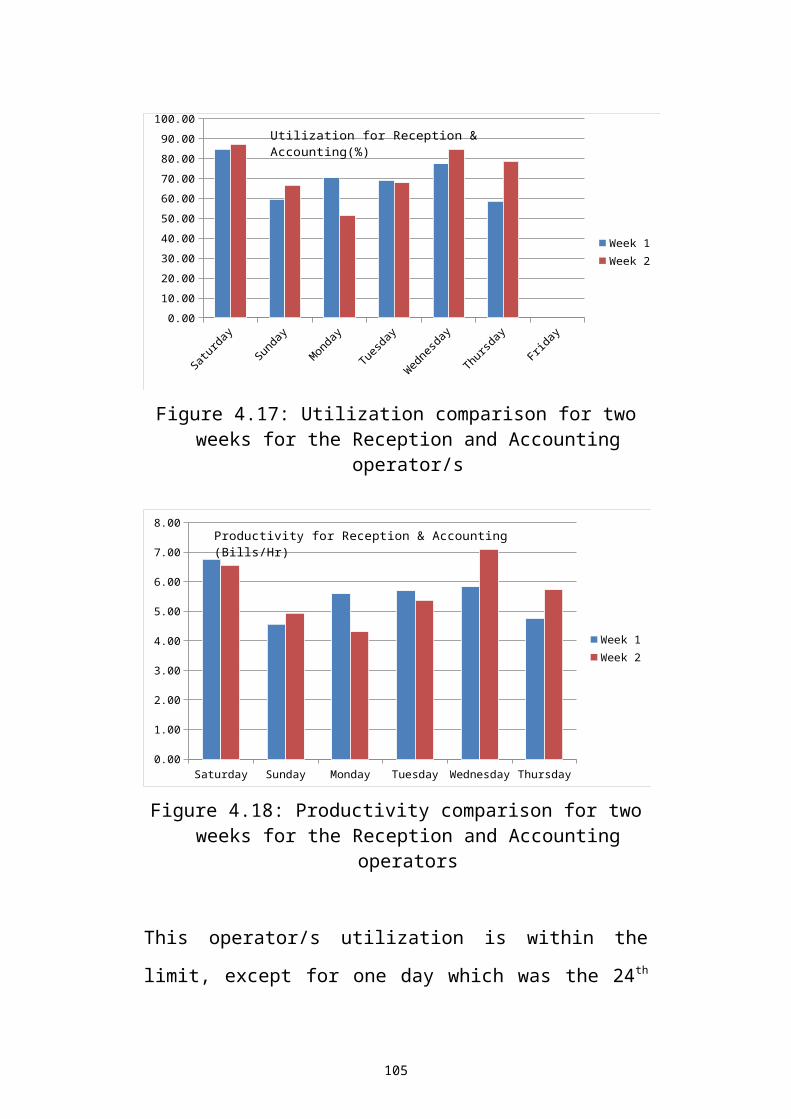
Saturday Sunday Monday Tuesday Wednesday Thursday Friday0.00
50.00
100.00
150.00
200.00
250.00
300.00
350.00
400.00
450.00
500.00
Week 1
Week 2
Figure 4.54: Productivity comparison for two weeks for other carriers Preparations operator/s
Saturday the 17th of Dec has the highest utilization and productivity
because on that day there was an extra airplane (Cargo Lox) that’s
heading to Algeria with medical supplements.
Even this operator only works for 5 hours in preparing other
carriers flights, and two hours in the import area. Still he is not
being utilized throughout the week good. So with arranging
between his supervisor and other operations supervisors, there can
be another area that he can work in. for example, reducing the
number of operators in RJ flight preparations and mix their work
together.
This operator has a high productivity at the start of the week, and
less for the rest of it.
105
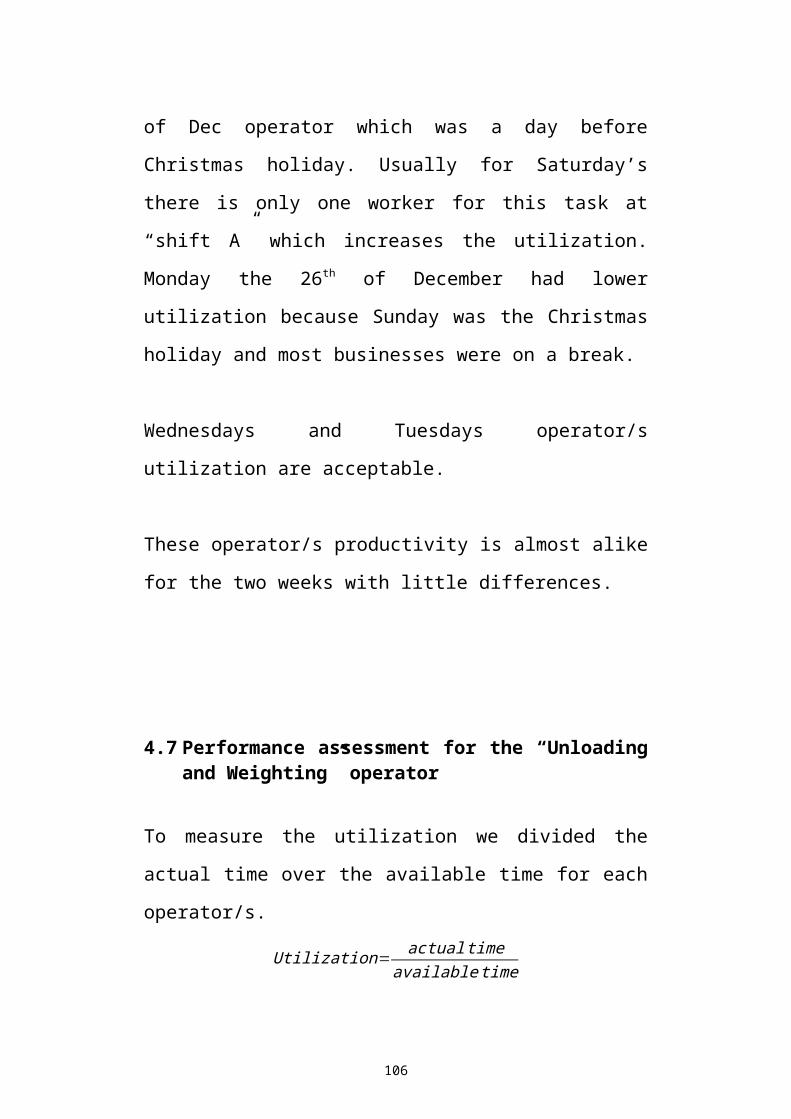
4.13 Performance assessment for the “ETV system” operator
No data were collected for this operator since this operator is used
by both import and export operations, which makes this data not
useful for performance assessment for this operator in relation to
export area only.
4.14 Overall assessment of operators’ utilization and
productivity
The overall assessment of the operators’ utilization and
productivity is done by calculating the average utilization and
average productivity for each type of operators for the two weeks
as shown in Table 4.16.
The comments on the values of the average utilization and average
productivity are shown in Table 4.16.
Table 4.18: The operators’ average utilization and productivity for two weeksOperators classificati
on
Average Utilization (week one) (%)
Average Utilization (week two) (%)
Average Productivity (week
one)
Average Productivity (week
two)
Comments
Reception & Accounting
69.86 72.69 5.53 Bills/Hr
5.6 Bills/Hr
Utilization: Acceptable Productivity: Unacceptable
Unloading & Weighing
67.24 80.45 199.3 Psc/Hr
349.2 Psc/Hr
Utilization: Acceptable Productivity: Acceptable
106
Put-away 68.26 78.24 195.3 Psc/Hr
352.1 Psc/Hr
Utilization: Acceptable Productivity: Acceptable
Storage (Yard)
71.86 80.02 185.7 Psc/Hr
350.7 Psc/Hr
Utilization: Acceptable Productivity: Acceptable
Collect (Yard)
74.92 77.45 335.4 Psc/Hr
282.8 Psc/Hr
Utilization: Acceptable Productivity: Acceptable
Preparation RJ
74.67 75.14 128.0 Psc/Hr
97.3 Psc/Hr
Utilization: Acceptable Productivity: Unacceptable
Preparation Other Carriers
62.60 69.31 169.2 Psc/Hr
188.7 Psc/Hr
Utilization: Unacceptable Productivity: Unacceptable
107
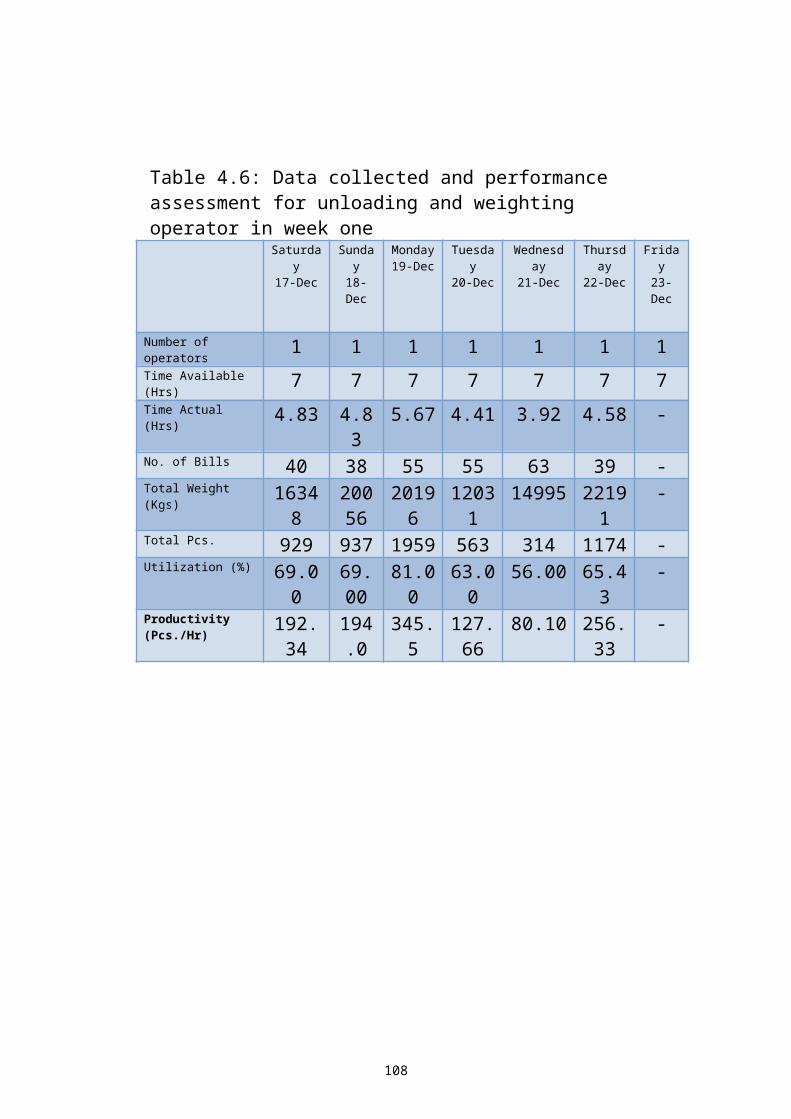
Discussion and Conclusions
108
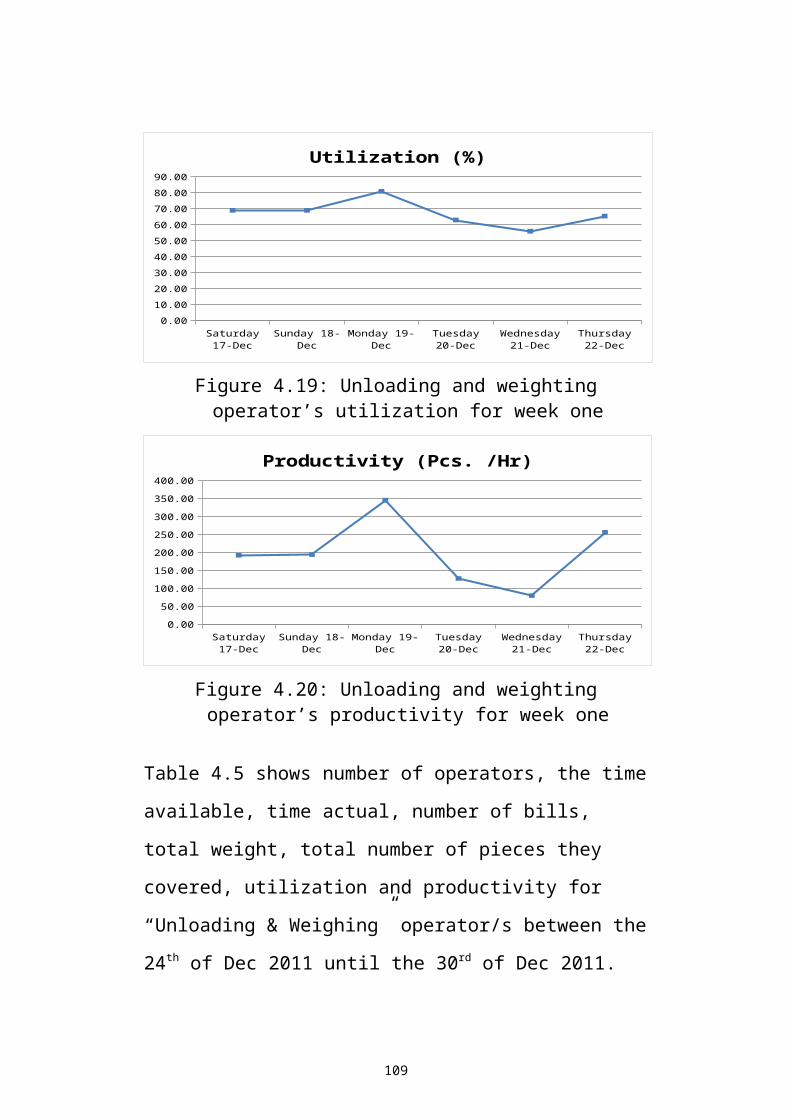
Air cargo Warehouse is essentially for easy doing bossiness in and
out the country in the way of attracts investor or domestic investors
to expand their own works out the country. The role of the
warehouse is important that’s why they need to be centralized
between their whole offices and the other airlines company to
create a best warehouse system. This system needs management in
way of moving information’s and goods together without any faults
to satisfy the customer.
RJ air cargo warehouse that is located near Queen Alia
International Airport (QAIA) are unique, it is like an air way port
but with warehouse operations. It work both ways in and out and
more over does the most works of delivering and receiving cargo to
and from Amman-Jordan, controlling these movements is essential.
According to that, system analysis must done helping in how to
control, improve, implantation and design the logistics services and
more even to do your assessments of the air-cargo warehouse like
in operations or employees’ assessments as we did.
We had to read about warehousing systems and mainly about air
cargo warehouse, through we had a good back ground on it from
few courses had previous semesters, like Facility Planning,
Production Planning and Control, and Project Management. But we
felt that we needed more so we read about Logistics and Supply
Chain Management. To analyze RJ system we observe the process
and interview managers.
109
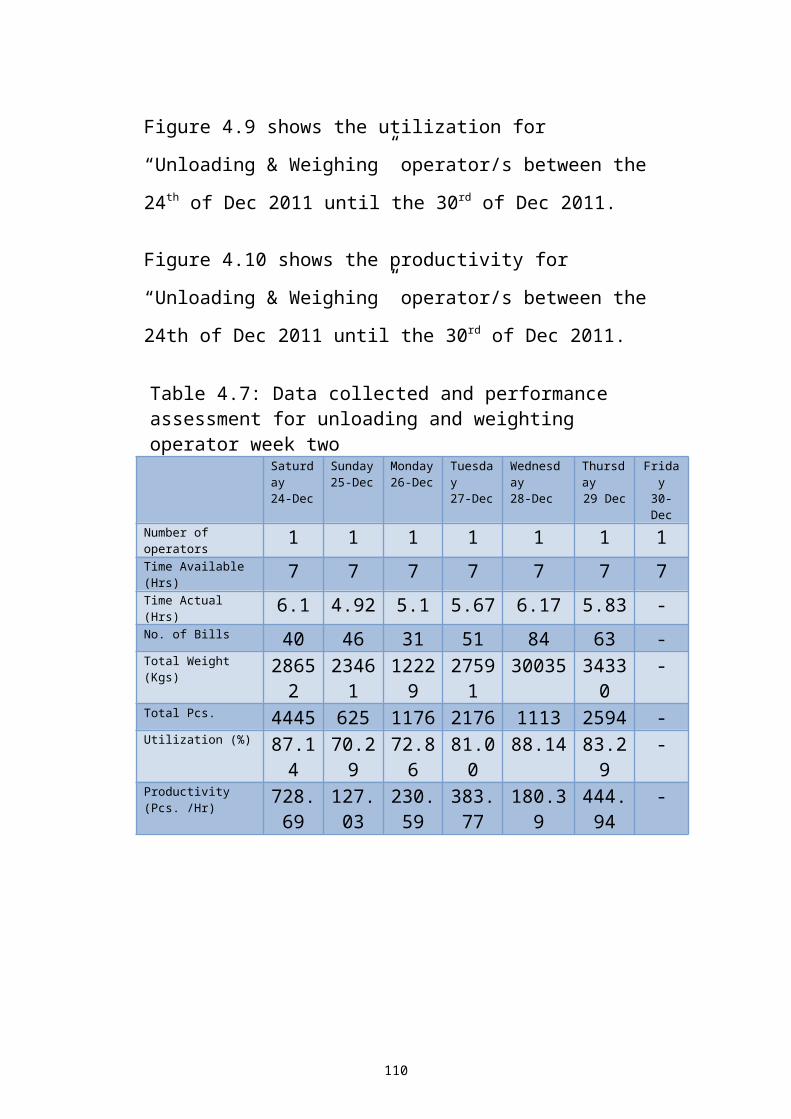
We choose a couple of key performance indicators to help us
assessing RJ air cargo warehouse operators and their utilization and
productivity. In which we analyzed operators’ data and represented
them in Tables with Graphs to simplify it and make it easier to
assess their performance. In result the output of performance
assessment for the utilization for whole operators was acceptable
except for the other carriers’ operator/s. The productivity for whole
operator’s were acceptable except for Reception & Accounting, RJ
Preparation and other carriers’ operator/s. Then we compared for
each operator for their two weeks utilization and productivity.
So far the number of operators is enough, especially that flow of
products in the region is lower, since Egypt, Libya, Syria and
Yemen markets are almost closed, which according to Mr.
Mohannad Awwad were a high demanding countries. The same
performance assessment done on the Export area can be done on
the import area as well.
We interviewed Mr. Mohannad Awwad and Mr. Al-Masri to get
desired utilization and the acceptable productivity for their
operators. Date for two weeks times which are the total weight,
total bills and total pieces. They were very cooperative, except for
Fridays’ supervisor; he found it hard to do.
Thankfully our university is subscribed in ProQuest website, which
turned out to be very helpful to have some variable information’s
about air cargo warehouse system, because it was hard to get this
type of information, and these thesis’s helped a lot.
110
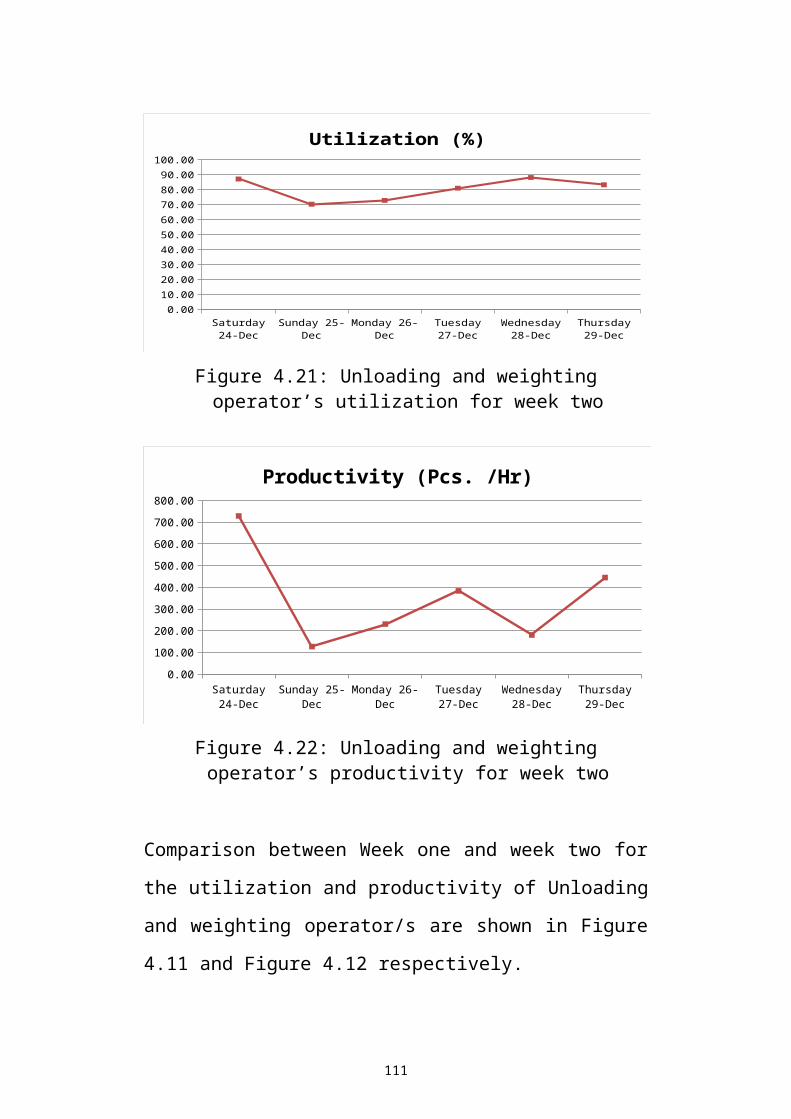
Recommendations
111
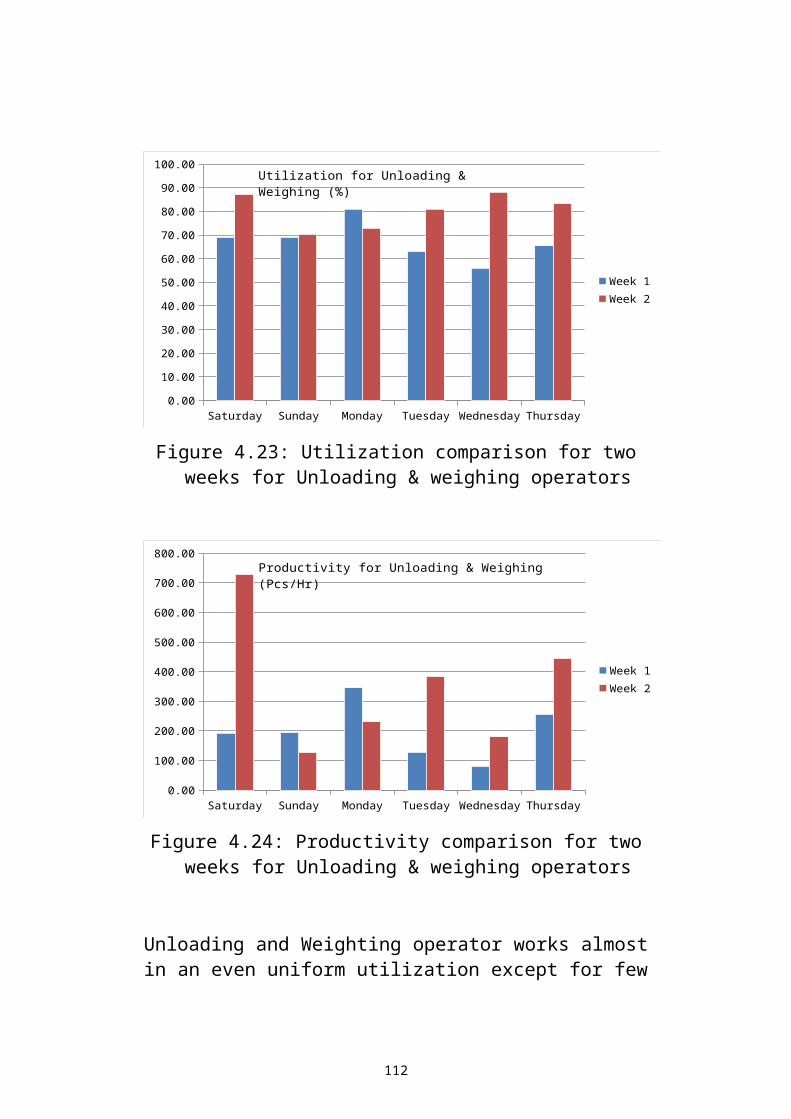
At RJ demand is very hard to predict. They should try to make
their employees multitasked. Example: If there are not a lot of
new shipments coming, and there are a lot of flights that should
be prepared, the operators can rearrange themselves to support
the “Pick & Pack” operators.
Paper works are too much, they should try to make it more
automated, so there will be no loss of documents, flow of
information will be easier to track, and as the whole world is
heading toward a better environmental protection this would be
a step further to help doing that as well, not to mention that it
will helps the company to save a little more money specially in
the recession hitting the region due to what is called the “Arab
Spring” which turned to be pretty much an autumn for business.
Whoever makes the operators’ schedule should make a better
forecasting for the next week or month; also he needs to be up
to the level to prepare it properly.
The supervisor or manager who makes the schedule for the
operators should have a long experience in the warehouse; he
should take into consideration not just the days of the week,
whether it is Sunday, Monday… etc. but should see the date of
the day, for example, For New Year Eve, when we went to take
our data from Mr. Fadi Ahmad there was too much work and
shipments, but they were behind, because that day was
Saturday, and on Saturday shift there is only one operator for
each operation. And according to him, most companies try to
112
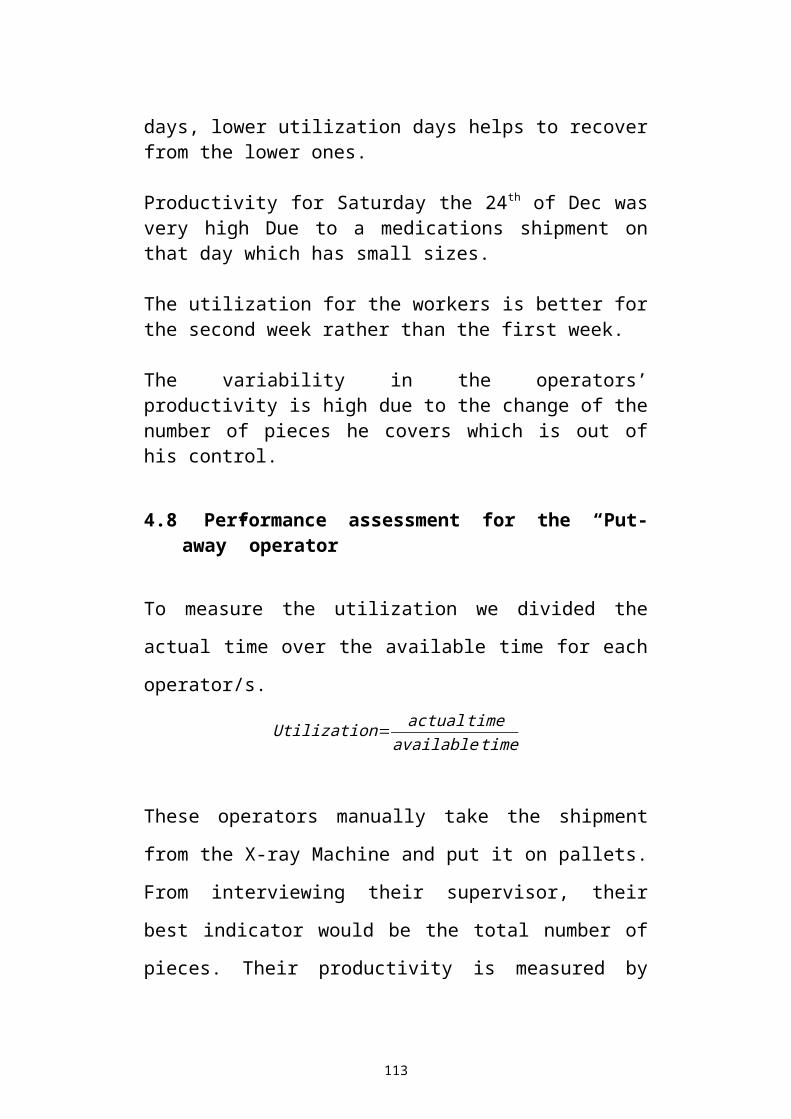
send before the New Year starts. Which caused a lot of delays
for some flights that did not have their pallets or ULDs’ ready
yet. Also, the supervisor should take into consideration the Hijri
calendar for Islamic events.
There should be also a study for management, because the
warehouse management complains that there are not enough
workers, and the top management for RJ thinks that the number
of operators is enough, which is agreeable. Yes there might be
some hectic days, but it can be handled. But from our own
observations, there is too much supervisors, and some of them
are not qualified enough to make good decisions, because
experience is important but knowledge is vital, so that the
experience he has would be built on a proper base.
We think that the supervisors should help and prepare
shipments with the operators, or at least there should be fewer
supervisors with one export controller. For example, For RJ
Flights preparations and other carrier’s flights preparations
should have one supervisor instead of two supervisors. Or there
can be two supervisors in each shift for the export area to
control and check if things are flowing smoothly. Except for
hectic days, this again, should be scheduled thoughtfully.
According to Mr. Fadi Ahmad there is a lot of paper work to be
done, and try to check the emails from the management for
higher priority shipments. This again supports the idea of trying
to make the flow of information more automated.
113
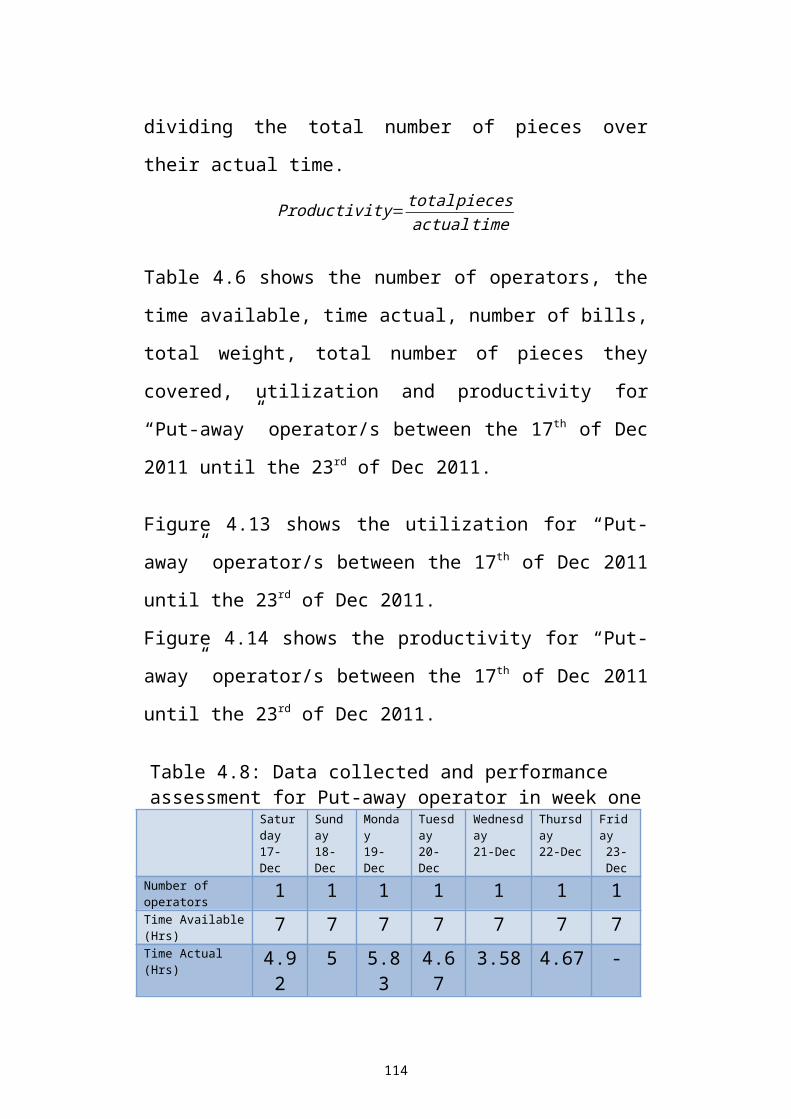
There can be two computers closer for the “Pick and Pack”
operators, so there would not be wasted time to get the “Flight
Booking Lists” from the transit office which is on the second
floor. Just at the beginning of the shift they will print out the
lists from the transit office and check for updates from the
closer computers. When the information’s are documented they
would not need to weight the shipments three times. First, by
the “Unloading & Weighing” operator when it arrives before he
signs, then by the storage (Yard) forklift operator. And last by
the “Collect (Yard)” operator before he gives it to the flights
preparation operators’. Their excuse is to get the gross weight
every time, whether to check it by the “Unloading and
weighing” operator (because he has to sign the Discharge
Shipment form” or to have the Gross weight before the pallets
are sent to the airplanes, so the air operations department will be
prepared. But if it is documented the operator will put the net
weight, so the shipment will be weighed only one time, and
every time the shipment moves the net weight is the same, but
the gross weight changes due to the pallets they use. These
pallets ULDs are seven to eight types, so they can be
standardized. And every time they change the shipment pallet or
put it in an ULD, they will only edit it easily. So they can track
it, know what is it on and its current weight.
References
114
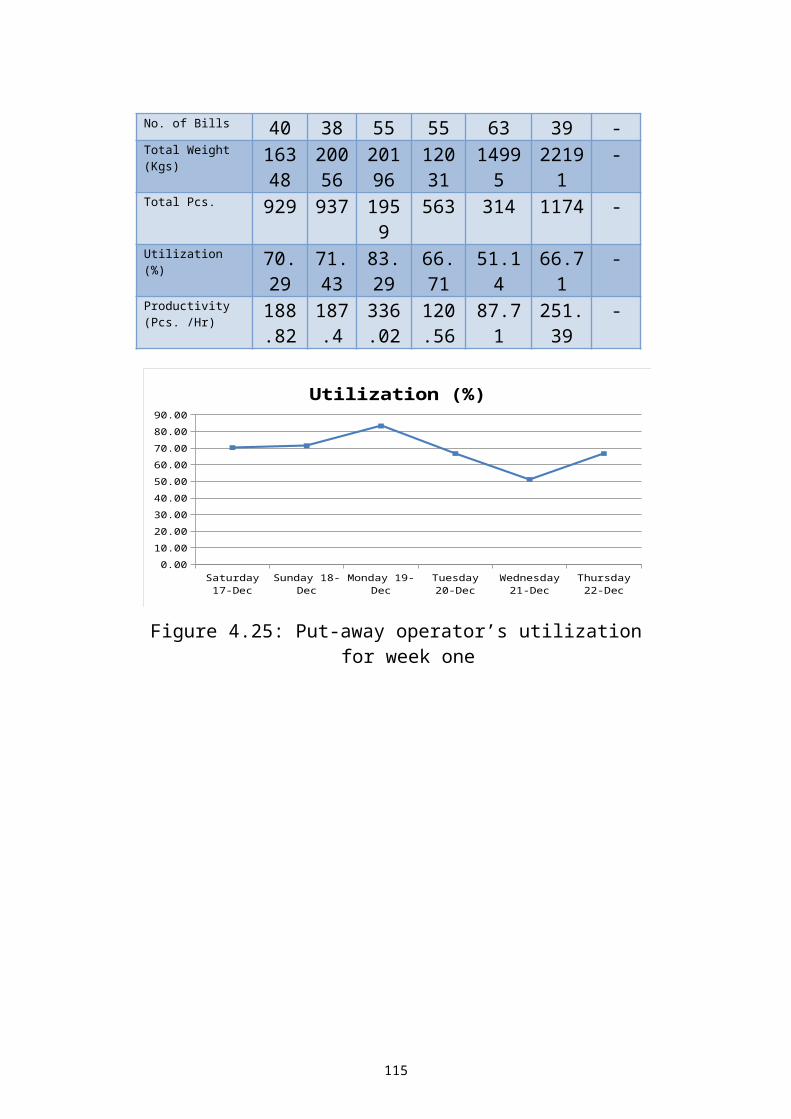
1. Knowledge based decision support system in the design and control of warehouse operations Chow, Ka Ho. ProQuest Dissertations and Theses; 2008; ProQuest Dissertations & Theses (PQDT).
2. Exploratory study of RFID applications for air cargo operations by Magalie Laniel, from
http://search.proquest.com/pqdtft/index
3. Pre-feasibility study 4: Amman air cargo hub IP0335 – May 2007, from
http://euromedaviation.org/fileadmin/download/InfrastructureTechnicalNotes/IP0335-RPT-TR- 41_PFS4_Amman_Air_Cargo_Hub_FINAL.pdf
4. Retrieved November 1st ,2011,from http://rj-cargo.com/tabid/64/Default.aspx
5. How to Manage Manpower | eHow.com fromhttp://www.ehow.com/how_12094019_calculate-manpower-
productivity.html
6. Colson, G. & Wakefield (2008). European Distribution Report 2008, available on-line at http://steconomice.uoradea.ro/anale/volume/2009/v4-management-and-marketing/50.pdf
7. Retrieved November 2nd, 2011, from http://www.oecd.org/dataoecd/59/29/2352458.pdf
8. Warehouse key performance indicators, August 27,2010 by Vijay Sangam, from
http://vijaysangamworld.wordpress.com/2010/08/27/warehouse-key-performance-indicators/
9. Retrieved November 2nd,2011, fromhttp://envplan.com/epa/fulltext/a38/a3852.pdf
10. Dangerous goods regulations, 2007, 48th edition, by IATA
11. OPERATIONS MANUAL PART A / GENERAL-BASIC, 2010, 1ST EDITION, BY RJ
12. Export Clearance Procedure at IGI Airport Delhi, posted May 4, 2011 3:12 AM by CS Gauta
13. Mr. Mohannad Awwad, Quality Control Manager, RJ air cargo warehouse, (Mar-Dec 2011).
115
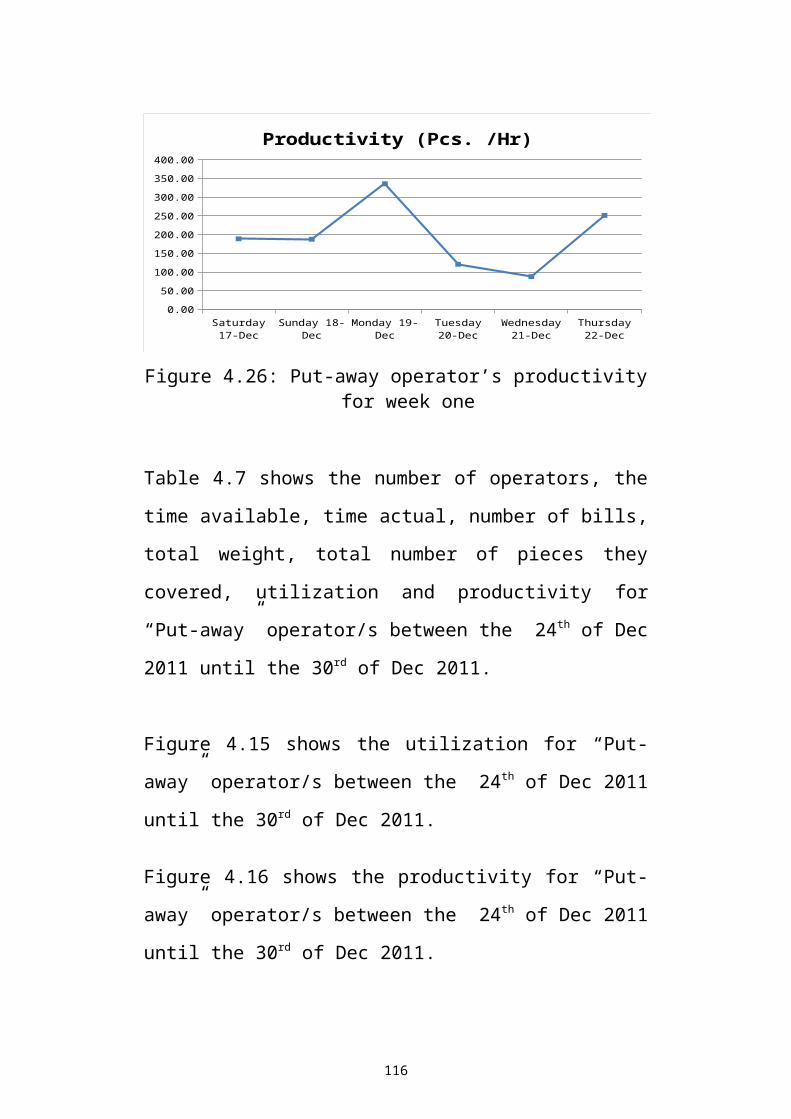
Appendix A
116
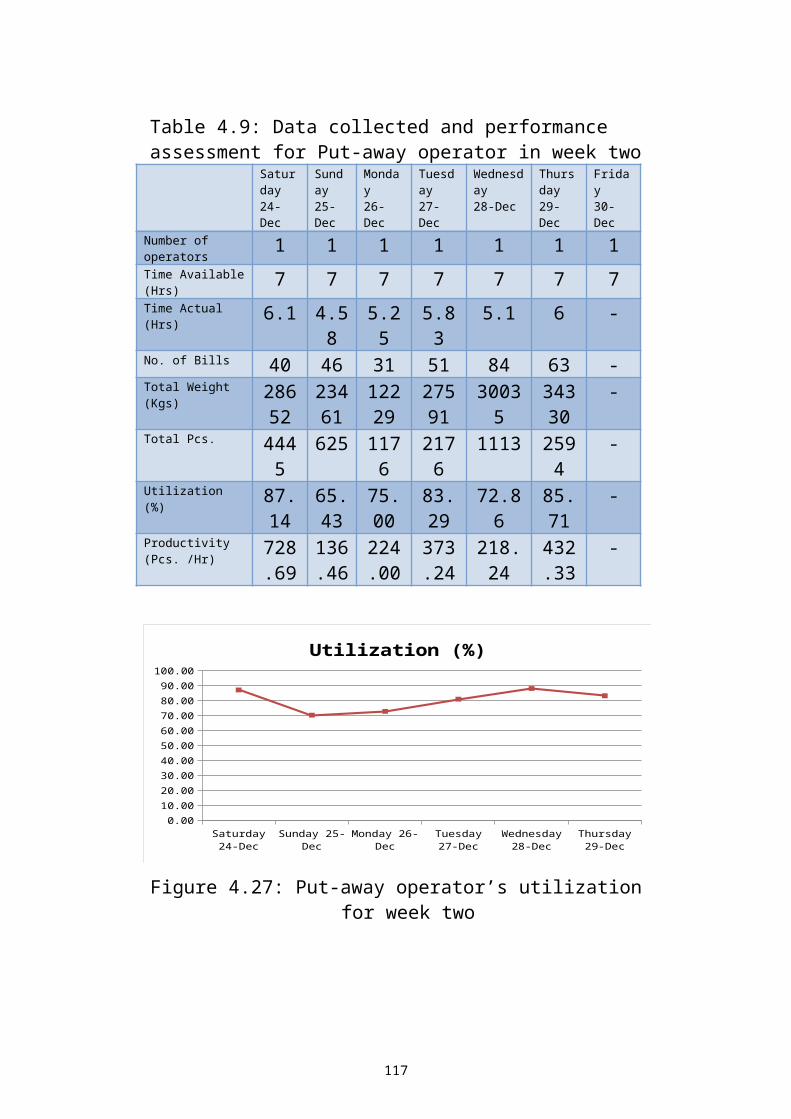
Figure A- 1: Export Good Weighting Form
117
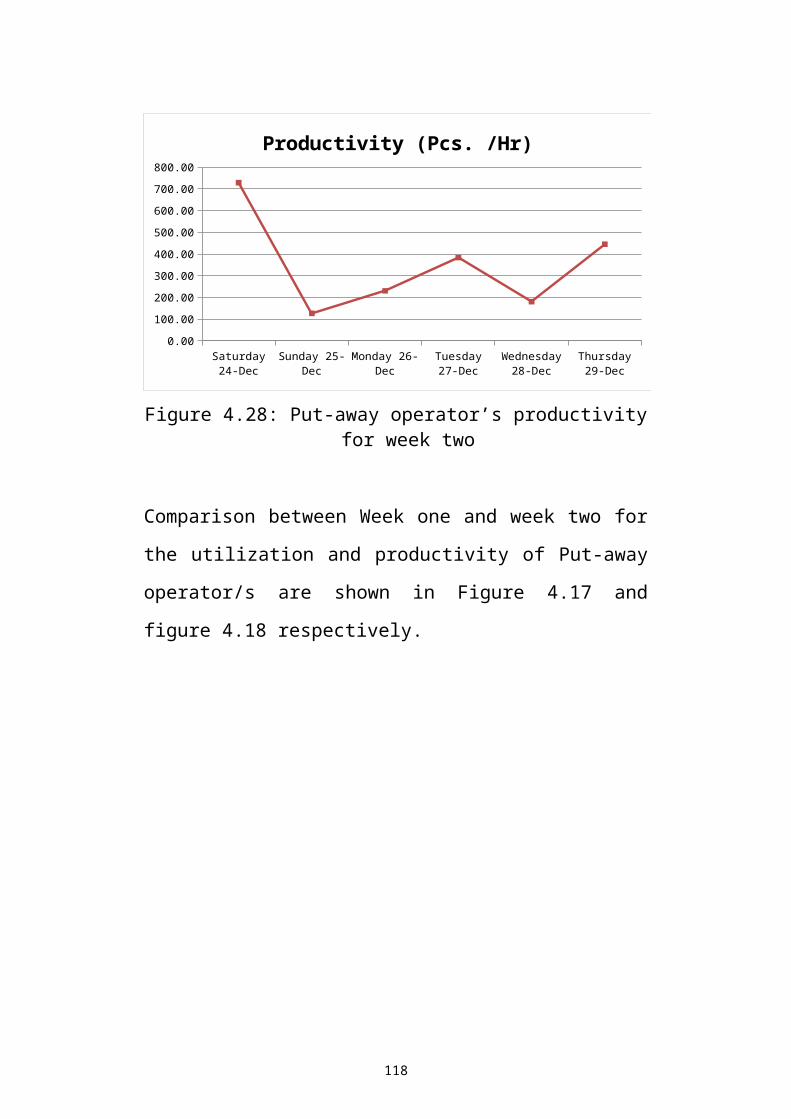
Figure A- 2: Flight Booking List
118
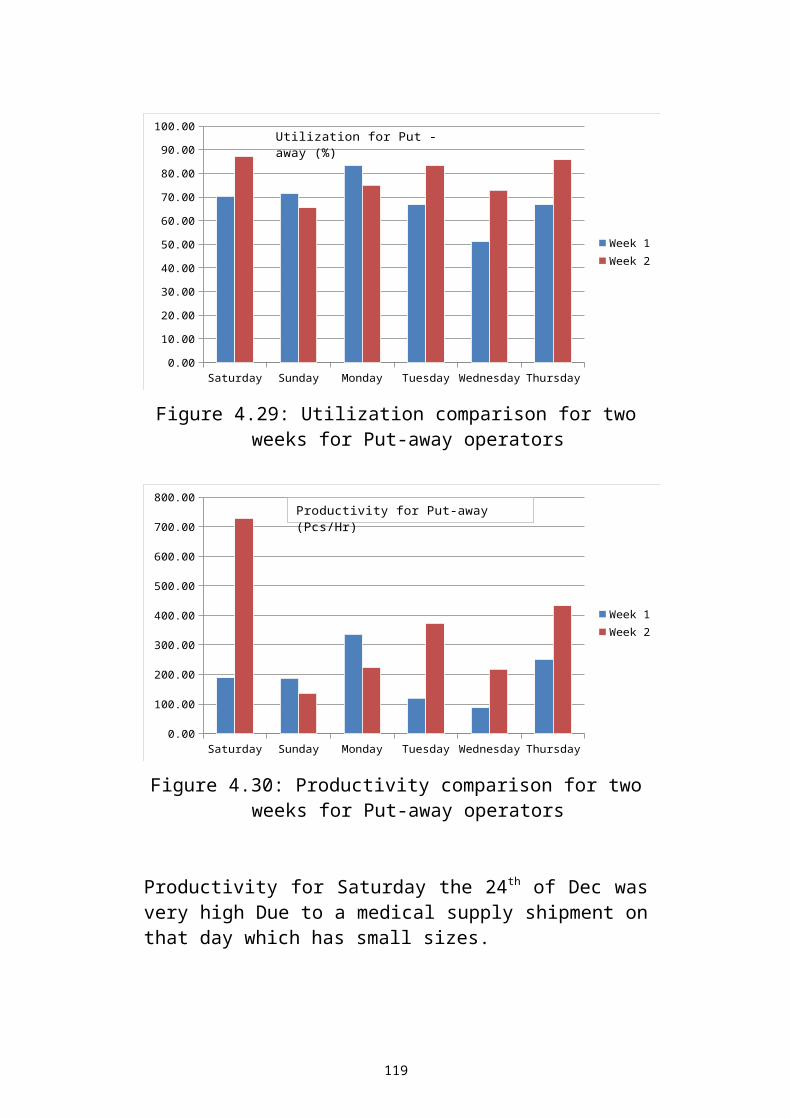
Figure A- 3: Instructions For Dispatching Of Goods Form
119
Figure A- 4: Shipment Discharging Form
120
Figure A- 5: Air Waybill Form
121
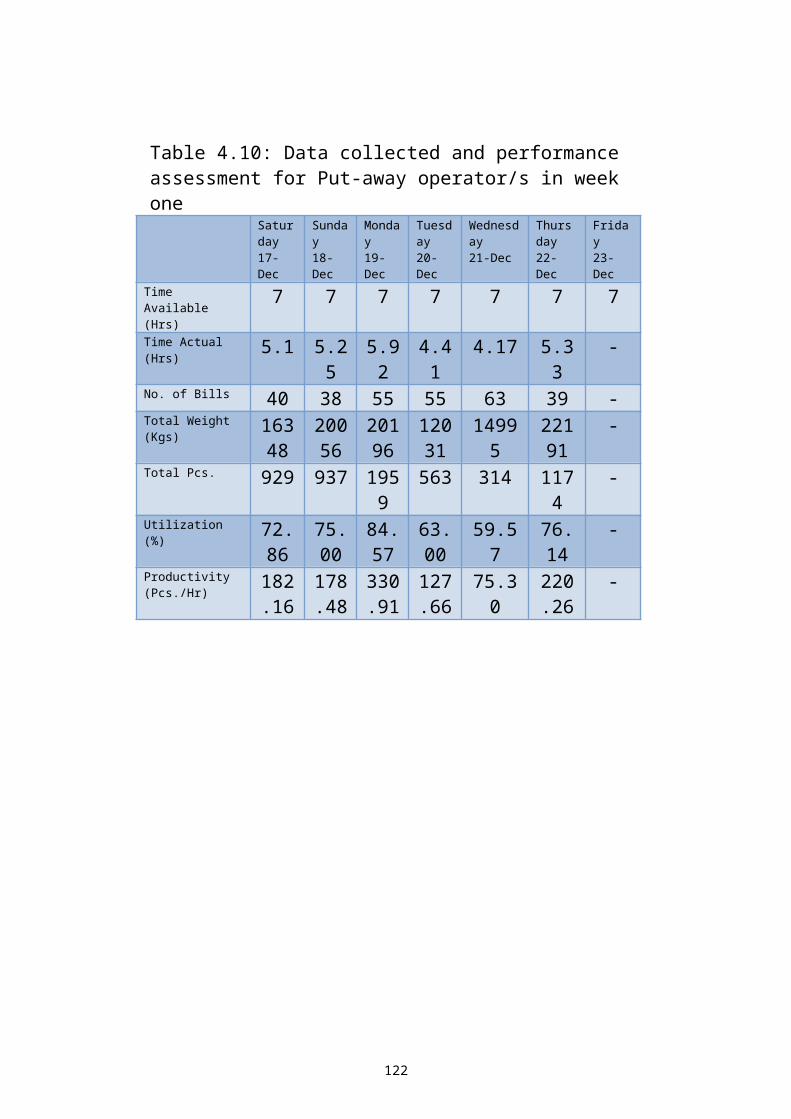
Figure A- 6: Activity Performance Inside Export Area Form
122
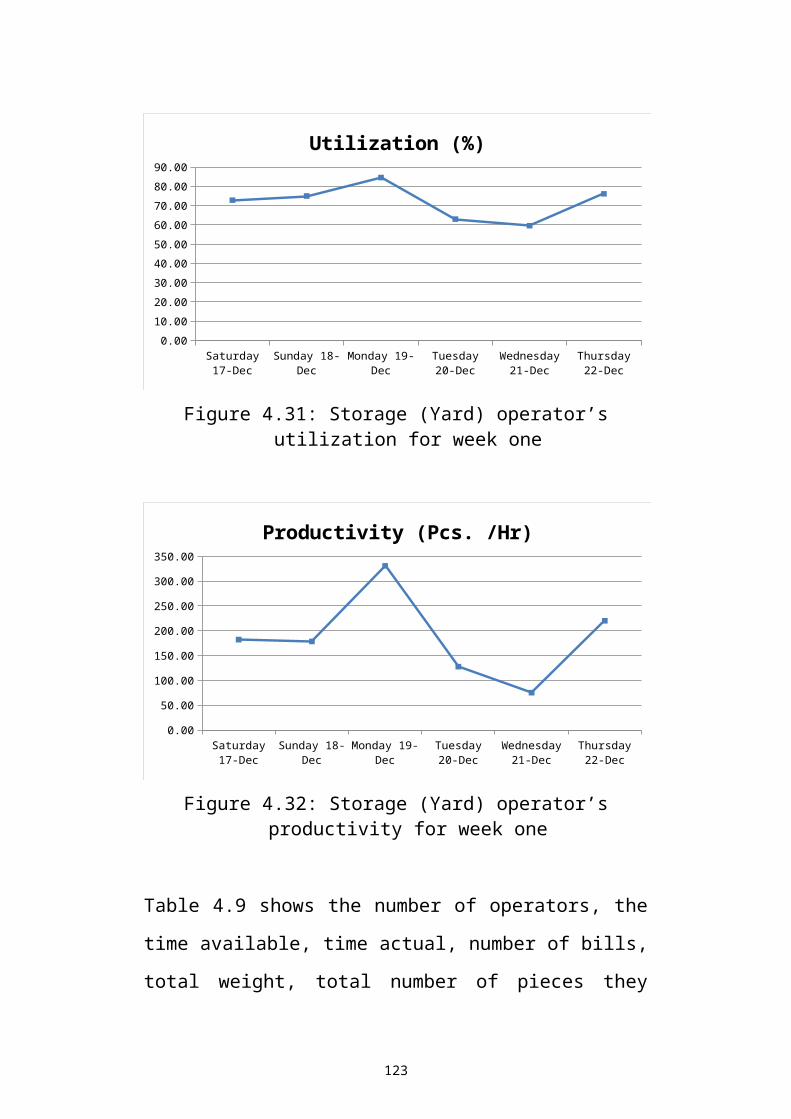
Figure A- 7: Study For Actual Time For Operators Form
123
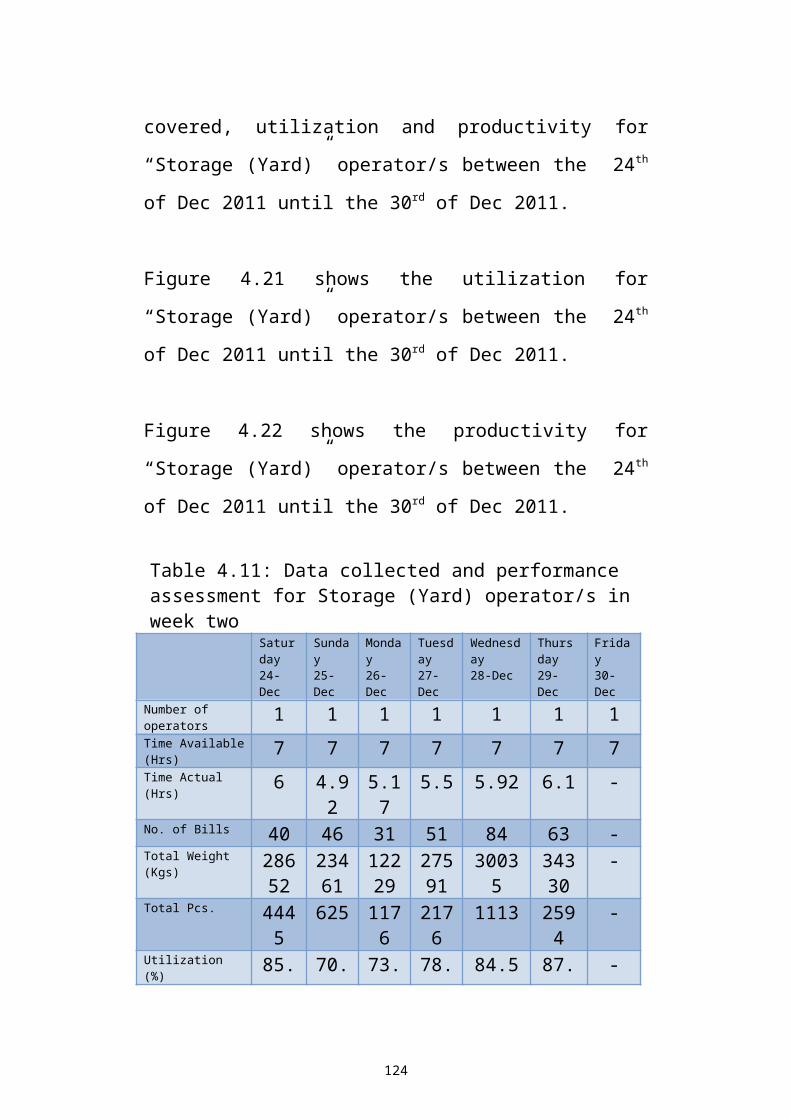
124
Recommended