Downward hydrocarbon migration predicted from numericalmodeling of fluid overpressure in the Paleozoic AnticostiBasin, eastern Canada
G. CHI1, D. LAVOIE2, R. BERTRAND3 AND M.-K. LEE4
1Department of Geology, University of Regina, Regina, SK, Canada; 2Geological Survey of Canada – Quebec Division,
Quebec, QC, Canada; 3INRS – ETE, Quebec, QC, Canada; 4Department of Geology, Auburn University, Auburn, AL, USA
ABSTRACT
The Anticosti Basin is a large Paleozoic basin in eastern Canada where potential source and reservoir rocks have
been identified but no economic hydrocarbon reservoirs have been found. Potential source rocks of the Upper
Ordovician Macasty Formation overlie carbonates of the Middle Ordovician Mingan Formation, which are under-
lain by dolostones of the Lower Ordovician Romaine Formation. These carbonates have been subjected to disso-
lution and dolomitization and are potential hydrocarbon reservoirs. Numerical simulations of fluid-overpressure
development related to sediment compaction and hydrocarbon generation were carried out to investigate
whether hydrocarbons generated in the Macasty Formation could migrate downward into the underlying Mingan
and Romaine formations. The modeling results indicate that, in the central part of the basin, maximum fluid over-
pressures developed above the Macasty Formation due to rapid sedimentation. This overpressured core dissipated
gradually with time, but the overpressure pattern (i.e. maximum overpressure above source rock) was maintained
during the generation of oil and gas. The downward impelling force associated with fluid-overpressure gradients
in the central part of the basin was stronger than the buoyancy force for oil, whereas the buoyancy force for gas
and for oil generated in the later stage of the basin is stronger than the overpressure-related force. Based on
these results, it is proposed that oil generated from the Macasty Formation in the central part of the basin first
moved downward into the Mingan and Romaine formations, and then migrated laterally up-dip toward the basin
margin, whereas gas throughout the basin and oil generated in the northern part of the basin generally moved
upward. Consequently, gas reservoirs are predicted to occur in the upper part of the basin, whereas oil reservoirs
are more likely to be found in the strata below the source rocks.
Key words: Anticosti basin, fluid overpressure, hydrocarbon generation, basinal fluid flow, hydrocarbon migration,
numerical modeling, downward fluid flow
Received 11 August 2009; accepted 26 January 2010
Corresponding author: Guoxiang Chi, Department of Geology, University of Regina, Regina, SK, Canada S4S 0A2.
Email: [email protected]. Tel: 1-306-585-4583. Fax: 1-306-585-5433.
Geofluids (2010) 10, 334–350
INTRODUCTION
The Anticosti Basin is a large (approximately 120 000
km2) Paleozoic sedimentary basin covering the northern
part of the Gulf of St. Lawrence, including Anticosti Island
(Fig. 1). The preserved succession of the basin consists of
Lower Ordovician to Lower Silurian carbonates. Studies by
Bertrand (1987, 1990, 1991) indicate that the shales of
the Upper Ordovician Macasty Formation contain >3.5%
total organic carbon (TOC) and have reached the oil
(northern part) and gas (southern part) windows. Source
rocks equivalent to the Macasty Formation are widespread
in other parts of the St. Lawrence Platform (Lavoie et al.
2009). Therefore, it is possible that organic-rich shales are
distributed over much of the Anticosti Basin, and large
amounts of hydrocarbons may have been generated.
Despite the hydrocarbon potential, limited exploration has
been carried out in the Anticosti Basin. To date, 13 holes
have been drilled on Anticosti Island, which corresponds
to one drill hole per 8645 km2 for the basin. Since the dis-
covery of the Port au Port oil field in neighboring western
Newfoundland in 1995 (Cooper et al. 2001), much
Geofluids (2010) 10, 334–350 doi: 10.1111/j.1468-8123.2010.00280.x
� 2010 Blackwell Publishing Ltd
attention has been paid to the Anticosti Basin, and a new
round of exploration is underway (Lavoie et al. 2009).
Dolostones of the Early Ordovician Romaine Formation
in the Anticosti Basin (Figs 1 and 2), a time and facies-
equivalent of the reservoir rock in the upper part of the St.
George Group in western Newfoundland (Azmy et al.
2008), show significant porosity and evidence of oil migra-
tion (Chi & Lavoie 2001; Lavoie et al. 2005). Dolostones
and dolomitized limestones of the Middle Ordovician Min-
gan Formation above the Romaine Formation have also
been shown to be locally porous, representing another
potential hydrocarbon reservoir unit (Lavoie et al. 2009).
Both the Romaine and Mingan formations were the targets
of recent exploration led by Shell Canada – Encal – Corri-
dor Resources – Hydro-Quebec Oil and Gas. The Romaine
and Mingan formations lie stratigraphically below the Mac-
asty Formation, and have not been thrusted or reverse-
faulted into positions above the source rock, although
some extensional faulting places the potential source and
reservoir rocks in local juxtaposition (Lynch & Trollope
2001). Therefore, the existence of hydrocarbon reservoirs
in the Romaine and Mingan formations depends on
whether hydrocarbons generated in the Macasty Formation
can migrate downward, in addition to suitable trapping
Mingan Islands
Anticosti Island
30 km
Romaine Fm.
Mingan Fm.
Macasty Fm. (unexposed)
Vauréal Fm.
Ellis Bay Fm.
Anticosti Gr.
64°
64°
63°
63°
62°
62°
50° 50°
49°
NACP
ARCO
LGCP
LGPLAnticosti Basin
a'
a
Newfoundland
Gulf of St. Lawrence
P.E.I.
Canadian Shield
Appalachian Orogen
St. Lawren
ce
Platform
}a
a′
Foreland Basins (O -S)2
Anticosti Basin
Passive Margin (C-O )1~
Lac St-Jean
St. Lawren
ce
Lowlands
(A)
(B)
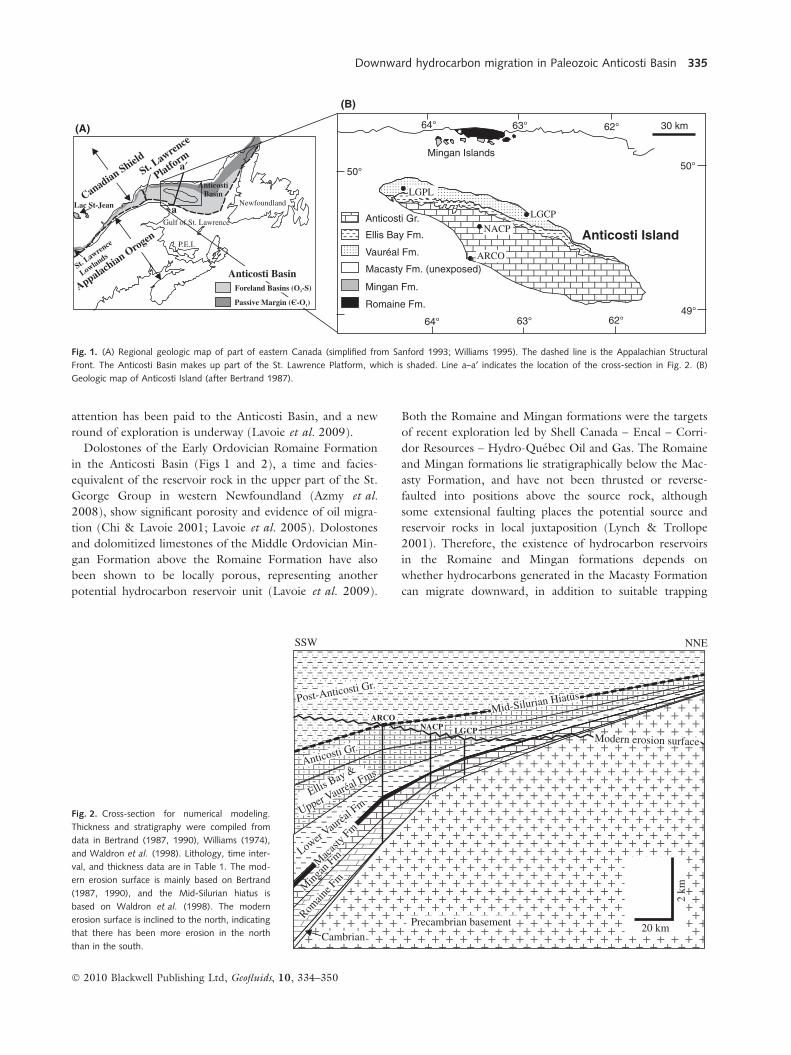
Fig. 1. (A) Regional geologic map of part of eastern Canada (simplified from Sanford 1993; Williams 1995). The dashed line is the Appalachian Structural
Front. The Anticosti Basin makes up part of the St. Lawrence Platform, which is shaded. Line a–a¢ indicates the location of the cross-section in Fig. 2. (B)
Geologic map of Anticosti Island (after Bertrand 1987).
Precambrian basement
Romain
e Fm
Ming
an F
m M
acas
ty Fm
Lower V au
réal F
mEllis
Bay &
Upper V auréal Fms
Anticosti Gr .
Post-Anticosti Gr .
Cambrian
2 km
20 km
Modern erosion surface
ARCO
LGCP NACP
SSW NNE
Mid-Silurian Hiatus
Fig. 2. Cross-section for numerical modeling.
Thickness and stratigraphy were compiled from
data in Bertrand (1987, 1990), Williams (1974),
and Waldron et al. (1998). Lithology, time inter-
val, and thickness data are in Table 1. The mod-
ern erosion surface is mainly based on Bertrand
(1987, 1990), and the Mid-Silurian hiatus is
based on Waldron et al. (1998). The modern
erosion surface is inclined to the north, indicating
that there has been more erosion in the north
than in the south.
Downward hydrocarbon migration in Paleozoic Anticosti Basin 335
� 2010 Blackwell Publishing Ltd, Geofluids, 10, 334–350

and sealing conditions. The direction of hydrocarbon migra-
tion depends on hydraulic potential (Hubbert 1940) or
fluid overpressure (a positive difference between actual fluid
pressure and hydrostatic pressure), in addition to buoyancy
and capillary forces (Hubbert 1953; Garven 1989; Bethke
et al. 1991). Therefore, it is important to know the distribu-
tion of fluid overpressure throughout the history of the
Anticosti Basin in order to evaluate the possibility of hydro-
carbons migrating downward from the Macasty Formation
to the Mingan and Romaine formations.
Fluid flow in sedimentary basins is typically driven by
fluid overpressures related to sediment compaction in the
sedimentation stage, and by topographic relief in the
uplifting stage (Garven 1989; Bethke et al. 1991),
whereas compression and thrusting can provide additional
forces near the structural front in foreland basins (Ge &
Garven 1992). In this study, we focus on modeling of
fluid overpressures in the sedimentary stage because much
of the primary migration of hydrocarbons from source
rocks to carrier beds may have taken place during this
stage. Topography-driven flow, which is important for
secondary migration or redistribution of hydrocarbons, is
not studied here. Fluid overpressure during sedimentation
is primarily caused by disequilibrium compaction, and by
hydrocarbon generation to a lesser extent (Swarbrick et al.
2002). Several studies suggest that hydrocarbon genera-
tion can be a major contribution to overpressure develop-
ment (Bredehoeft et al. 1994; Luo & Vasseur 1996; Lee
& Williams 2000; McPherson & Bredehoeft 2001;
Hansom & Lee 2005). We model the distribution of
fluid overpressure caused by disequilibrium compaction
and oil and gas generation in the Anticosti Basin based
on estimated thicknesses, lithologies, sedimentation dura-
tions, and TOC contents of different stratigraphic units
across the basin. This was performed by numerically solv-
ing the compaction, fluid flow, and heat transfer equa-
tions as described in Bethke (1985) and equations related
to the effect of hydrocarbon generation as modified from
Bredehoeft et al. (1994), Lee & Williams (2000) and
Hansom & Lee (2005). The possibility of downward
migration of hydrocarbons is evaluated based on the mag-
nitude of the buoyancy force (upward) and the vertical
impelling force related to downward gradient of overpres-
sure (Hubbert 1953).
GEOLOGIC SETTING
The Anticosti Basin is part of the St. Lawrence Platform
developed along the Paleozoic Laurentia continental mar-
gin (Sanford 1993). It consists of two sedimentary pack-
ages: a Cambrian to Lower Ordovician passive margin
succession and a Middle Ordovician to Lower Devonian
foreland basin succession (Waldron et al. 1998; Lavoie
2008). The transition from passive margin to foreland
basin is marked by an unconformity between the Lower
Ordovician Romaine Formation and the Middle Ordovi-
cian Mingan Formation (Desrochers & James 1988). This
unconformity is a continent-wide feature (Sauk–Tippeca-
noe sequences unconformity; Sloss 1963) and its develop-
ment was enhanced by migration of a tectonic peripheral
bulge that marks the onset of Iapetus subduction and the
Taconian Orogeny (Jacobi 1981; Knight et al. 1991).
The passive-margin succession unconformably overlies
the Precambrian basement, and comprises a thin veneer of
Cambrian (?) transgressive siliciclastic sediments followed
by Lower Ordovician Romaine Formation (Arenigian). A
thick succession of Cambrian sediments is widespread in
western Newfoundland and consists of siliciclastic – car-
bonate rocks of the Lower Cambrian Labrador Group and
carbonates of the Middle to Upper Cambrian Port au Port
Group (Waldron et al. 1998; Lavoie et al. in press). In the
northern part of the Anticosti Basin, Cambrian sediments
are absent and the Romaine Formation directly overlies the
basement, but Cambrian sediments are inferred to be pres-
ent south of Anticosti Island (Williams 1974). The
Romaine Formation is exposed on the northern edge of
the basin (Fig. 1B), and is encountered by drill holes on
Anticosti Island (Lavoie et al. 2009). The Romaine Forma-
tion is composed of dolostones and dolomitic limestones,
with minor sandstones and shales (Desrochers & James
1988).
The preserved foreland basin succession of the Antic-
osti Basin consists of (in ascending order) the Middle
Ordovician Mingan Formation, the Upper Ordovician
Macasty, Vaureal, and Ellis Bay formations, and the
Lower Silurian Anticosti Group (Lavoie et al. 2009). The
Mingan Formation (Darriwilian to Caradocian) consists
of limestones and dolomitic limestones, with minor shales
and sandstones. The Macasty Formation and the lower
part of the Vaureal Formation (late Caradocian to early
Ashgillian) are mainly composed of shales with minor
sandstones, whereas the upper part of the Vaureal For-
mation, the Ellis Bay Formation, and the Anticosti
Group (Ashgillian to Llandoverian) are composed of
limestones with minor shales and sandstones (Bertrand
1987; Sanford 1993).
Studies of organic matter maturation (Bertrand 1987,
1990) indicate that as much as 3.5 km of sediment was
deposited above the Anticosti Group and subsequently
eroded. Siliciclastic rocks of the Lower Devonian Clam
Bank and Red Island Road formations are preserved in
western Newfoundland (Burden et al. 2002; Quinn et al.
2004) and, from seismic correlation, the Clam Bank For-
mation is interpreted to be present southeast of Anticosti
Island (Sanford & Grant 1990). Waldron et al. (1998)
suggested that there was regional, tectonically driven
pre-Late Silurian erosion in the foreland basin, followed
by further sedimentation from latest Silurian to Early
336 G. CHI et al.
� 2010 Blackwell Publishing Ltd, Geofluids, 10, 334–350

Devonian. We infer that the eroded strata in the Anticosti
Basin were initially deposited from Late Silurian to Early
Devonian.
The Appalachian foreland basin was developed in
response to multiple tectonic events (Taconian, Acadian,
and Alleghanian) in the Appalachian Orogen (Quinlan &
Beaumont 1984). The foreland basin sedimentation in the
Anticosti Basin was largely the result of the Taconian
Orogeny (late Darriwilian to early Ashgillian) to the south
(Malo 2004; Lavoie 2008). The first thrusting event may
have taken place in late Darriwilian to early Caradocian,
resulting in formation of tectonic highlands in the Gaspe
and the initial foreland basin sedimentation of the Mingan
Formation (Malo 2004). Rapid sea-level rise combined
with continued foreland subsidence during the late Cara-
docian led to deposition of the Macasty Formation in the
sediment-starved Anticosti Basin (Malo 2004). Renewed
thrusting in the Ashgill resulted in rapid deposition, fol-
lowed by slow sedimentation in the Llandovery (Malo
2004; Long 2007). After a prolonged period of uplifting
and erosion in the Anticosti Basin, sedimentation may have
resumed from Late Silurian to Early Devonian, in response
to the Acadian Orogeny (Lochkovian to Givetian) (Wal-
dron et al. 1998; Burden et al. 2002; Quinn et al. 2004);
much of these sediments subsequently eroded after the
Acadian Orogeny.
As part of the St. Lawrence Platform, the strata in the
Anticosti Basin have not experienced significant tectonic
deformation. They strike northwest and dip gently to the
southwest (Fig. 1B), with no evidence of folding (Caston-
guay et al. 2005). Seismic profiles indicate a series of
northwest-trending high-angle faults with a downthrown
southwest block (Lynch & Trollope 2001; Lynch & Grist
2002). These faults primarily affected the lower part of the
succession including the Romaine, Mingan, and Macasty
formations and to some extent the base of the Vaureal
Formation (Lavoie et al. 2009).
PHYSICAL MODEL AND CALCULATIONMETHODS
A model cross-section of the Anticosti Basin (Fig. 2) was
constructed based on the stratigraphic data compiled by
Bertrand (1987). The location of the section is shown by
line a-a’ in Fig. 1A. The southern end of the section corre-
sponds to the Appalachian structural front (dashed line in
Fig. 1A), and the northern end is located north of the ero-
sional edge of the basin. The strata located south of the
Appalachian structural front belong to the Appalachian
Orogen and are not included in the model.
The model comprises eight hydrostratigraphic units: (1)
the Cambrian transgressive veneer, (2) the Romaine For-
mation, (3) the Mingan Formation, (4) the Macasty For-
mation, (5) the lower part of the Vaureal Formation, (6)
the upper part of the Vaureal Formation and the Ellis Bay
Formation, (7) the Anticosti Group, and (8) Upper Silu-
rian to Lower Devonian sediments that have been eroded.
The lithology, duration, TOC, and thickness data are in
Table 1. The thickness data in Table 1 are multiplied by a
decompaction factor to get initial thickness values before
compaction. The decompaction factors for individual
hydrostratigraphic units were determined by trail-and-error
to achieve the postcompaction thicknesses in Table 1. The
lithologic composition of the different hydrostratigraphic
units is represented by different combinations of sand-
stone, shale, and platform carbonates. No lateral changes
in lithology are invoked due to lack of data. Thicknesses
are controlled by three drill holes (ARCO, NACP, and
LGCP), and are extrapolated from isopach maps compiled
by Bertrand (1987). The TOC of 5.4% for the Macasty
Formation (Table 1) represents the value before matura-
tion, which was extrapolated from the data of Bertrand
(1991). The modern erosion surface (Fig. 2) indicates that
much of the northern part of the basin was removed by
erosion.
Table 1 Lithology, time interval, TOC, and thickness (m) of hydrostratigraphic units.
Unit Lithology
Time interval
(Ma)
TOC
(%)
Thickness (m)
Basin
center ARCO NACP LGCP
North coast of
St Lawrence Rv
Basin
margin
Post-Anticosti 50% sd + 50% sh 424.0 to 386.0 0.2 3286 2410 2249 2080 1632 800
Hiatus 428.0 to 424.0
Anticosti Gr 5% sd + 5% sh + 90% lms 439.0 to 428.0 0.1 1098 806 707 598 403 200
Ellis Bay Fm + Upper
Vaureal Fm
5% sd + 5% sh + 90% lms 441.1 to 439.0 0.1 1600 822 547 397 290 140
Lower Vaureal Fm 5% sd + 5% lms + 90% sh 443.1 to 441.1 0.3 1500 706 485 364 273 130
Macasty Fm 100% sh 449.7 to 443.1 5.4 180 173 28 42 30 15
Mingan Fm 10% sh + 90% lms 468.6 to 449.7 0.2 620 559 340 336 254 60
Romaine Fm 100% lms 493.0 to 468.6 0.1 1127 783 384 233 64 10
Cambrian 100% sd 510.0 to 493.0 0.0 200 0 0 0 0 0
sd, sandstone; sh, shale; lms, limestone; TOC, total organic carbon.
Downward hydrocarbon migration in Paleozoic Anticosti Basin 337
� 2010 Blackwell Publishing Ltd, Geofluids, 10, 334–350
The total length of the section is 220 km. The model
section is divided into 20 evenly distributed columns. The
left boundary (south, basin center) is considered a plane of
symmetry; no fluid flow or heat transfer occurs across this
boundary. The right boundary (north, basin edge) is open
to fluid flow. The bottom boundary is closed to fluid flow
and subject to a heat flux of 56.3 mW m)2 based on a
thermal gradient of 26�C km)1 derived from organic mat-
ter maturation studies (Bertrand 1987, 1990). The upper
boundary is open to flow, and has a fixed temperature of
20�C based on interpretation that much of the sedimentary
succession in the Anticosti Basin was deposited in tropical
conditions (Long 2007).
Numerical modeling was carried out to simulate fluid
flow and overpressure evolution using the physical model
described above. Calculations were made (i) considering
only the effect of disequilibrium compaction and heating
on fluid overpressure development and (ii) taking into
account the additional effect of oil and gas generation.
The thermal expansion coefficient, compressibility coeffi-
cient, heat capacity and heat conductivity of fluid and the
density, heat capacity and heat conductivity of solid matrix
are assumed to be constants (Table 2), adopted from Beth-
ke (1985) and Garven (1985) and summarized in Chi &
Savard (1998). Fluid density and viscosity are calculated
from fluid temperatures using the relationships in Bethke
(1985) and Bethke et al. (1993). Rock porosity (u) is
related to effective depth (ze) as described in Bethke
(1985):
/ ¼ /0e�ze b þ /1; ð1Þ
where u0 is the porosity at deposition, u1 is the irreducible
porosity, and b is an empirical parameter (Table 3). Perme-
ability (k) is related to porosity by
log kx ¼ A/þ B; ð2Þ
where kx is horizontal permeability and A and B are lithol-
ogy-dependent constants (Table 3). Vertical permeability
(kz) is calculated from horizontal permeability with the
ratio being a lithology-dependent constant (Table 3).
The porosity-depth and porosity-permeability relationship
parameters are adopted from Harrison & Summa (1991)
for sandstone and shale, and from Kaufman (1994) for
limestone (Table 3), as summarized in Chi & Savard
(1998). Sensitivity studies were carried out by varying
these parameters. The vertical and horizontal permeabilities
of the rocks are calculated as the harmonic and geometric
means of the lithologic components respectively.
The governing equations and numerical procedures are
similar to those in previous studies (Bethke 1985; Bethke
et al. 1993; Chi & Savard 1998; Lee & Williams 2000;
Chi 2001; Hansom & Lee 2005) and are not described
here. However, calculation of the effect of hydrocarbon
generation on overpressure development, and of the frac-
tions of oil and gas generated, requires some elaborations
in addition to those by Lee & Williams (2000) and Han-
som & Lee (2005). The flow equation used in the numeri-
cal modeling, derived from the general governing equation
of Bethke (1985) and with consideration of the effect of
oil and gas generation (Hansom & Lee 2005), is:
Vb/bþ Vb
ð1� /Þ bð/� /hÞ 1
ðqsm � qÞ
� �owot� 1
q
o
ox
qkxDz
lowox
� �Dx þ o
oz
qkzDx
lowoz
� �Dz
� �
¼ �V bVzm /qbþ 1
ð1� /Þ bð/� /hÞ� �
þ /VbaoT
otþ qo þ qg; ð3Þ
where Vb is the volume of a finite difference block, / is
the porosity, /h is the porosity in the intermediate time
step, b is the coefficient of compressibility of pore fluid, b
is a coefficient related to porosity decrease with depth, qsm
is density of fluid-saturated medium, q is the density of
fluid, w is the fluid overpressure, t is the time, x is the hor-
izontal coordinate, z is the vertical coordinate, kx is the
horizontal permeability, kz is the vertical permeability, l is
the fluid dynamic viscosity, Dx and Dz are the horizontal
and vertical size of the finite difference block, Vzm is the
settling velocity of a block, a is the coefficient of thermal
expansion of the pore fluid, T is temperature, and qo and
qg are source terms for oil and gas generation respectively.
This equation is solved, together with the compaction
equation and the heat transfer equation, for overpressure
Table 2 Rock and fluid properties used in the modeling.
Property Value Unit Reference
Fluid
Thermal expansion coefficient a = 5000 per �C (1)
Compressibility coefficient b = 4.3E-10 m s)2 kg)1 or Pa)1 (1)
Heat capacity Cf = 4200 J kg)1 per �C (1)
Heat conductivity Kf = 0.63 W m)1 per �C (2)
Solid matrix
Density qr = 2700 kg m)3 (1)
Heat capacity Cr = 840 J kg)1 per �C (1)
Heat conductivity Kr = 2.5 W m)1 per �C (2)
References: (1) Bethke (1985); (2) Garven (1985).
Table 3 Constants related to porosity and permeability calculations.
Lithology u0 u1 b (km)1) A* B* kx ⁄ kz Reference
Sandstone 0.40 0.10 0.50 15 )3 2.5 (1)
Shale 0.55 0.05 0.85 8 )8 10 (1)
Limestone 0.40 0.05 0.55 6 )4 2.5 (2)
References: (1) Harrison & Summa (1991); (2) Kaufman (1994).*Permeability calculated from A and B is in darcies (1 dar-cy = 9.869233 · 10)13 m2).
338 G. CHI et al.
� 2010 Blackwell Publishing Ltd, Geofluids, 10, 334–350

(w), temperature (T), and porosity (/). The values of qo
and qg are related to density changes from kerogen to oil
and from oil to gas as follows:
qo ¼gdXo
dt
qk
qo
� 1
� �XkVb; ð4Þ
qg ¼dXg
dt
qo
qg
� 1
!XkXoVb; ð5Þ
where Xo and Xg are fractions of oil and gas generated
(out of the total capacity for oil and gas generation respec-
tively); t is the time; qk, qo, and qg are the density of kero-
gen, oil, and gas respectively; Xk is the volume fraction of
kerogen in sedimentary rocks; and Vb is the volume of the
finite difference block. In this study, the density of kerogen
was assumed to be 1.45 g cm)3 (Lee & Williams 2000),
the density of oil was assumed to be 0.9 g cm)3 (Speight
2006), and the density of gas depends on temperature and
pressure and was calculated from an equation of state of
Duan et al. (1992), following Hansom & Lee (2005). The
volume fractions of kerogen were calculated from the TOC
wt% values. The kerogens of the Macasty Formation
belong to type II (Bertrand 1991), which may contain 68
to 74 wt% C (Bordenave 1993). Assuming an average of
71 wt% C in the kerogens and a density of 1.45 g cm)3
and 2.5 g cm)3 for the kerogens and rocks respectively, Xk
can be calculated from TOC as follows:
Xk ¼3:52TOC=100
1:45þ 1:48TOC=100: ð6Þ
The Xo and Xg values are related to the kinetics of kero-
gen-to-oil and oil-to-gas conversion. Because oil and gas
generation are considered as first-order reactions, the
change of kerogen fraction (V) with time (t) can be
expressed as follows (Bredehoeft et al. 1994):
dV
dt¼ �kV ð7Þ
or
dV
V¼ �kdt ; ð8Þ
where k is the rate of oil or gas generation, which can be
calculated according to the Arrhenius model:
k ¼ Ae�E=RTk ð9Þ
where A is the pre-exponential factor (h)1), E is the acti-
vation energy (KJ mol)1), R is the gas constant
(8.31432 J K)1 mol)1), and Tk is the absolute temperature
(K). In the numerical model, the value of k for a given
time step can be considered as constant, therefore, integra-
tion of Eq. (8) over a time step gives:
lnV
V p¼ �kDt ð10Þ
or
V ¼ V pe�kDt ; ð11Þ
where Vp is the V value of the previous time step. The
fraction of oil or gas generated (X) is complementary to V
(the remaining fraction of oil or gas) (i.e. X = 1 ) V),
therefore we have:
X ¼ 1� ð1�X pÞe�kDt ; ð12Þ
where X p is the X value in the previous time step. Both
Xo and Xg are calculated in the same way, although they
have different k values.
The timing and rate of hydrocarbon generation are con-
trolled by the pre-exponential factor A and the activation
energy E in the Arrhenius equation, which differ signifi-
cantly for different types of kerogens (Peters et al. 2006).
For type II kerogens in marine siliciclastic rocks like the
Macasty Formation (Bertrand 1991), an Ao value of
8.14 · 1013 ⁄ s or 2.92 · 1017 h)1 and an Eo value of
215.2 kJ mol)1 are adopted from Pepper & Corvi (1995)
(Table 4). Ag and Eg values for oil-to-gas cracking are set
to be 3.6 · 1016 h)1 and 230 kJ mol)1 respectively, based
on data for intra-source oil cracking as summarized in Pep-
per & Dodd (1995) (Table 4). Sensitivity studies were car-
ried out by varying the kinetic parameters.
The program used for the numerical modeling was first
written in FORTRAN by Chi & Savard (1998) and then
modified and written in C++ by Chi (2001). Further modi-
fications were made in the course of the present study to
account for the effect of hydrocarbon generation on over-
pressure development as described earlier. The program is
similar to Basin2TM (Bethke et al. 1993) for overpressure
calculation; the latter has many other functions but does
not include hydrocarbon generation in its current released
version. Modeling results obtained with our program with-
out hydrocarbon generation are similar to those obtained
with Basin2TM.
Table 4 Hydrocarbon properties and kinetic parameters used in the model-
ing.
Parameter Value Unit Reference
Kerogen density 1450 kg m)3 (1)
Oil density 900 kg m)3 (2)
Kerogen (type-II)-to-oil conversion
Ao 2.92 · 1017 h)1 (3)
Eo 215.2 kJ mol)1 (3)
Oil-to-gas conversion
Ag 3.6 · 1016 h)1 (4)
Eg 230 kJ mol)1 (4)
References: (1) Lee & Williams (2000); (2) Speight (2006); (3) Pepper &Corvi (1995); (4) Pepper & Dodd (1995).
Downward hydrocarbon migration in Paleozoic Anticosti Basin 339
� 2010 Blackwell Publishing Ltd, Geofluids, 10, 334–350
SIMULATION RESULTS
Overpressures caused by disequilibrium compaction
Modeling of fluid flow without hydrocarbon generation
was carried out by assigning 0% TOC to all hydrogeologic
units. The simulation results indicate that significant fluid
overpressures caused by disequilibrium compaction devel-
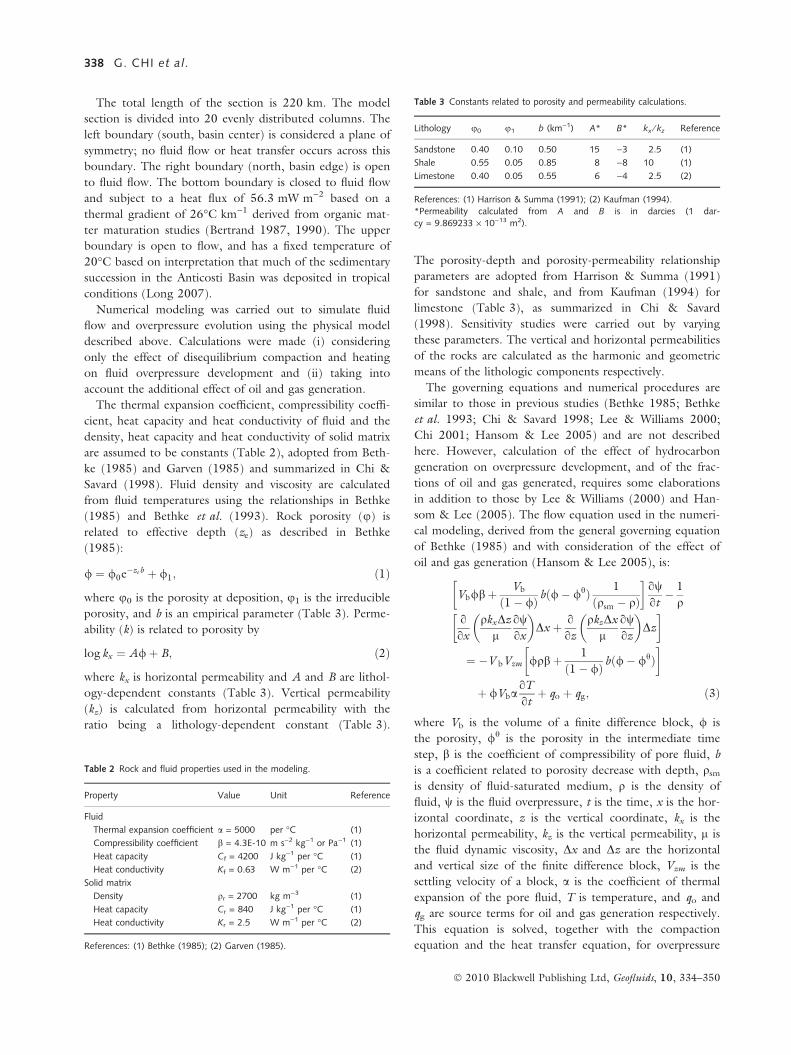
oped during certain stages of basin evolution (Fig. 3). The
overpressure values were highest in the basin center in the
lower part of the Vaureal Formation, and decreased
upward, downward, and laterally toward the basin margin
(Fig. 3).
The evolution of fluid overpressures in different strata at
different times and different locations in the basin is high-
lighted in Figs 3 and 4. At the basin center (Figs 3 and
4A), fluid pressures were close to hydrostatic values from
Cambrian to the end of deposition of the Mingan Forma-
tion (449.7 Ma); fluid overpressures gradually increased
during deposition of the Macasty, Vaureal, and Ellis Bay
formations and reached maximum values at the end of the
Ellis Bay Formation (439 Ma), when sedimentation rate
End of Mingan Fm 449.7 Ma
2.1E-2
2.5E-3
Romaine
Mingan
End of Anticosti Gr 428 Ma
19.2
13.4
7.7
1.9
Romaine Mingan
U V auréal + Ellis Bay
Anticosti
End of sedimentation 386 Ma
10.8
4.3
1.1
7.6
20 km
2 km
Romaine Mingan L V auréal
U V auréal + Ellis BayAnticosti
Post-Anticosti
Macasty
End of lower Vauréal Fm441.1 Ma
45.2 31.7
18.1 4.5
Romaine
Mingan
L V auréalMacasty
End of Ellis Bay Fm 439 Ma
132.0 92.4
52.8
13.2
Romaine Mingan
U V auréal + Ellis Bay Macasty
Fig. 3. Calculated fluid overpressures (bars)
resulting from sediment compaction in the
Anticosti Basin at the end Mingan Formation
(449.7 Ma), lower Vaureal Formation (441.1 Ma),
Ellis Bay Formation (439 Ma), Anticosti Group
(428 Ma), and post-Anticosti Group (386 Ma)
sedimentation.
340 G. CHI et al.
� 2010 Blackwell Publishing Ltd, Geofluids, 10, 334–350

was the highest. A strongly overpressured core developed
above the Macasty Formation (Fig. 3), which continued to
be present during sedimentation of the Anticosti Group,
although overpressure values gradually decreased. By the
end of sedimentation in the basin (386 Ma), only minor
amounts of overpressure remained. In shallower parts of
the basin, in contrast, fluid pressures remained close to
hydrostatic values throughout basin history, except during
–10 000
–9000
–8000
–7000
–6000
–5000
–4000
–3000
–2000
–1000
0 0 500 1000 1500 2000 2500
–10 000
–9000
–8000
–7000
–6000
–5000
–4000
–3000
–2000
–1000
0 0 500 1000 1500 2000 2500
–10 000
–9000
–8000
–7000
–6000
–5000
–4000
–3000
–2000
–1000
0 0 500 1000 1500 2000 2500
–10 000
–9000
–8000
–7000
–6000
–5000
–4000
–3000
–2000
–1000
0 0 500 1000 1500 2000
–10 000
–9000
–8000
–7000
–6000
–5000
–4000
–3000
–2000
–1000
0 0 500 1000
Mingan
Rom.
L V auréal
L V auréal
L V auréal
L V auréal
Mingan
Mingan
Mingan
Mingan
Romaine
Romaine
Romaine
Romaine
U V auréal& Ellis Bay
U V auréal& Ellis Bay
U V auréal& Ellis Bay
Anticosti Gr
Anticosti Gr
Macasty
Macasty
Macasty
Post-Anticosti Group
Macasty
Lithostatic pressure
Hydrostatic pressure
450 Ma 441 Ma 439 Ma 428 Ma 386 Ma
–4500
–4000
–3500
–3000
–2500
–2000
–1500
–1000
–500
0 0 200 400 600 800 1000 1200
–4500
–4000
–3500
–3000
–2500
–2000
–1500
–1000
–500
0 0 200 400 600 800 1000 1200
–4500
–4000
–3500
–3000
–2500
–2000
–1500
–1000
–500
0 0 200 400 600 800 1000 1200
–4500
–4000
–3500
–3000
–2500
–2000
–1500
–1000
–500
0 0 200 400 600 800 1000
–4500
–4000
–3500
–3000
–2500
–2000
–1500
–1000
–500
0 0 200 400 600
450 Ma 441 Ma 439 Ma 428 Ma 386 Ma
Hydrostatic pressure
Lithostatic pressure
Pressure (bars)
Dep
th (
m)
Pressure (bars)
Dep
th (
m)
(A) Depth – pressure profiles at the basin center
(B) Depth – pressure profiles in the middle of the section
Mingan
Rom.
L V auréal
L V auréal
L V auréal
Mingan
Mingan
Mingan
Mingan
Romaine
Romaine
Romaine
Romaine
U V auréal& Ellis Bay
U V auréal& Ellis Bay
Anticosti Gr
Anticosti Gr
Post-Anticosti GroupMacasty
L V auréal
Macasty U V auréal& Ellis Bay
Macasty
Macasty
Fig. 4. Calculated pressure–depth profiles in different stages of the basin evolution for the compaction-only model: (A) at the basin center, and (B) at the
middle of the section (99 km from basin center). The hydrostatic and lithostatic lines were constructed based on constant fluid and solid densities of 1 and
2.5 g cm)3 respectively.
Downward hydrocarbon migration in Paleozoic Anticosti Basin 341
� 2010 Blackwell Publishing Ltd, Geofluids, 10, 334–350

deposition of the Vaureal and Ellis Bay formations
(Fig. 4B).
Overpressures related to hydrocarbon generation
Simulations of fluid overpressure based on petroleum gen-
eration plus disequilibrium compaction produced almost
identical results as the compaction-only models for the per-
iod of time from Cambrian to the end of the Ellis Bay For-
mation, as illustrated by fluid overpressure in the Macasty
Formation at the basin center (Fig. 5). This is consistent
with the timing of hydrocarbon generation, as significant
oil generation did not start until the beginning of the
Anticosti Group (Fig. 5A). After this point, fluid overpres-
sure is slightly higher than in the case of no hydrocarbon
generation (Fig. 5B). Fluid overpressure started to increase
after 424 Ma (Fig. 5B), which coincides with the start of
gas generation (Fig. 5A), peaked at 412 Ma, and then
decreased with time again (Fig. 5B). The calculations have
not taken into account the effect of relative permeability
decrease (due to presence of hydrocarbon phases) on fluid
overpressure, and therefore the results should be inter-
preted as the minimum effect of hydrocarbon generation
on fluid overpressure.
At the end of Anticosti Group sedimentation (428 Ma),
the Macasty Formation in the central part of the basin was
at the end of the oil window (Fig. 5). Fluid overpressures
were slightly higher than in the compaction-only model,
and the overpressure distribution almost identical (compare
460
(A)
(B)
450 440 430 420 410 400 390 380
460 450 440 430 420 410 400 390 380
0
0.2
0.4
0.6
0.8
1
0
20
40
60
80
100
Hyd
roca
rbo
n g
ener
ated
(fr
acti
on
) O
verp
ress
ure
(b
ars)
T ime (Ma)
T ime (Ma)
Upper V auréal+ Ellis Bay Fm
Pos
t-A
ntic
osti
Gro
up
Hia
tus
Ant
icos
ti G
roup
Low
er V
auré
al F
m
Upper V auréal+ Ellis Bay Fm
Pos
t-A
ntic
osti
Gro
up
Hia
tus
Ant
icos
ti G
roup
Low
er V
auré
al F
m
Oil:
Ao
= 2.
92E
17; E
o =
215.
2
Gas
: Ag
= 3.
6E16
; Eg
= 23
0
With oil and gas generation
Without oil and gas generation
Fig. 5. Calculated evolution of oil and gas generation and overpressure in
the Macasty Formation at the basin center. (A) Fraction of oil and gas gen-
erated; (B) Fluid overpressure, with and without hydrocarbon generation.
End of sedimentation 386 Ma
End of Anticosti Gr 428 Ma
Fluid overpressure (bars)
20 km
2 km
18.6
1.9
7.4
13.0
Romaine Mingan
Anticosti
Post-Anticosti
U Vauréal + Ellis Bay
Macasty L V auréal
Romaine
Mingan
U V auréal + Ellis Bay
Anticosti
21.9
15.4
8.8
2.2
Fig. 6. Calculated fluid overpressures at the end
of Anticosti Group (428 Ma) and basin sedimen-
tation (380 Ma), with both disequilibrium com-
paction and hydrocarbon generation considered
in overpressure calculation.
342 G. CHI et al.
� 2010 Blackwell Publishing Ltd, Geofluids, 10, 334–350
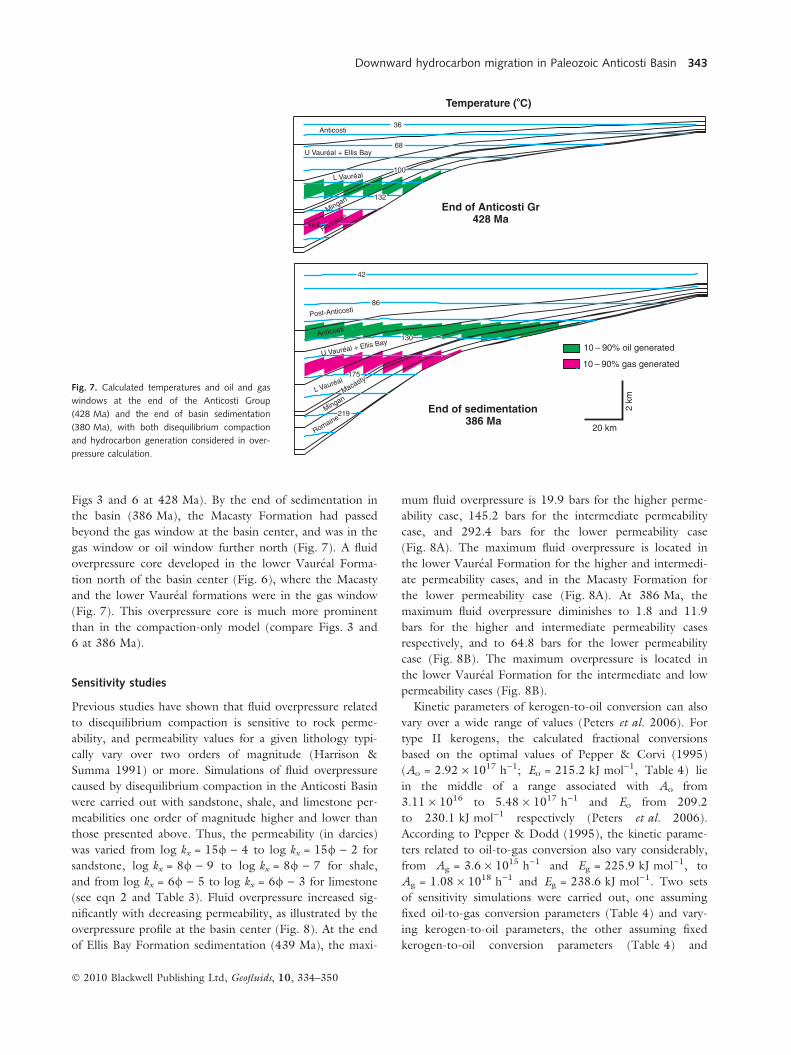
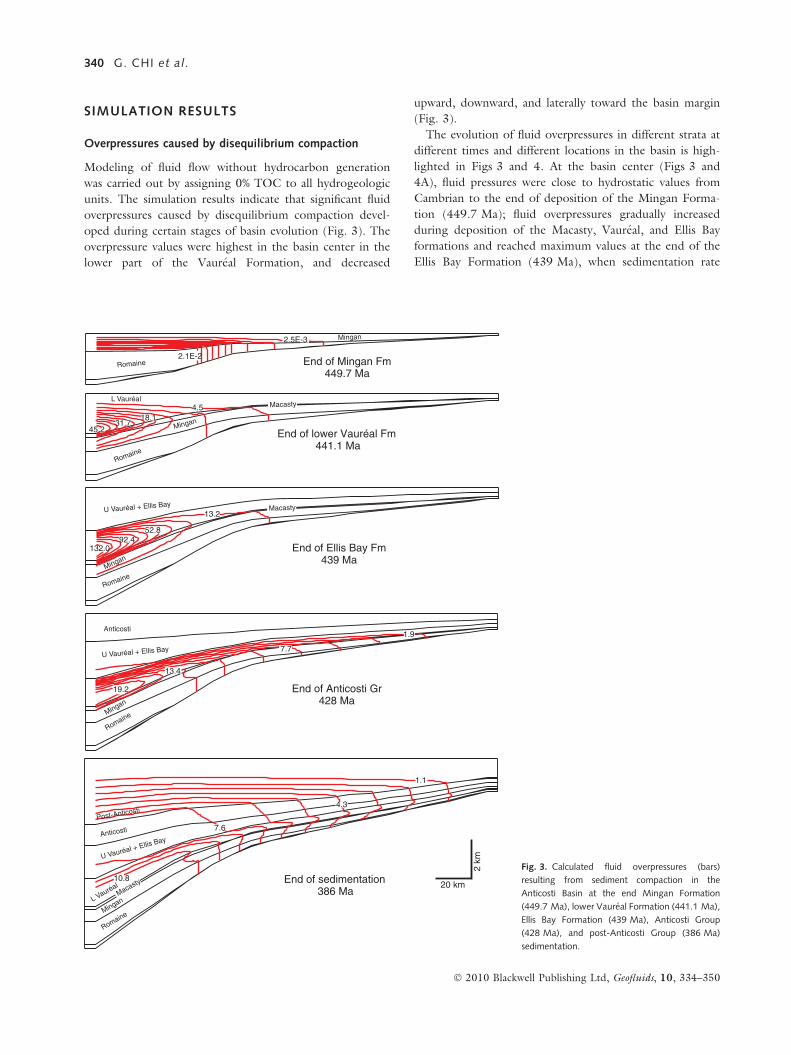
Figs 3 and 6 at 428 Ma). By the end of sedimentation in
the basin (386 Ma), the Macasty Formation had passed
beyond the gas window at the basin center, and was in the
gas window or oil window further north (Fig. 7). A fluid
overpressure core developed in the lower Vaureal Forma-
tion north of the basin center (Fig. 6), where the Macasty
and the lower Vaureal formations were in the gas window
(Fig. 7). This overpressure core is much more prominent
than in the compaction-only model (compare Figs. 3 and
6 at 386 Ma).
Sensitivity studies
Previous studies have shown that fluid overpressure related
to disequilibrium compaction is sensitive to rock perme-
ability, and permeability values for a given lithology typi-
cally vary over two orders of magnitude (Harrison &
Summa 1991) or more. Simulations of fluid overpressure
caused by disequilibrium compaction in the Anticosti Basin
were carried out with sandstone, shale, and limestone per-
meabilities one order of magnitude higher and lower than
those presented above. Thus, the permeability (in darcies)
was varied from log kx = 15/ ) 4 to log kx = 15/ ) 2 for
sandstone, log kx = 8/ ) 9 to log kx = 8/ ) 7 for shale,
and from log kx = 6/ ) 5 to log kx = 6/ ) 3 for limestone
(see eqn 2 and Table 3). Fluid overpressure increased sig-
nificantly with decreasing permeability, as illustrated by the
overpressure profile at the basin center (Fig. 8). At the end
of Ellis Bay Formation sedimentation (439 Ma), the maxi-
mum fluid overpressure is 19.9 bars for the higher perme-
ability case, 145.2 bars for the intermediate permeability
case, and 292.4 bars for the lower permeability case
(Fig. 8A). The maximum fluid overpressure is located in
the lower Vaureal Formation for the higher and intermedi-
ate permeability cases, and in the Macasty Formation for
the lower permeability case (Fig. 8A). At 386 Ma, the
maximum fluid overpressure diminishes to 1.8 and 11.9
bars for the higher and intermediate permeability cases
respectively, and to 64.8 bars for the lower permeability
case (Fig. 8B). The maximum overpressure is located in
the lower Vaureal Formation for the intermediate and low
permeability cases (Fig. 8B).
Kinetic parameters of kerogen-to-oil conversion can also
vary over a wide range of values (Peters et al. 2006). For
type II kerogens, the calculated fractional conversions
based on the optimal values of Pepper & Corvi (1995)
(Ao = 2.92 · 1017 h)1; Eo = 215.2 kJ mol)1, Table 4) lie
in the middle of a range associated with Ao from
3.11 · 1016 to 5.48 · 1017 h)1 and Eo from 209.2
to 230.1 kJ mol)1 respectively (Peters et al. 2006).
According to Pepper & Dodd (1995), the kinetic parame-
ters related to oil-to-gas conversion also vary considerably,
from Ag = 3.6 · 1015 h)1 and Eg = 225.9 kJ mol)1, to
Ag = 1.08 · 1018 h)1 and Eg = 238.6 kJ mol)1. Two sets
of sensitivity simulations were carried out, one assuming
fixed oil-to-gas conversion parameters (Table 4) and vary-
ing kerogen-to-oil parameters, the other assuming fixed
kerogen-to-oil conversion parameters (Table 4) and
10 – 90% oil generated
10 – 90% gas generated
20 km
2 km
o T emperature ( C )
End of sedimentation 386 Ma
End of Anticosti Gr 428 Ma
Mingan
U V auréal + Ellis Bay
L V auréal
Anticosti 36
68
100
132
164 Romaine
Romaine Mingan
Anticosti
Post-Anticosti
U V auréal + Ellis Bay
L V auréal
Macasty
42
86
130
175
219
Fig. 7. Calculated temperatures and oil and gas
windows at the end of the Anticosti Group
(428 Ma) and the end of basin sedimentation
(380 Ma), with both disequilibrium compaction
and hydrocarbon generation considered in over-
pressure calculation.
Downward hydrocarbon migration in Paleozoic Anticosti Basin 343
� 2010 Blackwell Publishing Ltd, Geofluids, 10, 334–350

–6000
–5000
–4000
–3000
–2000
–1000
0 0 10050 150 200 250 300
Fluid overpressure (bars) (A) (B) Fluid overpressure (bars) D
epth
(m
) Upper V auréal and Ellis Bay
Upper V auréal and Ellis BayLower V auréal
Lower V auréal
Macasty
Macasty
Mingan
Mingan
Romaine
Romaine
Anticosti Gr
Post-Anticosti Gr
Lower permeability
Lower permeability Higher permeability Higher permeability
Intermediate permeability
Intermediate permeability
–10 000
–9000
–8000
–7000
–6000
–5000
–4000
–3000
–2000
–1000
0 20 40 60 80
439 Ma 386 Ma
Fig. 8. Calculated overpressure–depth profiles at the basin center at (A) 439 Ma and (B) 386 Ma – sensitivity studies showing the effect of varying rock per-
meability.
Hyd
roca
rbo
n g
ener
ated
(fr
acti
on
) O
verp
ress
ure
(b
ars)
0
0.2
0.4
0.6
0.8
1
0
20
40
60
80
100
0
0.2
0.4
0.6
0.8
1
460 450 440 430 420 410 400 390 380 460 450 440 430 420 410 400 390 380
460 450 440 430 420 410 400 390 380 460 450 440 430 420 410 400 390 380
0
20
40
60
80
100
T ime (Ma) T ime (Ma)
Oil:
Ao
= 2
.92E
17; E
o =
215
.2
Oil:
Ao
= 2
.92E
17; E
o =
215
.2
Oil:
Ao
= 3
.1 1E
16; E
o =
209
.2
Oil: Ao = 5.48E17; Eo = 230.1
Gas
: Ag
= 3.
6E16
; Eg
= 23
0
Gas
: Ag
= 3.
6E16
; Eg
= 23
0
Gas: Ag = 3.6E16; Eg = 230
Gas
: Ag
= 3.
6E15
; Eg
= 22
5.9
Gas: Ag = 3.6E15; Eg = 225.9
Gas
: Ag
= 1.
08E
18; E
g =
238.
6
(A) (B)
(C) (D)
Pos
t-A
ntic
osti
Pos
t-A
ntic
osti
Pos
t-A
ntic
osti
Pos
t-A
ntic
osti
Hia
tus
Hia
tus
Hia
tus
Hia
tus
Ant
icos
ti
Ant
icos
ti
Ant
icos
ti A
ntic
osti
L V
auré
al
L V
auré
alL
V au
réal
L V
auré
al
Oil:
Ao
= 5.
48E
17; E
o =
230.
1
Oil: Ao = 2.92E17; Eo = 215.2
Oil: Ao = 3.1 1E16; Eo = 209.2
U V auréal+ Ellis Bay
U V auréal+ Ellis Bay
Gas: Ag = 1.08E18; Eg = 238.6
U V
auré
al +
Elli
s B
ay
U V
auré
al +
Elli
s B
ay
Fig. 9. Sensitivity studies showing the effect of kinetic parameters on timing of oil and gas generation (A and B) and fluid overpressure development (C and
D) in the Macasty Formation at the basin center. (A) and (C) assume a fixed set of gas generation kinetic parameters (Table 4) and varying oil generation
parameters (Table 4), whereas (B) and (D) assume a fixed set of oil generation kinetic parameters and varying gas generation parameters.
344 G. CHI et al.
� 2010 Blackwell Publishing Ltd, Geofluids, 10, 334–350

varying oil-to-gas conversion parameters. Simulation results
indicate that varying the kerogen-to-oil kinetic parameters
significantly changes the timing of oil generation (Fig. 9A),
but has minor effect on fluid overpressure (Fig. 9C). Simi-
larly, varying the oil-to-gas conversion kinetic parameters
changes the timing of gas generation (Fig. 9B). The effect
on the magnitude of fluid overpressure is minor, but the
timing of the second fluid overpressure peak related to gas
generation is significantly different for the different oil-to-
gas conversion parameters (Fig. 9D).
Impelling force of oil and gas migration
According to Hubbert (1953), the impelling force of
hydrocarbon (oil or gas) migration (EHC) is determined by
a combination of buoyancy force and the impelling force
of water (EW), and can be expressed as:
EHC ¼qHC � qW
qHC
g þ qW
qHC
EW ; ð13Þ
where qHC is the density of oil or gas, qW is the density of
water, and g is the gravity. The impelling force of water
flow is related to fluid overpressure (w) by
EW ¼ �1
qW
rW: ð14Þ
The vertical impelling force of hydrocarbon migration
can then be written as
EHC ¼qHC � qW
qHC
g � 1
qHC
oWoz
: ð15Þ
The first term reflects the buoyancy force, and the sec-
ond term is the impelling force of water.
A calculation of the impelling force for oil and gas gener-
ated in the Macasty Formation was carried out for the end of
the Anticosti Group (428 Ma) and the end of sedimentation
of the basin (386 Ma), and the results are listed in Table 5.
The impelling force of water is calculated based on the dif-
ference between the maximum overpressure (in the Lower
Vaureal Formation) and the overpressure at the base of the
Macasty Formation. At 428 Ma, the Macasty Formation
within 33 km north of the basin center has entered or just
passed the oil window (Figs 5A and 7). The downward verti-
cal impelling force for water is from )1.18 to )1.67 m s)2,
which is stronger than the upward buoyancy force of 0.43 to
0.58 m s)2. As a result, the combined impelling force for oil
is negative (downward; Table 5). At 386 Ma, the Macasty
Formation was in the gas window in the area 33–55 km
from basin center and in the oil window 77–132 km north
of the basin center (Fig. 7). For oil, the buoyancy force
ranges from 0.48 to 0.62 m s)2, and the vertical impelling
force for water is )0.05 to )0.25 m s)2 (Table 5). For gas,
the buoyancy force ranges from 38.83 to 42.67 m s)2, and
the impelling force for water is from )1.21 to 1.29 m s)2
(Table 5). The combined vertical impelling forces are consis-
tently upward and range from 0.30 to 0.43 m s)2 for oil and
from 37.62 to 41.38 m s)2 for gas (Table 5).
DISCUSSION: IMPLICATIONS FORHYDROCARBON MIGRATION
The source rock of the Macasty Formation is located in
the lower part of the sedimentary succession in the Antic-
osti Basin (Fig. 2) and thermal maturation studies (Ber-
trand 1987, 1990, 1991) indicate burial to the oil window
Table 5 Vertical impelling forces for hydrocarbons generated in the Macasty Formation.
Time
(Ma)
Location (distance
from basin center), km
Oil or
gas
Buoyancy force acting
on hydrocarbons (m s)2)
A ¼ qHC�qW
qHCg
Vertical impelling force
caused by overpressure
gradient (m s)2)
B ¼ � 1qHC
DWDz
Combined vertical
impelling force acting
on hydrocarbons (m s)2)
C = A + B
428 0 Oil 0.43 )1.33 )0.90
11 Oil 0.48 )1.56 )1.08
22 Oil 0.53 )1.67 )1.14
33 Oil 0.58 )1.18 )0.60
386 77 Oil 0.48 )0.05 0.43
88 Oil 0.52 )0.22 0.30
99 Oil 0.55 )0.22 0.33
110 Oil 0.57 )0.20 0.37
121 Oil 0.59 )0.23 0.37
132 Oil 0.62 )0.25 0.37
33 Gas 38.83 )1.21 37.62
44 Gas 40.64 )1.25 39.39
55 Gas 42.67 )1.29 41.38
Positive values indicate upward forces and negative values indicate downward forces; qHC = density of hydrocarbons; qW = density of water; g = gravity;
DW = fluid overpressure difference between the maximum overpressure (in the lower Vaureal Formation) and that at the base of Macasty; Dz = vertical dis-tance between the point of maximum overpressure and the base of Macasty.
Downward hydrocarbon migration in Paleozoic Anticosti Basin 345
� 2010 Blackwell Publishing Ltd, Geofluids, 10, 334–350

in the northern part of the basin and to the gas window in
the southern part. Given the high TOC values and large
thickness of the Macasty Formation, large amounts of oil
and gas may have been generated. The question is where
the hydrocarbons may have flowed and accumulated.
Directions of hydrocarbon migration
The direction of hydrocarbon migration is determined by
three forces including the capillary effect, the buoyancy
force, and the impelling force of groundwater flow (Hubbert
1953). Flow patterns are also controlled by the permeability
anisotropy of the strata. Thus, under a given hydraulic con-
dition, lateral flow is facilitated by bedding-parallel perme-
ability higher than bedding-perpendicular permeability.
The impelling force of groundwater flow is directly
related to the gradient of fluid overpressure. Fluid-flow sim-
ulation results indicate that the maximum fluid overpressure
near the basin center occurred above the major source rock,
forming a pressure barrier unfavorable for upward hydro-
carbon migration. In a compaction-only model, maximum
overpressure developed in the lower part of the Vaureal
shales due to high sedimentation rates during deposition of
the Vaureal and Ellis Bay formations. The shales of the
Macasty Formation and lower part of the Vaureal Forma-
tion compacted rapidly, and the escape of pore fluid was
limited by low permeability. Even higher overpressures
might have been achieved if we had considered loading
from thrusting near the structural front (Ge & Garven
1992). Sensitivity studies indicate that the magnitude of
fluid overpressure depends largely on the permeability of
the rocks, although the overpressure distribution pattern
remains more or less the same, with maximum overpres-
sures in the lower Vaureal Formation above the Macasty
Formation (Fig. 8). Fluid overpressure in the lower Vaureal
Formation decreases with time after sedimentation of the
Ellis Bay Formation, but this decline is slightly slowed
down by the generation of oil and gas. Fluid overpressure
then increased during the peak generation of gas (Fig. 5).
As a result, a prominent overpressured core was maintained
above the Macasty Formation in the central part of the
basin during oil and gas generation (Fig. 6). Such a distri-
bution of fluid overpressures is generally favorable for
downward migration of hydrocarbons generated in the
Macasty Formation in the central part of the basin.
Calculations of the impelling forces of oil and gas consid-
ering buoyancy and fluid overpressure indicate that the oil
in the Macasty Formation would migrate downward at
428 Ma, but that gas and oil generated at 386 Ma would
migrate upward (Table 5). Most oil in the central part of
the basin would have been generated before 428 Ma
(Figs 5A and 9A), so that downward migration of oil is
expected near the basin center. Downward migration of oil
is also likely in the area further to the north between 428
and 386 Ma if the effect of capillary force is considered.
The capillary force tends to expel oil from fine- to coarse-
grained sediments (Hubbert 1953). As the Macasty Forma-
tion is capped by the fine-grained lower Vaureal Formation
and underlain by the coarser-grained Mingan Formation,
the general effect of capillary force is to enhance downward
migration of oil. For gas, the buoyancy force is so much
higher than the downward impelling force related to fluid
overpressures (Table 5) that downward migration is unli-
kely even if the effect of capillary force is considered.
Because the overpressure gradient decreases significantly
downward from the Macasty–Mingan contact (Figs 3 and
6), it is difficult for oil to migrate all the way to the
Romaine Formation. One potential mechanism for oil to
reach the Romaine Formation is through episodic opening
of subvertical faults as a consequence of fluid overpressure
development (Payne et al. 2000). Subvertical faults in the
Romaine, Mingan, and Macasty formations, visible on seis-
mic profiles (Lynch & Trollope 2001; Lynch & Grist
2002), may have been re-activated by fluid overpressures in
the lower Vaureal formation and acted as conduits for
downward hydrocarbon flow.
The inferred hydrocarbon flow pattern, combined with
the observation that the carbonate rocks of underlying the
source beds have locally high porosity (Chi & Lavoie
2001; Lavoie et al. 2005, 2009), suggests that the
Romaine and Mingan formations may have served as reser-
voirs or carrier beds. Migration of oil in the Romaine For-
mation is supported by bitumen-coating pore space,
hydrocarbon fluid inclusions in late pore-filling calcite and
barite cements, and oil and gas shows in almost all ancient
drill holes (Chi & Lavoie 2001; Lynch & Trollope 2001;
Lynch & Grist 2002; Lavoie et al. 2005, 2009).
Once hydrocarbons were expelled into the underlying
carbonates and the downward impelling forces diminished,
they could migrate laterally (up-dip) toward the basin mar-
gin until migration was stopped by an impermeable barrier.
If oil was generated and expelled into the Mingan and
Romaine carbonates but did not migrate laterally from the
basin center, it would be eventually converted to gas,
because the basin center entered the gas window in the
later part of the basin history. In the northern part of
the basin, fluid overpressures were much smaller than in the
central part of the basin, and hydrocarbons were more likely
to migrate upward and laterally toward the basin margin.
In summary, the simulation results suggest that oil
generated in the organic-matter-rich Macasty shales tended
to migrate downward near the basin center and upward in
shallow parts of the basin. Natural gas, however, is more
likely to migrate upward throughout the basin. The poten-
tial hydrocarbon migration pattern is illustrated in Fig. 10.
Downward-migrating oil may have been trapped in the
carbonates of the Mingan and Romaine formations
beneath the source beds, or continued to migrate laterally
346 G. CHI et al.
� 2010 Blackwell Publishing Ltd, Geofluids, 10, 334–350
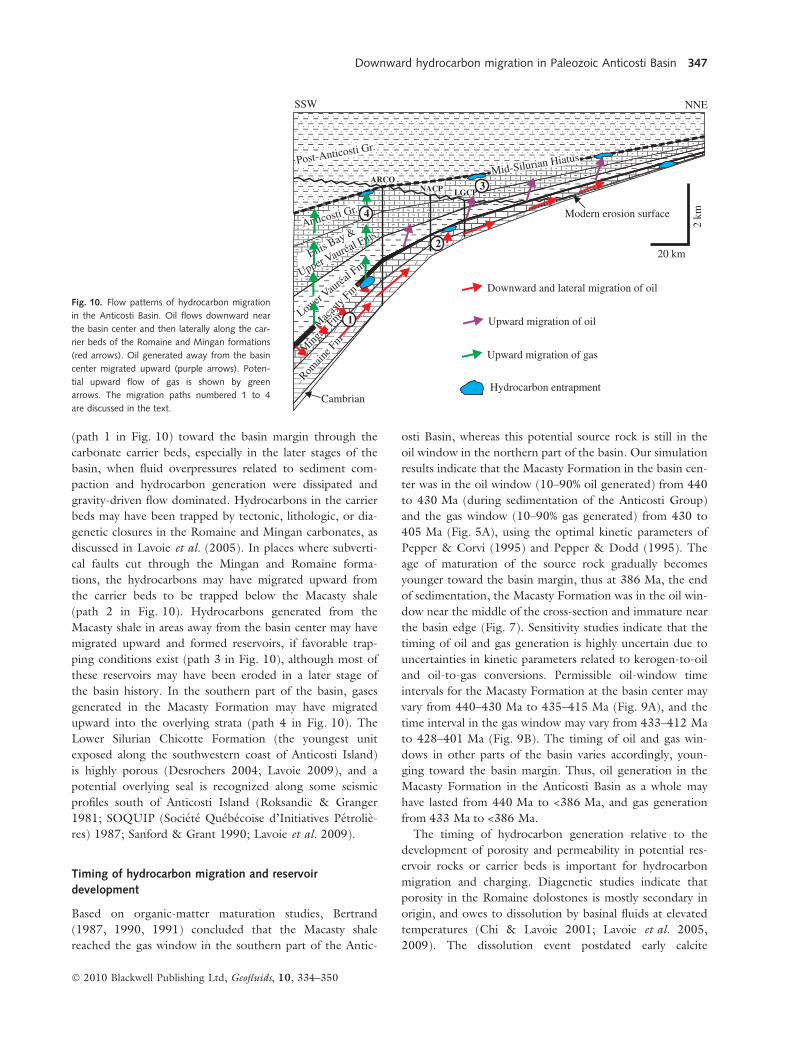
(path 1 in Fig. 10) toward the basin margin through the
carbonate carrier beds, especially in the later stages of the
basin, when fluid overpressures related to sediment com-
paction and hydrocarbon generation were dissipated and
gravity-driven flow dominated. Hydrocarbons in the carrier
beds may have been trapped by tectonic, lithologic, or dia-
genetic closures in the Romaine and Mingan carbonates, as
discussed in Lavoie et al. (2005). In places where subverti-
cal faults cut through the Mingan and Romaine forma-
tions, the hydrocarbons may have migrated upward from
the carrier beds to be trapped below the Macasty shale
(path 2 in Fig. 10). Hydrocarbons generated from the
Macasty shale in areas away from the basin center may have
migrated upward and formed reservoirs, if favorable trap-
ping conditions exist (path 3 in Fig. 10), although most of
these reservoirs may have been eroded in a later stage of
the basin history. In the southern part of the basin, gases
generated in the Macasty Formation may have migrated
upward into the overlying strata (path 4 in Fig. 10). The
Lower Silurian Chicotte Formation (the youngest unit
exposed along the southwestern coast of Anticosti Island)
is highly porous (Desrochers 2004; Lavoie 2009), and a
potential overlying seal is recognized along some seismic
profiles south of Anticosti Island (Roksandic & Granger
1981; SOQUIP (Societe Quebecoise d’Initiatives Petrolie-
res) 1987; Sanford & Grant 1990; Lavoie et al. 2009).
Timing of hydrocarbon migration and reservoir
development
Based on organic-matter maturation studies, Bertrand
(1987, 1990, 1991) concluded that the Macasty shale
reached the gas window in the southern part of the Antic-
osti Basin, whereas this potential source rock is still in the
oil window in the northern part of the basin. Our simulation
results indicate that the Macasty Formation in the basin cen-
ter was in the oil window (10–90% oil generated) from 440
to 430 Ma (during sedimentation of the Anticosti Group)
and the gas window (10–90% gas generated) from 430 to
405 Ma (Fig. 5A), using the optimal kinetic parameters of
Pepper & Corvi (1995) and Pepper & Dodd (1995). The
age of maturation of the source rock gradually becomes
younger toward the basin margin, thus at 386 Ma, the end
of sedimentation, the Macasty Formation was in the oil win-
dow near the middle of the cross-section and immature near
the basin edge (Fig. 7). Sensitivity studies indicate that the
timing of oil and gas generation is highly uncertain due to
uncertainties in kinetic parameters related to kerogen-to-oil
and oil-to-gas conversions. Permissible oil-window time
intervals for the Macasty Formation at the basin center may
vary from 440–430 Ma to 435–415 Ma (Fig. 9A), and the
time interval in the gas window may vary from 433–412 Ma
to 428–401 Ma (Fig. 9B). The timing of oil and gas win-
dows in other parts of the basin varies accordingly, youn-
ging toward the basin margin. Thus, oil generation in the
Macasty Formation in the Anticosti Basin as a whole may
have lasted from 440 Ma to <386 Ma, and gas generation
from 433 Ma to <386 Ma.
The timing of hydrocarbon generation relative to the
development of porosity and permeability in potential res-
ervoir rocks or carrier beds is important for hydrocarbon
migration and charging. Diagenetic studies indicate that
porosity in the Romaine dolostones is mostly secondary in
origin, and owes to dissolution by basinal fluids at elevated
temperatures (Chi & Lavoie 2001; Lavoie et al. 2005,
2009). The dissolution event postdated early calcite
Romain
e Fm
M
ingan
Fm
Mac
asty
Fm
Lower V au
réal F
mEllis
Bay &
Upper V auréal Fms
Anticosti Gr .
Post-Anticosti Gr .
Cambrian
2 km
20 km
Modern erosion surface
ARCO
LGCP NACP
SSW NNE
Mid-Silurian Hiatus
Downward and lateral migration of oil
Upward migration of oil
Upward migration of gas
Hydrocarbon entrapment
4
3
2
1
Fig. 10. Flow patterns of hydrocarbon migration
in the Anticosti Basin. Oil flows downward near
the basin center and then laterally along the car-
rier beds of the Romaine and Mingan formations
(red arrows). Oil generated away from the basin
center migrated upward (purple arrows). Poten-
tial upward flow of gas is shown by green
arrows. The migration paths numbered 1 to 4
are discussed in the text.
Downward hydrocarbon migration in Paleozoic Anticosti Basin 347
� 2010 Blackwell Publishing Ltd, Geofluids, 10, 334–350

cementation and early dolomitization, was coeval with late-
stage dolomitization and sulfide mineralization, and pre-
dated at least one phase of oil migration (Chi & Lavoie
2001; Lavoie et al. 2005). Although the age of the poros-
ity-generating dissolution is unknown, it is possible that
the dolomitization and dissolution processes took place
before or during the generation of oil and gas.
The oil inclusions trapped in late, pore-filling calcite and
barite cements in the Romaine Formation at the NACP
well on Anticosti Island (Fig. 1B) indicate a relatively late
oil migration event at low temperatures and pressures
(80º–90�C and 345–392 bars; Chi et al. 2000). The oil
most likely resulted from secondary migration or dismigra-
tion from deeper parts of the basin. One scenario is that
oil generated in the Macasty Formation first migrated into
the underlying Mingan and Romaine carbonates and then
up-dip along the carrier beds. As the Macasty Formation
gradually entered the gas window, more gas migrated into
the carrier beds, following the same conduits as the oil.
The high pressure caused by gas generation may have
accelerated oil migration toward the basin margin. Some
previously trapped oil may also have been expelled and
migrated at a late time, perhaps after maximum burial
(386 Ma), due to the late generation of gas.
CONCLUSIONS
Numerical modeling of fluid flow in the Anticosti Basin
indicates that significant fluid overpressures may have devel-
oped during basin evolution. Both sediment compaction
and hydrocarbon generation contributed to the develop-
ment of overpressures, but disequilibrium compaction
seems to be the most important factor. Maximum fluid
overpressures developed in the lower part of the thick Vau-
real shale near the basin center, which is located above the
Macasty source rocks. This overpressure barrier may have
forced oil generated in the Macasty Formation to flow
downward into the underlying Mingan and Romaine car-
bonates, potentially forming hydrocarbon reservoirs. These
hydrocarbons could also have migrated further up-dip
toward the basin margin through the Mingan and Romaine
carbonate carrier beds until they were trapped. In contrast,
in the northern part of the basin, fluid overpressures were
generally weak, and therefore hydrocarbons (mainly oil)
tended to migrate upward. Gas generated in the Macasty
Formation is likely to migrate upward throughout the
basin. The generation of oil and gas may have lasted after
maximum burial, and secondary migration of hydrocarbons
may have occurred fairly late in the history of the basin.
ACKNOWLEDGEMENTS
This study was initially supported by the Earth Science Sec-
tor of Natural Resources Canada through the NATional
geoscience MAPping (NATMAP) project on the eastern
Canada Appalachian forelands and St. Lawrence Platform.
Shell Canada, Corridor Resources, and the Ministere des
Ressources Naturelles du Quebec are thanked for financial
support and access to core material at various stages during
the project. Additional support came from NSERC (to
Chi). Dr M. Nastev of GSC-Quebec and Dr K. Peters of
Schlumberger are thanked for reviewing an early draft of
the manuscript and for many constructive comments. The
study has greatly benefited from comments by two Geofl-
uids reviewers. This study is a Geological Survey of Canada
Contribution (20090007).
REFERENCES
Azmy K, Lavoie D, Knight I, Chi G (2008) Dolomitization of theAguathuna Formation carbonates of Port au Port Peninsula in
western Newfoundland, Canada: implications for a hydrocarbon
reservoir. Canadian Journal of Earth Sciences, 45, 795–813.Bertrand R (1987) Maturation thermique et potentiel petroligene
des series post-taconiennes du Nord-Est de la Gaspesie et de l’Iled’Anticosti. DSc thesis, Neuchatel, Switzerland, 647 pp.
Bertrand R (1990) Maturation thermique et histoire de l’enfouiss-ement et de la generation des hydrocarbures du bassin de
l’archipel de Mingan et de l’ıle d’Anticosti, Canada. CanadianJournal of Earth Sciences, 27, 731–41.
Bertrand R (1991) Maturation thermique des roches meres dansles bassins des basses-terres du Saint-Laurent et dans quelques
buttes temoins au sud-est du Bouclier canadien. InternationalJournal of Coal Geology, 19, 359–83.
Bethke CM (1985) A numerical model of compaction-driven
groundwater flow and heat transfer and its application to paleo-
hydrology of intracratonic sedimentary basins. Journal of Geo-physical Research, 90, 6817–28.
Bethke CM, Reed JD, Oltz DF (1991) Long-range petroleum
migration in the Illinois Basin. AAPG Bulletin, 75, 925–45.
Bethke CM, Lee MK, Quinodoz H, Kreiling WN (1993) BasinModeling with Basin2, a Guide to Using Basin2, B2plot, B2video,and B2view. University of Illinois, Urbana, 225 pp.
Bordenave ML (1993) Applied Petroleum Geochemistry. Editions
Technip, Paris, 524 pp.
Bredehoeft JD, Wesley JB, Fouch TD (1994) Simulations of theorigin of fluid pressure, fracture generation, and the movement
of fluids in the Uinta Basin, Utah. AAPG Bulletin, 78, 1729–
47.Burden E, Quinn L, Nowlan G, Bailey-Nill L (2002) Palynology
and micropaleontology of the Clam Bank Formation (Lower
Devonian) of western Newfoundland, Canada. Palynology, 26,
185–215.Castonguay S, Wilson RA, Brisebois D, Desrochers A, Malo M
(2005) Compilation geologique, Anticosti-Gaspe-Campbellton, Lesponts geologiques de l’est du Canada, Transect 4, Quebec – Nou-veau-Brunswick. Geological Survey of Canada, Ottawa, OpenFile 4883, 1 ⁄ 125 000, 4 sheets.
Chi G (2001) BsnMod: A Windows Program for Simulating Basin-Scale Fluid Flow and Heat Transfer Processes Related to SedimentCompaction and Tectonic Uplifting in Two Dimensions. Geolo-
gical Survey of Canada, Ottawa, Current Research 2001D-24, 7
pp.
Chi G, Lavoie D (2001) A Diagenetic Study of Dolostones of theLower Ordovician Romaine Formation. Anticosti Island:
348 G. CHI et al.
� 2010 Blackwell Publishing Ltd, Geofluids, 10, 334–350

Geological Survey of Canada, Ottawa, Current Research 2001-D17, 13 pp.
Chi G, Savard MM (1998) Basinal fluid flow models related to
Zn-Pb mineralization in the southern margin of the Maritimes
Basin, eastern Canada. Economic Geology, 93, 896–910.Chi G, Bertrand R, Lavoie D (2000) Regional-scale variation of
characteristics of hydrocarbon fluid inclusions and thermal con-
ditions along the Paleozoic Laurentian continental margin ineastern Quebec, Canada. Bulletin of Canadian Petroleum Geol-ogy, 48, 193–211.
Cooper M, Weissenberger J, Knight I, Hostad D, Gillespie D,
Williams H, Burden E, Porter-Chaudhry J, Ray D, Clark E(2001) Basin evolution in western Newfoundland: new insights
from hydrocarbon exploration. AAPG Bulletin, 85, 393–418.
Desrochers A (2004) Controls on Ancient Rocky Shoreline Develop-ment: Examples from the Lower Silurian Chicotte Formation, An-ticosti Island; Gulf of St. Lawrence. Geological Association of
Canada – Mineralogical Association of Canada Joint Annual
Meeting, St Catherines 2004, CD-Rom with abstracts,Montreal, 118 pp.
Desrochers A, James NP (1988) Early Paleozoic surface and sub-
surface paleokarst: middle Ordovician Carbonates, Mingan
Islands, Quebec. In: Paleokarst (eds James NP, Choquette PW),pp. 183–210. Verlag, New York.
Duan Z, Moller N, Weare JH (1992) An equation of state for the
CH4-CO2-H2O system: I. Pure systems from 0 to 1000�C and
0 to 8000 bars. Geochimica et Cosmochimica Acta, 56, 2605–17.
Garven G (1985) The role of regional fluid flow in the genesis of
the Pine Point deposit, Western Canada sedimentary basin. Eco-nomic Geology, 80, 307–24.
Garven G (1989) A hydrogeologic model for the formation of the
giant oil sands deposits of the Western Canada Sedimentary
Basin. American Journal of Science, 289, 105–66.Ge S, Garven G (1992) Hydromechanical modeling of tectonically
driven groundwater flow with application to the Arkoma fore-
land basin. Journal of Geophysical Research, 97, 9119–44.
Hansom J, Lee MK (2005) Effects of hydrocarbon generation,basal heat flow and sediment compaction on overpressure devel-
opment: a numerical study. Petroleum Geoscience, 11, 353–60.
Harrison WJ, Summa LL (1991) Paleohydrogeology of the Gulf
of Mexico basin. American Journal of Science, 291, 109–76.Hubbert MK (1940) The theory of groundwater motion. Journal
of Geology, 48, 785–944.
Hubbert MK (1953) Entrapment of petroleum under hydrody-namic conditions. AAPG Bulletin, 37, 1954–2026.
Jacobi RD (1981) Peripheral bulge – a causal mechanism of the
Lower ⁄ Middle Ordovician unconformity along the western mar-
gin of the northern Appalachians. Earth and Planetary ScienceLetters, 56, 245–51.
Kaufman J (1994) Numerical models of fluid flow in carbonate
platforms: implications for dolomitization. Journal of Sedimen-tary Research, 64, 128–39.
Knight I, James NP, Lane TE (1991) The Ordovician St. George
Unconformity, northern Appalachians: the relationship of plate
convergence at the St. Lawrence Promontory to the Sauk-Tip-pecanoe sequence boundary. Geological Society of America Bulle-tin, 103, 1200–25.
Lavoie D (2008) Appalachian Foreland Basin of Canada. In: Sedi-mentary Basins of the World – USA and Canada (ed. AD Miall),pp. 65–103. Elsevier Science, the Netherlands.
Lavoie D (2009) Porosity – Permeability Values for Selected Paleo-zoic Field Samples in Quebec. Geological Survey of Canada,
Open File 6084, 23 pp.
Lavoie D, Chi G, Brennan-Alpert P, Desrochers A, Bertrand R(2005) Hydrothermal dolomitization in the Lower Ordovician
Romaine Formation of the Anticosti Basin: significance for
hydrocarbon exploration. Bulletin of Canadian Petroleum Geol-ogy, 53, 454–71.
Lavoie D, Pinet N, Dietrich J, Hannigan P, Castonguay S, Ham-
blin AP, Giles P (2009) Petroleum Resource Assessment, PaleozoicSuccessions of the St. Lawrence Platform and Appalachians ofEastern Canada. Geological Survey of Canada, Ottawa, Open
File 6174, 275 pp.
Lavoie D, Desrochers A, Dix GR, Knight I, Salad-Hersi O (in
press) The Great American Carbonate Bank (GACB) in easternCanada – an overview. In: The Great American Carbonate Bank:The Geology and Petroleum Potential of the Cambrian – Ordovi-cian Sauk Sequence of Laurentia (eds Wilson JL, Derby J),
AAPG Memoir. (in press).Lee MK, Williams DD (2000) Paleohydrogeology of the Delaware
Basin, western Texas: overpressure development, hydrocarbon
migration, and ore genesis. AAPG Bulletin, 84, 961–74.Long DGF (2007) Tempestite frequency curves: a key to Late
Ordovician and Early Silurian subsidence, sea-level change, and
orbital forcing in the Anticosti foreland basin, Quebec, Canada.
Journal of Canadian Earth Sciences, 44, 413–31.Luo X, Vasseur G (1996) Geopressuring mechanism of organic
matter cracking: numerical modeling. AAPG Bulletin, 80, 856–
74.
Lynch G, Grist AM (2002) Thermal Modeling of the LaurentianMargin Beneath Anticosti Island Using AFTA, 1D Well Profilesand Bulk Fluid Inclusions. Canadian Society of Petroleum Geol-
ogists, Diamond Jubilee Convention, Calgary 2002, Programwith abstracts, Calgary, 210 pp.
Lynch G, Trollope SW (2001) Dolomitization, Platform Collapse,and Reservoir Development in Ordovician Carbonates of AnticostiIsland, Gulf of St. Lawrence. Canadian Society of PetroleumGeologists, Annual Meeting, Calgary, ‘‘Rock the Foundation’’
Calgary 2001, Program with Abstracts, pp. 126-1–126-6.
Malo M (2004) Paleogeography of the Matapedia basin in the
Gaspe Appalachians: initiation of the Gaspe Belt successor basin.Canadian Journal of Earth Sciences, 41, 533–70.
McPherson BJOL, Bredehoeft JD (2001) Overpressures in the
Uinta basin, Utah: analysis using a three-dimensional basin evo-
lution model. Water Resources Research, 37, 857–71.Payne DF, Tuncay K, Park A, Comer JB, Ortoleva P (2000) A
reaction-transport-mechanical approach to modeling the inter-
relationships among gas generation, overpressuring, andfracturing: implications for the Upper Cretaceous natural gas
reservoirs of the Piceance Basin, Colorado. AAPG Bulletin, 84,
545–65.
Pepper AS, Corvi PJ (1995) Simple kinetic models of petroleumformation. Part I: oil and gas generation from kerogen. Marineand Petroleum Geology, 12, 291–319.
Pepper AS, Dodd TA (1995) Simple kinetic models of petroleum
formation. Part II: oil-gas cracking. Marine and Petroleum Geol-ogy, 12, 321–40.
Peters KE, Walters CC, Mankiewicz PJ (2006) Evaluation of
kinetic uncertainties in numerical models of petroleum genera-tion. AAPG Bulletin, 90, 387–403.
Quinlan GM, Beaumont C (1984) Appalachian thrusting, litho-
spheric flexure, and the Paleozoic stratigraphy of the Eastern
Interior of North America. Canadian Journal of Earth Sciences,21, 973–96.
Quinn L, Bashforth AR, Burden ET, Gillepsie H, Springer RK,
Williams SH (2004) The Red Island Road Formation: early
Devonian terrestrial fill in the Anticosti Foreland Basin, western
Downward hydrocarbon migration in Paleozoic Anticosti Basin 349
� 2010 Blackwell Publishing Ltd, Geofluids, 10, 334–350

Newfoundland. Canadian Journal of Earth Sciences, 41, 587–602.
Roksandic MM, Granger B (1981) Structural styles of Anticosti
Island, Gaspe Passage, and eastern Gaspe Peninsula inferred
from reflection seismic data. In: Subcommission of SilurianStratigraphy, Ordovician-Silurian Boundary Working Group:Field Meeting, Anticosti-Gaspe, 1981, Vol. II: Stratigraphy andPaleontology (ed. Lesperance PJ), pp. 211–21. Universite deMontreal, Montreal.
Sanford BV (1993) St. Lawrence platform – economic geology.
In: Chapter 12, Sedimentary Cover of the Craton in Canada(eds Stott DF, Aitken JD), Geological Survey of Canada, Geol-ogy of Canada, No. 5, 787–98.
Sanford BV, Grant AC (1990) Bedrock Geological Mapping andBasin Studies in the Gulf of St. Lawrence. Geological Survey of
Canada, Current Research, Paper 90-1B, 33–42.Sloss LL (1963) Sequences in the cratonic interior of North
America. Geological Society of America Bulletin, 74, 93–
114.SOQUIP (Societe Quebecoise d’Initiatives Petrolieres) (1987)
Estuary and Gulf of St. Lawrence; Geological, Geophysical and
Geochemical Data Integration. Geological Survey of Canada,Ottawa, Open File 1721.
Speight JG (2006) The Chemistry and Technology of Petroleum, 4th
edn. Taylor & Francis Group, CRC Press, Boca Raton, FL,
USA, 984 pp.Swarbrick RE, Osborne MJ, Yardley GS (2002) Comparison of
overpressure magnitude resulting from the main generating
mechanisms. In: Pressure Regimes in Sedimentary Basins andTheir Prediction (eds Huffman AR, Bowers GL), AAPG Mem-oir, 76, 1–12.
Waldron JWF, Anderson SD, Cawood PA, Goodwin LB, Hall J,
Jamieson RA, Palmer SE, Stockmal GS, Williams PE (1998)Evolution of the Appalachian Laurentian margin: lithoprobe
results in western Newfoundland. Canadian Journal of EarthSciences, 35, 1271–87.
Williams EP (1974) Geology and petroleum possibilities in andaround Gulf of St. Lawrence. AAPG Bulletin, 58, 1137–55.
Williams H (1995) Temporal and spatial divisions. In: Chapter 2,Geology of the Appalachian-Caledonian Orogen in Canada andGreenland (ed. Williams H). Geological Survey of Canada,
Geology of Canada, No. 6, 21–44.
350 G. CHI et al.
� 2010 Blackwell Publishing Ltd, Geofluids, 10, 334–350
Recommended