December 2017
DORIAN LPG ®
Forward-Looking Statements
This presentation contains certain forward-looking statements including analyses and other information based on forecasts of future results and estimates of amounts not yet determinable and statements relating to our future prospects, developments and business strategies. Forward-looking statements are identified by their use of terms and phrases such as “anticipate,” “believe,” “could,” “estimate,” “expect,” “intend,” “may,” “plan,” “predict,” “project,” “will” and similar terms and phrases, including references to assumptions. The forward-looking statements in this presentation are based upon various assumptions, many of which are based, in turn, upon further assumptions, including without limitation, management’s examination of historical operating trends, data contained in our records and other data available from third parties. Although we believe that these assumptions were reasonable when made, because these assumptions are inherently subject to significant uncertainties and contingencies that are difficult or impossible to predict and are beyond our control, we cannot assure you that we will achieve or accomplish these expectations, beliefs or projections.
Actual results could differ materially from expectations expressed in the forward-looking statements if one or more of the underlying assumptions or expectations proves to be inaccurate or is not realized. Our actual future results may be materially different from and worse than what we expect. We qualify all of the forward-looking statements by these cautionary statements. We caution readers of this presentation not to place undue reliance on forward-looking statements. Any forward-looking statements contained herein are made only as of the date of this presentation, and we undertake no obligation to update or revise any forward-looking statements, whether as a result of new information, future events or otherwise, except as required by law.
Disclaimer
2
Dorian LPG at a glance
3
Company overview Global presence
Average vessel age vs. global fleet
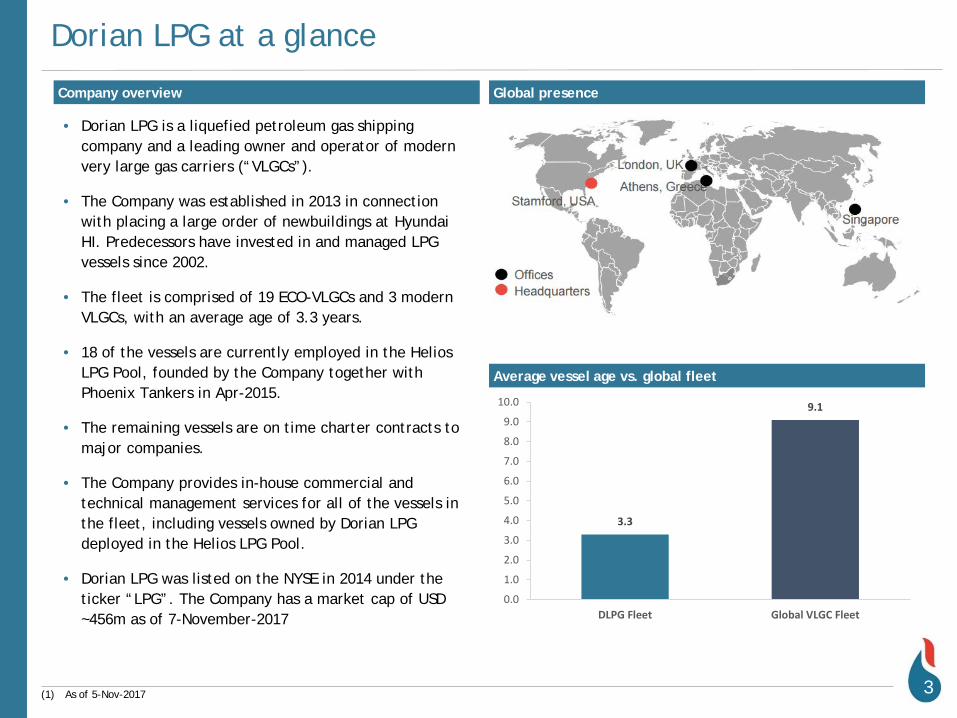
• Dorian LPG is a liquefied petroleum gas shipping company and a leading owner and operator of modern very large gas carriers (“VLGCs”).
• The Company was established in 2013 in connection with placing a large order of newbuildings at Hyundai HI. Predecessors have invested in and managed LPG vessels since 2002.
• The fleet is comprised of 19 ECO-VLGCs and 3 modern VLGCs, with an average age of 3.3 years.
• 18 of the vessels are currently employed in the Helios LPG Pool, founded by the Company together with Phoenix Tankers in Apr-2015.
• The remaining vessels are on time charter contracts to major companies.
• The Company provides in-house commercial and technical management services for all of the vessels in the fleet, including vessels owned by Dorian LPG deployed in the Helios LPG Pool.
• Dorian LPG was listed on the NYSE in 2014 under the ticker “LPG”. The Company has a market cap of USD ~456m as of 7-November-2017
(1) As of 5-Nov-2017
1
3.3
9.1
0.0
1.0
2.0
3.0
4.0
5.0
6.0
7.0
8.0
9.0
10.0
DLPG Fleet Global VLGC Fleet
History / background
4
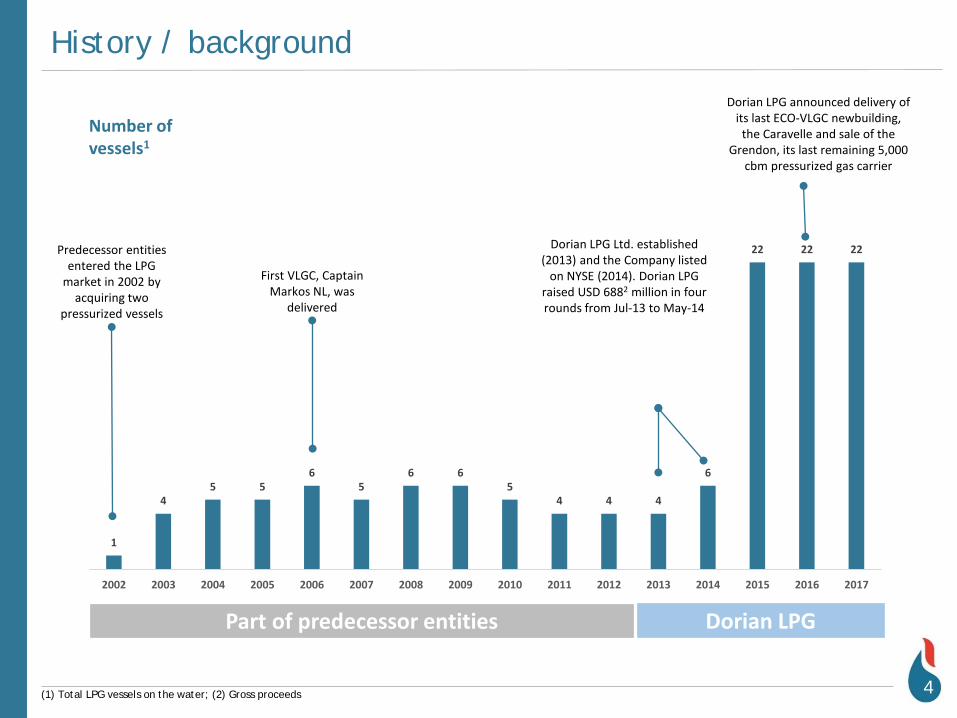
Predecessor entities entered the LPG
market in 2002 by acquiring two
pressurized vessels
Dorian LPG Ltd. established (2013) and the Company listed
on NYSE (2014). Dorian LPG raised USD 6882 million in four rounds from Jul-13 to May-14
Number of vessels1
Dorian LPG announced delivery of its last ECO-VLGC newbuilding,
the Caravelle and sale of the Grendon, its last remaining 5,000
cbm pressurized gas carrier
Part of predecessor entities Dorian LPG
First VLGC, Captain Markos NL, was
delivered
(1) Total LPG vessels on the water; (2) Gross proceeds
1
45 5
65
6 65
4 4 4
6
22 22 22
2002 2003 2004 2005 2006 2007 2008 2009 2010 2011 2012 2013 2014 2015 2016 2017
Experienced management team
5
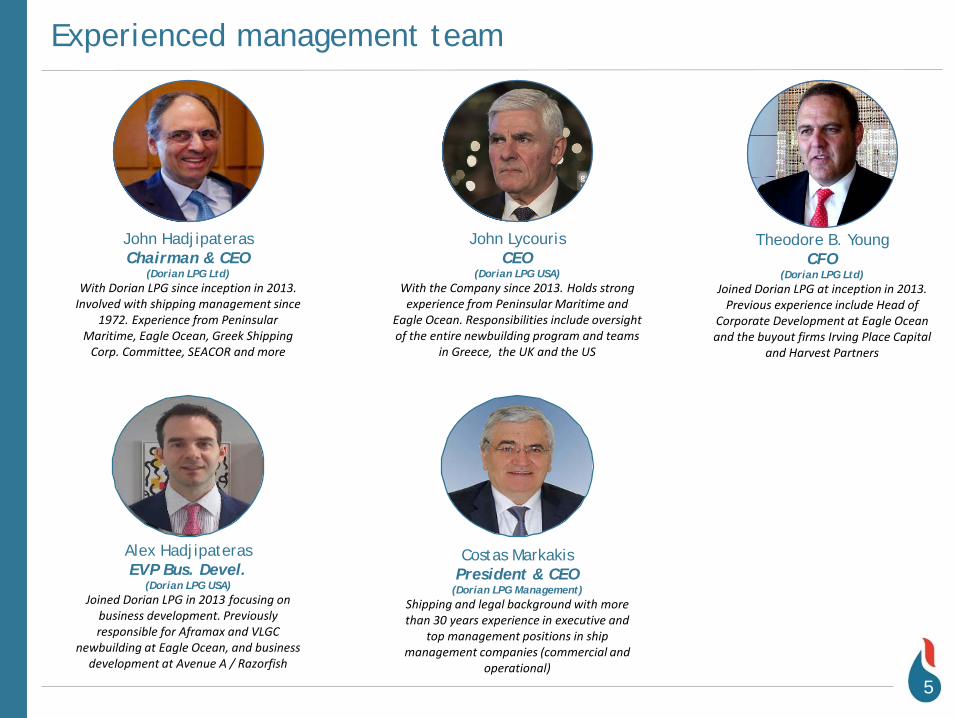
John HadjipaterasChairman & CEO
(Dorian LPG Ltd)With Dorian LPG since inception in 2013.
Involved with shipping management since 1972. Experience from Peninsular
Maritime, Eagle Ocean, Greek Shipping Corp. Committee, SEACOR and more
John LycourisCEO
(Dorian LPG USA)With the Company since 2013. Holds strong
experience from Peninsular Maritime and Eagle Ocean. Responsibilities include oversight of the entire newbuilding program and teams
in Greece, the UK and the US
Costas MarkakisPresident & CEO
(Dorian LPG Management)Shipping and legal background with more than 30 years experience in executive and
top management positions in ship management companies (commercial and
operational)
Theodore B. YoungCFO
(Dorian LPG Ltd)Joined Dorian LPG at inception in 2013.
Previous experience include Head of Corporate Development at Eagle Ocean and the buyout firms Irving Place Capital
and Harvest Partners
Alex HadjipaterasEVP Bus. Devel.
(Dorian LPG USA)Joined Dorian LPG in 2013 focusing on
business development. Previously responsible for Aframax and VLGC
newbuilding at Eagle Ocean, and business development at Avenue A / Razorfish
The Helios LPG Pool
6
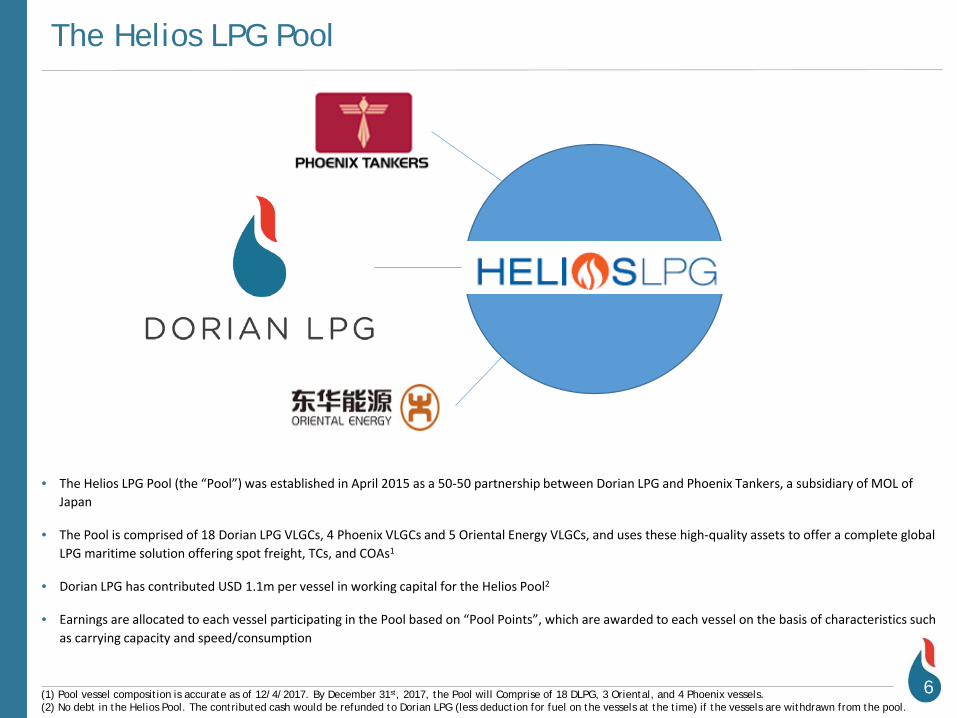
• The Helios LPG Pool (the “Pool”) was established in April 2015 as a 50-50 partnership between Dorian LPG and Phoenix Tankers, a subsidiary of MOL of Japan
• The Pool is comprised of 18 Dorian LPG VLGCs, 4 Phoenix VLGCs and 5 Oriental Energy VLGCs, and uses these high-quality assets to offer a complete global LPG maritime solution offering spot freight, TCs, and COAs1
• Dorian LPG has contributed USD 1.1m per vessel in working capital for the Helios Pool2
• Earnings are allocated to each vessel participating in the Pool based on “Pool Points”, which are awarded to each vessel on the basis of characteristics such as carrying capacity and speed/consumption
(1) Pool vessel composition is accurate as of 12/4/2017. By December 31st, 2017, the Pool will Comprise of 18 DLPG, 3 Oriental, and 4 Phoenix vessels.(2) No debt in the Helios Pool. The contributed cash would be refunded to Dorian LPG (less deduction for fuel on the vessels at the time) if the vessels are withdrawn from the pool.
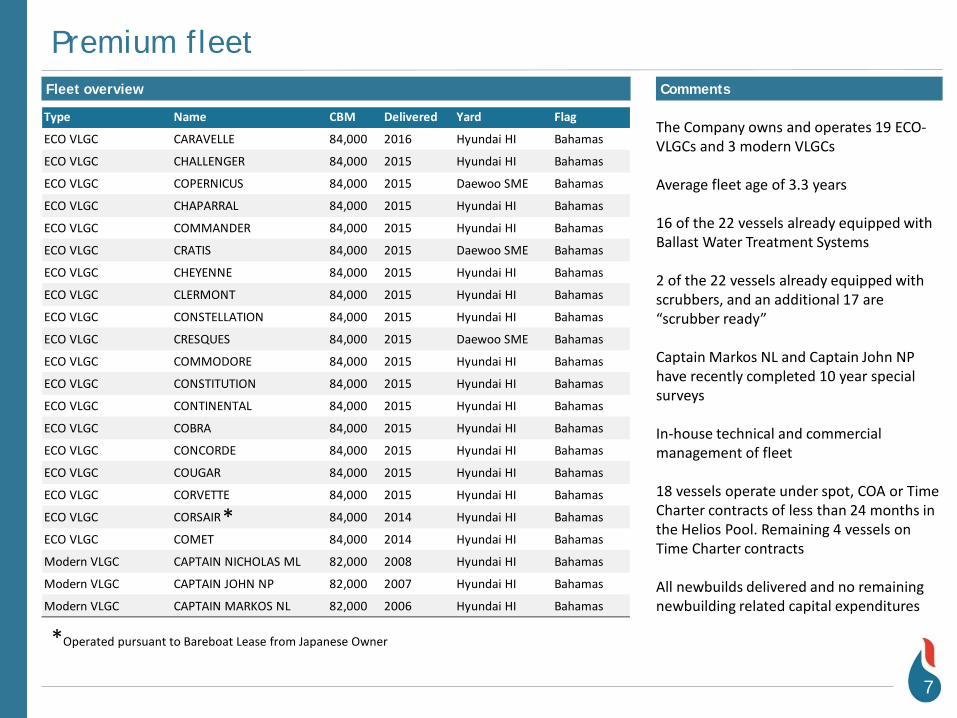
Type Name CBM Delivered Yard Flag
ECO VLGC CARAVELLE 84,000 2016 Hyundai HI Bahamas
ECO VLGC CHALLENGER 84,000 2015 Hyundai HI Bahamas
ECO VLGC COPERNICUS 84,000 2015 Daewoo SME Bahamas
ECO VLGC CHAPARRAL 84,000 2015 Hyundai HI Bahamas
ECO VLGC COMMANDER 84,000 2015 Hyundai HI Bahamas
ECO VLGC CRATIS 84,000 2015 Daewoo SME Bahamas
ECO VLGC CHEYENNE 84,000 2015 Hyundai HI Bahamas
ECO VLGC CLERMONT 84,000 2015 Hyundai HI Bahamas
ECO VLGC CONSTELLATION 84,000 2015 Hyundai HI Bahamas
ECO VLGC CRESQUES 84,000 2015 Daewoo SME Bahamas
ECO VLGC COMMODORE 84,000 2015 Hyundai HI Bahamas
ECO VLGC CONSTITUTION 84,000 2015 Hyundai HI Bahamas
ECO VLGC CONTINENTAL 84,000 2015 Hyundai HI Bahamas
ECO VLGC COBRA 84,000 2015 Hyundai HI Bahamas
ECO VLGC CONCORDE 84,000 2015 Hyundai HI Bahamas
ECO VLGC COUGAR 84,000 2015 Hyundai HI Bahamas
ECO VLGC CORVETTE 84,000 2015 Hyundai HI Bahamas
ECO VLGC CORSAIR 84,000 2014 Hyundai HI Bahamas
ECO VLGC COMET 84,000 2014 Hyundai HI Bahamas
Modern VLGC CAPTAIN NICHOLAS ML 82,000 2008 Hyundai HI Bahamas
Modern VLGC CAPTAIN JOHN NP 82,000 2007 Hyundai HI Bahamas
Modern VLGC CAPTAIN MARKOS NL 82,000 2006 Hyundai HI Bahamas
Premium fleet
7
Fleet overview Comments
The Company owns and operates 19 ECO-VLGCs and 3 modern VLGCs
Average fleet age of 3.3 years
16 of the 22 vessels already equipped with Ballast Water Treatment Systems
2 of the 22 vessels already equipped with scrubbers, and an additional 17 are “scrubber ready”
Captain Markos NL and Captain John NP have recently completed 10 year special surveys
In-house technical and commercial management of fleet
18 vessels operate under spot, COA or Time Charter contracts of less than 24 months in the Helios Pool. Remaining 4 vessels on Time Charter contracts
All newbuilds delivered and no remaining newbuilding related capital expenditures
*
*Operated pursuant to Bareboat Lease from Japanese Owner
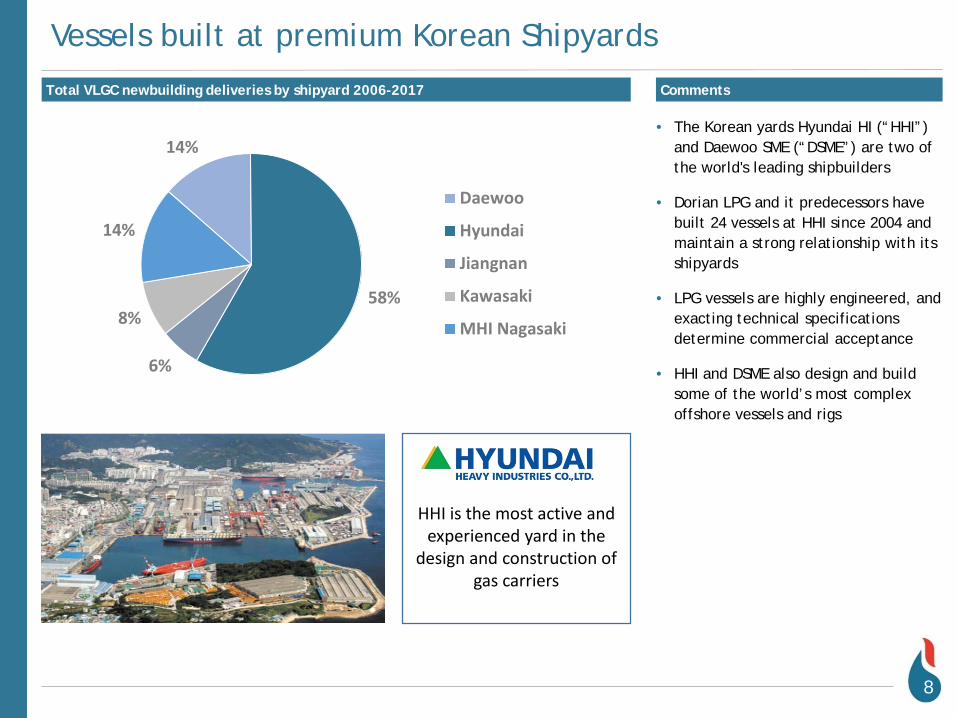
14%
58%
6%
8%
14%
Daewoo
Hyundai
Jiangnan
Kawasaki
MHI Nagasaki
Vessels built at premium Korean Shipyards
8
Total VLGC newbuilding deliveries by shipyard 2006-2017 Comments
• The Korean yards Hyundai HI (“HHI”) and Daewoo SME (“DSME”) are two of the world's leading shipbuilders
• Dorian LPG and it predecessors have built 24 vessels at HHI since 2004 and maintain a strong relationship with its shipyards
• LPG vessels are highly engineered, and exacting technical specifications determine commercial acceptance
• HHI and DSME also design and build some of the world’s most complex offshore vessels and rigs
HHI is the most active and experienced yard in the
design and construction of gas carriers
LPG Fundamentals
9
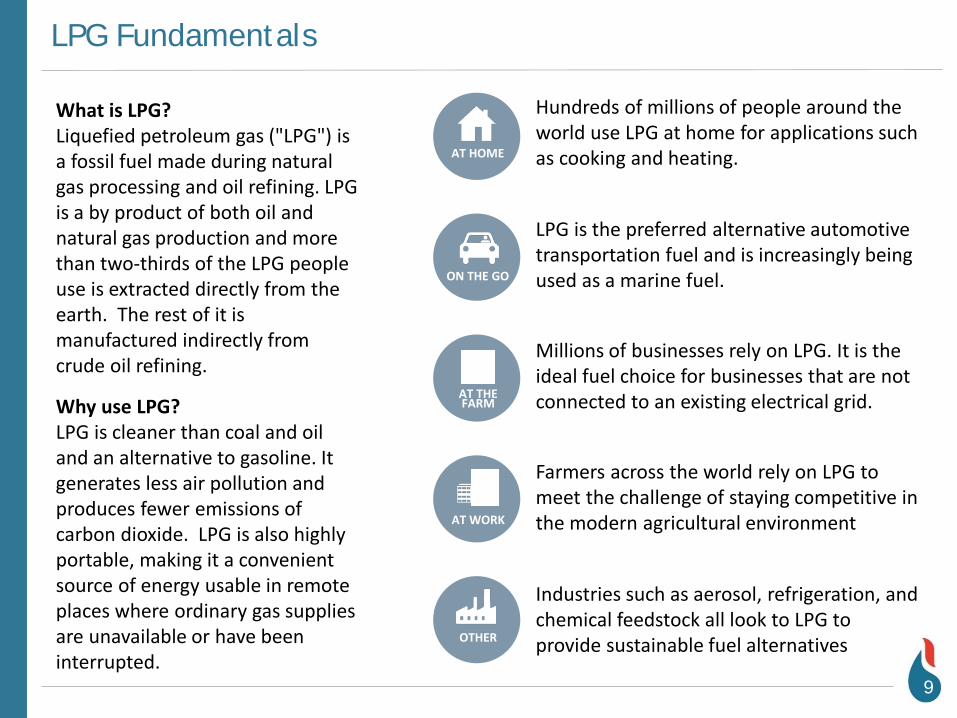
Hundreds of millions of people around the world use LPG at home for applications such as cooking and heating.
LPG is the preferred alternative automotive transportation fuel and is increasingly being used as a marine fuel.
Millions of businesses rely on LPG. It is the ideal fuel choice for businesses that are not connected to an existing electrical grid.
Farmers across the world rely on LPG to meet the challenge of staying competitive in the modern agricultural environment
Industries such as aerosol, refrigeration, and chemical feedstock all look to LPG to provide sustainable fuel alternatives
What is LPG?Liquefied petroleum gas ("LPG") is a fossil fuel made during natural gas processing and oil refining. LPG is a by product of both oil and natural gas production and more than two-thirds of the LPG people use is extracted directly from the earth. The rest of it is manufactured indirectly from crude oil refining.
Why use LPG?LPG is cleaner than coal and oil and an alternative to gasoline. It generates less air pollution and produces fewer emissions of carbon dioxide. LPG is also highly portable, making it a convenient source of energy usable in remote places where ordinary gas supplies are unavailable or have been interrupted.
AT HOME
ON THE GO
AT THEFARM
AT WORK
OTHER
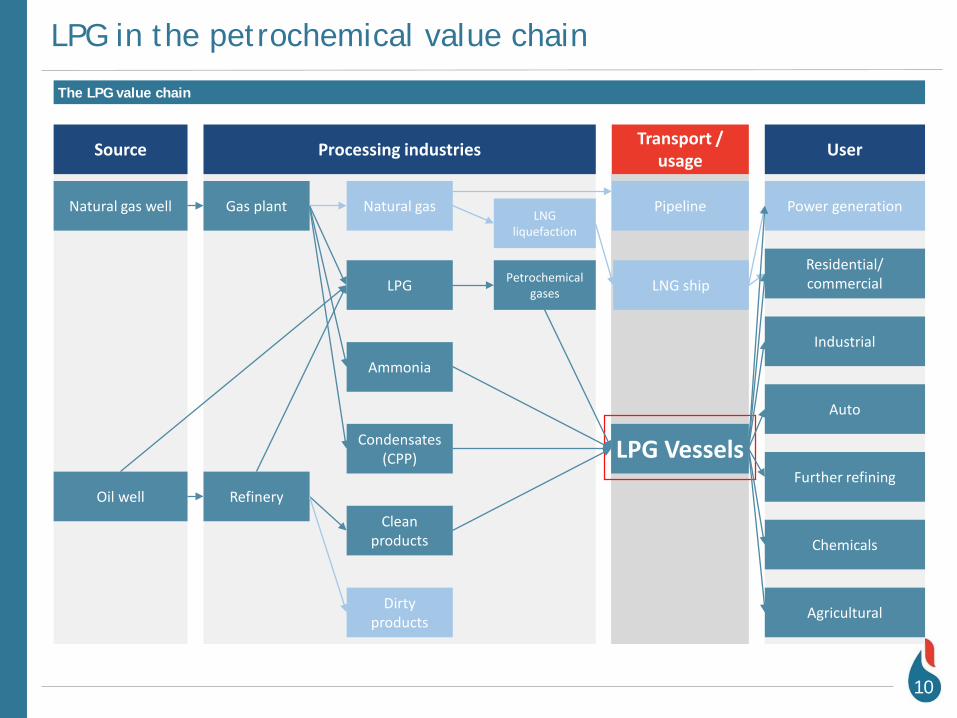
LPG in the petrochemical value chain
10
The LPG value chain
Source Processing industries Transport / usage User
Natural gas well
Oil well
Gas plant Natural gasLNG
liquefaction
Refinery
LPG
Ammonia
Condensates (CPP)
Clean products
Dirty products
Petrochemical gases
Pipeline
LNG ship
LPG Vessels
Power generation
Residential/commercial
Industrial
Auto
Further refining
Chemicals
Agricultural
LPG Supply and Export Dynamics
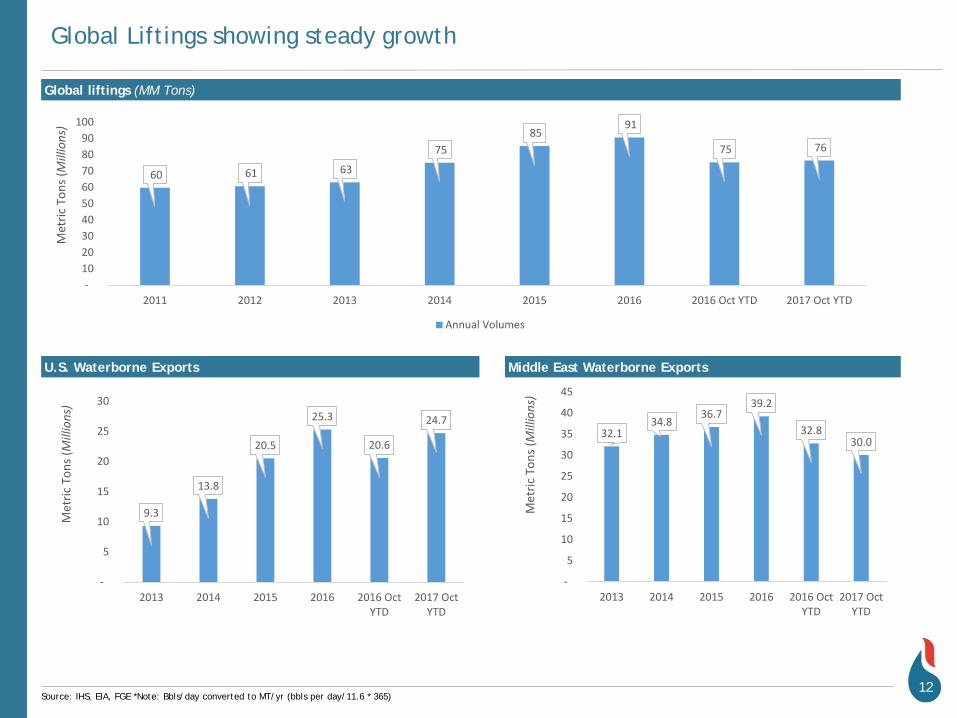
Global Liftings showing steady growth
Global liftings (MM Tons)
12Source: IHS, EIA, FGE *Note: Bbls/day converted to MT/yr (bbls per day/11.6 * 365)
U.S. Waterborne Exports Middle East Waterborne Exports
9.3
13.8
20.5
25.3
20.6
24.7
-
5
10
15
20
25
30
2013 2014 2015 2016 2016 OctYTD
2017 OctYTD
Met
ric T
ons (
Mill
ions
)
32.134.8
36.739.2
32.830.0
-
5
10
15
20
25
30
35
40
45
2013 2014 2015 2016 2016 OctYTD
2017 OctYTD
Met
ric T
ons (
Mill
ions
)
60 61 63
75 85
91
75 76
- 10 20 30 40 50 60 70 80 90
100
2011 2012 2013 2014 2015 2016 2016 Oct YTD 2017 Oct YTD
Met
ric T
ons (
Mill
ions
)
Annual Volumes
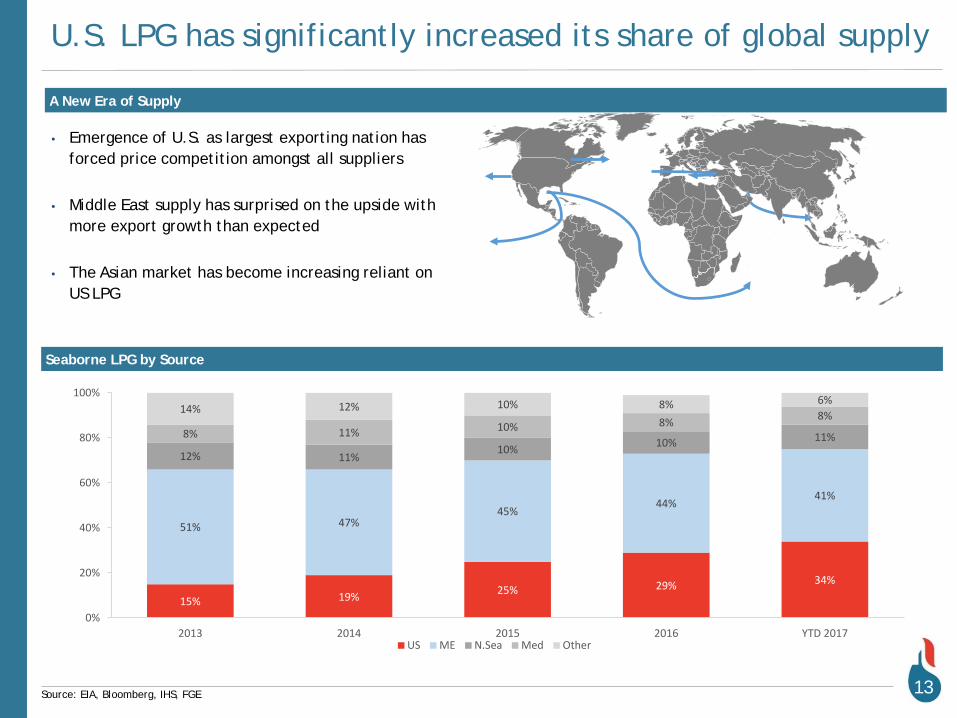
U.S. LPG has significantly increased its share of global supply
Source: EIA, Bloomberg, IHS, FGE
A New Era of Supply
13
• Emergence of U.S. as largest exporting nation has forced price competition amongst all suppliers
• Middle East supply has surprised on the upside with more export growth than expected
• The Asian market has become increasing reliant on US LPG
Seaborne LPG by Source
15% 19% 25% 29% 34%
51% 47%45%
44%41%
12% 11%10% 10% 11%8% 11% 10% 8% 8%14% 12% 10% 8% 6%
0%
20%
40%
60%
80%
100%
2013 2014 2015 2016 YTD 2017US ME N.Sea Med Other
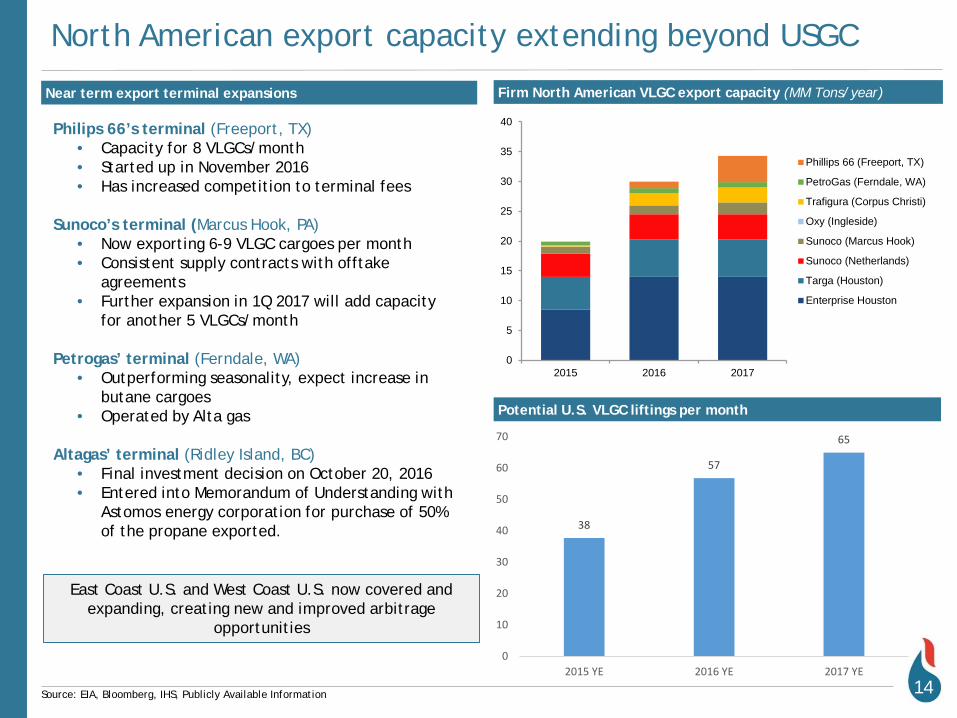
North American export capacity extending beyond USGC
Firm North American VLGC export capacity (MM Tons/year)
East Coast U.S. and West Coast U.S. now covered and expanding, creating new and improved arbitrage
opportunities
Philips 66’s terminal (Freeport, TX) • Capacity for 8 VLGCs/month• Started up in November 2016• Has increased competition to terminal fees
Sunoco’s terminal (Marcus Hook, PA)• Now exporting 6-9 VLGC cargoes per month• Consistent supply contracts with offtake
agreements• Further expansion in 1Q 2017 will add capacity
for another 5 VLGCs/month
Petrogas’ terminal (Ferndale, WA)• Outperforming seasonality, expect increase in
butane cargoes• Operated by Alta gas
Altagas’ terminal (Ridley Island, BC)• Final investment decision on October 20, 2016• Entered into Memorandum of Understanding with
Astomos energy corporation for purchase of 50% of the propane exported.
14Source: EIA, Bloomberg, IHS, Publicly Available Information
Near term export terminal expansions
38
57
65
0
10
20
30
40
50
60
70
2015 YE 2016 YE 2017 YE
Potential U.S. VLGC liftings per month
0
5
10
15
20
25
30
35
40
2015 2016 2017
Phillips 66 (Freeport, TX)
PetroGas (Ferndale, WA)
Trafigura (Corpus Christi)
Oxy (Ingleside)
Sunoco (Marcus Hook)
Sunoco (Netherlands)
Targa (Houston)
Enterprise Houston
15
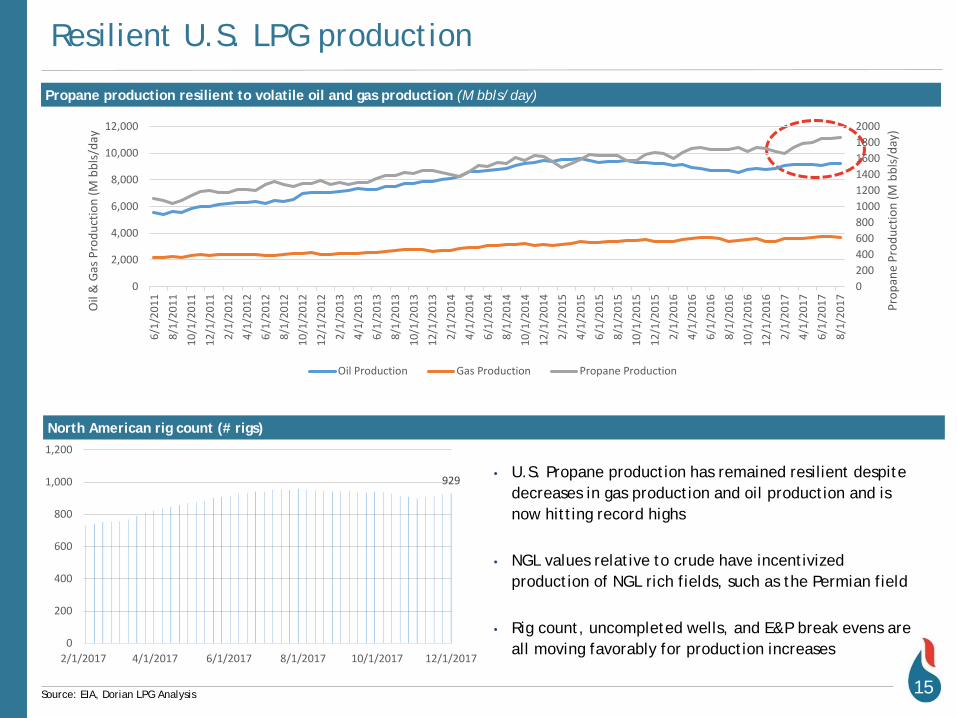
Propane production resilient to volatile oil and gas production (M bbls/day)
Source: EIA, Dorian LPG Analysis
• U.S. Propane production has remained resilient despite decreases in gas production and oil production and is now hitting record highs
• NGL values relative to crude have incentivized production of NGL rich fields, such as the Permian field
• Rig count, uncompleted wells, and E&P break evens are all moving favorably for production increases
Resilient U.S. LPG production
North American rig count (# rigs)
0200400600800100012001400160018002000
0
2,000
4,000
6,000
8,000
10,000
12,000
6/1/
2011
8/1/
2011
10/1
/201
112
/1/2
011
2/1/
2012
4/1/
2012
6/1/
2012
8/1/
2012
10/1
/201
212
/1/2
012
2/1/
2013
4/1/
2013
6/1/
2013
8/1/
2013
10/1
/201
312
/1/2
013
2/1/
2014
4/1/
2014
6/1/
2014
8/1/
2014
10/1
/201
412
/1/2
014
2/1/
2015
4/1/
2015
6/1/
2015
8/1/
2015
10/1
/201
512
/1/2
015
2/1/
2016
4/1/
2016
6/1/
2016
8/1/
2016
10/1
/201
612
/1/2
016
2/1/
2017
4/1/
2017
6/1/
2017
8/1/
2017 Pr
opan
e Pr
oduc
tion
(M b
bls/
day)
Oil
& G
as P
rodu
ctio
n (M
bbl
s/da
y
Oil Production Gas Production Propane Production
929
0
200
400
600
800
1,000
1,200
2/1/2017 4/1/2017 6/1/2017 8/1/2017 10/1/2017 12/1/2017
LPG Demand & Consumption
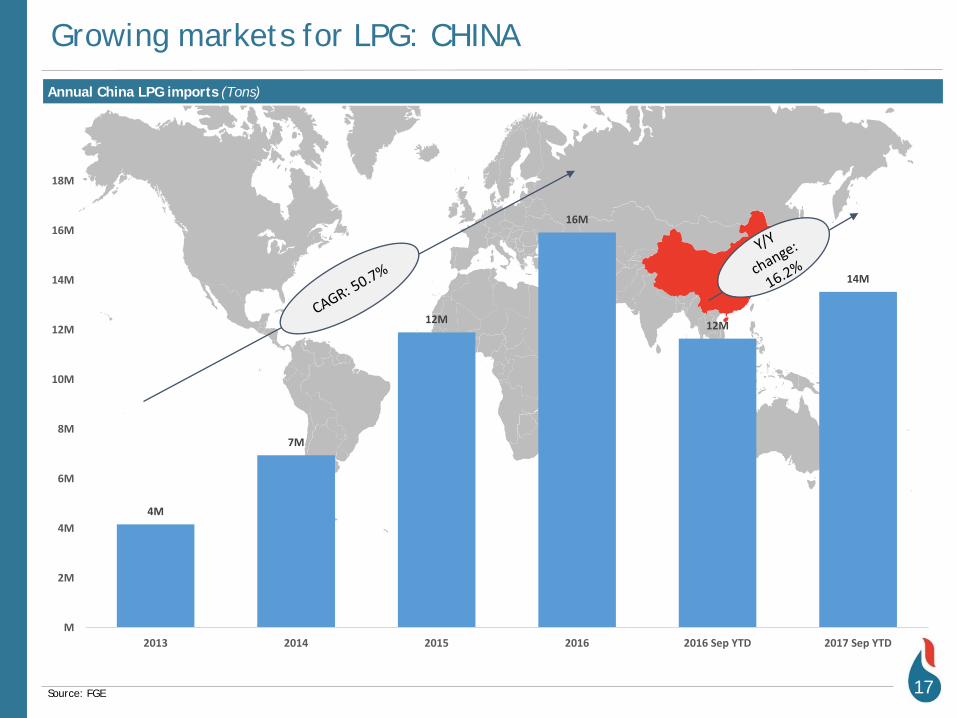
Growing markets for LPG: CHINA
• will be used as
primary fuel source
Annual China LPG imports (Tons)
17Source: FGE
4M
7M
12M
16M
12M
14M
M
2M
4M
6M
8M
10M
12M
14M
16M
18M
2013 2014 2015 2016 2016 Sep YTD 2017 Sep YTD
China LPG demand by sector (MM Tons)
Chinese demand expanding far beyond PDH
18Source: FGE, Platts
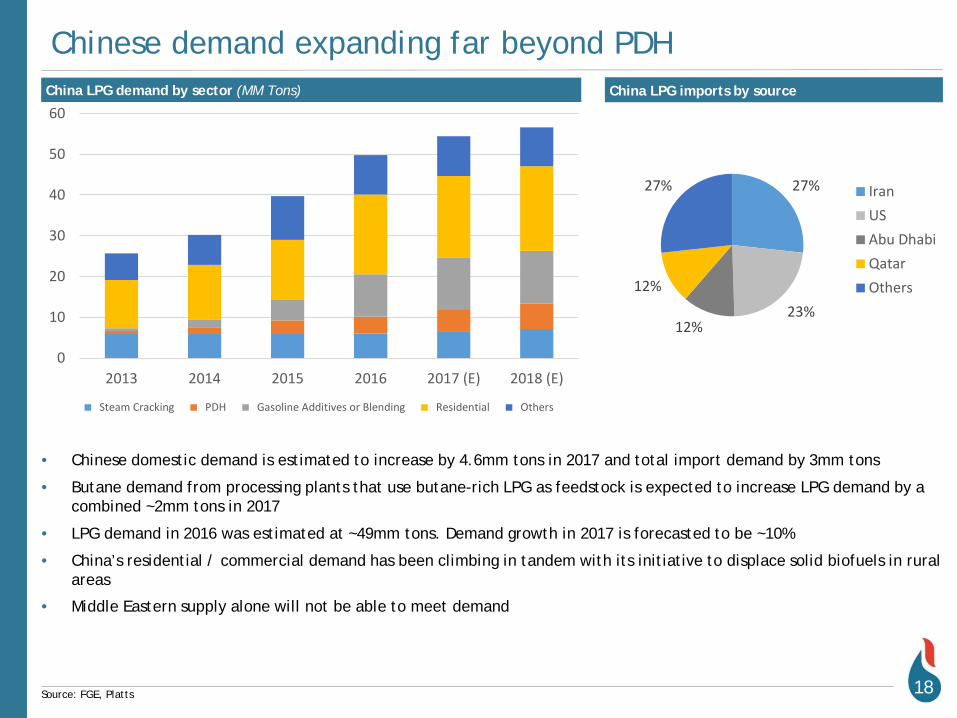
• Chinese domestic demand is estimated to increase by 4.6mm tons in 2017 and total import demand by 3mm tons
• Butane demand from processing plants that use butane-rich LPG as feedstock is expected to increase LPG demand by a combined ~2mm tons in 2017
• LPG demand in 2016 was estimated at ~49mm tons. Demand growth in 2017 is forecasted to be ~10%
• China’s residential / commercial demand has been climbing in tandem with its initiative to displace solid biofuels in rural areas
• Middle Eastern supply alone will not be able to meet demand
27%
23%12%
12%
27% IranUSAbu DhabiQatarOthers
China LPG imports by source
0
10
20
30
40
50
60
2013 2014 2015 2016 2017 (E) 2018 (E)
Steam Cracking PDH Gasoline Additives or Blending Residential Others
Global PDH & Petchems also fueling demand
19
Illustrative increase from Korean PDH Plant
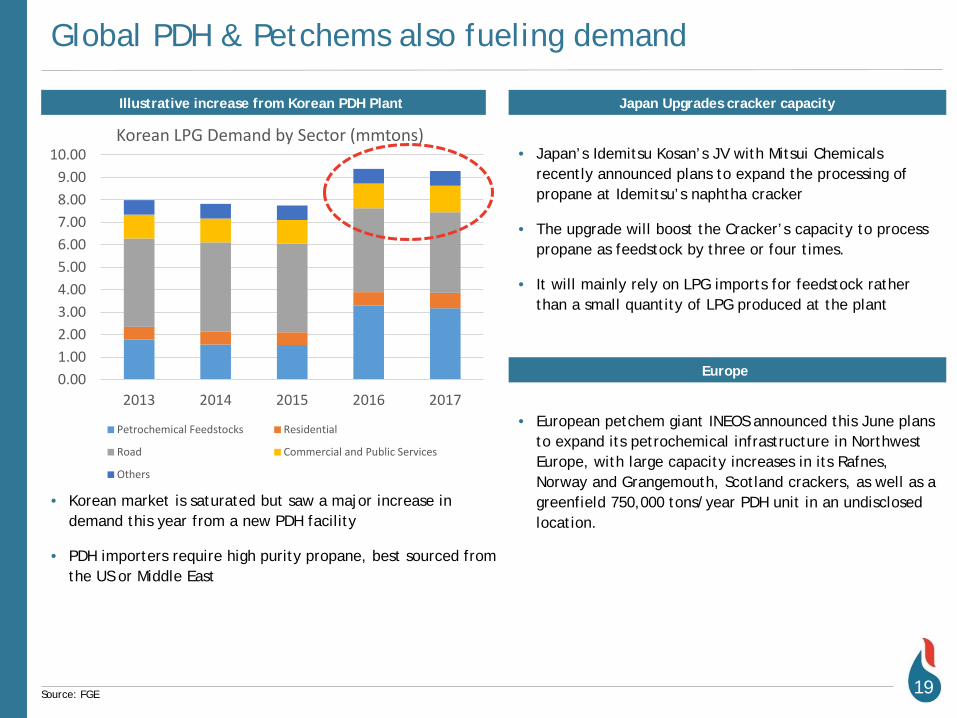
• Korean market is saturated but saw a major increase in demand this year from a new PDH facility
• PDH importers require high purity propane, best sourced from the US or Middle East
Japan Upgrades cracker capacity
• Japan’s Idemitsu Kosan’s JV with Mitsui Chemicals recently announced plans to expand the processing of propane at Idemitsu’s naphtha cracker
• The upgrade will boost the Cracker’s capacity to process propane as feedstock by three or four times.
• It will mainly rely on LPG imports for feedstock rather than a small quantity of LPG produced at the plant
0.001.002.003.004.005.006.007.008.009.00
10.00
2013 2014 2015 2016 2017
Korean LPG Demand by Sector (mmtons)
Petrochemical Feedstocks Residential
Road Commercial and Public Services
Others
Source: FGE
Europe
• European petchem giant INEOS announced this June plans to expand its petrochemical infrastructure in Northwest Europe, with large capacity increases in its Rafnes, Norway and Grangemouth, Scotland crackers, as well as a greenfield 750,000 tons/year PDH unit in an undisclosed location.
“The year of the LPG consumer”: INDIA
• Power conversion
project with Vitol
• By April, LPG will be
used as primary fuel
source
India LPG import forecast (Million MT)
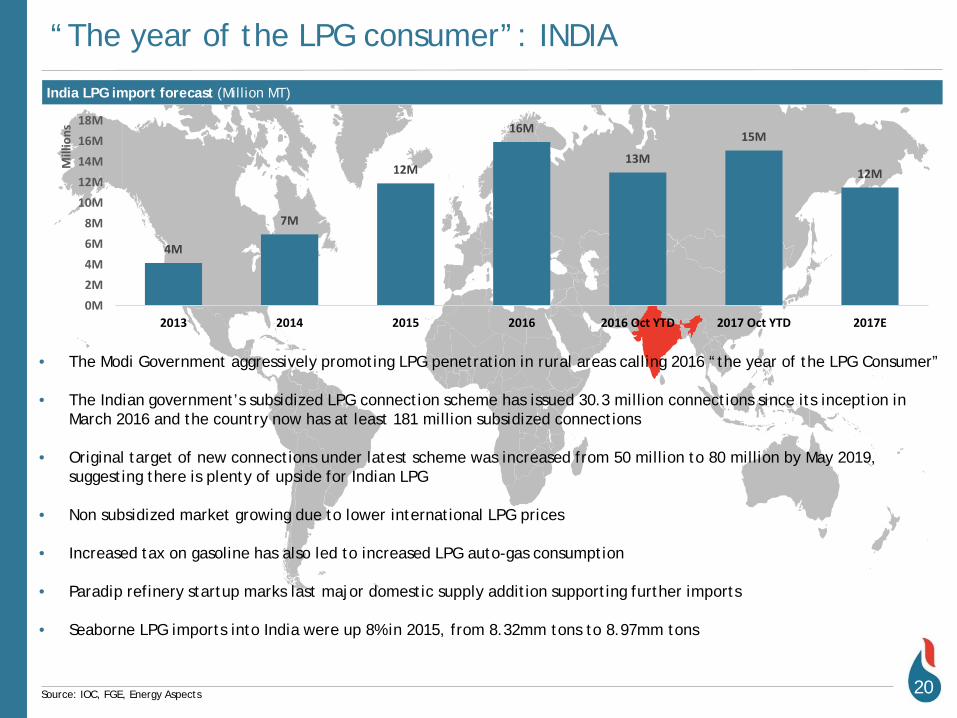
• The Modi Government aggressively promoting LPG penetration in rural areas calling 2016 “the year of the LPG Consumer”
• The Indian government’s subsidized LPG connection scheme has issued 30.3 million connections since its inception in March 2016 and the country now has at least 181 million subsidized connections
• Original target of new connections under latest scheme was increased from 50 million to 80 million by May 2019, suggesting there is plenty of upside for Indian LPG
• Non subsidized market growing due to lower international LPG prices
• Increased tax on gasoline has also led to increased LPG auto-gas consumption
• Paradip refinery startup marks last major domestic supply addition supporting further imports
• Seaborne LPG imports into India were up 8% in 2015, from 8.32mm tons to 8.97mm tons
20Source: IOC, FGE, Energy Aspects
4M
7M
12M
16M
13M
15M
12M
0M2M4M6M8M
10M12M14M16M18M
2013 2014 2015 2016 2016 Oct YTD 2017 Oct YTD 2017E
Mill
ions
0
2
4
6
8
10
12
14
2013 2014 2015 2016 2017 2018 2019 2020 2021 2022 2023 2024 2025
Industry Commercial and Public Services Residential
Indonesia emerging as a major demand center
21Source: FGE
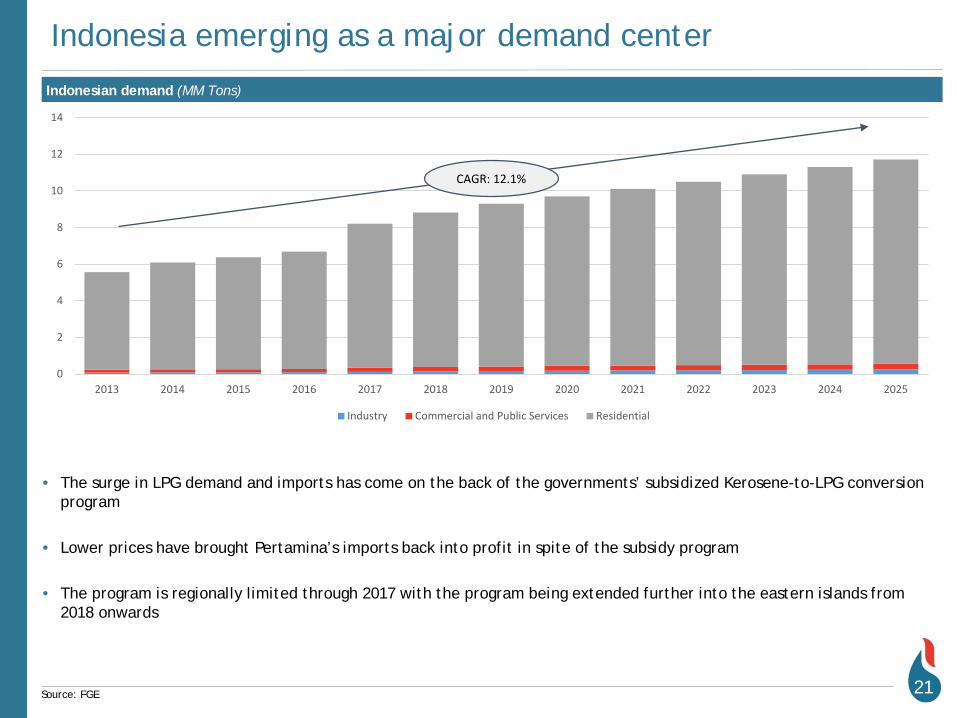
• The surge in LPG demand and imports has come on the back of the governments’ subsidized Kerosene-to-LPG conversion program
• Lower prices have brought Pertamina’s imports back into profit in spite of the subsidy program
• The program is regionally limited through 2017 with the program being extended further into the eastern islands from 2018 onwards
Indonesian demand (MM Tons)
CAGR: 12.1%
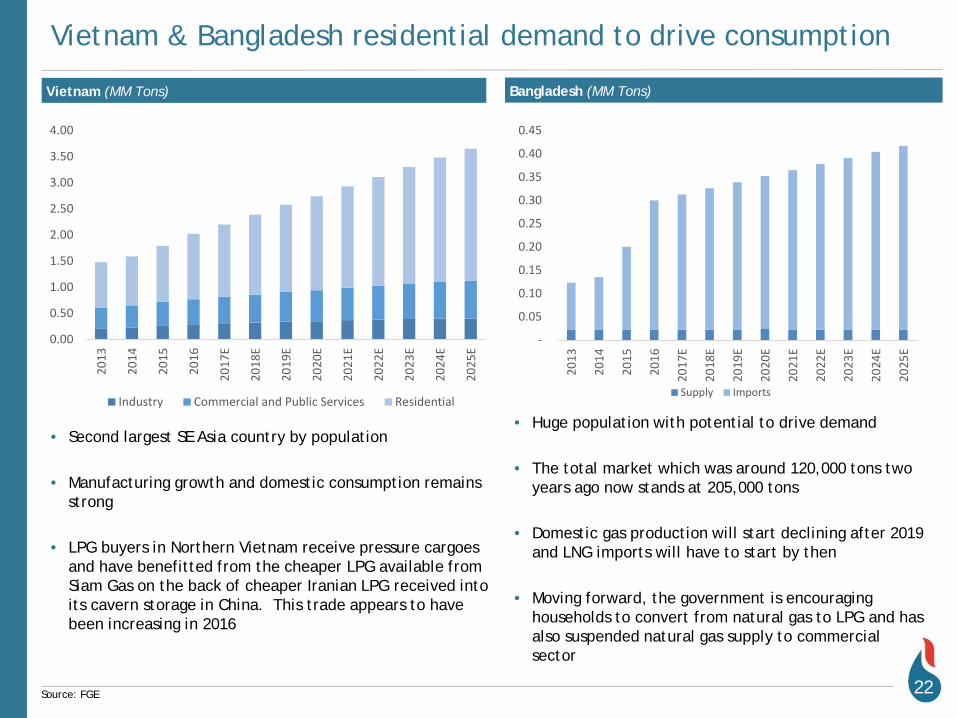
Vietnam & Bangladesh residential demand to drive consumption
22Source: FGE
• Second largest SE Asia country by population
• Manufacturing growth and domestic consumption remains strong
• LPG buyers in Northern Vietnam receive pressure cargoes and have benefitted from the cheaper LPG available from Siam Gas on the back of cheaper Iranian LPG received into its cavern storage in China. This trade appears to have been increasing in 2016
0.00
0.50
1.00
1.50
2.00
2.50
3.00
3.50
4.00
2013
2014
2015
2016
2017
E
2018
E
2019
E
2020
E
2021
E
2022
E
2023
E
2024
E
2025
E
Industry Commercial and Public Services Residential
• Huge population with potential to drive demand
• The total market which was around 120,000 tons two years ago now stands at 205,000 tons
• Domestic gas production will start declining after 2019 and LNG imports will have to start by then
• Moving forward, the government is encouraging households to convert from natural gas to LPG and has also suspended natural gas supply to commercial sector
-
0.05
0.10
0.15
0.20
0.25
0.30
0.35
0.40
0.45
2013
2014
2015
2016
2017
E
2018
E
2019
E
2020
E
2021
E
2022
E
2023
E
2024
E
2025
E
Supply Imports
Vietnam (MM Tons) Bangladesh (MM Tons)
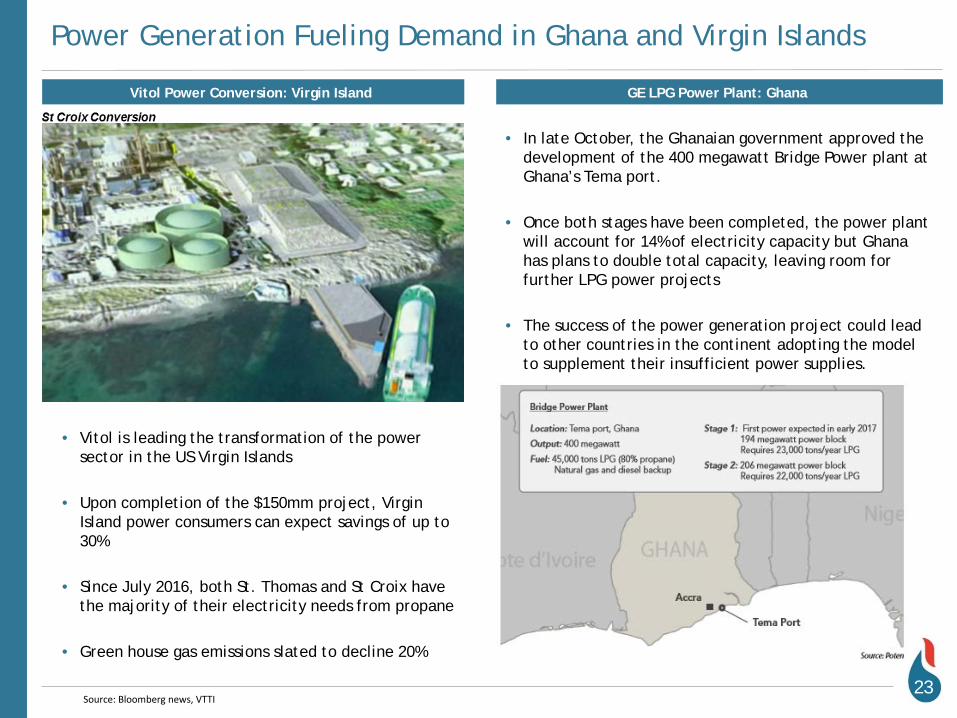
Power Generation Fueling Demand in Ghana and Virgin Islands
23
Vitol Power Conversion: Virgin Island GE LPG Power Plant: Ghana
• In late October, the Ghanaian government approved the development of the 400 megawatt Bridge Power plant at Ghana’s Tema port.
• Once both stages have been completed, the power plant will account for 14% of electricity capacity but Ghana has plans to double total capacity, leaving room for further LPG power projects
• The success of the power generation project could lead to other countries in the continent adopting the model to supplement their insufficient power supplies.
• Vitol is leading the transformation of the power sector in the US Virgin Islands
• Upon completion of the $150mm project, Virgin Island power consumers can expect savings of up to 30%
• Since July 2016, both St. Thomas and St Croix have the majority of their electricity needs from propane
• Green house gas emissions slated to decline 20%
Source: Bloomberg news, VTTI
24
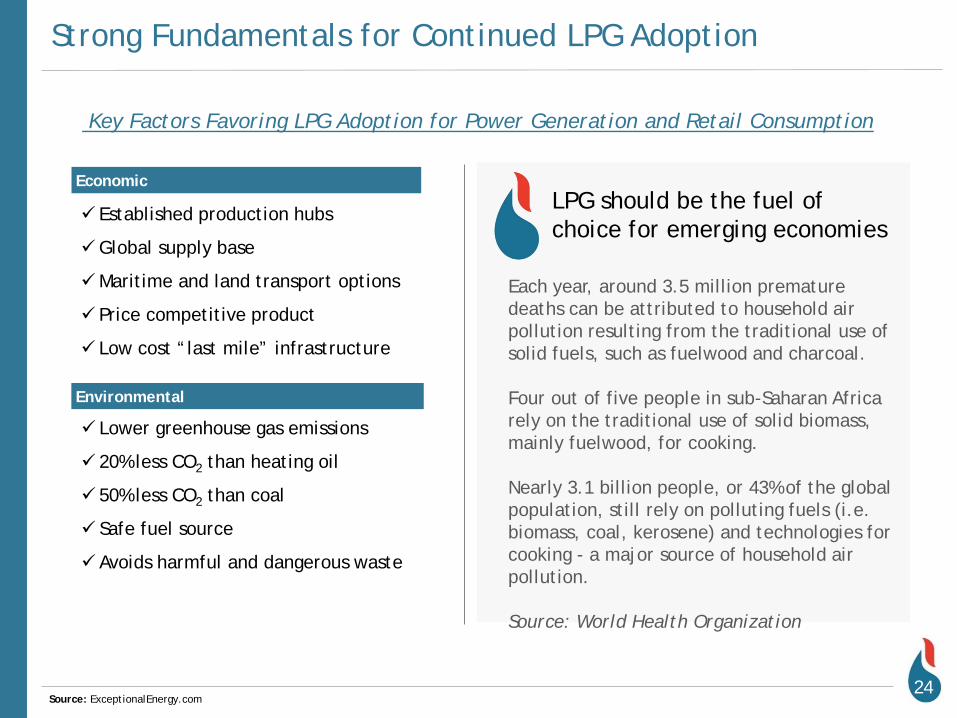
Established production hubs
Global supply base
Maritime and land transport options
Price competitive product
Low cost “last mile” infrastructure
Lower greenhouse gas emissions
20% less CO2 than heating oil
50% less CO2 than coal
Safe fuel source
Avoids harmful and dangerous waste
LPG should be the fuel of choice for emerging economies
Source: ExceptionalEnergy.com
Key Factors Favoring LPG Adoption for Power Generation and Retail Consumption
Strong Fundamentals for Continued LPG Adoption
Each year, around 3.5 million premature deaths can be attributed to household air pollution resulting from the traditional use of solid fuels, such as fuelwood and charcoal.
Four out of five people in sub-Saharan Africa rely on the traditional use of solid biomass, mainly fuelwood, for cooking.
Nearly 3.1 billion people, or 43% of the global population, still rely on polluting fuels (i.e. biomass, coal, kerosene) and technologies for cooking - a major source of household air pollution.
Source: World Health Organization
Economic
Environmental

VLGC Shipping Market Dynamics
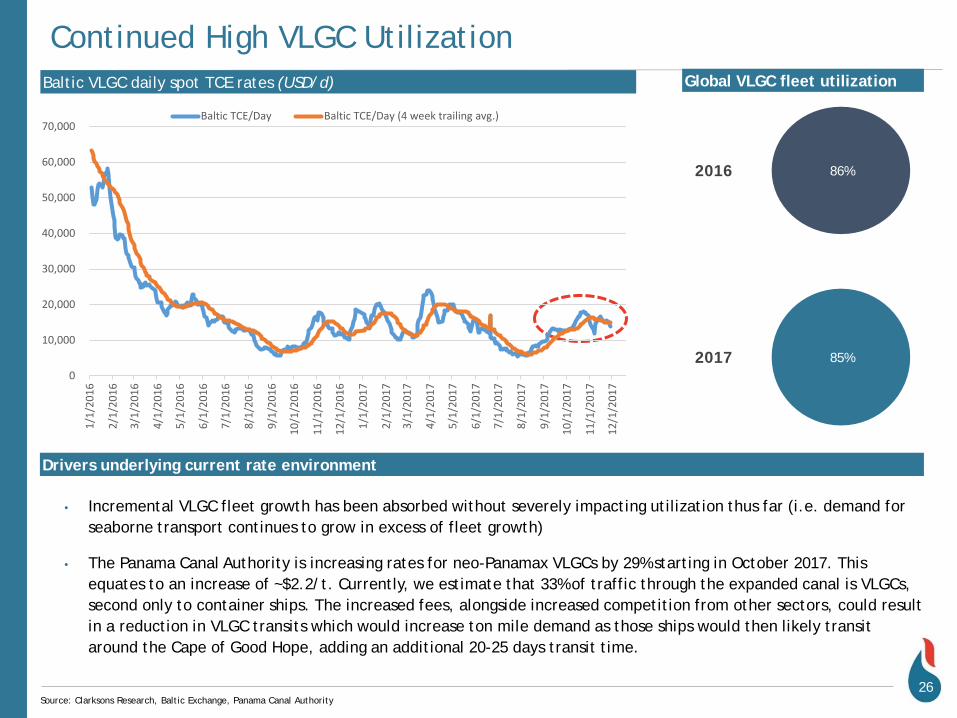
Continued High VLGC Utilization
Drivers underlying current rate environment
26Source: Clarksons Research, Baltic Exchange, Panama Canal Authority
Baltic VLGC daily spot TCE rates (USD/d) Global VLGC fleet utilization
86%
85%
2016
2017
• Incremental VLGC fleet growth has been absorbed without severely impacting utilization thus far (i.e. demand for seaborne transport continues to grow in excess of fleet growth)
• The Panama Canal Authority is increasing rates for neo-Panamax VLGCs by 29% starting in October 2017. This equates to an increase of ~$2.2/t. Currently, we estimate that 33% of traffic through the expanded canal is VLGCs, second only to container ships. The increased fees, alongside increased competition from other sectors, could result in a reduction in VLGC transits which would increase ton mile demand as those ships would then likely transit around the Cape of Good Hope, adding an additional 20-25 days transit time.
0
10,000
20,000
30,000
40,000
50,000
60,000
70,000
1/1/
2016
2/1/
2016
3/1/
2016
4/1/
2016
5/1/
2016
6/1/
2016
7/1/
2016
8/1/
2016
9/1/
2016
10/1
/201
6
11/1
/201
6
12/1
/201
6
1/1/
2017
2/1/
2017
3/1/
2017
4/1/
2017
5/1/
2017
6/1/
2017
7/1/
2017
8/1/
2017
9/1/
2017
10/1
/201
7
11/1
/201
7
12/1
/201
7
Baltic TCE/Day Baltic TCE/Day (4 week trailing avg.)
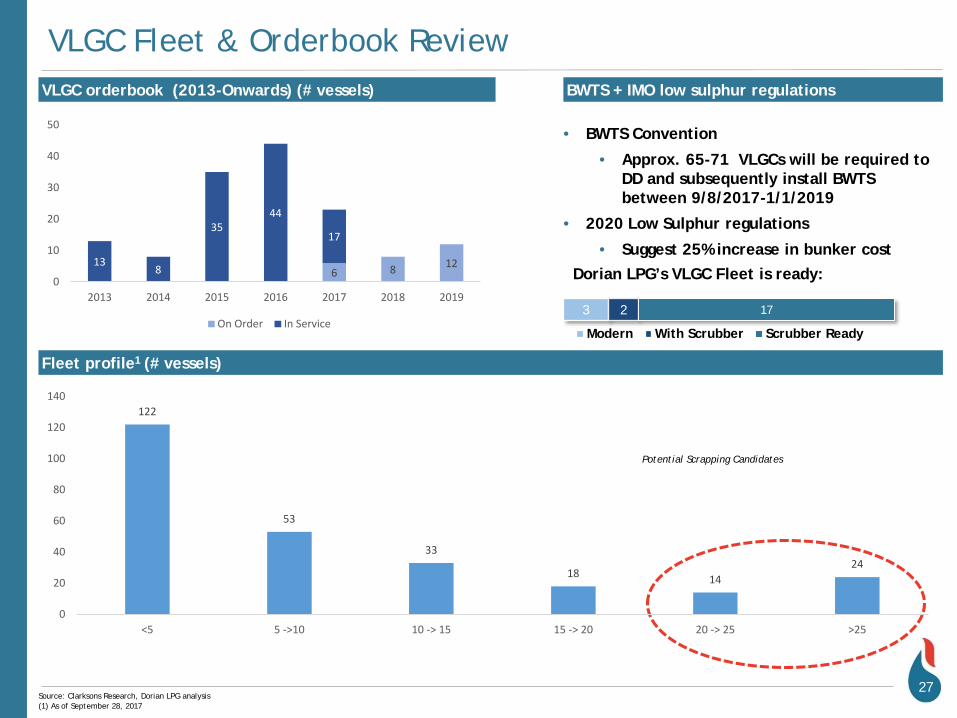
VLGC Fleet & Orderbook ReviewVLGC orderbook (2013-Onwards) (# vessels)
27Source: Clarksons Research, Dorian LPG analysis
Fleet profile1 (# vessels)
3 2 17
Modern With Scrubber Scrubber Ready
BWTS + IMO low sulphur regulations
• BWTS Convention
• Approx. 65-71 VLGCs will be required to DD and subsequently install BWTS between 9/8/2017-1/1/2019
• 2020 Low Sulphur regulations
• Suggest 25% increase in bunker costDorian LPG’s VLGC Fleet is ready:
Potential Scrapping Candidates
122
53
33
18 1424
0
20
40
60
80
100
120
140
<5 5 ->10 10 -> 15 15 -> 20 20 -> 25 >25
6 8 12138
3544
17
0
10
20
30
40
50
2013 2014 2015 2016 2017 2018 2019
On Order In Service
(1) As of September 28, 2017

Financials
Recent Financing Developments: Continuing to Enhance Balance Sheet Flexibility
29
• On May 31, 2017, Dorian LPG announced an agreement with its lenders under its $758 million facility to relax certain covenants of the 2015 Debt Facility and have also agreed to release $26.8 million of restricted cash to be applied towards future debt repayments, interest and certain fees.
• On June 7, 2017, the Company announced that it repaid its RBS debt facility at 96% of the then outstanding principal amount with a new $97 million bridge loan facility from DNB. As part of the refinancing, $6 million of cash previously restricted was released and used as unrestricted cash.
• On August 25, 2017, the Company announced that it had filed to issue up to $40 million of equity pursuant to an “at the market” (“ATM”) offering.
• On November 7, 2017, the Company refinanced a three-year-old VLGC, the Corsair, pursuant to a memorandum of agreement and a bareboat charter agreement that valued the vessel at $65 million. We will bareboat charter the vessel back for a period of 12 years, with purchase options from the 2nd
anniversary of the transaction. The underlying interest rate is 4.9% and the underlying amortization profile is 16 years. The cash refinancing proceeds of $52.0 million were used to repay $30.1 million of the 2017 Bridge Loan’s then outstanding principal amount.
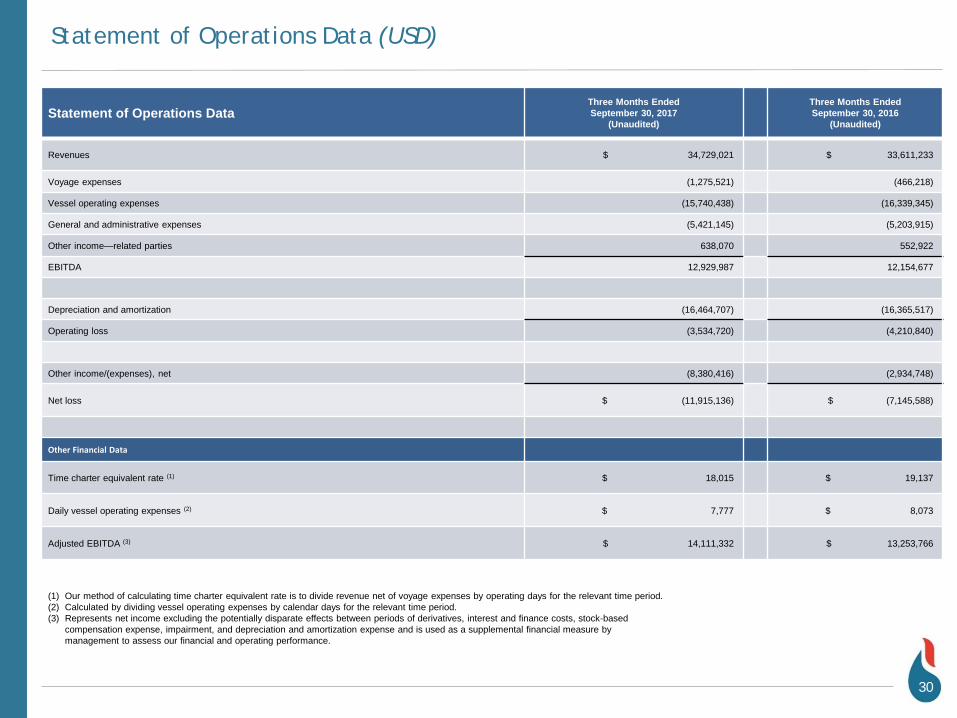
Statement of Operations Data (USD)
Statement of Operations DataThree Months Ended September 30, 2017
(Unaudited)
Three Months Ended September 30, 2016
(Unaudited)
Revenues $ 34,729,021 $ 33,611,233
Voyage expenses (1,275,521) (466,218)
Vessel operating expenses (15,740,438) (16,339,345)
General and administrative expenses (5,421,145) (5,203,915)
Other income—related parties 638,070 552,922
EBITDA 12,929,987 12,154,677
Depreciation and amortization (16,464,707) (16,365,517)
Operating loss (3,534,720) (4,210,840)
Other income/(expenses), net (8,380,416) (2,934,748)
Net loss $ (11,915,136) $ (7,145,588)
Other Financial Data
Time charter equivalent rate (1) $ 18,015 $ 19,137
Daily vessel operating expenses (2) $ 7,777 $ 8,073
Adjusted EBITDA (3) $ 14,111,332 $ 13,253,766
(1) Our method of calculating time charter equivalent rate is to divide revenue net of voyage expenses by operating days for the relevant time period.(2) Calculated by dividing vessel operating expenses by calendar days for the relevant time period.(3) Represents net income excluding the potentially disparate effects between periods of derivatives, interest and finance costs, stock-based
compensation expense, impairment, and depreciation and amortization expense and is used as a supplemental financial measure by management to assess our financial and operating performance.
30
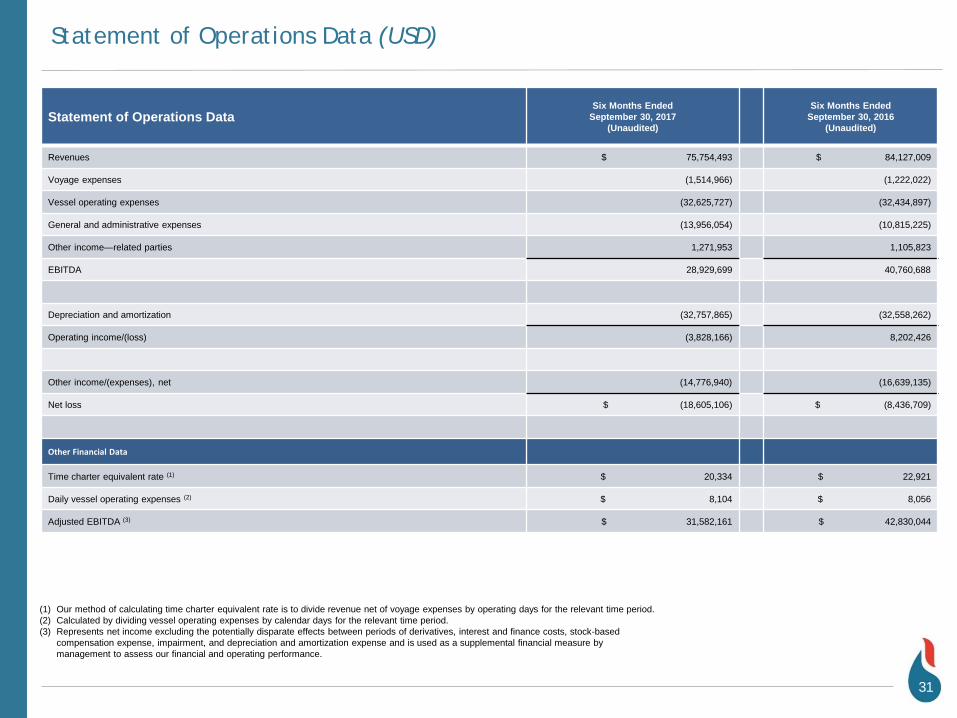
Statement of Operations Data (USD)
Statement of Operations DataSix Months Ended
September 30, 2017(Unaudited)
Six Months Ended September 30, 2016
(Unaudited)
Revenues $ 75,754,493 $ 84,127,009
Voyage expenses (1,514,966) (1,222,022)
Vessel operating expenses (32,625,727) (32,434,897)
General and administrative expenses (13,956,054) (10,815,225)
Other income—related parties 1,271,953 1,105,823
EBITDA 28,929,699 40,760,688
Depreciation and amortization (32,757,865) (32,558,262)
Operating income/(loss) (3,828,166) 8,202,426
Other income/(expenses), net (14,776,940) (16,639,135)
Net loss $ (18,605,106) $ (8,436,709)
Other Financial Data
Time charter equivalent rate (1) $ 20,334 $ 22,921
Daily vessel operating expenses (2) $ 8,104 $ 8,056
Adjusted EBITDA (3) $ 31,582,161 $ 42,830,044
(1) Our method of calculating time charter equivalent rate is to divide revenue net of voyage expenses by operating days for the relevant time period.(2) Calculated by dividing vessel operating expenses by calendar days for the relevant time period.(3) Represents net income excluding the potentially disparate effects between periods of derivatives, interest and finance costs, stock-based
compensation expense, impairment, and depreciation and amortization expense and is used as a supplemental financial measure by management to assess our financial and operating performance.
31
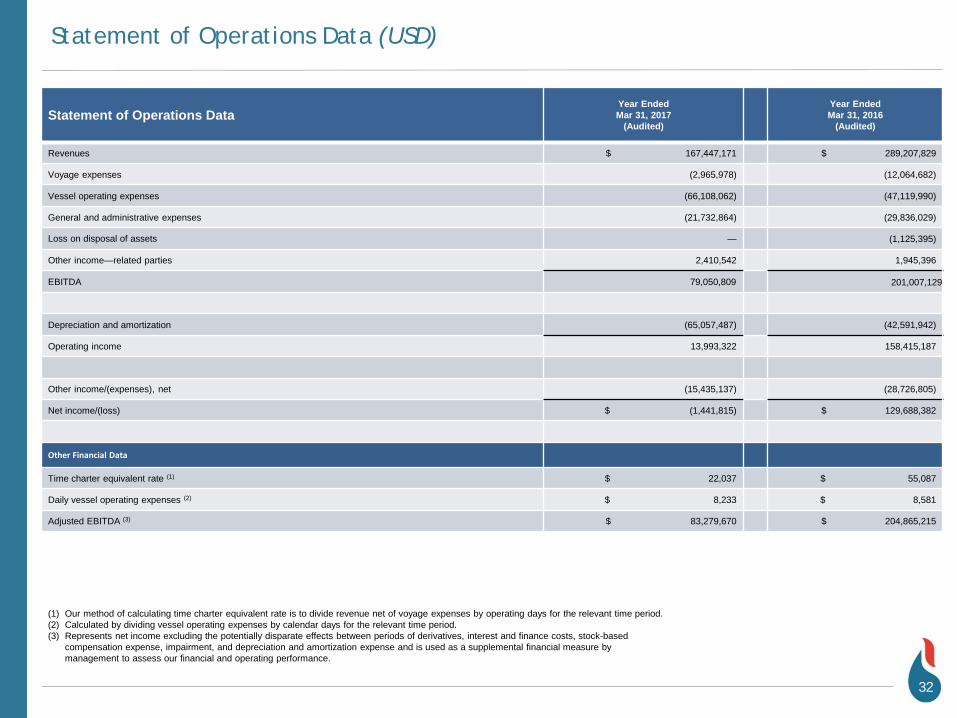
Statement of Operations Data (USD)
Statement of Operations DataYear Ended Mar 31, 2017
(Audited)
Year Ended Mar 31, 2016
(Audited)
Revenues $ 167,447,171 $ 289,207,829
Voyage expenses (2,965,978) (12,064,682)
Vessel operating expenses (66,108,062) (47,119,990)
General and administrative expenses (21,732,864) (29,836,029)
Loss on disposal of assets — (1,125,395)
Other income—related parties 2,410,542 1,945,396
EBITDA 79,050,809 201,007,129
Depreciation and amortization (65,057,487) (42,591,942)
Operating income 13,993,322 158,415,187
Other income/(expenses), net (15,435,137) (28,726,805)
Net income/(loss) $ (1,441,815) $ 129,688,382
Other Financial Data
Time charter equivalent rate (1) $ 22,037 $ 55,087
Daily vessel operating expenses (2) $ 8,233 $ 8,581
Adjusted EBITDA (3) $ 83,279,670 $ 204,865,215
(1) Our method of calculating time charter equivalent rate is to divide revenue net of voyage expenses by operating days for the relevant time period.(2) Calculated by dividing vessel operating expenses by calendar days for the relevant time period.(3) Represents net income excluding the potentially disparate effects between periods of derivatives, interest and finance costs, stock-based
compensation expense, impairment, and depreciation and amortization expense and is used as a supplemental financial measure by management to assess our financial and operating performance.
32
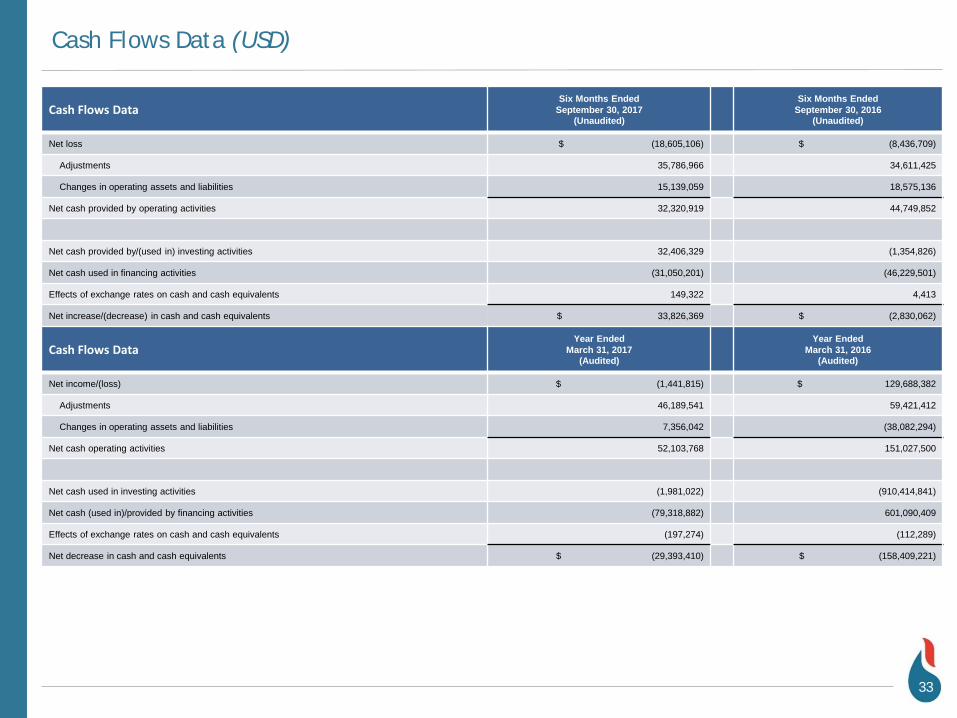
Cash Flows Data (USD)
Cash Flows DataSix Months Ended
September 30, 2017(Unaudited)
Six Months Ended September 30, 2016
(Unaudited)
Net loss $ (18,605,106) $ (8,436,709)
Adjustments 35,786,966 34,611,425
Changes in operating assets and liabilities 15,139,059 18,575,136
Net cash provided by operating activities 32,320,919 44,749,852
Net cash provided by/(used in) investing activities 32,406,329 (1,354,826)
Net cash used in financing activities (31,050,201) (46,229,501)
Effects of exchange rates on cash and cash equivalents 149,322 4,413
Net increase/(decrease) in cash and cash equivalents $ 33,826,369 $ (2,830,062)
Cash Flows DataYear Ended
March 31, 2017(Audited)
Year Ended March 31, 2016
(Audited)
Net income/(loss) $ (1,441,815) $ 129,688,382
Adjustments 46,189,541 59,421,412
Changes in operating assets and liabilities 7,356,042 (38,082,294)
Net cash operating activities 52,103,768 151,027,500
Net cash used in investing activities (1,981,022) (910,414,841)
Net cash (used in)/provided by financing activities (79,318,882) 601,090,409
Effects of exchange rates on cash and cash equivalents (197,274) (112,289)
Net decrease in cash and cash equivalents $ (29,393,410) $ (158,409,221)
33
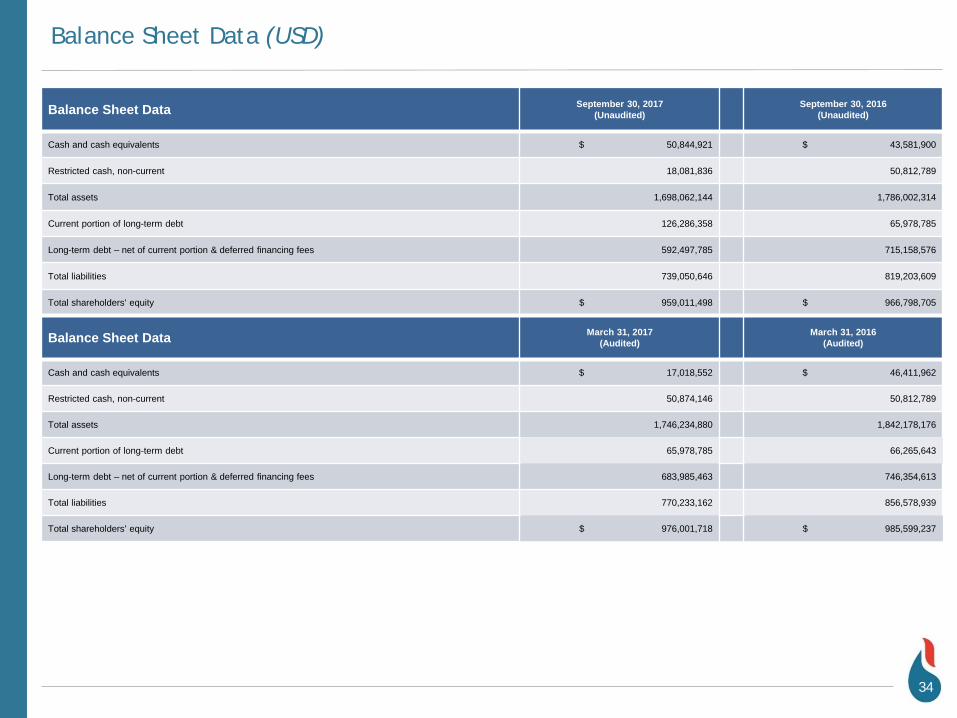
Balance Sheet Data (USD)
Balance Sheet Data September 30, 2017(Unaudited)
September 30, 2016(Unaudited)
Cash and cash equivalents $ 50,844,921 $ 43,581,900
Restricted cash, non-current 18,081,836 50,812,789
Total assets 1,698,062,144 1,786,002,314
Current portion of long-term debt 126,286,358 65,978,785
Long-term debt – net of current portion & deferred financing fees 592,497,785 715,158,576
Total liabilities 739,050,646 819,203,609
Total shareholders' equity $ 959,011,498 $ 966,798,705
Balance Sheet Data March 31, 2017(Audited)
March 31, 2016(Audited)
Cash and cash equivalents $ 17,018,552 $ 46,411,962
Restricted cash, non-current 50,874,146 50,812,789
Total assets 1,746,234,880 1,842,178,176
Current portion of long-term debt 65,978,785 66,265,643
Long-term debt – net of current portion & deferred financing fees 683,985,463 746,354,613
Total liabilities 770,233,162 856,578,939
Total shareholders' equity $ 976,001,718 $ 985,599,237
34
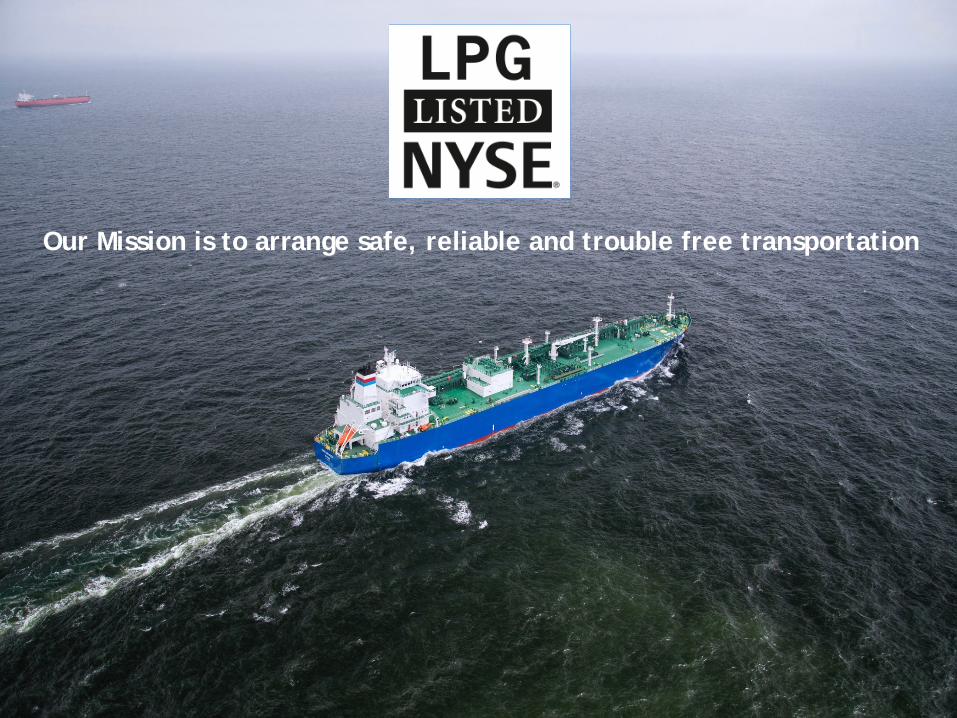
Our Mission is to arrange safe, reliable and trouble free transportation
Recommended