Page 1 of 24
THIS REPORT CONTAINS ASSESSMENTS OF COMMODITY AND TRADE ISSUES MADE BY
USDA STAFF AND NOT NECESSARILY STATEMENTS OF OFFICIAL U.S. GOVERNMENT
POLICY
Date:
GAIN Report Number:
Approved By:
Prepared By:
Report Highlights:
In 2016, the Dominican Republic was the fifth-largest market, valued at almost $484 million, for U.S.
consumer-oriented products in the Western Hemisphere after Canada, Mexico, Colombia, and Chile.
The U.S.-Dominican Republic-Central America Free Trade Agreement (CAFTA-DR) has improved the
competitiveness of U.S. products; consumer-oriented product sales have increased by 200 percent since
the implementation of the agreement in 2007. The United States is the largest consumer food exporter
to the Dominican Republic, with a market share of approximately 50 percent. With a very active
tourism sector valued at approximately $5.3 billion in 2016 (representing 7.8 percent of the GDP), there
are opportunities for increased U.S. exports to the Dominican market. Products with the highest
potential include snack foods, powdered milk, wine, craft beer, and cheddar cheese.
Post:
Santo Domingo
Mayra Carvajal, Agricultural Marketing Specialist
Lisa Ahramjian, Agricultural Attaché
Opportunities Abound for U.S. Consumer-Oriented Products
Exporter Guide
Dominican Republic
DR1717
12/26/2017
Required Report - public distribution

Page 2 of 24
SECTION I. MARKET OVERVIEW
1.1. Economic situation
According to the Dominican Republic Central Bank, the Dominican Republic (DR)’s gross domestic
product (GDP) grew by 6.6 percent in 2016. This growth has positioned the DR as a leader in Latin
America for the third consecutive year, exceeding the expectations of the government and other
international institutions. This is especially notable because the International Monetary Fund (IMF)
estimated Latin American’s GDP growth at -0.6 percent in 2016, mainly due to the economic situation
in Brazil, Argentina, Venezuela, and Ecuador. The IMF has projected the DR’s GDP to increase 5.3
percent in 2017.
DR GDP Growth, 2012 - 2016
In 2016, the main drivers of this growth were: mining (26.5 percent); financial intermediation (11.9
percent); construction (9 percent); trade (6.5 percent); hotels, bars, and restaurants (6.4 percent);
transportation and storage (5.6 percent); teaching (5.3 percent); and local manufacturing (5 percent).
The agricultural sector grew 10 percent in 2016, recovering from last year’s drought.
According to the Dominican Central Bank, the inflation rate in 2016 was 1.7 percent, which is the
second-lowest rate in 33 years. While the inflation rate has dramatically decreased since 2012, it had
increased moderately during 2015 due to price increases on locally-produced food and beverages (see
figure below). The inflation forecast for 2017 is 3.6 percent.

Page 3 of 24
DR Inflation Rate, 2012 - 2016
As of December 31, 2016, the exchange rate of the spot market for sales of U.S. dollars was
1US$=46.70RD$.
1.2. Demographics and income distribution
According to the most recent census carried out by the National Office of Statistics (ONE) in 2010, the
DR population was 9.4 million, with an annual growth rate of 1.21 percent. Of this total, men represent
50.17 percent and women make up 49.82 percent. Approximately 75 percent of the population lives in
urban areas and 25 percent lives in rural areas.
The largest age cohort in the population is the
one between 15-19 years (10.4 percent),
followed closely by 10-14 year-olds (10.3
percent). Two-thirds of the population is under
35 years old (see graphic of the composition of the
DR population).
With 3,339,410 people or 35.35percent of the
population, the city of Santo Domingo
(including the National District, Santo
Domingo province, and its surrounding
suburbs) is the largest market in the country. It’s
also the city with the highest population
density at about 2,396 inhabitants per square
kilometer (km2). Following the city of Santo
Domingo, the largest markets in the DR are:
Santiago province (population: 963,422;

Page 4 of 24
population density: 343 inhabitants per km21
); San Cristobal province (population: 569,930; population
density: 459 inhabitants per km22
); and La Vega province (population: 394,205; population density: 172
inhabitants per km2). Other important provinces are La Romana, Bonao, San Francisco de Macoris, and
Higuey. Higuey includes the most important tourist area of the country: the municipalities of Bávaro
and Punta Cana.
To study behavior trends, the Dominican Central Bank divides the population into 5 quintiles by
income; the income and purchasing power for these segments varies significantly as described below:
Quintile Description % of Population
Monthly
average
income
(US$)
Main Expenses and
Percentage of Total Expenses
1 below the
poverty line
10% (944,528
people)
198.63 Food/non-alcoholic beverages:
47.2%
2 lower class 47% (4,439,282
people)
309.35 Food/non-alcoholic beverages:
38.1%
Transportation: 12.3%
Housing: 9.4%
This represents a good market
for basic U.S. products such as
beans, poultry, rice, and bread.
3 middle class 20% of the
population
(1,889,056
people)
434.33 Food/non-alcoholic beverages:
31.6%
Transportation: 13.7%
This represents a good market
for U.S. high value products3
4 upper middle
class
17% (1,605,698
people)
671.90 Food/non-alcoholic beverages:
24.8%
Transportation for 13.7%
Housing: 10.9%
Hotels and restaurants: 9.5%
This represents a good market
for U.S. high value products
5 upper class 6% (566,717
people)
1,599.77 Food/non-alcoholic beverages:
12.3%
Transportation: 24.8%
This represents a good market
for U.S. high value products
1 The city of Santiago has a population of 591,985 and a population density of 3,587 habitants/ km2.
2 The city of San Cristobal has a population of 232,769 and a population density of 1,095 habitants/ km2.
3 In this report Post refers as High Value Products to agricultural products with a level of processing either intermediate or consumer
oriented.

Page 5 of 24
1.3. Market size
Based on a 2007 survey (the most recent), approximately 21 percent of household expenditures were
spent on food and non-alcoholic beverages. Within this category of expenses, the average Dominican
consumes the following products:
Monthly average expenses in food and non-alcoholic beverages in DR
Category
Monthly expenses
Absolute (US$
1,000,000)
Relative
(percent)
Food and non-alcoholic beverages 334.25 100.00
Food 298.49 89.30
- Meat 70.14 23.50
- Bread and cereals 67.16 22.50
- Vegetables 41.79 14.00
- Milk, cheeses and eggs 33.13 11.10
- Fruits 30.15 10.10
- Oils and fat 14.03 4.70
- Foodstuff 19.40 6.50
- Fish 11.34 3.80
- Sugar, jam, honey, chocolate and sweets 11.34 3.80
Non-alcoholic beverages 35.76 10.70
- Mineral water, refreshments, fruit and legume
juices 31.96 89.35
- Coffee, tea and cocoa 3.81 10.65 Source: Built by FAS/Post with data from the National Poll of Household Income and Expenses, 2007. ONE.
Post does not anticipate that these spending patterns will change significantly in the near future.
Therefore, since the DR’s economy continues to develop and the population continues to increase, the
growing demand of food products in the country presents opportunities for U.S exporters.
From 2012 to 2016, the DR imported more than $12 billion in food and beverages, with approximately
50 percent coming from the United States. In 2016, the DR imported $2.5 billion in agricultural and
food and beverages products, sourcing $1.26 billion of that from the United States. In comparison, the
total U.S. exports of food and beverages to the DR in 2007 were $804 million; this highlights positive
impact of CAFTA-DR for U.S. exports.

Page 6 of 24
1.4. Advantages and challenges in the market
Advantages Challenges 1. The implementation of CAFTA-DR, which has
lowered or eliminated duties on nearly 80
percent of products.
1. Competition from other CAFTA-DR signees and
other countries that have signed free trade
agreements with the DR.
2. A large and growing tourist population (6.0
million in 2016), which demands high value
food products.
2. Tariff rate quotas, safeguards and other CAFTA-DR
provisions that protect local producers of rice, meat
(beef, poultry and pork), dairy products, beans,
garlic, and onions.
3. A growing number of consumers demanding
higher quality and healthier products; they
generally perceive that U.S. products meet their
requirements.
3. Requirement that U.S. products must comply with
Spanish language labeling requirements.
4. Efficient food distribution channels, with the
construction of new highways and the
modernization of seaports and airports
facilitating the flow of imported food products.
4. Cold chain limitations.
5. Consumers greatly influenced by the U.S.
culture, with a positive perception of U.S.
products.
5. Require import permits for some products.
6. The proximity of the DR to the United States
and strong bilateral relationships throughout the
public and private sectors, which facilitates
trade.
6. 18 percent VAT and high internal logistic costs.
7. Growing population in urban centers and
increased employment.
7. Lack of transparency and corruption, which continue
to earn the DR relatively low scores in international
comparison tables (DR was 99th out of 190 countries
in the World Bank’s 2018 “Ease of Doing Business”
ranking).
8. A Dominican diaspora in the U.S. of
approximately one million persons, clustered
primarily in the northeastern states and Florida,
whose remittance payments help support the
Dominican economy.
8. A lack of institutional continuity across changes in
government administrations.
SECTION II. EXPORTER BUSINESS TIPS
2.1. Business culture
Personal relationships are essential to building business relationships in the DR. In general, Dominicans
attach great importance to courtesy in all business endeavors. A warm handshake combined with
conversation about the person’s wellbeing, family, or other similar topics prior to launching into any
conversation related to business is considered a common courtesy. This communication helps
Dominican businessman develop more confidence prior to any business commitment. Of course, as
genuinely warm and friendly as Dominicans are, every aspect of the business transaction should be
clearly stated between the parties in writing.

Page 7 of 24
The DR has few but persistent market access issues. A common market entry option is to appoint an
agent or distributor in the DR; licensing agreements and franchises can also be successful. Because of
the DR’s proximity to the United States and low air travel costs, the optimal market entry method is
through a coordinated strategy that includes personally visiting potential partners or distributors in the
DR. U.S. exporters should also be prepared to provide all promotional materials in the Spanish
language. Good after-sales service is a pre-requisite of doing business successfully in the country.
2.2. Consumer tastes and preferences
Dominicans have adopted a lot of U.S. culture, such as music, sports, entertainment, and fashion. DR
food consumption trends are similar to trends in the United States. While U.S. trends may take a few
years to arrive in the DR, CAFTA-DR has accelerated this transfer. For example, in the middle class
and above, consumers routinely visit U.S. fast food chains and restaurants established in the DR.
Dominican consumers perceive that products made in more developed countries are more reliable in
terms of quality and safety. Additionally, higher income classes are demanding more natural and
healthy products, including those with less saturated fat, cholesterol, and sugar.
2.3. Food Standards and Regulations (FAIRS)
In general, food laws in the Dominican Republic have not substantially restricted trade for U.S.
products. There are four government Ministries involved in setting food policy for the country: the
Ministry of Public Health, the Ministry of Industry and Commerce, the Ministry of Agriculture, and the
Ministry of the Environment and Natural Resources. The Ministry of Health plays a leading role within
the Ministries.
For more detailed information on how these Ministries interact and proceed, please refer to Post’s 2017
Food and Agriculture Import Regulations and Standards (FAIRS) narrative report, DR1714.
2.4. General import and inspection procedures
2.4.1. Product registration
The first step in importing new food products into the Dominican Republic is product registration.
Importers register new food products with the Ministry of Public Health. The Ministry issues a
certificate to the importer or the local legal representative with a Sanitation Registration Number, which
must be printed on the label of the product or as an additional sticker.
For more information, please refer to Post’s 2017 FAIRS narrative report (DR1714).

Page 8 of 24
2.4.2. Customs clearance
The General Directorate of Customs Office requires the importer to present the following documents to
release all shipments valued over US$100:
Bill of Lading (English or Spanish)
Commercial Invoice
Insurance Certificate issued by a local insurance company
Sanitary certificate issued by the origin country
Non-objection Certificate issued by the Ministry of Agriculture4
Import Permit issued by the Department of Internal Taxes for alcoholic beverages only
When importers have all of the required documents and no sanitary issues arise, the customs clearance
procedure can be completed in twenty-four hours. The process has been streamlined in recent years due
to the implementation of electronic customs systems, which allows the importer to request permits and
process other transactions online. However, importers usually hire a knowledgeable customs agent who
expedites the process. Larger importers will have a customs agent within their company. After ten days
in port, shipping lines assess a daily charge for the use of their containers. Port authorities also charge
for the use of their space.
After the invoice is reviewed, Customs officials determine the duty. If it is determined that the invoice
does not reflect what Customs believes is an accurate price, Customs officials will review the duty based
on their own appraisal list (Lista de Valuación Aduanera, LVA). The actual product value may be lower
than the one in the list, so importers sometimes need to appeal their findings.
In September 2017, the Ministry of Agriculture started to implement the Customs Authority’s electronic
system, One Stop Shop of External Trade (or VUCE in Spanish) to digitize their agricultural imports
authorizations process. The system is currently being used for a handful of commodities, including
apples, grapes, citrus, vegetables, and meats. Once fully implemented, the system is expected to
increase transparency for traders, who will be able to view the status of their approvals and reasons for
any rejections.
2.4.3. Tariffs
Current tariffs are based on DR-CAFTA; many have been or will be reduced under the agreement.
Tariffs range from 0 to 20 percent for most products, and up to 99 percent in some cases. A number of
products are duty free and are listed in Baskets A, B, G, W and X of the agreement. The tariffs for
products in other baskets are being reduced over time. The tariff reduction schedule for each basket is
listed in Appendix II of this report.
4 For more information on this permits, please access: http://agricultura.gob.do/servicios/informacion-sobre-procedimientos-para-la-
importacion-de-productos-y-subproductos-de-origen-vegetal/ and http://agricultura.gob.do/servicios/informacion-sobre-procedimientos-
para-la-importacion-de-productos-y-sub-productos-de-origen-animal/
Page 9 of 24
A complete list of the base tariff schedule, in Spanish only, under the CAFTA-DR agreement can be
found at the following link:
http://www.ustr.gov/sites/default/files/uploads/agreements/cafta/asset_upload_file732_5848.pdf
Tariff codes are the same in all languages. Therefore, the code for any product is the same in both
Spanish and English. For more information on the text of the agreement, please go to
http://www.ustr.gov/trade-agreements/free-trade-agreements/cafta-dr-dominican-republic-central-
america-fta/final-text.
Exporters also need to be aware of other internal taxes applied to imported luxury products, such as
wine, during the clearance process. Although the duty may be low and even zero, luxury taxes may be
as much as 300 percent. These taxes, charged at customs, increase the price for the end consumer
significantly.
SECTION III. MARKET SECTOR STRUCTURE AND TRENDS
3.1. Retail food sector
Since the start of the trade liberalization process in the 90’s and especially since the implementation of
CAFTA-DR, retail in Dominican Republic has become bigger, more diversified, and more sophisticated.
Supermarkets have diversified their stores, including specific stores for determined segments of the
population, including high-end segments. The most important supermarket chains in DR are controlled
by local investment. Even though the existing supermarket chains do not have any formal industry
association, they have been effective at defending their dominant position in the local market. U.S.
supermarket chains have not entered the market except for Pricesmart, which is owned by Dominican
and U.S. investors. The main urban cities are well covered by several supermarket chains.
According to Post research, there are eight major players in the supermarket sector with more than 160
stores located all across the country, as follows:
Major supermarket chains in Dominican Republic, 2017
Name Ownership Outlets Location Purchasing agent
La Sirena Dominican (Grupo
Ramos) 25
Santo Domingo, Santiago, Puerto
Plata, La Vega, San Francisco, San
Cristóbal, Bonao, Higuey, Moca La
Romana and Bani
Direct importers and
distributors
Supermercado Pola Dominican (Grupo
Ramos) 9
Santo Domingo, Bávaro, Las
Terrenas and Sosúa
Direct importers and
distributors
Aprezio Dominican (Grupo
Ramos) 25
Santo Domingo, Santiago, Cotuí
and Boca Chica
Direct importers and
distributors
Supermercados
Nacional
Dominican (Centro
Cuesta Nacional) 14
Santo Domingo, Santiago, La
Romana and Punta Cana
Direct importers
Wholesalers/
distributors
It is also a member of
the Topco Associates
in the U.S.

Page 10 of 24
Name Ownership Outlets Location Purchasing agent
Jumbo Dominican (Centro
Cuesta Nacional) 12
Santo Domingo, La Romana, San
Pedro, Santiago, Moca, La Vega,
Higuey, Bávaro and Puerto Plata
Direct importers
Wholesalers/
distributors
It is also a member of
the Topco Associates
in the U.S.
Jumbo Express Dominican (Centro
Cuesta Nacional) 4 Santo Domingo
Direct importers
Wholesalers/
distributors
It is also a member of
the Topco Associates
in the U.S.
Supermercados Bravo Dominican 11
Santo Domingo, Autopista Las
Américas, Las Colinas and
Santiago
Direct importers and
distributors
Supermercados Plaza
Lama
Dominican 11 Santo Domingo, Bavaro and La
Vega
Direct importers and
distributors
Supermercados La
Cadena
Dominican
(MERCATODO) 10 Santo Domingo
Direct importers and
distributors
Pricesmart Warehouse
U.S./ Dominican 3 Santo Domingo and Santiago
Direct importers and
distributors
Carrefour French 2 Santo Domingo
Direct importers and
distributors
Superfresh Dominican 1 Santo Domingo
Direct importer and
distributor
National Association of
Small Supermarkets
(UNASE)
Dominican 40 Major cities Direct importers and
distributors
Source: Built by FAS/Post with data from interviews and research (M Carvajal)
As shown in the previous table, Grupo Ramos (59 stores) and Centro Cuesta Nacional (30 stores) are the
biggest supermarket chains in the country. They have diversified their stores in three categories, each
one aiming at one specific segment of the population. These major supermarkets have distributed
outlets within the provinces with the largest per capita income.
These supermarket chains import products directly from the United States and also buy from other local
importers. Supermarkets are increasing their number of product lines. They are also developing the
market for their own private brands and are the exclusive representatives of some name brand products.
Still, according to Post sources, only 20 to 25 percent of the retail sales are recorded by supermarkets.
The rest are posted by informal establishments, such as mom and pop stores (colmados), open public
markets, and street vendors, which traditionally distribute local, domestic products.
3.2. Hotel, Restaurants and Institutions (HRI)

Page 11 of 24
In total, the HRI sector contributed 17.3 percent to the Dominican Republic (DR)’s GDP in 2016, which
reflected a 4.9 percent increase from 2015. The tourism sector continues to be very important to the
DR’s economy and a key driver of trends and demand in the food service sector. According to the
World Travel & Tourism Council (WTTC)’s last annual research, travel and tourism contributed 5.4
percent to the DR’s total GDP in 2016, and is forecast to rise by 4.8 percent in 2017. The average
tourist spends approximately US$130 per day.
According to the last official Central Bank Touristic Statistics Bulletin, nearly 6 million tourists entered
the DR in 2016 as seen in the graphic below; this was a 6.5 percent increase from the previous year.
Within this increase, 84 percent were foreigners and the remaining 16 percent were DR nationals
residing outside of the country. The number of foreign arrivals increased annually on average by 7
percent for the last three years. Sixty-seven percent (3.4 million) of foreign visitors entered the DR
through the Punta Cana Airport, the most important tourism area. Approximately 18 percent of foreign
visitors come through the Santo Domingo airport.
Non-Resident Tourist Arrivals
Source: Central Bank Touristic Statistics 2016
U.S. tourists continue to lead arrivals in DR, representing approximately 41 percent (2.1 million) of
foreign visitors in 2016. Europeans, mainly from Germany, France, Spain, Russia, and the United
Kingdom, comprise 23 percent (approximately one million) of foreign visitors.
Most of the hotels located in Punta Cana, Puerto Plata, and La Romana operate under the “all-inclusive”
business model, serving nearly 3 million foreigners every year. The average hotel occupancy rate keeps
similar proportion as previous year: La Romana/Bayahibe, 85 percent; Punta Cana, 83 percent; Samana,
79 percent; and Puerto Plata, 60 percent.
Most of the travelers who conduct business in the DR arrive through Santo Domingo and Santiago
airports. Therefore, Post estimates that nearly 1 million foreigners stay in “non-tourism hotels”
annually. The average hotel occupation rate for 2016 was similar to 2015: Santo Domingo, 63 percent
and Santiago, 59 percent.
There are approximately 129 outlets of 21 fast food restaurant chains in the DR according to the Exports
and Investment Promotion Agency of El Salvador (PROESA). Most of them are U.S. franchises.
According to the same source, there are approximately 333 medium and large restaurants in the country;
167 of them located in Santo Domingo (of which 50 are considered high end restaurants), 61 in
Santiago, 60 in Bávaro (a tourist region within Punta Cana), 23 in La Romana, and 22 in Puerto Plata.

Page 12 of 24
Supply of the restaurant sector is dominated by a few major distributors and by major local
confectionaries. The most important supermarkets distribute wines and other products to these
restaurants.
In the DR, there are a limited number of institutional, mainly social, programs exist that demand food on
a regular basis. The Government of the DR is involved in two programs, both of which exclusively
utilize local products:
1. The Comedores Economicos Program (accessible diners) is a program in which the Government
distributes consumer goods (raw or cooked), subsidizing approximately 87 percent of the cost.
The distributed products include: rice, beans, oil, chicken, salami, pasta, tomato sauce, liquid
seasoning, garlic paste, and tubers.
2. The Alimentacion Escolar Program (school alimentation) is a program in which the Government
distributes consumer goods for kids in public schools all around the country. The program buys
and distributes products such as plantains, milk, cheese, bread, and eggs. It is estimated that the
Government invests approximately $530,000 in this program every day.
3.3. Food processing sector
In the DR, according to the General Directory of Internal Taxes (DGII), there are 1,075 companies
classified as agricultural industrials or processors. According the same source, the main processing
companies based on gross income are:
Company Main activity
Nestle
Dominicana
S.A.
Production of several massive consumption products for internal sales and exports
to the Caribbean and Latin-American region, including milk (powder, whole,
condensed, evaporated), cereals, dehydrated soups, powder seasoning, liquid
seasoning, and dog and cat food. Buys local and imported products for processing.
Molinos del
Ozama S.A.
Production of wheat and corn flour, pastas, and cookies using mainly imported raw
material. Molinos del Ozama is owned by the Molinos Modernos company located
in Guatemala and has a processing capacity of 1,200 MTof wheat per day.
Industrias
Banilejas S.A.
Purchase and processing of coffee using mainly local products; imports if needed.
Frito-Lay
Dominicana
S.A.
Production of snacks from plantains, cassava, potatoes, and spices using mainly
local raw materials. Frito-Lay is a brand of the PepsiCo group.
Quala
Dominicana
S.A.
Production of seasoning cubes, juices from powder, oat products, and other
products. This Colombian multinational established operations in DR in 1998.
Molinos Valle
del Cibao S.A
Production of 4 brands of wheat flour (Princesa, Famosa, Principe and Princesita)
using mainly imported raw material. This company is part of the Bocel Group and
is one of the DR’s biggest importers of wheat flour.

Page 13 of 24
Company Main activity
Unilever Caribe
S.A.
Production and importation of more than 70 widely-consumed products, including
seasoning products, corn flour, detergents, deodorants, and soaps.
Sanut
Dominicana
S.A.
Production of yellow corn, soybean meal, wheat, soybean oil, yellow fat, and
fertilizers. This Dominican company also provides veterinary services.
Molinos
Modernos S.A.
See Molinos del Ozama.
La Dominicana
Industrial SRL
Production of pastas. This company is part of the Bocel group.
According to the Central Bank of the Dominican Republic, the “food products industry” represented a
$2.6 billion industry in 2015.
Page 14 of 24
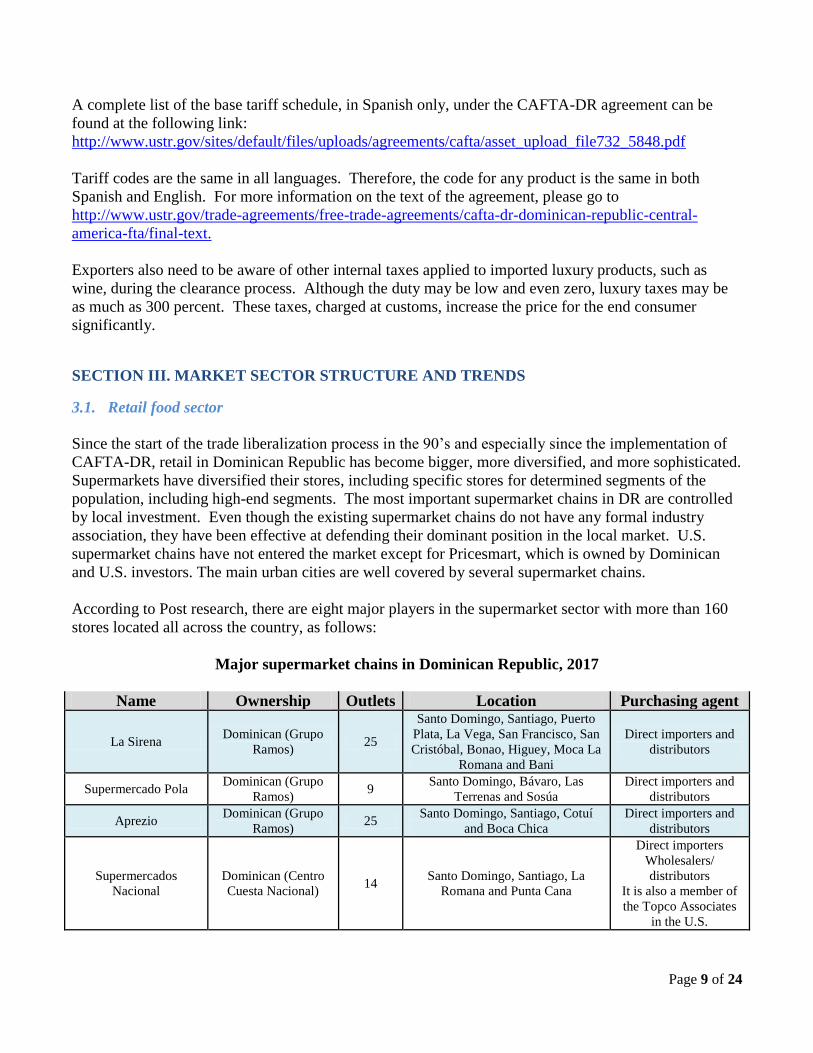
SECTION IV. BEST HIGH VALUE PRODUCTS PROSPECTS
Product
category
Total
Imports
2016
($1,000,000
)
Imports from U.S.
($1,000,000)
5-Yr.
Avg.
annual
U.S.
import
growt
h
Impor
t tariff
rate by
Jan
2018
Key
constraints
over market
developmen
t
Market
attractivenes
s for U.S. 201
4
201
5
201
6
Snack foods
NESOI 17.9 22.9 14.9
18% 0%
Strong
competition
with local
produced
and imported
products
from Central
America and
other
countries
Increasing
demand of
snack
products in
the middle
income class.
Still good
opportunity
for U.S.
products to
reenter the
market.
Consumers
understand
higher quality
standards
Non-Fat Dry
Milk
(NFDM)
(040210000)
11.5 31.5 12.9
2% 39.2%
Still subject
to TRQ’s
and
additional
safeguard
duties
Increasing
demand of
dairy
products. DR
consumer
associates
U.S. dairy
with high
quality
Grape wine
NESOI
(2204214000
)
10.9
8.8 9.6
36% 0%
Competition
with Chilean,
Spanish, and
French wines
Increasing
segments of
the market are
expending
more money
in alcoholic
beverages
Beer, malt
(2203000000
)
5.7 3.4 4.7
23% 2.67%
Strong
competition
from the
local
industry
Increased
demand for
foreign beers
among
Dominican
consumers,
especially in
restaurants

Page 15 of 24
Product
category
Total
Imports
2016
($1,000,000
)
Imports from U.S.
($1,000,000)
5-Yr.
Avg.
annual
U.S.
import
growt
h
Impor
t tariff
rate by
Jan
2018
Key
constraints
over market
developmen
t
Market
attractivenes
s for U.S. 201
4
201
5
201
6
Cheddar
Cheese
(0406901000
)
3.5 1.8 1.4
234% 2.67%
Still subject
to TRQ’s
and
additional
safeguard
duties.
Competition
from local
producers
Nevertheless
, the
percentage
of increase
indicates the
huge
potential for
the United
States for
this product
Increasing
demand of
dairy
products,
especially
cheeses. DR
consumer
associates
U.S. dairy
with high
quality
Notes:
1. Data Source: U.S. Census Bureau Trade Data
SECTION V. KEY CONTACTS AND FURTHER INFORMATION
Foreign Agricultural Service (FAS/ USDA)
U.S. Embassy in Santo Domingo
República de Colombia Av. #57, Arroyo Hondo, Santo Domingo, Dominican Republic
Telephone: 809-368-7654
E-mail: [email protected]
Web page: www.fas.usda.gov Comment: Contact this office for more detailed information about the Dominican food market, lists of importers,
major players in the sector, questions, etc.
Ministry of Agriculture; General Directorate of Livestock (DIGEGA in Spanish)
George Washington Av., Ciudad Ganadera, Santo Domingo, Dominican Republic
Telephone: 809-535-9689, ext. 223
Fax: 809-533-5863
Contacts: Dr. Bolivar Toribio, Livestock Directorate Director
Dr. Lisette Gomez, Animal Health Director
E-mail: [email protected]
Web page: www.ganaderia.gob.do Comment: This department within the Ministry of Agriculture issues the non-objection sanitary certificates, which
are required to import animal products.

Page 16 of 24
Ministry of Agriculture; Plant Health Division
Autopista Duarte, Km. 6 ½, Jardines del Norte, Santo Domingo, Dominican Republic.
Telephone: 809-547-3888, ext. 3786
Fax: 809-227-1268
Contacts: Dr. Emigdio Gomez, Plant Health Director
Ing. Manuel Duran, Plant Health Deputy Director
E-mail: [email protected]
Web page: www.agricultura.gob.do Comment: This department within the Ministry of Agriculture issues the non-objection phytosanitary certificates,
which are required to import vegetable products.
Ministry of Public Health; General Directorate of Drugs, Food and Sanitary Products (DIGEMAPS)
Ave. San Cristobal, Esquina Ave. Tiradentes, Santo Domingo, Dominican Republic
Telephone: 809-541-3121, ext. 2204
Fax: 809-544-2083
Contact: Dr. Fatima del Rosario Cabrera, Head of the Food Department
E-mail: [email protected]
Web page: www.sespas.gov.do
Comment: This department issues the sanitary registration number that is required to sell pre-packed
food products in the country. The department is also in charge of food inspection.
Oficina Nacional de Derecho de Autor (ONDA)
(National Office for Copyrights)
Calle Modesto Diaz No.2
Edif. del Archivo General de la Nación 1er. piso, Zona Universitaria, Santo Domingo, Dominican
Republic
Contact: Dr. Marino Feliz Terrero, Director General
Telephone: 809-508-7373
Fax: 809-274-7575
E-mail: [email protected]
Comment: Through this office, importers register trademarks, product registration, and property rights.
Instituto Dominicano para la Calidad
(Quality Dominican Institute)
Ministerio de Industria y Comercio
(Ministry of Industry and Commerce)
Ave. Mexico esq. Leopoldo Navarro, Edificio de Oficinas Gubernamentales
Juan Pablo Duarte, Piso 11 (Edif. El Huacal), Santo Domingo, Dominican Republic
Contact: Dr. Manuel Guerrero, Executive Director
Telephone: 809-686-2205
Fax: 809-686-2235
E-mail: [email protected]
Web page: http://www.digenor.gob.do
Comment: This bureau is part of the Ministry of Industry and Commerce and issues and enforces the
application of NORDOM 53, which requires product labels in the Spanish language and the sanitary
registration number on all pre-packed retail food products.

Page 17 of 24
Dirección General de Aduanas
(General Directorate of Customs)
Av. Abraham Lincoln No. 1101, Ens. Serrallés
Santo Domingo, Dominican Republic
Contact: Mr. Enrique Ramirez Paniagua, Director
Telephone: 809-547-7070
Fax: 809-540-5853
E-mail: [email protected]
Webpage: http://www.dga.gov.do
Comment: This is the official entity in charge of customs and the related local regulations.
Centro de Exportación e Inversión de la Republica Dominicana (CEI-RD)
(Export and Investment Center of the DR)
Av. 27 de Febrero, Esq. Gregorio Luperón, Plaza de las Banderas, Santo Domingo, Dominican Republic
Contact: Mr. Henry Molina, Director
Telephone: 809-530-5505
Fax: 809-530-8208
Email: [email protected]
Webpage: http://www.cei-rd.gov.do
Comment: This is an official entity responsible for increasing exports from DR and investment in the
country.
Cámara Americana de Comercio de la República Dominicana
American Chamber of Commerce of the Dominican Republic
Av. Sarasota No. 20, Torre Empresarial AIRD, 6to. Piso, Santo Domingo, Dominican Republic
Contact: Mr. William Malamud, Executive Vice President
Telephone: 809-381-0777
Fax: 809-381-0303
E-mail: [email protected]
Website: http://www.amcham.org.do
Comment: This organization is formed by 2,500 enterprises (Dominican and American) which facilitate
access to information, knowledge, and business contacts between their members in order to increase
business between the DR and the United States.

Page 18 of 24
APPENDIX I. STATISTICS
Table A. Key trade and demographic information
Agricultural imports from all countries ($Millions) / U.S. market share (percent)1
$2,459/ 50%
Consumer food imports from all countries ($Millions) / U.S. market share
(percent)1
$1,029/ 47%
Edible fishery imports from all countries / U.S. market share (percent)1
$65/ 16%
Total population (Millions) / Annual growth rate (percent)2
9.4/ 1.21%
Urban population (Millions) / Annual growth rate (percent)2
7/ NA
Number of major metropolitan areas2 7
Size of the middle class (Millions) / Growth rate (percent)2
1.88/ NA
Per capita Gross Domestic Product (U.S. Dollars)3
$6,480
Unemployment rate (percent)3
14.5%
Per capita Food Expenditures (U.S. Dollars)4
$1,233
Percent of female population employed2
35.4%
Exchange rate (US$1=X.X local currency)3 US$1=RD$48.38
1. GATS, GTIS, 2016. 2. Population Census National Office of Statistics (ONE), 2010.
3. http://www.xe.com/currencyconverter, December 18, 2017.
4. Based on ONE estimates of average 21.4 percent of income on food.

Page 19 of 24
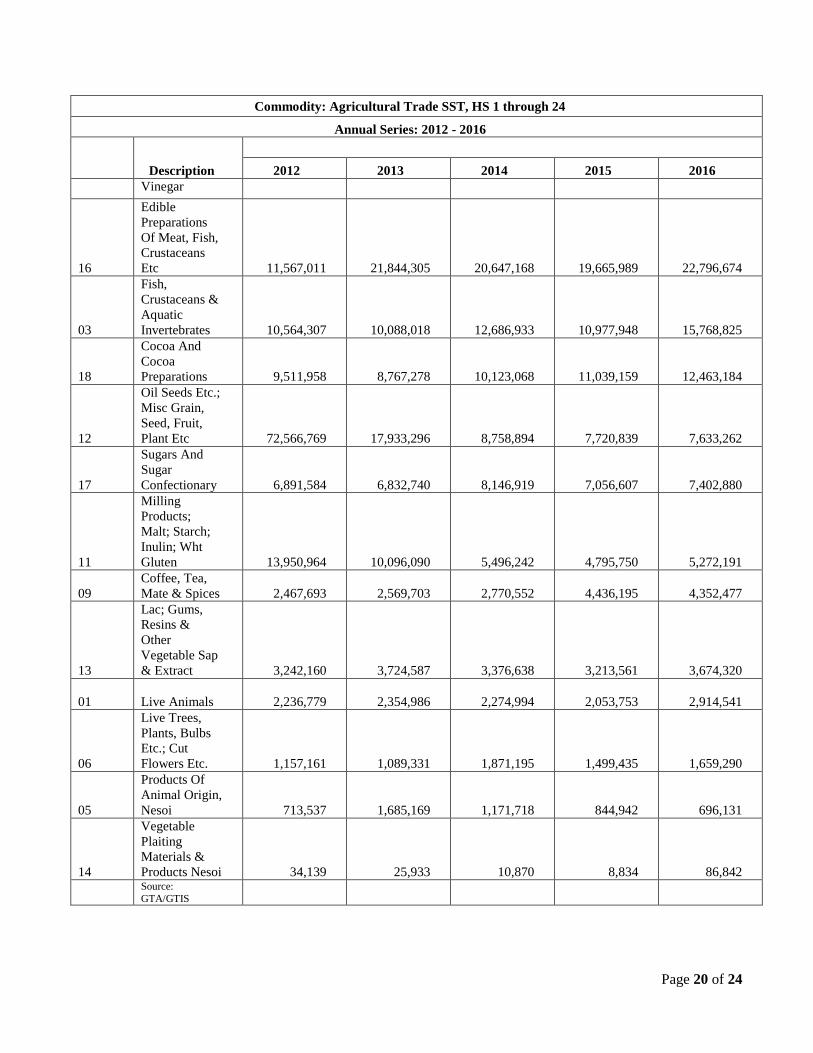
Table B. U.S. Agricultural exports to DR (US$)
Commodity: Agricultural Trade SST, HS 1 through 24
Annual Series: 2012 - 2016
Description
2012 2013 2014 2015 2016
Ag
Trade
SST
HS 1 through
24
1,090,561,919
1,136,755,658
1,366,402,895
1,214,396,057
1,266,582,243
23
Food Industry
Residues &
Waste; Prep
Animal Feed
134,429,294
172,962,572
213,840,854
202,486,163
232,468,957
10 Cereals
220,405,325
189,023,167
305,136,846
187,256,298
181,077,834
24
Tobacco And
Manufactured
Tobacco
Substitutes
113,544,191
129,682,243
127,636,756
165,990,651
162,218,112
02
Meat And
Edible Meat
Offal
104,317,464
105,262,686
132,940,414
148,551,122
159,375,030
15
Animal Or
Vegetable
Fats, Oils Etc.
& Waxes
72,341,242
77,627,892
152,512,471
109,836,711
111,030,935
21
Miscellaneous
Edible
Preparations
61,611,676
83,251,630
71,814,872
57,236,818
60,040,147
04
Dairy Prods;
Birds Eggs;
Honey; Ed
Animal Pr
Nesoi
62,183,570
69,577,319
72,589,328
59,724,313
55,998,274
07
Edible
Vegetables &
Certain Roots
& Tubers
37,803,519
28,961,858
28,140,814
46,506,960
48,344,803
20
Prep
Vegetables,
Fruit, Nuts Or
Other Plant
Parts
22,625,866
25,784,740
33,496,085
43,733,487
47,368,381
08
Edible Fruit &
Nuts; Citrus
Fruit Or Melon
Peel
35,877,465
31,069,129
38,575,895
40,968,277
43,705,178
19
Prep Cereal,
Flour, Starch
Or Milk;
Bakers Wares
68,669,204
112,055,579
79,278,833
40,819,510
43,072,220
22
Beverages,
Spirits And
21,849,041
24,485,407
33,104,536
37,972,735
37,161,755
Page 20 of 24
Commodity: Agricultural Trade SST, HS 1 through 24
Annual Series: 2012 - 2016
Description
2012 2013 2014 2015 2016
Vinegar
16
Edible
Preparations
Of Meat, Fish,
Crustaceans
Etc
11,567,011
21,844,305
20,647,168
19,665,989
22,796,674
03
Fish,
Crustaceans &
Aquatic
Invertebrates
10,564,307
10,088,018
12,686,933
10,977,948
15,768,825
18
Cocoa And
Cocoa
Preparations
9,511,958
8,767,278
10,123,068
11,039,159
12,463,184
12
Oil Seeds Etc.;
Misc Grain,
Seed, Fruit,
Plant Etc
72,566,769
17,933,296
8,758,894
7,720,839
7,633,262
17
Sugars And
Sugar
Confectionary
6,891,584
6,832,740
8,146,919
7,056,607
7,402,880
11
Milling
Products;
Malt; Starch;
Inulin; Wht
Gluten
13,950,964
10,096,090
5,496,242
4,795,750
5,272,191
09
Coffee, Tea,
Mate & Spices
2,467,693
2,569,703
2,770,552
4,436,195
4,352,477
13
Lac; Gums,
Resins &
Other
Vegetable Sap
& Extract
3,242,160
3,724,587
3,376,638
3,213,561
3,674,320
01 Live Animals
2,236,779
2,354,986
2,274,994
2,053,753
2,914,541
06
Live Trees,
Plants, Bulbs
Etc.; Cut
Flowers Etc.
1,157,161
1,089,331
1,871,195
1,499,435
1,659,290
05
Products Of
Animal Origin,
Nesoi
713,537
1,685,169
1,171,718
844,942
696,131
14
Vegetable
Plaiting
Materials &
Products Nesoi
34,139
25,933
10,870
8,834
86,842
Source:
GTA/GTIS

Page 21 of 24
Table C. Top suppliers of agricultural products to DR (US$)
UDG: Agricultural Trade SST, HS 1 through 24
Annual Series: 2012 - 2016
Reporting
Country
United States Dollars
2012 2013 2014 2015 2016
Reporting
Total
2,358,059,766
2,339,834,383
2,485,272,372
2,460,188,576
2,528,428,029
United States
1,090,561,919
1,136,755,658
1,366,402,895
1,214,396,057
1,266,582,243
Brazil
196,982,269
156,561,124
94,049,563
140,827,922
123,596,272
Argentina
202,581,560
222,142,304
79,761,872
76,655,407
109,378,135
Mexico
70,498,729
86,210,008
94,395,220
105,886,571
96,821,187
Spain
48,537,920
56,655,626
63,340,124
70,966,733
82,044,154
Costa Rica
64,558,636
61,235,264
62,994,132
65,556,239
71,157,538
Denmark
65,003,103
70,314,808
73,872,248
55,468,449
67,750,759
China
61,061,508
49,030,865
47,415,746
41,825,678
62,774,567
United
Kingdom
42,590,745
36,680,994
50,190,207
58,417,523
54,296,500
Guatemala
29,105,890
39,688,068
45,621,923
54,948,659
51,244,567
Canada
42,561,876
30,804,390
38,244,800
56,735,830
47,389,384
Netherlands
46,938,743
41,238,222
50,126,889
40,576,968
41,237,985
Norway
42,544,050
37,689,674
43,857,822
39,955,129
40,961,390
Colombia
40,426,767
18,609,753
35,934,461
46,776,452
37,204,270
Ecuador
21,305,765
26,779,215
36,140,379
33,748,322
37,029,021
Honduras
25,582,280
30,825,748
35,343,472
58,542,355
36,234,263
Chile
30,125,868
29,638,214
33,060,283
31,928,622
33,004,033
India
16,826,379
11,535,537
15,061,420
16,878,960
26,342,853
El Salvador
29,839,135
22,648,694
20,647,824
22,327,691
24,967,400
France
23,241,271
23,371,266
32,724,989
36,748,948
24,625,445
Germany
12,941,952
19,596,552
23,553,619
22,352,427
22,066,921
Peru
14,828,859
13,134,820
14,629,650
18,554,257
21,527,188

Page 22 of 24
UDG: Agricultural Trade SST, HS 1 through 24
Annual Series: 2012 - 2016
Reporting
Country
United States Dollars
2012 2013 2014 2015 2016
Belgium
7,255,008
12,576,988
15,482,359
18,326,820
21,449,993
Italy
11,712,707
12,657,427
14,216,284
15,062,230
18,092,786
Nicaragua
12,191,150
20,939,003
20,772,510
28,650,074
17,008,526
Indonesia
9,427,308
14,171,558
16,649,971
14,839,200
16,718,889
Thailand
17,700,762
11,797,061
11,796,439
13,204,891
12,829,795
New Zealand
7,759,963
8,268,535
10,395,711
9,728,519
10,087,265 Source: GTIS

Page 23 of 24
APPENDIX II. BASKET OF PRODUCTS ACCORDING TO TARIFFS SCHEDULE AND
EXAMPLES OF POTENTIAL PRODUCTS IN EACH CATEGORY
Basket Tariff schedule reduction/ example of potential products
A
Duty free (0%) immediately
Potential products: Breakfast cereals WO sugar; Grape wine; Apple juice.
Other products: Chicken wings, de-boned turkey breast, rabbit meat, some fish, some
vegetables and salads, cold weather fruits, such as apples, grapes, pears, dry fruits, tea,
species, olive oil, breakfast cereals, olives, capers, some fruit juices, sparkling wine.
B
Duty free as off January 1, 2010.
Potential products: Potato fries frozen.
Other products: Chicken breasts, red salmon, lobsters, cauliflower, broccoli and Brussels
sprouts, beets, water melon, preparations from turkey meat, preparations of caviar, crabs and
shrimp, preparations of salads and fruits, cigars.
C
10% annual reduction, duty free by January 1, 2015 (reduction over 10 years).
Potential products: Baby food.
Other products:
Bacon, liquid milk, butter, other cheeses, lamb and mutton, turkey breast with bone,
potatoes, chick peas, dry coconuts, cashew nuts, tropical fruits, sweets of orange, lemons
and papaya, tomato or papaya juice, mustard, mayonnaise, compound seasonings , whisky,
gin, liquors.
D
6.66% annual reduction, duty free by January 1, 2020 (reduction over 15 years).
Potential products: Bread, biscuits, other baked products; Beer, malt; Cheese, Cheddar.
Other products: Prime and choice beef, beef trimmings, onions, garlic, vegetable oil,
margarine, cheddar cheese, beans.
F
No reduction until January 1, 2016. 10% annual reduction from January 1, 2016 -2025.
Other products: Milk powder, Yogurt.
G Free trade even before CAFTA-DR.
M
2% reduction in 2006. 2% additional reduction in 2007. 8% additional annual reduction
from 2008-2012. 16% additional annual reduction from 2012 - 2015.
Other products: Wooden furniture.
N
8.3% annual reduction from 2006 - 2017.
Other products: Potatoes, turkey meat, ice cream, glucose and glucose syrup, pig fat.

Page 24 of 24
Basket Tariff schedule reduction/ example of potential products
O
No reduction until January 1, 2012. 10% annual reduction from January 2012 - 2016. 12%
annual reduction from 2016 - 2020.
Other products: Pork cuts.
V
No reduction until January 2016. 8% annual reduction from January 2016 - 2021. 12%
annual reduction from January 2021-2025.
Other products: Rice, Chicken leg quarters, mozzarella cheese.
W
Duty free as off January 1, 2009.
Other products: Turkeys not cut in pieces.
X Duty free as off January 1, 2010.
Y 15percent annual reduction from 2006-10. 5percent annual reduction from 2011-15.
Other products: Chicken, not cut in pieces.
Recommended