Does Private Equity have a role in Superannuation
Portfolios?
Kar Mei TangAVCAL
18th Melbourne Money & Finance Conference1 & 2 July 2013
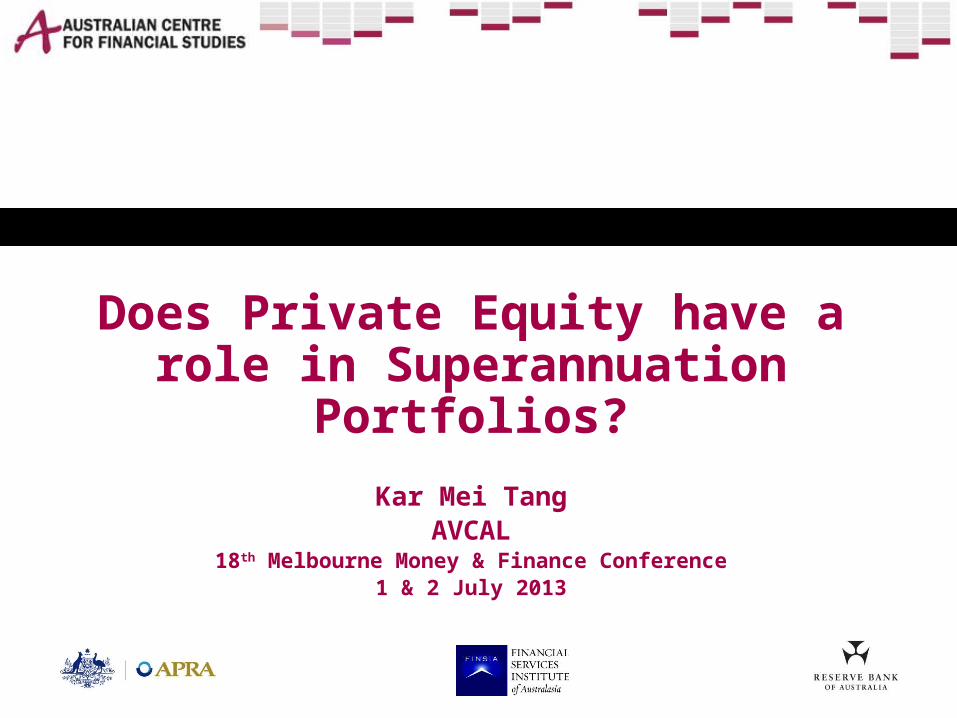
Why do pension funds currently invest in PE?
Target superior LT returns
Diversification Future Fund:- PE fulfils
2 functions in the portfolio: high alpha, and exposure to investment themes not available through liquid assets
Ave. PE allocation (% of assets) of pension plans, by country/region
Sources: Bain Global Private Equity Report 2013, Mercer European Asset Allocation Survey 2012, Preqin, AVCAL analysis.

Meeting the returns challenge
Source: Cambridge Associates, returns as of 31 Dec 2012. C|A Australian PE Index returns are net of management fees, expenses, and carried interest.
Australian PE vs ASX 300 returns (31 Dec 2012)
1 year 3 year 5 year 10 yearsC |A Australian PE Index (AUD terms) 6.77 8.19 3.96 9.67S&P/ASX 300 Acc. Index 19.74 2.8 -1.81 9.05S&P/ASX 300 Acc. PME 20.12 2.89 0.66 4.17
Source: Commonwealth Superannuation Corporation

-4
0
4
8
12
16
%
Manager selection is important too
Australian PE vs super returns
1-yr 3-yr 5-yr 10-yr returns returns returns returns
Sources: Cambridge Associates, Chant West, AVCAL analysis. Returns as of 31 Dec 2012. Super funds data for Growth options only. All returns are net of investment fees and tax.
-4
0
4
8
12
16
%
1-yr 3-yr 5-yr 10-yr returns returns returns returns
Australian Top 2-quartile PE vs Top 2-quartile super returns
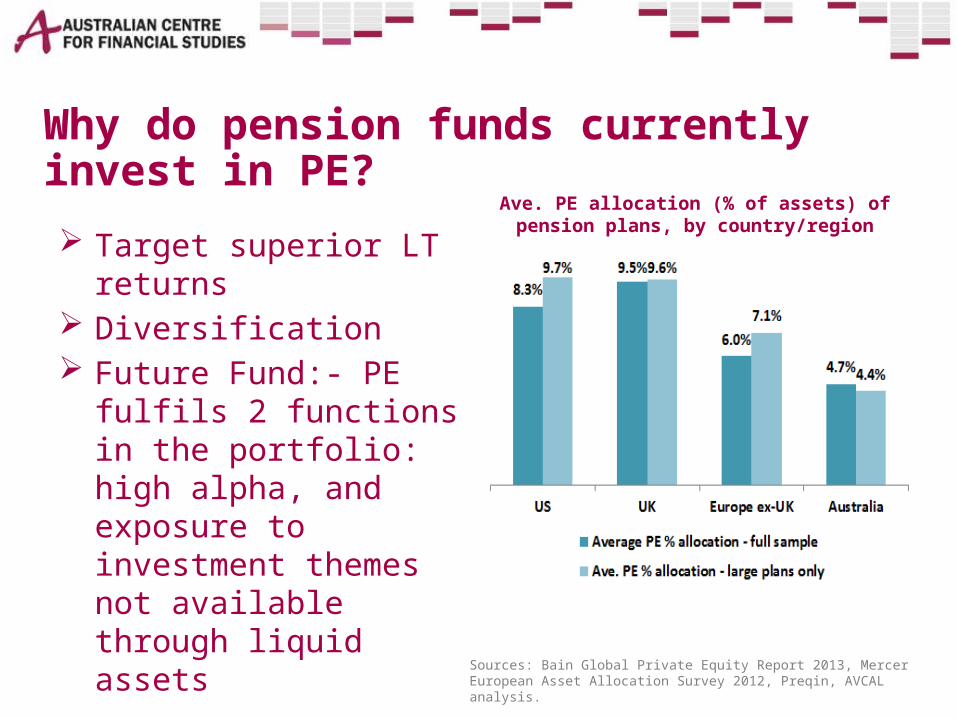
Come for the returns, stay for the diversification
-25
-20
-15
-10
-5
0
5
10
15
2005 Q1 2006 Q1 2007 Q1 2008 Q1 2009 Q1 2010 Q1 2011 Q1 2012 Q1
%
Cambridge Associates AU PE and VC Index Return S&P/ASX 300 index return
-50
-40
-30
-20
-10
0
10
20
30
40
9/30/2001 9/30/2005 9/30/2009
%
Cambridge Associates AU PE and VC Index Return S&P/ASX 300 index return
Volatility of quarterly returns:PE & VC Index stdev: 4.9% S&P/ASX 300 Index stdev: 8.1% Freq. of positive returns:PE & VC Index: 71% S&P/ASX 300 Index: 58%
Volatility of annual returns:PE & VC Index stdev: 14.4% S&P/ASX 300 Index stdev: 17.9% Freq. of positive returns:PE & VC Index: 75% S&P/ASX 300 Index: 67% Sources: Cambridge Associates, S&P, AVCAL analysis
Australian PE vs ASX 300: Quarterly returns
Australian PE vs ASX 300: Annual returns
But…
LiquidityFees

Liquidity
Managing liquidity risk: APRA guidance ASFA, FSC guidance Stronger Super reforms Internal controls
An allocation to illiquid assets does have a risk-adjusted return payoff Cummings & Ellis (2011) looks
at Australian DC investments in illiquid assets
Funds with moderate (below 30%) allocations to illiquid investments have higher risk-adjusted returns
Illiquid asset allocations linked to higher
Source: Cummings and Ellis (2011)
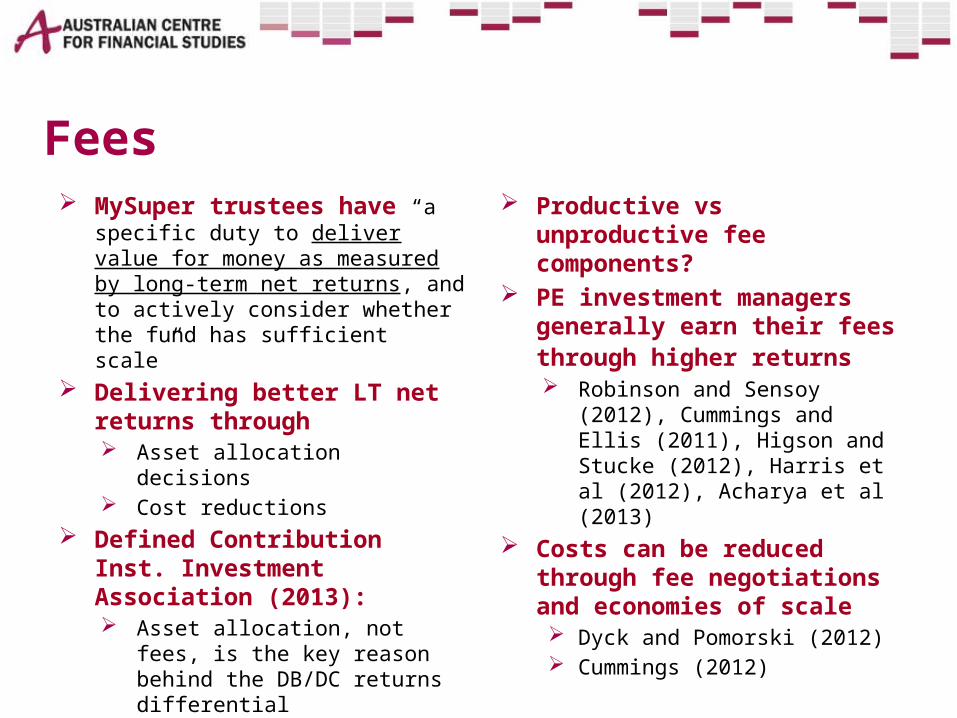
Fees MySuper trustees have “a
specific duty to deliver value for money as measured by long-term net returns, and to actively consider whether the fund has sufficient scale”
Delivering better LT net returns through Asset allocation decisions Cost reductions
Defined Contribution Inst. Investment Association (2013): Asset allocation, not fees, is
the key reason behind the DB/DC returns differential
Productive vs unproductive fee components?
PE investment managers generally earn their fees through higher returns Robinson and Sensoy (2012),
Cummings and Ellis (2011), Higson and Stucke (2012), Harris et al (2012), Acharya et al (2013)
Costs can be reduced through fee negotiations and economies of scale Dyck and Pomorski (2012) Cummings (2012)
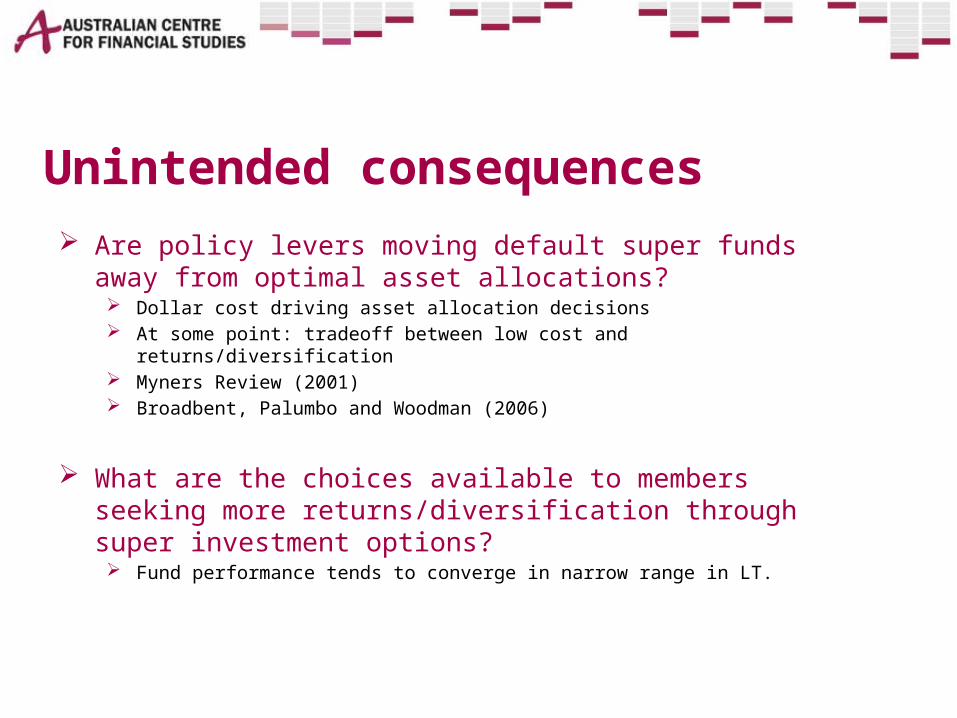
Unintended consequences Are policy levers moving default super funds away from
optimal asset allocations? Dollar cost driving asset allocation decisions At some point: tradeoff between low cost and returns/diversification Myners Review (2001) Broadbent, Palumbo and Woodman (2006)
What are the choices available to members seeking more returns/diversification through super investment options? Fund performance tends to converge in narrow range in LT.
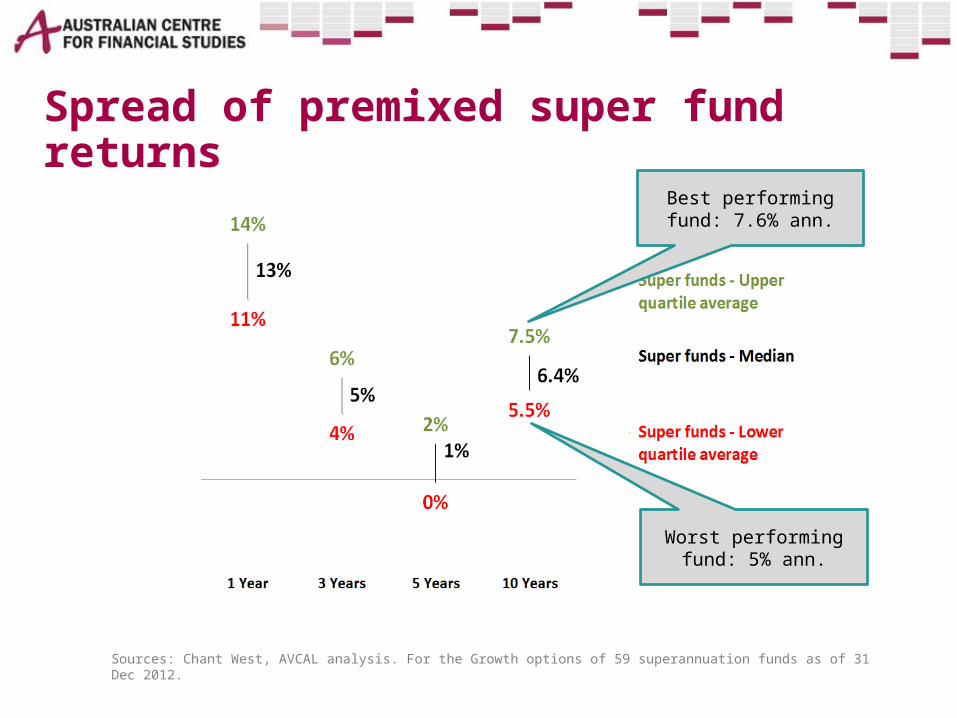
Spread of premixed super fund returns
Sources: Chant West, AVCAL analysis. For the Growth options of 59 superannuation funds as of 31 Dec 2012.
Best performing fund: 7.6% ann.
Worst performing fund: 5% ann.
Summary
Retirement savings adequacy a looming problem
PE has historically delivered, but good manager selection and a LT focus needed
Room for more diversity in: asset allocations options available to
members wanting access to high-performing asset classes through super
Further work: getting members more
engaged policy levers with
unintended LT consequences
look at global best practice: how mature pension PE programmes approach the asset class to deliver value

THANK YOU
Recommended