Does Housework Lower Wages and Why? Evidence for Britain
Mark BryanInstitute for Social and Economic Research,
University of Essex
Almudena Sevilla SanzUniversity of Oxford
04/12/2007 (2)
Introduction
• Gender pay gap in the UK is (still) about 18% (full time workers).
• Traditional explanation based on differences in human capital and job characteristics, with residual attributed to discrimination.
• Domestic commitments have indirect influence on wages via career interruptions which limit human capital accumulation (Mincer and Polachek, 1974).
• We investigate the direct impact of housework on wages (holding constant human capital and hours of work).
04/12/2007 (3)
Background• Becker (1985) described a model of allocating time
and energy/effort between housework and market work.
• Model predicts that time spent on (energy intensive) housework reduces effort in the market and hence the wage.
• US evidence (e.g. Hersch and Stratton, 1997, 2000) finds negative effects for women. Effects for men? Does marriage (and domestic specialisation) matter?
• For Denmark, Bonke et al (2005) find negative effects for women, especially for housework done just before/after market work. But positive effects for men.
04/12/2007 (4)
Our aims and contribution
• Document negative effects of housework on wages in Britain.
• Do effects differ by gender and marital status and if so why? Amount, type or timing of housework?
• Use longitudinal data from BHPS + work-life histories. Control for actual experience + measured human capital + job characteristics + fixed effects.
• Supplementary analysis of housework type and timing using UK TUS.
04/12/2007 (5)
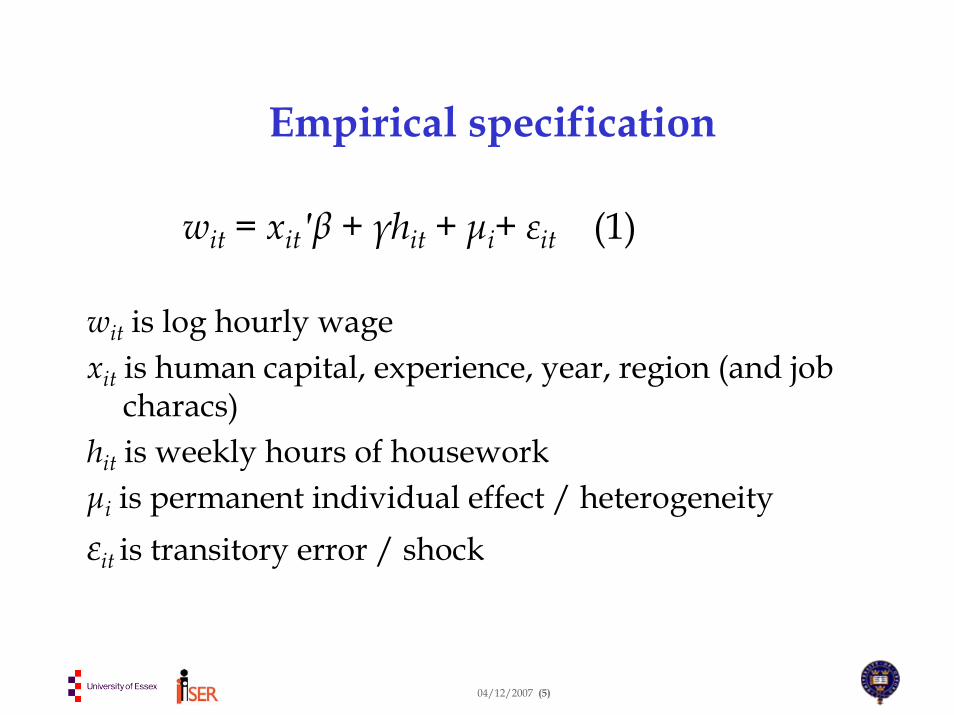
Empirical specification
wit = xit′β + γhit + μi+ εit (1)
wit is log hourly wagexit is human capital, experience, year, region (and job
characs)hit is weekly hours of houseworkμi is permanent individual effect / heterogeneityεit is transitory error / shock
04/12/2007 (6)
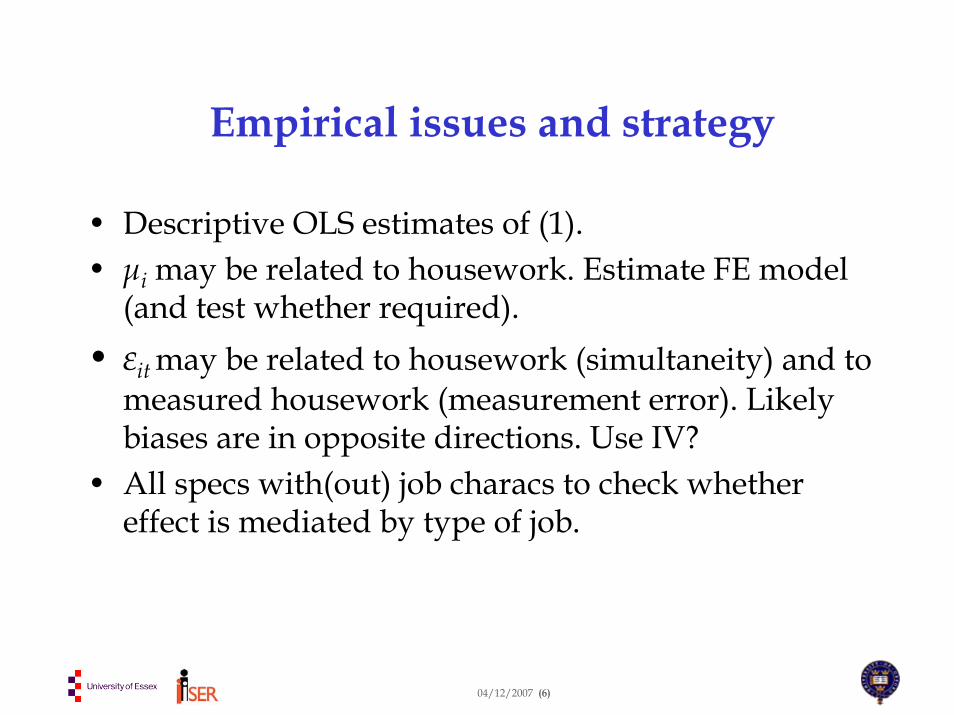
Empirical issues and strategy
• Descriptive OLS estimates of (1).• μi may be related to housework. Estimate FE model
(and test whether required).• εit may be related to housework (simultaneity) and to
measured housework (measurement error). Likely biases are in opposite directions. Use IV?
• All specs with(out) job characs to check whether effect is mediated by type of job.
04/12/2007 (7)
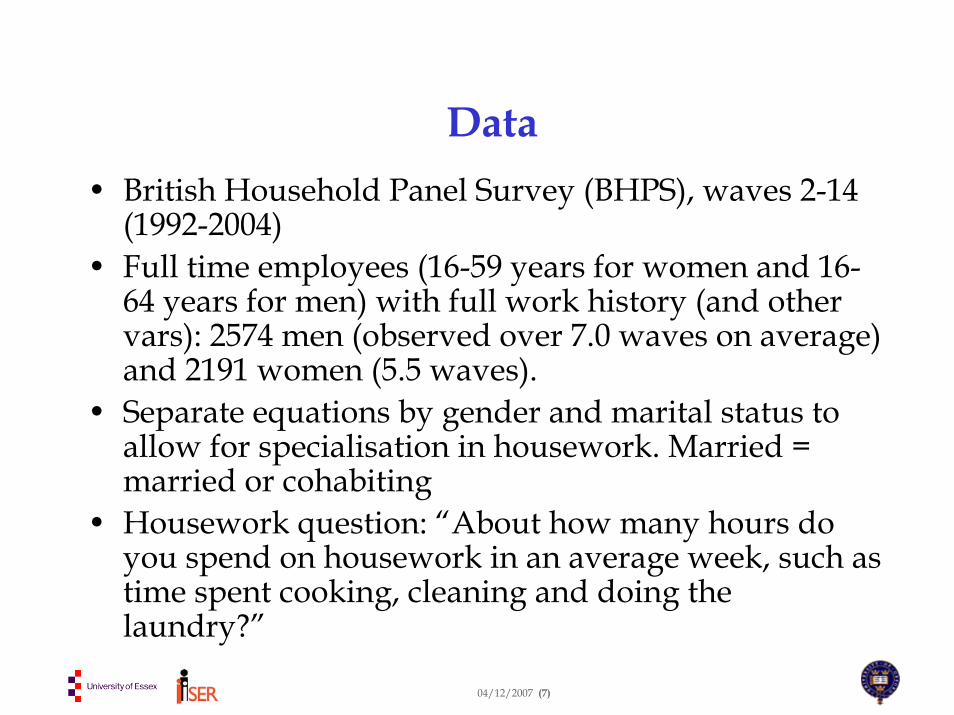
Data• British Household Panel Survey (BHPS), waves 2-14
(1992-2004)• Full time employees (16-59 years for women and 16-
64 years for men) with full work history (and other vars): 2574 men (observed over 7.0 waves on average) and 2191 women (5.5 waves).
• Separate equations by gender and marital status to allow for specialisation in housework. Married = married or cohabiting
• Housework question: “About how many hours do you spend on housework in an average week, such as time spent cooking, cleaning and doing the laundry?”
04/12/2007 (8)
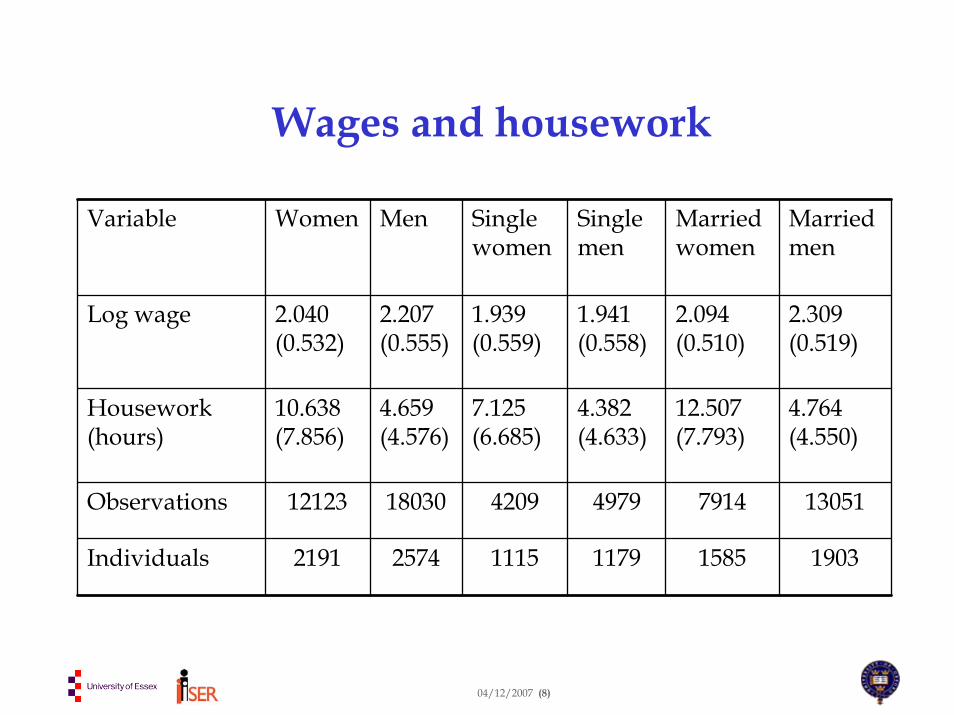
Wages and housework
Variable Women Men Single women
Single men
Married women
Married men
Log wage 2.040(0.532)
2.207(0.555)
1.939(0.559)
1.941(0.558)
2.094(0.510)
2.309(0.519)
Housework (hours)
10.638(7.856)
4.659(4.576)
7.125(6.685)
4.382(4.633)
12.507(7.793)
4.764(4.550)
Observations 12123 18030 4209 4979 7914 13051
Individuals 2191 2574 1115 1179 1585 1903
04/12/2007 (9)
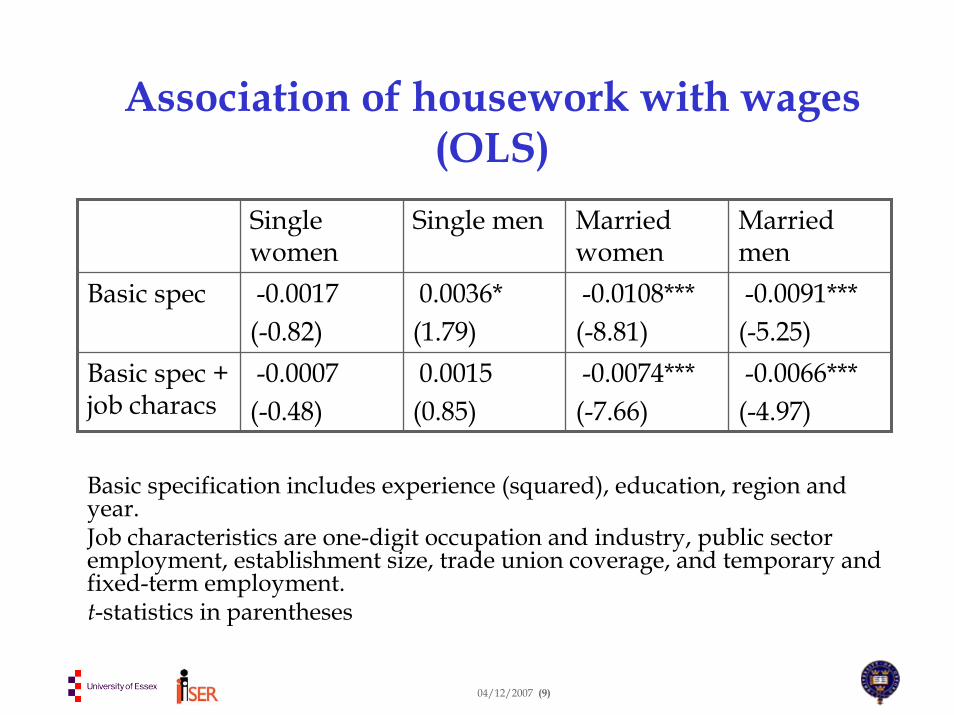
Association of housework with wages (OLS)
Single women
Single men Married women
Married men
Basic spec -0.0017 (-0.82)
0.0036* (1.79)
-0.0108***(-8.81)
-0.0091***(-5.25)
Basic spec + job characs
-0.0007(-0.48)
0.0015(0.85)
-0.0074*** (-7.66)
-0.0066***(-4.97)
Basic specification includes experience (squared), education, region and year.Job characteristics are one-digit occupation and industry, public sector employment, establishment size, trade union coverage, and temporary and fixed-term employment.t-statistics in parentheses
04/12/2007 (10)
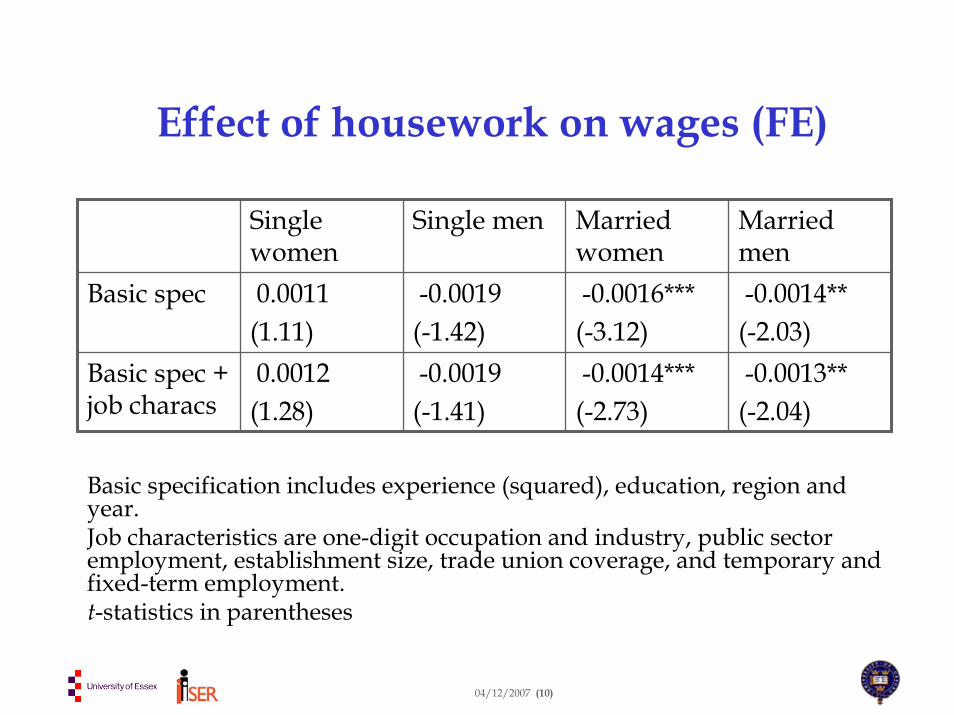
Effect of housework on wages (FE)
Single women
Single men Married women
Married men
Basic spec 0.0011(1.11)
-0.0019(-1.42)
-0.0016***(-3.12)
-0.0014**(-2.03)
Basic spec + job characs
0.0012(1.28)
-0.0019(-1.41)
-0.0014***(-2.73)
-0.0013**(-2.04)
Basic specification includes experience (squared), education, region and year.Job characteristics are one-digit occupation and industry, public sector employment, establishment size, trade union coverage, and temporary and fixed-term employment.t-statistics in parentheses
04/12/2007 (11)
Effect of housework on wages (FE)
• Still no effect for singles.• Negative effect for married women• Only weak evidence of an effect for married men
(difference compared to single men is NS). • One hour extra housework per week lowers married
women’s wages by 0.16%. • Is married men’s result due to low variance of men’s
housework? Can only use available data… What would happen if some men increased their housework to women’s levels (behaved like women…)?
04/12/2007 (12)
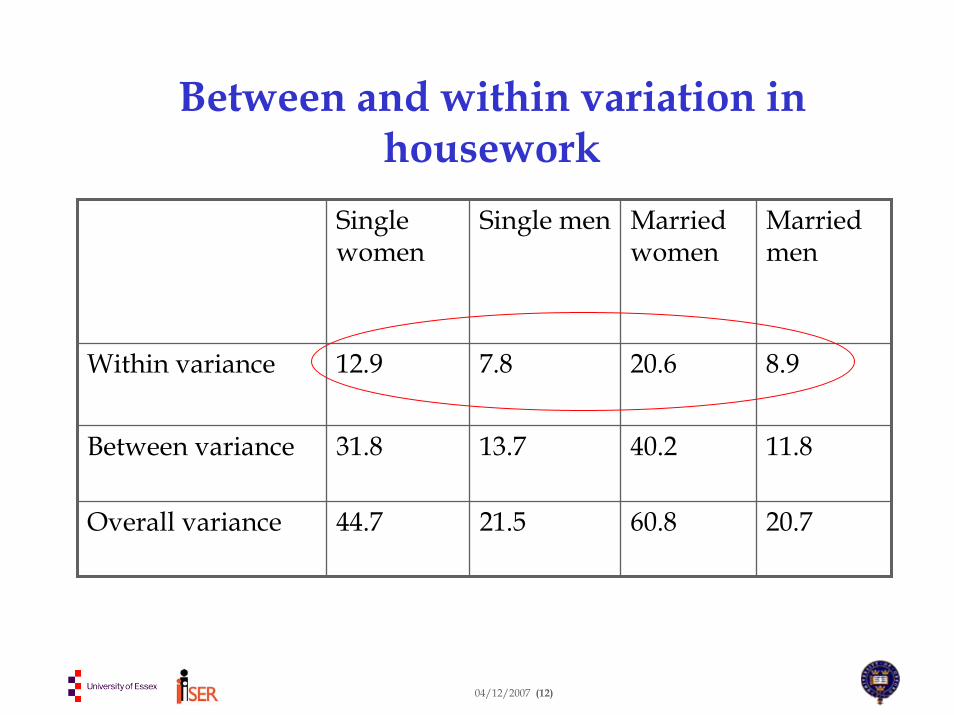
Between and within variation in housework
Single women
Single men Married women
Married men
Within variance 12.9 7.8 20.6 8.9
Between variance 31.8 13.7 40.2 11.8
Overall variance 44.7 21.5 60.8 20.7
04/12/2007 (13)
Simultaneity and measurement error
wit = xit′β + γhit + μi+ εit
• FE controls for permanent heterogeneity (μi), but not for correlation of εit with (measured) housework.
• Wage increase may reduce housework time, e.g. use pay rise to hire a cleaner. Then εit is negatively correlated with hit.
• If γ is negative, classical measurement error in housework (only) implies that measured housework and εit are positively correlated.
• Overall effect ambiguous...
04/12/2007 (14)
Alternative estimates and specifications • FE IV – but which instruments? Try spousal labour
market behaviour and total number of employed household members.
• Use panel to find instruments? Estimate FD equation; instrument housework by 2nd lag of housework in levels. More generally use further lags: panel GMM.
• Use lagged housework as alternative measure. No ambiguity in timing of wage vs housework changes. Less endogeneity bias(?). Estimates are total effect of lagged housework (inc effect of current housework correlated with past housework).
04/12/2007 (15)
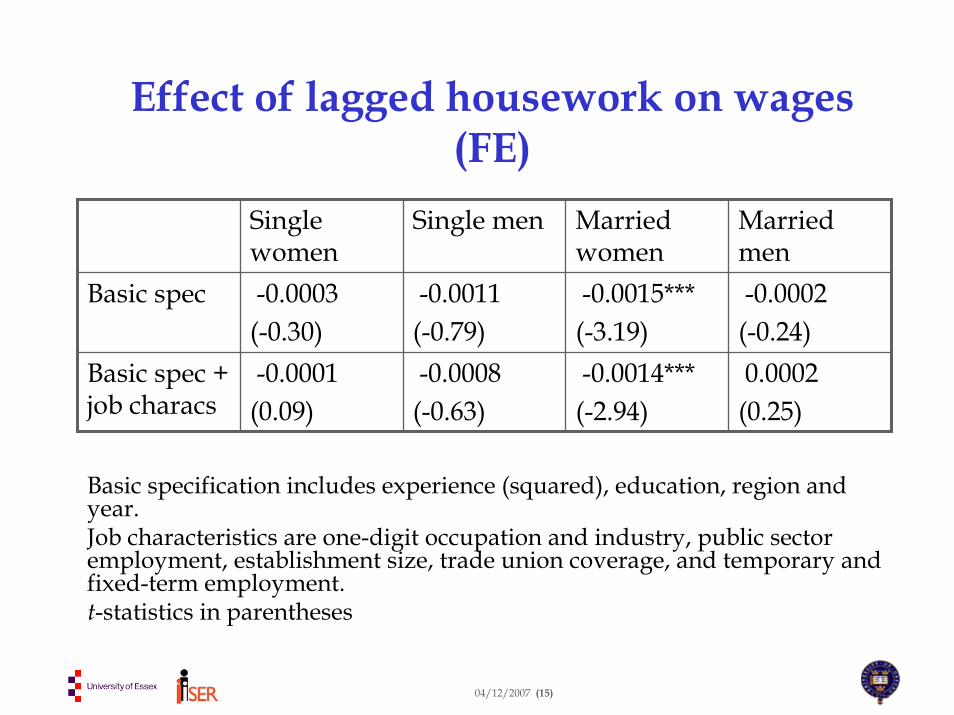
Effect of lagged housework on wages (FE)
Single women
Single men Married women
Married men
Basic spec -0.0003(-0.30)
-0.0011(-0.79)
-0.0015***(-3.19)
-0.0002(-0.24)
Basic spec + job characs
-0.0001(0.09)
-0.0008(-0.63)
-0.0014***(-2.94)
0.0002(0.25)
Basic specification includes experience (squared), education, region and year.Job characteristics are one-digit occupation and industry, public sector employment, establishment size, trade union coverage, and temporary and fixed-term employment.t-statistics in parentheses
04/12/2007 (16)
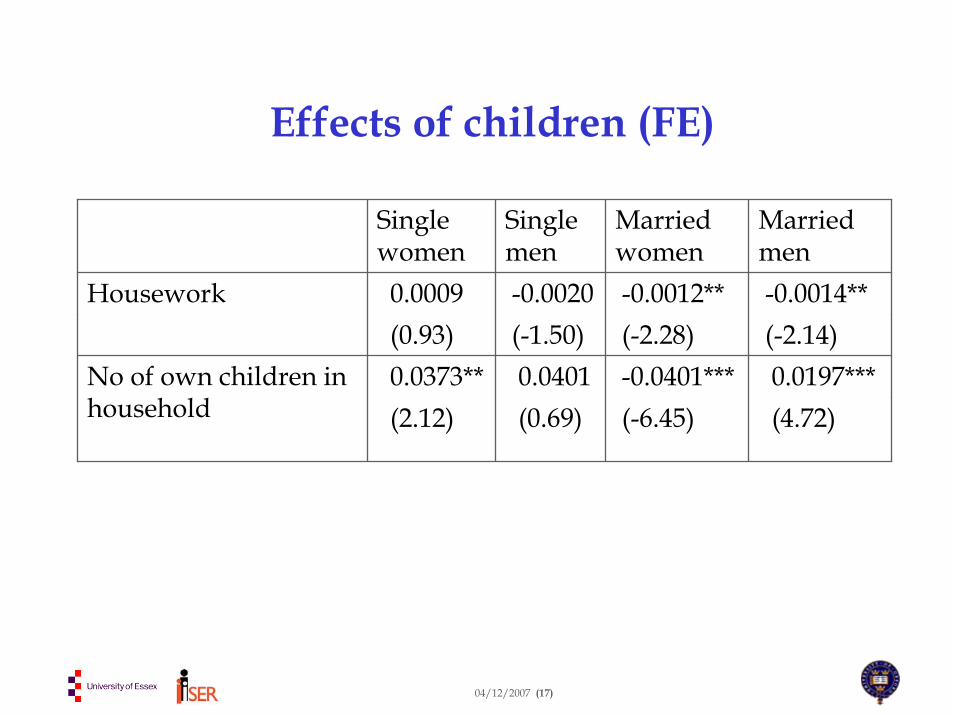
Effects of children
• We do not have data on childcare. But we know children are associated with lower wages for women (“family gap”, e.g. Waldfogel, 1998). What about men?
• Childcare is correlated with housework: in our data children are associated with 3 hours more housework for women and 0.5 hour for men.
• Does omitted childcare bias housework coefficients?• Test whether housework coefficients are picking up
childcare effect.
04/12/2007 (17)
Effects of children (FE)
Single women
Single men
Married women
Married men
Housework 0.0009 -0.0020 -0.0012** -0.0014** (0.93) (-1.50) (-2.28) (-2.14) 0.0373** 0.0401 -0.0401*** 0.0197***(2.12) (0.69) (-6.45) (4.72)
No of own children in household
04/12/2007 (18)
Dimensions of housework: amount, type and timing
• Do only large amounts of housework have an effect?• Could explain lack of effect for singles and married
men?• Try quadratic and spline functions (nodes at 5 and 10
hours).• Find no evidence of non-linear effects.
04/12/2007 (19)
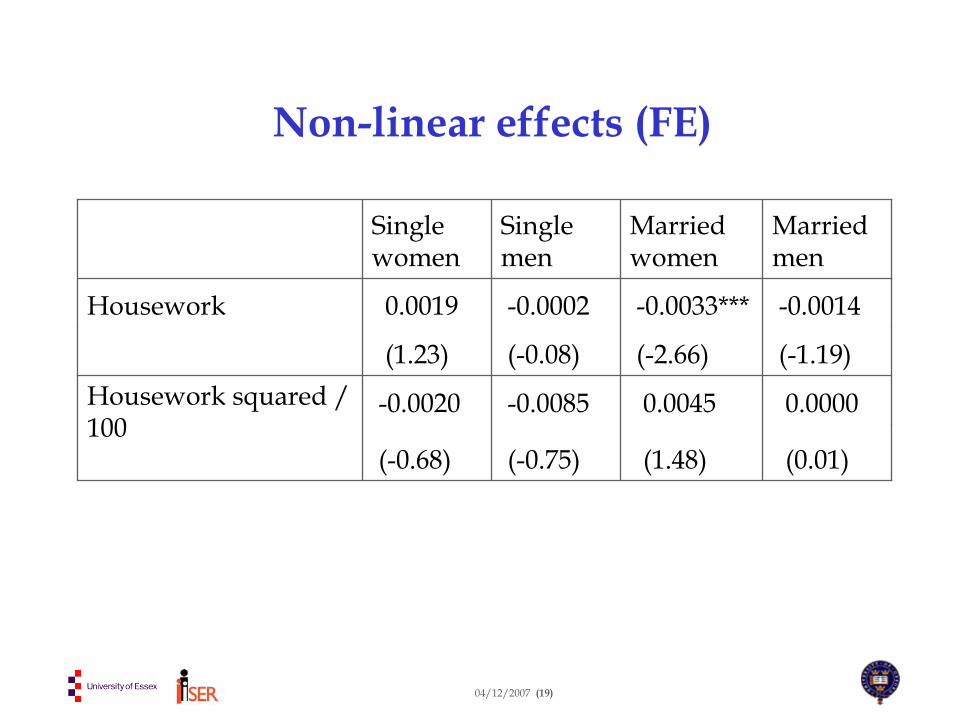
Non-linear effects (FE)
Single women
Single men
Married women
Married men
Housework 0.0019 -0.0002 -0.0033*** -0.0014
(1.23) (-0.08) (-2.66) (-1.19)
-0.0020 -0.0085 0.0045 0.0000
(-0.68) (-0.75) (1.48) (0.01)
Housework squared / 100
04/12/2007 (20)
Type and timing of housework
• No information on type and timing in BHPS, but use complementary descriptive data from UK Time Use Survey 2000 .
• UK TUS is based on time diaries.• What doing in 10 min slots throughout day: primary,
secondary activity; with whom; where.• But limitations in earnings data (net, some banded,
last pay period only) . Cross section only.
04/12/2007 (21)
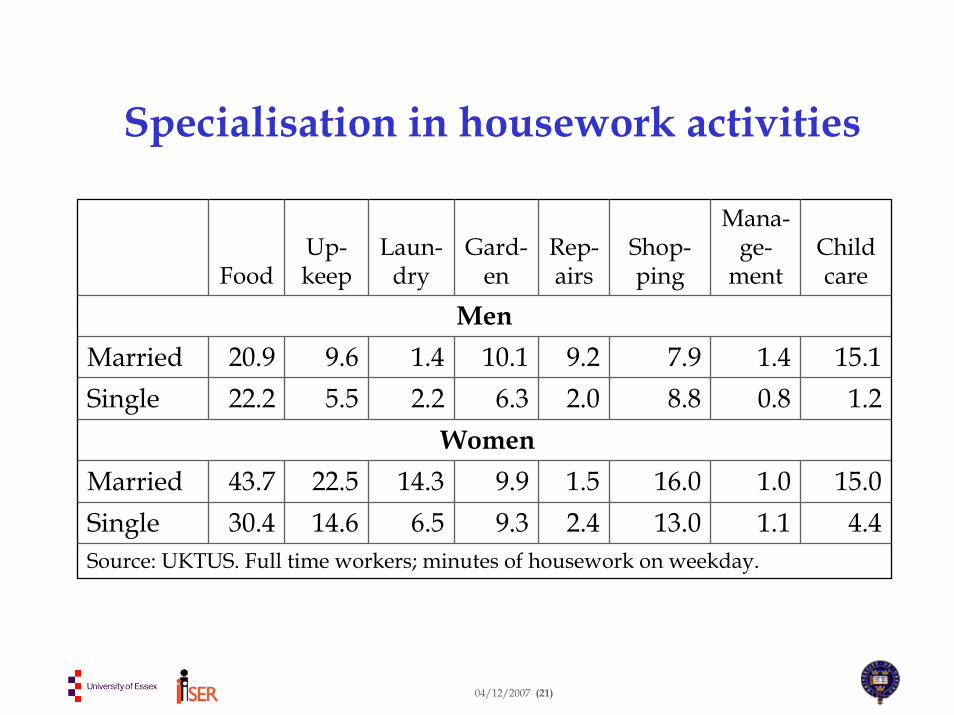
Specialisation in housework activities
FoodUp-keep
Laun-dry
Gard-en
Rep-airs
Shop-ping
Mana-ge-
mentChildcare
MenMarried 20.9 9.6 1.4 10.1 9.2 7.9 1.4 15.1Single 22.2 5.5 2.2 6.3 2.0 8.8 0.8 1.2
WomenMarried 43.7 22.5 14.3 9.9 1.5 16.0 1.0 15.0Single 30.4 14.6 6.5 9.3 2.4 13.0 1.1 4.4Source: UKTUS. Full time workers; minutes of housework on weekday.
04/12/2007 (22)
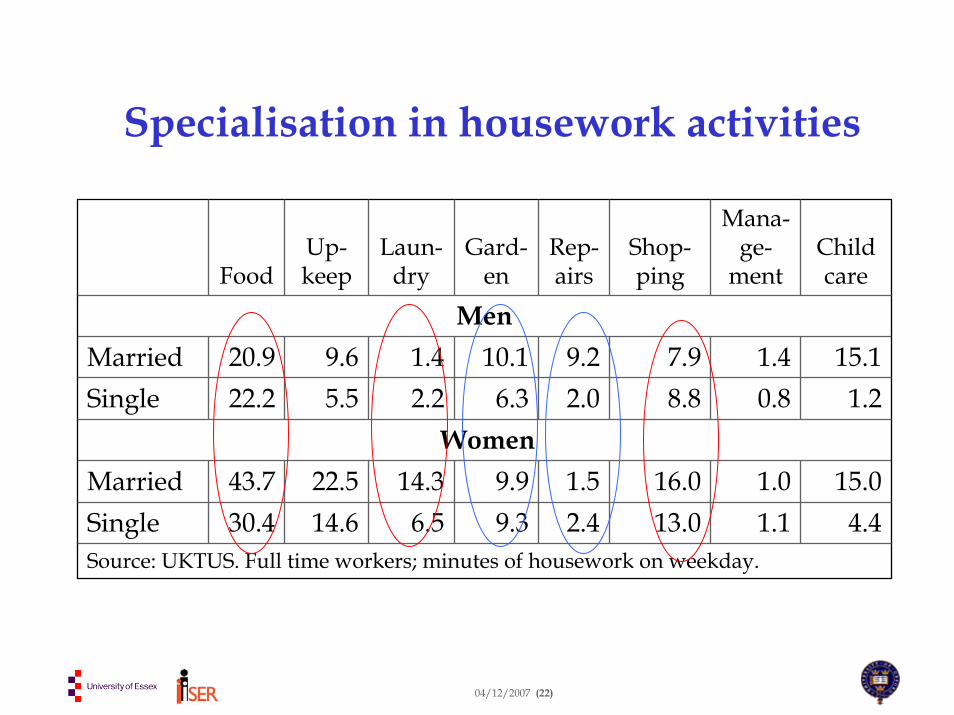
Specialisation in housework activities
FoodUp-keep
Laun-dry
Gard-en
Rep-airs
Shop-ping
Mana-ge-
mentChildcare
Men10.1 9.26.3 2.0
9.9 1.59.3 2.4
Married 20.9 9.6 1.4 7.98.8
16.013.0
1.4 15.1Single 22.2 5.5 2.2 0.8 1.2
WomenMarried 43.7 22.5 14.3 1.0 15.0Single 30.4 14.6 6.5 1.1 4.4Source: UKTUS. Full time workers; minutes of housework on weekday.
04/12/2007 (23)
Specialisation in housework activities
• Married women specialize in more routine and time intensive activities, e.g. food, laundry, shopping.
• Married men specialize in gardening, household management and repairs.
• Consistent with other studies, e.g. Hersh and Stratton (2002) [US] and Fernandez and Sevilla-Sanz (2006) [Spain].
• Lack of threshold effects suggests effect on wages is not because married women’s housework activities are time-intensive
• More likely, these activities need to be done routinely, usuallyduring work-days, and cannot be postponed until the weekend.
• Do not know whether these types of housework are more tiring but can check timing relative to market work.
04/12/2007 (24)
Timing of paid work and housework0
.1.2
.3.4
Popo
rtion
of t
ime
in h
ouse
wor
k
4am 8am 12pm 4pm 8pm 12am 3.50amTime
Men
0.1
.2.3
.4Po
porti
on o
f tim
e in
hou
sew
ork
4am 8am 12pm 4pm 8pm 12am 3.50amTime
Women0
.2.4
.6.8
1Po
porti
on o
f tim
e in
wor
k
4am 8am 12pm 4pm 8pm 12am 3.50amTime
Men
0.2
.4.6
.81
Popo
rtion
of t
ime
in w
ork
4am 8am 12pm 4pm 8pm 12am 3.50amTime
Women
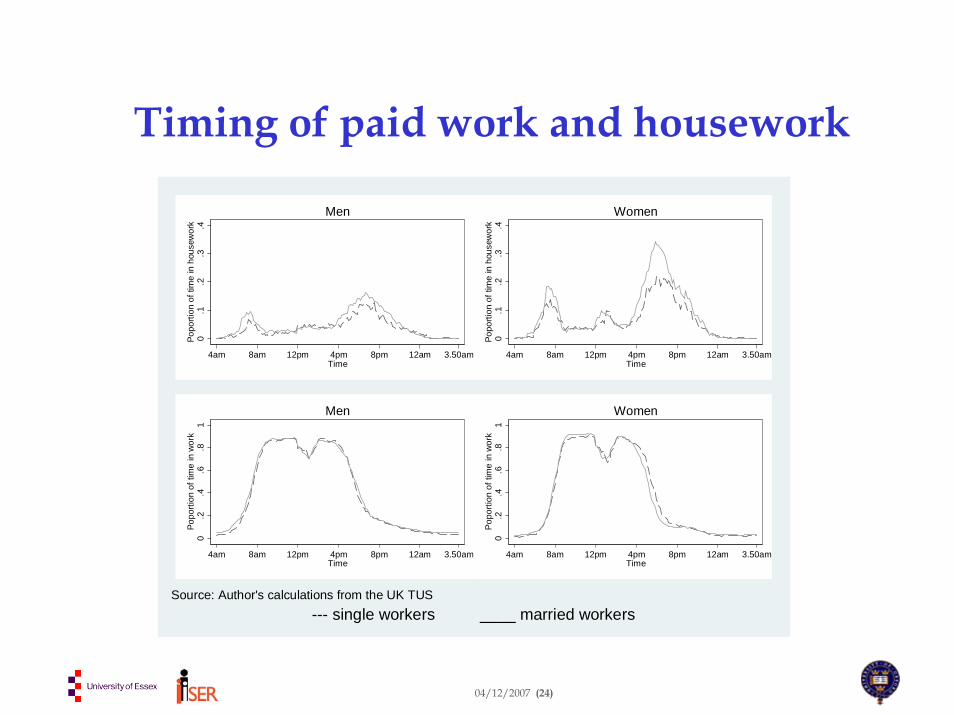
Source: Author's calculations from the UK TUS--- single workers ____ married workers
04/12/2007 (25)
Timing of paid work and housework
• Married men and women do more housework between 4pm and 8pm than singles.
• But both married and single men spend about the same time on work (44% between 4pm-8pm)
• Whereas married women do less work than singles over these times (32% of time vs 40% of time for single women).
• Married women’s housework appears to be done at times that interfere with market work.
04/12/2007 (26)
Robustness checks
• Include children variables to check estimated housework effect is not due to (omitted) childcare.
• Include PT workers. Stronger effects (inc married men), but are FT and PT workers comparable?
• Including age instead of experience (larger samples). V similar estimates.
• Combined married-single equations with interactions (but fixed effect constrained to be same across marital status).
04/12/2007 (27)
Conclusions
• We find that housework reduces wages for married women but not single women or men.
• Best estimate is marginal effect of -0.16.• Marriage appears to matter for women but not for
men because it involves domestic specialisation and introduces synchronisation requirements between partners type and timing of housework matter more than amount.

04/12/2007 (28)
Extra slides
04/12/2007 (29)
IV estimation
• IV is potentially a solution to simultaneity and measurement error.
• Have already controlled for μi using FE. So need instruments strongly correlated with (changes in ) hit and uncorrelated with εit FE IV estimation.
• Focus on married individuals (as seemingly no effect for singles), allowing use of spousal characteristics.
• Instruments: spousal labour market participation, hours of work, occupation and wage, and the total number of employed household members.
• Also tried spousal attitudes towards domestic roles (limited number of waves, and low variation over time).
04/12/2007 (30)
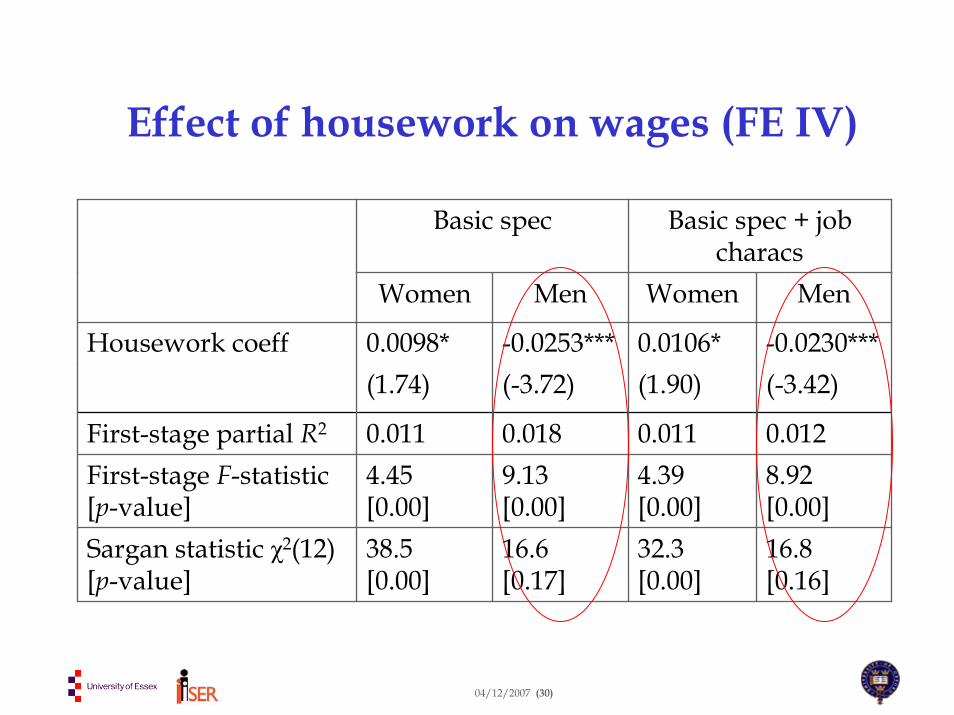
Effect of housework on wages (FE IV)
Basic spec Basic spec + job characs
Women Men Women Men
Housework coeff 0.0098* -0.0253*** 0.0106* -0.0230***(1.74) (-3.72) (1.90) (-3.42)
First-stage partial R2 0.011 0.018 0.011 0.012First-stage F-statistic [p-value]
4.45 [0.00]
9.13 [0.00]
4.39 [0.00]
8.92[0.00]
Sargan statistic χ2(12) [p-value]
38.5 [0.00]
16.6[0.17]
32.3[0.00]
16.8[0.16]
04/12/2007 (31)
IV results
• Test indicate that changes in women’s labour market behaviour are valid instruments for (changes in) spouses’ housework.
• But changes in men’s labour market behaviour do not appear to be valid instruments. Due to differences in labour market dynamics of men vswomen?
• Focus on men’s results: one hour increase in housework leads to 2.5% reduction in wages (compared to 0.14% in FE equation).
04/12/2007 (32)
IV results contd.• FE IV estimate is larger in magnitude than FE
estimate, suggesting measurement error dominates simultaneity bias.
• Test endogeneity (either measurement error or simultaneity) by comparing FE and IV FE results using a Hausman test.
• Test of housework coefficients only: χ2(1)=11.74 reject exogenous housework (IV preferred). Test of all coefficients: χ2(30)=11.72 do not reject exogeneity (FE preferred).
• We take this as suggestive evidence that housework is measured with error for men and that FE could be seen as a lower bound (in magnitude) on the true effect.
04/12/2007 (33)
IV results
• Instruments (spousal labour market behaviour and total number of employed household members) only test as valid in (married) men’s equation.
• FE IV estimate is larger in magnitude than FE estimate (-2.5% compared to -0.14%), suggesting measurement error dominates simultaneity bias.
• But exogeneity test (comparing FE and IV FE) does not reject [χ2(30)=11.72] FE preferred.
• FE remains our preferred specification. But suggestive evidence that housework is measured with error and that FE could be seen as a lower bound (in magnitude) on the true effect.
04/12/2007 (34)
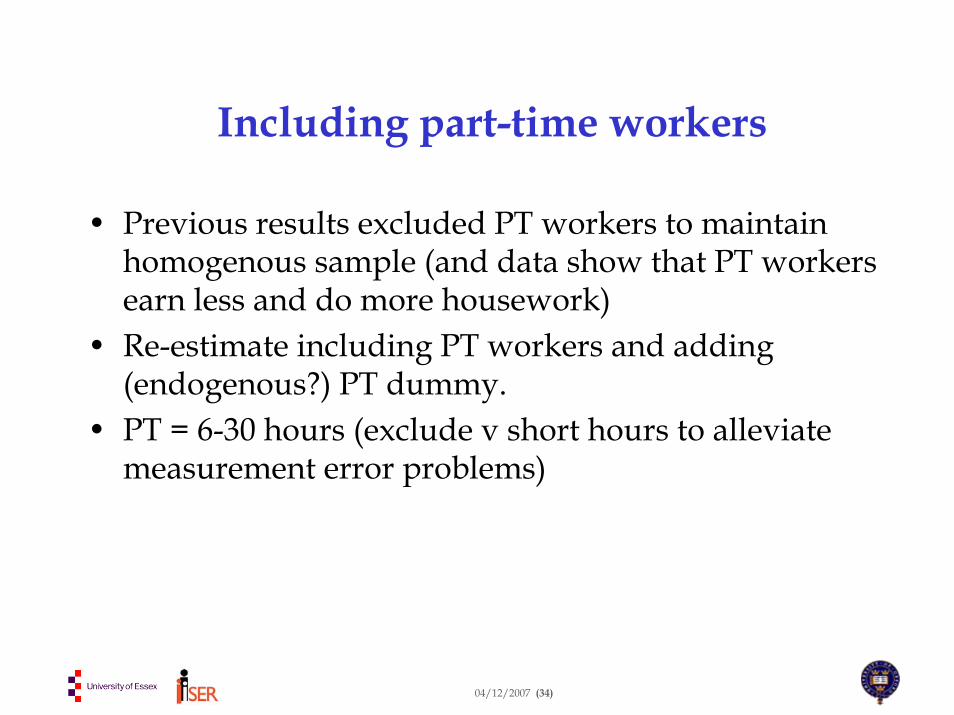
Including part-time workers
• Previous results excluded PT workers to maintain homogenous sample (and data show that PT workers earn less and do more housework)
• Re-estimate including PT workers and adding (endogenous?) PT dummy.
• PT = 6-30 hours (exclude v short hours to alleviate measurement error problems)
04/12/2007 (35)
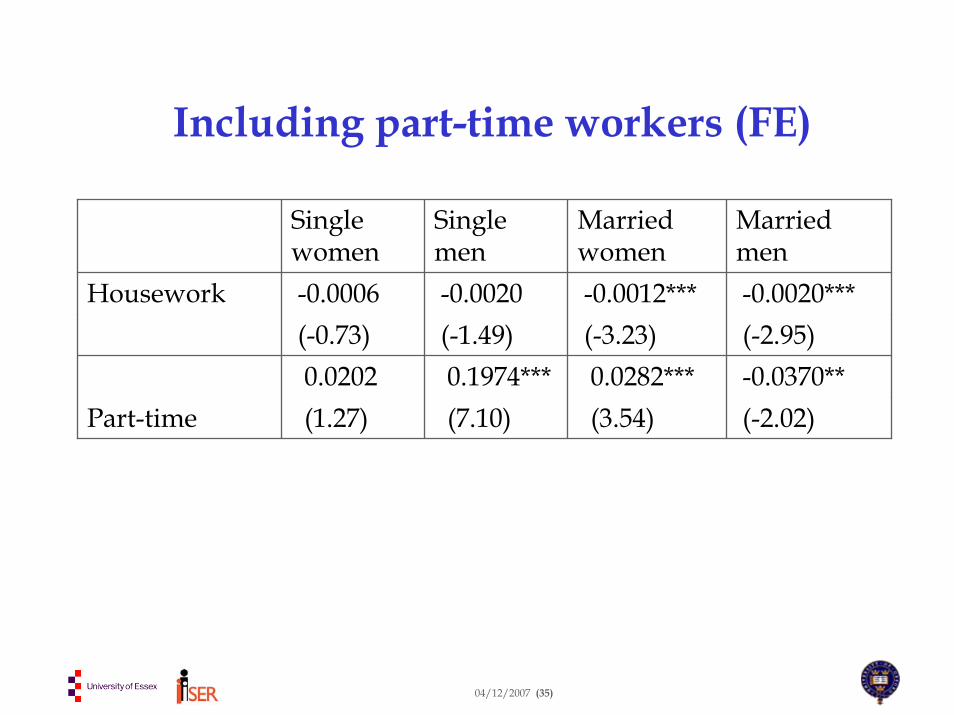
Including part-time workers (FE)
Single women
Single men
Married women
Married men
Housework -0.0006 -0.0020 -0.0012*** -0.0020*** (-0.73) (-1.49) (-3.23) (-2.95) 0.0202 0.1974*** 0.0282*** -0.0370** (1.27) (7.10) (3.54) (-2.02) Part-time
04/12/2007 (36)
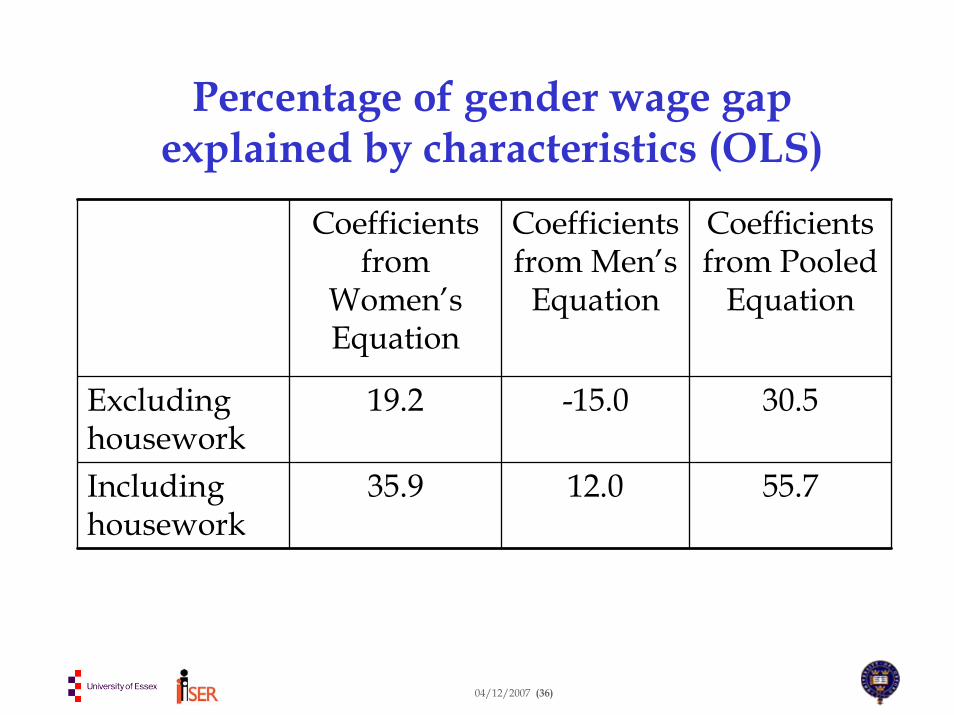
Percentage of gender wage gap explained by characteristics (OLS)
Coefficients from
Women’s Equation
Coefficients from Men’s
Equation
Coefficients from Pooled
Equation
Excluding housework
19.2 -15.0 30.5
Including housework
35.9 12.0 55.7
Recommended