Does ecosystem diversity affect soil hydraulic properties?
Investigation of biotic and abiotic factors on infiltration capacity
in a grassland biodiversity experiment
Dissertation
Zur Erlangung des akademischen Grades doctor rerum naturalium
(Dr. rer. Nat.)
Vorgelegt dem Rat der Chemisch-Geowissenschaftlichen Fakultät der Friedrich-
Schiller-Universität Jena
von Diplom-Biologin Christine Fischer
geboren am 20.10.1983 in Arnstadt, Deutschland

Gutachter:
1. Jun.-Prof. Dr. Anke Hildebrandt, Friedrich-Schiller-Universität Jena
2. Prof. Dr. Sabine Attinger, Friedrich-Schiller-Universität Jena
Tag der öffentlichen Verteidigung: 16.04.2014

“We know more about the movement of celestial bodies than about the soil underfoot.”
- Leonardo da Vinci -

Contents
Abbreviations ................................................................................................................................ i
Abstract ....................................................................................................................................... iii
Kurzzusammenfassung ............................................................................................................... v
1 General introduction ................................................................................................................ 3
1.1. Background ....................................................................................................................................... 3
1.2 The Jena Experiment ......................................................................................................................... 6 1.2.1 Temperate grasslands ................................................................................................................. 6 1.2.2 Experimental set-up ................................................................................................................... 6 1.2.3 Ecotron (Montpellier) .............................................................................................................. 11
1.3 Objectives ........................................................................................................................................ 12 1.3.1 Research Questions .................................................................................................................. 12 1.3.2 Layout of thesis ........................................................................................................................ 14
Background: Applied concepts ................................................................................................ 17
2 Background: Applied concepts ............................................................................................. 19
2.1 Water flow through soil ................................................................................................................... 19 2.1.1 Components of soil .................................................................................................................. 19 2.1.2 The physics of water flow ........................................................................................................ 20 2.1.3 Preferential flow (macropore flow) .......................................................................................... 21
2.2 Infiltration measurements ................................................................................................................ 23 2.2.1 Hood infiltrometer ................................................................................................................... 23 2.2.2 Analysis/Calculation ................................................................................................................ 24
2.3 Factors affecting surface soil hydraulic properties .......................................................................... 26 2.3.1 Biotic factors ............................................................................................................................ 26 2.3.2 Soil structural properties (bulk density, porosity and soil organic carbon) .............................. 29 2.3.3 Soil texture ............................................................................................................................... 31
3 Spatial variability of infiltration capacity at field scale ...................................................... 35
3.1 Introduction ..................................................................................................................................... 35
3.2 Material and methods: ..................................................................................................................... 35 3.2.1 Experimental set-up ................................................................................................................. 35 3.2.2 Analysis ................................................................................................................................... 36
3.3 Results ............................................................................................................................................. 36
3.4 Conclusion ....................................................................................................................................... 38
4 How do earthworms, soil texture and plant composition affect infiltration along an
experimental plant diversity gradient in grassland? .............................................................. 41
4.1 Abstract ............................................................................................................................................ 41
4.2 Introduction ..................................................................................................................................... 41
4.3 Material and methods ...................................................................................................................... 43 4.3.1 Study area and experimental design ......................................................................................... 43 4.3.2 Infiltration measurement .......................................................................................................... 45 4.3.3 Soil texture and moisture ......................................................................................................... 46 4.3.4 Statistical analyses ................................................................................................................... 46

4.4 Results ............................................................................................................................................. 48 4.4.1 Soil texture and moisture and infiltration ................................................................................. 48 4.4.2 Plant species richness and infiltration ...................................................................................... 49 4.4.3 Plant functional groups and infiltration .................................................................................... 49 4.4.4 Earthworms, functional groups and infiltration ....................................................................... 53 4.4.5 Seasonal variability of infiltration ............................................................................................ 55 4.4.6 Path analysis ............................................................................................................................ 55
4.5 Discussion ........................................................................................................................................ 58 4.5.1 Influence of Earthworms on infiltration ................................................................................... 58 4.5.2 Influence of plant functional group on infiltration ................................................................... 59 4.5.3 Path analysis ............................................................................................................................ 60 4.5.4 Influence of plant species richness on infiltration capacity...................................................... 61 4.5.5 Influence of soil texture and soil moisture on infiltration ........................................................ 62
4.6 Conclusions ..................................................................................................................................... 63
5 Soil and plant community characteristics governing soil hydraulic properties in a
grassland plant diversity experiment ...................................................................................... 67
5.1. Abstract ........................................................................................................................................... 67
5.2 Introduction ..................................................................................................................................... 67
5.3 Material and methods ...................................................................................................................... 69 5.3.1 Study area and experimental design ......................................................................................... 69 5.3.2 Infiltration measurement .......................................................................................................... 70 5.3.3 Soil structural parameters ......................................................................................................... 71 5.3.4 Soil texture, moisture and hydrophobicity ............................................................................... 71 5.3.5 Vegetation parameters ............................................................................................................. 72 5.3.6 Statistical analyses ................................................................................................................... 72
5.4. Results ............................................................................................................................................ 73 5.4.1 Plant community composition (Plant species richness and functional groups) ........................ 73 5.4.2 Soil structural variables (bulk density, porosity, soil organic carbon) ..................................... 73 5.4.3 Soil texture, soil moisture and hydrophobicity ........................................................................ 75 5.4.4 Path analysis ............................................................................................................................ 76 5.4.5 Earthworms .............................................................................................................................. 77 5.4.6 Temporal variation of infiltration capacity .............................................................................. 79
5.5 Discussion ........................................................................................................................................ 80 5.5.1 Influence of plant species richness and structural parameters on infiltration ........................... 80 5.5.2 Influence of earthworms on infiltration ................................................................................... 81 5.5.3 Temporal variation of infiltration capacity .............................................................................. 82 5.5.4 Conclusion ............................................................................................................................... 83
6 An in situ lysimeter experiment (Ecotron/Montpellier) on biotic and abiotic factors
influencing hydrological response through a soil profile ....................................................... 87
6.1 Abstract ............................................................................................................................................ 87
6.2 Introduction ..................................................................................................................................... 87
6.3 Material and Methods ...................................................................................................................... 89 6.3.1 Experimental design ................................................................................................................. 89 6.3.2 Infiltration measurement .......................................................................................................... 90 6.3.4 Soil texture and moisture ......................................................................................................... 91 6.3.5 Biotic parameters (earthworm biomass, above shoot and below biomass) .............................. 91 6.3.6 Soil bulk density and organic carbon content .......................................................................... 92 6.3.7 Statistical analysis .................................................................................................................... 92
6.4 Results ............................................................................................................................................. 93 6.4.1 Vegetation parameters (plant species richness, above- and belowground biomass) ................ 93 6.4.2 Soil structural parameters (bulk density and soil organic carbon) ........................................... 93 6.4.3 Earthworms .............................................................................................................................. 95 6.4.4 Explanatory variables in 0, 25 and 55 cm depth ...................................................................... 96 6.4.5 Infiltration patterns and variability........................................................................................... 96
6.5 Discussion ........................................................................................................................................ 98 6.5.1 Factors explaining infiltration at the soil surface ..................................................................... 98 6.5.2 Factors explaining infiltration capacity over the depth profile ................................................ 99
6.6 Conclusion ..................................................................................................................................... 100
7 Effects of soil depth on the estimation of saturated hydraulic conductivity using
pedotransfer functions (PTFs) ............................................................................................... 103
7.1 Abstract .......................................................................................................................................... 103
7.2 Introduction ................................................................................................................................... 103
7.3 Material and Methods .................................................................................................................... 104 7.3.1 Experimental design ............................................................................................................... 104 7.3.2 Hydraulic conductivity ........................................................................................................... 104 7.3.3 Soil parameters....................................................................................................................... 104 7.3.4 Models for estimating ............................................................................................................ 105 7.3.5 Performance of models .......................................................................................................... 105
7.4 Results ........................................................................................................................................... 106 7.4.1 Ks model analysis .................................................................................................................. 106 7.4.2 Puplished PTFs and model comparison ................................................................................. 106
7.5 Discussion ...................................................................................................................................... 109
7.6 Conclusion ..................................................................................................................................... 109
8 General discussion ................................................................................................................ 113
8.1 Synthesis ............................................................................................................................. 113
8.2 General Perspectives ......................................................................................................... 118
9. References ............................................................................................................................ 121
10. Appendix ............................................................................................................................ 133
Acknowledgements .................................................................................................................. 139
Curriculum vitae ..................................................................................................................... 140


Abbreviations
i
Abbreviations
ANOVA analysis of variance
B block
BM biomass
ρd bulk density
C carbon
CV coefficient of variation
de equivalent diameter
+ew plot with ambient earthworm population
-ew plots with reduced earthworm population (extraction)
GR grasses
GLM general linear models
FG functional groups
K(h) unsaturated hydraulic conductivity
Ks saturated hydraulic conductivity
LEG legumes
N nitrogen
ΨG gravitational potential
ΨM matrix potential
ΨO osmotic potential
ΨT total potential
PTFs pedotransfer functions
PVC polyvinyl chloride
r pearson correlation coefficient
SH small herbs
SOC soil organic carbon
SR species richness
Tl time linear
TH tall herbs

Abstract
iii
Abstract
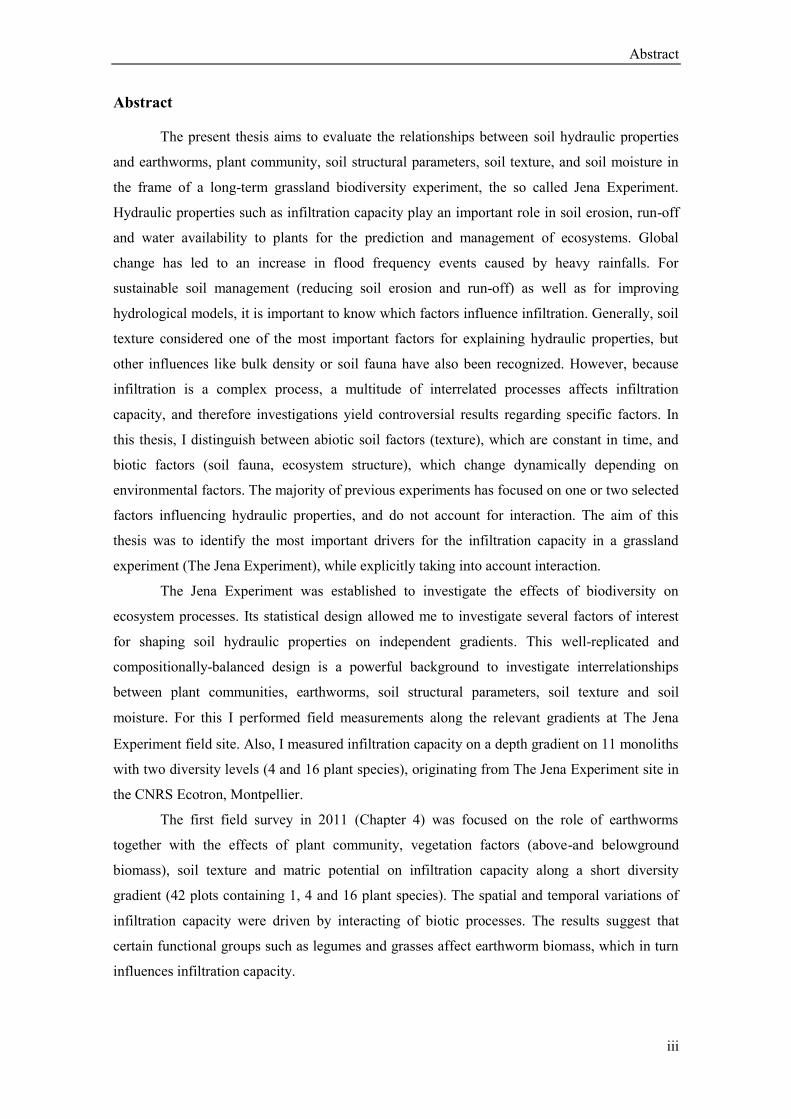
The present thesis aims to evaluate the relationships between soil hydraulic properties
and earthworms, plant community, soil structural parameters, soil texture, and soil moisture in
the frame of a long-term grassland biodiversity experiment, the so called Jena Experiment.
Hydraulic properties such as infiltration capacity play an important role in soil erosion, run-off
and water availability to plants for the prediction and management of ecosystems. Global
change has led to an increase in flood frequency events caused by heavy rainfalls. For
sustainable soil management (reducing soil erosion and run-off) as well as for improving
hydrological models, it is important to know which factors influence infiltration. Generally, soil
texture considered one of the most important factors for explaining hydraulic properties, but
other influences like bulk density or soil fauna have also been recognized. However, because
infiltration is a complex process, a multitude of interrelated processes affects infiltration
capacity, and therefore investigations yield controversial results regarding specific factors. In
this thesis, I distinguish between abiotic soil factors (texture), which are constant in time, and
biotic factors (soil fauna, ecosystem structure), which change dynamically depending on
environmental factors. The majority of previous experiments has focused on one or two selected
factors influencing hydraulic properties, and do not account for interaction. The aim of this
thesis was to identify the most important drivers for the infiltration capacity in a grassland
experiment (The Jena Experiment), while explicitly taking into account interaction.
The Jena Experiment was established to investigate the effects of biodiversity on
ecosystem processes. Its statistical design allowed me to investigate several factors of interest
for shaping soil hydraulic properties on independent gradients. This well-replicated and
compositionally-balanced design is a powerful background to investigate interrelationships
between plant communities, earthworms, soil structural parameters, soil texture and soil
moisture. For this I performed field measurements along the relevant gradients at The Jena
Experiment field site. Also, I measured infiltration capacity on a depth gradient on 11 monoliths
with two diversity levels (4 and 16 plant species), originating from The Jena Experiment site in
the CNRS Ecotron, Montpellier.
The first field survey in 2011 (Chapter 4) was focused on the role of earthworms
together with the effects of plant community, vegetation factors (above-and belowground
biomass), soil texture and matric potential on infiltration capacity along a short diversity
gradient (42 plots containing 1, 4 and 16 plant species). The spatial and temporal variations of
infiltration capacity were driven by interacting of biotic processes. The results suggest that
certain functional groups such as legumes and grasses affect earthworm biomass, which in turn
influences infiltration capacity.
Abstract
iv
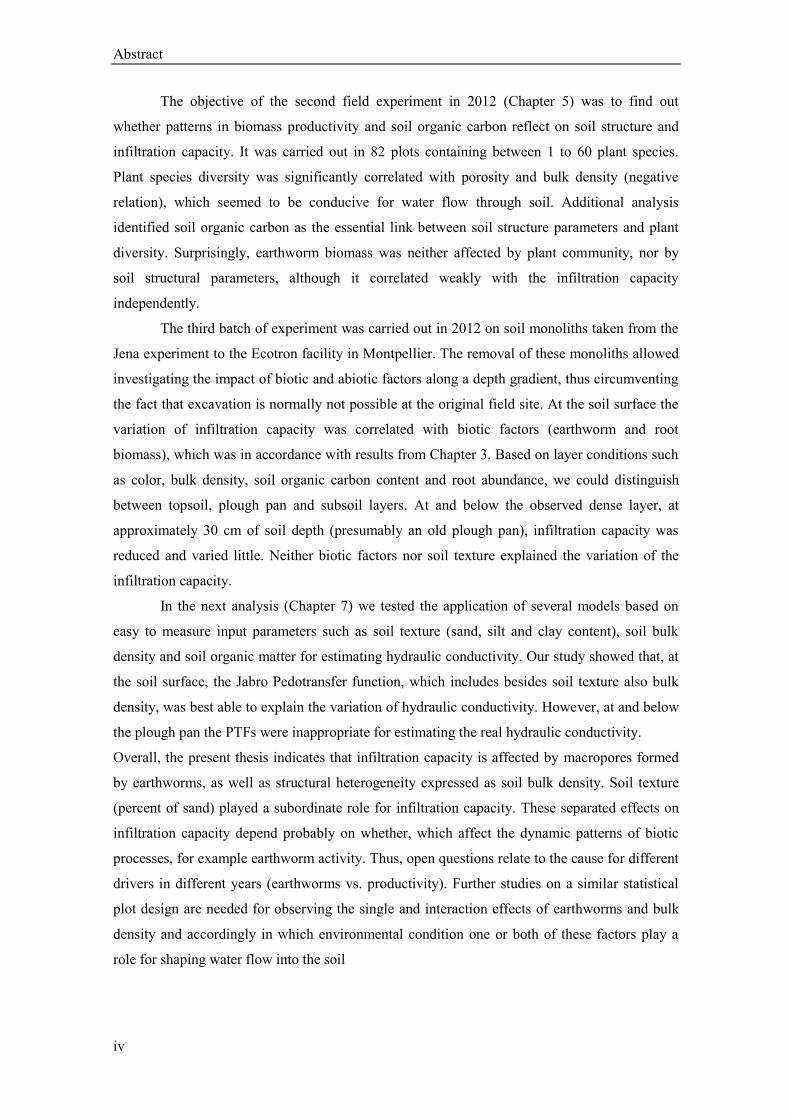
The objective of the second field experiment in 2012 (Chapter 5) was to find out
whether patterns in biomass productivity and soil organic carbon reflect on soil structure and
infiltration capacity. It was carried out in 82 plots containing between 1 to 60 plant species.
Plant species diversity was significantly correlated with porosity and bulk density (negative
relation), which seemed to be conducive for water flow through soil. Additional analysis
identified soil organic carbon as the essential link between soil structure parameters and plant
diversity. Surprisingly, earthworm biomass was neither affected by plant community, nor by
soil structural parameters, although it correlated weakly with the infiltration capacity
independently.
The third batch of experiment was carried out in 2012 on soil monoliths taken from the
Jena experiment to the Ecotron facility in Montpellier. The removal of these monoliths allowed
investigating the impact of biotic and abiotic factors along a depth gradient, thus circumventing
the fact that excavation is normally not possible at the original field site. At the soil surface the
variation of infiltration capacity was correlated with biotic factors (earthworm and root
biomass), which was in accordance with results from Chapter 3. Based on layer conditions such
as color, bulk density, soil organic carbon content and root abundance, we could distinguish
between topsoil, plough pan and subsoil layers. At and below the observed dense layer, at
approximately 30 cm of soil depth (presumably an old plough pan), infiltration capacity was
reduced and varied little. Neither biotic factors nor soil texture explained the variation of the
infiltration capacity.
In the next analysis (Chapter 7) we tested the application of several models based on
easy to measure input parameters such as soil texture (sand, silt and clay content), soil bulk
density and soil organic matter for estimating hydraulic conductivity. Our study showed that, at
the soil surface, the Jabro Pedotransfer function, which includes besides soil texture also bulk
density, was best able to explain the variation of hydraulic conductivity. However, at and below
the plough pan the PTFs were inappropriate for estimating the real hydraulic conductivity.
Overall, the present thesis indicates that infiltration capacity is affected by macropores formed
by earthworms, as well as structural heterogeneity expressed as soil bulk density. Soil texture
(percent of sand) played a subordinate role for infiltration capacity. These separated effects on
infiltration capacity depend probably on whether, which affect the dynamic patterns of biotic
processes, for example earthworm activity. Thus, open questions relate to the cause for different
drivers in different years (earthworms vs. productivity). Further studies on a similar statistical
plot design are needed for observing the single and interaction effects of earthworms and bulk
density and accordingly in which environmental condition one or both of these factors play a
role for shaping water flow into the soil
Kurzzusammenfassung
v
Kurzzusammenfassung
Eingebettet in das interdisziplinär ausgerichtete Jena Experiment war es das Ziel dieser
Arbeit, die Einflüsse von Regenwürmern, Pflanzenbedeckung, Bodentextur und Lagerungsdichte,
Porosität und organischen Kohlenstoff auf bodenhydraulische Eigenschaften zu untersuchen und
die daraus resultierenden Konsequenzen für Ökosystemdienstleistungen bzw. Funktionen
abzuleiten. Hydraulische Eigenschaften des Bodens, wie die Infiltrationskapazität, spielen bei der
Vorhersage und Modellierung von Bodenerosion, Oberflächenabfluss und Wasserverfügbarkeit
für Pflanzen eine bedeutende Rolle. Die anthropogen bedingte Zunahme von
Starkregenereignissen sowie damit einhergehende Hochwasserereignisse führen zur Verdichtung,
Verschlämmung und Verlust biologischer Aktivität. Für ein nachhaltiges Bodenmanagement ist
der Erhalt der standorttypischen Infiltrationskapazität von zentraler Bedeutung. In den meisten
hydrologischen Modellen wird die Bodentextur als wichtige Faktoren zur Ableitung von
hydraulischen Eigenschaften herangezogen. Untersuchungen zeigten jedoch, dass die Infiltration
durch eine Vielzahl von Faktoren beeinflusst wird. In dieser Arbeit unterscheide ich zwischen
abiotischen (Textur) Eigenschaften, die konstant sind, und biotischen Faktoren
(Ökosystemzusammensetzung, Bodenfauna), welche sich dynamisch den Umweltbedingungen
anpassen. Das Ziel dieser Arbeit war die Identifikation der bedeutendsten Faktoren, die die
Infiltrationskapazität in einem europäischen Grasland beeinflussen, wobei die Interaktion dieser
Faktoren explizit beachtet wurde.
Das Design des Jena Experiments bietet die einzigartige Gelegenheit, die Bedeutung
physikalischer und biologischer Prozesse entlang unabhängiger Gradienten zu untersuchen.
Dadurch ist es möglich einzelne und interagierende Einflüsse auf die Infiltrationskapazität zu
analysieren. Um die wichtigsten direkten und indirekten mechanistischen Zusammenhänge zu
erforschen, führte ich im Rahmen meiner Promotion Feldversuche entlang eines
Pflanzenartengradienten auf dem Jena Experiment in den Jahren 2011 und 2012 durch. Um einen
Einblick in die Tiefengradienten zu erhalten, führte ich zusätzlich eine Messkampagne an elf
Großlysimetern des Jena Experiments mit zwei Biodiversitätsstufen (4 und 16 Arten) im CNRS
Ecotron (Montpellier) durch.
Ziel der ersten Feldstudie in Jahr 2011 (Kapitel 4) war es, vor allem den Einfluss von
Regenwürmern gemeinsam mit Pflanzengemeinschaften und Bodentextur auf die
Infiltrationskapazität entlang eines Biodiversitätsgradienten (42 Plots mit 1, 4 und 16 Arten) zu
untersuchen. Die Ergebnisse zeigen, dass bestimmte funktionelle Gruppen, wie Leguminosen und
Gräser, die Regenwurmbiomasse beeinflussen und sich diese wiederum auf die
Infiltrationskapazität auswirken. Die räumlichen und zeitlichen Schwankungen der
Infiltrationskapazität werden durch ein komplexes Zusammenspiel von biotischen Prozessen
zwischen den funktionellen Gruppen und den Regenwurmaktivitäten angetrieben.
Kurzzusammenfassung
vi
Das zweite Feldexperiment im Jahr 2012 (Kapitel 5) untersuchte inwieweit
bodenstrukturierende Faktoren, wie Lagerungsdichte, Porosität und organischer Kohlenstoff,
entlang eines Artengradienten von 1 bis 60 Arten (82 Plots), den Wasserdurchfluss im Boden
beeinflussen. Die Ergebnisse verdeutlichen, dass Pflanzenartenvielfalt die Infiltrationskapazität
durch Veränderung von Lagerungsdichte, Porosität und organischer Kohlenstoffgehalt
beeinflusst. Unabhängig davon wurde die Infiltrationskapazität auch von der
Regenwurmbiomasse beeinflusst, welche aber selbst weder mit der Pflanzenartenvielfalt noch
mit der Lagerungsdichte korrelierte.
Ziel des dritten Experiments im Jahr 2012 (Kapitel 6) war es, den Einfluss biotischer und
abiotischer Faktoren auf die Infiltrationskapazität in verschiedenen Bodentiefen (0, 25 und 55 cm
Tiefe) zu untersuchen. Die Infiltrationskapazität korrelierte mit der Regenwurmbiomasse an der
Bodenoberfläche, ähnlich wie im Jahr 2011. Der Oberboden konnte durch Bodenfarbe, erhöhte
Lagerungsdichte, niedrigerer Kohlenstoffgehalt und Wurzelbiomasse deutlich vom Unterboden
unterschieden werden. In etwa 25 cm Bodentiefe (vermutlich eine alte Pflugsohle), hatten weder
Regenwürmer, Pflanzenartenvielfalt, Lagerungsdichte, noch Bodentextur einen Einfluss auf die
Infiltrationskapazität.
Getestet wurde anschließend die Anwendung von Pedotransferfunktionen (PTFs) zur
Berechnung der gesättigten Leitfähigkeit (Kapitel 7). Als Eingabeparameter wurden die
verfügbaren Parameter Bodentextur (Sand, Schluff und Ton), Lagerungsdichte und organischer
Bodengehalt verwendet. Im Oberboden war es möglich die gesättigte hydraulische Leitfähigkeit
mittels des Models von Jabro abzuschätzen. Jedoch an und unterhalb der beobachteten Pflugsohle
waren alle verwendeten PFTs für Berechnung der gesättigten hydraulischen Leitfähigkeit
ungeeignet.
Zusammenfassend hat die vorgelegte Arbeit aufgezeigt, dass in Grasländern, die
Lagerungsdichte und Regenwurmaktivität einen entscheidenden Beitrag zur Erhöhung der
Infiltrationskapazität des Bodens leisten. Regenwürmer wurden nicht von der
Pflanzenartenvielfalt, sondern werden vielmehr von bestimmten funktionellen Gruppen, wie
Leguminosen und Gräsern beeinflusst. Regenwürmer beeinflussten die Infiltrationskapazität
unabhängig von der Lagerungsdichte. Pflanzenartenvielfalt hingegen wirkt sich positiv durch
Veränderung der Bodenstruktur auf die Infiltrationskapazität aus. In tieferen Bodenschichten hebt
sich der biotische Einfluss, durch anthropogen verursachte Kompaktierung (Pflugsohle), wieder
auf. Wie stark dieser Einfluss von Lagerungsdichte und Regenwürmern zusammen oder einzeln
auf die Infiltrationskapazität ist, hängt wahrscheinlich von weiteren Umweltbedingungen
(Wetter) ab. Die Ergebnisse dieser Untersuchungen belegen die komplexen Wechselwirkungen
zwischen Wasserdurchfluss im Boden und Ökosystemvielfalt sowie die hohe raumzeitliche
Dynamik. Inwieweit diese biotischen Faktoren einzeln oder miteinander über die
Bodenstrukturen auf die Infiltration wirken, sollte Gegenstand weiter Forschungsarbeiten sein.
Chapter
1
General Introduction


General Introduction
3
1 General introduction
1.1. Background
Infiltration is next to precipitation, run-off and evapotranspiration one of the important
physical components in the hydrological cycle. Water from precipitation runs into streams,
lakes, rivers, and oceans or infiltrates through the soil profile. Water can also run-off over land,
causing erosion, flooding and degradation of water quality. To determine strategies for soil and
water conservation and to minimize surface run-off and soil erosion it is important to know
which factors affected surface hydraulic properties such as infiltration and hydraulic
conductivity (Shukla et al. 2006). Especially for agriculture it is important to quantify the
infiltration to determine the availability of water for crop growth and the resulting irrigation
amount for optimal plant growth.
Infiltration is the movement of water from the ground surface into the soil profile, via
pores or small openings and determined by the factors of gravity, capillary action and soil
porosity (Hillel 1998). The maximum rate at which water enters into or is absorbed by the soil is
termed infiltration capacity (Ward and Robinson 1990). Hydraulic conductivity, an important
soil property, is the movement of water in a porous media under a hydraulic gradient and
interrelated with the infiltration capacity. Soil hydraulic conductivity is a critically important
soil property for predicting and managing ecosystem patterns.
Most simulations of infiltration and redistribution in unsaturated soils are based on the
Richards equation (soil water flow equation). When water infiltrates through the soil, it passes
through the plant via transpiration into the atmosphere. Water removal by plants via
transpiration is treated as a sink term in the Richards equation (soil water flow equation
(Richards 1931)). Modeling water flow and chemical transport hydraulic conductivity is
estimated using pedotransfer functions (PTFs) based on easy to measure soil properties such as
soil texture (sand, silt and clay content), bulk density and soil organic carbon (Schaap et al.
2001, Wösten et al. 2001). But how and how much of the precipitation infiltrates into the soil
surface and reaches the river or is released via transpiration in the atmosphere strongly depends
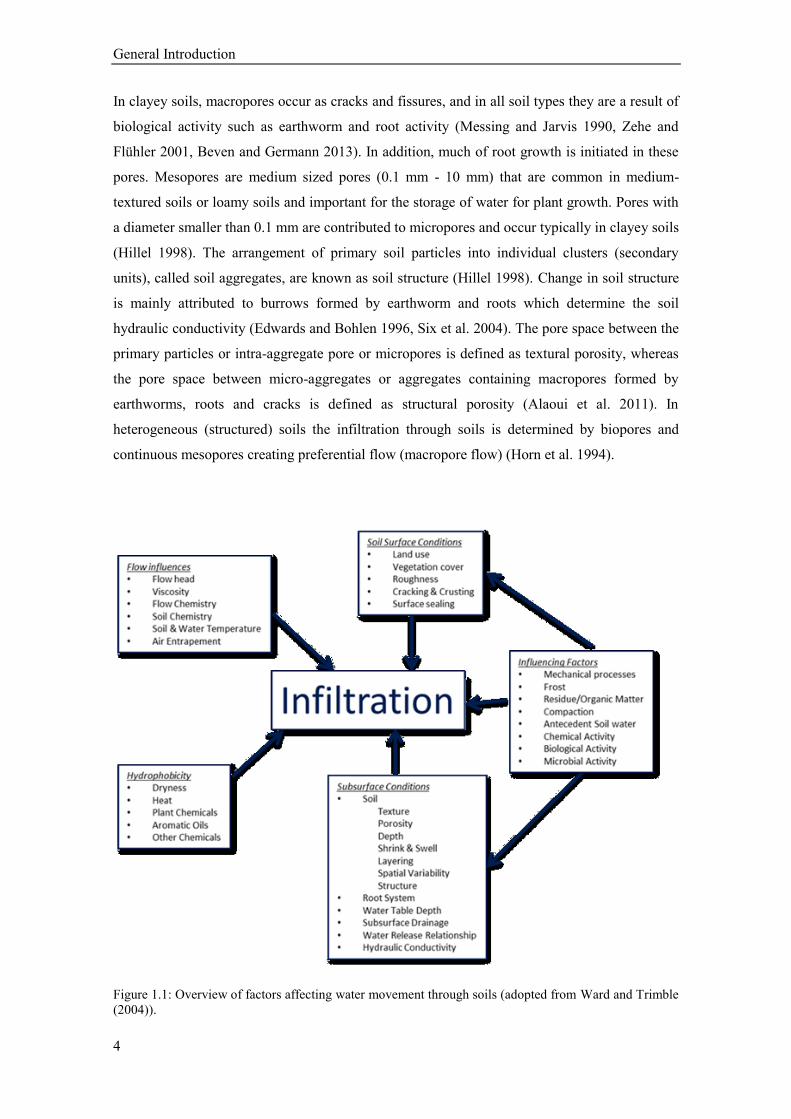
on many factors. Figure 1.1 gives an overview on the amount of factors which could influence
the water flow through soil. Apart to this categorization of factors influencing infiltration,
generally factors can be attribute to biotic (for example earthworm biomass, vegetation type and
cover) and in abiotic (for example texture) factors (Ward and Trimble 2004).
In saturated soils infiltration is mainly determined by the different size, shape and
continuity of pores (Beven and Germann 2013). Based on the size or capillary potential, soil
pores can be classified into different pore size classes: macro-, meso- and micropores (Beven
1981). According to Luxmoore (1981), pores with diameters >10 mm are referred to
macropores which tend to be freely draining and are prevalent in coarse textured or sandy soils.
General Introduction
4
In clayey soils, macropores occur as cracks and fissures, and in all soil types they are a result of
biological activity such as earthworm and root activity (Messing and Jarvis 1990, Zehe and
Flühler 2001, Beven and Germann 2013). In addition, much of root growth is initiated in these
pores. Mesopores are medium sized pores (0.1 mm - 10 mm) that are common in medium-
textured soils or loamy soils and important for the storage of water for plant growth. Pores with
a diameter smaller than 0.1 mm are contributed to micropores and occur typically in clayey soils
(Hillel 1998). The arrangement of primary soil particles into individual clusters (secondary
units), called soil aggregates, are known as soil structure (Hillel 1998). Change in soil structure
is mainly attributed to burrows formed by earthworm and roots which determine the soil
hydraulic conductivity (Edwards and Bohlen 1996, Six et al. 2004). The pore space between the
primary particles or intra-aggregate pore or micropores is defined as textural porosity, whereas
the pore space between micro-aggregates or aggregates containing macropores formed by
earthworms, roots and cracks is defined as structural porosity (Alaoui et al. 2011). In
heterogeneous (structured) soils the infiltration through soils is determined by biopores and
continuous mesopores creating preferential flow (macropore flow) (Horn et al. 1994).
Figure 1.1: Overview of factors affecting water movement through soils (adopted from Ward and Trimble
(2004)).
General Introduction
5
Soil type and soil management which may vary in space and time (Mallants et al. 1997,
Kutílek 2004) could shape the soil structure of the soil. Because of this variability of soil
structure, the estimation of infiltration and soil hydraulic properties is a very complicated
subject. Next to microbes, soil fauna and texture, vegetation factors also influences soil
structural parameters such as soil organic carbon, bulk density and porosity (Six et al. 2004).
These parameters are good characteristic factors that indicate changes of pore sizes induced to
land use, weathering influences, or biological activities. Other studies showed that an increase in
soil bulk density decreases hydraulic conductivity due to the reduction of larger pores
(Franzluebbers 2002, Zacharias and Wessolek 2007). Additionally, soil bulk density and
porosity are good indicators for soil compaction implying a destruction of soil structure
impacting infiltration through soil (Logsdon and Karlen 2004). Soils with a good structure are
characterized by enhanced water infiltration and decreased run-off and erosion potential. Most
of the infiltration measurements on structured soils result in unreliable values because the
calculation assumes homogenous soil (Salverda and Dane 1993). For a correct description of the
water flow in structured soils, matrix flow as well as macropore flow should be considered in
experiments.
Plants which represent the primary components of terrestrial ecosystems play a very
important role for ecosystem functioning and composition of soils. Experiments are needed to
analyze the consequences of loss in plant species richness by ecosystem processes and
functioning long-term observation in biodiversity (Loreau and Hector 2001, Hooper et al. 2005).
A number of biodiversity experiments in temperate grasslands have investigated the effects of
biodiversity on ecosystem processes and stability, e.g. Ecotron Biodiversity Experiment, Cedar
Creek Biodiversity Experiment and the BIODEPTH experiment (Biodiversity and Ecological
Processes in Terrestrial Herbaceous Ecosystems: experimental manipulations of plant
communities). The results and critique of the previous experiments were considered in the
design of The Jena Experiment. In this experiment it is possible to test the effects of plant
species richness and plant functional groups separately (Roscher et al. 2004). Additionally, the
experimental design allows testing of the effects of biodiversity on ecosystem processes and
includes more interactions between plants, soil fauna, invertebrates, physical and chemical soil
properties and hydrological conditions and their impact on ecosystem patterns.
For central Europe the IPCC report predicts that in the 21th century, precipitation
patterns will change due to climate change: decreasing precipitation in summer and increasing
precipitation in autumn/winter. It is therefore likely that flooding events will increase in winter
and droughts will increase in the summer (IPCC 2012). Through climate change, biodiversity
patterns will mainly be affected which results in a change of hydrological patterns (Weltzin et
al. 2003). Inappropriate management can reduce or block infiltration resulting in water ponds on
the surface or run offs. Thus plant production decreases because less water is stored in the soil.

General Introduction
6
An important task in agriculture is to enhance water infiltration potential into soil to prevent,
reduce impact, or to avoid the impact of runoff and frequent floods (Mannering and Meyer
1963). Additionally, it is important to look into specific mechanisms in which hydrology
impacts biodiversity. In this context, the study of factors affecting infiltration capacity in
context with the loss of plant species richness has specific importance, for example in managing
agricultural soils. Generally, it is assumed that communities containing less species are less
resilient against frequent disturbances and single extreme events such as high precipitation
events (Tilman 1996). Knowledge of factors affecting water flow through soil becomes more
important for buffering future extreme precipitation events.
1.2 The Jena Experiment
1.2.1 Temperate grasslands
The biome temperate grassland is characterized by a dominance of grasses, absences
of trees and shrubs, hot summers, cold winters and moderate rainfall. Precipitation usually
occurs in the late spring and early summer. The biome includes the veldts of Africa, the pampas
of South America, the steppes of Eurasia, and the prairies of North America. In Europe,
temperate grasslands make up an important part of the agricultural area (Isselstein et al. 2005).
Because of human use and the transformation of grasslands for agriculture, farming and grazing
had an important impact on biodiversity (Smit et al. 2008). Over the last hundred years, many of
the natural grasslands have been lost by converting grasslands into agricultural land. Since
1950, the temperate grasslands biome has lost nearly 70% of its native cover (Duraiappah
2005). For food supply, farmlands are important. However, the anthropogenic impact on plants
and animals in temperate grasslands have unknown consequences for human well-being.
1.2.2 Experimental set-up
The experiment was performed at the field site of The Jena Experiment which is located
in the floodplain of the Saale river near Jena (Thuringia, Germany; 50°55´N, 11°35´E, 130 m
above sea level) (Figure 1.2). The mean annual air temperature is 9.3°C and the mean annual
precipitation is about 587 mm (Kluge and Müller-Westermeier 2000). The soil of the
experimental site is an Eutric Fluvisol (Fao-Unesco 1997), developed from up to 2 m-thick
loamy fluvial sediments. Before the establishment of the experiment, the field site was
agricultural land for the last 40 years and highly fertilized over the last decades for growing
vegetables and wheat (Roscher et al. 2004). After the last harvest in autumn 2000 the field was
ploughed and kept fallow throughout 2001. In July 2001 the field was harrowed bimonthly and
treated with Glyphosate (N-(Phosphonomethyl)-glycine, Roundup). In spring 2002, the
experimental area was harrowed twice before the plots were established. Seeds were sown with

General Introduction
7
a total density of 1000 seedlings per m², divided equally among the species of each mixture
(Roscher et al. 2004). In 2002, with the start of the experiment, organic carbon was determined
in the plough horizon in the range of 13 to 33 g C kg -1
and C/N ratios were between 8 and 15,
while pH ranges from 7.1 to 8.4. Carbonate content varies with distance from the river in a
range from 4 and 42 g C g-1
. At the beginning of the experiment, all soil properties were
homogeneous through the plough horizon (Roscher et al. 2004, Oelmann et al. 2007). Plots were
assembled into four blocks following a gradient in soil characteristics from sandy loam near the
river to silty clay with increasing distance from the river (see Chapter 1.2.2.2). Each block
contains an equal number of plots and plant species and functional group diversity levels.
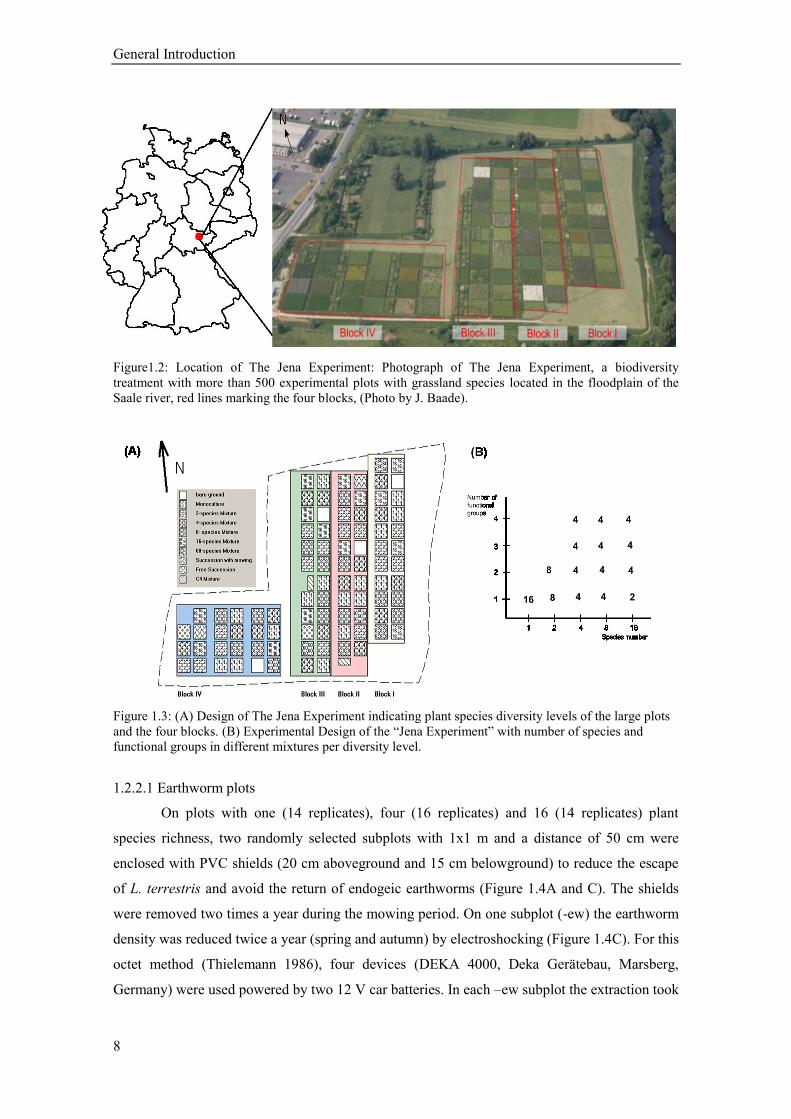
A pool of 60 native plant species common of Central European mesophilic grasslands
(Molinio-Arrhenatheretea, Ellenberg and Leuschner (2010)) was used to established a gradient
of plant species richness (1, 2, 4, 8, 16 and 60) and functional group richness (1, 2, 3 and 4) on
80 plots of 20 x 20 m (Figure 1.3 A, B). There were 16 replicates for mixtures with 1, 2, 4, 8,
species diversity and14 replicates for mixtures with 16 species, and 4 replicates for the mixtures
with 60 species. All 60 species had been assigned into four groups: 12 legumes, 16 grasses, 12
small herbs and 20 tall herbs based on a cluster analysis of morphological, phenological and
physiological traits. Bare-ground plots (0 plant species) were created as control plots in each
experimental block. The additional treatment area contained subplots representing “natural”
grassland, managed by mowing located outside of the field site and used as reference plots (r).
These two plots were not sown after the establishment of the Jena Experiment and thus have no
specific definition of species present. The plots were mown twice a year and weeded regularly
by hand. For more details see Roscher et al. (2004).
In January 2003 and again in 2011, unusually high rainfall on frozen ground in the
upper catchment of the Saale river caused a flood, flooding approximately 75 % of the field site,
affecting Blocks 1 to 3. Additionally, in June 2013, the experiment was flooded again for
approximately 2 weeks, affecting again Block 1 and 3.
General Introduction
8
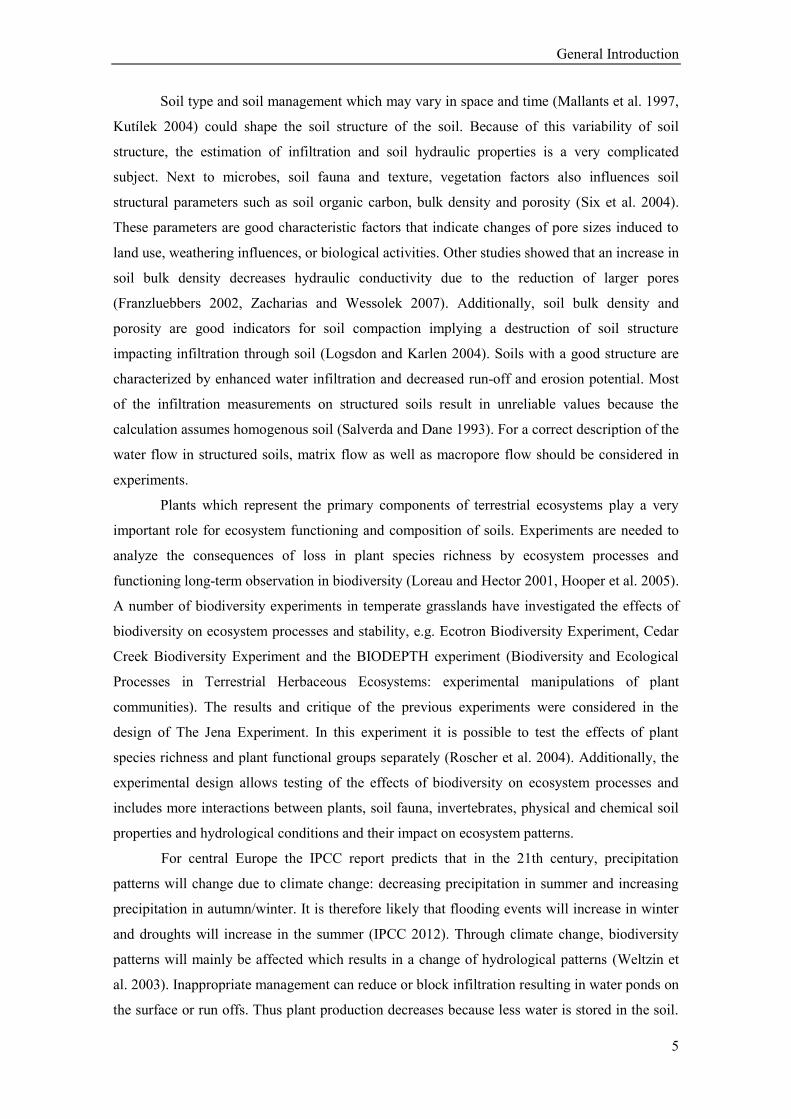
Figure1.2: Location of The Jena Experiment: Photograph of The Jena Experiment, a biodiversity
treatment with more than 500 experimental plots with grassland species located in the floodplain of the
Saale river, red lines marking the four blocks, (Photo by J. Baade).
Figure 1.3: (A) Design of The Jena Experiment indicating plant species diversity levels of the large plots
and the four blocks. (B) Experimental Design of the “Jena Experiment” with number of species and
functional groups in different mixtures per diversity level.
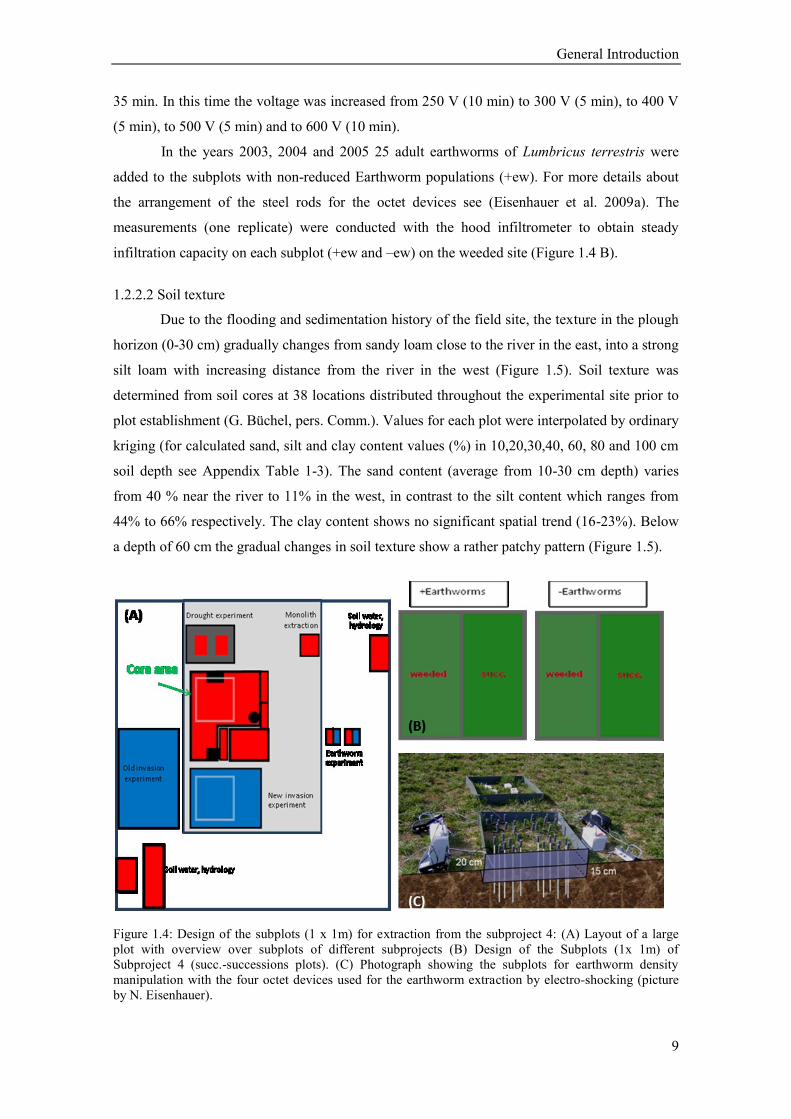
1.2.2.1 Earthworm plots
On plots with one (14 replicates), four (16 replicates) and 16 (14 replicates) plant
species richness, two randomly selected subplots with 1x1 m and a distance of 50 cm were
enclosed with PVC shields (20 cm aboveground and 15 cm belowground) to reduce the escape
of L. terrestris and avoid the return of endogeic earthworms (Figure 1.4A and C). The shields
were removed two times a year during the mowing period. On one subplot (-ew) the earthworm
density was reduced twice a year (spring and autumn) by electroshocking (Figure 1.4C). For this
octet method (Thielemann 1986), four devices (DEKA 4000, Deka Gerätebau, Marsberg,
Germany) were used powered by two 12 V car batteries. In each –ew subplot the extraction took
General Introduction
9
35 min. In this time the voltage was increased from 250 V (10 min) to 300 V (5 min), to 400 V
(5 min), to 500 V (5 min) and to 600 V (10 min).
In the years 2003, 2004 and 2005 25 adult earthworms of Lumbricus terrestris were
added to the subplots with non-reduced Earthworm populations (+ew). For more details about
the arrangement of the steel rods for the octet devices see (Eisenhauer et al. 2009a). The
measurements (one replicate) were conducted with the hood infiltrometer to obtain steady
infiltration capacity on each subplot (+ew and –ew) on the weeded site (Figure 1.4 B).
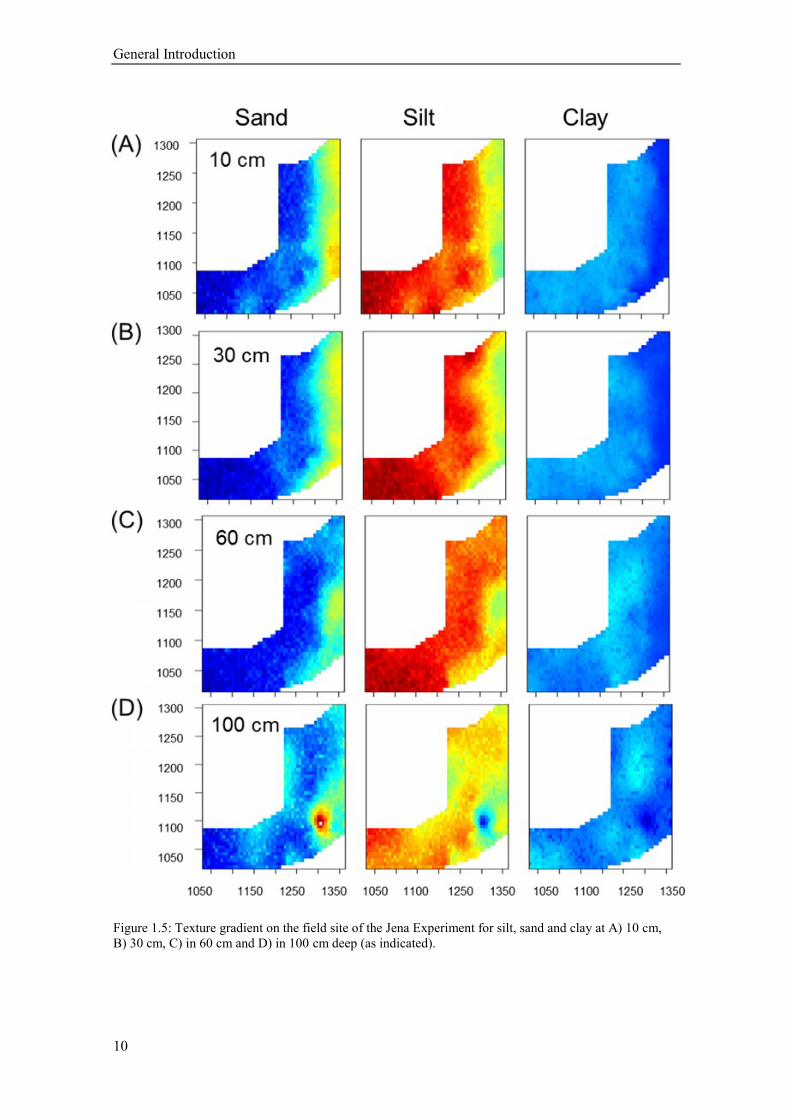
1.2.2.2 Soil texture
Due to the flooding and sedimentation history of the field site, the texture in the plough
horizon (0-30 cm) gradually changes from sandy loam close to the river in the east, into a strong
silt loam with increasing distance from the river in the west (Figure 1.5). Soil texture was
determined from soil cores at 38 locations distributed throughout the experimental site prior to
plot establishment (G. Büchel, pers. Comm.). Values for each plot were interpolated by ordinary
kriging (for calculated sand, silt and clay content values (%) in 10,20,30,40, 60, 80 and 100 cm
soil depth see Appendix Table 1-3). The sand content (average from 10-30 cm depth) varies
from 40 % near the river to 11% in the west, in contrast to the silt content which ranges from
44% to 66% respectively. The clay content shows no significant spatial trend (16-23%). Below
a depth of 60 cm the gradual changes in soil texture show a rather patchy pattern (Figure 1.5).
Figure 1.4: Design of the subplots (1 x 1m) for extraction from the subproject 4: (A) Layout of a large
plot with overview over subplots of different subprojects (B) Design of the Subplots (1x 1m) of
Subproject 4 (succ.-successions plots). (C) Photograph showing the subplots for earthworm density
manipulation with the four octet devices used for the earthworm extraction by electro-shocking (picture
by N. Eisenhauer).
(A)
General Introduction
10
Figure 1.5: Texture gradient on the field site of the Jena Experiment for silt, sand and clay at A) 10 cm,
B) 30 cm, C) in 60 cm and D) in 100 cm deep (as indicated).
30 cm
10 cm
General Introduction
11
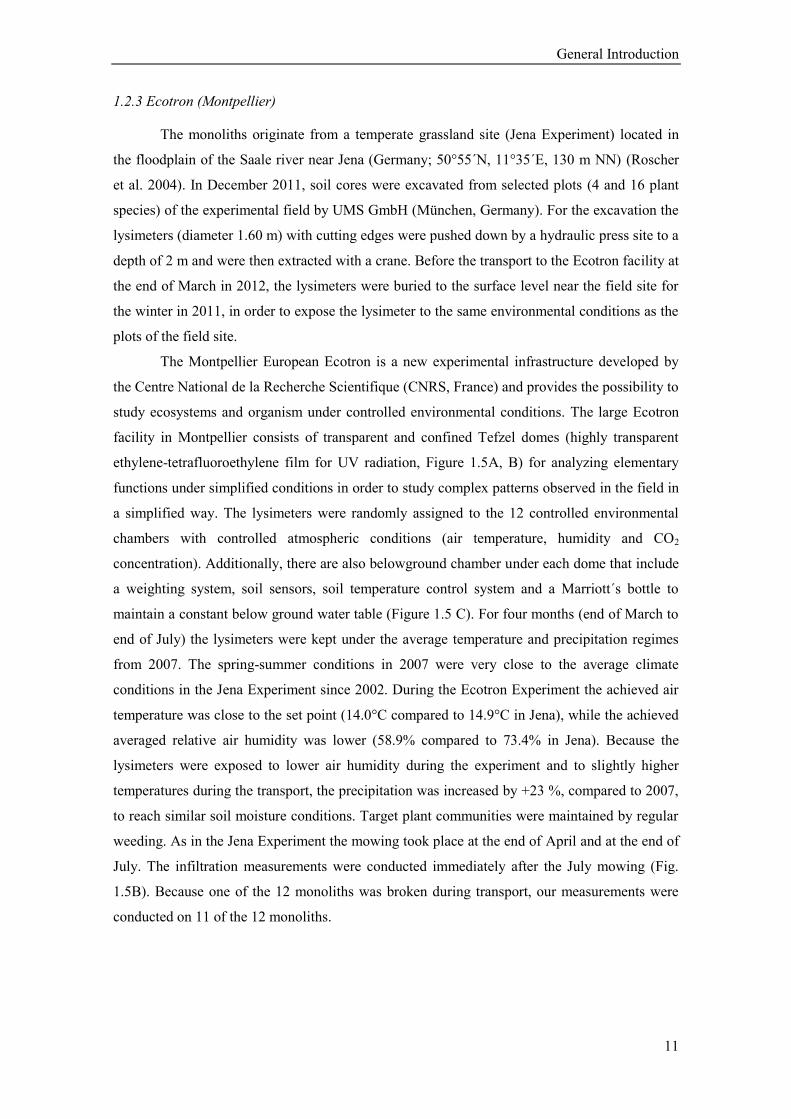
1.2.3 Ecotron (Montpellier)
The monoliths originate from a temperate grassland site (Jena Experiment) located in
the floodplain of the Saale river near Jena (Germany; 50°55´N, 11°35´E, 130 m NN) (Roscher
et al. 2004). In December 2011, soil cores were excavated from selected plots (4 and 16 plant
species) of the experimental field by UMS GmbH (München, Germany). For the excavation the
lysimeters (diameter 1.60 m) with cutting edges were pushed down by a hydraulic press site to a
depth of 2 m and were then extracted with a crane. Before the transport to the Ecotron facility at
the end of March in 2012, the lysimeters were buried to the surface level near the field site for
the winter in 2011, in order to expose the lysimeter to the same environmental conditions as the
plots of the field site.
The Montpellier European Ecotron is a new experimental infrastructure developed by
the Centre National de la Recherche Scientifique (CNRS, France) and provides the possibility to
study ecosystems and organism under controlled environmental conditions. The large Ecotron
facility in Montpellier consists of transparent and confined Tefzel domes (highly transparent
ethylene-tetrafluoroethylene film for UV radiation, Figure 1.5A, B) for analyzing elementary
functions under simplified conditions in order to study complex patterns observed in the field in
a simplified way. The lysimeters were randomly assigned to the 12 controlled environmental
chambers with controlled atmospheric conditions (air temperature, humidity and CO2
concentration). Additionally, there are also belowground chamber under each dome that include
a weighting system, soil sensors, soil temperature control system and a Marriott´s bottle to
maintain a constant below ground water table (Figure 1.5 C). For four months (end of March to
end of July) the lysimeters were kept under the average temperature and precipitation regimes
from 2007. The spring-summer conditions in 2007 were very close to the average climate
conditions in the Jena Experiment since 2002. During the Ecotron Experiment the achieved air
temperature was close to the set point (14.0°C compared to 14.9°C in Jena), while the achieved
averaged relative air humidity was lower (58.9% compared to 73.4% in Jena). Because the
lysimeters were exposed to lower air humidity during the experiment and to slightly higher
temperatures during the transport, the precipitation was increased by +23 %, compared to 2007,
to reach similar soil moisture conditions. Target plant communities were maintained by regular
weeding. As in the Jena Experiment the mowing took place at the end of April and at the end of
July. The infiltration measurements were conducted immediately after the July mowing (Fig.
1.5B). Because one of the 12 monoliths was broken during transport, our measurements were
conducted on 11 of the 12 monoliths.

General Introduction
12
Figure 1.6: Photograph of the experimental Tefzel domes (macrocosm) at the ECOTRON facility
(Montpellier European Ecotron, France) (photo by CNRS Ecotron Montpellier), (B) photograph of one
macrocosms showing the infiltration procedure using a hood infiltrometer (C) Photograph of one
belowground chamber under the dome (photo by CNRS Ecotron Montpellier). For more details see
Chapter 1.2.3..
1.3 Objectives
1.3.1 Research Questions
The design of The Jena Experiment, with a controlled manipulation of plant diversity
and covering experimental blocks with differences in soil structure and texture, allows for
disentangling the relative importance of biotic (plant community, earthworms), soil structural
parameter (bulk density, porosity and soil organic carbon) and abiotic (soil texture) factors on
soil hydraulic properties such as infiltration capacity. In the first field experiment (Chapter 4),
we aimed to explore the relation between soil water fluxes and plant community, earthworms
and soil texture. In the second field experiment (Chapter 5), the objective was to quantify the
change in infiltration capacity affected by soil structural parameters (bulk density, soil organic
carbon, and porosity), plant community, earthworms and soil texture. In the third experiment we
measured infiltration capacity on 11 monoliths with two diversity levels (4 and 16 plant
species), originating from The Jena Experiment site at several depths in the CNRS Ecotron,
Montpellier (chapter 6 and 7).
As a part of the hydrology subproject of The Jena Experiment the overall aim of this
thesis was to investigate the several factors that improve biological activity, and therefore
General Introduction
13
counteract the compaction and loss of mechanical stability that decreases infiltration capacity
and increases the intensity of flooding events. Based on several studies (Ward and Trimble
2004, Van Eekeren et al. 2010, Deb and Shukla 2012) indicating many direct influencing factors
on hydraulic properties leading to contradictory results, I focused on direct and indirect
mechanisms to disentangle the interrelated factors shaping infiltration capacity. This leads us to
ask the overall questions:
(1) Which factors shape soil hydraulic properties such as infiltration capacity? – Are
abiotic factors (soil texture) more important compared to biotic factors (earthworms,
plant and functional diversity, root biomass) for the infiltration through soil?
Generally it is believed that earthworms have a positive effect on infiltration capacity
(Stockdill 1966, Zachmann and Linden 1989, Edwards and Bohlen 1996). However, these
positive effects are known for agriculture systems and knowledge about effects in natural
communities is rare. The mechanisms behind the impact of earthworms and the plant
community are not fully understood. In order to evaluate the effects of earthworms, plant
species richness, plant functional group richness and texture on soil hydraulic properties in a
plant diversity experiment, we try to answer the following questions:
(2) Does earthworm activity increase infiltration capacity?
(3) How does the plant community influence earthworm activity?
Summarizing the present knowledge according to the effects of biodiversity on soil
water plant interactions, it has to be stated that it is difficult to derive a clear picture of the
interactions between the water cycle and plant biodiversity. An increased soil water infiltration
depends on soil aggregation and stability which is impacted by texture, soil fauna and
vegetation parameters (Angers and Caron 1998, Six et al. 2004, Pérès et al. 2013). In order to
improve the understanding of the relationship between soil structural parameters (soil bulk
density, porosity and soil organic carbon) and water infiltration with respect to plant diversity,
plant functional group richness and texture gradient the following questions were investigated:
(4) Do patterns in soil organic carbon content, induced by biodiversity gradients, relate
to structural parameters bulk density and porosity?
(5) Do those parameters affect infiltration capacity?
General Introduction
14
Next to spatial variability of hydraulic properties across the field site, knowledge of
spatial variability along a soil profile is also important for the development of optimal
agricultural and land management strategies. For irrigation and soil management, it is also
important to consider the role of the several factors on infiltration also through several depths.
We therefore measured, in addition to field experiments, the infiltration capacity on Lysimeter
taken from the field site in Montpellier (France) at several depths. The main questions of this
field study were:
(6) Do the observed factors influencing soil hydraulic properties at the soil surface also
affect infiltration into deeper soil strata? What factors are important drivers for the
infiltration at several depths?
Infiltration measurements using the hood infiltrometer directly estimated the hydraulic
conductivity via Wooding´s equation (Wooding 1968). Because these direct measurements are
costly and time consuming, indirect methods were developed to estimate hydraulic conductivity
based on easy to measure soil properties (Schaap et al. 1998, Schaap et al. 2001). In order to test
the application of the most common pedotransfer functions (PTFs) at several depths, we ask the
following questions:
(7) Can we predict observed saturated hydraulic conductivity using the pedotransfer
functions (PTFs) at several depths?
1.3.2 Layout of thesis
This thesis is divided into the following chapters (Figure 1.7):
Chapter 1 deals with the general introduction and objectives of the study. In this
chapter the overall design of the Experiment is also outlined.
Chapter 2 reviews the literature covering soil physics and structure, infiltration theory
and measurement techniques of tension infiltrometer, and major factors that influence
surface soil hydraulic properties.
Chapter 3 gives a short overview of the effect of spatial variability of infiltration
capacity
The three research objectives are described in chapter 4, 5 and 6: The format of the
chapters is in the form of intact papers for submission to journals. As a result this
format leads to some duplication of introductory material in each chapter.
Chapter 4 analyzes the variation of infiltration along texture, plant species and
earthworm gradient
Chapter 5 links the infiltration patterns to soil structural parameters and identifies the
most important structural parameters influencing soil hydraulic properties

General Introduction
15
Chapter 6 characterizes infiltration patterns along several soil depths (soil surface,
within rooting zone, below rooting zone) and quantifies the relationship with soil
structural parameters, biotic factors, soil texture, and soil moisture. In this chapter we
examine if flow patterns at the soil surface continue to deeper soil layers and which
factors influence this.
Chapter 7 tests the application of several Pedotransfer functions (PTFs) for the
measured hydraulic conductivities on Lysimeter in several depths.
Chapter 8 summarizes and discusses the findings by addressing the research questions
Figure 1.7: Overview of chapters of the present thesis. Further explanations can be found in the respective
chapter.


Chapter
2
Background: Applied concepts

Background: Applied concepts
19
2 Background: Applied concepts
2.1 Water flow through soil
2.1.1 Components of soil
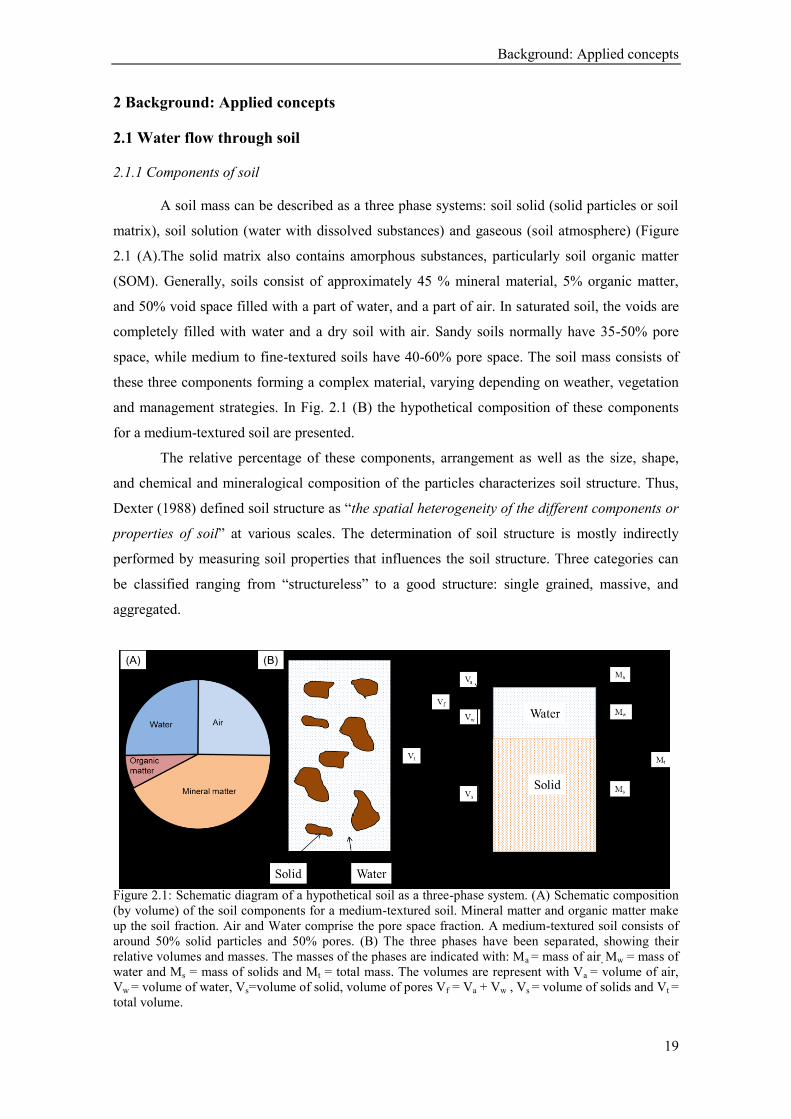
A soil mass can be described as a three phase systems: soil solid (solid particles or soil
matrix), soil solution (water with dissolved substances) and gaseous (soil atmosphere) (Figure
2.1 (A).The solid matrix also contains amorphous substances, particularly soil organic matter
(SOM). Generally, soils consist of approximately 45 % mineral material, 5% organic matter,
and 50% void space filled with a part of water, and a part of air. In saturated soil, the voids are
completely filled with water and a dry soil with air. Sandy soils normally have 35-50% pore
space, while medium to fine-textured soils have 40-60% pore space. The soil mass consists of
these three components forming a complex material, varying depending on weather, vegetation
and management strategies. In Fig. 2.1 (B) the hypothetical composition of these components
for a medium-textured soil are presented.
The relative percentage of these components, arrangement as well as the size, shape,
and chemical and mineralogical composition of the particles characterizes soil structure. Thus,
Dexter (1988) defined soil structure as “the spatial heterogeneity of the different components or
properties of soil” at various scales. The determination of soil structure is mostly indirectly
performed by measuring soil properties that influences the soil structure. Three categories can
be classified ranging from “structureless” to a good structure: single grained, massive, and
aggregated.
Figure 2.1: Schematic diagram of a hypothetical soil as a three-phase system. (A) Schematic composition
(by volume) of the soil components for a medium-textured soil. Mineral matter and organic matter make
up the soil fraction. Air and Water comprise the pore space fraction. A medium-textured soil consists of
around 50% solid particles and 50% pores. (B) The three phases have been separated, showing their
relative volumes and masses. The masses of the phases are indicated with: Ma = mass of air, Mw = mass of
water and Ms = mass of solids and Mt = total mass. The volumes are represent with Va = volume of air,
Vw = volume of water, Vs=volume of solid, volume of pores Vf = Va + Vw , Vs = volume of solids and Vt =
total volume.
Background: Applied concepts
20
2.1.2 The physics of water flow
The retention and movement of water in soil, uptake and translocation in plants and loss
via evapotranspiration in the atmosphere, are mainly controlled by energy relationships. Kinetic
and potential energy are the two principle forms. Kinetic energy in soil is quite low and
therefore negligible. In 1907 E. Buckingham introduced the term “potential” according to soil
water flow and used an equivalent equation of Darcy´s law to quantify unsaturated flow in soils.
The total potential of soil water, according to the International Soil Science Society, is “the
amount of work that must be done per unit quantify of pure water in order to transport
reversibly and isothermally an infinitesimal quantity of water from a pool of pure water at a
specific elevation at atmospheric pressure to the soil water (at a specific point)” (Aslyng 1963).
Water flow through soil is driven by three major forces. This includes soil water
potentials of gravitational (ѰG), matric (ѰM) and osmotic (ѰO) potential. The sum of these
potentials (Ѱ= ѰG+ ѰM+ ѰO) resulted in the total soil water potential (Miller 1989). Total water
potential describes the energy state in the soil-plant-atmosphere continuum. The energy status of
standing water is zero. Differences in total potential between two points in the soil drive the
water flux in the direction of the lower potential. The gravity potential is equal to the work
which is needed to lift a body against the earth´s gravitational from a reference level to its
present position. Thus the gravity potential is higher the greater the height of water above a
given reference point. The gravity potential is taken as positive or zero, when the reference level
is the soil surface then the gravity potential is negative. The gravitational potential near the soil
surface is always higher compared to ѰG of the subsoil. Under saturated conditions, difference
in ѰG drives the water flow, whereas under unsaturated conditions matric potential determines
the water flow. Matric potential is the measurement for the influence of the matric or how much
water is held in the soil by adhesion and cohesion (Figure 2.2). This potential is always the
opposite of the gravity potential. Therefore it receives a negative sign. The osmotic potential is
determined by the amount of dissolved salts and therefore plays an important role in arid areas.
However, for the water flow into plant root osmotic potential is important. Normally, plant root
potential is lower than the soil water potential, water moves from the soil to the root. The less
the water content of a soil, the greater the forces you need to exclude water from the soil. The
required energy to move water differs between the soil moisture states: saturation, filed rate and
permanent wilting point (Figure 2.2).
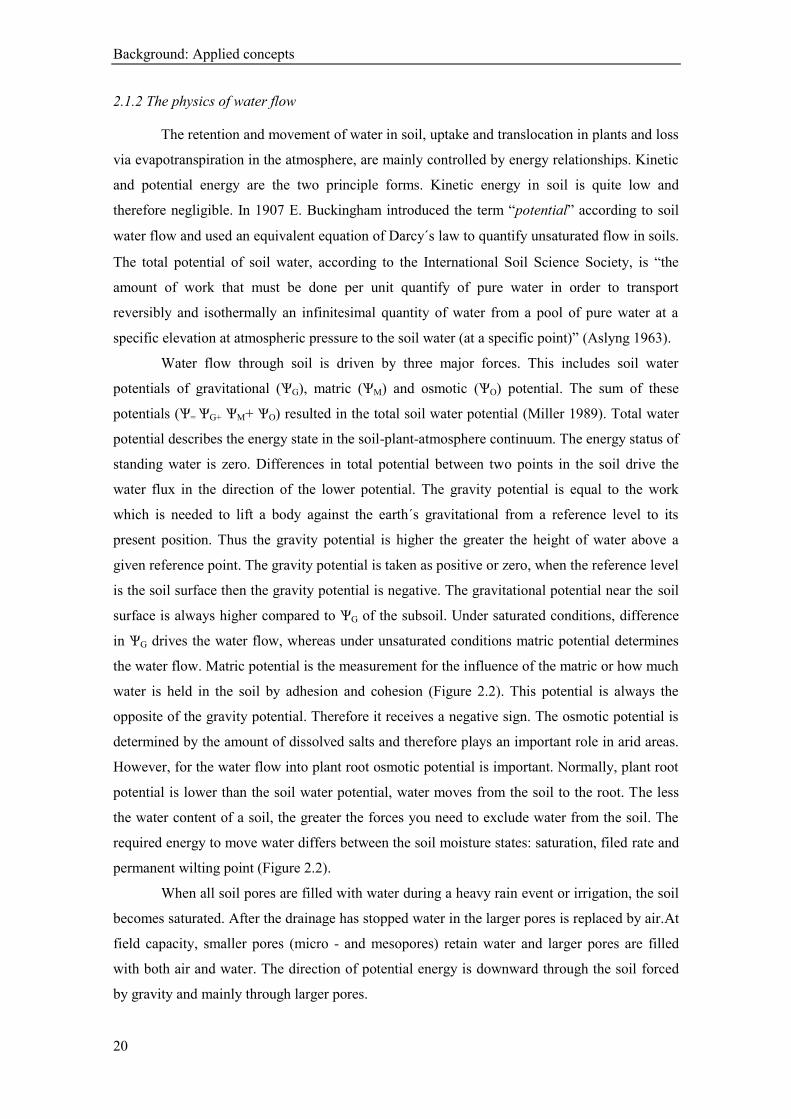
When all soil pores are filled with water during a heavy rain event or irrigation, the soil
becomes saturated. After the drainage has stopped water in the larger pores is replaced by air.At
field capacity, smaller pores (micro - and mesopores) retain water and larger pores are filled
with both air and water. The direction of potential energy is downward through the soil forced
by gravity and mainly through larger pores.
Background: Applied concepts
21
Figure 2.2: Schematic overview of air-water interface during wetting processes in porous media.
If the water content decreases again and the soil matric potential becomes more negative, water
is held to mineral surfaces (capillary forces). At this soil moisture level (permanent wilting
point), plants can no longer adsorb water from the soil. Soil texture, particularly clay content,
has a strong influence on the field rate and the permanent wilting point (Rowell 1994).
2.1.3 Preferential flow (macropore flow)
The generic term “preferential flow” is also known as non-uniform flow, which
describes the process of water movement through a porous medium by pores bypassing the soil
matrix pore space (Luxmoore 1991). During infiltration, preferential flow is a function of the
initial matrix water content, rainfall intensity, rainfall amount, matrix hydraulic conductivity,
and the soil surface contributing area (Trojan and Linden 1992). Based on the differences in
flow processes, preferential flow can be subdivided into three different types, such as macropore
flow (Figure 2.3), fingered and funneled flow (Germann and Beven 1981, Bundt et al. 2001).
Macropore flow is the water flow through pores formed by plant roots (Meek et al. 1992),
earthworms (Lavelle et al. 1992, Lavelle 1997, Angers and Caron 1998) or cracks and fissures
(Germann and Beven 1981, Messing and Jarvis 1990, Zehe and Flühler 2001) and is much
larger than flow through soil matrix pores. Water flow from macropores into the surrounding
soil matrix can be week or with no interaction (Figure 2.3). Fingered flow (flow instability) can
be caused by profile heterogeneity, water repellence and/or air entrapment. The presence of
sloping layers or large impeding structures such as clay lenses can cause “funnelling” by
redirecting the downward water flow. Preferential flow is often attributed to macropore flow
(Luxmoore 1991, Bundt et al. 2001) because macropore flow is the dominant flow process in
many soils and has a strong influence on the total infiltration through soil (Beven and Germann
1982).
Background: Applied concepts
22
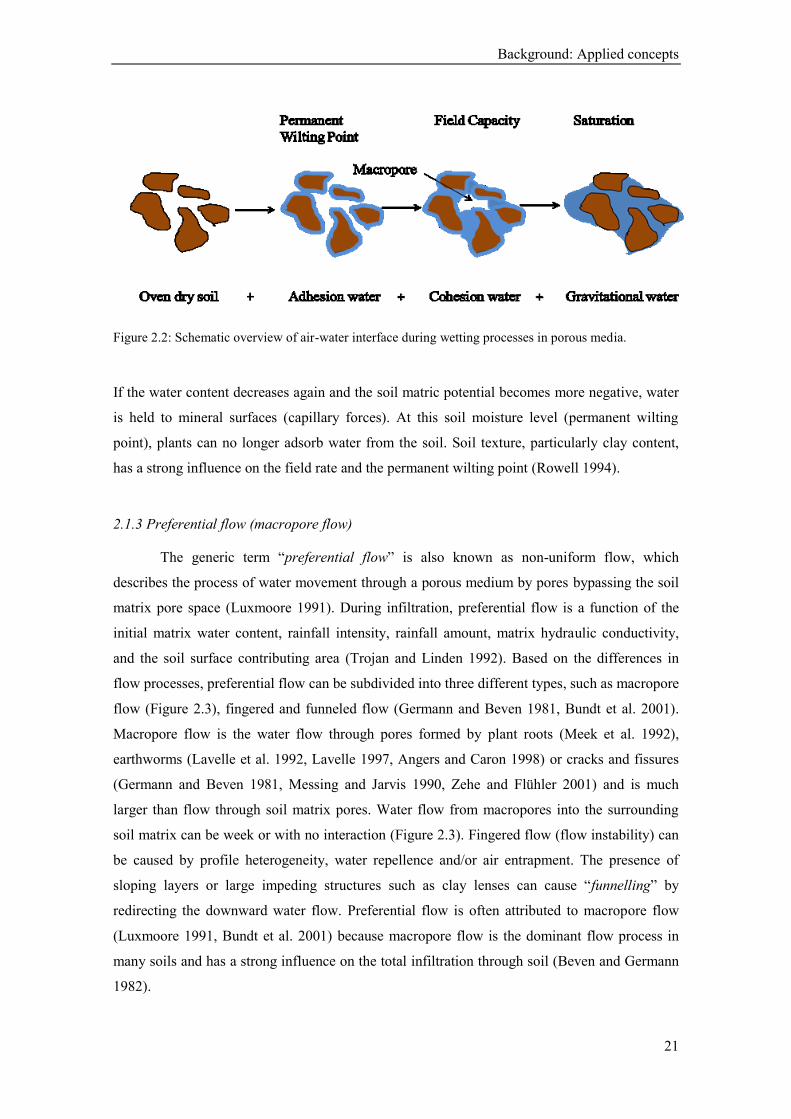
Figure 2.3: Macropore flow paths in a sandy soil of the Jena Experiment, indicated by blue dye. At the
soil surface more uniform flow (Matrix Flow) occur, followed by differentiation into macropores in the
subsoil (Macropore Flow). Water transfer from the macropores into the surrounding soil matrix is called
interaction flow.
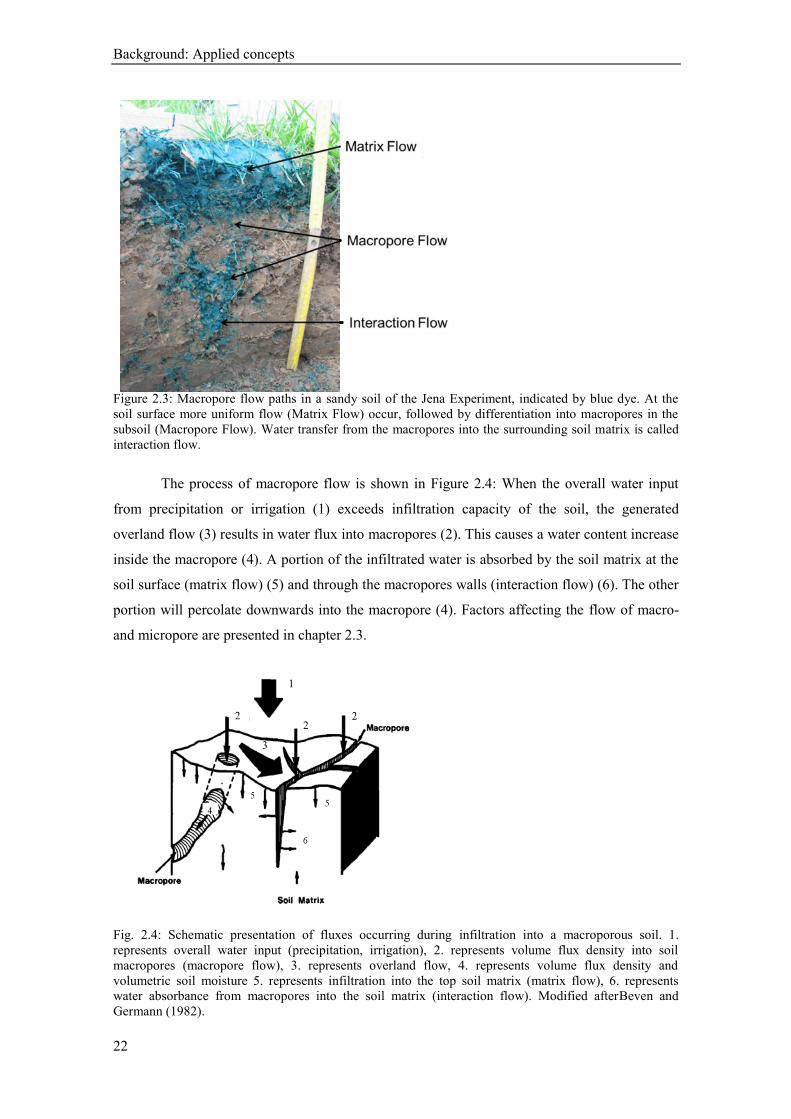
The process of macropore flow is shown in Figure 2.4: When the overall water input
from precipitation or irrigation (1) exceeds infiltration capacity of the soil, the generated
overland flow (3) results in water flux into macropores (2). This causes a water content increase
inside the macropore (4). A portion of the infiltrated water is absorbed by the soil matrix at the
soil surface (matrix flow) (5) and through the macropores walls (interaction flow) (6). The other
portion will percolate downwards into the macropore (4). Factors affecting the flow of macro-
and micropore are presented in chapter 2.3.
Fig. 2.4: Schematic presentation of fluxes occurring during infiltration into a macroporous soil. 1.
represents overall water input (precipitation, irrigation), 2. represents volume flux density into soil
macropores (macropore flow), 3. represents overland flow, 4. represents volume flux density and
volumetric soil moisture 5. represents infiltration into the top soil matrix (matrix flow), 6. represents
water absorbance from macropores into the soil matrix (interaction flow). Modified afterBeven and
Germann (1982).
Background: Applied concepts
23
2.2 Infiltration measurements
Because hydraulic conductivity is a complex variable it is difficult to obtain quantitative
measurements of this soil property. Direct and indirect methods exist to estimate soil hydraulic
conductivity. To determine the saturated hydraulic conductivity (Ks), a good approach is to
measure infiltration of the soil. Mohanty et al. (1994) mentioned some field methods for
measuring the hydraulic conductivity: the Guelph permeameter method, the constant head
permeameter method, the disk permeameter method, the double tube method and the velocity
permeameter method. In our field experiment we used a new type of tension infiltrometer called
a hood infiltrometer (more details in Chapter 2.2.1, Figure 2.5).
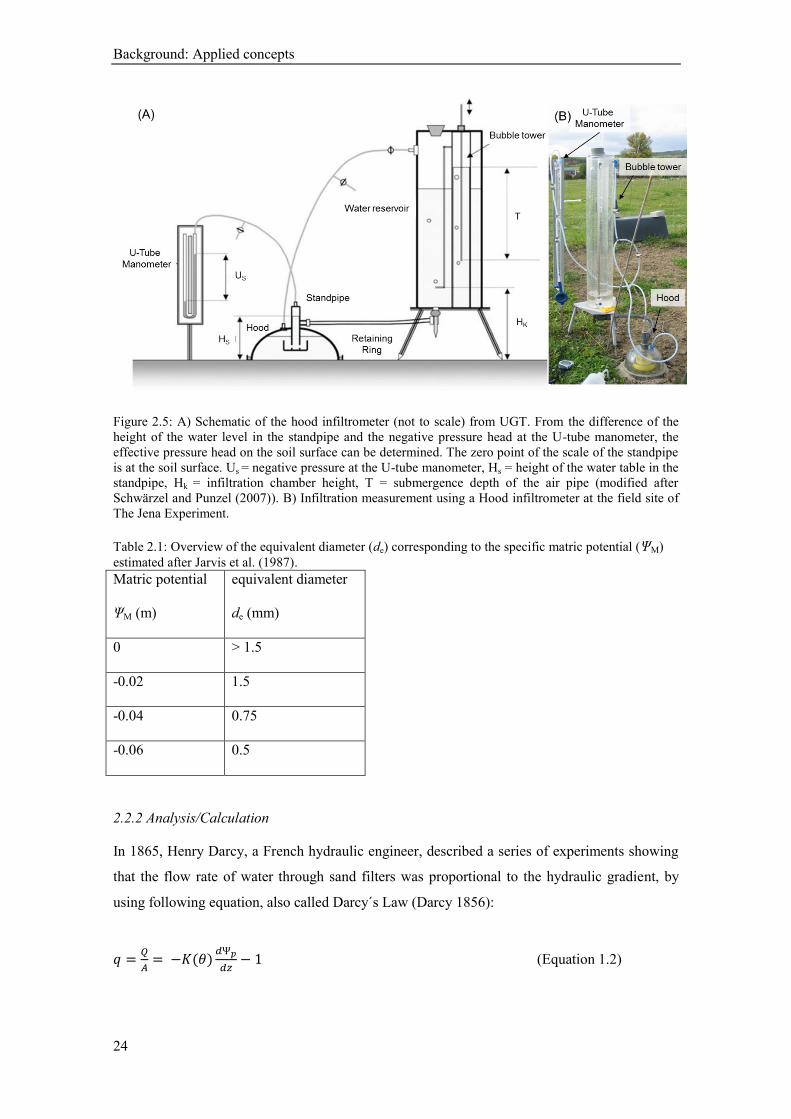
2.2.1 Hood infiltrometer
This in situ technique using a hood infiltrometer (Schwärzel and Punzel 2007) is a good
method for the determination of infiltration capacity. Therfore, a small hood with a diameter of
17.6 cm (for Ecotron experiment 24.8 cm) is placed with the open site to the soil surface filled
with water. Through a “Mariotte” bubble tower with a rate of 5 liters different water pressures
can be applied (Figure 2.5A) (Schwärzel and Punzel 2007). We conducted measurements at
pressure supply heads to the bubble point of the soil. For hood infiltration measurements no
contact layer and therefore no preparation of the soil surface is needed. The source of infiltration
takes place by the circular shaped soil surface covered by the hood. The pressure in the hood is
regulated by the “Mariotte” bubble tower. The effective pressure head (H) can be calculated
between the difference value in the U-pipe manometer (Us) and the pressure value in the
standpipe of the hood (HS):
H = Us - Hs (Equation 1.1)
In this study negative pressure is matric potential. With increasing matric potential
(pressure head becomes more negative), the water flow decreases through pores. For a specific
matric potential (ΨM) the equivalent diameter (de) of the largest soil pore conducting water can
be estimated after Jarvis et al. (1987). At ΨM = 0 m the soil is saturated and the entire pore
spectrum is potentially active. At ΨM = -0.02 m, the largest active pores correspond to de =1.5
mm, at ΨM = -0.04 m to de = 0.75 mm and at ΨM = -0.06 m to de = 0.5 mm (Table 2.1).
Background: Applied concepts
24
Figure 2.5: A) Schematic of the hood infiltrometer (not to scale) from UGT. From the difference of the
height of the water level in the standpipe and the negative pressure head at the U-tube manometer, the
effective pressure head on the soil surface can be determined. The zero point of the scale of the standpipe
is at the soil surface. Us = negative pressure at the U-tube manometer, Hs = height of the water table in the
standpipe, Hk = infiltration chamber height, T = submergence depth of the air pipe (modified after
Schwärzel and Punzel (2007)). B) Infiltration measurement using a Hood infiltrometer at the field site of
The Jena Experiment.
Table 2.1: Overview of the equivalent diameter (de) corresponding to the specific matric potential (ΨM)
estimated after Jarvis et al. (1987).
Matric potential
ΨM (m)
equivalent diameter
de (mm)
0 > 1.5
-0.02 1.5
-0.04 0.75
-0.06 0.5
2.2.2 Analysis/Calculation
In 1865, Henry Darcy, a French hydraulic engineer, described a series of experiments showing
that the flow rate of water through sand filters was proportional to the hydraulic gradient, by
using following equation, also called Darcy´s Law (Darcy 1856):
(Equation 1.2)

Background: Applied concepts
25
where q is the specific discharge Q/A, respectively the volume water flow in units of volume
per time/area (m³/ms).
K is a factor of proportionality, or the saturated hydraulic conductivity (LT-1
) for a given grade
of sand. The gradient of the water pressure is expressed as dѰp/dz. Hydraulic conductivity was
lower for fine sand in comparison to coarse sand. In general, K depends on the moisture content
and pressure head (Ward and Trimble 2004). In saturated soils, K is defined as the saturated
hydraulic conductivity (Ksat).
Typically, most of the models for the calculation of unsaturated water flow within the soil are
based on a numerical solution combining Darcy´s equation with the continuity equation referred
to as Richards or diffusions equation (Richards 1931):
(Equation 1.3)
where θ is the soil water content [L³L-3
], t is time [T], z is a spatial coordinate [L], Ѱ is the
matric potential expressed as a pressure head [L], K(h) is the unsaturated hydraulic conductivity
[LT-1
] as a function of the matric potential, and q(z) is the sink/source term [T-1
] that
corresponds to the water uptake by roots or the water release from roots due to hydraulic
redistribution. The validity of the equations is based on the assumption that the soil is saturated,
homogenous and isotrop, while the flow laminar and isothermal. Consequently, the Richards
equation does not account for all active processes and therefore does not represent the real water
flow in natural systems. Based on Gardner ´s exponential model of the saturated hydraulic
conductivity:
(Equation 1.4)
where Ks [LT-1
] is the saturated hydraulic conductivity and α [L-1
] is the exponential slope under
a given supply potential h0. Analysis of infiltration measurements are based on Wooding’s
(1968) solution for infiltration to describe a three dimensional steady state infiltration into soil
from a shallow circular source of radius r with a constant pressure head by
(
) (Equation 1.5)
where r is the disk radius and Q(h0) is the steady state flow rate (L³/T) under a given supply
potential h0 (L). For a given disk radius the unknown parameters Ks and α can be solved by
measuring with the hood infiltrometer at multiple supply potentials (Ankeny et al. 1990,
Messing and Jarvis 1990, Reynolds et al. 2000). Then α is a constant in the interval between the
two applied pressure heads h0(i) and h0(i+1) when Equation 1.4 and 1.5 are applied piecewise:
Background: Applied concepts
26
i = 1,…, n-1 (Equation 1.6)
where n is the number of supply pressure heads. Rearranging Equation (3) gives
(
)
i = 1,…, n-1 (Equation 1.7)
The steady infiltration capacity between supply pressure heads h0(i+1/2) are calculated by
[
] i = 1,…, n-1 (Equation 1.8)
Using the known values h0(i+1/2), Ki+1/2, and αi+1/2 you can calculate the saturated hydraulic
conductivity Ks by
[ ]
i = 1,…, n-1 (Equation 1.9)
2.3 Factors affecting surface soil hydraulic properties
Water flow through soil is highly variable in space and time (Messing and Jarvis 1990,
Cerdà 1996) due to soil heterogeneity and factors related to soil surface conditions impact the
soil pore system. Parameters that are known to be important for spatial and temporal changes in
hydraulic parameters and influence soil matric forces and pore space are mentioned in the
following chapters. These factors were investigated in more detail in this study. In this thesis, I
distinguish between abiotic soil factors (texture), which are constant in time, and biotic factors
(soil fauna, plant community and soil structural parameters), which change dynamically
depending on environmental factors.
2.3.1 Biotic factors
2.3.1.1 Earthworms (Lumbricidae)
Important components of many terrestrial ecosystems are earthworms that act as soil
ecosystem engineers. They have an influence on soil organic matter dynamics, hydraulic
properties, pedogenetic processes, and plant performances by altering soil structure, water
movement, nutrient dynamics, and plant growth (Lavelle 1988, Edwards and Bohlen 1996,
Scheu 2003, Six et al. 2004). Aristotle was probably one of the first to recognize the importance
of earthworms. He referred to them as the "intestines of the soil“. In the middle of the 18th
century, Linnaeus gave the first description of Lumbricus terrestris taxonomy. Darwin (1882)
Background: Applied concepts
27
was one of the first scientists who showed the biological importance of earthworms to soil
fertility and development for the agriculture.
Bouché (1977) defined the zone 2mm around earthworm burrows as the term
drilosphere. Later in 1988 Lavelle also included the earthworm itself and all the soil volume that
is directly and indirectly modified by earthworms to the drilosphere. Earthworms can be defined
into three major ecological types based on their different localization in soil, burrowing
behavior and food resources: endogeic, epigeic and anecic earthworms (Bouché 1977) (Figure
2.6). Depending on the ecological type, earthworms create burrows ranging from 2-11mm in
diameter (Ehlers 1975, Syers and Springett 1983). They have different influences on the
drilosphere components because they differ in depth and orientation of the burrows, casting
manner, morphology, size, pigmentation and relationship to the soil microflora (Lavelle, 1988).
Epigeic species (surface soil and litter species) live within the surface plant litter. Endogeic
species (upper soil species) build only temporary horizontal channels and refill their burrows
(Lavelle et al. 1995). These small worms with a diameter ranging between 2-5 mm are adapted
to highly variable moisture, temperature and high organic matter content of soil (Pérès et al.
1998). An intermediate type of earthworm between the litter-dwelling epigeic and the soil-
dwelling endogeics are anecic species (deep-burrowing species). A typical representative of the
anecic species is Lumbricus terrestris. These species burrow long vertical casts in the soil and
feed mainly on surface litter. Most of the burrows have a diameter larger than 5 mm (Edwards
and Bohlen 1996) and can exist for a long time up to a depth of 2 m (Edwards et al. 1992), even
after the death of the worm. Because of the different mixing and crawling strategies, endogeic
and epigeic earthworms mainly increase the infiltration in the topsoil, as opposed to anecic
species which enhance water flow to deeper soil strata (Shuster et al. 2002) (Figure 2.6). The
burrowing activity is different not only between the ecological types, but also between the
different species from one ecological group (Bastardie et al. 2003).
Through their burrowing activity, earthworms affect infiltration (Shipitalo and Butt,
1999), water movement (Shipitalo et al. 2004), plant performance (Wurst and Jones 2003), soil
physical properties (Lavelle 1988), microbial communities (Brown 1995, Scheu 2003) nutrient
cycling (Edwards and Bohlen 1996), soil aggregation (Shipitalo and Protz 1988, Six et al. 2004)
and vegetation development (Milcu et al. 2006). Some studies have documented that
earthworms enhance plant productivity (Hopp and Slater 1948, Stockdill 1966, Schmidt and
Curry 1999). Eisenhauer et al. (2009b) showed that earthworms also increase belowground
competition by increasing plant diversity, and that legumes benefit from earthworm abundance.
Earthworm performance is negatively affected mainly by the presence of grasses and benefits
by the presence of legumes (Eisenhauer et al. 2009a). It has been suggested that legumes and
earthworms are mutualistic related (Eisenhauer et al. 2009b).
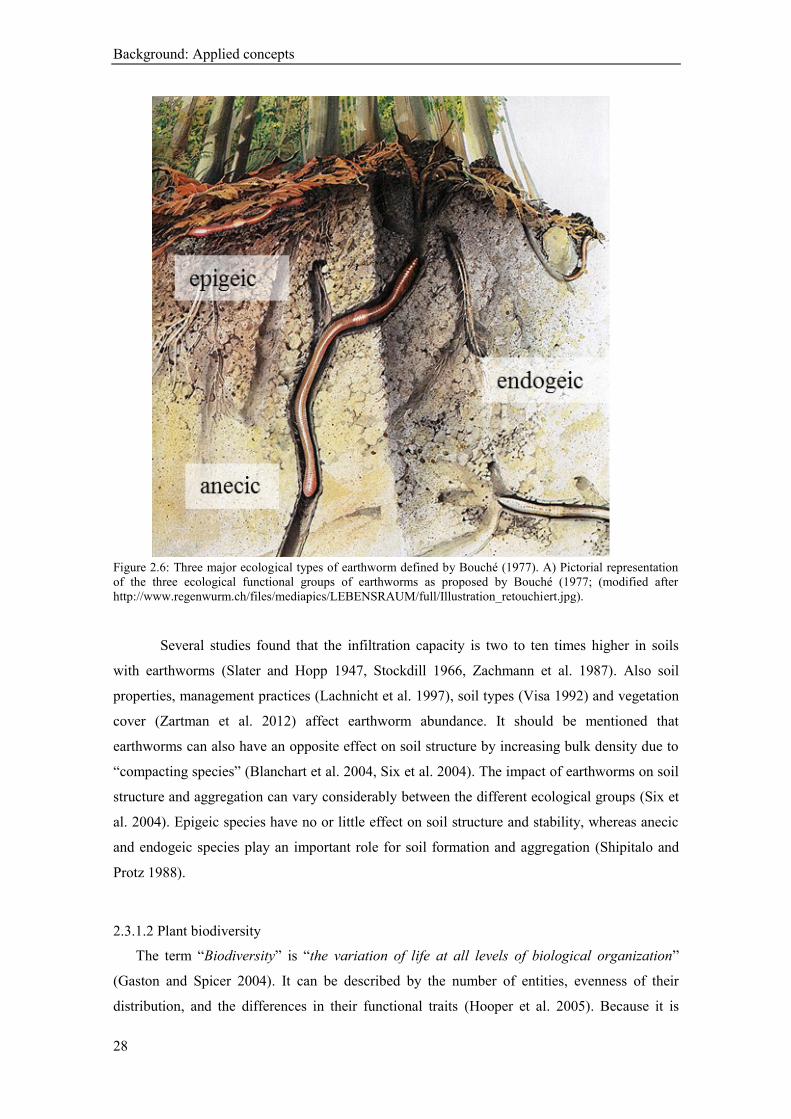
Background: Applied concepts
28
Figure 2.6: Three major ecological types of earthworm defined by Bouché (1977). A) Pictorial representation
of the three ecological functional groups of earthworms as proposed by Bouché (1977; (modified after
http://www.regenwurm.ch/files/mediapics/LEBENSRAUM/full/Illustration_retouchiert.jpg).
Several studies found that the infiltration capacity is two to ten times higher in soils
with earthworms (Slater and Hopp 1947, Stockdill 1966, Zachmann et al. 1987). Also soil
properties, management practices (Lachnicht et al. 1997), soil types (Visa 1992) and vegetation
cover (Zartman et al. 2012) affect earthworm abundance. It should be mentioned that
earthworms can also have an opposite effect on soil structure by increasing bulk density due to
“compacting species” (Blanchart et al. 2004, Six et al. 2004). The impact of earthworms on soil
structure and aggregation can vary considerably between the different ecological groups (Six et
al. 2004). Epigeic species have no or little effect on soil structure and stability, whereas anecic
and endogeic species play an important role for soil formation and aggregation (Shipitalo and
Protz 1988).
2.3.1.2 Plant biodiversity
The term “Biodiversity” is “the variation of life at all levels of biological organization”
(Gaston and Spicer 2004). It can be described by the number of entities, evenness of their
distribution, and the differences in their functional traits (Hooper et al. 2005). Because it is

Background: Applied concepts
29
difficult to measure biodiversity, species richness has become an often used approach in
ecological studies (Gotelli and Colwell 2001).
The effect of how plant biodiversity might influence hydraulic pathways in soil is not
clearly understood. However, there is an increasing number of ecological studies that highlight
the influence of plant species numbers and/or composition on ecosystem processes and
properties such as plant productivity and nutrient cycling (Hector et al. 1999, Loreau and Hector
2001, Spehn et al. 2004). Higher Biomass production is associated with larger and longer
macropores (Grevers and Jong 1990). As well, earthworm abundance and root biomass are
positively related to plant species richness, which changes the number of macropores and have
an influence on water relations and movement in the soil (Bardgett et al. 2001).
Other soil properties, like aggregate stability, are influenced by plant species richness
(Angers and Caron 1998, Pohl et al. 2009), due to their differences in root functional traits (root
biomass, diameter of coarse and fine roots, root orientation and distribution) (Gyssels and
Poesen 2003). Next to aggregate stability the root system affects the infiltration capacity, bulk
density, organic and chemical content and shear strength (Six et al. 2004, Bronick and Lal
2005). Therefore, first growing plant roots can clog pore, thus resulting in a reduced infiltration
capacity. However, if the roots decompose, the created channels increased the infiltration
capacity (Barley 1954, Gish and Jury 1983, Mitchell et al. 1995).
2.3.2 Soil structural properties (bulk density, porosity and soil organic carbon)
Bulk density and porosity are good soil structural indicators for characterization
changing soil structure and aggregation (Six et al. 2000). High bulk density indicates a low
porosity and implies that root growth is reduced, which results in poor air and water flow
through the soil (Stirzaker et al. 1996). Management and vegetation cover affect organic matter
content, soil structure and porosity. Soils with high organic matter content and porous structure
are contributed to lower bulk density and higher porosity (Franzluebbers 2002). Additionally,
Berglund et al. (1980) have shown that organic matter correlates positively with infiltration
capacity, reflecting the importance of organic matter for enhancing soil structure and
macroporosity by improving humus and clay complexes in the soil.
The change of bulk density is used as an indicator of soil compaction (Alaoui et al.
2011). Compacted soils have a bulk density higher than 1.6 g/cm³, while porous soil with high
organic matter have bulk densities around 1.0 g/cm³. The greater the bulk density the lower the
total pore space for water flow and root growth. But bulk density cannot account for changes of
the shape and size of the pores in the soil. In contrast to silt and clayey soils, sandy soils have a
higher bulk density caused by a low volume of pores. Generally, most rocks have a bulk density
Background: Applied concepts
30
of 2.65 g/cm³, while medium textured soils with 50 percent pore space have a bulk density
around 1.33 g/ cm³.
Soil porosity refers to that part of a soil volume that is not occupied by soil particles or
organic matter, it is the fraction of the total volume occupied by pores or voids. This value can
range from 30 to 60% (Hillel 1998). Pore spaces are filled with air, other gases, or water. Large
pores (macropores) allow the movement of air and the drainage of water. Also within these
pores, root growth and soil fauna activity is promoted. Sandy soils are often less porous
compared to silt or clayey soils, because they consist of a lower amounts of small pores and are
dominated by larger, fewer pores. Because of the shrinking and swelling characteristic of clayey
soils, the porosity here is very variable. With increasing organic matter, the porosity also
increases, which leads to a higher infiltration (Franzluebbers 2002).
Besides the primary matrix porosity (solid phase of soil), pores created by root, soil
fauna and cracks form a secondary porosity. Therefore water flow in soils can occur between
the primary and secondary porosity systems. Generally, porosity is mainly divided into textural
porosity (matrix), as the pore space between the primary particles (intra-aggregate), and
structural porosity (inter-aggregate), as the pore space between micro-aggregates containing
macropores such as biopores, cracks and fissures (Hillel 1998). Macroporosity (structural
porosity) is the most dynamic part of total porosity due to tillage, climate and biological
activities. These large pores are important for plant growth and improved infiltration.
Compaction of the soil by agriculture management results in an increase in bulk density, a
decrease in porosity, which leads to a decrease in infiltration, and an increase in run-off and soil
erosion (Berglund et al. 1980, Franzluebbers 2002).
Calculations
Soil bulk density (ρb) is calculated as the dry weight of soil divided by its total soil
volume (volume of soil particles and pores):
(Equation 1.10)
where Ms is the weight of oven dry soil (g) and Vs the volume of the container (cm³).
Soil porosity is the ratio of the volume of soil pores to the total soil volume:
(Equation 1.11)
where Vv is the volume of pores (cm³) and Vt the volume of soil sample (cm³).
Background: Applied concepts
31
2.3.3 Soil texture
A very important abiotic factor, which is controlled the rate of infiltration, is the type of
soil. Soil can be classified into four soil texture classes: sands, silts, loams and clays depending
on the proportion of small, medium and large particles (clay, silt, and sand). Sand particles
range in size from 63–2000 µm, silt particles ranges from 2–63 µm and clay is made up of
particles less than 2 µm in diameter (Ad-hoc-AG Boden, 2005). Generally, water moves faster
through coarse (sandy) soil because of the large pores as opposed to through fine grained
(clayey) soil with smaller pores. Traditionally, prediction of hydraulic conductivity is based on
soil texture, bulk density or organic matter content, implying a decrease of hydraulic
conductivity with an increase of a fraction of fine grains (Blackburn 1975, Wösten and Van
Genuchten 1988, Archer et al. 2002). This relationship can be reversed due to soil structuring
processes leading to interconnected macropores (Jarvis and Messing 1995, Lin et al. 1999).
Several studies showed that soil texture in dry regions plays an important role for water
availability in soil, thus affecting the vegetation structure (Barnes and Harrison 1982, Knoop
and Walker 1985, Parker 1991).

Chapter
3
Spatial variability of infiltration capacity

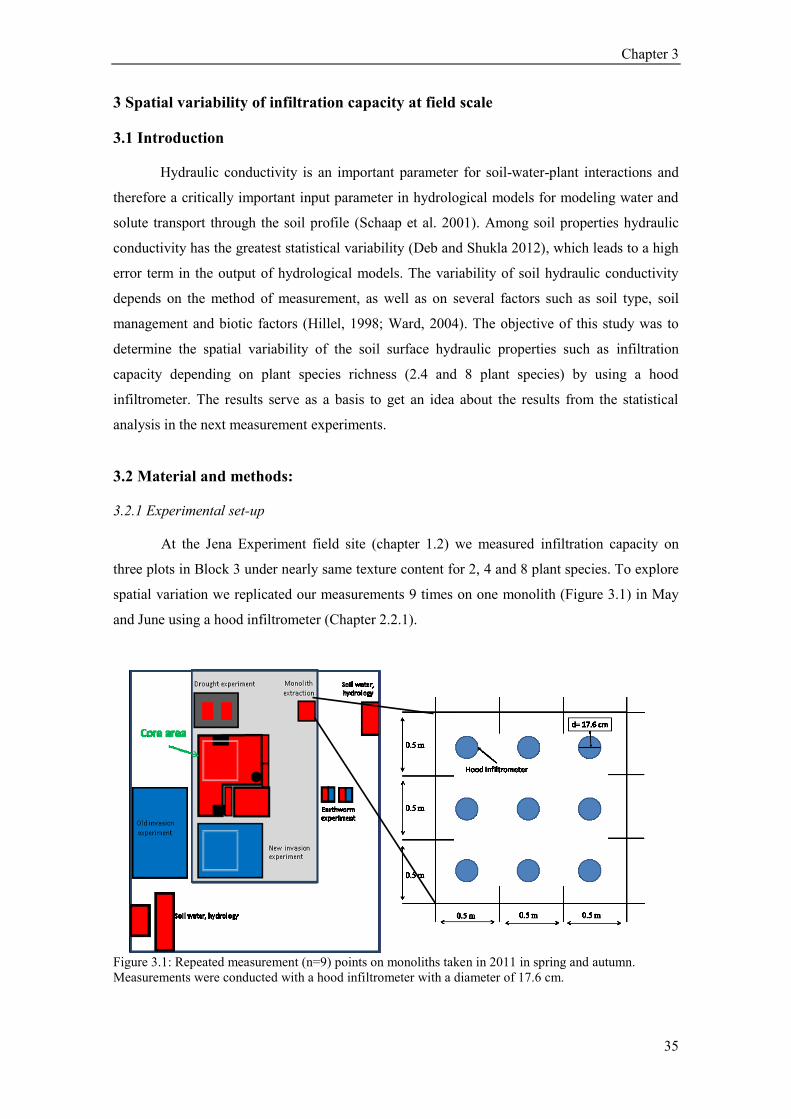
Chapter 3
35
3 Spatial variability of infiltration capacity at field scale
3.1 Introduction
Hydraulic conductivity is an important parameter for soil-water-plant interactions and
therefore a critically important input parameter in hydrological models for modeling water and
solute transport through the soil profile (Schaap et al. 2001). Among soil properties hydraulic
conductivity has the greatest statistical variability (Deb and Shukla 2012), which leads to a high
error term in the output of hydrological models. The variability of soil hydraulic conductivity
depends on the method of measurement, as well as on several factors such as soil type, soil
management and biotic factors (Hillel, 1998; Ward, 2004). The objective of this study was to
determine the spatial variability of the soil surface hydraulic properties such as infiltration
capacity depending on plant species richness (2.4 and 8 plant species) by using a hood
infiltrometer. The results serve as a basis to get an idea about the results from the statistical
analysis in the next measurement experiments.
3.2 Material and methods:
3.2.1 Experimental set-up
At the Jena Experiment field site (chapter 1.2) we measured infiltration capacity on
three plots in Block 3 under nearly same texture content for 2, 4 and 8 plant species. To explore
spatial variation we replicated our measurements 9 times on one monolith (Figure 3.1) in May
and June using a hood infiltrometer (Chapter 2.2.1).
Figure 3.1: Repeated measurement (n=9) points on monoliths taken in 2011 in spring and autumn.
Measurements were conducted with a hood infiltrometer with a diameter of 17.6 cm.

Chapter 3
36
3.2.2 Analysis
For the characterization of the spatial variability of the infiltration capacity within plant species
richness and month, we used the Coefficient of Variation (CV), standard deviation and mean. A
CV≤10% contributes to a weak variability, a CV between 10 and 100% to a moderate
variability, and CV ≥ 100% to a strong variability. We also check our data for outliers. After
Zuur et al. (2010) an outlier is defined as an observation with a large or small value compared to
the majority of data points. There is no mathematical definition to determine when an outlier is
an outlier. In the past there has been much discussion regarding the handling of extreme data
points and their removing from the dataset. According to Wainer (1976) we define an outlier or
so called "fringeliers” as an outlier, when the observed value lies three standard deviations from
the mean.
3.3 Results
The CVs for the infiltration capacity decreased for 2 plant species (CV=111%) to 4 plants
species (CV=44%) and then increased slightly for 8 plant species (CV=57%) at saturation in
May. CVs decreased for 2 plant species (CV=105%) to 4 plant species (CV=26%), and then
also increased for 8 plant species (CV=63%) in June 2011 (Table 3.1). In May two data points
and in June one data point all on plots containing 2 plant species were detected as outliers
because the value was three times higher than the standard deviation of the overall mean (Figure
3.2). By removing the outliers in May, the CV increased continuously from 2 species (CV=33
%) to 8 species (CV=57 %). For two plant species the variation changed from strong to
moderate by removing outliers. But in June, the removed outliers did not change the overall
pattern and only reduced the CV for 2 plant species richness from 105% to 102% (Table 3.1).
For all data points, removing the two outliers in May strongly reduced the mean, SD and CV. In
June, removing one outlier, the mean, SD and CV was only slightly reduced. In May infiltration
capacity did not correlate with plant species richness (r= -0.192, p=0.328), but after removing
the outliers a trend was observed (r=0.288, p=0.154). Also in June infiltration capacity did not
correlate with plant species richness (r=0.034, p=0.867), even after removing outliers (r=0.203,
p=0.321).
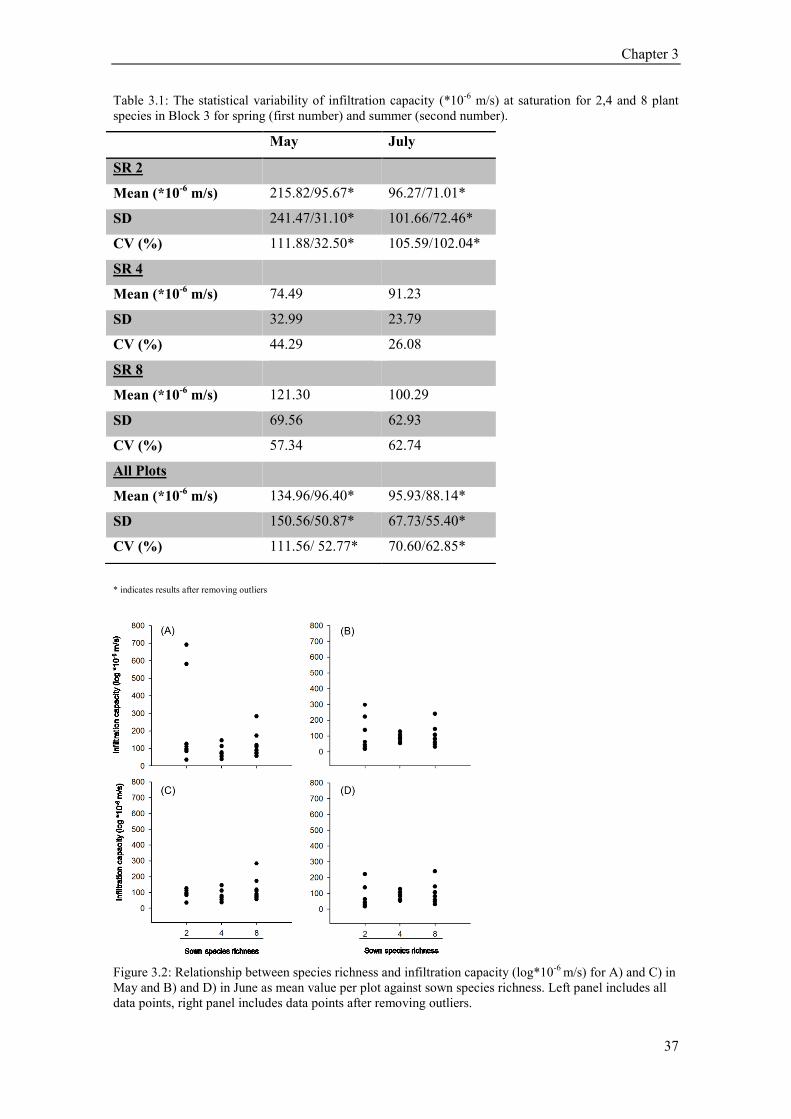
Chapter 3
37
Table 3.1: The statistical variability of infiltration capacity (*10-6
m/s) at saturation for 2,4 and 8 plant
species in Block 3 for spring (first number) and summer (second number).
* indicates results after removing outliers
Figure 3.2: Relationship between species richness and infiltration capacity (log*10-6
m/s) for A) and C) in
May and B) and D) in June as mean value per plot against sown species richness. Left panel includes all
data points, right panel includes data points after removing outliers.
May July
SR 2
Mean (*10-6
m/s) 215.82/95.67* 96.27/71.01*
SD 241.47/31.10* 101.66/72.46*
CV (%) 111.88/32.50* 105.59/102.04*
SR 4
Mean (*10-6
m/s) 74.49 91.23
SD 32.99 23.79
CV (%) 44.29 26.08
SR 8
Mean (*10-6
m/s) 121.30 100.29
SD 69.56 62.93
CV (%) 57.34 62.74
All Plots
Mean (*10-6
m/s) 134.96/96.40* 95.93/88.14*
SD 150.56/50.87* 67.73/55.40*
CV (%) 111.56/ 52.77* 70.60/62.85*
Chapter 3
38
3.4 Conclusion
Generally, it is assumed that samples collected close to each other are more similar than those
collected at a greater distance (Deb and Shukla 2012). Surprisingly, the data shows that there is
a high variation between samples taken next to each other, up to very high variation in plots
containing two plant species. By not removing these outliers, a possible effect on infiltration
capacity is probably masked by these variations. The spatial pattern varied within plant species
richness and the dates highlighting the fact that one set of measurements is not sufficient for
describing the spatial variability of water flow through soil. The results showed that infiltration
varies for plant species richness and measurement date. To achieve proper estimates it is
necessary to take many samples covering the whole field site. By increasing the number of
measurement points, it is possible to deal with the “noise”, by reducing the impact of outliers
(Wen et al. 2013). The high variation of hydraulic conductivity has dramatic effects on the
output. In spring, when outliers were removed from our dataset, the correlation between plant
species richness changed from no significant negative correlation to a positive trend. Therefore,
we have to be aware that no effect may be overwhelmed by spatial variation, and that trends
could also give a hint of possible effects on water flow through soil. Additionally, the variability
of infiltration capacity within plant species richness was larger than the variability between the
measurement dates. In our next field campaigns we aimed to increase our data points to reduce
the impact of the high variation of infiltration on our results.

Chapter
4
How do earthworms, soil texture and plant composition affect infiltration
along an experimental plant diversity gradient in grassland?

Chapter 4
41
4 How do earthworms, soil texture and plant composition affect infiltration along
an experimental plant diversity gradient in grassland?
4.1 Abstract
Infiltration is a key process in determining the water balance, but so far effects of
earthworms, soil texture and plant diversity their interactions have not been studied in detail.
We measured infiltration capacity in subplots with ambient and reduced earthworm density
nested in plots of different plant species richness (1, 4 and 16), plant functional group richness
and composition (1 to 4; legumes, grasses, small herbs, tall herbs). In summer, earthworm
presence significantly increased infiltration, whereas in fall effects of grasses and legumes on
the infiltration were mediated by suppressing or enhancing earthworm biomass. Both grasses
and legumes modified infiltration and may even reverse effects of texture. We propose two
pathways: (i) direct, probably by modifying the pore spectrum and (ii) indirect, by enhancing or
suppressing earthworm biomass, which in turn influenced infiltration capacity due to burrowing
activity. Overall, the results suggest that substantial spatial and temporal variation of soil
hydraulic properties can be explained by biotic processes, especially by the presence of certain
plant functional groups affecting earthworm biomass due to shaping soil structure, while soil
texture had no significant effect. Therefore biotic parameters should be taken into account in
hydrological applications.
4.2 Introduction
The water balance of the soil is determined by the interaction of water supply and water
removal due to processes such as precipitation, infiltration, run-off, percolation and
evapotranspiration. For efficient soil and water management, knowledge of soil hydraulic
properties, including soil hydraulic conductivity and infiltration characteristics, is necessary to
understand how rainwater moves from the soil surface to groundwater. Hydraulic conductivity
describes the rate of a porous medium to transmit water. It depends on total pore space, pore
size distribution and tortuosity (Kutílek 2004). Soil pores are of various origin. The smallest
ones (micropores) are related to the grain size distribution and constitute the largest fraction of
the total pore volume (Dexter 1988, Lin et al. 1999, Ward and Trimble 2004). Larger pores
(often referred to as meso- and macropores) make up a characteristic property of the soil structure
(Angers and Caron 1998, Lipiec et al. 2006). Soil structure is determined by aggregates of
different sizes, divided into intra-aggregate and inter-aggregate pore structures (Alaoui et al.
2011). According to the pore size classification intra-aggregate pores include micro- and
mesopores, whereas inter-aggregate pores include meso- and mainly macropores (Hillel 1998).
Chapter 4
42
Traditional predictions of hydraulic conductivity are based on soil texture, bulk density
or organic matter content (mainly intra-aggregate pores) (Rawls et al. 1982, Wösten and Van
Genuchten 1988, Vereecken 1995), implying a decrease of hydraulic conductivity with
increasing fraction of fine grains. However, this relationship can be weakened by soil
structuring processes forming larger inter-aggregate pores such as interpedal voids and biopores
(Jarvis and Messing 1995, Lin et al. 1999). Macropores constitute a comparatively small
fraction of the total pore space, but can contribute substantially to total flow through the porous
medium, mainly during high intensity rainfall events (Watson and Luxmoore 1986, Beven and
Germann 2013). Thus, they provide channels for bypass flow or deep macropore infiltration.
Macropores created by both earthworms and plant roots also play a major role for
preferential flow (Edwards et al. 1990, Angers and Caron 1998, Beven and Germann 2013). For
example, Weiler and Naef (Weiler and Naef 2003) observed in grassland that the flow rate
through vertically oriented macropores formed by earthworms or plant roots was higher than
through the soil matrix. On the other hand, root growth can have opposite effects by clogging of
pore space and thus decrease hydraulic conductivity (Bodner et al. 2008).
Macropores formed by earthworms range between 2 to 11 mm in diameter (Ehlers 1975)
depending on the ecological group of earthworms, i.e. endogeic, epigeic and anecic (Bouché
1977). Endogeic and epigeic earthworms that live in upper mineral soil or at the soil surface
mainly form small and tortuous pores ranging between 2 and 5 mm in diameter (Pérès et al.
1998). In contrast, anecic species form pores larger than 5 mm in diameter, which may reach as
deep as 2 m into the soil (Edwards and Bohlen 1996) and thus enhance infiltration into deep soil
layers (Shuster et al. 2002). As a consequence of the different specific burrowing behaviors the
impact on water flow through soil varies among the different ecological groups (Edwards et al.
1990). Further, roots form voids of substantial size, but the majority of pores stemming from
root growth are smaller (0.1-0.6 mm) than those from earthworms (Tippkötter 1983). However,
root induced pores differ with plant species and can be much larger. For example, most of the
root channels formed by the legume alfalfa were between 0.5 and 2.5 mm in diameter (Meek et
al. 1989). Besides the formation of macropores mentioned above, biotic processes are also
involved in creating and stabilizing of soil structure (Six et al. 2004, Pérès et al. 2013). Soil
aggregates are more stable in biologically active soil with high carbon content, which is
therefore associated with low soil bulk density and high porosity (Zacharias and Wessolek
2007).
The processes contributing to structuring of the soil and shaping its hydraulic properties
are intensively interlinked. For example, earthworm activity depends on a number of factors
which influence soil structure and hydraulic properties themselves, such as soil type (Visa 1992)
and texture (Edwards and Bohlen 1996), management practices (Lachnicht et al. 1997) and
vegetation cover (Zartman et al. 2012). Earthworms also alter above- and belowground plant
Chapter 4
43
productivity by creating additional macropores and their effect varies with plant diversity and
plant functional groups (Eisenhauer et al. 2009a, Eisenhauer et al. 2009b). Several experimental
studies have shown that above- and belowground biomass production change with increasing
plant diversity (Tilman et al. 2001, Spehn et al. 2004, Bessler et al. 2009). Furthermore, larger
and longer macropores were associated with increased plant biomass production and earthworm
abundance (Grevers and Jong 1990). Plant species richness not only affects rooting density, but
also improves soil stability, accumulation of organic matter and promotes the activity for soil
biota (Angers and Caron 1998, Thompson et al. 2010). Relatedly, the presence of certain plant
functional groups, such as legumes and grasses, has been shown to affect the abundance and
activity of soil organisms (Milcu et al. 2008, Eisenhauer et al. 2011). Understanding how plant
diversity, functional group composition and earthworms influence soil water fluxes and
resulting soil moisture distribution is important to improve predictions on how water fluxes will
change in taxonomically simplified ecosystems.
Our measurements were conducted in the frame of the Jena Experiment (Roscher et al.
2004), a long-term grassland biodiversity experiments with a manipulation of plant diversity
and covering experimental blocks with differences in soil structure and texture. This orthogonal
experiment presents the opportunity to study Infiltration capacity in the field and allows for
disentangling the relative importance of soil-physical and biological processes for soil hydraulic
conductivity. The main questions of the field study were:
(i) Does earthworm activity increase infiltration capacity?
(ii) How does the plant community influence earthworm activity?
4.3 Material and methods
4.3.1 Study area and experimental design
4.3.1.1 The Jena Experiment
The study was performed on the field site of The Jena Experiment which is located in
the floodplain of the Saale river near Jena (Thuringia, Germany; 50°55´N, 11°35´E, 130 m
above sea level). Mean annual air temperature is 9.3°C and mean annual precipitation is 587
mm (Kluge and Müller-Westermeier 2000). Before the establishment in 2002 the experimental
field site was an arable land and highly fertilized over the last decades. After the last harvest in
autumn 2000 the field was ploughed and kept fallow throughout 2001, and the experimental
plant communities were established in spring 2002 for investigating the interactions between
plant diversity and ecosystem processes, focusing on element cycling and trophic interactions
(Roscher et al. 2004). The soil of the experimental site is an Eutric Fluvisol (FAO-Unesco 1997)
developed from up to 2 m thick loamy fluvial sediments (Roscher et al. 2004). The soil texture
on the field site in the upper 10 cm of the soil profile changes with increasing distance from the
Chapter 4
44
river, gradually from sandy loam to silt clay. The sand content decreases from 40% near the
river to 11% at distance, while the silt content increases proportionally from 44% to 66%. The
clay content (16-23%) shows no significant spatial trend. Plots were assembled in a10 ha area
into four blocks, arranged parallel to the river, thus accounting for changes in soil properties and
water conditions.
A pool of 60 native plant species common of Central European mesophilic grasslands
was used to established a gradient of plant species richness (1, 2, 4, 8, 16 and 60) and functional
group richness (1, 2, 3 and 4) on 82 plots of 20 x 20 m. To account for differences in
morphology and physiology, species were assigned to four functional groups: grasses (16
species), small herbs (12 species), tall herbs (20 species) and legumes (12 species). In addition
to test on effects of plant species richness and functional group richness, the experimental
design allows for tests caused by the presence and absence of certain functional groups and
texture. The plots were mown twice a year and the mown material was removed from the plots
shortly after cutting. All plots were weeded regularly to maintain the target species composition.
More details on the experiment and management are given in (Roscher et al. 2004).
4.3.1.2 Earthworm subplots
Earthworm abundance was observed and manipulated on subplots of the main
experimental plots with species-richness levels of 1 (12 plots), 4 (16 plots) and 16 (14 plots)
since September 2003 (Table 4.1). Two subplots (size 1 x 1 m) are located in close vicinity to
each other (50 cm distance). Two treatments were established: ambient earthworm (+ew) and
earthworm reduction (-ew). Subplots were enclosed with PVC shields (20 cm aboveground and
15 cm belowground) to decrease the re-colonization of earthworm reduction subplots
(Eisenhauer et al. 2009a). Aboveground shields were removed two times a year during the
mowing period. Earthworms were extracted from reduction subplots twice a year in spring
(beginning of April) and autumn (end of September) by electro-shocking. A voltage was applied
to the soil for 35 min. via four octet devices (Thielemann 1986) (DEKA 4000, Deka Gerätebau,
Marsberg, Germany) powered by two 12 V batteries. During the application time the voltage
was increased sequentially from 250 V (10 min) to 300 V (5 min), 400 V (5 min), 500 V (5
min) and 600 V (10 min). For more details on the arrangement of the steel rods of the octet
devices and management of the earthworm subplots see (Eisenhauer et al. 2009a). Notably, steel
rods were installed in both earthworm subplots controlling for potential side effects on
infiltration. Two sampling campaigns on the –ew and additional extraction on control subplots
in 2006 (Eisenhauer, unpupl. data) confirmed that earthworm data from –ew subplots is an
adequate measure of earthworm data in the +ew subplots. Extracted earthworms were identified,
counted and weighted (with gut content) in the laboratory. Earthworms at the field site of the
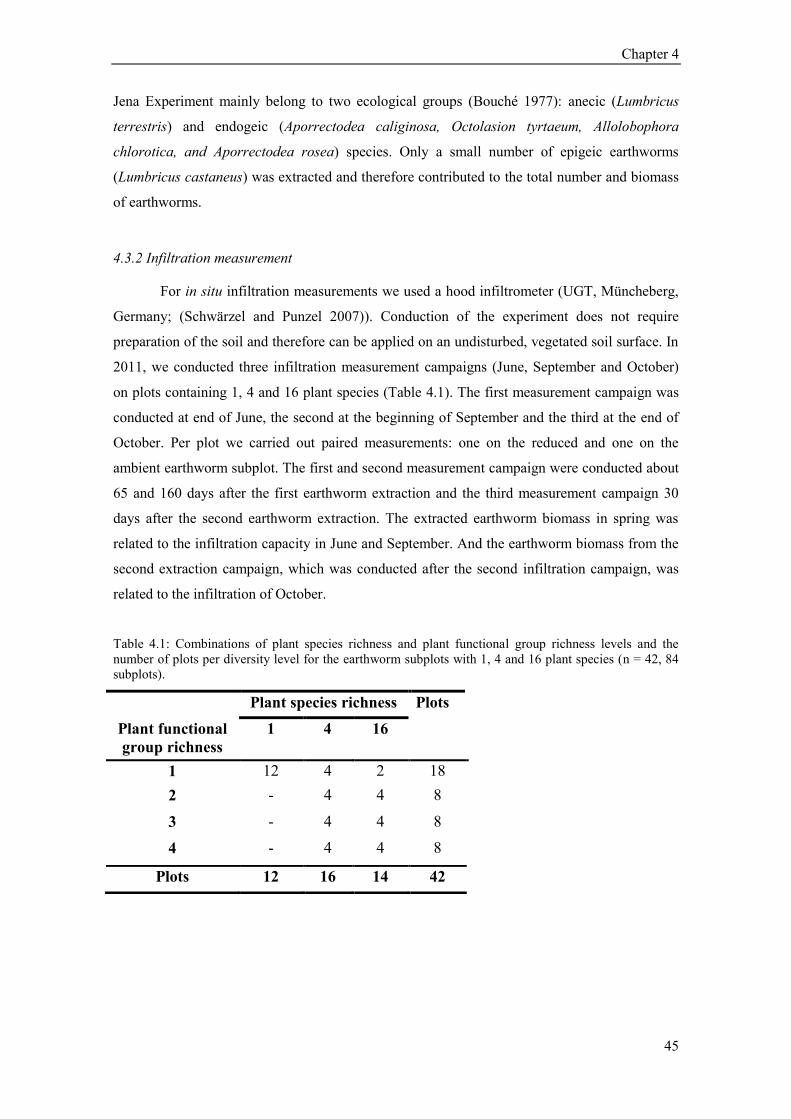
Chapter 4
45
Jena Experiment mainly belong to two ecological groups (Bouché 1977): anecic (Lumbricus
terrestris) and endogeic (Aporrectodea caliginosa, Octolasion tyrtaeum, Allolobophora
chlorotica, and Aporrectodea rosea) species. Only a small number of epigeic earthworms
(Lumbricus castaneus) was extracted and therefore contributed to the total number and biomass
of earthworms.
4.3.2 Infiltration measurement
For in situ infiltration measurements we used a hood infiltrometer (UGT, Müncheberg,
Germany; (Schwärzel and Punzel 2007)). Conduction of the experiment does not require
preparation of the soil and therefore can be applied on an undisturbed, vegetated soil surface. In
2011, we conducted three infiltration measurement campaigns (June, September and October)
on plots containing 1, 4 and 16 plant species (Table 4.1). The first measurement campaign was
conducted at end of June, the second at the beginning of September and the third at the end of
October. Per plot we carried out paired measurements: one on the reduced and one on the
ambient earthworm subplot. The first and second measurement campaign were conducted about
65 and 160 days after the first earthworm extraction and the third measurement campaign 30
days after the second earthworm extraction. The extracted earthworm biomass in spring was
related to the infiltration capacity in June and September. And the earthworm biomass from the
second extraction campaign, which was conducted after the second infiltration campaign, was
related to the infiltration of October.
Table 4.1: Combinations of plant species richness and plant functional group richness levels and the
number of plots per diversity level for the earthworm subplots with 1, 4 and 16 plant species (n = 42, 84
subplots).
Plant species richness Plots
Plant functional
group richness
1 4 16
1 12 4 2 18
2 - 4 4 8
3 - 4 4 8
4 - 4 4 8
Plots 12 16 14 42

Chapter 4
46
A hood with a diameter of 16 cm was placed with the open side on the undisturbed soil
surface. The contact between the soil and hood was sealed with wet sand. We conducted
measurements at increasingly negative matric potentials (ΨM) beginning with ψM = 0 m and
reducing it stepwise by -0.02 m until the bubble point of the soil was reached. The bubble point
refers to the matric potentials, upon which a pore channel allows for penetration of air into the
hood and therefore the maximum applicable matric potential at this location. For a specific
matric potential (ΨM) the equivalent diameter (de) of the largest soil pore conducting water can
be estimated after (Jarvis et al. 1987). At ΨM = 0 m the soil is saturated and the entire pore
spectrum is potentially active. At smaller matrix potential larger pores are no longer active and
infiltration capacity deceases. This allows evaluating infiltration capacity through different parts
of the pore spectrum. At ΨM = -0.02 m the largest active pores correspond to de = 1.5 mm, at ΨM
= -0.04 m to de = 0.75 mm and at ΨM = -0.06 m to de = 0.50 mm. At each pressure level we
recorded infiltration capacity until they were constant in time. This steady infiltration capacity
was used for further analysis. Infiltration capacity at a given matric potential are directly linked
to hydraulic conductivity (Wooding 1968). The flow conditions in natural soils, however, are far
from ideal with anisotropic behaviour, heterogeneous initial soil water contents and flow
dynamics that do not correspond to the Richards equation near soil saturation (Beven and
Germann 2013). Therefore, we refrained from deriving hydraulic conductivity from our
infiltration capacity, for example via Wooding´s formula (Wooding 1968). Instead, we worked
with the observed infiltration capacity, considering those as a surrogate for the rate of the soil to
conduct water at the applied matric potential.
4.3.3 Soil texture and moisture
Soil texture was determined from soil cores at 38 locations (average of 0-100 cm depth)
distributed throughout the experimental site before plot establishment (G. Büchel, pers. comm.)
and values for each plot were interpolated by ordinary kriging. The fraction of sand and silt are
negatively correlated (clay showing no spatial trend). Thus, in the following statistical analysis
for simplicity we used the sand fraction as factor representing soil texture.
The volumetric soil water content (m3 m
-3) was determined with a FDR probe (ML2x
Theta Probe, Delta-T Devices, Cambridge, United Kingdom). The device was inserted from the
top 6 cm deep (length of the prongs) into the soil surrounding the hood before the infiltration
experiment. The average of three measurements was used for further analysis.
4.3.4 Statistical analyses
Statistical analyses were performed using the statistical software R 2.6.2 (R Development Core
Team, http.//www.R-project.org). The data were checked for heteroscedasticity and log-

Chapter 4
47
transformed if required. Analyses were performed with mixed effect models using the lme
function implemented in the nmle package (Pinheiro and Bates 2000). Starting from a constant
null model with random effects only, we stepwise added the fixed effects and estimated their
significance using the maximum likelihood method and likelihood ratio tests. To remove spatial
variability in all analysis we fitted block first and then tested the effects of plant community.
First, we analysed the variation of the infiltration capacity for each month separately by using
plot identity as a random factor and a sequence of the following fixed effects according to the
experimental design: block (as a factor, BL; 1, 2, 3, 4), plant species richness (log-linear term;
SR; 1, 4, 16), plant functional group richness (linear-term; FG; 1, 2, 3, 4), ambient and reduced
density (E; 0, 1) and their interactions (E x SR, E x FG). The design also allowed testing for the
effects of the presence (or absence) of certain plant functional groups on the response variable.
In alternative models the presence of grasses (GR; 0, 1), legumes (LEG; 0, 1), small herbs (SH;
0, 1) and tall herbs (TH; 0, 1) and their interactions with the previously mentioned factors were
tested. Second, we analysed the variation of the infiltration capacity between sampling dates
with plot identity as random factor and the fixed effects BL, SR, FG, E and time (as factor; TI;
June, September and October) and two-way interactions between the earthworm treatments,
plant diversity and time (E x SR, E x FG, TI x SR, TI x FG, TI x E). Most plots had a bubble
point at ΨM < -0.06 m. Therefore, for data analysis of individual months, we only considered
infiltration capacity for ΨM up to -0.04 m. For the integral dataset (all plots, all months) the
experimental factors were tested up to the ΨM = -0.06 m. We used simple linear regressions to
analyse the influence of texture (sand fraction in 0-10 cm depth), and soil water content before
the measurement on the infiltration capacity.
Based on the mixed effect model approach revealing a strong grass and legumes effect
on infiltration in October, we used path analysis to investigate how the total earthworm biomass
extracted from the earthworm reduction subplot in September, texture and the presence/absence
of legumes and grasses directly and indirectly affected the infiltration capacity on plots with
reduced earthworm (-ew) and ambient densities (+ew) in October. The impact on nfiltration
capacity in reduced and ambient plots was calculated in separate analysis. Path analysis allows
testing direct and indirect relationships between variables in a multivariate approach (Grace
2006). Hence, by using path analysis we were able to test if certain plant functional groups such
as legumes and grasses directly influence infiltration capacity on +ew and –ew plots or if
infiltration is indirectly influenced by earthworm biomass. In the path analysis arrow represent
causal relationships, while rectangles represent manipulated (grasses and legumes) or measured
variables (sand, earthworm biomass and infiltration capacity). The adequacy of the model was
determined via Chi²-tests, AIC and RMSEA. Non-signifcant Chi²-test (p>0.05), low AIC and
low RMSEA indicating an adequate model fit (Grace 2006). Beginning with the full model
(including all possible pathways) the models were improved by stepwise removing of
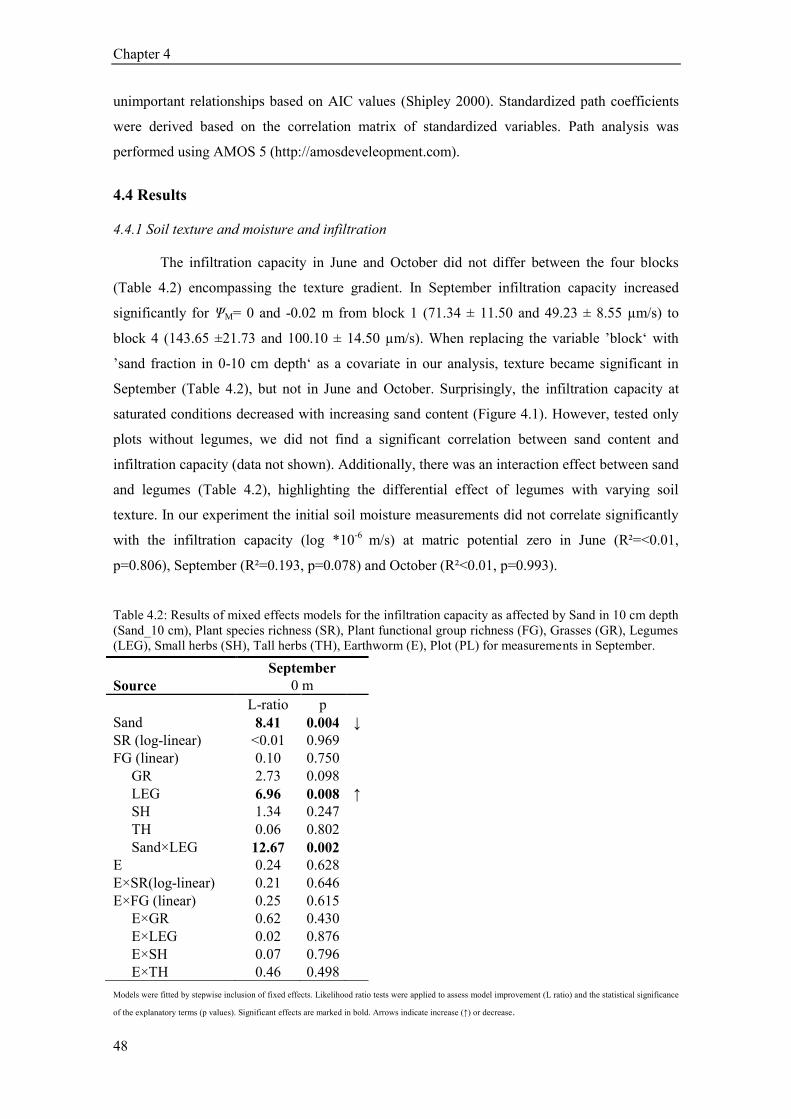
Chapter 4
48
unimportant relationships based on AIC values (Shipley 2000). Standardized path coefficients
were derived based on the correlation matrix of standardized variables. Path analysis was
performed using AMOS 5 (http://amosdeveleopment.com).
4.4 Results
4.4.1 Soil texture and moisture and infiltration
The infiltration capacity in June and October did not differ between the four blocks
(Table 4.2) encompassing the texture gradient. In September infiltration capacity increased
significantly for ΨM= 0 and -0.02 m from block 1 (71.34 ± 11.50 and 49.23 ± 8.55 µm/s) to
block 4 (143.65 ±21.73 and 100.10 ± 14.50 µm/s). When replacing the variable ’block‘ with
’sand fraction in 0-10 cm depth‘ as a covariate in our analysis, texture became significant in
September (Table 4.2), but not in June and October. Surprisingly, the infiltration capacity at
saturated conditions decreased with increasing sand content (Figure 4.1). However, tested only
plots without legumes, we did not find a significant correlation between sand content and
infiltration capacity (data not shown). Additionally, there was an interaction effect between sand
and legumes (Table 4.2), highlighting the differential effect of legumes with varying soil
texture. In our experiment the initial soil moisture measurements did not correlate significantly
with the infiltration capacity (log *10-6
m/s) at matric potential zero in June (R²=<0.01,
p=0.806), September (R²=0.193, p=0.078) and October (R²<0.01, p=0.993).
Table 4.2: Results of mixed effects models for the infiltration capacity as affected by Sand in 10 cm depth
(Sand_10 cm), Plant species richness (SR), Plant functional group richness (FG), Grasses (GR), Legumes
(LEG), Small herbs (SH), Tall herbs (TH), Earthworm (E), Plot (PL) for measurements in September.
Models were fitted by stepwise inclusion of fixed effects. Likelihood ratio tests were applied to assess model improvement (L ratio) and the statistical significance
of the explanatory terms (p values). Significant effects are marked in bold. Arrows indicate increase (↑) or decrease.
September
Source 0 m
L-ratio p
Sand 8.41 0.004 ↓
SR (log-linear) <0.01 0.969
FG (linear) 0.10 0.750
GR 2.73 0.098
LEG 6.96 0.008 ↑
SH 1.34 0.247
TH 0.06 0.802
Sand×LEG 12.67 0.002
E 0.24 0.628
E×SR(log-linear) 0.21 0.646
E×FG (linear) 0.25 0.615
E×GR 0.62 0.430
E×LEG 0.02 0.876
E×SH 0.07 0.796
E×TH 0.46 0.498
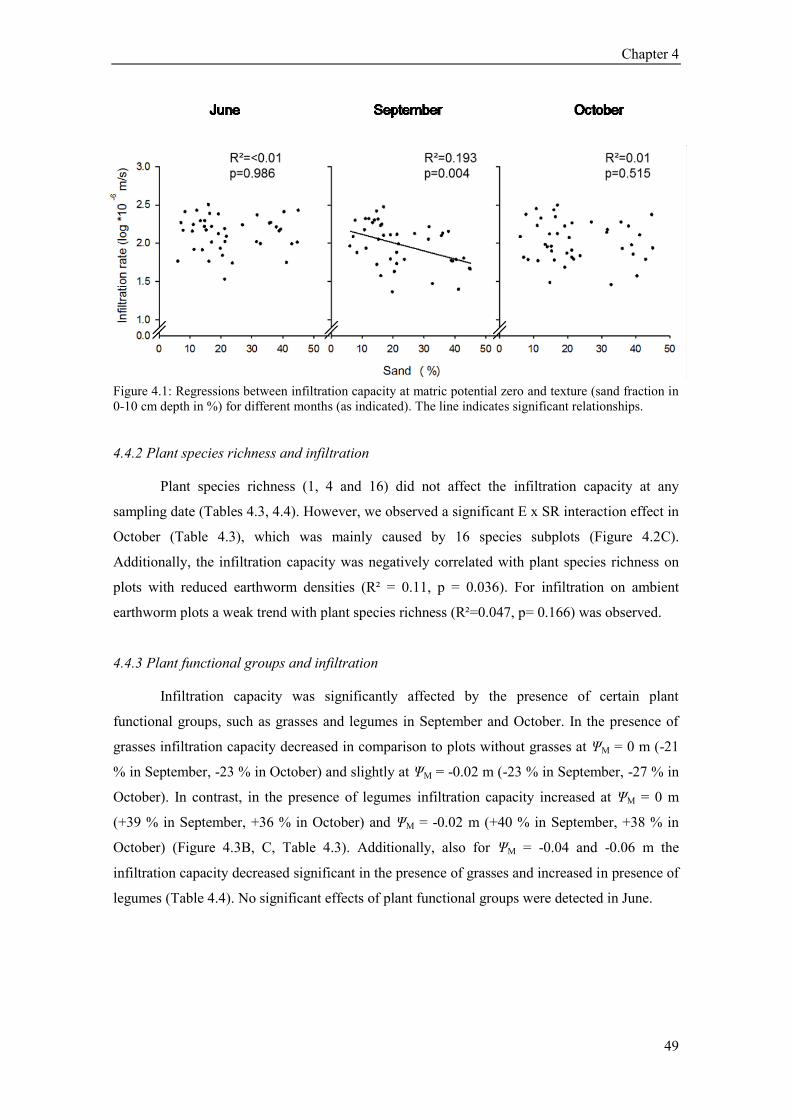
Chapter 4
49
Figure 4.1: Regressions between infiltration capacity at matric potential zero and texture (sand fraction in
0-10 cm depth in %) for different months (as indicated). The line indicates significant relationships.
4.4.2 Plant species richness and infiltration
Plant species richness (1, 4 and 16) did not affect the infiltration capacity at any
sampling date (Tables 4.3, 4.4). However, we observed a significant E x SR interaction effect in
October (Table 4.3), which was mainly caused by 16 species subplots (Figure 4.2C).
Additionally, the infiltration capacity was negatively correlated with plant species richness on
plots with reduced earthworm densities (R² = 0.11, p = 0.036). For infiltration on ambient
earthworm plots a weak trend with plant species richness (R²=0.047, p= 0.166) was observed.
4.4.3 Plant functional groups and infiltration
Infiltration capacity was significantly affected by the presence of certain plant
functional groups, such as grasses and legumes in September and October. In the presence of
grasses infiltration capacity decreased in comparison to plots without grasses at ΨM = 0 m (-21
% in September, -23 % in October) and slightly at ΨM = -0.02 m (-23 % in September, -27 % in
October). In contrast, in the presence of legumes infiltration capacity increased at ΨM = 0 m
(+39 % in September, +36 % in October) and ΨM = -0.02 m (+40 % in September, +38 % in
October) (Figure 4.3B, C, Table 4.3). Additionally, also for ΨM = -0.04 and -0.06 m the
infiltration capacity decreased significant in the presence of grasses and increased in presence of
legumes (Table 4.4). No significant effects of plant functional groups were detected in June.

Chapter 4
50
Models were fitted by stepwise inclusion of fixed effects. Likelihood ratio tests were applied to assess model improvement (L-ratio) and the statistical significance of the explanatory terms
(p values). Significant effects are marked in bold. Arrows indicate increase (↑) or decrease (↓).
Table 4.3: Results of mixed effects models for the infiltration capacity as affected by Block (BL), Plant species richness (SR), Plant functional group
richness (FG), Grasses (GR), Legumes (LEG), Small herbs (SH), Tall herbs (TH), Earthworms (E), Plot (PL) for measurements in June, September and
October separately for the matric potentials ψM = 0 m and ψM = -0.02 m.
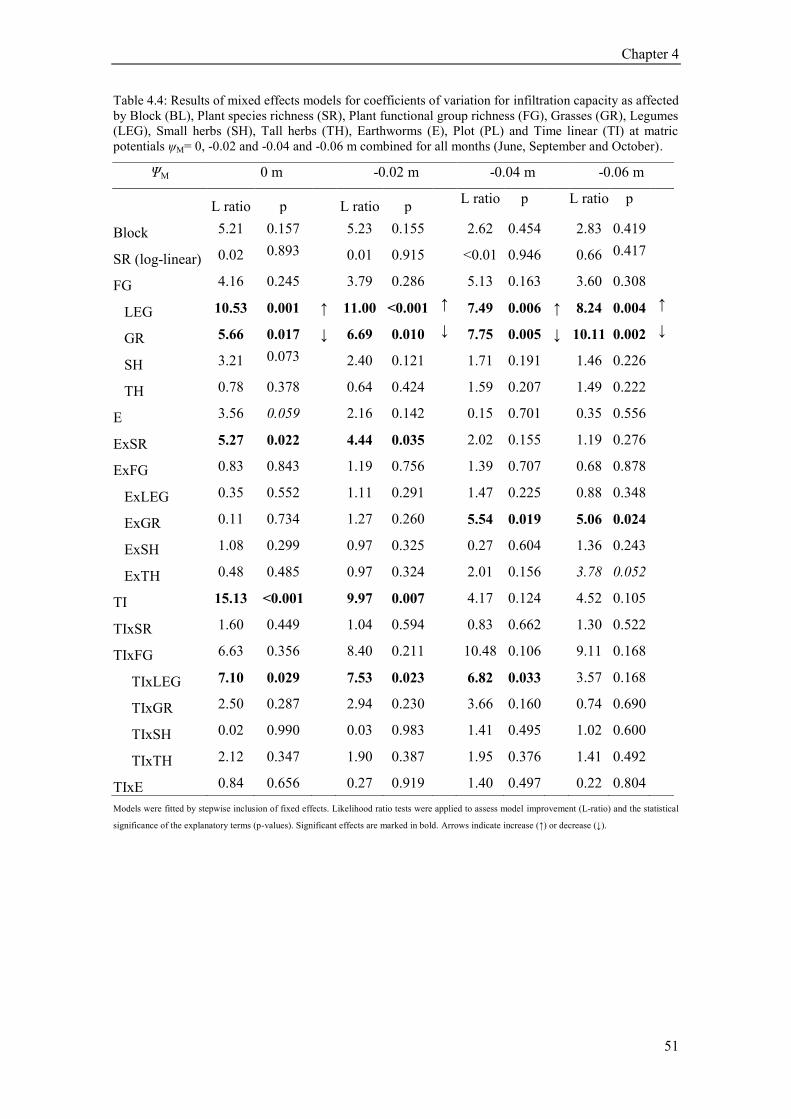
Chapter 4
51
Table 4.4: Results of mixed effects models for coefficients of variation for infiltration capacity as affected
by Block (BL), Plant species richness (SR), Plant functional group richness (FG), Grasses (GR), Legumes
(LEG), Small herbs (SH), Tall herbs (TH), Earthworms (E), Plot (PL) and Time linear (TI) at matric
potentials ψM= 0, -0.02 and -0.04 and -0.06 m combined for all months (June, September and October).
Models were fitted by stepwise inclusion of fixed effects. Likelihood ratio tests were applied to assess model improvement (L-ratio) and the statistical
significance of the explanatory terms (p-values). Significant effects are marked in bold. Arrows indicate increase (↑) or decrease (↓).
ΨM 0 m -0.02 m -0.04 m -0.06 m
L ratio p
L ratio p L ratio p L ratio p
Block 5.21 0.157 5.23 0.155 2.62 0.454 2.83 0.419
SR (log-linear) 0.02 0.893
0.01 0.915 <0.01 0.946 0.66 0.417
FG 4.16 0.245 3.79 0.286 5.13 0.163 3.60 0.308
LEG 10.53 0.001 ↑ 11.00 <0.001 ↑ 7.49 0.006 ↑ 8.24 0.004 ↑
GR 5.66 0.017 ↓ 6.69 0.010 ↓ 7.75 0.005 ↓ 10.11 0.002 ↓
SH 3.21 0.073
2.40 0.121 1.71 0.191 1.46 0.226
TH 0.78 0.378 0.64 0.424 1.59 0.207 1.49 0.222
E 3.56 0.059 2.16 0.142 0.15 0.701 0.35 0.556
ExSR 5.27 0.022 4.44 0.035 2.02 0.155 1.19 0.276
ExFG 0.83 0.843 1.19 0.756 1.39 0.707 0.68 0.878
ExLEG 0.35 0.552 1.11 0.291 1.47 0.225 0.88 0.348
ExGR 0.11 0.734 1.27 0.260 5.54 0.019 5.06 0.024
ExSH 1.08 0.299 0.97 0.325 0.27 0.604 1.36 0.243
ExTH 0.48 0.485 0.97 0.324 2.01 0.156 3.78 0.052
TI 15.13 <0.001 9.97 0.007 4.17 0.124 4.52 0.105
TIxSR 1.60 0.449 1.04 0.594 0.83 0.662 1.30 0.522
TIxFG 6.63 0.356 8.40 0.211 10.48 0.106 9.11 0.168
TIxLEG 7.10 0.029 7.53 0.023 6.82 0.033 3.57 0.168
TIxGR 2.50 0.287 2.94 0.230 3.66 0.160 0.74 0.690
TIxSH 0.02 0.990 0.03 0.983 1.41 0.495 1.02 0.600
TIxTH 2.12 0.347 1.90 0.387 1.95 0.376 1.41 0.492
TIxE 0.84 0.656 0.27 0.919 1.40 0.497 0.22 0.804

Chapter 4
52
Figure 4.2: Variation in infiltration capacity at matric potential zero as affected by plant species richness
(1, 4, 16 species) in earthworm subplots (ambient earthworm density) and earthworm reduction subplots
(reduced earthworm density) in (A) June, (B) September, (C) October, and (D) in total for all plant
species and sampling dates (right panel). Means with standard errors.
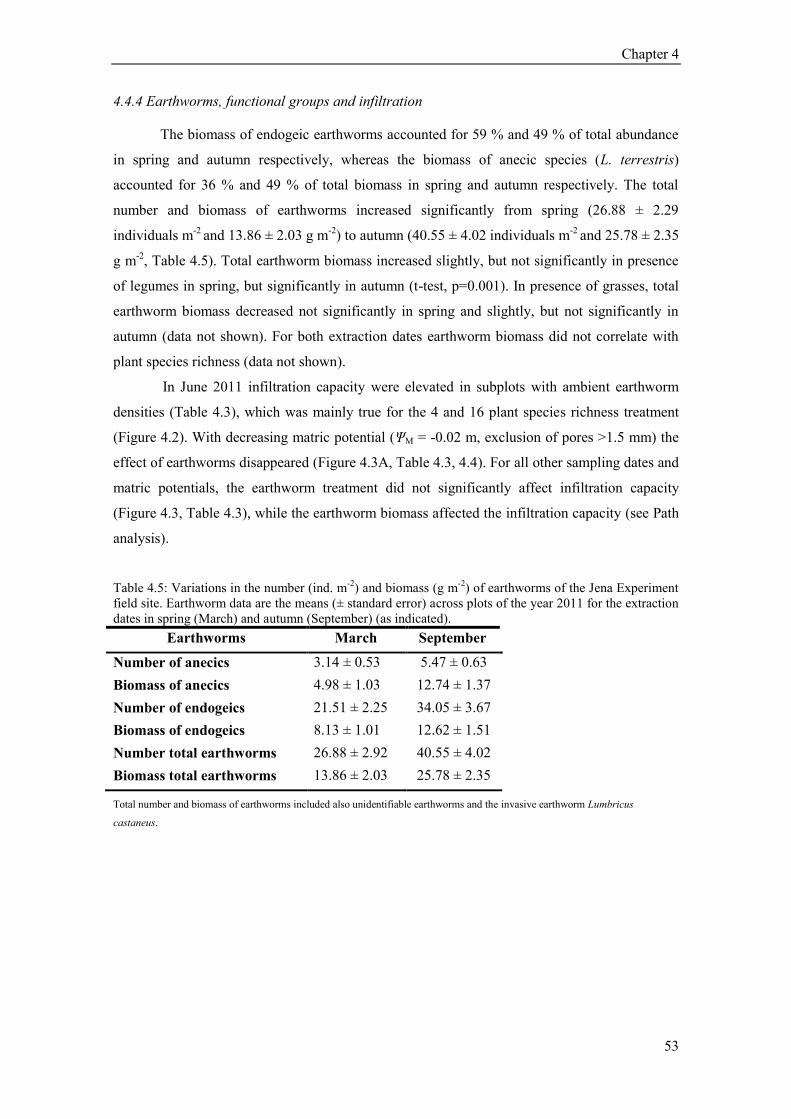
Chapter 4
53
4.4.4 Earthworms, functional groups and infiltration
The biomass of endogeic earthworms accounted for 59 % and 49 % of total abundance
in spring and autumn respectively, whereas the biomass of anecic species (L. terrestris)
accounted for 36 % and 49 % of total biomass in spring and autumn respectively. The total
number and biomass of earthworms increased significantly from spring (26.88 ± 2.29
individuals m-2
and 13.86 ± 2.03 g m-2
) to autumn (40.55 ± 4.02 individuals m-2
and 25.78 ± 2.35
g m-2
, Table 4.5). Total earthworm biomass increased slightly, but not significantly in presence
of legumes in spring, but significantly in autumn (t-test, p=0.001). In presence of grasses, total
earthworm biomass decreased not significantly in spring and slightly, but not significantly in
autumn (data not shown). For both extraction dates earthworm biomass did not correlate with
plant species richness (data not shown).
In June 2011 infiltration capacity were elevated in subplots with ambient earthworm
densities (Table 4.3), which was mainly true for the 4 and 16 plant species richness treatment
(Figure 4.2). With decreasing matric potential (ΨM = -0.02 m, exclusion of pores >1.5 mm) the
effect of earthworms disappeared (Figure 4.3A, Table 4.3, 4.4). For all other sampling dates and
matric potentials, the earthworm treatment did not significantly affect infiltration capacity
(Figure 4.3, Table 4.3), while the earthworm biomass affected the infiltration capacity (see Path
analysis).
Table 4.5: Variations in the number (ind. m-2
) and biomass (g m-2
) of earthworms of the Jena Experiment
field site. Earthworm data are the means (± standard error) across plots of the year 2011 for the extraction
dates in spring (March) and autumn (September) (as indicated).
Earthworms March September
Number of anecics 3.14 ± 0.53 5.47 ± 0.63
Biomass of anecics 4.98 ± 1.03 12.74 ± 1.37
Number of endogeics 21.51 ± 2.25 34.05 ± 3.67
Biomass of endogeics 8.13 ± 1.01 12.62 ± 1.51
Number total earthworms 26.88 ± 2.92 40.55 ± 4.02
Biomass total earthworms 13.86 ± 2.03 25.78 ± 2.35
Total number and biomass of earthworms included also unidentifiable earthworms and the invasive earthworm Lumbricus
castaneus.

Chapter 4
54
Figure 4.3: Variation in infiltration capacity in June, September and October as affected by (A)
earthworms (ambient and reduced earthworm density), (B) presence of grasses, and (C) presence of
legumes for applied matric potential ΨM = 0 m (left panel) and tension ΨM = -0.02 m (right panel). Means
with standard errors.

Chapter 4
55
4.4.5 Seasonal variability of infiltration
In 2011 time significantly affected the infiltration capacity at saturated matric potential
ΨM = 0 m and ΨM = -0.02 m (Table 4.3). The average infiltration capacity decreased from June
to September (-24 and -22 % for ΨM = 0 m and ψM = -0.02 m) and increased slightly from
September to October (+8 and: +14 % for ΨM = 0 m and ΨM = -0.02 m, respectively). In
particular, the effect of legumes depended strongly on time. The interaction between legumes
and time on infiltration capacity was significant for matric potentials ΨM = 0 m, -0.02 m, and -
0.04 m but not for -0.06 m (Table 4.3, 4.4). At lower matric potentials, infiltration capacity did
not change between months (Table 4.3, Figure 4.4) suggesting that seasonal processes act
mainly on large pores.
Figure 4.4: Variation in infiltration capacity separated for the different months (June, filled circles;
September, open circles; and October, grey triangle) for the matric potential ψM = 0, -0.02, -0.04 and -
0.06 m.
4.4.6 Path analysis
The path analysis supports the results of the mixed linear model approaches, but, in
addition, helps to identify possible mechanisms. The initial model for October (AIC = 49.10,
Figure 4.5) was improved as described in the method section. In October the improved model
explained 13% of the infiltration capacity on plots with ambient earthworm density (Figure
4.6A; χ² = 1.80, p = 0.937, AIC = 29.80) and 29% of the infiltration capacity on subplots with
reduced earthworm density (Figure 4.7B; χ² = 1.10 p = 0.954, AIC = 31.10). The total
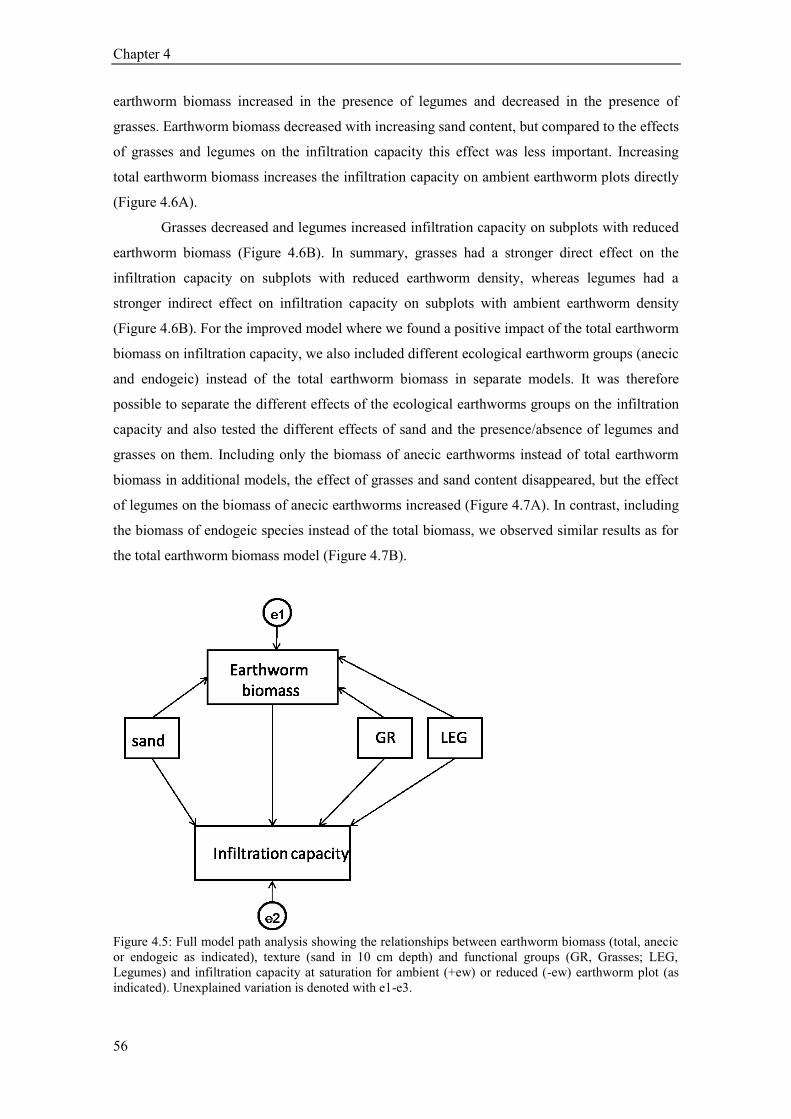
Chapter 4
56
earthworm biomass increased in the presence of legumes and decreased in the presence of
grasses. Earthworm biomass decreased with increasing sand content, but compared to the effects
of grasses and legumes on the infiltration capacity this effect was less important. Increasing
total earthworm biomass increases the infiltration capacity on ambient earthworm plots directly
(Figure 4.6A).
Grasses decreased and legumes increased infiltration capacity on subplots with reduced
earthworm biomass (Figure 4.6B). In summary, grasses had a stronger direct effect on the
infiltration capacity on subplots with reduced earthworm density, whereas legumes had a
stronger indirect effect on infiltration capacity on subplots with ambient earthworm density
(Figure 4.6B). For the improved model where we found a positive impact of the total earthworm
biomass on infiltration capacity, we also included different ecological earthworm groups (anecic
and endogeic) instead of the total earthworm biomass in separate models. It was therefore
possible to separate the different effects of the ecological earthworms groups on the infiltration
capacity and also tested the different effects of sand and the presence/absence of legumes and
grasses on them. Including only the biomass of anecic earthworms instead of total earthworm
biomass in additional models, the effect of grasses and sand content disappeared, but the effect
of legumes on the biomass of anecic earthworms increased (Figure 4.7A). In contrast, including
the biomass of endogeic species instead of the total biomass, we observed similar results as for
the total earthworm biomass model (Figure 4.7B).
Figure 4.5: Full model path analysis showing the relationships between earthworm biomass (total, anecic
or endogeic as indicated), texture (sand in 10 cm depth) and functional groups (GR, Grasses; LEG,
Legumes) and infiltration capacity at saturation for ambient (+ew) or reduced (-ew) earthworm plot (as
indicated). Unexplained variation is denoted with e1-e3.
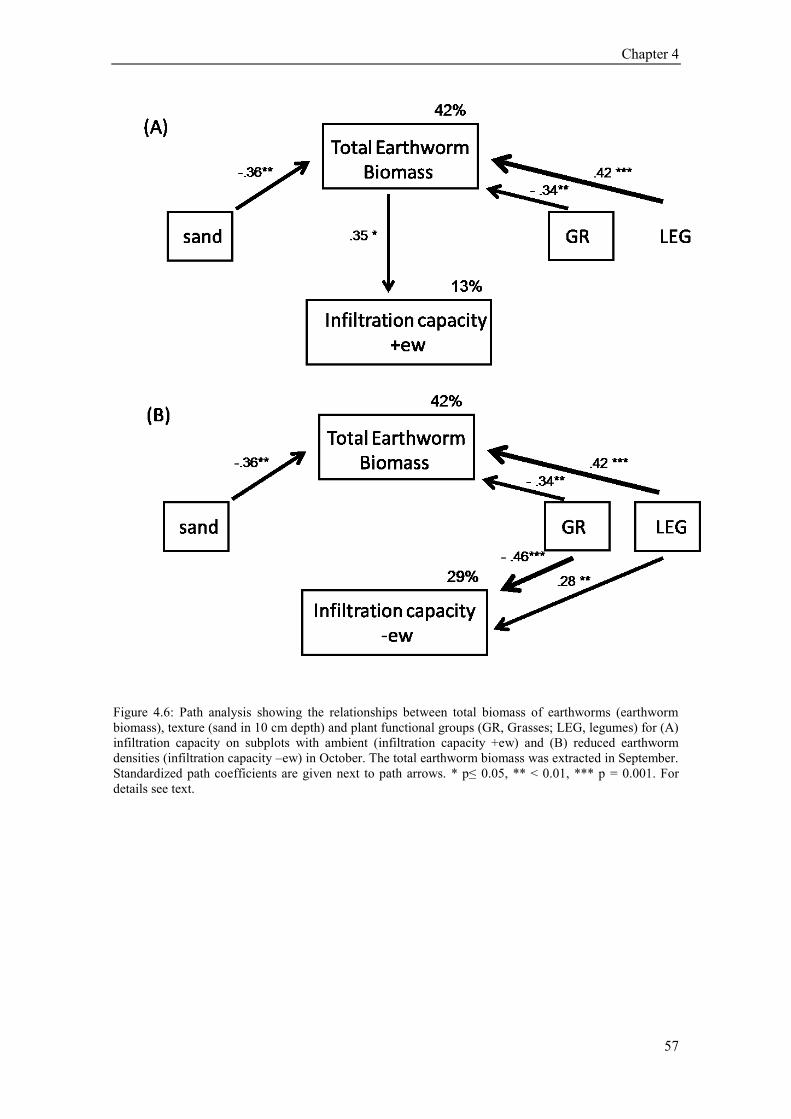
Chapter 4
57
Figure 4.6: Path analysis showing the relationships between total biomass of earthworms (earthworm
biomass), texture (sand in 10 cm depth) and plant functional groups (GR, Grasses; LEG, legumes) for (A)
infiltration capacity on subplots with ambient (infiltration capacity +ew) and (B) reduced earthworm
densities (infiltration capacity –ew) in October. The total earthworm biomass was extracted in September.
Standardized path coefficients are given next to path arrows. * p≤ 0.05, ** < 0.01, *** p = 0.001. For
details see text.
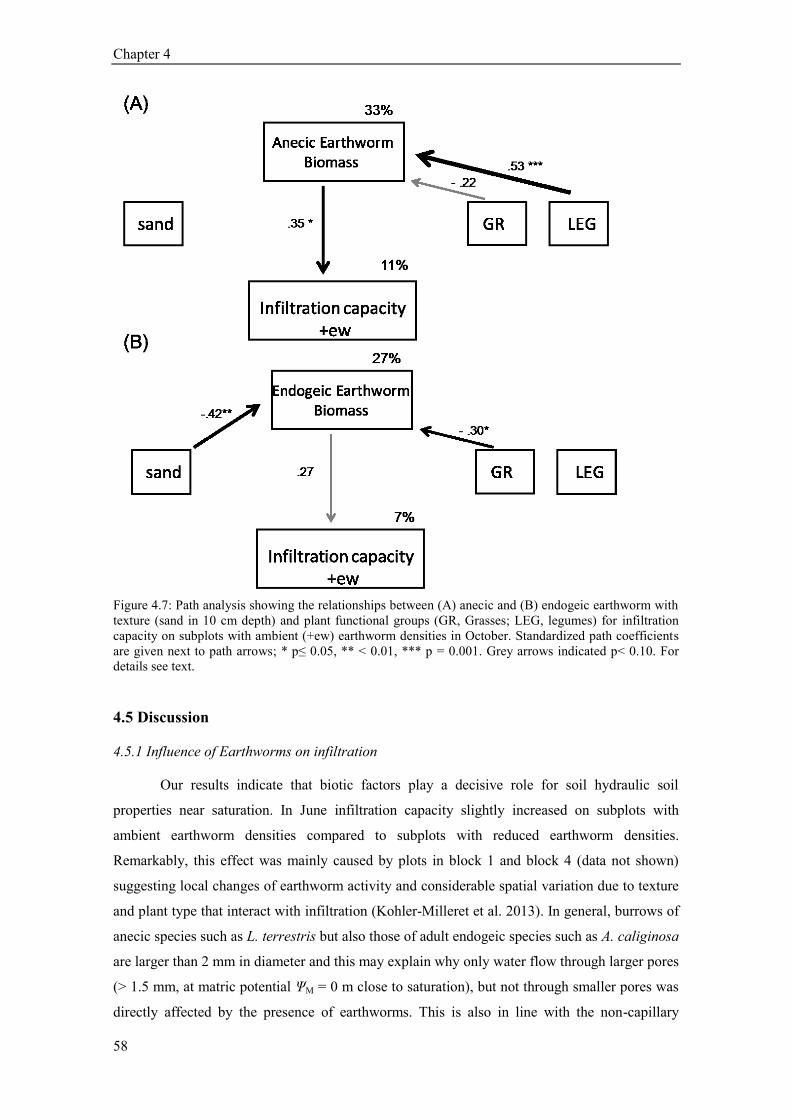
Chapter 4
58
Figure 4.7: Path analysis showing the relationships between (A) anecic and (B) endogeic earthworm with
texture (sand in 10 cm depth) and plant functional groups (GR, Grasses; LEG, legumes) for infiltration
capacity on subplots with ambient (+ew) earthworm densities in October. Standardized path coefficients
are given next to path arrows; * p≤ 0.05, ** < 0.01, *** p = 0.001. Grey arrows indicated p< 0.10. For
details see text.
4.5 Discussion
4.5.1 Influence of Earthworms on infiltration
Our results indicate that biotic factors play a decisive role for soil hydraulic soil
properties near saturation. In June infiltration capacity slightly increased on subplots with
ambient earthworm densities compared to subplots with reduced earthworm densities.
Remarkably, this effect was mainly caused by plots in block 1 and block 4 (data not shown)
suggesting local changes of earthworm activity and considerable spatial variation due to texture
and plant type that interact with infiltration (Kohler-Milleret et al. 2013). In general, burrows of
anecic species such as L. terrestris but also those of adult endogeic species such as A. caliginosa
are larger than 2 mm in diameter and this may explain why only water flow through larger pores
(> 1.5 mm, at matric potential ΨM = 0 m close to saturation), but not through smaller pores was
directly affected by the presence of earthworms. This is also in line with the non-capillary
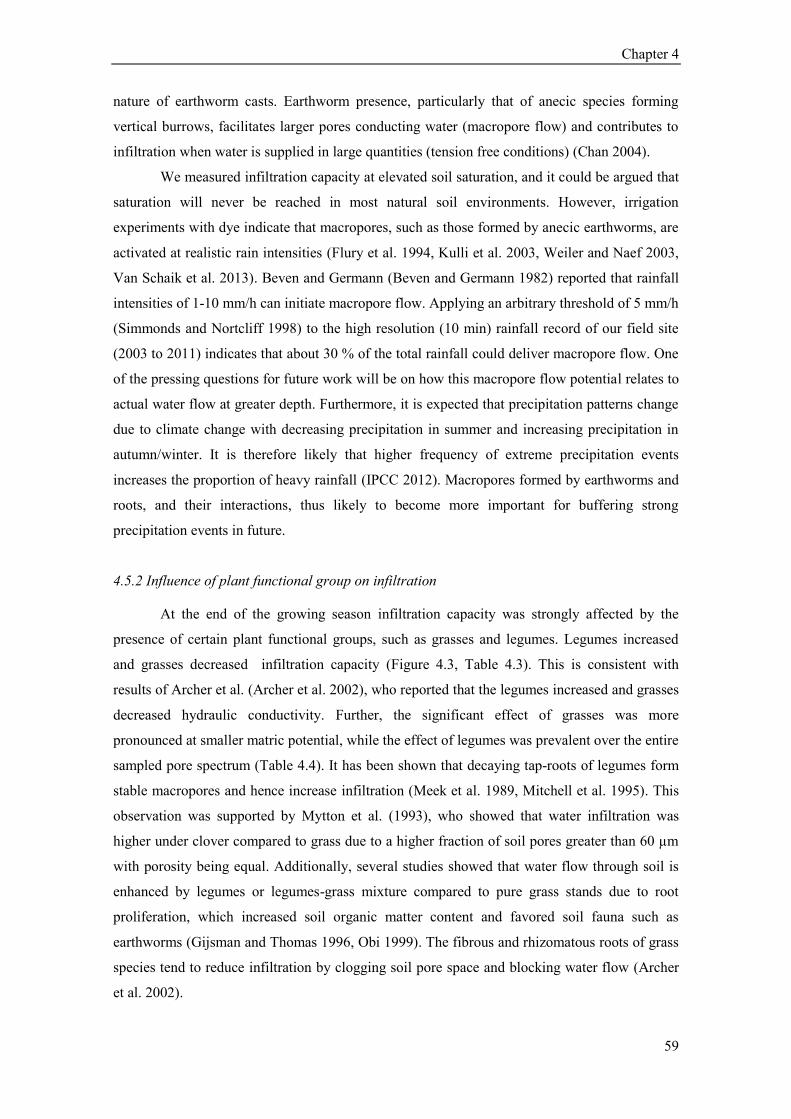
Chapter 4
59
nature of earthworm casts. Earthworm presence, particularly that of anecic species forming
vertical burrows, facilitates larger pores conducting water (macropore flow) and contributes to
infiltration when water is supplied in large quantities (tension free conditions) (Chan 2004).
We measured infiltration capacity at elevated soil saturation, and it could be argued that
saturation will never be reached in most natural soil environments. However, irrigation
experiments with dye indicate that macropores, such as those formed by anecic earthworms, are
activated at realistic rain intensities (Flury et al. 1994, Kulli et al. 2003, Weiler and Naef 2003,
Van Schaik et al. 2013). Beven and Germann (Beven and Germann 1982) reported that rainfall
intensities of 1-10 mm/h can initiate macropore flow. Applying an arbitrary threshold of 5 mm/h
(Simmonds and Nortcliff 1998) to the high resolution (10 min) rainfall record of our field site
(2003 to 2011) indicates that about 30 % of the total rainfall could deliver macropore flow. One
of the pressing questions for future work will be on how this macropore flow potential relates to
actual water flow at greater depth. Furthermore, it is expected that precipitation patterns change
due to climate change with decreasing precipitation in summer and increasing precipitation in
autumn/winter. It is therefore likely that higher frequency of extreme precipitation events
increases the proportion of heavy rainfall (IPCC 2012). Macropores formed by earthworms and
roots, and their interactions, thus likely to become more important for buffering strong
precipitation events in future.
4.5.2 Influence of plant functional group on infiltration
At the end of the growing season infiltration capacity was strongly affected by the
presence of certain plant functional groups, such as grasses and legumes. Legumes increased
and grasses decreased infiltration capacity (Figure 4.3, Table 4.3). This is consistent with
results of Archer et al. (Archer et al. 2002), who reported that the legumes increased and grasses
decreased hydraulic conductivity. Further, the significant effect of grasses was more
pronounced at smaller matric potential, while the effect of legumes was prevalent over the entire
sampled pore spectrum (Table 4.4). It has been shown that decaying tap-roots of legumes form
stable macropores and hence increase infiltration (Meek et al. 1989, Mitchell et al. 1995). This
observation was supported by Mytton et al. (1993), who showed that water infiltration was
higher under clover compared to grass due to a higher fraction of soil pores greater than 60 µm
with porosity being equal. Additionally, several studies showed that water flow through soil is
enhanced by legumes or legumes-grass mixture compared to pure grass stands due to root
proliferation, which increased soil organic matter content and favored soil fauna such as
earthworms (Gijsman and Thomas 1996, Obi 1999). The fibrous and rhizomatous roots of grass
species tend to reduce infiltration by clogging soil pore space and blocking water flow (Archer
et al. 2002).
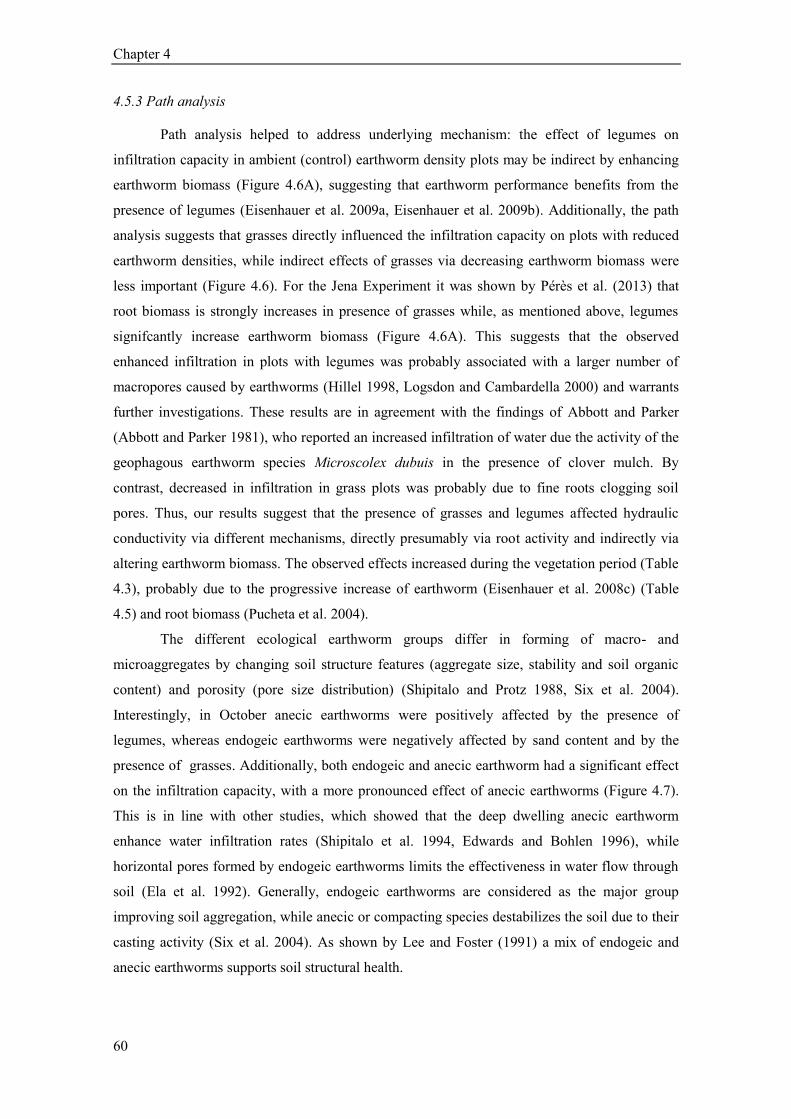
Chapter 4
60
4.5.3 Path analysis
Path analysis helped to address underlying mechanism: the effect of legumes on
infiltration capacity in ambient (control) earthworm density plots may be indirect by enhancing
earthworm biomass (Figure 4.6A), suggesting that earthworm performance benefits from the
presence of legumes (Eisenhauer et al. 2009a, Eisenhauer et al. 2009b). Additionally, the path
analysis suggests that grasses directly influenced the infiltration capacity on plots with reduced
earthworm densities, while indirect effects of grasses via decreasing earthworm biomass were
less important (Figure 4.6). For the Jena Experiment it was shown by Pérès et al. (2013) that
root biomass is strongly increases in presence of grasses while, as mentioned above, legumes
signifcantly increase earthworm biomass (Figure 4.6A). This suggests that the observed
enhanced infiltration in plots with legumes was probably associated with a larger number of
macropores caused by earthworms (Hillel 1998, Logsdon and Cambardella 2000) and warrants
further investigations. These results are in agreement with the findings of Abbott and Parker
(Abbott and Parker 1981), who reported an increased infiltration of water due the activity of the
geophagous earthworm species Microscolex dubuis in the presence of clover mulch. By
contrast, decreased in infiltration in grass plots was probably due to fine roots clogging soil
pores. Thus, our results suggest that the presence of grasses and legumes affected hydraulic
conductivity via different mechanisms, directly presumably via root activity and indirectly via
altering earthworm biomass. The observed effects increased during the vegetation period (Table
4.3), probably due to the progressive increase of earthworm (Eisenhauer et al. 2008c) (Table
4.5) and root biomass (Pucheta et al. 2004).
The different ecological earthworm groups differ in forming of macro- and
microaggregates by changing soil structure features (aggregate size, stability and soil organic
content) and porosity (pore size distribution) (Shipitalo and Protz 1988, Six et al. 2004).
Interestingly, in October anecic earthworms were positively affected by the presence of
legumes, whereas endogeic earthworms were negatively affected by sand content and by the
presence of grasses. Additionally, both endogeic and anecic earthworm had a significant effect
on the infiltration capacity, with a more pronounced effect of anecic earthworms (Figure 4.7).
This is in line with other studies, which showed that the deep dwelling anecic earthworm
enhance water infiltration rates (Shipitalo et al. 1994, Edwards and Bohlen 1996), while
horizontal pores formed by endogeic earthworms limits the effectiveness in water flow through
soil (Ela et al. 1992). Generally, endogeic earthworms are considered as the major group
improving soil aggregation, while anecic or compacting species destabilizes the soil due to their
casting activity (Six et al. 2004). As shown by Lee and Foster (1991) a mix of endogeic and
anecic earthworms supports soil structural health.

Chapter 4
61
In part our results are in contrast to other studies (Stockdill 1966, Zachmann et al. 1987,
Wuest 2001), which found a direct impact of earthworm treatment on infiltration. Studies on the
influence of earthworms on infiltration capacity usually ignore gradients of texture and plant
functional groups. This gradient increased the variance in our data and affected the earthworm
populations in the plots. However, our observation area was also rather small (240 cm2) and the
setup prevented from conducting additional measurements. Also, we compared plots with
ambient to plots with reduced earthworm density contrasting earlier studies which compared
ambient (by earthworm addition) with control plots (no earthworms) (Zachmann and Linden
1989, Joschko et al. 1992). While our setup has the advantage to better reflect ’natural‘
conditions, it may have caused a comparatively smaller contrast between treatments. Since the
used octet extraction method cannot remove earthworms completely (extraction reduced the
surface activity of earthworms by about 38 % five weeks after the last manipulation (Eisenhauer
et al. 2008b)), the differences between the treatments might not have been as strong as in other
experiments, and re-colonization of earthworm reduction subplots may have weakened the
contrast further. Unfortunately we cannot exclude completely that extraction efficiency varies
dependent on plant community properties, because there exists no detailed studies that evaluated
the extraction efficiency of the octet method as a function of plant community structure. Effects
of earthworms on plant performance and the resulting impact on soil hydraulic properties
depend also on other soil factors, such as soil texture and bulk density, leading to substantial
spatial variation and interaction which probably masked earthworm effects. More observations
on the pore structure in the different treatments are necessary to validate the proposed complex
interactions in soil processes leading to the observed infiltration patterns. In general, we could
relate earthworms to infiltration based on earthworm biomass, while the effect of the earthworm
treatment was not very strong.
4.5.4 Influence of plant species richness on infiltration capacity
In contrast to the pronounced effects of certain plant functional groups, such as legumes
and grasses, plant diversity measures (plant species and functional group richness) had only
small effects on the infiltration capacity and earthworm performance. In October, we found that
plant diversity had only a marginally significant effect on the infiltration capacity on subplots
with ambient earthworm density, but plant species diversity affected infiltration capacity
significantly on subplots with reduced earthworm density, presumably due to plant roots
clogging macropores (Barley 1954, Gish and Jury 1983). This is supported by data on the
relationship between plant diversity and standing root mass in the Jena Experiment, showing
that root biomass also increased with diversity level (Bessler et al. 2009, Ravenek et al., in
prep.). Additionally, infiltration capacity decreased over the year presumably by the growing
Chapter 4
62
roots clogging macropores, which is in accordance with observations by Gish and Jury (Gish
and Jury 1983). Additionally, Angulo-Jaramillo et al. (2000) observed a decrease of hydraulic
conductivity caused by sealing of interconnected pores at the soil surface. However, on subplots
with ambient earthworm densities this clogging may have been counteracted by the activity of
earthworms. These results suggest that water flow through soil is more strongly affected by
earthworm biomass which is regulated by the presence of certain functional groups then by loss
of single plant species along the observed gradient.
4.5.5 Influence of soil texture and soil moisture on infiltration
Grain size distribution strongly influences hydraulic properties of porous media, and
therefore texture has often been related to hydraulic conductivity (Rawls et al. 1982, Saxton et
al. 1986). However, in our experiment saturated and near-saturated infiltration capacity in June
and October were not affected by soil texture (Figure 4.1). Surprisingly, in September
infiltration capacity varied with soil texture, but unexpectedly it was lowest in coarse textured
soils. However, the results are in agreement with Jarvis and Messing (1995) and Lin et al.
(1999), who found higher hydraulic conductivity in finer as compared to coarser textured soils
due to well-developed soil structure (earthworm burrows, root channels) and a high degree of
macroporosity. As detailed above, legumes increased infiltration capacity, and interestingly the
negative correlation between sand and infiltration capacity disappeared when removing plots
containing legumes. This is probably a result of the positive relationship between legumes and
earthworms and resulting effects on infiltration. An alternative explanation for increased
infiltration in presence of legumes could be that especially finer textured soils roots affect the
formation of aggregates and structure (Angers and Caron 1998, Six et al. 2004). Kördel et al.
(2008) suggested that the formed macropores are less stable over time in sandy soil. However,
investigations on soil stability in the Jena Experiment itself (Pérès et al. 2013) suggest the
opposite effect, with legumes decreasing soil aggregate stability (indirectly, by increasing
earthworm biomass and decreasing plant root biomass). At the same time, we found a lower
number of earthworms in more sandy soils in 2011 (data not shown). This is in line with
previous studies (Paoletti 1999, Bens et al. 2007) showing that sandy soils support smaller
earthworm populations than clayey soils resulting to lower hydraulic conductivity in sandy
soils. Thus, our results may be a result of both legumes and finer soil texture promoting
earthworm abundance, but dedicated research is necessary to support these findings. Our results
underline the importance of soil structure as influenced by biotic processes. This also
corroborates the findings of Bonsu (1992) who suggested that the texture based calculation
underestimates the hydraulic conductivity, in particular in fine textured soils.
Chapter 4
63
One important source of error that can dominate or suppress other factors is the initial
soil moisture content. Several studies have shown that the infiltration through soil is correlated
with the initial soil moisture content (Slater 1957, Azooz and Arshad 1996). This relation was
not expected in our setup, since the soil moisture is controlled by fixing the infiltration pressure
head. At the beginning of an infiltration experiment low initial soil moisture content enhanced
the water flow through the soil because of larger gradients in matric potential and filling up of
the soil storage. The influence of initial moisture content decreased during the experiment, when
the pores are filled and infiltration reaches a steady state (Blackburn 1975). A potential error
source is finishing the experiment before steady infiltration capacity is reached in dry soils and
hence overestimating infiltration capacity. Thus, we checked whether infiltration capacity was
biased by initial soil moisture and this was not the case. Thus our infiltration measurements
were performed correctly. Another factor potentially affecting infiltration capacity is soil
hydrophobicity. Hydrophobic exudates are produced by plant roots and soil microbes. Soto et al.
(1994) observed that the soil showed a tendency to be water repellent if the volumetric water
content fell below θc = 22 % for medium textured soils, the so called ’critical soil water content‘
(Dekker and Ritsema 1994). The majority of the measured volumetric water contents exceeded
this threshold (data not shown). Since most of our observed effects enhanced during the
growing season, while the chance for hydrophobicity decreased, we conclude that water
repellency did not affect our results.
4.6 Conclusions
Despite large spatial variability of soil hydraulic properties, biotic factors emerged as
significant agents for infiltration. The presence of legumes increased and the presence of grasses
decreased infiltration capacity with the effects increasing over the course of the growing season.
The path analysis suggests that modifications in hydraulic conductivity are probably due to (i)
roots directly, modifying the pore spectrum and (ii) indirectly, suppressing or enhancing
earthworm activity. The results suggest that earthworm biomass is synchronized with other soil
processes such as plant root growth, such that the observed effects of plant functional groups
include earthworm and root activity.
Most predictions of near surface soil hydraulic properties are based on easily accessible
soil properties such as soil texture. Our results suggest that biotic effects, especially the presence
of certain plant functional groups affecting earthworm biomass, shape hydraulic conductivity
and may even reverse effects of texture. Therefore, for explaining variations in hydrological
processes, such as infiltration capacity, the structure of soil fauna and plant communities need to
be considered.

Chapter
5
Soil and plant community characteristics governing soil hydraulic
properties in a grassland plant diversity experiment

Chapter 5
67
5 Soil and plant community characteristics governing soil hydraulic properties in a
grassland plant diversity experiment
5.1. Abstract
Soil hydraulic properties such as infiltration capacity play an important role for soil
erosion, run-off and water availability to plants for the prediction and management of ecosystem
patterns. There have been only a few studies about the mechanisms and characteristics of how
plant diversity might influences vertical soil water fluxes by modifying soil infiltration capacity.
In this study we quantify the change in infiltration capacity affected by soil structural variables
(bulk density, porosity and soil organic carbon content) in a grassland plant diversity experiment
(Jena Experiment). We conducted two infiltration measurement campaigns (in May and October
2012) along a plant species richness gradient from 1 to 60. Although the spatial variation of the
infiltration capacity and the interactions among soil- and vegetation characteristics are very
complex, our research showed that plant diversity systematically increased infiltration capacity
in the studied grassland. Soil structure variables played a major role in mediating this relation.
Texture (percent of sand) did not correlate with the infiltration capacity at any time. In May
earthworm biomass marginally affected water infiltration but did not influence soil structural
parameters. In the present study plant species richness, bulk density (or inversely porosity) and
soil organic carbon are important parameters for studying changes of water flow through soil.
Our observations identified important ecological drivers of infiltration capacity, suggesting
complex interactions between plant species richness, earthworms and soil structural variables,
while showing little impact of soil texture.
5.2 Introduction
Studies linking plant diversity and water fluxes have so far focused on the role of water
as a resource. Besides providing a resource for plants and soil organisms, soil water also acts as
a transport agent for dissolved matter and as a medium for microbial activity. Understanding
how diversity influences soil water fluxes and resulting soil moisture distribution is an
important step for understanding other biological processes. To determine strategies for soil and
water conservation and to minimize surface run-off and soil erosion, especially in agriculture
when predicting and managing ecosystem patterns, it is important to know which factors
influence surface hydraulic properties such as hydraulic conductivity and infiltration capacity
(Shukla et al. 2006).
The measurement and monitoring of the soil hydraulic properties are quite difficult and
expensive (Wösten and Van Genuchten 1988). Hydraulic conductivity is often estimated
indirectly from pedotransfer functions (PTFs) based on soil texture and structure (Rawls et al.
1982; Vereecken 1995; Wösten et al. 1998).
Chapter 5
68
The reliability of these models are limited in their application due to regional dependence of the
resulting functions used for the pedotransferfunction (PTFs) derivation (Tietje and Hennings
1996, Wösten et al. 1998). To better understand the hydrologic behavior of grassland sites, field
measurements for defining factors shaping soil hydraulic properties, such as infiltration
capacity, are therefore important for the characterization of water flow processes through soil.
Based on the size, shape and continuity, soil pores can be classified into macro-, meso
and micropores (Beven 1981, Beven and Germann 2013). In grassland, infiltration capacity is
enhanced by water flow through macropores. These can be biological macropores caused by soil
fauna or plant roots development (Meek et al. 1992, Lavelle 1997, Angers and Caron 1998), or
structural macropores due to cracks and fissures (Germann and Beven 1981; Messing and Jarvis
1990; Zehe and Flühler 2001). Soil organic matter may have an indirect influence on both
formation and the stabilization of pores (Six et al. 2004), and a strong relation has been
observed between soil organic content and bulk density or porosity (Franzluebbers 2002; Lipiec
et al. 2006).
Increasing plant species richness is associated with higher plant and root biomass
production (Spehn et al. 2000, Tilman et al. 2001, Marquard et al. 2009) implying a higher input
of above- and belowground organic matter (Steinbeiss et al. 2008). Besides water removal by
plants via transpiration through root water uptake, soil hydraulic properties are also shaped by
plant species richness directly via roots (Angers and Caron 1998) and indirectly by shaping soil
structure (Oades 1993). Water flow through vertically oriented macropores formed by plant
roots can enhance infiltration (Mitchell et al. 1995), whereas root growth clogging of soil pores
can result in a decrease of water flow (Bodner et al. 2008). The most commonly known soil
structural parameters are soil bulk density, porosity and soil organic carbon which are
influenced by the type of vegetation cover and partly by plant species richness, microbes, fauna
or other soil properties such as texture (Six et al. 2004). Generally, it is known that biological
activity is greater on higher plant species richness plots leading to higher carbon content,
decreased bulk density and increased porosity (Zacharias and Wessolek 2007, Périé and Ouimet
2008). Other studies have shown that an increase in soil organic matter content leads to a higher
pore development, which increases soil aggregate stability, water holding rate and water
infiltration through soil (Berglund et al. 1980, Haynes and Naidu 1998, Franzluebbers 2002).
Also larger soil animals such as earthworms improve the water infiltration by modifying soil
structure and aggregate stability through burrowing, casting and mixing of litter and soil by
creating burrows as pathways for water flow (Six et al. 2004; Pérès et al. 2013; Edwards and
Bohlen 1996). The stability of soil aggregates and the pores between the aggregates improve
infiltration, drainage and storage of water, activity of soil fauna, and plant growth (Lee and
Foster 1991; Bronick and Lal 2005).
Chapter 5
69
In agriculture an important task is to increase infiltration to prevent and/or reduced run-
off and frequent flood events (Mannering and Meyer 1963). Therefore, slow water infiltration is
a serious problem that leads to reduced plant water use efficiency, increased run-off and erosion.
On bare ground or low plant cover ground rain water drops can compact the soil surface layer
by clogging soil pores and thus reduced infiltration through soil. There is little research on the
understanding of how plant diversity might influence vertical soil water fluxes by modifying
soil hydraulic properties in grasslands. The objective of this field study was to quantify the
change in infiltration capacity in a grassland plant diversity experiment covering a gradient in
soil texture and plant species diversity. In order to unravel possible mechanisms affecting water
infiltration through soil improve, the following questions were investigated:
(i) Do patterns in soil organic carbon content, induced by biodiversity gradients, relate to
structural parameters bulk density and porosity?
(ii) Do those parameters affect infiltration capacity?
5.3 Material and methods
5.3.1 Study area and experimental design
5.3.1.1 The Jena Experiment
The study was performed on the field site of The Jena Experiment which is located in
the floodplain of the Saale river near Jena (Thuringia, Germany; 50°55´N, 11°35´E, 130 m
above sea level). The mean annual air temperature is 9.3°C and the mean annual precipitation is
about 587 mm (Kluge and Müller-Westermeier 2000). Before its establishment in 2002 the
experimental field site was arable land and had been highly fertilized over the last decades.
After its last harvest in autumn of 2000, the field was ploughed and kept fallow throughout
2001, and the diversity treatment was started in spring of 2002. The texture on the field site at
the upper soil surface changes gradually with increasing distance from the river from loam into
a silt loam. The clay content shows no significant spatial trend. The soil of the experimental site
is an Eutric Fluvisol (Fao-Unesco 1997) developed from up to 2 m thick loamy fluvial
sediments (Roscher et al. 2004). The species were drawn from a pool of 60 plant species
common to the Central European mesophilic grasslands to established a gradient of plant
species richness (1, 2, 4, 8, 16 and 60) and functional group richness (1, 2, 3 and 4) on 80 plots
of 20 x 20 m.. To account for differences in morphology and physiology, species were assigned
to four functional groups: Grasses (16 species), small herbs (12 species), tall herbs (20 species)
and legumes (12 species). Plots were assembled into four blocks, arranged parallel to the river,
thus accounting for changes in soil properties and water conditions. Independently of the plant
species richness, the statistical design allows for the testing of effects caused by the presence
and absence of certain functional groups. For more details on the experiment and management,
Chapter 5
70
please refer to Roscher et al. (2004). The plots were mown twice a year and the hay was
removed from the plots some days after cutting. All plots were weeded regularly to maintain the
target species composition.
5.3.1.2 Earthworm subplots
For infiltration measurements in May 2012, earthworm biomass was determined at the
same time, but only on plots with species-richness levels of 1 (12 plots), 4 (16 plots) and 16 (14
plots). The subproject was completed before the next extraction campaign in October.
Earthworm performance was performed in May 2012 on one subplot (size 1 x 1 m) by electro-
shocking. A voltage was applied to the soil for 35 min. via four octet devices (Thielemann
1986) (DEKA 4000, Deka Gerätebau, Marsberg, Germany) powered by two 12 V batteries.
During the application time the voltage was increased sequentially from 250 V (10 min) to 300
V (5 min), 400 V (5 min), 500 V (5 min) and 600 V (10 min). For more details on the
arrangement of the steel rods of the octet devices and management of the earthworm subplots
see Eisenhauer et al. (2009a). Extracted earthworms were identified, counted and weighed (with
gut content) in the laboratory. Earthworms at the field site of the Jena Experiment mainly
belong to two ecological groups (Bouché 1977): anecic (Lumbricus terrestris) and endogeic
(Aporrectodea caliginosa, Octolasion tyrtaeum, Allolobophora chlorotica, and Aporrectodea
rosea) species.
5.3.2 Infiltration measurement
For in situ infiltration measurements we used a hood infiltrometer (UGT, Müncheberg,
Germany; method described in Schwärzel & Punzel, 2007). With the in situ technique it is
possible to determine the water flow through different pore size classes and consequently
quantify the role of soil texture, moisture, earthworms or plant roots without destroying the
measurement environment. In 2012, we conducted two infiltration measurement campaigns (in
May and October) along a species richness gradient on plots containing 1 (n=12), 2 (n=16), 4
(n=16), 8 (n=16), 16 (n=14) and 60 (n=4) plant species.
A small hood with a diameter of 16 cm was placed with the open side on the undisturbed soil
surface. The contact between the soil and hood was sealed with wet sand. We conducted
measurements at increasingly negative matric potentials (ΨM) beginning with ΨM = 0 m and
reducing it stepwise by -0.02 m until the bubble point of the soil was reached. The bubble point
refers to the matric potentials, upon which a pore channel allows for the penetration of air into
the hood and therefore the maximum applicable matric potential at this location. For a specific
matric potential (ΨM) the equivalent diameter (de) of the largest soil pore conducting water can
be estimated after Jarvis et al. (1987). At ΨM = 0 m the soil is saturated and the entire pore
Chapter 5
71
spectrum is potentially active. At ΨM = -0.02 m the largest active pores correspond to de =1.5
mm, at ΨM = -0.04 m to de = 0.75 mm. At each pressure level, we recorded infiltration capacity
until they were constant in time. This steady infiltration capacity was used for further analysis.
Infiltration capacity at a given matric potential is directly linked to hydraulic conductivity
(Wooding 1968). The flow conditions in natural soils are however far from ideal, with
anisotropic behaviour, heterogeneous initial soil water contents and flow dynamics that do not
correspond to the Richards equation near soil saturation. Therefore, we refrained from deriving
hydraulic conductivity from our infiltration capacity, for example via Wooding´ s formula
(1968). Instead, we worked with the observed infiltration capacity, considering those as a
surrogate for the rate of the soil to conduct water at the applied matric potential.
5.3.3 Soil structural parameters
In October 2012, three samples per plot were taken from each plot using soil sample
rings with an internal diameter of 57 mm and 40.5 mm height (inner volume of 100 cm³). The
samples were dried at 105°C and weighed to calculate the bulk density [g/cm3] (0-5 cm soil
depth). Prior determination of bulk density we measured porosity on a sand plate at saturation.
Soil organic carbon was measured in 2011 (one year before we measured bulk density
and soil organic carbon). Three samples per plot were taken using a split tube sampler with an
inner diameter of 4.8 cm (Eijkelkamp Agrisearch Equipment, Giesbeek, the Netherlands) and
sieved through a 2 mm sieve. After drying at 40°C the soil samples were segmented to a depth
resolution of 5 cm. For our analysis we used the first 5 cm segment (0-5 cm depth). The three
samples from one plot were mixed into one sample. Total carbon concentration was analyzed on
ball-milled subsamples (time 4 min, frequency 30 s-1
) by an elemental analyzer at 1150°C
(Elementaranalysator vario Max CN; Elementar Analysensysteme GmbH, Hanau, Germany)
before and after incubation. For the calculation of organic carbon, the difference between
elemental analyses of the total carbon concentration and soil inorganic carbon concentration was
determined (Steinbeiss et al. 2008).
5.3.4 Soil texture, moisture and hydrophobicity
Soil texture was determined from soil cores at 38 locations distributed throughout the
experimental site prior to plot establishment (G. Büchel, pers. comm.). Values for each plot
were interpolated by ordinary kriging. The fraction of sand and silt are negatively correlated
(clay showing no spatial trend). For simplicity, in the following statistical analysis we used the
sand fraction as a factor representing soil texture. The volumetric soil water content (in m³ m-3
)
was determined with a FDR probe (ML2x Theta Probe, Delta-T Devices, Cambridge, United
Kingdom). The device was inserted from the top to 6 cm deep (the length of the prongs) into the
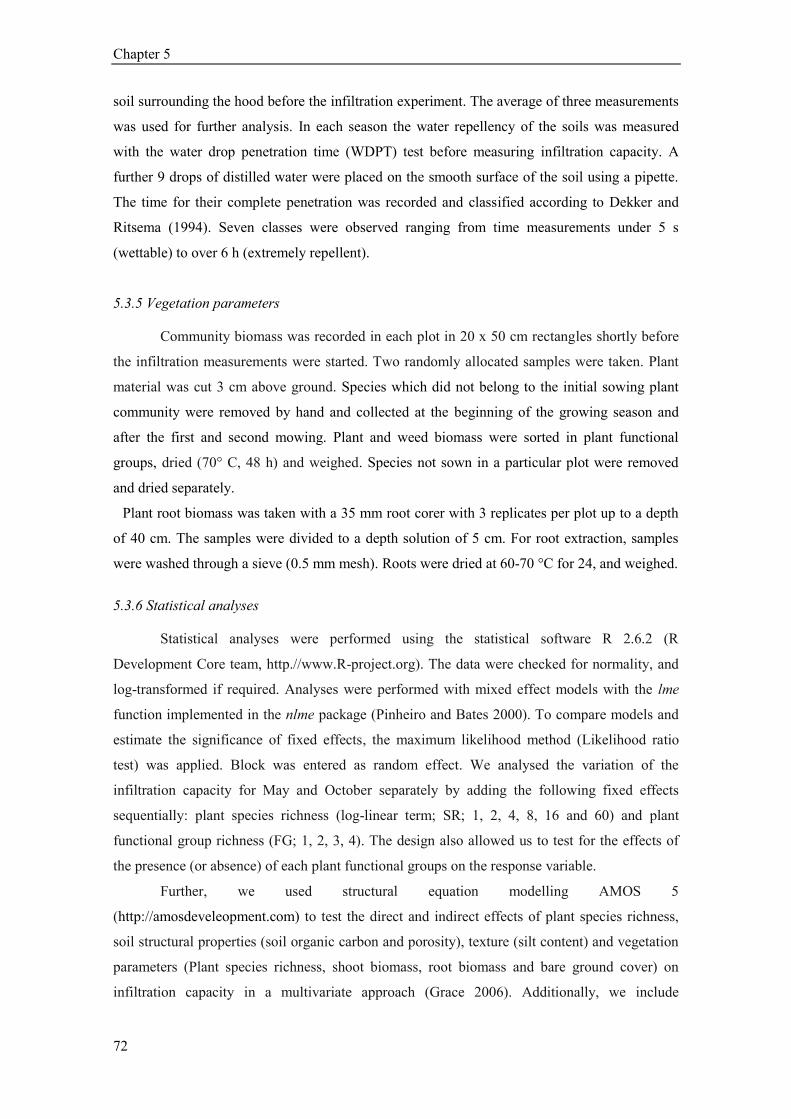
Chapter 5
72
soil surrounding the hood before the infiltration experiment. The average of three measurements
was used for further analysis. In each season the water repellency of the soils was measured
with the water drop penetration time (WDPT) test before measuring infiltration capacity. A
further 9 drops of distilled water were placed on the smooth surface of the soil using a pipette.
The time for their complete penetration was recorded and classified according to Dekker and
Ritsema (1994). Seven classes were observed ranging from time measurements under 5 s
(wettable) to over 6 h (extremely repellent).
5.3.5 Vegetation parameters
Community biomass was recorded in each plot in 20 x 50 cm rectangles shortly before
the infiltration measurements were started. Two randomly allocated samples were taken. Plant
material was cut 3 cm above ground. Species which did not belong to the initial sowing plant
community were removed by hand and collected at the beginning of the growing season and
after the first and second mowing. Plant and weed biomass were sorted in plant functional
groups, dried (70° C, 48 h) and weighed. Species not sown in a particular plot were removed
and dried separately.
Plant root biomass was taken with a 35 mm root corer with 3 replicates per plot up to a depth
of 40 cm. The samples were divided to a depth solution of 5 cm. For root extraction, samples
were washed through a sieve (0.5 mm mesh). Roots were dried at 60-70 °C for 24, and weighed.
5.3.6 Statistical analyses
Statistical analyses were performed using the statistical software R 2.6.2 (R
Development Core team, http.//www.R-project.org). The data were checked for normality, and
log-transformed if required. Analyses were performed with mixed effect models with the lme
function implemented in the nlme package (Pinheiro and Bates 2000). To compare models and
estimate the significance of fixed effects, the maximum likelihood method (Likelihood ratio
test) was applied. Block was entered as random effect. We analysed the variation of the
infiltration capacity for May and October separately by adding the following fixed effects
sequentially: plant species richness (log-linear term; SR; 1, 2, 4, 8, 16 and 60) and plant
functional group richness (FG; 1, 2, 3, 4). The design also allowed us to test for the effects of
the presence (or absence) of each plant functional groups on the response variable.
Further, we used structural equation modelling AMOS 5
(http://amosdeveleopment.com) to test the direct and indirect effects of plant species richness,
soil structural properties (soil organic carbon and porosity), texture (silt content) and vegetation
parameters (Plant species richness, shoot biomass, root biomass and bare ground cover) on
infiltration capacity in a multivariate approach (Grace 2006). Additionally, we include
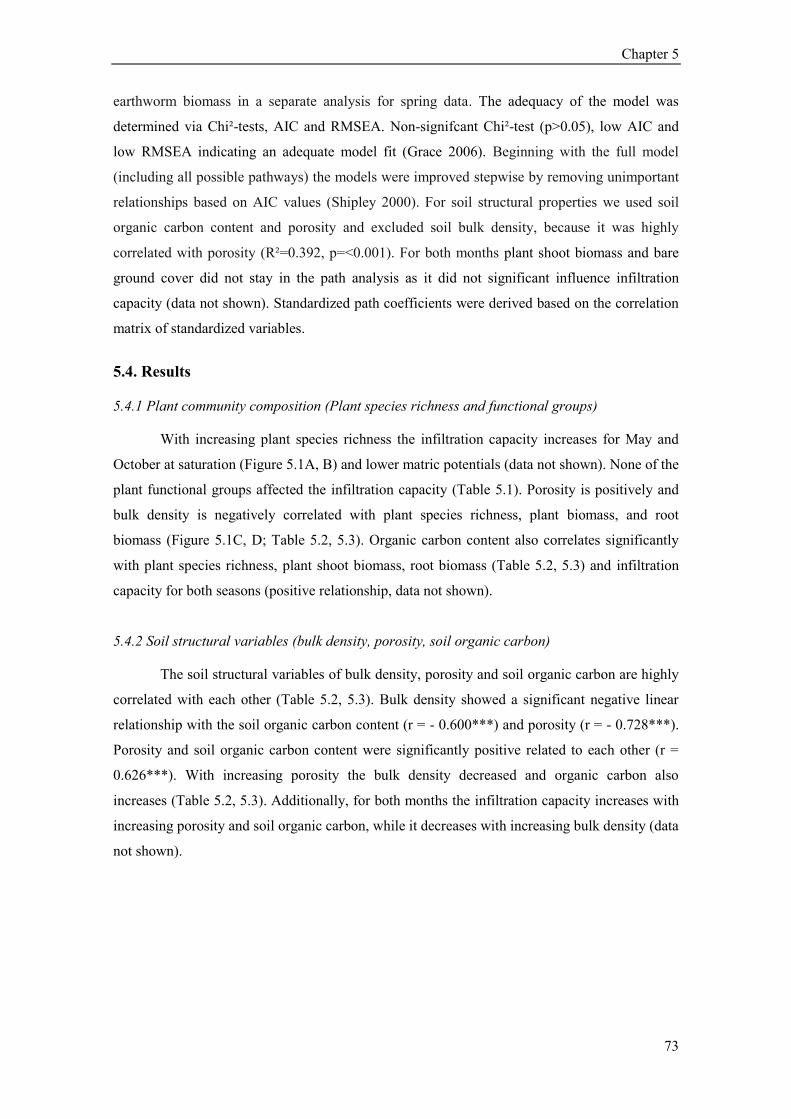
Chapter 5
73
earthworm biomass in a separate analysis for spring data. The adequacy of the model was
determined via Chi²-tests, AIC and RMSEA. Non-signifcant Chi²-test (p>0.05), low AIC and
low RMSEA indicating an adequate model fit (Grace 2006). Beginning with the full model
(including all possible pathways) the models were improved stepwise by removing unimportant
relationships based on AIC values (Shipley 2000). For soil structural properties we used soil
organic carbon content and porosity and excluded soil bulk density, because it was highly
correlated with porosity (R²=0.392, p=<0.001). For both months plant shoot biomass and bare
ground cover did not stay in the path analysis as it did not significant influence infiltration
capacity (data not shown). Standardized path coefficients were derived based on the correlation
matrix of standardized variables.
5.4. Results
5.4.1 Plant community composition (Plant species richness and functional groups)
With increasing plant species richness the infiltration capacity increases for May and
October at saturation (Figure 5.1A, B) and lower matric potentials (data not shown). None of the
plant functional groups affected the infiltration capacity (Table 5.1). Porosity is positively and
bulk density is negatively correlated with plant species richness, plant biomass, and root
biomass (Figure 5.1C, D; Table 5.2, 5.3). Organic carbon content also correlates significantly
with plant species richness, plant shoot biomass, root biomass (Table 5.2, 5.3) and infiltration
capacity for both seasons (positive relationship, data not shown).
5.4.2 Soil structural variables (bulk density, porosity, soil organic carbon)
The soil structural variables of bulk density, porosity and soil organic carbon are highly
correlated with each other (Table 5.2, 5.3). Bulk density showed a significant negative linear
relationship with the soil organic carbon content (r = - 0.600***) and porosity (r = - 0.728***).
Porosity and soil organic carbon content were significantly positive related to each other (r =
0.626***). With increasing porosity the bulk density decreased and organic carbon also
increases (Table 5.2, 5.3). Additionally, for both months the infiltration capacity increases with
increasing porosity and soil organic carbon, while it decreases with increasing bulk density (data
not shown).
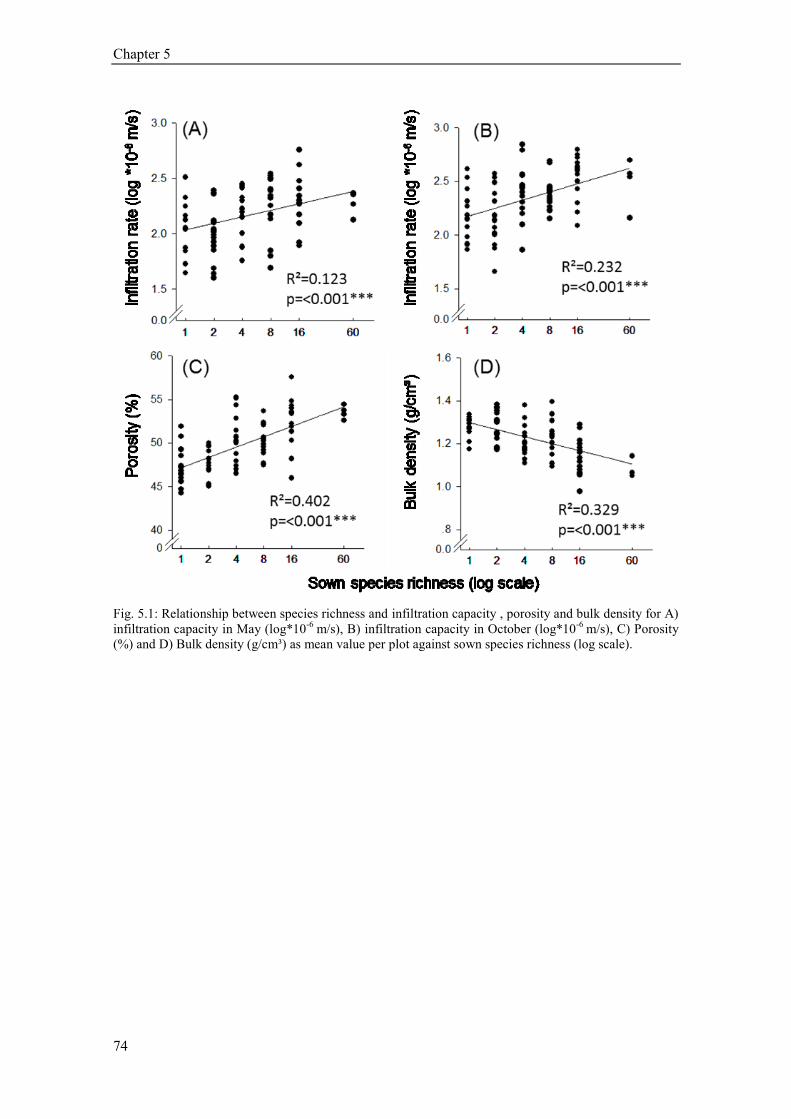
Chapter 5
74
Fig. 5.1: Relationship between species richness and infiltration capacity , porosity and bulk density for A)
infiltration capacity in May (log*10-6
m/s), B) infiltration capacity in October (log*10-6
m/s), C) Porosity
(%) and D) Bulk density (g/cm³) as mean value per plot against sown species richness (log scale).

Chapter 5
75
Table 5.1: Summary of mixed-effect model analyses for infiltration capacity (log *10-6
m/s) in A) May
and B) October for the matric potentials ψM = 0, 0.02 and 0.04 m.
0 m -0.02 m -0.04 m
L ratio p L ratio p L ratio p
(A) May
SR (log-linear) 9.58 0.002 ↑ 11.52 <0.001 ↑ 12.83 <0.001 ↑
FG 4.91 0.178 5.31 0.151 4.01 0.260
LEG 0.01 0.929 0.01 0.938 0.17 0.683
GR 2.22 0.137 1.89 0.170 0.84 0.360
SH 0.12 0.731 <0.01 0.958 0.01 0.911
TH 1.40 0.236 1.69 0.194 2.07 0.150
(B) October
SR (log-linear) 22.80 <0.001 ↑ 29.18 <0.001 ↑ 16.67 <0.001 ↑
FG 1.70 0.634 2.99 0.393 2.07 0.558
LEG 0.07 0.799 0.52 0.472 0.02 0.897
GR <0.01 0.955 0.65 0.420 0.52 0.472
SH 0.36 0.550 2.39 0.122 0.28 0.597
TH 0.65 0.421 2.27 0.132 1.76 0.185
Models were fitted by stepwise inclusion of fixed effects. Likelihood ratio tests were applied to assess model improvement (L ratio) and the statistical
significance of the explanatory terms (p values). Significant effects are marked in bold. Arrows indicate increase (↑) or decrease (↓).Abbreviations: SR
= species richness (log-linear), FG = functional group, LEG = legume presence/absence, GR = grasses presence/absence, SH = small herbs
presence/absence, TH = tall herbs =presence/absence.
5.4.3 Soil texture, soil moisture and hydrophobicity
In both months (May and October) texture content (percent of clay, sand and silt) did
not correlate with the infiltration capacity (data not shown). In May the moisture content weakly
correlated with the infiltration capacity at ΨM = 0 m (R²=0.07, p=0.026), -0.02 m (R²=0.06,
p=0.028) and -0.04 m (R² =0.09, p=0.009). With increasing moisture content the infiltration
capacity increases. In October moisture content did not correlate with the infiltration capacity
for any of the applied matric potentials. In both seasons almost all measurements testing the
water repellency were below 5s, only single drops of one plot required time between 5s and 1
min (slightly water repellent). On average all plots were wettable and we therefore concluded
that wettability did not influence our results.
Chapter 5
76
Table 5.2: Pearson correlation matrix for studied variables in May.
Abbreviations: SR= species richness (log-linear), Bd=Bulk density, BM root =Biomass root, BM above= plant biomass
aboveground, BM weed= Plant biomass weed, LAI= Leaf Area Index, Bare = Bare ground cover; * p≤0.05, ** < 0.01, *** p=0.001
Table 5.3: Pearson correlation matrix for studied variables in October (Oct).
Abbreviations: SR= species richness (log-linear), Bd=Bulk density, BM root =Biomass root, BM above= plant biomass
aboveground, BM weed= Plant biomass weed, LAI= Leaf Area Index, Bare= Bare ground cover; * p≤0.05, ** < 0.01, *** p<0.001
5.4.4 Path analysis
Because of a strong effect of the interrelated variables on infiltration, we used path
analysis for the visualisation of direct, indirect and interaction effects. Using path analyses, we
were able to investigate the effects of plant species richness through changes in root biomass,
soil organic carbon content and porosity for both months. The initial model (AIC=51.52; Figure
5.2A) was improved as described in material and methods. In May the path analysis model
explained 20 % of the infiltration capacity at saturation (Figure 5.2B). For the improved model
(Fig. 5.2 B, χ² = 7.203, p = 0.408, AIC = 47.203) root biomass, porosity and soil organic carbon
increased significantly with increasing plant species richness. Infiltration capacity at saturation
was mainly explained by the variation of porosity (positive relationship), while there was
May Bd
(g/cm³)
BM root
(mg/cm³)
BM shoot
(g/m²)
Sand
(%)
Porosity
(%)
SR Moisture
(%)
Corg -0.600*** 0.400*** 0.219* - 0.626*** 0.437*** -
Bd -0.522*** -0.288** - -0.728*** -0.574*** -
BM root 0.378*** - 0.567*** 0.590*** -
BM above -0.219* 0.347** 0.556*** 0.411***
Sand - - -0.326**
Porosity 0.634*** 0.251*
SR -
Moisture
Oct Bd
(g/cm³)
BM root
(mg/cm³)
BM shoot
(g/m²)
Sand
(%)
Porosity
(%)
SR Moisture
(%)
Corg -0.600*** 0.400*** - - 0.626*** 0.437*** -
Bd -
0.522***
-0.251* - -0.728*** -0.574*** -
BM root 0.266* - 0.567*** 0.590*** -
BM above - 0.245** 0.528*** 0.349**
Sand - - -0.269*
Porosity 0.634*** -
SR -
Moisture
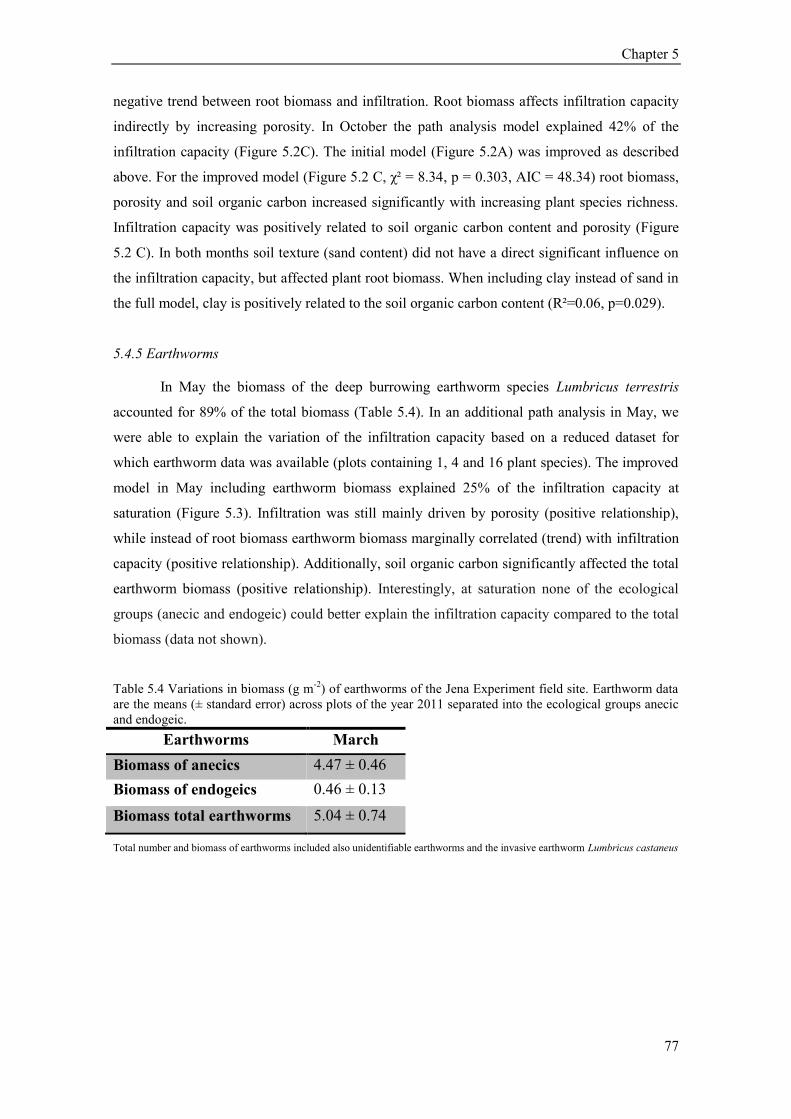
Chapter 5
77
negative trend between root biomass and infiltration. Root biomass affects infiltration capacity
indirectly by increasing porosity. In October the path analysis model explained 42% of the
infiltration capacity (Figure 5.2C). The initial model (Figure 5.2A) was improved as described
above. For the improved model (Figure 5.2 C, χ² = 8.34, p = 0.303, AIC = 48.34) root biomass,
porosity and soil organic carbon increased significantly with increasing plant species richness.
Infiltration capacity was positively related to soil organic carbon content and porosity (Figure
5.2 C). In both months soil texture (sand content) did not have a direct significant influence on
the infiltration capacity, but affected plant root biomass. When including clay instead of sand in
the full model, clay is positively related to the soil organic carbon content (R²=0.06, p=0.029).
5.4.5 Earthworms
In May the biomass of the deep burrowing earthworm species Lumbricus terrestris
accounted for 89% of the total biomass (Table 5.4). In an additional path analysis in May, we
were able to explain the variation of the infiltration capacity based on a reduced dataset for
which earthworm data was available (plots containing 1, 4 and 16 plant species). The improved
model in May including earthworm biomass explained 25% of the infiltration capacity at
saturation (Figure 5.3). Infiltration was still mainly driven by porosity (positive relationship),
while instead of root biomass earthworm biomass marginally correlated (trend) with infiltration
capacity (positive relationship). Additionally, soil organic carbon significantly affected the total
earthworm biomass (positive relationship). Interestingly, at saturation none of the ecological
groups (anecic and endogeic) could better explain the infiltration capacity compared to the total
biomass (data not shown).
Table 5.4 Variations in biomass (g m-2
) of earthworms of the Jena Experiment field site. Earthworm data
are the means (± standard error) across plots of the year 2011 separated into the ecological groups anecic
and endogeic.
Earthworms March
Biomass of anecics 4.47 ± 0.46
Biomass of endogeics 0.46 ± 0.13
Biomass total earthworms 5.04 ± 0.74
Total number and biomass of earthworms included also unidentifiable earthworms and the invasive earthworm Lumbricus castaneus
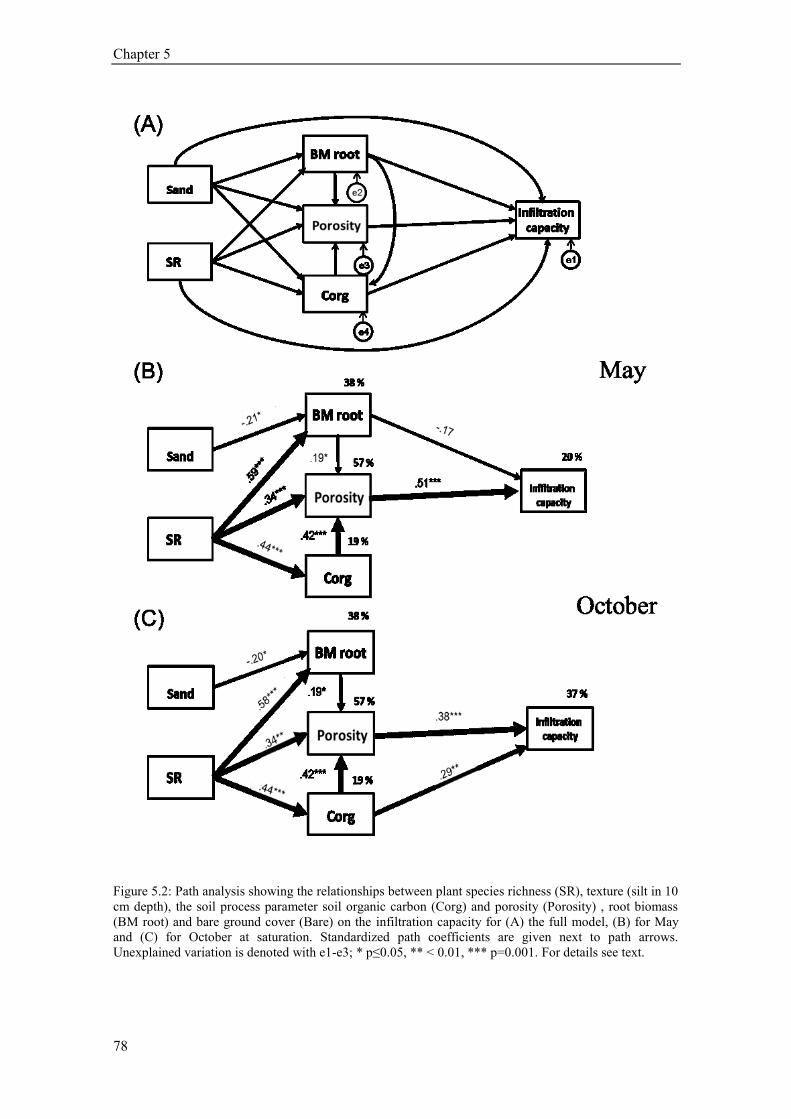
Chapter 5
78
Figure 5.2: Path analysis showing the relationships between plant species richness (SR), texture (silt in 10
cm depth), the soil process parameter soil organic carbon (Corg) and porosity (Porosity) , root biomass
(BM root) and bare ground cover (Bare) on the infiltration capacity for (A) the full model, (B) for May
and (C) for October at saturation. Standardized path coefficients are given next to path arrows.
Unexplained variation is denoted with e1-e3; * p≤0.05, ** < 0.01, *** p=0.001. For details see text.
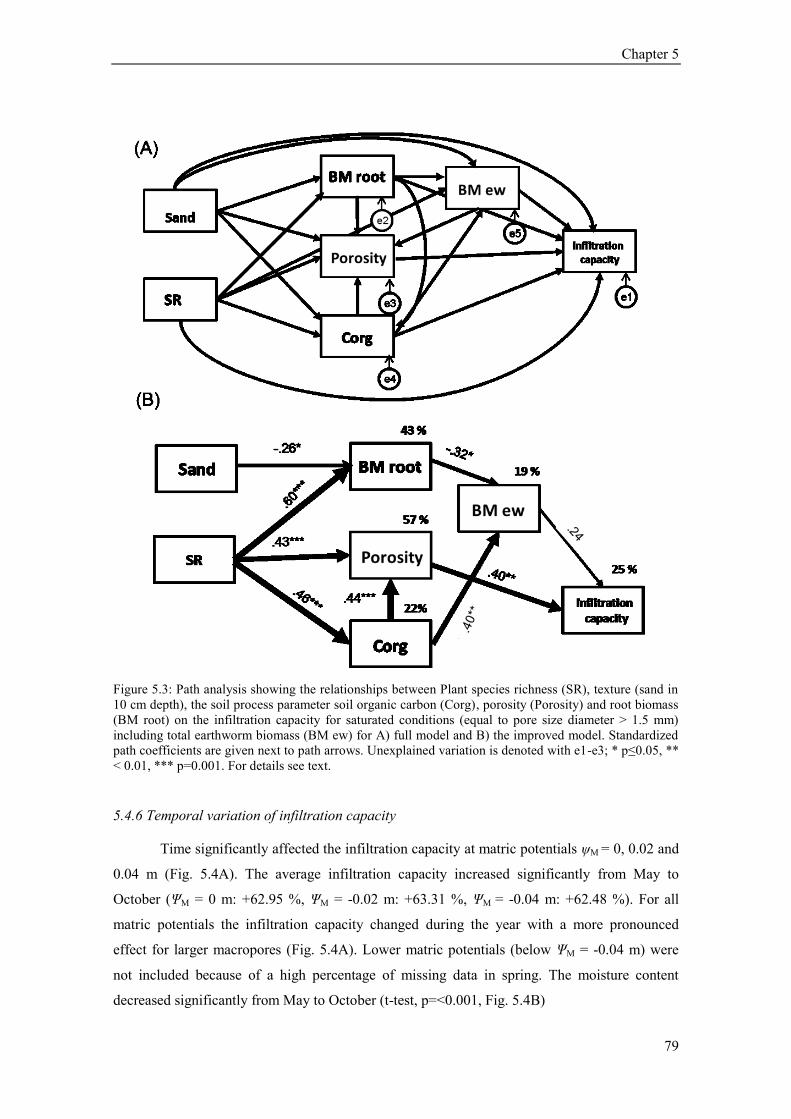
Chapter 5
79
Figure 5.3: Path analysis showing the relationships between Plant species richness (SR), texture (sand in
10 cm depth), the soil process parameter soil organic carbon (Corg), porosity (Porosity) and root biomass
(BM root) on the infiltration capacity for saturated conditions (equal to pore size diameter > 1.5 mm)
including total earthworm biomass (BM ew) for A) full model and B) the improved model. Standardized
path coefficients are given next to path arrows. Unexplained variation is denoted with e1-e3; * p≤0.05, **
< 0.01, *** p=0.001. For details see text.
5.4.6 Temporal variation of infiltration capacity
Time significantly affected the infiltration capacity at matric potentials ψM = 0, 0.02 and
0.04 m (Fig. 5.4A). The average infiltration capacity increased significantly from May to
October (ΨM = 0 m: +62.95 %, ΨM = -0.02 m: +63.31 %, ΨM = -0.04 m: +62.48 %). For all
matric potentials the infiltration capacity changed during the year with a more pronounced
effect for larger macropores (Fig. 5.4A). Lower matric potentials (below ΨM = -0.04 m) were
not included because of a high percentage of missing data in spring. The moisture content
decreased significantly from May to October (t-test, p=<0.001, Fig. 5.4B)
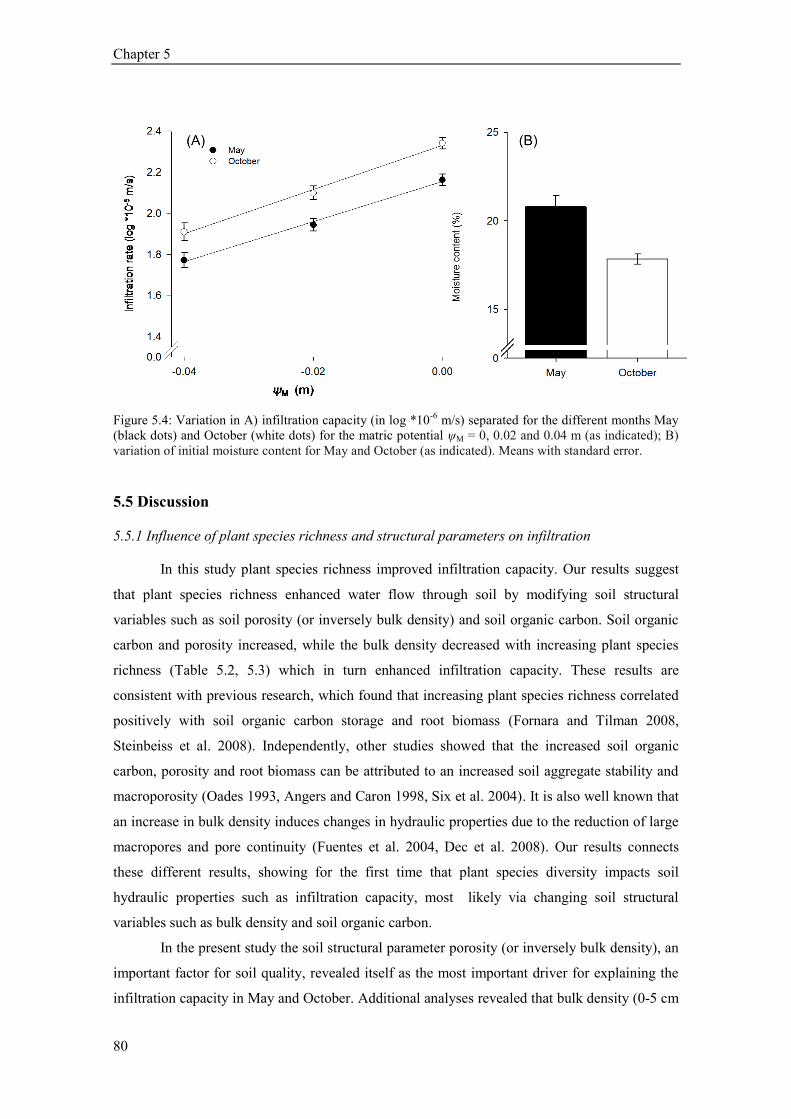
Chapter 5
80
Figure 5.4: Variation in A) infiltration capacity (in log *10-6
m/s) separated for the different months May
(black dots) and October (white dots) for the matric potential ψM = 0, 0.02 and 0.04 m (as indicated); B)
variation of initial moisture content for May and October (as indicated). Means with standard error.
5.5 Discussion
5.5.1 Influence of plant species richness and structural parameters on infiltration
In this study plant species richness improved infiltration capacity. Our results suggest
that plant species richness enhanced water flow through soil by modifying soil structural
variables such as soil porosity (or inversely bulk density) and soil organic carbon. Soil organic
carbon and porosity increased, while the bulk density decreased with increasing plant species
richness (Table 5.2, 5.3) which in turn enhanced infiltration capacity. These results are
consistent with previous research, which found that increasing plant species richness correlated
positively with soil organic carbon storage and root biomass (Fornara and Tilman 2008,
Steinbeiss et al. 2008). Independently, other studies showed that the increased soil organic
carbon, porosity and root biomass can be attributed to an increased soil aggregate stability and
macroporosity (Oades 1993, Angers and Caron 1998, Six et al. 2004). It is also well known that
an increase in bulk density induces changes in hydraulic properties due to the reduction of large
macropores and pore continuity (Fuentes et al. 2004, Dec et al. 2008). Our results connects
these different results, showing for the first time that plant species diversity impacts soil
hydraulic properties such as infiltration capacity, most likely via changing soil structural
variables such as bulk density and soil organic carbon.
In the present study the soil structural parameter porosity (or inversely bulk density), an
important factor for soil quality, revealed itself as the most important driver for explaining the
infiltration capacity in May and October. Additional analyses revealed that bulk density (0-5 cm
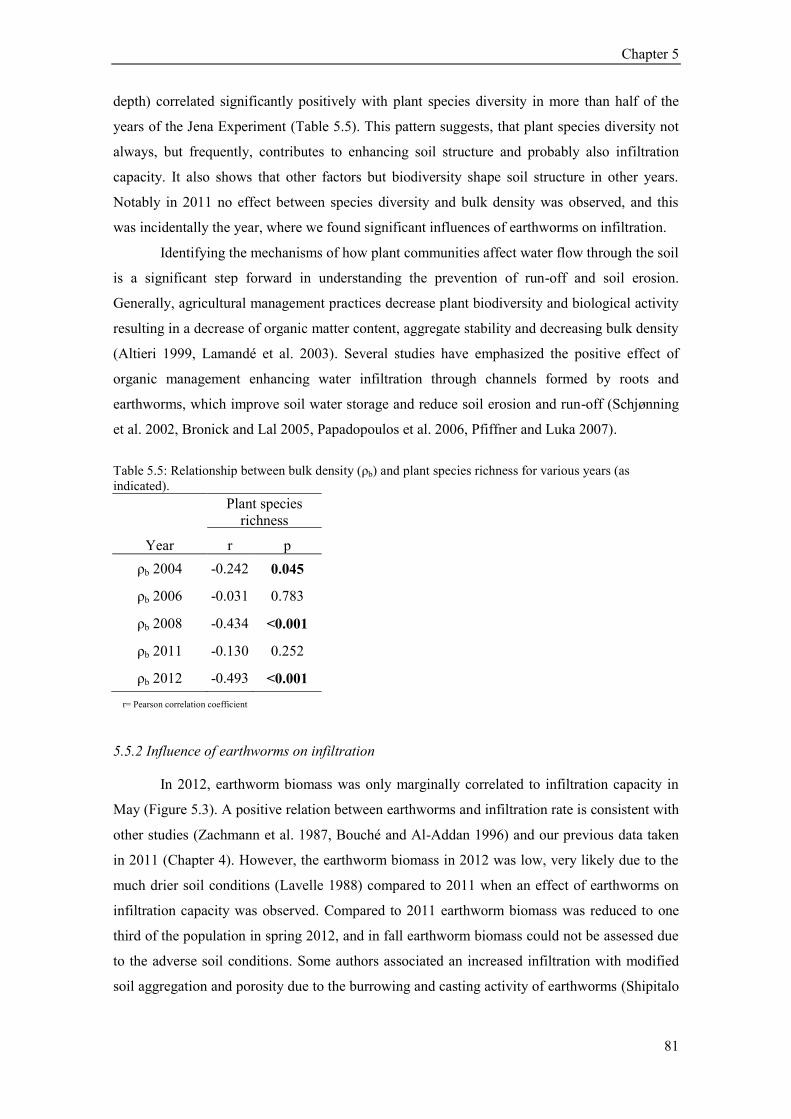
Chapter 5
81
depth) correlated significantly positively with plant species diversity in more than half of the
years of the Jena Experiment (Table 5.5). This pattern suggests, that plant species diversity not
always, but frequently, contributes to enhancing soil structure and probably also infiltration
capacity. It also shows that other factors but biodiversity shape soil structure in other years.
Notably in 2011 no effect between species diversity and bulk density was observed, and this
was incidentally the year, where we found significant influences of earthworms on infiltration.
Identifying the mechanisms of how plant communities affect water flow through the soil
is a significant step forward in understanding the prevention of run-off and soil erosion.
Generally, agricultural management practices decrease plant biodiversity and biological activity
resulting in a decrease of organic matter content, aggregate stability and decreasing bulk density
(Altieri 1999, Lamandé et al. 2003). Several studies have emphasized the positive effect of
organic management enhancing water infiltration through channels formed by roots and
earthworms, which improve soil water storage and reduce soil erosion and run-off (Schjønning
et al. 2002, Bronick and Lal 2005, Papadopoulos et al. 2006, Pfiffner and Luka 2007).
Table 5.5: Relationship between bulk density (ρb) and plant species richness for various years (as
indicated).
Year
Plant species
richness
r p
ρb 2004 -0.242 0.045
ρb 2006 -0.031 0.783
ρb 2008 -0.434 <0.001
ρb 2011 -0.130 0.252
ρb 2012 -0.493 <0.001
r= Pearson correlation coefficient
5.5.2 Influence of earthworms on infiltration
In 2012, earthworm biomass was only marginally correlated to infiltration capacity in
May (Figure 5.3). A positive relation between earthworms and infiltration rate is consistent with
other studies (Zachmann et al. 1987, Bouché and Al-Addan 1996) and our previous data taken
in 2011 (Chapter 4). However, the earthworm biomass in 2012 was low, very likely due to the
much drier soil conditions (Lavelle 1988) compared to 2011 when an effect of earthworms on
infiltration capacity was observed. Compared to 2011 earthworm biomass was reduced to one
third of the population in spring 2012, and in fall earthworm biomass could not be assessed due
to the adverse soil conditions. Some authors associated an increased infiltration with modified
soil aggregation and porosity due to the burrowing and casting activity of earthworms (Shipitalo
Chapter 5
82
and Protz 1988, Yeates et al. 1998, Six et al. 2004). But in contrast to these studies, earthworm
biomass in 2012 did not correlate with soil structural parameters.
A number of reasons may be responsible for this: First, earthworm biomass was only
assessed on a short species richness gradient with fewer plots (only for 1, 4 and 16 plant
species), which may have masked possible effects. However, the relation between biodiversity
and bulk density with infiltration capacity was significant also on this smaller subset of plots,
which suggests, that the effects of bulk density and earthworms on infiltration capacity are
probably decoupled. This is supported by the results of the path analysis, which shows separate
pathways for these two factors. Second, although in general earthworm activity has a positive
effect on soil structure (by increasing porosity and decreasing bulk density) (Lee and Foster
1991, Pérès et al. 1998, Blanchart et al. 2004, Hale et al. 2005), their specific role on soil
structure depends next to the ecological group, also on their functional attributes such as
compacting (increasing soil bulk density) and decompacting (decreasing soil bulk density)
earthworm species (Blanchart et al. 1997, Six et al. 2004). Thus, also negative and no effects on
soil structure by earthworms have been reported (Zund et al. 1997, Fonte et al. 2009, Salehi et
al. 2013). Furthermore, the positive correlation between bulk density and earthworm mainly in
agriculture soils could be attributed to an initially higher bulk density before adding earthworms
resulting in a significant decrease of bulk density (Poier and Richter 1992, Hale et al. 2005).
Third, since earthworm activity was generally low in 2012, their effect on bulk density would
generally be week.
Independent of bulk density, our results show that earthworm biomass increases the
infiltration capacity, which could be caused by increasing macropore numbers which not
necessarily affect soil structure at the scale of soil sample cylinders (100 cm3). Also, since
earthworm activity changes between years their influence on infiltration likely also depends on
population dynamics. This may the reason, why we found a stronger relationship between
earthworms and infiltration capacity in 2011 compared to 2012.
5.5.3 Temporal variation of infiltration capacity
Over the year the infiltration capacity increased significantly (Fig. 5.4 A). These results
differ from other studies (Archer et al. 2002, Bodner et al. 2008) and data taken in 2011
(Chapter 4), which found that infiltration through soil is decreased over the growing season
probably due to plant root growth lead to clogging/sealing of pre-existing pores. The increase of
infiltration capacity may be associated with dying roots, in the dryer soil and lower precipitation
in 2012 compared to 2011 (Schumm and Lusby 1963, Messing and Jarvis 1993) (Fig. 5.4 B).
Root decay, which leaves behind empty macropores (Barley 1954, Gish and Jury 1983, Mitchell
et al. 1995), has the rate to increase infiltration capacity. In our study soil porosity was also
Chapter 5
83
positively related to root biomass of the previous year. This finding corroborates with other
studies which found that roots increased infiltration indirectly by increasing soil macroporosity
(Ela et al. 1992, Beven and Germann 2013).
5.5.4 Conclusion
The reduction of bulk density (or increase of porosity) in diverse species mixtures was
the most critical parameter for explaining infiltration capacity. Soil organic carbon and roots are
fundamental factors leading to a change in bulk density and porosity. These factors, which
improve infiltration through soil, might reduce the impact of rainfall leading to reduced run-off
and soil erosion. However, the impact of plant species richness on soil structural parameters
does not appear every year, which probably also affects the resulting infiltration pattern. Also
earthworms play a role for explaining infiltration capacity, independent of plant species richness
and bulk density. After 10 years of the establishment of the biodiversity grassland site, higher
plant species richness generally increased infiltration capacity by improving soil structural
parameters. For soil management these results highlighted that earthworms and plant species
diversity both affecting infiltration capacity, whereby the mechanism are different and probably
not related to each other.

Chapter
6
An in situ lysimeter experiment (Ecotron/Montpellier) on abiotic and biotic
factors influencing hydrological response through a soil profile

Chapter 6
87
6 An in situ lysimeter experiment (Ecotron/Montpellier) on biotic and abiotic
factors influencing hydrological response through a soil profile
6.1 Abstract
Water flow through the soil profile is controlled by abiotic and biotic parameters that
vary in space and time. Knowledge of the factors affecting soil hydraulic properties through the
soil profile is important, for the development of optimal agricultural and land management
strategies. We measured Infiltration capacity at two plant diversity levels (4 and 16 species) on
monoliths originated from The Jena Biodiversity Experiment in the CNRS Ecotron Experiment
(Montpellier, France). We analyzed the infiltration capacity at several depths (soil surface,
within the rooting zone, below the main rooting zone). In order to mechanistically understand
variations in infiltration we extracted and counted earthworms in the infiltration area after the
infiltration experiments, determined soil texture, soil organic carbon, bulk density, initial
moisture content and root biomass at each depth, and above shoot biomass. Higher earthworm
biomass increases infiltration capacity at the soil surface. The impacts of biotic processes on
infiltration at the soil surface have no impact on processes through deeper soil layers (25-55
cm). Infiltration capacity decreased in the subsoil by a visible compacted layer (presumably an
old plough pan). This decrease was due to a reduction of larger pores formed by earthworms
and plant roots, which can negatively affect water infiltration. Furthermore, in deeper soil layers
none of the observed parameters could explain the infiltration capacity. In the present study we
show that after 10 years of conversion from arable into grassland, at and below the observed
dense layer the biotic impact at the soil surface on infiltration was reversed leading to
inappropriate predictions for infiltration in deeper soil layers.
6.2 Introduction
Soil properties are greatly influenced by abiotic and biotic parameters varying in space
and time (Deb and Shukla 2012). Saturated hydraulic conductivity is the most important soil
property for water-plant-soil interactions and water flow through the soil profile. Field studies
have shown that saturated hydraulic conductivity in the topsoil can vary greatly because it is
influenced by many factors on different spatial scales (Seyfried and Wilcox 1995, Deb and
Shukla 2012). Additionally, soil hydraulic properties are often critical input parameters to
irrigation and water management models at scales ranging from plot to catchment. Spatial
variability of soil hydraulic properties through a soil profile determines surface run-off, plant
water storage and water flow through groundwater. Therefore, this is important for the
development of optimal agricultural and land management strategies (Bodner et al. 2008,
Schwärzel et al. 2011).
Chapter 6
88
Infiltration through soil is determined by soil structure, moisture and the degree of
biological activity (Angers and Caron 1998, Bronick and Lal 2005). The spatial variation, size
and connectivity of pores formed by earthworms and plant roots play a key role in determining
the rate of influx through soil (Edwards and Bohlen 1996, Angers and Caron 1998, Beven and
Germann 2013). In addition to the already known seasonal dynamics of earthworm activity
(Eisenhauer et al. 2009b), earthworms also vary within depth depending on the ecological type:
endogeic, epigeic and anecic (Bouché 1977) with burrows ranging from 2 to 11 mm in diameter
(Ehlers 1975, Syers and Springett 1983). Because of the different feeding and burrowing
strategies, endogeic and epigeic earthworm mainly increase the infiltration in the topsoil, while
anecic species enhance water flow to deeper soil strata (Shuster et al., 2002). As reported by
Van Schaik et al. (2013), earthworm macropore numbers decreased with depth (10, 30 and 50
cm), except for larger pores (> 6 mm in diameter). But these macropores had a smaller
hydrological effectiveness compared to those at a depth of 10 and 30 cm.
Plant diversity can influence water infiltration through several mechanisms. First,
earthworm abundance and/or biomass have been reported to be positively related to plant
species richness (Zaller and Arnone 1999, Spehn et al. 2004), which may induce changes in the
number of macropores and have an influence water movement in the soil (Bardgett et al. 2001).
Second, increasing species richness is associated with higher above- and belowground plant
productivity (Tilman et al. 2001, Spehn et al. 2002). The differences in the vertical distribution
of roots and rooting strategies due to variations in plant species richness, plant functional groups
and soil texture (Coupland and Johnson 1965, Fargione and Tilman 2005, Schenk 2005) have
pronounced effects on water fluxes through the soil profile. Several studies have shown that in
root profiles root density declines exponentially with increasing depth (Schenk and Jackson
2002, Schenk 2005). However, root effects can strongly differ. Growing roots mainly clog soil
pores causing reduced Infiltration capacity, while decaying roots can create vertical channels in
the soil increasing the infiltration capacity (Barley 1954, Gish and Jury 1983).
The Ecotron experiment provides the possibility of analyzing soil hydraulic properties
under controlled environmental conditions and almost identical functional group composition in
several depths. Soil texture has often been related to hydraulic conductivity, but as shown in
previous studies of the Jena Experiment, biotic factors play a more important role for the
infiltration capacity at the soil surface (Chapter 4) The general objective of this study was to
investigate to which extent biotic factors, such as plant species richness, plant root biomass,
earthworm biomass, soil moisture and soil texture, play a role on the infiltration capacity of
different macropore sizes at several depths (soil surface, within rooting zone and below rooting
zone).
We measured infiltration capacity at two diversity levels (4 and 16 species) in plots
containing all functional groups (small herbs, tall herbs, legumes and grasses) with almost the

Chapter 6
89
same proportions. We measured infiltration at several depths (top, within the rooting zone,
below the main rooting zone). In order to distinguish whether the effects were due to biotic
(earthworms, root biomass and/or plant biomass) and/or abiotic factors (texture, initial moisture
content), we extracted and counted earthworms in the infiltration area after the infiltration
experiments, determined texture, measured initial moisture content at each depth, as well as
measured above- and belowground biomass. We conducted infiltration measurements at several
matric potentials in order to determine whether changes in infiltration capacity (hydraulic
conductivity) are due to alterations in large or small soil pores. The infiltration through soil is
controlled by macropores connected to the soil surface (Van Schaik et al. 2013) suppressing or
promoting the direction and velocity at which water flows through the profile. Accounting for
the variability of the soil properties it is crucial to understand the interactions between soil and
biotic parameters, as well as their effects on water flow through the soil. With this study we
want to find out which factors improve macropore flow through deeper depths. For irrigation
and soil management it is important to consider what roles the factors on infiltration at several
depths play. The main question of this field study was:
(i) Do the observed factors influencing soil hydraulic properties at the soil surface also affect
infiltration into deeper soil strata? What factors are important drivers for the infiltration at
several depths?
6.3 Material and Methods
6.3.1 Experimental design
In 2011 excavated soil cores from the experimental field site to a depth of 2.20 m were
transported to CNRS Ecotron of Montpellier (France). The monoliths originate from a
temperate grassland site, the Jena Experiment, located in the floodplain of the Saale river near
Jena (Thuringia, Germany; 50°55´N, 11°35´E, 130 m above sea level). The Ecotron experiment
provides the possibility to study ecosystems processes and organism under controlled
environmental. The CNRS of Montpellier (France) Ecotron consists of transparent and confined
Teflon domes for analyzing elementary functions under simplified conditions. Therefore,
complex patterns in the real field community can be simplified. Under the same environmental
condition and near the same functional group composition, we measured soil hydraulic
properties and other important soil and biotic parameters to compare with the results from the
field site. Additionally, we focused on the spatial variability of the infiltration capacity along the
soil profile of the various factors and the resulting interactions between abiotic and biotic factors
at a depth of 0, 20 and 60 cm. Because one of the 12 monoliths was broken, our measurements
were conducted on 11 of the 12 monoliths.

Chapter 6
90
6.3.2 Infiltration measurement
For in situ infiltration measurements we used a hood infiltrometer (UGT, Müncheberg,
Germany; method described in Schwärzel & Punzel, 2007). With the in situ technique it is
possible to determine the water flow through different pore size classes and consequently
quantify the role of soil texture, moisture, earthworms or plant roots without destroying the
measurement environment. We conducted two measurements per monolith at three different soil
depths.
A hood with a diameter of 24 cm was placed with the open side on the undisturbed soil
surface. The contact between the soil and hood was sealed with wet sand. We conducted
measurements at increasingly negative matric potentials (ѰM), beginning with ѰM =0 m and
reducing it stepwise by 0.02 m until the bubble point of the soil was reached. The bubble point
refers to the matric potentials upon which a pore channel allows for penetration of air into the
hood and therefore the maximum applicable matric potential at this location. For a specific
matric potential (ѰM) the equivalent diameter (de) of the largest soil pore conducting water can
be estimated after Jarvis et al. (1987). At ѰM = 0 m the soil is saturated and the entire pore
spectrum is potentially active. At ѰM = -0.02 m the largest active pores correspond to de =1.5
mm and at ѰM = -0.04 m to de = 0.7 mm. At each pressure level we recorded infiltration
capacity until they were constant in time. This steady infiltration capacity was used for further
analysis. Infiltration capacity at a given matric potential is directly linked to hydraulic
conductivity (Wooding 1968). The flow conditions in natural soils are far from ideal, with
anisotropic behaviour, heterogeneous initial soil water contents, and flow dynamics that do not
correspond to the Richards equation near soil saturation. Therefore, we refrained from deriving
hydraulic conductivity from our infiltration capacity, for example via Wooding´s formula
(1968). Instead, we worked with the observed Infiltration capacity, considering those as a
surrogate for the rate of the soil to conduct water at the applied matric potential. We measured
infiltration capacity on plots with similar absence/presence of grass and legumes in response to
variations in soil texture, initial soil moisture, earthworm biomass, target plant and weed shoot
biomass, root biomass, and plant diversity at soil depths of 0, 25 and 55 cm. In order to alleviate
the effects of soil heterogeneity, we used two infiltration experiments per treatment plot.
Overviews of all measured variables for explaining infiltration capacity are given in Table 6.1.
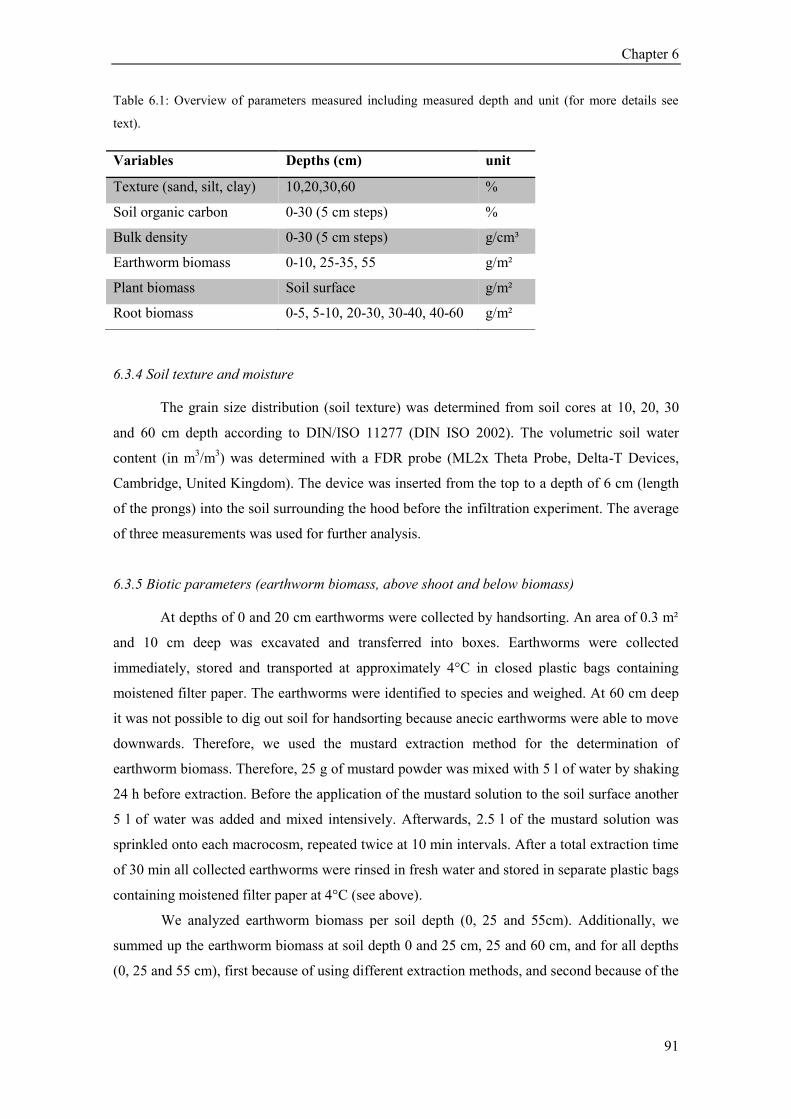
Chapter 6
91
Table 6.1: Overview of parameters measured including measured depth and unit (for more details see
text).
6.3.4 Soil texture and moisture
The grain size distribution (soil texture) was determined from soil cores at 10, 20, 30
and 60 cm depth according to DIN/ISO 11277 (DIN ISO 2002). The volumetric soil water
content (in m3/m
3) was determined with a FDR probe (ML2x Theta Probe, Delta-T Devices,
Cambridge, United Kingdom). The device was inserted from the top to a depth of 6 cm (length
of the prongs) into the soil surrounding the hood before the infiltration experiment. The average
of three measurements was used for further analysis.
6.3.5 Biotic parameters (earthworm biomass, above shoot and below biomass)
At depths of 0 and 20 cm earthworms were collected by handsorting. An area of 0.3 m²
and 10 cm deep was excavated and transferred into boxes. Earthworms were collected
immediately, stored and transported at approximately 4°C in closed plastic bags containing
moistened filter paper. The earthworms were identified to species and weighed. At 60 cm deep
it was not possible to dig out soil for handsorting because anecic earthworms were able to move
downwards. Therefore, we used the mustard extraction method for the determination of
earthworm biomass. Therefore, 25 g of mustard powder was mixed with 5 l of water by shaking
24 h before extraction. Before the application of the mustard solution to the soil surface another
5 l of water was added and mixed intensively. Afterwards, 2.5 l of the mustard solution was
sprinkled onto each macrocosm, repeated twice at 10 min intervals. After a total extraction time
of 30 min all collected earthworms were rinsed in fresh water and stored in separate plastic bags
containing moistened filter paper at 4°C (see above).
We analyzed earthworm biomass per soil depth (0, 25 and 55cm). Additionally, we
summed up the earthworm biomass at soil depth 0 and 25 cm, 25 and 60 cm, and for all depths
(0, 25 and 55 cm), first because of using different extraction methods, and second because of the
Variables Depths (cm) unit
Texture (sand, silt, clay) 10,20,30,60 %
Soil organic carbon 0-30 (5 cm steps) %
Bulk density 0-30 (5 cm steps) g/cm³
Earthworm biomass 0-10, 25-35, 55 g/m²
Plant biomass Soil surface g/m²
Root biomass 0-5, 5-10, 20-30, 30-40, 40-60 g/m²
Chapter 6
92
tremor caused by digging possible facilitate the movement of anecic earthworms into deeper
soil layers.
Community biomass was recorded in each plot in 20 x 50 cm rectangles shortly before
the infiltration measurements started. Two randomly allocated samples were taken. Plant
material was cut to a height of 3 cm aboveground. Plant and weed biomass were sorted into
plant functional groups, dried (70° C, 48 h) and weighed. Root biomass was taken with a 35 mm
root corer with 3 replicates per macrocosm up to a depth of 60 cm. Cores were divided into 6
layers (0-5, 5-10, 10-20, 20-30 and 40-60 cm). Layers pooled per macrocosm and washed with
tap water. Root biomass was dried at 65° C for 48h minimum before weighing.
6.3.6 Soil bulk density and organic carbon content
Shortly before the excavation of the lysimeters in November in 2011, three samples next
to the excavation area were taken using a split tube sampler with an inner diameter of 4.8 cm
(Eijkelkamp Agrisearch Equipment, Giesbeek, the Netherlands). After drying at 40°C the soil
samples were segmented depth resolutions from 5 cm up to 30 cm. All soil samples were passed
through a sieve with a mesh size of 2 mm. The samples were then dried at 105°C and weighed
to calculate the bulk density [g/cm3].
Total carbon concentration was analyzed on ball-milled subsamples (time 4 min,
frequency 30 s-1
) by an elemental analyzer at 1150°C (Elementaranalysator vario Max CN;
Elementar Analysensysteme GmbH, Hanau, Germany) before and after incubation. For the
calculation of organic carbon the difference between elemental analyses of the total carbon
concentration and soil inorganic carbon concentration was determined (Steinbeiss et al. 2008).
6.3.7 Statistical analysis
Statistical analyses were performed with a linear model using the statistical software R
2.6.2 (R Development Core team, http.//www.R-project.org). On infiltration capacity at soil
depths of 0, 25 and 55 cm, we tested the effects of the explanatory variables plant species
richness (SR; 4 and 16 species), soil texture (sand and clay, in %), earthworm biomass (BM ew,
g/m²), root biomass (BM root, g/m3) and total plant aboveground biomass (BM above, g/m²). To
identify the most important predictors of infiltration capacity we used the Akaike Information
Criterion (AIC) (Burnham and Anderson 1998). For the infiltration capacity in each depth,
variables from all depths (0, 25 and 60 cm) were tested. The model with the lowest AIC
containing one of the best fitting
variables was selected, and in a further step, the respective model was extended by additionally
fitting one of the rest variables in an alternative model until the AIC could not be improved
furthermore. Additionally, we used linear regression to test correlations between the biotic and
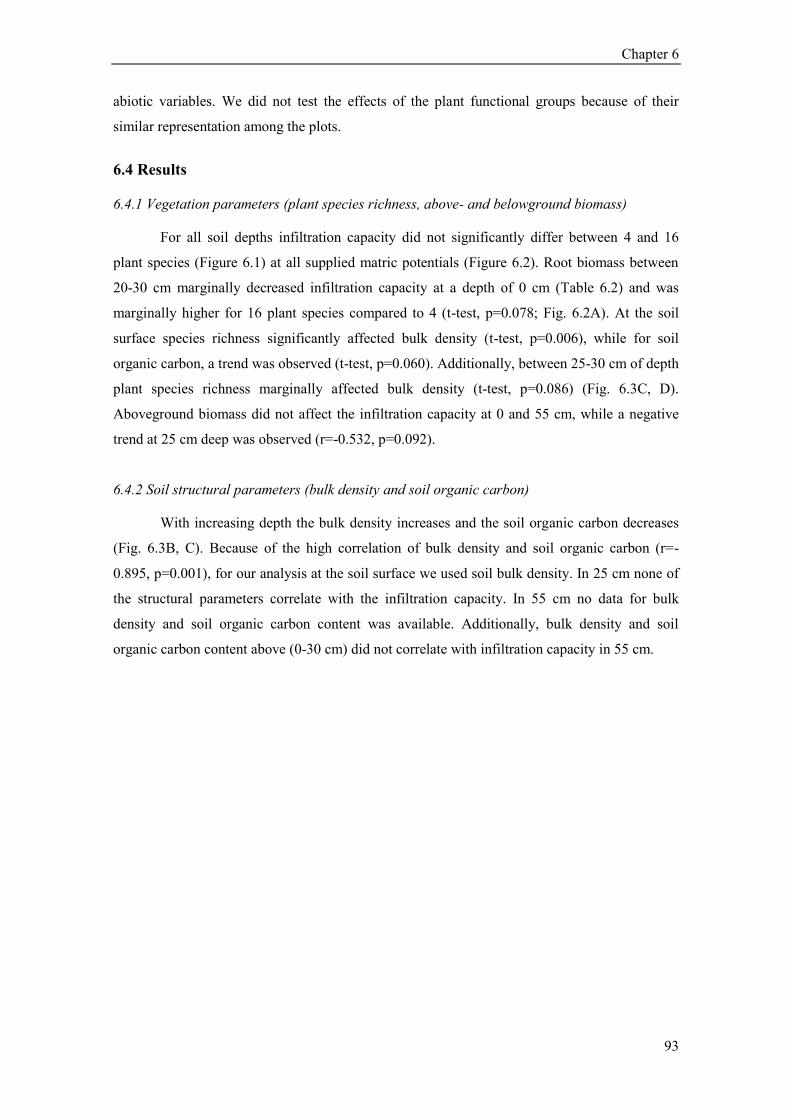
Chapter 6
93
abiotic variables. We did not test the effects of the plant functional groups because of their
similar representation among the plots.
6.4 Results
6.4.1 Vegetation parameters (plant species richness, above- and belowground biomass)
For all soil depths infiltration capacity did not significantly differ between 4 and 16
plant species (Figure 6.1) at all supplied matric potentials (Figure 6.2). Root biomass between
20-30 cm marginally decreased infiltration capacity at a depth of 0 cm (Table 6.2) and was
marginally higher for 16 plant species compared to 4 (t-test, p=0.078; Fig. 6.2A). At the soil
surface species richness significantly affected bulk density (t-test, p=0.006), while for soil
organic carbon, a trend was observed (t-test, p=0.060). Additionally, between 25-30 cm of depth
plant species richness marginally affected bulk density (t-test, p=0.086) (Fig. 6.3C, D).
Aboveground biomass did not affect the infiltration capacity at 0 and 55 cm, while a negative
trend at 25 cm deep was observed (r=-0.532, p=0.092).
6.4.2 Soil structural parameters (bulk density and soil organic carbon)
With increasing depth the bulk density increases and the soil organic carbon decreases
(Fig. 6.3B, C). Because of the high correlation of bulk density and soil organic carbon (r=-
0.895, p=0.001), for our analysis at the soil surface we used soil bulk density. In 25 cm none of
the structural parameters correlate with the infiltration capacity. In 55 cm no data for bulk
density and soil organic carbon content was available. Additionally, bulk density and soil
organic carbon content above (0-30 cm) did not correlate with infiltration capacity in 55 cm.
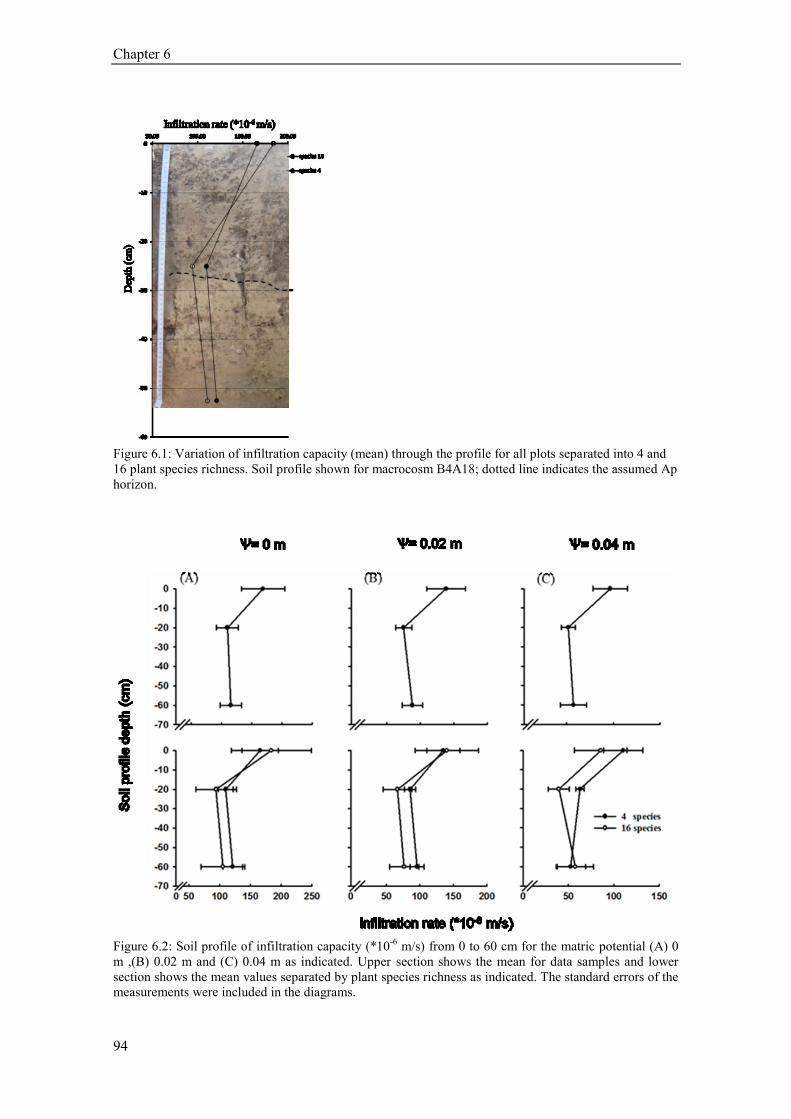
Chapter 6
94
Figure 6.1: Variation of infiltration capacity (mean) through the profile for all plots separated into 4 and
16 plant species richness. Soil profile shown for macrocosm B4A18; dotted line indicates the assumed Ap
horizon.
Figure 6.2: Soil profile of infiltration capacity (*10-6
m/s) from 0 to 60 cm for the matric potential (A) 0
m ,(B) 0.02 m and (C) 0.04 m as indicated. Upper section shows the mean for data samples and lower
section shows the mean values separated by plant species richness as indicated. The standard errors of the
measurements were included in the diagrams.

Chapter 6
95
Figure 6.3: Variation of A) root biomass (mg*cm-3
), B) bulk density (g*cm-3
) and C) soil organic carbon
content (%) through the profile for all plots separated into 4 and 16 plant species richness, soil profile
shown for macrocosm B4A04. Mean with ± Standard error.
Table 6.2: Person correlation (r) coefficients for infiltration capacity of ѰM=0, -0.02 and -0.04 m
including important variables from the model selection.
Significant effects are marked in bold. * p≤0.05, ** < 0.01, *** p=0.001
6.4.3 Earthworms
Because of different applied extraction methods and the movement of earthworms
during digging, the differences between the depths were not comparable. In sum the earthworm
biomass did not differ between the plant species. For analyzing the effects of earthworms on the
infiltration capacity the biomass was tested between 0 and 25 cm, as well as between 25 and 55
cm for the infiltration. Additionally, also the impact of earthworm biomass separated for each
depth on the infiltration capacity at 0, 25 and 55 cm was tested. Because of the small samples
size a separation into ecological groups and therefore analyzing the effect on infiltration
capacity was not possible (some values with zero). At the soil surface earthworm biomass
Variables Depth
(cm)
r
(ѰM= 0 m)
p r
(ѰM= 0.02 m)
p r
(ѰM= 0.04 m)
p
Earthworm biomass
0-10 0.652 0.030 * 0.620 0.042 * 0.496 0.121
Root biomass
0-5 0.263 0.435 0.391 0.235 0.406 0.215
5-10 -0.346 0.297 -0.415 0.204 -0.451 0.164
10-20 -0.351 0.289 -0.267 0.427 -0.312 0.351
20-30 -0.575 0.064 -0.607 0.048 -0.558 0.074
Chapter 6
96
extraction from the upper layer significantly correlated with the infiltration capacity at the soil
surface (Table 6.2). Earthworm biomass correlated marginally with the bulk density at 0-5 cm
depth (r=-0.55, p=0.079) and significant with the bulk density in 5-10 (r = -0.75, p = 0.008).
Additionally, earthworm biomass correlated with soil organic carbon at 0-5 cm depth (r=0.66,
p=0.025), 5-10 cm depth (r=0.70, p=0.024). Infiltration capacity for pores larger or equal than
1.5 mm increased significantly with total earthworm biomass (ѰM = 0, p = 0.030 and ѰM =
0.02m, p = 0.042). At the depths of 25 and 55 cm the earthworm biomass did not affect the
infiltration capacity.
6.4.4 Explanatory variables in 0, 25 and 55 cm depth
The most parsimonious model explaining the variation of infiltration capacity at the soil
surface contained earthworm biomass (total biomass) and root biomass at 20-30 cm for larger
macropores (ѰM = 0 and 0.02 , respectively > 1.5 mm and = 1.5 mm in diameter) (Table 6.3).
The infiltration capacity increased significantly with increasing earthworm biomass and and
decreased with root biomass. For smaller macropores (ѰM = 0.04m, <0.7 mm) none of the
observed variables could improve the model. For subsoil layers (25 and 55 cm), none of the
measured variables correlated to the infiltration capacity, respectively improved the model.
Additionally, soil texture and moisture did not affect the infiltration capacity at depths of 0, 25
and 55 cm.
6.4.5 Infiltration patterns and variability
The infiltration capacity at saturation decreased from 0 to 25 cm by 57 % and increased
marginally from 25 to 55 cm by 14 % for 4 and 16 plant species (Fig. 6.1). For smaller
macropores the infiltration capacity also decreased from 0 to 25 cm and increased slightly from
25 to 55cm (Fig. 6.2). For all applied matric potentials, plant species richness did not
significantly affect the infiltration capacity at several depths (Fig. 6.2 lower part). To investigate
the variability of infiltration capacity we compared the standard deviation of infiltration for all
samples and also separated samples of 4 and 16 plant species. At saturation the variation of
infiltration at saturation was highest at the soil surface and decreased up to a depth of 55 cm.
The variation was lowest at 55 cm deep compared to 25 cm deep. For ѰM =0.02 and 0.04 m the
variation was also highest at the soil surface and decreased to 25 and 55 cm (Table 6.4), while
the variation was lowest at 25 cm compared to 55 cm

Chapter 6
97
Tab. 6.3: Summary of best explanatory variables for the infiltration capacity (*10 -6
m/s) at 0 cm depth for
various ѰM (0, 0.02 and 0.04 m). Soil moisture (Moisture in %), earthworm biomass (in 0-10 cm depth)
and root biomass in 20-30 cm depth (BM root, g/m²).
Bold font indicates significant effects. Arrows indicate an increase (↑) or decrease (↓) of the infiltration capacity.
To test if patterns at the soil surface layer are dependent on deeper soil layers, we used
the Spearman rank correlation coefficient (rS) and Pearson correlation coefficient (r) to compare
topsoil (0 cm), with rooting zone (25 cm) and below rooting zone (55 cm). We did not find any
significant correlations between the infiltration capacity at 0 cm compared to 25 and 55 cm, and
25 to 55 cm (data not shown).
Tab. 6.4: Mean, Standard deviation (SD) and minimum (min) and maximum (max) values of infiltration
capacity (*10-6
m/s) for all plots at several matric potentials (0, 0.02 and 0.04m).
0cm ѰM= 0 m ѰM = 0.02 m ѰM = 0.04 m
all species richness
Mean (*10-6
m/s) 175.80 138.18 96.53
SD 120.87 95.05 60.59
Min/Max 50.43/457.74 40.38/ 329.42 33.78/ 194.99
20 cm
all species richness
Mean (*10-6
m/s) 101.35 74.84 50.02
SD 60.01 40.56 24.15
Min/Max 29.19/ 239.92 17.07/148.27 9.64/ 87.84
60 cm
all species richness
Mean (*10-6
m/s) 115.65 88.14 57.36
SD 58.27 50.41 46.44
Min/Max 35.56/ 233.25 16.38/198.82 4.54/ 142.17
Depth 0 cm ѰM = 0 m AIC
Variable t-value p-value
Intercept 3.721 0.006 139.65
1st Earthworm biomass 4.105 0.003 ↑ 135.11
2nd BM root (20-30 cm) -3.654 0.006 ↓ 123.69
R² 0.785
ѰM = 0.02 m
Intercept 3.841 0.005 132.97
1st Earthworm biomass -3.686 0.006 ↑ 128.55
2nd BM root (20-30 cm) -3.607 0.007 ↓ 117.61
R² 0.762
Chapter 6
98
6.5 Discussion
6.5.1 Factors explaining infiltration at the soil surface
In this study, measurements of infiltration capacity in several depths allows to obtaining
information of factors affecting infiltration capacity through the soil profile. Infiltration capacity
at the soil surface was mainly driven by earthworm biomass at matric potentials 0 and 0.02 m (≥
1.5 mm pore size diameter), with infiltration capacity increasing with earthworm activity.
Indeed, most earthworm burrows are larger than 2 mm in diameter (Edwards and Bohlen 1996).
This explains why only water flow through larger pores (≥1.5 mm), but not through smaller
pores was affected by the biomass of earthworms (Tab. 6.2).
This finding supports previous result measured in 2011 (Chapter 4) and at the first
glance differs from the measurement taken in 2012 (Chapter 5) at the field site. However, in fact
this result is not contradicting at all, but highlighting the considerable influence on earthworm
population dynamics and the presumably consequently different effect on infiltration capacity.
Other studies have shown that the earthworm population depends on soil moisture conditions
(Lavelle 1988, Edwards and Bohlen 1996). Our measurements in 2012 at the field site showed
that under dry soil conditions (soil moisture content: 17.85 ± 4.29%) earthworm biomass was
reduced compared to earthworm biomass in the year 2011 with wet soil conditions (soil
moisture content: 33.71 ± 4.29%; Chapter 5). However, in 2011 we could observe a significant
effect of earthworm biomass on the infiltration. In the Ecotron Experiment similar soil moisture
conditions (soil moisture content: 29.70 ± 2.56%) compared to 2011 leading probably to the
more pronounced effect of earthworm biomass on infiltration capacity. This finding supports
results from Berry and Jordan (2001) which shown that under high soil moisture content (30%)
earthworms developed faster and yielded in a higher biomass compared to earthworms in drier
soil conditions (20% and 25%). This support the fact, that under wet soil moisture conditions,
earthworm activity is increased and thus affecting infiltration capacity.
In this experiment bulk density and soil organic carbon between 5-10 cm deep were
correlated to the earthworm biomass. Generally, it is believed that earthworms have a positive
effect on the water flow through soils by changing the soil structure such as bulk density and
soil organic carbon content (Six et al. 2004, Bronick and Lal 2005). At the field site no
correlation between earthworm biomass and the soil bulk density (0-5 cm) was observed in the
same year (Chapter 5). This may be on the one hand caused by the much moister soil conditions
in the Ecotron compared to the field site, causing higher earthworm activity. On the other hand,
the extraction method at the Ecotron is also much more efficient compared to the octet method
used in the field (Eisenhauer et al. 2008b). Therefore, a correlation between earthworms and
bulk density could also have been undetected at the field size. In general our results highlight
that, while both earthworms and bulk density play an important role for infiltration capacity,

Chapter 6
99
their interrelation, could not yet be explained. It may by driven by earthworm presence and
population dynamics.
Bulk density was however related to species diversity, while soil carbon content as well
as root biomass (factors that explained bulk density and infiltration capacity in the field in
2012, Chapter 5) only showed a trend, It is however partly in line with the results in 2012,
where plant species richness affects improved soil structural parameters. However the link
between soil structural parameter on the infiltration was not observed, while soil structural
parameters between 5-10 cm soil deep affected earthworm biomass, which in turn affected the
infiltration capacity. Despite the low sample size, the results give a hint that at the soil surface
biotic factors play an important role for the infiltration capacity. Further investigations are
needed to obtain a clear picture of the combined effects and interactions of earthworms and soil
structural parameters on the infiltration capacity.
6.5.2 Factors explaining infiltration capacity over the depth profile
Infiltration capacity at deeper layers was lower and varied much less compared to the
topsoil. As shown above, a great deal of variation in infiltration capacity originates from biotic
factors. The small variation of infiltration capacity at depth indicates that these factors are no
more relevant. The bulk density was increased at 25 cm depth, indicating soil compaction
(plough pan), which can be a result of the destruction of inter-aggregate pores and may be
responsible for the reduced infiltration capacity. This is in agreement with (Horn et al. 1994).
The boundary between top and subsoil was also marked by a color change and reduced root
biomass (Figure 6.2). This zone is likely the result of ploughing before the establishment of the
Jena experiment which was formerly agricultural land (Roscher et al. 2004). At and below this
zone, bulk density increased, while soil organic carbon and root biomass decreased resulting in
a decreased infiltration capacity increasing soil depth (Figure 6.1 and 6.2). Since the field site
was not ploughed for the preceding 10 years, this denser layer is probably an old plough pan. In
our experiment this layer was found at approximately 30 cm of depth. Generally, plough pans
have high bulk densities with a reduced number of macropores and low connectivity of pores
which reduced root growth and earthworm activity (Goss et al. 1984, Reicosky and Archer
2007, Nawaz et al. 2013). This supports the idea that the compacted layer (old plough pan) at
around 25 cm of soil depth hampered penetration of earthworms and plant roots and thereby
eliminated possible biotic influences, which affect infiltration capacity. Surprisingly, not even
texture parameters explained the variation of infiltration capacity at the depths of 25 and 55 cm.
Even a decade after the conversion of arable land into grassland, soil compaction caused by
ploughing, reduced infiltration capacity at 30 cm below the soil surface.
Chapter 6
100
6.6 Conclusion
The aim of this chapter was to identify drivers of infiltration in different soil depths (soil
surface, within the rooting zone and below the rooting zone) in a grassland biodiversity
experiment that was formerly used as agricultural land. Our study shows that infiltration at the
soil surface was correlated with earthworm biomass, which was interrelated to soil structural
parameters such as bulk density and soil organic carbon at 5-10 cm depth. The different soil
moisture conditions in the field and in the plot of the Ecotron experiment probably lead to
increased activity of earthworms, which in turn also affected infiltration. Remarkably, in greater
depths none of the observed factors in the experiment played an important role for the measured
infiltration capacity.
Grasslands cover approximately one quarter of the world land area, contribute a high
percentage to the world agricultural area and store around 20% of the global terrestrial soil
carbon stocks (Ramankutty et al. 2008, Conant 2012). For grassland management and the
minimization of surface run-off and soil erosion, after 10 years of conversion from arable land
into grassland, at and below the observed compacted layer, biotic effects that impacted
infiltration at the soil surface are suppressed. When applying hydrological models we have to be
aware that anthropogenic impacts resulting in a compacted layer (plough pan) affects vertical
water flow besides above all other soil properties.

Chapter
7
Effects of soil depth on the estimation of saturated hydraulic
conductivity using pedotransfer functions (PTFs)


Chapter 7
103
7 Effects of soil depth on the estimation of saturated hydraulic conductivity using
pedotransfer functions (PTFs)
7.1 Abstract
Saturated hydraulic conductivity (Ks) is a crucial input parameter for modeling water
flow and solution transport through soils. Due to the spatial and temporal variation of Ks it is
difficult to measure. Based on these difficulties and when measured hydraulic conductivity is
not available, indirect methods such as pedotransfer functions (PTFs) were developed to use
easy to measure soil data. We evaluated the performance of various common published PTFs
for estimating Ks using available input data such as soil texture, bulk density and soil organic
carbon content. We compared the derived Ks with measured Ks values taken in a lysimeter study
(Ecotron Experiment, Montpellier, France) at several depths (soil surface, within the rooting
zone, below the main rooting zone). The measured Ks values were obtained by using a hood
infiltrometer. At the soil surface the best regression model for estimating Ks based on two input
parameters (earthworm biomass at the soil surface and root biomass in 20-30 cm depth). At
deeper soil layers (25 and 55 cm) all PTFs underestimated the mean values for all depths.
Regarding the root mean squared (RMSE) and Nash Sutcliffe Efficiency (NSE) values, all
applied PTFs used in this study, except to the Jabro model at the soil surface, are inadequate for
estimating Ks. For a sufficient application in hydrological models, estimation of Ks could be
improved by taken into account macroporosity in the PTFs.
7.2 Introduction
For understanding and modeling water flow and chemical transport in the vadose zone,
agriculture and environmental processes and how much water will runoff and causes soil
erosion, hydraulic conductivity is an important physical soil property (Shouse and Mohanty
1998). Generally, the determination of soil saturated hydraulic conductivity (Ks) is based on
direct and indirect methods. For the direct measurement of hydraulic conductivity, field
observations have shown that hydraulic conductivity is mainly controlled by the properties of
the porous media, such as size and connectivity of structural pores (Alaoui et al. 2011), and on
the measuring method (Durner and Lipsius 2006), soil type (Wösten and Van Genuchten 1988),
and on spatial variability (Russo and Bresler , Mallants et al. 1997). Next to these difficulties
direct methods are time consuming and expensive (Schaap et al. 1998). Additionally, due to the
soil heterogeneity and experimental error, results of these measurements are sometimes
unreliable (Schaap et al. 1998).
Based on these difficulties and when measured hydraulic conductivity is not available,
indirect methods such as pedotransfer functions (PTFs) were developed to use easy to measured
Chapter 7
104
soil data such as texture, bulk density and organic matter content for estimating hydraulic
properties (Hu et al. 2008). In summary, many efforts have been made to develop PTFs at large
scales at the soil surface (see review Wösten et al., 2001). In this study, we therefore investigate
the usability of available soil properties such as soil texure (sand, silt and clay content), bulk
density and soil organic carbon to predict Ks at the soil surface, within the rooting zone and
below the rooting zone. The objective of this study was to determine the applicability of some
recommended models in the literature, such as the Rosetta (Schaap et al. 1998), Jabro (1992)
and Vereecken (1990) PTFs, to calculate hydraulic conductivity for different soil textures and at
several depths. Additionally, we compared a derived model created with the best explanatory
variables at the soil surface. Furthermore, the differences between measured and calculated
values of Ks were evaluated using two statistical parameters: the mean square deviation
(RSME) and the Nash Sutcliffe Efficiency (NSE) parameter (Nash and Sutcliffe 1970, Tietje
and Tapkenhinrichs 1993). The main aim of this study was to answer the following question:
(i) Can we predict observed saturated hydraulic conductivity using the pedotransfer functions
(PTFs) at several depths?
7.3 Material and Methods
7.3.1 Experimental design
The monoliths originate from a temperate grassland site (Jena Experiment) located in
the floodplain of the Saale river near Jena (Germany; 50°55´N, 11°35´E, 130 m NN) (Roscher
et al. 2004). For more details about the conditions and experimental Ecotron station in
Montpellier see chapter 6.3.1.
7.3.2 Hydraulic conductivity
For the assessment of saturated hydraulic conductivity (Ks) we used a hood infiltrometer
(UGT, Müncheberg, Germany; method described in Schwärzel and Punzel (2007)). For each
macrocosm two measurements at each depth were conducted. For the calculation of hydraulic
conductivity see Chapter 2.2.2 Equation 1.3-1.9. For the measurement procedure see Chapter
6.3.2.
7.3.3 Soil parameters
The grain size distribution (soil texture) was determined from soil cores at depths of 10,
30 and 60 cm according to DIN/ISO 11277 (DIN ISO 2002). The determination of soil bulk
density and soil organic carbon content is described in detail in chapter 6.3.6. The soil organic
matter content is taken to be equal to 1.72 times the organic carbon content (in %).
Chapter 7
105
7.3.4 Models for estimating
Several published PTFs for Ks were used in this study (Table 7.1). Based on the
availability of the input data (texture, bulk density and soil organic carbon) four different PTFs
were chosen, beginning with a model based on neural network methods containing only soil
texture as input data (Rosetta SSC). For Rossetta SSC-BD bulk density was added. The model
by Jabro (1992) predicts saturated hydraulic conductivity of soil using silt, clay content and bulk
density. Sand content did not play a significant role for predicting hydraulic conductivity and
therefore was not included in the end model. Vereecken (1990) relates Ks to soil properties such
as clay, sand, and soil organic matter, as well as bulk density via empirical equations and
multivariate regression analysis.
7.3.5 Performance of models
In order to examine the performance of the PTFs, we compared calculated Ks with
measured Ks values at each depth. We used R², root mean square error (RMSE) and the Nash
Sutcliffe efficiency (NSE). The RSME gives the mean difference between measured and
calculated Ks values and is calculated by (Tietje and Tapkenhinrichs 1993):
RMSD=√
∑
(Equation 7.1)
where is the measured Ks value, is the calculated Ks value obtained with various models,
and n is the number of measurements.
The NSE compares the measured and the calculated Ks value and is calculated as (Nash and
Sutcliffe 1970):
NSE= ∑
∑
] (Equation 7.2)
where is the average of measured Ks values. The NSE determines the relative magnitude
of residual variance compared to the measured data variance, which indicates the fitting of
observed versus modelled values at the 1:1 line. The values can range from −∞ to 1. A value of
1 corresponds to a perfect match of modeled to measured values. Values between 0 and 1
indicate that the model calculations are as accurate as the mean of the measured data. When the
measured data is a better predictor than the calculated data, then the efficiency is less than zero
indicating unacceptable performance.

Chapter 7
106
Table 7.1: Pedotransfer functions and derived model for estimating Ks.
Author PTF mathematical expression
1.Schaap (1999, Rosetta
SSC)
Rosetta neural network requiring percentage sand, silt and
clay
2. Schaap (1999, Rosetta
SSC-BD)
Rosetta neural network requiring percentage sand, silt, clay
and bulk density
3. Jabro (1992) Log(Ks) (cm h
-1)= 9.56 - 0.81 (log silt) - 1.09 (log clay) -
4.64 (ρd)
4. Vereecken (1990) Ks(cm d
-1)=exp (20.62 - 0.96 (ln clay) - 0.66 (ln sand) -
0.46 (ln OM) – 8.43(ρd))
5. derived model Ks= 203.60 + 4.41 * ew biomass -140.37 * BM root ρd = bulk density, ew biomass = earthworm biomass in 0-10 cm, OM=organic matter, BM root = root biomass in 20-30 cm soil depth
7.4 Results
7.4.1 Ks model analysis
Based on the presence of the layer condition such as color, bulk density, soil organic
carbon content and root abundance we could determine three distinct layers: topsoil, plough pan
and subsoil (see chapter 6). Correlation tests showed that soil infiltration at saturation was
highly significant to earthworm biomass and plant root biomass, but not to texture (clay, silt and
sand content) (see chapter 6, Tab. 6.1). Using stepwise regression, the best model included two
variables: earthworm biomass at the soil surface and root biomass between 20-30 cm. The
regression results showed that these variables significantly explained the hydraulic conductivity
at the soil surface (Tab. 7.2). The predicted and observed Ks were plotted on a 1:1 line (Fig.
7.1). A linear trendline showed that observed and calculated data were highly correlated
(R²=0.57, p=0.023). For the subsoil layers, none variables explained the infiltration capacity and
therefore we could not develop a model.
7.4.2 Puplished PTFs and model comparison
Based on available input data from the Ecotron experiment (bulk density (ρd)), organic
matter (OM), silt (Si), clay (C) and sand (S)) various published PTFs for estimating Ks were
evaluated in this study (Tab. 7.1). Table 7.2 contains an overview of necessary input parameters
for the PTFs compared to this study. In order to evaluate the performance of the chosen PTFs
and the derived model in predicting Ks, the estimates were compared to the measured Ks values
at each depth (Tab. 7.3). The table shows the mean values for Ks with associated minimum
(Min) and maximum (Max) values at the various depths. Calculated and measured values
decreased with increasing depth. At the soil surface, the derived model using parameters from
the soil surface is slightly the best model for predicting Ks at this layer (R²=0.457, p=0.023).
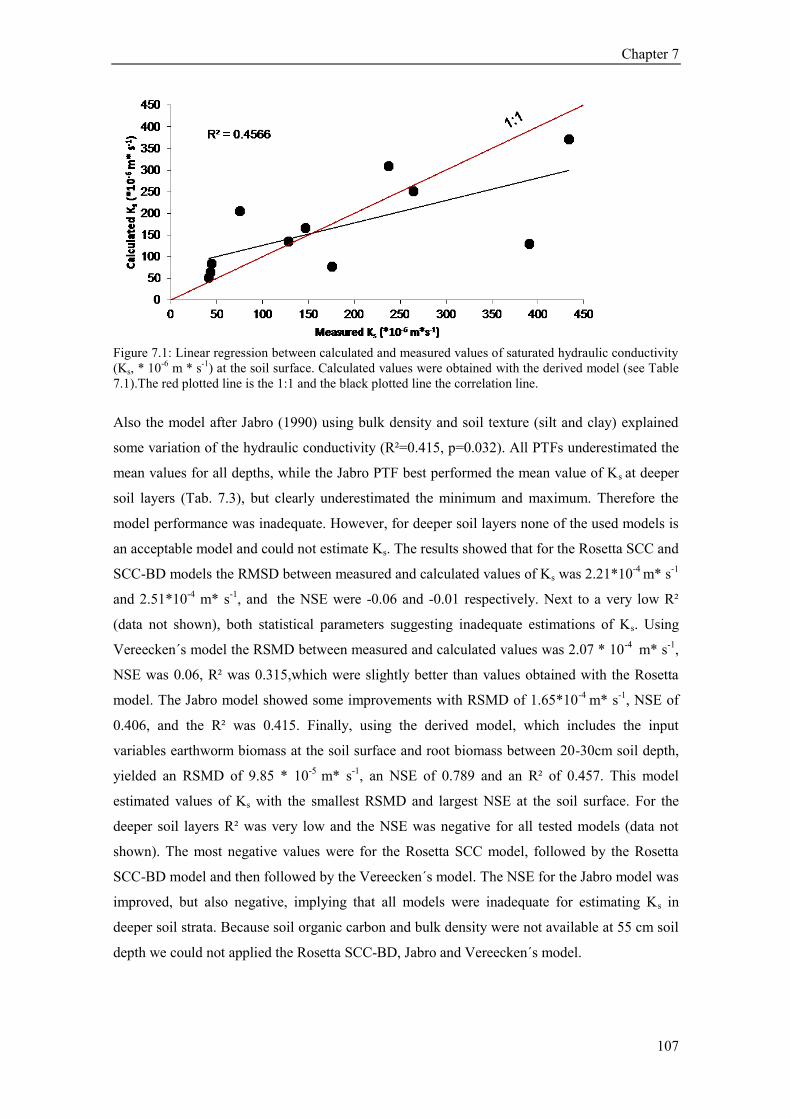
Chapter 7
107
Figure 7.1: Linear regression between calculated and measured values of saturated hydraulic conductivity
(Ks, * 10-6
m * s-1
) at the soil surface. Calculated values were obtained with the derived model (see Table
7.1).The red plotted line is the 1:1 and the black plotted line the correlation line.
Also the model after Jabro (1990) using bulk density and soil texture (silt and clay) explained
some variation of the hydraulic conductivity (R²=0.415, p=0.032). All PTFs underestimated the
mean values for all depths, while the Jabro PTF best performed the mean value of Ks at deeper
soil layers (Tab. 7.3), but clearly underestimated the minimum and maximum. Therefore the
model performance was inadequate. However, for deeper soil layers none of the used models is
an acceptable model and could not estimate Ks. The results showed that for the Rosetta SCC and
SCC-BD models the RMSD between measured and calculated values of Ks was 2.21*10-4
m* s-1
and 2.51*10-4
m* s-1
, and the NSE were -0.06 and -0.01 respectively. Next to a very low R²
(data not shown), both statistical parameters suggesting inadequate estimations of Ks. Using
Vereecken´s model the RSMD between measured and calculated values was 2.07 * 10-4
m* s-1
,
NSE was 0.06, R² was 0.315,which were slightly better than values obtained with the Rosetta
model. The Jabro model showed some improvements with RSMD of 1.65*10-4
m* s-1
, NSE of
0.406, and the R² was 0.415. Finally, using the derived model, which includes the input
variables earthworm biomass at the soil surface and root biomass between 20-30cm soil depth,
yielded an RSMD of 9.85 * 10-5
m* s-1
, an NSE of 0.789 and an R² of 0.457. This model
estimated values of Ks with the smallest RSMD and largest NSE at the soil surface. For the
deeper soil layers R² was very low and the NSE was negative for all tested models (data not
shown). The most negative values were for the Rosetta SCC model, followed by the Rosetta
SCC-BD model and then followed by the Vereecken´s model. The NSE for the Jabro model was
improved, but also negative, implying that all models were inadequate for estimating Ks in
deeper soil strata. Because soil organic carbon and bulk density were not available at 55 cm soil
depth we could not applied the Rosetta SCC-BD, Jabro and Vereecken´s model.
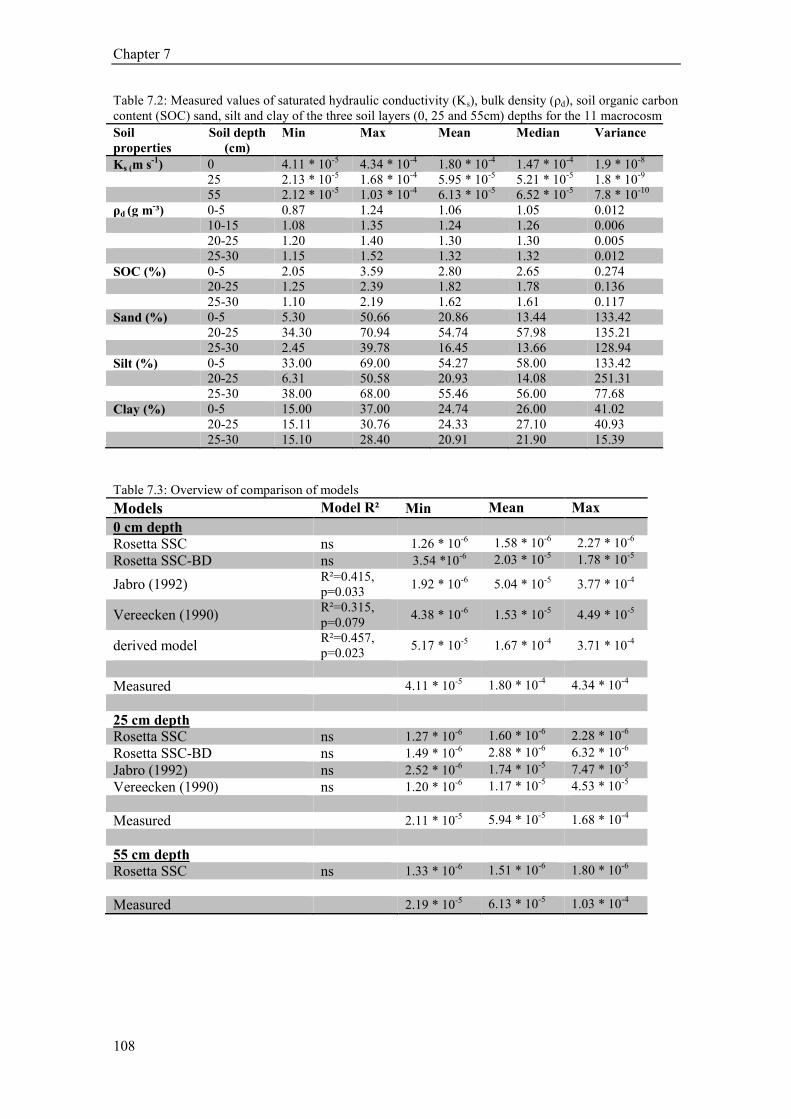
Chapter 7
108
Table 7.2: Measured values of saturated hydraulic conductivity (Ks), bulk density (ρd), soil organic carbon
content (SOC) sand, silt and clay of the three soil layers (0, 25 and 55cm) depths for the 11 macrocosm
Soil
properties
Soil depth
(cm)
Min Max Mean Median Variance
Ks (m s-1
) 0 4.11 * 10-5
4.34 * 10-4
1.80 * 10-4
1.47 * 10-4
1.9 * 10-8
25 2.13 * 10-5
1.68 * 10-4
5.95 * 10-5
5.21 * 10-5
1.8 * 10-9
55 2.12 * 10-5
1.03 * 10-4
6.13 * 10-5
6.52 * 10-5
7.8 * 10-10
ρd (g m-³) 0-5 0.87 1.24 1.06 1.05 0.012
10-15 1.08 1.35 1.24 1.26 0.006
20-25 1.20 1.40 1.30 1.30 0.005
25-30 1.15 1.52 1.32 1.32 0.012
SOC (%) 0-5 2.05 3.59 2.80 2.65 0.274
20-25 1.25 2.39 1.82 1.78 0.136
25-30 1.10 2.19 1.62 1.61 0.117
Sand (%) 0-5 5.30 50.66 20.86 13.44 133.42
20-25 34.30 70.94 54.74 57.98 135.21
25-30 2.45 39.78 16.45 13.66 128.94
Silt (%) 0-5 33.00 69.00 54.27 58.00 133.42
20-25 6.31 50.58 20.93 14.08 251.31
25-30 38.00 68.00 55.46 56.00 77.68
Clay (%) 0-5 15.00 37.00 24.74 26.00 41.02
20-25 15.11 30.76 24.33 27.10 40.93
25-30 15.10 28.40 20.91 21.90 15.39
Table 7.3: Overview of comparison of models
Models Model R² Min Mean Max
0 cm depth
Rosetta SSC ns 1.26 * 10-6
1.58 * 10-6
2.27 * 10-6
Rosetta SSC-BD ns 3.54 *10-6
2.03 * 10-5
1.78 * 10-5
Jabro (1992) R²=0.415,
p=0.033 1.92 * 10
-6 5.04 * 10
-5 3.77 * 10
-4
Vereecken (1990) R²=0.315,
p=0.079 4.38 * 10
-6 1.53 * 10
-5 4.49 * 10
-5
derived model R²=0.457,
p=0.023 5.17 * 10
-5 1.67 * 10
-4 3.71 * 10
-4
Measured 4.11 * 10-5 1.80 * 10
-4 4.34 * 10-4
25 cm depth
Rosetta SSC ns 1.27 * 10-6
1.60 * 10-6
2.28 * 10-6
Rosetta SSC-BD ns 1.49 * 10-6
2.88 * 10-6
6.32 * 10-6
Jabro (1992) ns 2.52 * 10-6
1.74 * 10-5
7.47 * 10-5
Vereecken (1990) ns 1.20 * 10-6
1.17 * 10-5
4.53 * 10-5
Measured 2.11 * 10-5
5.94 * 10-5
1.68 * 10-4
55 cm depth
Rosetta SSC ns 1.33 * 10-6
1.51 * 10-6
1.80 * 10-6
Measured 2.19 * 10-5
6.13 * 10-5
1.03 * 10-4
Chapter 7
109
7.5 Discussion
This study evaluated the application of various Pedotransfer functions (PTFs, Table 7.1)
at several soil depths (soil surface, within rooting zone, below the rooting zone). In our study
PTFs generally underestimated the real Ks at the soil surface and were inadequate at predicting
the Ks in deeper soil layers (Tab. 7.3). The calculated hydraulic conductivity matched
observations better, when bulk density and soil organic carbon are included, such as in the PTFs
after Jabro (1992) and Vereecken (1990). Probably because of the high correlation of bulk
density and soil organic matter (data not shown), adding soil organic matter in the Vereecken
model (1990) did not improve model estimation compared to the Jabro model. Furthermore,
other studies have shown that additional variables such as, water content at defined potentials,
can improve the accuracy of the prediction (Aimrun and Amin 2009, Alvarez-Acosta et al.
2012), but these extra variables also increase the amount of effort to obtain and requires their
availability (Tietje and Tapkenhinrichs 1993, Minasny et al. 1999). In our study we were not
able to test the improvement using water content at defined potential, because it not available.
The regression model shows that the relatively high measured Ks is affected, next to
bulk density, by earthworms and root biomass (at the depth interval of 20-30 cm). This may be
partly, because both earthworm and root biomass carry information on pore connectivity. On the
other hand, soil texture, bulk density and soil organic matter only provide information on pore
space but not on how pores are connectivity (Sobieraj et al. 2001).
7.6 Conclusion
The tested PTFs predicted Ks very poorly. Next to the high spatial variation of hydraulic
conductivity, the variation in pore structure is probably an important source of uncertainty for
the estimation. For all depths the used PTFs underestimated Ks. The performance of the PTFs
was improved by including additional data such as bulk density and soil organic matter. The
best regression model for estimating Ks at the soil surface is a two parameter regression model
(earthworm biomass at the soil surface and root biomass between 20-30 cm soil deep). At and
below the assumed plough layer predictions using texture, bulk density and soil organic carbon
content failed to predict Ks.


Chapter
8
General discussion

General discussion
113
8 General discussion
This thesis evaluated the main direct and indirect mechanisms by which plant
community, earthworms, soil structural parameters, soil texture and soil moisture and
earthworms affect infiltration capacity in a biodiversity grassland experiment (The Jena
Experiment). There is little research on understanding how these interrelated factors might
influence vertical soil water fluxes by modifying soil hydraulic properties. In order to improve
the understanding of factors affecting water flow through soil and their possible interactions I
conducted two field surveys (Chapter 4, chapter 5) along the relevant plant species gradient at
The Jena Experiment field site. In the third experiment we measured infiltration capacity on 11
monoliths with two diversity levels (4 and 16 plant species), originating from The Jena
Experiment site at several depths in the CNRS Ecotron, Montpellier (chapter 6 and 7). . In this
thesis, I distinguish between abiotic soil factors (texture), which are constant in time, and biotic
factors (soil fauna, ecosystem structure), which change dynamically depending on
environmental factors. The main results of this thesis are summarized in the framework of the
research questions formulated in Chapter 1 and summarized with a general perspective.
8.1 Synthesis
Soil hydraulic conductivity is an important input variable for process-based soil
hydrological models (Shouse and Mohanty 1998, Li et al. 2013). For a better understanding of
run-off processes, preferential flow and solution transport the characterization of factors
affecting of the spatial hydraulic conductivity is important (Shukla et al. 2006). It has been
suggested that presence of macropores and the connectivity of pores may influences the
infiltration pattern of soil (Durner and Lipsius 2006). There are a large number of studies for
understanding the water flow through, leading to controversial results. In this thesis the
orthogonal design of The Jena Experiment presents the opportunity to disentangling the effect
on infiltration pattern by plant species loss caused by human activity on a soil structural, texture
and earthworm gradient. I used this setup to address the question:
(1) Which factors shape soil hydraulic properties such as infiltration capacity? – Are
abiotic factors (soil texture) more important compared to biotic factors (earthworms,
plant and functional diversity, root biomass) for the infiltration through soil?
We found a relation between macropores formed by earthworms as well as structural
heterogeneity expressed as soil bulk density with the infiltration capacity (Chapter 4-7).
General discussion
114
Furthermore, results in 2012 showed that plant species richness and its increased root biomass
control bulk density leading to an increase of infiltration capacity (Chapter 5).
The different effects on infiltration capacity do not contradict each other. These separated
effects on infiltration capacity probably depended on seasonal changes in climate affecting the
dynamical patterns of the factors that could lead also to undiscovered interactions. Soil texture
and soil moisture had only subordinate effects on infiltration capacity (Chapter 4-7).
Usually, pore size distribution depends on soil type (Rawls et al. 1982), thus influences
the infiltration capacity through soil. Between clayey and sandy soil there are large differences
in pores size with fine pores in clayey and large pores in sandy soils, leading to a higher
infiltration capacity in sandy soils. Interestingly, legumes presumably reverse this texture effect
by forming additional pores resulting in a lower infiltration in sandy soils.
Biotic processes play a decisive role for explaining the variation of infiltration capacity.
Soil texture and soil moisture did not influence infiltration capacity.
Biotic influences on infiltration capacity are based on shaping pore sizes. In has been
shown that in many terrestrial ecosystems earthworms dominate the invertebrate biomass and
are the most important decomposer groups. They improving soil structure and affect infiltration.
Due to their burrowing and feeding behavior earthworms provide pathways for water flow and
play an important role in the formation of macro- and microaggregates (Lee 1985, Edwards and
Bohlen 1996, Six et al. 2004, Bronick and Lal 2005). For land management high Infiltration
capacity contribute to reduce run-off and soil erosion (Kladivko et al. 1986). I therefore asked
the question:
(2) Does earthworm activity increase infiltration capacity?
(3) How does the plant community influence earthworm activity?
The results of the study presented in Chapter 4-6 showed that with increasing
earthworm biomass the infiltration capacity increases. Smaller macropores (< 1.5 mm (Chapter
4 and 5) and <0.75mm (Chapter 6)) were not affected by earthworm biomass. Interestingly, the
effect of earthworm biomass on infiltration capacity was independent of the effect of bulk
density on infiltration capacity. However, a positive correlation between earthworms and soil
organic carbon content was found. This emphasized that earthworms probably acts on large
macropores, while changes in bulk density are due to other processes (possibly soil aggregation
as shown by Chappell et al. (1999) and Baumgartl and Horn (1991). Several studies suggested
that with increasing plant species and functional group diversity influenced earthworm density
due to the amount and quality of plant residues (Edwards and Bohlen 1996, Hector et al. 1999,
Hooper et al. 2005). Only few studies found an increase of earthworm density with increasing
General discussion
115
plant species (Zaller and Arnone 1999, Spehn et al. 2000) or no response (Gastine et al. 2003).
My study shows not plant species and functional group diversity, but certain plant functional
groups such as legumes and grasses affected earthworm performance (Eisenhauer and Scheu
2008a) (Chapter 4). Remarkably, in absence of earthworm growing grass root presumably
clogged soil pores and thus reduced the infiltration capacity (Chapter 4). Earthworm biomass
explained independently of plant species richness, soil bulk density and porosity some variation
of the infiltration capacity which indicates uncoupled effects on the infiltration capacity. The
responses of earthworm on plant community measures and their effect on infiltration capacity
were not uniform. This suggests that the dynamic of earthworm populations which is, besides
soil and ecosystem properties, also affected by the climate conditions (such as rainfall). This
plays an important role for infiltration and the resulted interactions with other factors.
Infiltration capacity was affected by earthworm biomass. With increasing earthworm
biomass the infiltration also increases. This effect was independent of bulk density.
Besides earthworms, microbial activity improves soil structure, leading to soil
aggregates and a larger pore spectrum. Generally, it is known that biological activity is higher
on higher plant species richness plots leading to higher carbon content, decreased bulk density
and increased porosity (Zacharias and Wessolek 2007; Périé and Ouimet 2008). Other studies
have shown that an increase in soil organic matter content lead to a higher pore development,
which increased soil aggregate stability, water holding rate and water infiltration through soil
(Berglund et al. 1980; Haynes and Naidu 1998; Franzluebbers 2002). The stability of soil
aggregates and the pores between the aggregates improve infiltration, drainage and storage of
water (Lee and Foster 1991; Bronick and Lal 2005). Also, investigations on the influence of
vegetation on soil hydraulic properties are often focused on soil management or topography
(Schwartz et al. 2003, Bodhinayake and Cheng Si 2004, Bodner et al. 2008). Therefore, there is
no investigation on how ecosystem properties, especially species diversity, may reflect on soil
hydraulic properties. I therefore investigated the following questions:
(4) Do patterns in soil organic carbon content, induced by biodiversity gradients, relate
to structural parameters bulk density and porosity?
(5) Do those parameters affect infiltration capacity?
As explained above earthworms had no influence on bulk density. However, bulk
density was related to plant species diversity.
Furthermore, we could show that plant species diversity influenced vertical soil water fluxes by
modifying soil structural parameters such as bulk density and porosity (Chapter 5, 6). In the last
10 years soil structural parameters (here soil bulk density) correlated in more than half of the

General discussion
116
observed years with plant species richness. This suggests that infiltration capacity is often
affected by plant species diversity, whereas in some years other processes (potentially
earthworms) play a more important role for explaining infiltration capacity. For example 2012
was characterized by a dry autumn and we found a more pronounced effect of plants species
diversity on infiltration capacity. This was accompanied by reduced earthworm activity due the
dry soil. After 10 years after conversion of an arable land into grassland, the infiltration capacity
at the soil surface for higher plant species richness plots was comparable to the natural
composition (reference plots-r) plots. In contrast, bare ground plots were similar to plots
containing lower plant species (Fig. 8.1).
Besides earthworms, soil structural parameters such as soil bulk density and porosity
affect the infiltration capacity. However, both are not correlated to each other. Plant
diversity indirectly increased infiltration by improving soil structural parameters.
Figure 8.1: Relationship between species richness (0, 1, 2, 4, 8, 16, and 60 plant species) and Reference
plots (r) for A) infiltration capacity (log*10-6 m/s), B) Porosity (%) and C) Bulk density (g/cm³).

General discussion
117
Most of the observations were conducted at the soil surface, indicating how much water
can enter the soil. The last part of this research was dedicated to understand the further heritage
of the infiltrated water. Water flow in macropores formed by earthworms and plant roots are
crucial for the prediction of soil run-off and soil erosion (Beven and Germann 1982, Weiler and
Naef 2003). Next to the initiation of water flow into macropores at the soil surface, it has been
suggested that in addition, also subsurface connected macropores could play an important role
in explaining water flow through soil (Ela et al. 1992, Kladivko 2001). I therefore asked:
(6) Do the observed factors influencing soil hydraulic properties at the soil surface also
affect infiltration into deeper soil strata? What factors are important drivers for the
infiltration at several depths?
The observed influence of biotic (earthworm and root biomass) and soil structural
parameters (soil bulk density and soil organic carbon content) at the soil surface played no role
at and below the plough pan (Chapter 6). Above this compacted layer we observed much greater
variation in the infiltration capacity, compared to below. In our study none of the observed
variables could explain the infiltration capacity in deeper soil strata. After 10 years after the
conversion of arable into grassland, soil surface biotic factors, such as soil structural parameters
which are affected by plant diversity and earthworms, could not counteract the compaction in
20–30 cm soil depth, caused by anthropogenic impact. In none of the observed depths, soil
texture was a relevant factor for explaining infiltration capacity.
At the soil surface bulk density, earthworm biomass, soil organic carbon and root biomass
were highly correlated to the infiltration capacity. At and below the plough pan none of
the observed variables, neither soil texture could explain the infiltration pattern. Higher
infiltration at the soil surface not implies a higher infiltration in deeper soil strata.
For the measurement of saturated hydraulic conductivity, direct methods (in situ or in
the laboratory) are particularly difficult, expensive and time intensive (Schaap et al. 1998,
Aimrun and Amin 2009). Therefore, indirect methods such as pedotransfer functions (PTFs)
were developed using easy to measure soil properties such as texture, soil bulk density and soil
organic matter for calculating hydraulic conductivity (Schaap et al. 2001, Wösten et al. 2001).
The estimation of hydraulic conductivity is an important variable in hydrological models for
evaluating water flow, water relationship for plant growth and chemical transport processes
needed in agriculture and engineering applications (Shouse and Mohanty 1998, Wösten et al.
2001). I therefore asked the question:

General discussion
118
(7) Can we predict observed saturated hydraulic conductivity using the pedotransfer
functions (PTFs) at several depths?
In this study, we investigated the utility of available soil properties (texture, soil organic
contant and bulk density to estimate the saturated hydraulic conductivity (Ks) at several depths.
The performance of well-common known PTFs such as Rossetta, Jabro and Vereecken were
tested. We calculated and compared the hydraulic conductivity conducted on 11 lysimeter,
because there the depth distributions of factors that are important for the infiltration capacity
(e.g. root biomass) were available, and Ks could be assessed at several depths. The best
regression model for estimating the soil saturated hydraulic conductivity at the soil surface
showed that biotic factors from deeper soil layers and earthworms from the topsoil (0-10 cm)
play an important role. This implies that probably larger and longer connected pores up to the
plough pan play an important role for the hydraulic conductivity at the soil surface.
Additionally, this emphasized (as shown in Chapter 5) the independent role to bulk density of
earthworms on the infiltration capacity.
At and below the old plough layer predictions using PTFs based on soil texture, bulk
density and soil organic carbon content were very uncertain. At the soil surface the pedotransfer
function after Jabro (1990) explained 41% of the measured variation of Ks. In general, models
including bulk density could better explain the measured hydraulic conductivity. For a sufficient
application in hydrological models, estimation of Ks could be improved by accounting for roots.
Predicting hydraulic conductivity near saturation remains difficult and uncertain for all
soil layers. PTFs including soil structure are better in estimating soil hydraulic
conductivity, but other biotic factors such as earthworms activity and roots are also
important.
8.2 General Perspectives
At present heavy rainfalls inducing flooding events occur more often leading to a higher
risk of run-off and soil erosion (IPCC 2012). For soil conservation, hydraulic properties such as
infiltration capacity are a very important soil quality indicator reflecting soil conditions. The
change of the soil infiltration capacity by inadequate land-use and land-management is
connected to a loss
of biodiversity (including plant and soil fauna diversity), resulting in negative impact on soil
erosion and surface run-off (Pimentel and Kounang 1998, Tilman et al. 2002, Haines-Young
2009). A high infiltration of soil is important to reduced soil erosion and diminishes the impact
of temporal flooding during high precipitation events (Mannering and Meyer 1963).
The results of this thesis show that the infiltration capacity is affected on the one hand
by large macropores formed by earthworms and on the other hand by plant species diversity,

General discussion
119
which improves soil structural parameters such as bulk density. Both effects can act together
with the strength of their effects depending on other environmental conditions such as climate
(Figure 8.2). For example, in 2012 we observed a strong influence of species diversity (and
hence bulk density), and only a small influence of earthworms on infiltration capacity, probably
in this year climate conditions suppressed earthworm activity.
The results of the thesis indicate that the positive effects of plant diversity at the soil
surface were not transferred into deeper soil layers. For drainage, crop production and water
management a plough layer is problematic. Further work is needed to find solutions for
appropriate measures to minimize risks of subsoil compaction. Therefore, variation of the depth
of ploughing, conversation tillage, incorporating a combination of plants with deep tap and
fibrous roots could improve or correct the subsoil compaction (Ishaq et al. 2001, Hassan et al.
2007). For the estimation of soil hydraulic conductivity at the soil surface and the application in
hydrological models information about soil structure properties are essential.
In summary, this study shows that vegetation cover and earthworms influence explain
patterns of infiltration capacity, although different patterns have been observed in different
years. Measurements in The Jena Experiment on several gradients were an opportunity to
discover these influences, because they allowed for distinguishing interacting effects on the
infiltration capacity. Within the last decades several studies have shown that grassland
biodiversity supports and regulates ecosystem services such as primary productivity, nutrient
cycling, stability and carbon storage (Roscher et al. 2004; Hooper et al. 2005; Cardinale et al.
2007; Steinbeiss et al. 2008; Bessler et al. 2009; Weigelt et al. 2010). Here, I show that species
diversity may also provide an ecosystem service related to erosion and flood prevention by
providing higher infiltration capacity, although this effect varies between years. Despite the
temporal and spatial variation of infiltration capacity, my results underline that biotic influences
on soil hydraulic properties over a longer period of time sustain and improve ecosystem services
and functioning. This study shows that earthworms (then also legumes and grasses play a role)
and plant species diversity (then soil structural parameters play a role) are relevant for
explaining variation in infiltration capacity. Open questions relate to the cause for different
drivers in different years (earthworms vs. productivity).
Further studies on a similar statistical plot design are necessary for observing the single and
interaction effects of earthworms and bulk density and accordingly in which environmental
condition one or both of these factors play a role maintaining ecosystem services and
functioning.

General discussion
120
Figure 8.2: Summary of probable and hypothetical mechanisms by which plant species richness, plant
functional groups, plant roots, earthworms and soil structural parameters such as soil organic carbon, bulk
Figure 8.2: Scheme of probable and hypothetical effects of climate, soil texture, plant species richness,
plant functional groups, plant roots, earthworms and soil structural parameters such as soil organic carbon
and porosity on infiltration capacity.

References
121
9. References
Abbott I. and Parker C. A. (1981) Interactions between earthworms and their soil environment.
Soil Biology and Biochemistry 13: 191-197.
Ad-hoc-AG Boden (2005) Bodenkundliche Kartieranleitung. 5. Auflage, Hannover.
Aimrun W. and Amin M. S. M. (2009) Pedo-transfer function for saturated hydraulic
conductivity of lowland paddy soils. Paddy and Water Environment 7: 217-225.
Alaoui A., Lipiec J. and Gerke H. H. (2011) A review of the changes in the soil pore system due
to soil deformation: A hydrodynamic perspective. Soil and Tillage Research 115–116:
1-15.
Altieri M. A. (1999) The ecological role of biodiversity in agroecosystems. Agriculture,
Ecosystems & Environment 74: 19-31.
Alvarez-Acosta C., Lascano R. J. and Stroosnijder L. (2012) Test of the rosetta pedotransfer
function for saturated hydraulic conductivity. Open Journal of Soil Science 2: 203-212.
Angers D. A. and Caron J. (1998) Plant-induced Changes in Soil Structure: Processes and
Feedbacks. Biogeochemistry 42: 55-72.
Angulo-Jaramillo R., Vandervaere J.-P., Roulier S., Thony J.-L., Gaudet J.-P. and Vauclin M.
(2000) Field measurement of soil surface hydraulic properties by disc and ring
infiltrometers: A review and recent developments. Soil and Tillage Research 55: 1-29.
Ankeny M. D., Kaspar T. C. and Horton R. (1990) Characterization of Tillage and Traffic
Effects on Unconfined Infiltration Measurements. Soil Science Society of America
Journal 54: 837-840.
Archer N. A. L., Quinton J. N. and Hess T. M. (2002) Below-ground relationships of soil
texture, roots and hydraulic conductivity in two-phase mosaic vegetation in South-east
Spain. Journal of Arid Environments 52: 535-553.
Aslyng H. (1963) Soil physics terminology. International Union of Soil Sciences 23.
Azooz R. H. and Arshad M. A. (1996) Soil infiltration and hydraulic conductivity under long-
term no-tillage and conventional tillage systems. Canadian Journal of Soil Science 76:
143-152.
Bardgett R. D., Anderson J. M., Behan-Pelletier V., Brussaard L., Coleman D. C., Ettema C.,
Moldenke A., Schimel J. P. and Wall D. H. (2001) The Influence of Soil Biodiversity
on Hydrological Pathways and the Transfer of Materials between Terrestrial and
Aquatic Ecosystems. Ecosystems 4: 421-429.
Barley K. P. (1954) Effects of Root Growth and Decay on the Permeability of A Synthetic
Sandy Loam. Soil Science 78: 205-210.
Barnes P. W. and Harrison A. T. (1982) Species distribution and community organization in a
Nebraska Sandhills mixed prairie as influenced by plant/soil-water relationships.
Oecologia 52: 192-201.
Bastardie F., Capowiez Y., de Dreuzy J. R. and Cluzeau D. (2003) X-ray tomographic and
hydraulic characterization of burrowing by three earthworm species in repacked soil
cores. Applied Soil Ecology 24: 3-16.
Baumgartl T. and Horn R. (1991) Effect of aggregate stability on soil compaction. Soil and
Tillage Research 19: 203-213.
Bens O., Wahl N., Fischer H. and Hüttl R. (2007) Water infiltration and hydraulic conductivity
in sandy cambisols: impacts of forest transformation on soil hydrological properties.
European Journal of Forest Research 126: 101-109.
Berglund E. R., Ahyoud A. and Tayaa M. H. (1980) Comparison of soil and infiltration
properties of range and afforested sites in northern Morocco. Forest Ecology and
Management 3: 295-306.
Berry E. C. and Jordan D. (2001) Temperature and soil moisture content effects on the growth
of Lumbricus terrestris (Oligochaeta: Lumbricidae) under laboratory conditions. Soil
Biology and Biochemistry 33: 133-136.
Bessler H., Temperton V. M., Roscher C., Buchmann N., Schmid B., Schulze E.-D., Weisser W.
W. and Engels C. (2009) Aboveground overyielding in grassland mixtures is associated
with reduced biomass partitioning to belowground organs. Ecology 90: 1520-1530.
References
122
Beven K. (1981) Micro-, Meso-, Macroporosity and Channeling Flow Phenomena in Soils. Soil
Science Society of America Journal 45: 1245-1245.
Beven K. and Germann P. (1982) Macropores and water flow in soils. Water Resources
Research 18: 1311-1325.
Beven K. and Germann P. (2013) Macropores and water flow in soils revisited. Water
Resources Research 49: 3071-3092.
Blackburn W. H. (1975) Factors influencing infiltration and sediment production of semiarid
rangelands in Nevada. Water Resources Research 11: 929-937.
Blanchart E., Lavelle P., Braudeau E., Le Bissonnais Y. and Valentin C. (1997) Regulation of
soil structure by geophagous earthworm activities in humid savannas of Côte d'Ivoire.
Soil Biology and Biochemistry 29: 431-439.
Blanchart E., Albrecht A., Brown G., Decaens T., Duboisset A., Lavelle P., Mariani L. and
Roose E. (2004) Effects of tropical endogeic earthworms on soil erosion. Agriculture,
Ecosystems & Environment 104: 303-315.
Boden A.-h.-A. (2005):Bodenkundliche Kartieranleitung. Hannover
Bodhinayake W. and Cheng Si B. (2004) Near-saturated surface soil hydraulic properties under
different land uses in the St Denis National Wildlife Area, Saskatchewan, Canada.
Hydrological Processes 18: 2835-2850.
Bodner G., Loiskandl W., Buchan G. and Kaul H. P. (2008) Natural and management-induced
dynamics of hydraulic conductivity along a cover-cropped field slope. Geoderma 146:
317-325.
Bonsu M. (1992) A study of a texture-based equation for estimating the saturated hydraulic
conductivity of an alfisol in the sudan savannah ecological zone, Ghana. Hydrological
Sciences Journal 37: 599-606.
Bouché M. B. (1977) Strategies lombriciennes. Ecological Bulletins: 122-132.
Bouché M. B. and Al-Addan F. (1996) Earthworms, water infiltration and soil stability: Some
new assessments. Soil Biology and Biochemistry 29: 441-452.
Bronick C. J. and Lal R. (2005) Soil structure and management: a review. Geoderma 124: 3-22.
Brown G. (1995) How do earthworms affect microfloral and faunal community diversity? Plant
and Soil 170: 209-231.
Buckingham, E. (1907) Studies on the movement of soil moisture. Bulletin 38. USDA Bureau
of Soils, Washington, DC.
Bundt M., Widmer F., Pesaro M., Zeyer J. and Blaser P. (2001) Preferential flow paths:
biological ‘hot spots’ in soils. Soil Biology and Biochemistry 33: 729-738.
Burnham K. and Anderson D. (1998) Model selection and inference a practical information
theoretic approach. Springer, Berlin , Heidelberg, New York
Cerdà A. (1996) Seasonal variability of infiltration rates under contrasting slope conditions in
southeast Spain. Geoderma 69: 217-232.
Chan K. Y. (2004) Impact of tillage practices and burrows of a native Australian anecic
earthworm on soil hydrology. Applied Soil Ecology 27: 89-96.
Chappell N. A., Ternan J. L. and Bidin K. (1999) Correlation of physicochemical properties and
sub-erosional landforms with aggregate stability variations in a tropical Ultisol
disturbed by forestry operations. Soil and Tillage Research 50: 55-71.
Conant R. (2012) Grassland Soil Organic Carbon Stocks: Status, Opportunities, Vulnerability.
In: R Lal, K Lorenz, R F Hüttl, B U Schneider and J von Braun (eds) Recarbonization
of the Biosphere. Springer Netherlands
Coupland R. T. and Johnson R. E. (1965) Rooting Characteristics of Native Grassland Species
in Saskatchewan. Journal of Ecology 53: 475-507.
Darcy H. (1856) Les fontaines publiques de la ville de Dijon. V. Dalmont
Darwin C. (1882) The formation of vegetable mould through the action of worms : with
observations on their habits / by Charles Darwin. J. Murray, London
Deb S. K. and Shukla M. K. (2012) Variability of hydraulic conductivity due to multiple
factors. American Journal of Environmental Sciences 8: 489-502.

References
123
Dec D., Dorner J., Becker-Fazekas O. and Horn R. (2008) Effect of bulk density on hydraulic
properties of homogenized and structured soils. Revista de la ciencia del suelo y
nutrición vegetal 8: 1-13.
Dekker L. W. and Ritsema C. J. (1994) How water moves in a water repellent sandy soil: 1.
Potential and actual water repellency. Water Resource Research 30: 2507-2517.
Dexter A. R. (1988) Advances in characterization of soil structure. Soil and Tillage Research
11: 199-238.
DIN ISO (2002) Bodenbeschaffenheit – Bestimmung der Partikelgrößenverteilung in
Mineralböden – Verfahren mittels Siebung und Sedimentation. Beuth-Verlag GmbH
Berlin
Duraiappah A. K., Naeem, S. (2005) Millennium Ecosystem Assessment.Ecosystems and
human well-being: Biodiversity Synthesis World Resources Institute, Washington DC,
US
Durner W. and Lipsius K. (2006) Determining Soil Hydraulic Properties. Encyclopedia of
Hydrological Sciences. John Wiley & Sons, Ltd
Edwards C. A. and Bohlen P. J. (1996) The biology and ecology of earthworms. Chapman and
Hall, London
Edwards W. M., Shipitalo M. J., Owens L. B. and Norton L. D. (1990) Effect of Lumbricus
terrestris L. burrows on hydrology of continuous no-till corn fields. Geoderma 46: 73-
84.
Edwards W. M., Shipitalo M. J., Traina S. J., Edwards C. A. and Owens L. B. (1992) Role of
Lumbricus terrestris (L.) burrows on quality of infiltrating water. Soil Biology and
Biochemistry 24: 1555-1561.
Ehlers W. (1975) Observations on Earthworm Channels and Infiltration on Tilled and Untilled
Loess Soil. Soil Science 119: 242-249.
Eisenhauer N. and Scheu S. (2008a) Earthworms as drivers of the competition between grasses
and legumes. Soil Biology and Biochemistry 40: 2650-2659.
Eisenhauer N., Straube D. and Scheu S. (2008b) Efficiency of two widespread non-destructive
extraction methods under dry soil conditions for different ecological earthworm groups.
European Journal of Soil Biology 44: 141-145.
Eisenhauer N., Milcu A., Sabais A. C. W. and Scheu S. (2008c) Animal Ecosystem Engineers
Modulate the Diversity-Invasibility Relationship. PLoS ONE 3: e3489.
Eisenhauer N., Milcu A., Nitschke N., Sabais A., Scherber C. and Scheu S. (2009a) Earthworm
and belowground competition effects on plant productivity in a plant diversity gradient.
Oecologia 161: 291-301.
Eisenhauer N., Milcu A., Sabais A. C. W., Bessler H., Weigelt A., Engels C. and Scheu S.
(2009b) Plant community impacts on the structure of earthworm communities depend
on season and change with time. Soil Biology and Biochemistry 41: 2430-2443.
Eisenhauer N., Milcu A., Sabais A. C. W., Bessler H., Brenner J., Engels C., Klarner B.,
Maraun M., Partsch S., Roscher C., Schonert F., Temperton V. M., Thomisch K.,
Weigelt A., Weisser W. W. and Scheu S. (2011) Plant Diversity Surpasses Plant
Functional Groups and Plant Productivity as Driver of Soil Biota in the Long Term.
PLoS ONE 6: e16055.
Ela S. D., Gupta S. C. and Rawls W. J. (1992) Macropore and Surface Seal Interactions
Affecting Water Infiltration into Soil. Soil Science Society of America Journal 56: 714-
721.
Ellenberg H. and Leuschner C. (2010) Vegetation Mitteleuropas mit den Alpen: In
ökologischer, dynamischer und historischer Sicht. Ulmer Verlag, Stuttgart
FAO-Unesco (1997) Soil map of the world. Revised legend with corrections and update,
Wageningen
Fargione J. E. and Tilman D. (2005) Diversity decreases invasion via both sampling and
complementarity effects. Ecology Letters 8: 604-611.
Flury M., Flühler H., Jury W. A. and Leuenberger J. (1994) Susceptibility of soils to
preferential flow of water: A field study. Water Resources Research 30: 1945-1954.
References
124
Fonte S. J., Winsome T. and Six J. (2009) Earthworm populations in relation to soil organic
matter dynamics and management in California tomato cropping systems. Applied Soil
Ecology 41: 206-214.
Fornara D. A. and Tilman D. (2008) Plant functional composition influences rates of soil carbon
and nitrogen accumulation. Journal of Ecology 96: 314-322.
Franzluebbers A. J. (2002) Water infiltration and soil structure related to organic matter and its
stratification with depth. Soil and Tillage Research 66: 197-205.
Fuentes J. P., Flury M. and Bezdicek D. F. (2004) Hydraulic Properties in a Silt Loam Soil
under Natural Prairie, Conventional Till, and No-Till. Soil Science Society of America
Journal 68: 1679-1688.
Gastine A., Scherer-Lorenzen M. and Leadley P. W. (2003) No consistent effects of plant
diversity on root biomass, soil biota and soil abiotic conditions in temperate grassland
communities. Applied Soil Ecology 24: 101-111.
Gaston K. J. and Spicer J. I. (2004) Biodiversity: An Introduction. Wiley
Germann P. and Beven K. (1981) Water flow in soil macropores I. An experimental approach.
Journal of Soil Science 32: 1-13.
Gijsman A. J. and Thomas R. J. (1996) Evaluation of some physical properties of an oxisol after
conversion of native savanna into legume-based or pure grass pastures. Tropical
Grasslands 30: 237-248.
Gish T. J. and Jury W. A. (1983) Effect of plant root channels on solute transport. Trans. Am.
Soc. Agric. Eng. 26: 440-444.
Goss M. J., Ehlers W., Boone F. R., White I. and Howse K. R. (1984) Effects of soil
management practice on soil physical conditions affecting root growth. Journal of
Agricultural Engineering Research 30: 131-140.
Gotelli N. J. and Colwell R. K. (2001) Quantifying biodiversity: procedures and pitfalls in the
measurement and comparison of species richness. Ecology Letters 4: 379-391.
Grace J. (2006) Structural Equation Modeling and Natural Systems. Cambridge University
Press
Grevers M. C. J. and Jong E. D. (1990) The characterization of soil macroporosity of a clay soil
under ten grasses using image analysis. Canadian Journal of Soil Science 70: 93-103.
Gyssels G. and Poesen J. (2003) The importance of plant root characteristics in controlling
concentrated flow erosion rates. Earth Surface Processes and Landforms 28: 371-384.
Haines-Young R. (2009) Land use and biodiversity relationships. Land Use Policy 26: S178-
S186.
Hale C., Frelich L., Reich P. and Pastor J. (2005) Effects of European Earthworm Invasion on
Soil Characteristics in Northern Hardwood Forests of Minnesota, USA. Ecosystems 8:
911-927.
Hassan F. U., Ahmad M., Ahmad N. and Abbasi M. K. (2007) Effects of subsoil compaction on
yield and yield attributes of wheat in the sub-humid region of Pakistan. Soil and Tillage
Research 96: 361-366.
Haynes R. J. and Naidu R. (1998) Influence of lime, fertilizer and manure applications on soil
organic matter content and soil physical conditions: a review. Nutrient Cycling in
Agroecosystems 51: 123-137.
Hector A., Schmid B., Beierkuhnlein C., Caldeira M. C., Diemer M., Dimitrakopoulos P. G.,
Finn J. A., Freitas H., Giller P. S., Good J., Harris R., Högberg P., Huss-Danell K.,
Joshi J., Jumpponen A., Körner C., Leadley P. W., Loreau M., Minns A., Mulder C. P.
H., O'Donovan G., Otway S. J., Pereira J. S., Prinz A., Read D. J., Scherer-Lorenzen
M., Schulze E.-D., Siamantziouras A.-S. D., Spehn E. M., Terry A. C., Troumbis A. Y.,
Woodward F. I., Yachi S. and Lawton J. H. (1999) Plant Diversity and Productivity
Experiments in European Grasslands. Science 286: 1123-1127.
Hillel D. (1998) Environmental Soil Physics. CA Academic Press, New York
Hooper D. U., Chapin F. S., Ewel J. J., Hector A., Inchausti P., Lavorel S., Lawton J. H., Lodge
D. M., Loreau M., Naeem S., Schmid B., Setälä H., Symstad A. J., Vandermeer J. and
Wardle D. A. (2005) Effects of biodiversity on ecosystem functioning: A consensus of
current knowledge Ecological Monographs 75: 3-35.
References
125
Hopp H. and Slater C. S. (1948) Influence of Earthworms on Soil Productivity. Soil Science 66:
421-428.
Horn R., Taubner H., Wuttke M. and Baumgartl T. (1994) Soil physical properties related to
soil structure. Soil and Tillage Research 30: 187-216.
Hu W., Shao M. A., Wang Q. J., Fan J. and Reichardt K. (2008) Spatial variability of soil
hydraulic properties on a steep slope in the loess plateau of China. Scientia Agricola 65:
268-276.
IPCC (2012) Summary for policemakers. In: managing the risks of extrem events and disaster in
advance climate change adaption. In: C B Field, Barros, V., Stocker, T.F., Qin, D.,
Dokken, D.J., Ebi, K.L., Mastrandrea, M.D., Mach, K. and P J., G.-K., Allen, S.K.,
Tignor, M. & Midgley, P.M.). (eds) A Special Report of Working Groups I and II of the
Intergovernmental Panel on Climate Change., Cambridge University Press, Cambridge,
UK, and New York, NY, USA
Ishaq M., Hassan A., Saeed M., Ibrahim M. and Lal R. (2001) Subsoil compaction effects on
crops in Punjab, Pakistan: I. Soil physical properties and crop yield. Soil and Tillage
Research 59: 57-65.
Isselstein J., Jeangros B. and Pavlu V. (2005) Agronomic aspects of biodiversity targeted
management of temperate grasslands in Europe–a review. Agronomy Research 3: 139-
151.
Jabro J. D. (1992) Estimation of saturated hydraulic conductivity of soils from particle size
distribution and bulk density data. Transactions of the ASAE 35: 557-560.
Jarvis N. J., Leeds-Harrison P. B. and Dosser J. M. (1987) The use of tension infiltrometers to
assess routes and rates of infiltration in a clay soil. Journal of Soil Science 38: 633-640.
Jarvis N. J. and Messing I. (1995) Near-Saturated Hydraulic Conductivity in Soils of
Contrasting Texture Measured by Tension Infiltrometers. Soil Science Society of
America Journal 59: 27-34.
Joschko M., Söchtig W. and Larink O. (1992) Functional relationship between earthworm
burrows and soil water movement in column experiments. Soil Biology and
Biochemistry 24: 1545-1547.
Kladivko E. J., Mackay A. D. and Bradford J. M. (1986) Earthworms as a Factor in the
Reduction of Soil Crusting. Soil Science Society of America Journal 50: 191-196.
Kladivko E. J. (2001) Tillage systems and soil ecology. Soil and Tillage Research 61: 61-76.
Kluge G. and Müller-Westermeier G. (2000) Das Klima ausgewählter Orte der Bundesrepublik
Deutschland: Jena. Berichte des Deutschen Wetterdienstes 213, Offenbach/ Main
Knoop W. T. and Walker B. H. (1985) Interactions of Woody and Herbaceous Vegetation in a
Southern African Savanna. Journal of Ecology 73: 235-253.
Kohler-Milleret R., Bayon R.-C., Chenu C., Gobat J.-M. and Boivin P. (2013) Impact of two
root systems, earthworms and mycorrhizae on the physical properties of an unstable silt
loam Luvisol and plant production. Plant and Soil: 1-15.
Kördel W., Egli H. and Klein M. (2008) Transport of pesticides via macropores (IUPAC
Technical Report). Pure Appl. Chem. 80: 105-160.
Kulli B., Gysi M. and Flühler H. (2003) Visualizing soil compaction based on flow pattern
analysis. Soil and Tillage Research 70: 29-40.
Kutílek M. (2004) Soil hydraulic properties as related to soil structure. Soil and Tillage
Research 79: 175-184.
Lachnicht S. L., Parmelee R. W., McCartney D. and Allen M. (1997) Characteristics of
macroporosity in a reduced tillage agroecosystem with manipulated earthworm
populations: Implications for infiltration and nutrient transport. Soil Biology and
Biochemistry 29: 493-498.
Lamandé M., Hallaire V., Curmi P., Pérès G. and Cluzeau D. (2003) Changes of pore
morphology, infiltration and earthworm community in a loamy soil under different
agricultural managements. CATENA 54: 637-649.
Lavelle P. (1988) Earthworm activities and the soil system. Biology and Fertility of Soils 6:
237-251.
References
126
Lavelle P., Blanchart E., Martin A., Spain A. V. and Martin S. (1992) Impact of Soil Fauna on
the Properties of Soils in the Humid Tropics. Soil Sci Soc Am, Madison, WI
Lavelle P., Lattaud C., Trigo D. and Barois I. (1995) Mutualism and biodiversity in soils. Plant
and Soil 170: 23-33.
Lavelle P. (1997) Faunal activities and soil processes: Adaptive strategies that determine
ecosystem function. Advances in Ecological Research Volume 27: 93-132.
Lee K. and Foster R. (1991) Soil fauna and soil structure. Soil Research 29: 745-775.
Lee K. E. (1985) Earthworms : their ecology and relationships with soils and land use.
Academic Press, Sydney [etc.]
Li X., Zhang Q. and Ye X. (2013) Effects of spatial information of soil physical properties on
hydrological modeling based on a distributed hydrological model. Chinese
Geographical Science 23: 182-193.
Lin H. S., McInnes K. J., Wilding L. P. and Hallmark C. T. (1999) Effects Of Soil Morphology
On Hydraulic Properties I. Quantification Of Soil Morphology. Soil Science Society of
America Journal 63: 948-954.
Lipiec J., Kuś J., Słowińska-Jurkiewicz A. and Nosalewicz A. (2006) Soil porosity and water
infiltration as influenced by tillage methods. Soil and Tillage Research 89: 210-220.
Logsdon S. D. and Cambardella C. A. (2000) Temporal Changes in Small Depth-Incremental
Soil Bulk Density 1 Instrument information is provided for the benefit of the reader and
does not imply endorsement by the USDA. Soil Science Society of America Journal 64:
710-714.
Logsdon S. D. and Karlen D. L. (2004) Bulk density as a soil quality indicator during
conversion to no-tillage. Soil and Tillage Research 78: 143-149.
Loreau M. and Hector A. (2001) Partitioning selection and complementarity in biodiversity
experiments. Nature 412: 72-76.
Luxmoore R. J. (1981) Micro-, meso-, and macroporosity of soil. Soil Sci. Soc. Am. J. 45:
Medium: X; Size: Pages: 671.
Luxmoore R. J. (1991) On preferential flow and its measurement
Mallants D., Mohanty B. P., Vervoort A. and Feyen J. (1997) Spatial analysis of saturated
hydraulic conductivity in a soil with macropores. Soil Technology 10: 115-131.
Mannering J. V. and Meyer L. D. (1963) The Effects of Various Rates of Surface Mulch on
Infiltration and Erosion1. Soil Science Society of America Journal 27: 84-86.
Marquard E., Weigelt A., Temperton V. M., Roscher C., Schumacher J., Buchmann N., Fischer
M., Weisser W. W. and Schmid B. (2009) Plant species richness and functional
composition drive overyielding in a six-year grassland experiment. Ecology 90: 3290-
3302.
Meek B. D., Rechel E. A., Carter L. M. and DeTar W. R. (1989) Changes In Infiltration Under
Alfalfa As Influenced By Time And Wheel Traffic. Soil Science Society of America
Journal 53: 238-241.
Meek B. D., Rechel E. R., Carter L. M., DeTar W. R. and Urie A. L. (1992) Infiltration rate of a
sandy loam soil: effects of traffic, tillage, and plant roots. Soil Science Society of
America Journal 56: 908-913.
Messing I. and Jarvis N. J. (1990) Seasonal variation in field-saturated hydraulic conductivity in
two swelling clay soils in Sweden. Journal of Soil Science 41: 229-237.
Messing I. and Jarvis N. J. (1993) Temporal variation in the hydraulic conductivity of a tilled
clay soil as measured by tension infiltrometers. Journal of Soil Science 44: 11-24.
Milcu A., Partsch S., Langel R. and Scheu S. (2006) The response of decomposers (earthworms,
springtails and microorganisms) to variations in species and functional group diversity
of plants. Oikos 112: 513-524.
Milcu A., Partsch S., Scherber C., Weisser W. W. and Scheu S. (2008) Earthworms and
legumes control litter decompostion in a plant diversity gradient. Ecology 89: 1872-
1882.
Miller F. (1989) Matric water potential as an ecological determinant in compost, a substrate
dense system. Microbial Ecology 18: 59-71.

References
127
Minasny B., McBratney A. B. and Bristow K. L. (1999) Comparison of different approaches to
the development of pedotransfer functions for water-retention curves. Geoderma 93:
225-253.
Mitchell A. R., Ellsworth T. R. and Meek B. D. (1995) Effect of root systems on preferential
flow in swelling soil. Communications in Soil Science and Plant Analysis 26: 2655-
2666.
Mohanty B. P., Ankeny M. D., Horton R. and Kanwar R. S. (1994) Spatial analysis of hydraulic
conductivity measured using disc infiltrometers. Water Resources Research 30: 2489-
2498.
Mytton L. R., Cresswell A. and Colbourn P. (1993) Improvement in soil structure associated
with white clover. Grass and Forage Science 48: 84-90.
Nash J. E. and Sutcliffe J. V. (1970) River flow forecasting through conceptual models part I -
A discussion of principles. Journal of Hydrology 10: 282-290.
Nawaz M., Bourrié G. and Trolard F. (2013) Soil compaction impact and modelling. A review.
Agronomy for Sustainable Development 33: 291-309.
Oades J. M. (1993) The role of biology in the formation, stabilization and degradation of soil
structure. Geoderma 56: 377-400.
Obi M. E. (1999) The physical and chemical responses of a degraded sandy clay loam soil to
cover crops in southern Nigeria. Plant and Soil 211: 165-172.
Oelmann Y., Wilcke W., Temperton V. M., Buchmann N., Roscher C., Schumacher J., Schulze
E.-D. and Weisser W. W. (2007) Soil and Plant Nitrogen Pools as Related to Plant
Diversity in an Experimental Grassland. Soil Science Society of America Journal 71:
720-729.
Paoletti M. G. (1999) The role of earthworms for assessment of sustainability and as
bioindicators. Agriculture, Ecosystems & Environment 74: 137-155.
Papadopoulos A., Mooney S. J. and Bird N. R. A. (2006) Quantification of the effects of
contrasting crops in the development of soil structure: an organic conversion. Soil Use
and Management 22: 172-179.
Parker K. C. (1991) Topography, Substrate, and Vegetation Patterns in the Northern Sonoran
Desert. Journal of Biogeography 18: 151-163.
Pérès G., Cluzeau D., Curmi P. and Hallaire V. (1998) Earthworm activity and soil structure
changes due to organic enrichments in vineyard systems. Biology and Fertility of Soils
27: 417-424.
Pérès G., Cluzeau D., Menasseri S., Soussana J. F., Bessler H., Engels C., Habekost M.,
Gleixner G., Weigelt A., Weisser W. W., Scheu S. and Eisenhauer N. (2013)
Mechanisms linking plant community properties to soil aggregate stability in an
experimental grassland plant diversity gradient. Plant and Soil.
Périé C. and Ouimet R. (2008) Organic carbon, organic matter and bulk density relationships in
boreal forest soils. Canadian Journal of Soil Science 88: 315-325.
Pfiffner L. and Luka H. (2007) Earthworm populations in two low-input cereal farming systems.
Applied Soil Ecology 37: 184-191.
Pimentel D. and Kounang N. (1998) Ecology of Soil Erosion in Ecosystems. Ecosystems 1:
416-426.
Pinheiro J. C. and Bates D. M. (2000) Mixed-effects models in S and S-Plus. Springer, New
York
Pohl M., Alig D., Körner C. and Rixen C. (2009) Higher plant diversity enhances soil stability
in disturbed alpine ecosystems. Plant and Soil 324: 91-102.
Poier K. R. and Richter J. (1992) Spatial distribution of earthworms and soil properties in an
arable loess soil. Soil Biology and Biochemistry 24: 1601-1608.
Pucheta E., Bonamici I., Cabido M. and Díaz S. (2004) Below-ground biomass and productivity
of a grazed site and a neighbouring ungrazed exclosure in a grassland in central
Argentina. Austral Ecology 29: 201-208.
Ramankutty N., Evan A. T., Monfreda C. and Foley J. A. (2008) Farming the planet: 1.
Geographic distribution of global agricultural lands in the year 2000. Global
Biogeochemical Cycles 22: GB1003.
References
128
Rawls W. J., Brakensiek D. L. and Saxto K. E. (1982) Estimation of soil water properties.
Transactions of the ASAE 25: 1316-1320.
Reicosky D. C. and Archer D. W. (2007) Moldboard plow tillage depth and short-term carbon
dioxide release. Soil and Tillage Research 94: 109-121.
Reynolds W. D., Bowman B. T., Brunke R. R., Drury C. F. and Tan C. S. (2000) Comparison of
Tension Infiltrometer, Pressure Infiltrometer, and Soil Core Estimates of Saturated
Hydraulic Conductivity. Soil Science Society of America Journal 64: 478-484.
Richards L. A. (1931) Capillary conduction of liquids through porous mediums Physics 1: 318-
333.
Roscher C., Schumacher J., Baade J., Wilcke W., Gleixner G., Weisser W. W., Schmid B. and
Schulze E.-D. (2004) The role of biodiversity for element cycling and trophic
interactions: an experimental approach in a grassland community. Basic and Applied
Ecology 5: 107-121.
Rowell D. L. (1994) Soil science: methods and applications. Longman Scientific & Technical
Russo D. and Bresler E. Soil Hydraulic Properties as Stochastic Processes: I. An Analysis of
Field Spatial Variability. Soil Science Society of America Journal 45: 682-687.
Salehi A., Ghorbanzadeh N. and Kahneh E. (2013) Earthworm biomass and abundance, soil
chemical and physical properties under different poplar plantations in the north of Iran.
Journal of Forest Science 59: 223-229.
Salverda A. P. and Dane J. H. (1993) An examination of the Guelph permeameter for measuring
the soil's hydraulic properties. Geoderma 57: 405-421.
Saxton K. E., Rawls W. J., Romberger J. S. and Papendick R. I. (1986) Estimating Generalized
Soil-water Characteristics from Texture. Soil Science Society of America Journal 50:
1031-1036.
Schaap M. G., Leij F. J. and van Genuchten M. T. (1998) Neural Network Analysis for
Hierarchical Prediction of Soil Hydraulic Properties. Soil Science Society of America
Journal 62: 847-855.
Schaap M. G., Leij F. J. and van Genuchten M. T. (2001) rosetta: a computer program for
estimating soil hydraulic parameters with hierarchical pedotransfer functions. Journal of
Hydrology 251: 163-176.
Schenk H. J. and Jackson R. B. (2002) The global biogeography of roots. Ecological
Monographs 72: 311-328.
Schenk H. J. (2005) Vertical Vegetation Structure Below Ground: Scaling from Root to Globe.
Springer Berlin Heidelberg
Scheu S. (2003) Effects of earthworms on plant growth: patterns and perspectives: The 7th
international symposium on earthworm ecology · Cardiff · Wales · 2002. Pedobiologia
47: 846-856.
Schjønning P., Munkholm L. J., Moldrup P. and Jacobsen O. H. (2002) Modelling soil pore
characteristics from measurements of air exchange: the long-term effects of fertilization
and crop rotation. European Journal of Soil Science 53: 331-339.
Schmidt O. and Curry J. (1999) Effects of earthworms on biomass production, nitrogen
allocation and nitrogen transfer in wheat-clover intercropping model systems. Plant and
Soil 214: 187-198.
Schumm S. A. and Lusby G. C. (1963) Seasonal variation of infiltration capacity and runoff on
hillslopes in western Colorado. Journal of Geophysical Research 68: 3655-3666.
Schwartz R. C., Evett S. R. and Unger P. W. (2003) Soil hydraulic properties of cropland
compared with reestablished and native grassland. Geoderma 116: 47-60.
Schwärzel K. and Punzel J. (2007) Hood Infiltrometer - A New Type of Tension Infiltrometer.
Soil Science Society of America Journal 71: 1438-1447.
Schwärzel K., Carrick S., Wahren A., Feger K.-H., Bodner G. and Buchan G. (2011) Soil
Hydraulic Properties of Recently Tilled Soil under Cropping Rotation Compared with
Two-Year Pasture. Vadose Zone Journal 10: 354-366.
Seyfried M. S. and Wilcox B. P. (1995) Scale and the Nature of Spatial Variability: Field
Examples Having Implications for Hydrologic Modeling. Water Resources Research
31: 173-184.
References
129
Shipitalo M. J. and Protz R. (1988) Factors Influencing the Dispersibility of Clay in Worm
Casts. Soil Science Society of America Journal 52: 764-769.
Shipitalo M. J., Edwards W. M. and Redmond C. E. (1994) Comparison of Water Movement
and Quality in Earthworm Burrows and Pan Lysimeters. J. Environ. Qual. 23: 1345-
1351.
Shipitalo M. J., Nuutinen V. and Butt K. R. (2004) Interaction of earthworm burrows and cracks
in a clayey, subsurface-drained, soil. Applied Soil Ecology 26: 209-217.
Shouse P. J. and Mohanty B. P. (1998) Scaling of near-saturated hydraulic conductivity
measured using disc infiltrometers. Water Resour. Res. 34: 1195-1205.
Shukla M. K., Lal R. and Ebinger M. (2006) Determining soil quality indicators by factor
analysis. Soil and Tillage Research 87: 194-204.
Shuster W. D., Subler S. and McCoy E. L. (2002) The influence of earthworm community
structure on the distribution and movement of solutes in a chisel-tilled soil. Applied Soil
Ecology 21: 159-167.
Simmonds L. P. and Nortcliff S. (1998) Small scale variability in the flow of water and solutes,
and implications for lysimeter studies of solute leaching. Nutrient Cycling in
Agroecosystems 50: 65-75.
Six J., Paustian K., Elliott E. T. and Combrink C. (2000) Soil Structure and Organic Matter I.
Distribution of Aggregate-Size Classes and Aggregate-Associated Carbon. Soil Science
Society of America Journal 64: 681-689.
Six J., Bossuyt H., Degryze S. and Denef K. (2004) A history of research on the link between
(micro)aggregates, soil biota, and soil organic matter dynamics. Soil and Tillage
Research 79: 7-31.
Slater C. S. and Hopp H. (1947) Relation of fall protection to earthworm populations and soil
physical conditions. Proceedings of the National Academy of Sciences 12: 508-511.
Slater C. S. (1957) Cylinder infiltrometers for determining rates of irrigation. Soil Science
Society of America Journal 21: 457-460.
Smit H. J., Metzger M. J. and Ewert F. (2008) Spatial distribution of grassland productivity and
land use in Europe. Agricultural Systems 98: 208-219.
Sobieraj J. A., Elsenbeer H. and Vertessy R. A. (2001) Pedotransfer functions for estimating
saturated hydraulic conductivity: implications for modeling storm flow generation.
Journal of Hydrology 251: 202-220.
Soto B., Basanta R., Benito E., Perez R. and Diaz-Fierros F. (1994) Runoff and erosion from
burnt soils in northwest Spain. In: M Sala, Rubio JL. (ed) Soil erosion and degradation
as a consequence of forest fires. Geoforma, Logroño, Spain
Spehn E., Joshi J., Schmid B., Alphei J. and Körner C. (2000) Plant diversity effects on soil
heterotrophic activity in experimental grassland ecosystems. Plant and Soil 224: 217-
230.
Spehn E. M., Scherer-Lorenzen M., Schmid B., Hector A., Caldeira M. C., Dimitrakopoulos P.
G., Finn J. A., Jumpponen A., O'Donnovan G., Pereira J. S., Schulze E. D., Troumbis
A. Y. and Körner C. (2002) The role of legumes as a component of biodiversity in a
cross-European study of grassland biomass nitrogen. Oikos 98: 205-218.
Spehn E. M., Hector A., Joshi J., Scherer-Lorenzen M. and Schmid B. (2004) Ecosystem effects
of biodiversity manipulations in European grasslands. Grassland Science in Europe
Volume 9. vdf Hochschulverlag AG an der ETH Zurich, Zürich
Steinbeiss S., Beßler H., Engels C., Temperton V. M., Buchmann N., Roscher C., Kreutziger Y.,
Baade J., Habekost M. and Gleixner G. (2008) Plant diversity positively affects short-
term soil carbon storage in experimental grasslands. Global Change Biology 14: 2937-
2949.
Stirzaker R. J., Passioura J. B. and Wilms Y. (1996) Soil structure and plant growth: Impact of
bulk density and biopores. Plant and Soil 185: 151-162.
Stockdill S. M. J. (1966) The role of earthworm in pasture production and moisture
conservation. Proceedings of the 28th Conference of the Zealand Grassland Association
13: 68-83.

References
130
Syers J. K. and Springett J. A. (1983) Earthworm ecology in grassland soils. In: J E Satchell
(ed) Earthworm Ecology. Springer Netherlands
Thielemann U. (1986) The octet-method for sampling earthworm populations. Pedobiologia 29:
296-302.
Thompson S. E., Harman C. J., Heine P. and Katul G. G. (2010) Vegetation-infiltration
relationships across climatic and soil type gradients. J. Geophys. Res. 115: G02023.
Tietje O. and Tapkenhinrichs M. (1993) Evaluation of Pedo-Transfer Functions. Soil Science
Society of America Journal 57: 1088-1095.
Tietje O. and Hennings V. (1996) Accuracy of the saturated hydraulic conductivity prediction
by pedo-transfer functions compared to the variability within FAO textural classes.
Geoderma 69: 71-84.
Tilman D. (1996) Biodiversity: Population Versus Ecosystem Stability. Ecology 77: 350-363.
Tilman D., Reich P. B., Knops J., Wedin D., Mielke T. and Lehman C. (2001) Diversity and
Productivity in a Long-Term Grassland Experiment. Science 294: 843-845.
Tilman D., Cassman K. G., Matson P. A., Naylor R. and Polasky S. (2002) Agricultural
sustainability and intensive production practices. Nature 418: 671-677.
Tippkötter R. (1983) Morphology, spatial arrangement and origin of macropores in some
hapludalfs, West Germany. Geoderma 29: 355-371.
Trojan M. D. and Linden D. R. (1992) Microrelief and Rainfall Effects on Water and Solute
Movement in Earthworm Burrows. Soil Science Society of America Journal 56: 727-
733.
van Eekeren N., de Boer H., Hanegraaf M., Bokhorst J., Nierop D., Bloem J., Schouten T., de
Goede R. and Brussaard L. (2010) Ecosystem services in grassland associated with
biotic and abiotic soil parameters. Soil Biology and Biochemistry 42: 1491-1504.
van Schaik L., Palm J., Klaus J., Zehe E. and Schröder B. (2013) Linking spatial earthworm
distribution to macropore numbers and hydrological effectiveness. Ecohydrology: n/a-
n/a.
Vereecken H. (1995) Estimating the unsaturated hydraulic conductivity from theoretical models
using simple soil properties. Geoderma 65: 81-92.
Vereecken H., Meas, J., Feyen, J. (1990) Estimating Unsaturated Hydraulic Conductivity from
Easily Measured Soil Properties. Soil Science 149: 1-12.
Visa N. (1992) Earthworm community response to tillage and residue management on different
soil types in southern Finland. Soil and Tillage Research 23: 221-239.
Wainer H. (1976) Robust Statistics: A Survey and Some Prescriptions. Journal of Educational
and Behavioral Statistics 1: 285-312.
Ward A. D. and Trimble S. W. (2004) Environmental hydrology. CRC Press, Boca Ratan
Ward R. C. and Robinson M. (1990) Principles of Hydrology. McGraw-Hill Ryerson, Limited
Watson K. W. and Luxmoore R. J. (1986) Estimating Macroporosity in a Forest Watershed by
use of a Tension Infiltrometer. Soil Science Society of America Journal 50: 578-582.
Weiler M. and Naef F. (2003) An experimental tracer study of the role of macropores in
infiltration in grassland soils. Hydrological Processes 17: 477-493.
Weltzin J. F., Loik M. E., Schwinning S., Williams D. G., Fay P. A., Haddad B. M., Harte J.,
Huxman T. E., Knapp A. K., Lin G., Pockman W. T., Shaw M. R., Small E. E., Smith
M. D., Smith S. D., Tissue D. T. and Zak J. C. (2003) Assessing the response of
terrestrial ecosystems to potential changes in precipitation. Bioscience 53: 941-952.
Wen Y.-W., Tsai Y.-W., Wu D. B.-C. and Chen P.-F. (2013) The Impact of Outliers on Net-
Benefit Regression Model in Cost-Effectiveness Analysis. PLoS ONE 8: e65930.
Wooding R. A. (1968) Steady Infiltration from a Shallow Circular Pond. Water Resources
Research 4: 1259-1273.
Wösten J., Lilly A., Nemes A. and Le Bas C. (1998) Using existing soil data to derive hydraulic
parameters for simulation models in enviromental studies and in land use planning.
DLO-Staring Centre
Wösten J. H. M. and van Genuchten M. T. (1988) Using texture and other soil properties to
predict the unsaturated soil hydraulic functions. Soil Science Society of America
Journal 52: 1762-1770.

References
131
Wösten J. H. M., Pachepsky Y. A. and Rawls W. J. (2001) Pedotransfer functions: bridging the
gap between available basic soil data and missing soil hydraulic characteristics. Journal
of Hydrology 251: 123-150.
Wuest S. B. (2001) Earthworm, infiltration, and tillage relationships in a dryland pea–wheat
rotation. Applied Soil Ecology 18: 187-192.
Wurst S. and Jones T. H. (2003) Indirect effects of earthworms (Aporrectodea caliginosa) on an
above-ground tritrophic interaction. Pedobiologia 47: 91-97.
Yeates G. W., Shepherd T. G. and Francis G. S. (1998) Contrasting response to cropping of
populations of earthworms and predacious nematodes in four soils. Soil and Tillage
Research 48: 255-264.
Zacharias S. and Wessolek G. (2007) Excluding Organic Matter Content from Pedotransfer
Predictors of Soil Water Retention. . Soil Science Society of America Journal 71: 43-50.
Zachmann J. E., Linden D. R. and Clapp C. E. (1987) Macroporous infiltration and
redistribution as affected by earthworms, tillage and residue. Soil Science Society of
America Journal 51: 1580-1586.
Zachmann J. E. and Linden D. R. (1989) Earthworm Effects on Corn Residue Breakdown and
Infiltration. Soil Science Society of America Journal 53: 1846-1849.
Zaller J. G. and Arnone J. A., III (1999) Earthworm responses to plant species' loss and elevated
CO2 in calcareous grassland. Plant and Soil 208: 1-8.
Zartman R. E., Moffet C. A., Wester D. B., Sosebee R. E., Fish E. B. and Jaynes W. F. (2012)
Influence of Surface Biosolids Application on Infiltration. Applied and Environmental
Soil Science 2012.
Zehe E. and Flühler H. (2001) Slope scale variation of flow patterns in soil profiles. Journal of
Hydrology 247: 116-132.
Zund P. R., Pillai-McGarry U., McGarry D. and Bray S. G. (1997) Repair of a compacted
Oxisol by the earthworm Pontoscolex corethrurus (Glossoscolecidae, Oligochaeta).
Biology and Fertility of Soils 25: 202-208.
Zuur A. F., Ieno E. N. and Elphick C. S. (2010) A protocol for data exploration to avoid
common statistical problems. Methods in Ecology and Evolution 1: 3-14.


Appendix
133
10. Appendix
Appendix Table A1: Calculated values (in %) for all Plots (plotcode indicated plot number at The Jena
Experiment field site) in 10, 20, 30, 40, 60, 80 and 100 cm depth for clay
clay10 clay20 clay30 clay40 clay60 clay80 clay100 plotcode
15.60 16.50 15.30 14.10 15.10 18.40 15.50 B1A01
13.80 14.50 14.90 13.80 16.30 18.90 15.60 B1A02
14.50 15.10 15.20 14.40 16.00 16.10 12.70 B1A03
13.30 14.00 15.10 14.30 15.20 15.60 14.40 B1A04
13.60 14.30 15.70 16.00 15.30 15.10 11.70 B1A05
15.40 15.60 15.70 14.40 16.70 18.50 17.60 B1A06
14.80 15.30 15.10 15.70 17.50 16.80 15.30 B1A07
14.10 14.10 15.30 13.40 18.20 22.10 17.00 B1A08
13.70 14.50 15.80 13.50 19.10 27.10 15.90 B1A09
14.20 14.20 15.90 16.00 16.80 20.40 16.80 B1A11
14.00 15.80 17.50 15.60 16.50 16.50 15.90 B1A12
15.30 16.60 19.20 19.10 17.10 21.90 12.40 B1A13
16.80 17.40 17.70 18.80 18.20 19.80 9.60 B1A14
16.10 16.40 16.90 17.10 15.60 18.00 12.60 B1A15
16.50 17.00 17.60 18.80 18.00 20.30 19.60 B1A16
18.10 18.40 17.70 19.60 19.40 25.30 20.10 B1A17
18.70 18.70 16.50 19.60 19.90 24.10 22.90 B1A18
20.60 18.60 17.10 18.20 21.20 21.60 22.40 B1A19
20.60 17.50 16.60 17.30 20.70 25.40 17.70 B1A20
16.80 16.80 16.40 17.90 21.00 27.90 19.30 B1A21
16.90 16.90 16.10 17.40 18.10 22.40 19.20 B1A22
13.70 17.60 19.90 16.50 17.20 28.20 26.10 B2A01
15.60 19.70 21.00 19.10 21.30 24.50 22.90 B2A02
20.50 21.90 20.80 19.10 21.70 20.20 11.50 B2A03
23.20 22.70 22.10 20.90 21.80 21.20 8.60 B2A04
20.40 19.60 21.00 19.60 20.80 21.90 18.50 B2A05
20.90 20.40 19.90 21.30 22.70 26.60 25.70 B2A06
21.90 23.40 21.90 24.60 25.00 29.30 27.50 B2A08
23.30 23.60 21.60 25.10 26.00 31.50 27.50 B2A09
22.60 22.50 18.20 24.40 23.80 25.80 25.60 B2A10
21.90 21.30 16.50 23.90 22.10 23.70 20.90 B2A11
21.20 21.20 20.80 20.40 22.10 26.80 25.70 B2A12
20.20 23.90 23.10 23.90 24.60 24.60 23.00 B2A13
20.20 21.40 20.10 22.80 23.20 21.20 20.90 B2A14
21.30 20.90 22.20 22.70 21.60 24.10 17.50 B2A15
21.80 20.80 20.90 21.70 19.70 22.30 19.40 B2A16
21.30 20.50 19.40 21.40 23.30 26.70 26.10 B2A17
22.30 22.80 23.00 24.90 28.40 30.70 31.00 B2A18
22.50 23.80 24.50 27.80 26.50 30.90 26.20 B2A19
23.90 24.30 22.30 27.10 27.00 27.50 25.70 B2A20
24.70 24.70 21.30 24.90 24.60 24.80 25.90 B2A21
22.90 22.90 19.80 26.40 23.60 23.10 24.50 B2A22
24.00 24.00 21.80 22.40 28.10 22.10 21.80 B3A01
24.00 24.00 24.20 23.60 26.70 24.70 24.10 B3A02
21.40 22.50 22.20 23.40 25.80 25.70 25.60 B3A03
22.70 23.30 23.40 23.00 26.80 26.40 24.10 B3A04
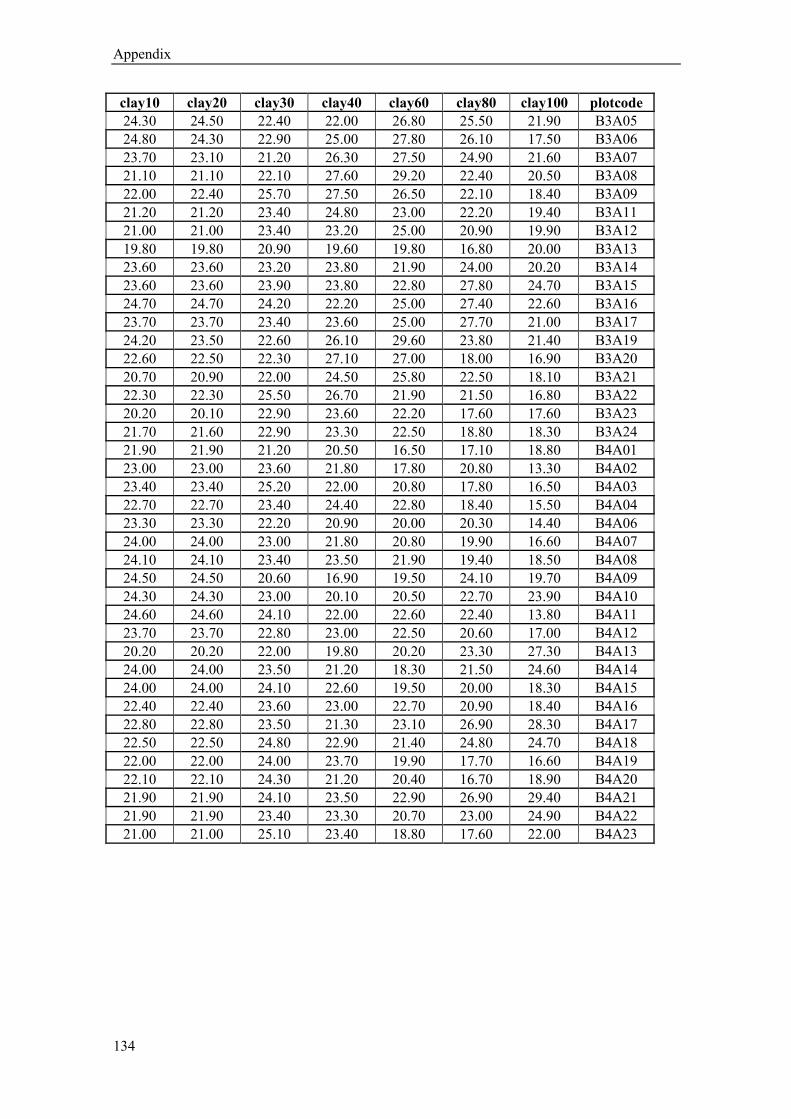
Appendix
134
clay10 clay20 clay30 clay40 clay60 clay80 clay100 plotcode
24.30 24.50 22.40 22.00 26.80 25.50 21.90 B3A05
24.80 24.30 22.90 25.00 27.80 26.10 17.50 B3A06
23.70 23.10 21.20 26.30 27.50 24.90 21.60 B3A07
21.10 21.10 22.10 27.60 29.20 22.40 20.50 B3A08
22.00 22.40 25.70 27.50 26.50 22.10 18.40 B3A09
21.20 21.20 23.40 24.80 23.00 22.20 19.40 B3A11
21.00 21.00 23.40 23.20 25.00 20.90 19.90 B3A12
19.80 19.80 20.90 19.60 19.80 16.80 20.00 B3A13
23.60 23.60 23.20 23.80 21.90 24.00 20.20 B3A14
23.60 23.60 23.90 23.80 22.80 27.80 24.70 B3A15
24.70 24.70 24.20 22.20 25.00 27.40 22.60 B3A16
23.70 23.70 23.40 23.60 25.00 27.70 21.00 B3A17
24.20 23.50 22.60 26.10 29.60 23.80 21.40 B3A19
22.60 22.50 22.30 27.10 27.00 18.00 16.90 B3A20
20.70 20.90 22.00 24.50 25.80 22.50 18.10 B3A21
22.30 22.30 25.50 26.70 21.90 21.50 16.80 B3A22
20.20 20.10 22.90 23.60 22.20 17.60 17.60 B3A23
21.70 21.60 22.90 23.30 22.50 18.80 18.30 B3A24
21.90 21.90 21.20 20.50 16.50 17.10 18.80 B4A01
23.00 23.00 23.60 21.80 17.80 20.80 13.30 B4A02
23.40 23.40 25.20 22.00 20.80 17.80 16.50 B4A03
22.70 22.70 23.40 24.40 22.80 18.40 15.50 B4A04
23.30 23.30 22.20 20.90 20.00 20.30 14.40 B4A06
24.00 24.00 23.00 21.80 20.80 19.90 16.60 B4A07
24.10 24.10 23.40 23.50 21.90 19.40 18.50 B4A08
24.50 24.50 20.60 16.90 19.50 24.10 19.70 B4A09
24.30 24.30 23.00 20.10 20.50 22.70 23.90 B4A10
24.60 24.60 24.10 22.00 22.60 22.40 13.80 B4A11
23.70 23.70 22.80 23.00 22.50 20.60 17.00 B4A12
20.20 20.20 22.00 19.80 20.20 23.30 27.30 B4A13
24.00 24.00 23.50 21.20 18.30 21.50 24.60 B4A14
24.00 24.00 24.10 22.60 19.50 20.00 18.30 B4A15
22.40 22.40 23.60 23.00 22.70 20.90 18.40 B4A16
22.80 22.80 23.50 21.30 23.10 26.90 28.30 B4A17
22.50 22.50 24.80 22.90 21.40 24.80 24.70 B4A18
22.00 22.00 24.00 23.70 19.90 17.70 16.60 B4A19
22.10 22.10 24.30 21.20 20.40 16.70 18.90 B4A20
21.90 21.90 24.10 23.50 22.90 26.90 29.40 B4A21
21.90 21.90 23.40 23.30 20.70 23.00 24.90 B4A22
21.00 21.00 25.10 23.40 18.80 17.60 22.00 B4A23
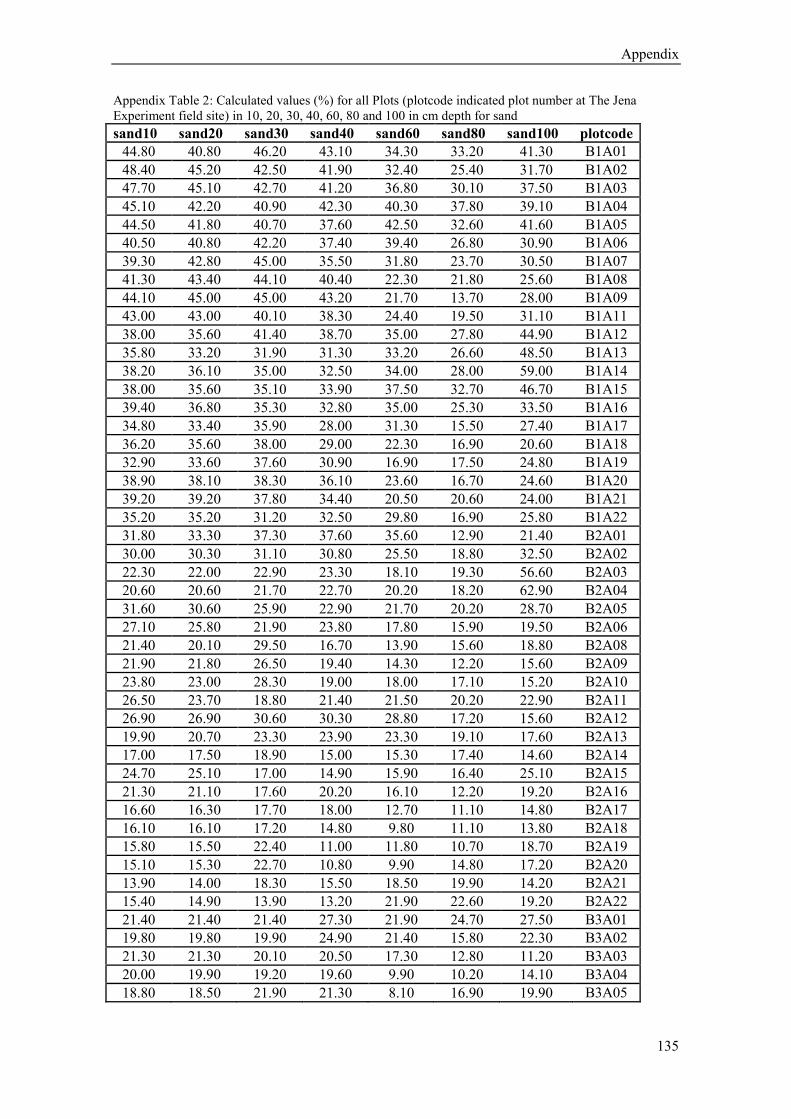
Appendix
135
Appendix Table 2: Calculated values (%) for all Plots (plotcode indicated plot number at The Jena
Experiment field site) in 10, 20, 30, 40, 60, 80 and 100 in cm depth for sand
sand10 sand20 sand30 sand40 sand60 sand80 sand100 plotcode
44.80 40.80 46.20 43.10 34.30 33.20 41.30 B1A01
48.40 45.20 42.50 41.90 32.40 25.40 31.70 B1A02
47.70 45.10 42.70 41.20 36.80 30.10 37.50 B1A03
45.10 42.20 40.90 42.30 40.30 37.80 39.10 B1A04
44.50 41.80 40.70 37.60 42.50 32.60 41.60 B1A05
40.50 40.80 42.20 37.40 39.40 26.80 30.90 B1A06
39.30 42.80 45.00 35.50 31.80 23.70 30.50 B1A07
41.30 43.40 44.10 40.40 22.30 21.80 25.60 B1A08
44.10 45.00 45.00 43.20 21.70 13.70 28.00 B1A09
43.00 43.00 40.10 38.30 24.40 19.50 31.10 B1A11
38.00 35.60 41.40 38.70 35.00 27.80 44.90 B1A12
35.80 33.20 31.90 31.30 33.20 26.60 48.50 B1A13
38.20 36.10 35.00 32.50 34.00 28.00 59.00 B1A14
38.00 35.60 35.10 33.90 37.50 32.70 46.70 B1A15
39.40 36.80 35.30 32.80 35.00 25.30 33.50 B1A16
34.80 33.40 35.90 28.00 31.30 15.50 27.40 B1A17
36.20 35.60 38.00 29.00 22.30 16.90 20.60 B1A18
32.90 33.60 37.60 30.90 16.90 17.50 24.80 B1A19
38.90 38.10 38.30 36.10 23.60 16.70 24.60 B1A20
39.20 39.20 37.80 34.40 20.50 20.60 24.00 B1A21
35.20 35.20 31.20 32.50 29.80 16.90 25.80 B1A22
31.80 33.30 37.30 37.60 35.60 12.90 21.40 B2A01
30.00 30.30 31.10 30.80 25.50 18.80 32.50 B2A02
22.30 22.00 22.90 23.30 18.10 19.30 56.60 B2A03
20.60 20.60 21.70 22.70 20.20 18.20 62.90 B2A04
31.60 30.60 25.90 22.90 21.70 20.20 28.70 B2A05
27.10 25.80 21.90 23.80 17.80 15.90 19.50 B2A06
21.40 20.10 29.50 16.70 13.90 15.60 18.80 B2A08
21.90 21.80 26.50 19.40 14.30 12.20 15.60 B2A09
23.80 23.00 28.30 19.00 18.00 17.10 15.20 B2A10
26.50 23.70 18.80 21.40 21.50 20.20 22.90 B2A11
26.90 26.90 30.60 30.30 28.80 17.20 15.60 B2A12
19.90 20.70 23.30 23.90 23.30 19.10 17.60 B2A13
17.00 17.50 18.90 15.00 15.30 17.40 14.60 B2A14
24.70 25.10 17.00 14.90 15.90 16.40 25.10 B2A15
21.30 21.10 17.60 20.20 16.10 12.20 19.20 B2A16
16.60 16.30 17.70 18.00 12.70 11.10 14.80 B2A17
16.10 16.10 17.20 14.80 9.80 11.10 13.80 B2A18
15.80 15.50 22.40 11.00 11.80 10.70 18.70 B2A19
15.10 15.30 22.70 10.80 9.90 14.80 17.20 B2A20
13.90 14.00 18.30 15.50 18.50 19.90 14.20 B2A21
15.40 14.90 13.90 13.20 21.90 22.60 19.20 B2A22
21.40 21.40 21.40 27.30 21.90 24.70 27.50 B3A01
19.80 19.80 19.90 24.90 21.40 15.80 22.30 B3A02
21.30 21.30 20.10 20.50 17.30 12.80 11.20 B3A03
20.00 19.90 19.20 19.60 9.90 10.20 14.10 B3A04
18.80 18.50 21.90 21.30 8.10 16.90 19.90 B3A05
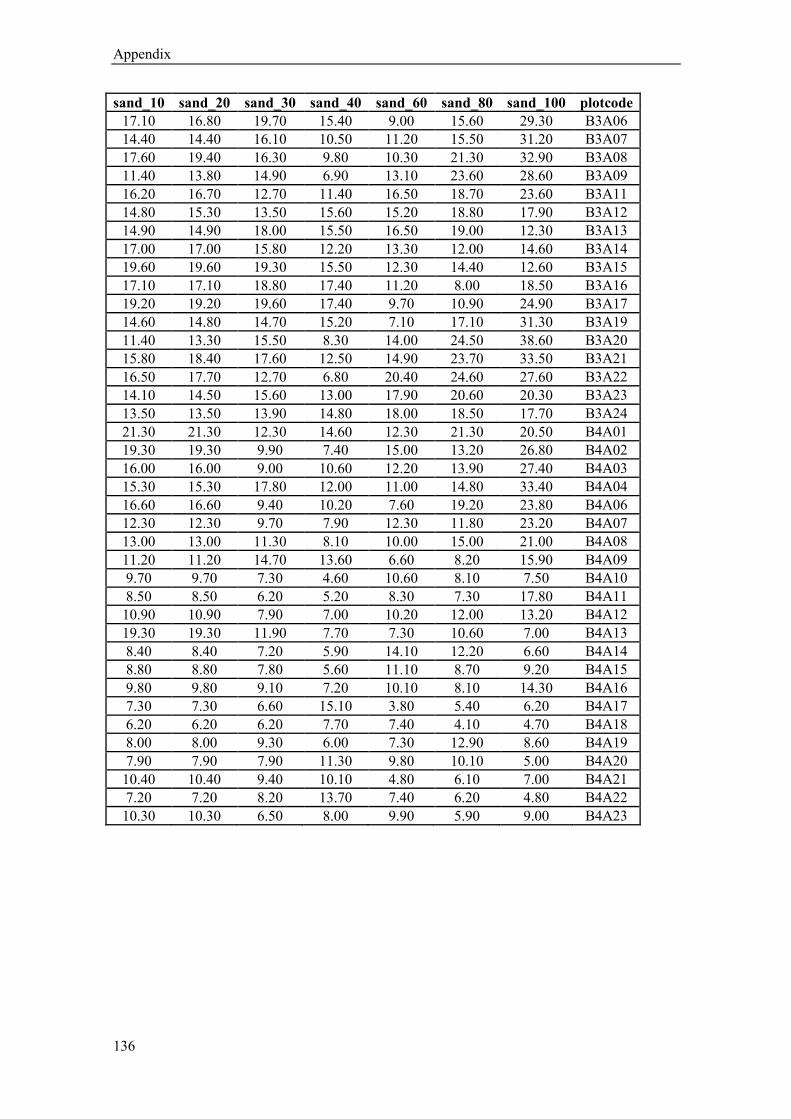
Appendix
136
sand_10 sand_20 sand_30 sand_40 sand_60 sand_80 sand_100 plotcode
17.10 16.80 19.70 15.40 9.00 15.60 29.30 B3A06
14.40 14.40 16.10 10.50 11.20 15.50 31.20 B3A07
17.60 19.40 16.30 9.80 10.30 21.30 32.90 B3A08
11.40 13.80 14.90 6.90 13.10 23.60 28.60 B3A09
16.20 16.70 12.70 11.40 16.50 18.70 23.60 B3A11
14.80 15.30 13.50 15.60 15.20 18.80 17.90 B3A12
14.90 14.90 18.00 15.50 16.50 19.00 12.30 B3A13
17.00 17.00 15.80 12.20 13.30 12.00 14.60 B3A14
19.60 19.60 19.30 15.50 12.30 14.40 12.60 B3A15
17.10 17.10 18.80 17.40 11.20 8.00 18.50 B3A16
19.20 19.20 19.60 17.40 9.70 10.90 24.90 B3A17
14.60 14.80 14.70 15.20 7.10 17.10 31.30 B3A19
11.40 13.30 15.50 8.30 14.00 24.50 38.60 B3A20
15.80 18.40 17.60 12.50 14.90 23.70 33.50 B3A21
16.50 17.70 12.70 6.80 20.40 24.60 27.60 B3A22
14.10 14.50 15.60 13.00 17.90 20.60 20.30 B3A23
13.50 13.50 13.90 14.80 18.00 18.50 17.70 B3A24
21.30 21.30 12.30 14.60 12.30 21.30 20.50 B4A01
19.30 19.30 9.90 7.40 15.00 13.20 26.80 B4A02
16.00 16.00 9.00 10.60 12.20 13.90 27.40 B4A03
15.30 15.30 17.80 12.00 11.00 14.80 33.40 B4A04
16.60 16.60 9.40 10.20 7.60 19.20 23.80 B4A06
12.30 12.30 9.70 7.90 12.30 11.80 23.20 B4A07
13.00 13.00 11.30 8.10 10.00 15.00 21.00 B4A08
11.20 11.20 14.70 13.60 6.60 8.20 15.90 B4A09
9.70 9.70 7.30 4.60 10.60 8.10 7.50 B4A10
8.50 8.50 6.20 5.20 8.30 7.30 17.80 B4A11
10.90 10.90 7.90 7.00 10.20 12.00 13.20 B4A12
19.30 19.30 11.90 7.70 7.30 10.60 7.00 B4A13
8.40 8.40 7.20 5.90 14.10 12.20 6.60 B4A14
8.80 8.80 7.80 5.60 11.10 8.70 9.20 B4A15
9.80 9.80 9.10 7.20 10.10 8.10 14.30 B4A16
7.30 7.30 6.60 15.10 3.80 5.40 6.20 B4A17
6.20 6.20 6.20 7.70 7.40 4.10 4.70 B4A18
8.00 8.00 9.30 6.00 7.30 12.90 8.60 B4A19
7.90 7.90 7.90 11.30 9.80 10.10 5.00 B4A20
10.40 10.40 9.40 10.10 4.80 6.10 7.00 B4A21
7.20 7.20 8.20 13.70 7.40 6.20 4.80 B4A22
10.30 10.30 6.50 8.00 9.90 5.90 9.00 B4A23
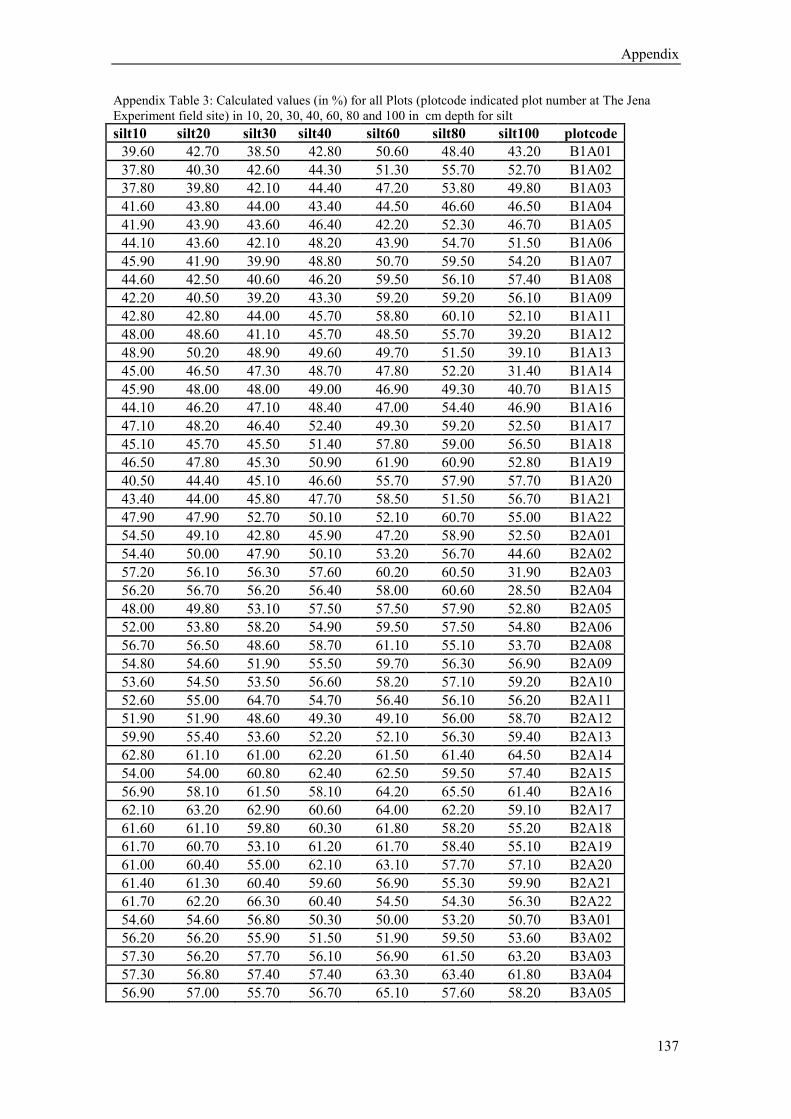
Appendix
137
Appendix Table 3: Calculated values (in %) for all Plots (plotcode indicated plot number at The Jena
Experiment field site) in 10, 20, 30, 40, 60, 80 and 100 in cm depth for silt
silt10 silt20 silt30 silt40 silt60 silt80 silt100 plotcode
39.60 42.70 38.50 42.80 50.60 48.40 43.20 B1A01
37.80 40.30 42.60 44.30 51.30 55.70 52.70 B1A02
37.80 39.80 42.10 44.40 47.20 53.80 49.80 B1A03
41.60 43.80 44.00 43.40 44.50 46.60 46.50 B1A04
41.90 43.90 43.60 46.40 42.20 52.30 46.70 B1A05
44.10 43.60 42.10 48.20 43.90 54.70 51.50 B1A06
45.90 41.90 39.90 48.80 50.70 59.50 54.20 B1A07
44.60 42.50 40.60 46.20 59.50 56.10 57.40 B1A08
42.20 40.50 39.20 43.30 59.20 59.20 56.10 B1A09
42.80 42.80 44.00 45.70 58.80 60.10 52.10 B1A11
48.00 48.60 41.10 45.70 48.50 55.70 39.20 B1A12
48.90 50.20 48.90 49.60 49.70 51.50 39.10 B1A13
45.00 46.50 47.30 48.70 47.80 52.20 31.40 B1A14
45.90 48.00 48.00 49.00 46.90 49.30 40.70 B1A15
44.10 46.20 47.10 48.40 47.00 54.40 46.90 B1A16
47.10 48.20 46.40 52.40 49.30 59.20 52.50 B1A17
45.10 45.70 45.50 51.40 57.80 59.00 56.50 B1A18
46.50 47.80 45.30 50.90 61.90 60.90 52.80 B1A19
40.50 44.40 45.10 46.60 55.70 57.90 57.70 B1A20
43.40 44.00 45.80 47.70 58.50 51.50 56.70 B1A21
47.90 47.90 52.70 50.10 52.10 60.70 55.00 B1A22
54.50 49.10 42.80 45.90 47.20 58.90 52.50 B2A01
54.40 50.00 47.90 50.10 53.20 56.70 44.60 B2A02
57.20 56.10 56.30 57.60 60.20 60.50 31.90 B2A03
56.20 56.70 56.20 56.40 58.00 60.60 28.50 B2A04
48.00 49.80 53.10 57.50 57.50 57.90 52.80 B2A05
52.00 53.80 58.20 54.90 59.50 57.50 54.80 B2A06
56.70 56.50 48.60 58.70 61.10 55.10 53.70 B2A08
54.80 54.60 51.90 55.50 59.70 56.30 56.90 B2A09
53.60 54.50 53.50 56.60 58.20 57.10 59.20 B2A10
52.60 55.00 64.70 54.70 56.40 56.10 56.20 B2A11
51.90 51.90 48.60 49.30 49.10 56.00 58.70 B2A12
59.90 55.40 53.60 52.20 52.10 56.30 59.40 B2A13
62.80 61.10 61.00 62.20 61.50 61.40 64.50 B2A14
54.00 54.00 60.80 62.40 62.50 59.50 57.40 B2A15
56.90 58.10 61.50 58.10 64.20 65.50 61.40 B2A16
62.10 63.20 62.90 60.60 64.00 62.20 59.10 B2A17
61.60 61.10 59.80 60.30 61.80 58.20 55.20 B2A18
61.70 60.70 53.10 61.20 61.70 58.40 55.10 B2A19
61.00 60.40 55.00 62.10 63.10 57.70 57.10 B2A20
61.40 61.30 60.40 59.60 56.90 55.30 59.90 B2A21
61.70 62.20 66.30 60.40 54.50 54.30 56.30 B2A22
54.60 54.60 56.80 50.30 50.00 53.20 50.70 B3A01
56.20 56.20 55.90 51.50 51.90 59.50 53.60 B3A02
57.30 56.20 57.70 56.10 56.90 61.50 63.20 B3A03
57.30 56.80 57.40 57.40 63.30 63.40 61.80 B3A04
56.90 57.00 55.70 56.70 65.10 57.60 58.20 B3A05

Appendix
138
silt10 silt20 silt30 silt40 silt60 silt80 silt100 plotcode
58.10 58.90 57.40 59.60 63.20 58.30 53.20 B3A06
61.90 62.50 62.70 63.20 61.30 59.60 47.20 B3A07
61.30 59.50 61.60 62.60 60.50 56.30 46.60 B3A08
66.60 63.80 59.40 65.60 60.40 54.30 53.00 B3A09
62.60 62.10 63.90 63.80 60.50 59.10 57.00 B3A11
64.20 63.70 63.10 61.20 59.80 60.30 62.20 B3A12
65.30 65.30 61.10 64.90 63.70 64.20 67.70 B3A13
59.40 59.40 61.00 64.00 64.80 64.00 65.20 B3A14
56.80 56.80 56.80 60.70 64.90 57.80 62.70 B3A15
58.20 58.20 57.00 60.40 63.80 64.60 58.90 B3A16
57.10 57.10 57.00 59.00 65.30 61.40 54.10 B3A17
61.20 61.70 62.70 58.70 63.30 59.10 47.30 B3A19
66.00 64.20 62.20 64.60 59.00 57.50 44.50 B3A20
63.50 60.70 60.40 63.00 59.30 53.80 48.40 B3A21
61.20 60.00 61.80 66.50 57.70 53.90 55.60 B3A22
65.70 65.40 61.50 63.40 59.90 61.80 62.10 B3A23
64.80 64.90 63.20 61.90 59.50 62.70 64.00 B3A24
56.80 56.80 66.50 64.90 71.20 61.60 60.70 B4A01
57.70 57.70 66.50 70.80 67.20 66.00 59.90 B4A02
60.60 60.60 65.80 67.40 67.00 68.30 56.10 B4A03
62.00 62.00 58.80 63.60 66.20 66.80 51.10 B4A04
60.10 60.10 68.40 68.90 72.40 60.50 61.80 B4A06
63.70 63.70 67.30 70.30 66.90 68.30 60.20 B4A07
62.90 62.90 65.30 68.40 68.10 65.60 60.50 B4A08
64.30 64.30 64.70 69.50 73.90 67.70 64.40 B4A09
66.00 66.00 69.70 75.30 68.90 69.20 68.60 B4A10
66.90 66.90 69.70 72.80 69.10 70.30 68.40 B4A11
65.40 65.40 69.30 70.00 67.30 67.40 69.80 B4A12
60.50 60.50 66.10 72.50 72.50 66.10 65.70 B4A13
67.60 67.60 69.30 72.90 67.60 66.30 68.80 B4A14
67.20 67.20 68.10 71.80 69.40 71.30 72.50 B4A15
67.80 67.80 67.30 69.80 67.20 71.00 67.30 B4A16
69.90 69.90 69.90 63.60 73.10 67.70 65.50 B4A17
71.30 71.30 69.00 69.40 71.20 71.10 70.60 B4A18
70.00 70.00 66.70 70.30 72.80 69.40 74.80 B4A19
70.00 70.00 67.80 67.50 69.80 73.20 76.10 B4A20
67.70 67.70 66.50 66.40 72.30 67.00 63.60 B4A21
70.90 70.90 68.40 63.00 71.90 70.80 70.30 B4A22
68.70 68.70 68.40 68.60 71.30 76.50 69.00 B4A23

Acknowledgements
139
Acknowledgements
This thesis would not have been possible without the initiation by Prof. Sabine Attinger and Jun.
Prof. Dr. Anke Hildebrandt.
First of all, I am grateful to my thesis supervisor and doctor mother Jun.-Prof. Dr. Anke
Hildebrandt for the opportunity to doing my thesis in are research area, which not exactly
covered my scientific background, and the continuous support of my research. Her enormous
knowledge and guidance has greatly supported my work and the present thesis. She always had
time for helpful and motivating discussions.
I would like to express my thanks to Prof. Dr. Sabine Attinger, Prof. Dr. W.W. Weisser and PD
Dr. Jussi Baade for their support, help and critical reading of the manuscript. I will like to take
this opportunity to express my thanks to all my Co-Authors and colleagues for their helpful
discussion and support.
I am especially grateful to Prof. Dr. Nico Eisenhauer for guiding me with his valuable
suggestion in the field of earthworms and his critical reading of the manuscripts.
I thank PD Dr. Christiane Roscher for being my representative of the HIGRADE research
school and helped me every time in statistical questions, for introducing me in mixed effect
models, ANOVA, and so on. She corrected very fast and precisely my manuscripts.
I thank all the members of the Forschergruppe of the Jena Experiment Special thanks go to the
gardeners for maintaining the experiment field site (Steffen Ferber, Steffen Eismann, Silke
Hengelhaupt, Heike Scheffler, Ute Köber, Katja Kunze and Gerlinde Kratzsch). Thanks to all
the “hard working people” in the field under hot sun, heavy rain, storms and floods. Also thanks
to all of my student helpers, particularly Franziska Guderle and Wenke Stoll.
I want to express my special thanks to Kerry Hinds for spending time reading this thesis.
Special thanks also to my officemates and colleagues Marcel Bechmann, Marcus Guderle and
Johanna Metzger for creating a very homy atmosphere in the dark office (formerly archive
room). I like to thank all the technical staff from the MPI for Biogeochemistry, especially Olaf
Kolle and Iris Kuhlmann for their technical assistance and Uta Gerighausen for the provision of
data covered in this thesis.
I would thank the German Research Foundation (DFG, FOR456/1451) for funding; Max Planck
Society for facility support at the MPI for Biogeochemistry in Jena. Also thanks to the
Helmholtz Interdisciplinary Graduate School for Environmental Research (HIGRADE) for the
education support.
I am grateful to my boyfriend Norman, for enduring my moods (in particular in the last months)
and his unlimited patience. Of course the biggest thanks to all my friends and family,
particularly my sister Annika, for an open mind for my request and problems.

Curriculum vitae
140
Curriculum vitae
Personal details
Name: Christine Fischer
Adress: Mittelstraße 50
07745 Jena, Germany
Mobile 0163/ 154 48 12
E-Mail: [email protected]
Birthday &- place: 20.10.1983 in Arnstadt, Germany
Nationality: German
Eduaction
09/1994-07/2002 Albert-Schweitzer-Gymnasium 7 in Erfurt, Degree: General
qualification for university entrance
08/2002-07/2005 Apprenticeship as a survey technician, Erfurt
Scientific Career
11/2010-11/2013 PhD student at the Friedrich-Schiller University Jena under the
supervision of Jun.-Prof- Anke Hildebrandt
PhD Thesis: “Does ecosystem diversity affect soil hydraulic properties?
Investigation of the biotic and abiotic factors on Infiltration capacity in
a grassland biodiversity experiment“
10/2005-09/2010 Study of Biology at the Friedrich-Schiller-University Jena, Germany
Diploma thesis: „Regulation of Jasmonic acid and12-Oxophytodienacid (OPDA)
release upon herbivory in A.thaliana”
Work experience
10/2009-02/2010 Tutor for Mathematics and tatistics for Biologists at the Friedrich-
Schiller-
und 10/2008-02/2009 University Jena, Germany
03/2009-08/2009 Student research assistant for interactions between Nicotiana attenuata
and Mykorrhiza at the Max-Planck-Institut for chemical ecology, Jena
09/2007 Student research assistant in the working group „Multitrophische
Interaktionen“ at the institute for ecology, Jena
04/2007-06/2007 Student research assistant for field work at The Jena Experiment field
site
Further Qualifications
08.07.2013 Course: “Structural Equation Modelling-A gentle introduction”,
Graduierten Akademie, Jena
Curriculum vitae
141
26.11.2012 Course: “How to deal with missingness?-Analysis of incomplete
datasets”,
Graduierten Akademie, Jena
16.-18.04.2012 Course: Introduction to Biodiversity Sciences (basic and applied plant
and animal biology/ecology)-Higrade
30.01.-2.02.2012 Course: Ecological data evaluation (R), Higrade
02.-07.10.2011 Summer School on Flow and Transport in Terrestrial Systems,
Heidelberg
10.-11.05.2011 Course: Multivariate statistics using R –Higrade
14.-18.03.2011 Course: Applied Statistics and Data Analysis-Higrade
30.03.-01.04./2011 Introduction to Hydrological Processes, Water Resources Management
and Aquatic Ecosystems (2011)-Higrade
14.-18.03.2011 Course: Applied Statistics and Data Analysis, International Max Planck
Research School for Global Biochemical Cycles (IMPRS), Jena
30.04./07.05.2010 Courses Statistics in a nutshell: Design and Analysis of Experiments (I);
Questionnaires and Surveys (II), Graduierten Akademie , Jena
03/2008 Traineeship: „Praktische Einführung in GPS und GIS“ at the Institute
for ecology, Jena
08/2007 Traineeship at the Verein zur Förderung der ökologischen Bildung e.V.,
Erfurt
Other skills and interests
Seit 2012 Board member in the choir Chorissimo, Jena
2007 bis heute Singer in the choir Chorissimo, Jena
2003-2005 voluntary danceteacher (CVJM)
2000-2005 volunteer at the CVJM choir (Christlicher Verein Junger Menschen),
Erfurt
Awards
2013 First place for Poster Award with the title "Key soil and plant
community characteristics govering soil hydraulic properties in a
grassland biodiversity experiment" at the Biohydrology Conference at
the University Koblenz-Landau.
Curriculum vitae
142
Publications
Schäfer, M., Fischer, C., Meldau, S., Seebald, E., Oelmüller, R., Baldwin, I. T. (2011). Lipase
activity in insect oral secretions mediates defense responses in Arabidopsis thaliana.
Plant Physiology.
Schäfer, M.,Fischer, C., Baldwin, I.T. and Meldau, S. (2011). Grasshopper oral secretions
increase salicylic acid and abscic acid levels in wounded leaves of Arabidopsis thaliana.
Plant signaling & Behaviour.
In Preparation
Fischer, C., Roscher, C., Jensen, B.,Eisenhauer, E., Baade, J. Attinger, A.,Scheu, S., Weisser,
W.W., Hildebrandt, A.(in prep.). How do earthworm, soil texture and plant composition
affect infiltration in managed grasslands along a plant diversity gradient?
Fischer, C. Tischer,J., Roscher,C., Eisenhauer, N., Raveneck, J., Gleixner, G. Attinger, S.,
Jensen, B. , de Kroon, H., Mommer, L., Hildebrandt, A.(in prep.). Soil and plant
community characteristics governing soil hydraulic properties in a grassland
biodiversity experiment.
Posters
Fischer, C., Roscher, C., Merkel, B.,Eisenhauer, E., Baade, J. Attinger, A.,Scheu, S.,
Hildebrandt, A.(2012). Infiltration capacity as affected by soil texture, plant community
composition and earthworms in a grassland plant diversity experiment. Eurosoil (Bari,
Italy).
Fischer, C. Tischer,J., Roscher,C., Eisenhauer, N., Raveneck, J., Gleixner, G. Attinger, S.,
Jensen, B. , de Kroon, H., Mommer, L., Hildebrandt, A.(2013). Key soil and plant
community characteristics govering soil hydraulic properties in a grassland biodiversity
experiment. Biohydrology (Landau, Germany).
Presentations
Fischer, C., Roscher, C., Jensen, B.,Eisenhauer, E., Baade, J. Attinger, A.,Scheu, S.,
Hildebrandt, A.(2012) How do soil texture, plant community composition and
earthworms affected the Infiltration capacity in a grassland plant diversity experiment
depending on season? EGU (Vienna, Austria).
Fischer, C. Tischer,J., Roscher,C., Eisenhauer, N., Raveneck, J., Gleixner, G. Attinger, S.,
Jensen, B. , de Kroon, H., Mommer, L., Hildebrandt, A. (2013) Factors affecting
Infiltration capacity in a grassland plant diversity experiment, MPI for biogeochemistry
colloquium (Jena, Germany).
Fischer, C., Roscher, C., Jensen, B., Eisenhauer, E., Baade, J. Attinger, A.,Scheu, S., Weisser,
W.W., Hildebrandt, A.(2013) What factors influence water infiltration through soil?
HIGRADE fall conference (Leizig, Germany).

Curriculum vitae
143
Supervisions
Julia Kästner (2011) Infiltration capacity as affected by soil texture, plant community
composition and earthworms in a grassland plant diversity experiment. Praktikumsbericht,
Friedrich-Schiller-Universität Jena.
Jana Tischer (2012) Zusammenhang zwischen Bodeneigenschaften und Biodiversität.
Projektbericht, Friedrich-Schiller-Universität Jena.
Wenke Stoll (2013) Vergleich von FDR- und TDR- Sonden zur Bestimmung des
Bodenwassergehaltes auf dem Jena Biodiversitätsexperiment. Bachelor thesis, Friedrich-
Schiller-Universität Jena.
Ort, Datum Christine Fischer

Selbständigkeitserklärung
Ich erkläre, dass ich die vorliegende Dissertation selbständig und nur unter Verwendung
der angebenen Hilfmittel, persönlichen Mitteilungen und Quellen angefertigt habe.
Ort, Datum Christine Fischer
Recommended