DOCUMENT RESUME
ED 395 004 TM 025 000
AUTHOR Livingston, Samuel A.TITLE Adjusting Scores on Examinations Offering a Choice of
Essay Questions.INSTITUTION Educational Testing Service, Princeton, N.J.REPORT NO ETS-RR-88-64PUB DATE Nov 88NOTE 26p.
PUB TYPE Reports Evaluative/FeasibLkity (142)
EDRS PRICE MF01/PCO2 Plus Postage.DESCRIPTORS Advanced Placement; *Correlation; *Difficulty Level;
*Essays; *Scores; Scoring; Test Construction; *TestInterpretation; Test Items; Test Results
IDENTIFIERS Advanced Placement Examinations (CEEB); *ChoiceBehavior
ABSTRACTWhen test-takers are offered a choice of essay
questions, some questions may be harder than others. If the testincludes a common portion taken by all test-takers, an adjustment tothe scores is possible. Previously proposed adjustment proceduresdisregard the test-makers' efforts to create questions of equaldifficulty; these procedures tend to make larger adjustments when thescores to be adjusted are less correlated with scores on the commonportion. This paper suggests an adjustment procedure that makessmaller adjustments when the correlation between the scores to beadjusted and the scores on the common portion is weak. The paperincludes a derivation of the adjustment formula and a numericalexample of the resulting adjustment. The numerical example usesgroups taking an Advanced Placement history test, with group size's of3,411; 38,445; 1,390; 10,382; and 5,180. The basis for the solutionis to impute a score for the test-taker on each alternate questionthe test-taker did not answer, and then average the scores, observedand imputed, over all the alternative questions. (Contains two tablesand four references.) (Author/SLD)
***********************************************************************
Reproductions supplied by EDRS are the best that can be madefrom the original document.
***********************************************************************

A
U.S. OEASTMENT OF :EDUCATIONOthce of EducabonaI Research and Improvement
EDUC IONAL RESOURCES INFORMATIONCENTER (ERIC)
Ns document has been reproduced asrecerved from the person or ofgantzabonongmattng .1
0 Mtnor changes have been made to tmpeorereproductron Quihty
Pants of view Or Opt noon stated on th ts 90Cu.mint do not necessanN rfOritAint offloadOE RI posttron or pohcy
0
RR-88-64
"PERMISSION TO REPRODUCE THISMATERIAL HAS BEEN GRANTED BY
TO THE EDUCATIONAL RESOURCESINFORMATION CENTER (ERIC)
ADJUSTING SCORES ON EXAMINATIONS OFFERINGA CHOICE OF ESSAY QUESTIONS
Samuel A. Livingston
Educational Tasting SarvIcaRincaton, New Jersey
Novambar 1988
BEST COPY AVAILABLE
2

Adjusting Scores on Examinations Offering a Choice of Essay Questions
Samuel A. Livingston

Copyright 0 1988. Educational Testing Service. All rights reserved.
4

Abstract
When test-takers are offered a choice of essay questions, somequestions may be harder than others. If the test includes a commonportion taken by all test-takers,an adjustment to the scores ispossible. Previously proposed adjustment procedures disregard thetest-makers' efforts to create questions of equal difficulty; theseprocedures tend to make larger adjustments when the scores to beadjusted are less correlated with scores on the common portion. This
paper suggests an adjustment procedure that makes smaller adjustmentswhen the corelation between the scores to be adjusted and the scores onthe common portion is weak. The paper includes a derivation of theadjustment formula and a numerical example of the resulting adjustment.

Adjusting Scores on Examinations Offering a Choice of Essay Questions
Samuel A. Livingston
Is there a problem?
Some tests offer the test-taker a choice of essay questions in one
part of the test, while requiring all test-takers to answer the same
questions in another part of the test. Two such tests are the Advanced
Placement (AP) Examinations in American history and in European
history. The developers of these examinations do their best to make
the alternate essay questions equally difficult, and the leaders of the
reading/scoring process do their best to assure that the standards for
scoring the alternate questions are equally demanding. Nevertheless,
when the scoring has been completed and the results tabulated, the data
occasionally suggest that scores on two or more alternate essay
questions may not be comparable. Consider the example in Table 1, from
an AP history test. A comparison of the groups answering questions 5
and 6 might cause us to question an assumption of equal difficulty.
Group 5 appears, on the basis of the common portions, to be at least as
able as the other groups, but their scores on the portion allowing a
choice of questions are, on the average, about a third of a standard
deviation lower. Group 6 appears, on the basis of the common portions,
to be somewhat weaker than the other groups, but their scores on the
portion allowing a choice of questions tend to be the highest of the
five groups. The most obvoius explanation for these results is that

Question 5 may have been particularly difficult and Question 6
particularly easy.A.
Before comparing the statistical properties of various adjustment
methods, it might be wise to consider the more basic question of
whether any adjustment is desirable. A hypothetical (but possibly
realistic) example may clarify the issue. Suppose a substantial
minority of AP history teachers give a special emphasis to a particular
content area. Call this content area "Topic 6". Instruction time is
limited, and the emphasis on Topic 6 will come, most probably, at the
expense of other content areas. Therefore, it will not tend to improve
these test-takers' performance on the common portion. However, these
test-takers will tend to become ext s on Topic 6, at least in
comparison with other AP test-takers. '.ow suppose that question 6 on
the AP examination tests Topic 6. Our hypothetical situation might
well produce results similar to those in Table I. In this case, any
statistical adjustment of the scores would tend to devalue the test-
takers' truly better performance on question 6. In effect, the
adjustment procedure says, "Since the test-takers answering question 6
were not generally better than the other test-takers on the common
portion (in fact, they were somewhat weaker), their higher scores on
the alternate questions must be the result of an easier question or
more lenient grading, and not of truly superior knowledge." The
question of whether to make an adjustment, then, is a question of what
to believe aboLt the reasons for the inconsistencies between tht.
groups' performance on the alternate questions and on the common
portion.
2
7

The problem of adjusting scores on alternate essay questions is,
in some ways, similar to that of scaling the College Board Achievement
Tests. Those tests offer the test-taker a choice of subjects, and the
scores on different tests are scaled so that they can be compared as
indicators of the test-takers' general level of acadimic achievement.
However, choosing among alternate essay questions on a test differs in
an important way from choosing among College Board Achievement Tests in
different subjects. The Achievement Tests in different subjects are
constructed independently of each other. They contain different
numbers of questions, and their raw scores are not intended to be
comparable. In the absence of statistical information, there is no way
to establish a meaningful correspondence between scores on one
Achievement Test and scores on another Achievement Test. In contrast,
the alternate questions on many essay tests (including the AP history
examinations) have been constructed to be of equal difficulty. The
attempt to produc,t equally difficult questions may not succeed
completely, but in the absence of any statistical information to the
contrary it provides a reason for considering raw scores on the
alternate questions to be comparable.
Questions versus readers as a source of difticulty
In adjusting scores on alternate essay questions, it is not
necessary to consider the readers who score the test-takers' papers as
a separate source of difficulty (i.e., separate from the intrinsic
difficulty of the question). Even if the test-takers' responses to
each alternate question are read and scored by different readers, the
readers who score the responses can be considered a part of the
3
BEST COPY AVAILABLE

question. As long as the adjustment is to be the same for all test-
takers choosing a particular question, it does not matter why Question
5 proved to be harder than Question 6; it matters only how much harder
Question 5 was than Question 6. (Adjusting for differences in the
scoring standards of individual readers is a different problem. See
Braun, 1986, for an analysis of this problem.)
What properties should the adjusted scores have?
Any score adjustment to be used for alternate essay questions must
have the property that equal adjusted scores on any two of the
alternate questions will represent the same level of achievement. This
requirement is necessary for the fairness of the procedure and the
validity of the scores. Also, a test-taker's individual adjusted score
on the portion of the examination offering a choice of questions should
be a function of the test-taker's unadjusted score
on that portion only. It should not depend on the test-taker's scores
on other parts of the exam. To allow this kind of dependence would
lessen the effective weight of the portion of the exam containing the
alternate questions.1
Cowell's solution
Cowell (1972) proposed a method for scaling scores on alternate AP
free-response questions which is essentially the same as the method for
1There is an additonal requirement for any adjustment to be usedon the College Board Advanced Placement Examinations: the distributionof the adjusted scores must not differ greatly from the distribution ofthe una,justed scores. The reason for this requirement is that thechoice of AP grade boundaries ("cutoff scores") depends partly on thedistribution of AP grades that will result. However, the AP scoringschedule does not allow time for a statistical adjustment to be madeuntil after the grade boundaries are determined.
4
9

scaling College Board Achievement Test sco:as. Cowell's method is
based on the assumption that if all test-takers taking the exam had
answered a particular question, the relationship between scores on that
question and on the common portion would have been the same in this
"total group" as it was in the subgroup of test-takers who actually
chose that question. More precisely, the regression of alternate-
question scores on common-portion scores is assumed to be the same in
the group of test-takers who did not choose the question as it was in
the group of test-takers who did choose that question. This assumption
is used to estimate the total-group mean and standard deviation of
scores on each alternate question. The scores on all the alternate
questions are then linearly re-scaled to have the same mean and
standard deviation in the total group.
One property of Cowell's solution that seems undesirable is that,
other things being equal, it makes a larger adjustment when the
relationship between scores on the alternate question and the common
portion is weaker. Consider the extreme case, in which scores on an
alternate question are uncorrelated with scores on the common portion,
so that the regression line has slope 0.00. In this case, the total
group would be estimated to do exactly as well on the alternate
question as did the test-takers who actually answered it. Now suppose
that the scores on Ali the alternate questions were uncorrelated with
scores on the common portion. Then, on any alternate question, the
astimated mean and standard deviation estimated for the total group
would be the same as the mean and standard deviation observed for those
test-takers who actually answered that question. A roscaling based on
5

these estinates would adjust away any score differences between the
groups of test-takers taking different alternate questions. In effect,
it would attribute the observed score differences entirely to
differences in the difficulty of the questions and not at all to
differences in the ability of the groups of test-takers.
Cowell's solution, in effect, disregards the attempt by the test
developers to create alternate questions of equal difficulty. But in
the absence of any information to the contrary, it makes sense to
assume that the test developers were successful in creating alternate
essay questions of equal difficulty. The weaker the relationship
between scores on the common portion and on the alternate questions,
the weaker the evidence against this prior assumption of equal
difficulty. Cowell's solution produces the largest adjustment to the
scores when the evidence of the need for an adjustment is weakest.
Rubin and Thayer's covariance estimation nrocedure.
A development that might appear to offer a solution to the problem
is that of Rubin and Thayer (1978), entitled "Relating tests given to
different samples." Rubin and Thayer's contribution, in terms of tests
with alternate questions, is a method for estimating the covariance, in
the full examinee group, of scores on each pair of alternate questions.
The method requires the user to specify a plausible value (between .00
and 1.00) for the partial correlation of scores on each pair of
alternate questions, controlling for scores on the common portion.
Unfortunately, Rubin and Thayer's method solves only a part of the
problem. Even if the population variances and covariances are known,
6
ii

it is still necessary to specify the unobserved means. One possible
approach would be to assume that the unobserved regression of any
alternate question on the common portion would be the same in all
groups as it is in the group where that regression is observed.
However, this assumption would lead to a solution with the same
undesirable property as Cowell's solution. Under this assumption, if
the relationship between scores on the alternate questions and scores
on the common portion were weak, the estimated mean scores of the
groups not answering a particular alternate question would be close to
the observed mean score of the group that answered the question, rather
than to their own observed mean scores on the questions they answered.
This assumption would lead to larger adjustments when the relationship
between scores on the common portion and the alternate questions is
weak than when it is strong. But without some assumption about the
unobserved mean scores, Rubin and Thayer's procedure does not tell us
how many points to add or subtract in each test-taker's score.
Rosenbaum's solution
A solution suggested by Rosenbaum (1985), though more complex and
more comprehensive than Cowell's, is based on similar reasoning.
Rosenbaum's method estimates, for each alternate question, the entire
score distribution that would have resulted if all the test-takers had
answered that question. The result is an estimated total-group score
distribution on each alternate question. The scores in the alternate
questions can then be adjusted so that a higher estimated total-group
percentile always corresponds to a higher adjusted score.
7

Rosenbaum's method of estimating the total-group score
distribution for each alternate question can be described in a step-by-
step procedure:
1. Call the alternate question "Question Y." Create an indicator
variable Z, such that Z.1 for telt-takers who chose question Y
and Z-0 for test-takers who did not.
2. Perform a logistic regression of the indicator variable Z on
the items in the common portion, in the total group of all
test-takers. The result will be a variable X that can be
computed from item responses on the common portion and that
predicts whether or not the test-taker chose question Y. X
can be thought of as a way to score the common portion so as
to predict which test-takers will choose question Y.
3. Classify the test-takers who actually answered question Y into
a two-way table, based on their scores on X and Y.
4. Assume that the probability of choosing Question Y was
the same for all test-takers with the same X
score, regardless of how
well they would have done on Question Y. Use the results of
the logistic regression in Step 2 to estimate this probability
at each level of X.
5. Create an estimated two-way table of X and Y scores for the
total group, by dividing the number of test-takers in each
cell of the observed two-way tabl.: of Step 3 by the
probability estimated in Step 4. i.e., the probability that a
test-taker with that X-score would choose Question Y.
8
13

6. Sum across the score levels of X to get the estimated total-
group score distribution for question Y.
Mathematically, the logic of this method can be written as follows.
(Remember, Z-.1 means that the test-taker answered Question Y.)
P(Z-1. I X-,x, Y-y. Z-1)
Therefore,
Y-y) - N(X-x. Z-1) .
P(Z -1 I X-x, Y-y)
If we assume that, for all y,
P(Z -1 I X-x, Y-y) - P(Z -1 I X-x) ,
we have the estimate
N(X-x, Y-y) N(X-x. Z-1)
P(Z..1 I X-x)
and
N(Y-y) - E [N:(X-x. Y-y. Z-1)].all x P (Z..1 I X...x)
Although Rosenbaum's solution differs from Cowell's in many ways,
it shares the same undesirable property. Other things being equal, it
makes a larger adjustment to scores on the alternate questions when
their relationship with the common portion is weaker. In the extreme
case, suppose that test-takers' X-scores were unrelated to their scores
on Question Y. Then the distribution of the Y-scores would be the same
at all X-score levels. As a result, the score distribution on Question
Y estimated for the total group would b. the same as the score
distribution observed for the test-takers who chose Question Y. Now
suppose that scores on the common portion were unrelated to scores on
9
4

Any of the alternate questions. Then on each alternate question the
total group would be estimated to do as well as the test-takers who
chose that question did. As a result, the adjusted scores of all the
groups would have the same distribution. All differences between the
unadjusted scores of the groups answering different alternate questions
would be attributed to differences in the difficulty of the questions.
Like Cowell's method, Rosenbaum's method produces the largest
adjustment in the scores when the evidence for the necessity of an
adjustment is weakest.
Presenting this example mathematically, suppose that X and Y are
statistically independent among the test-takers answering Question Y.
Then, in this extreme case,
N(X-x, Z-1) - N(X-x. Z-1) N(Y-y. Z-1) .
N(Z-1)
Then our estimate of N(Y-y) becomes
N(Y-y) - Eall x
But
Therefore,
l]
N(X-x. Z-1) N(Y-y.Z -1)N(Z -.1) P(Z -1 I X-x)
- N(Y-y. Z-1) E N(X-x. Z-.1)N(Z-1) all x P(Z-1 1 X-x)
P(Z-0. 1 X-x) - N(X-x. Z-.1)N(X...x)
N(X-x. Z-1) - N(X..x),
P(Z-1 1 X...x)
and our estimate becomes
10

and
N(Yy) 1,1(11y. Z1) E N(Xx)N(Z1) all x
141(Yy. Z-1) N(total)N(Z1)
P(Yy) N(Yy) $(Yy. Z1) .
N(total) N(Z1)
The last equation shows that when X and Y are completely
independent, the distribution of Y scores in the full group of test-
takers is estimated to be exactly what it was in the group for which
Z-1, that is, the group who chose Question Y. If the common portion X
is completely independent of each alternate question Y1, Y2, , the
score distrtbution for each of these questions in the total group will
be estimated to be pxactly the same as it was in the grbup of test-
takers who chose that question. In effect, the group of test-takers
answering each question will be assumed to be equal in ability to the
total group. Any between-group differences in the scores (of Group 1
on Question 1, Group 2 on Question 2, etc.) will be attributed to
differences in the difficulty of the questions.
An ad hoc solution
Is it possible to develop a solution that does not lead to the same
problem as the methods discussed previously? Certainly, it is possible
to create an adjustment formula that results in a large adjustment only
when the scores on the common portion are strongly related to those on
the alternate questions. In fact, it is easy to develop a family of
solutions, all with the desired properties. However, it is not easy to
11

show, on the basis of any reasonable assumptions, that any one of these
solutions is preferable to the others. The solution presented here
will be the simplest of this family of solutions.
The basis for the solution is to impute a score for the test-taker
on each alternate question the test-taker did not answer, and then
average the scores - observed and imputed - over all the alternate
questions. A presentation of this solution will require some
additional notation.
Let
X score on the common portion;
yi score on Question i;
yj score on Question j;
si ri mean, standard deviation, correlation in Group
i (the test-takers who answered Question i);
m , s , r1
mean, standard deviation, correlation in Group
5'1
j.
the score imputed on Question j for a test-taker not in
Group j;
y the score that would be imputed if scores on Question j
were perfectly correlated with scores on the common
portion.
We want to impute a yj score for each test-taker in Group i, and we
want this imputed yj score to depend only on his/her observed yi score,
not on his/her individual x score. First, suppose yj were uncorrelated
with x in Group j, the group of test-takers who acutally answered
Question j. In this case, there is no evidence against the Drior
12
17
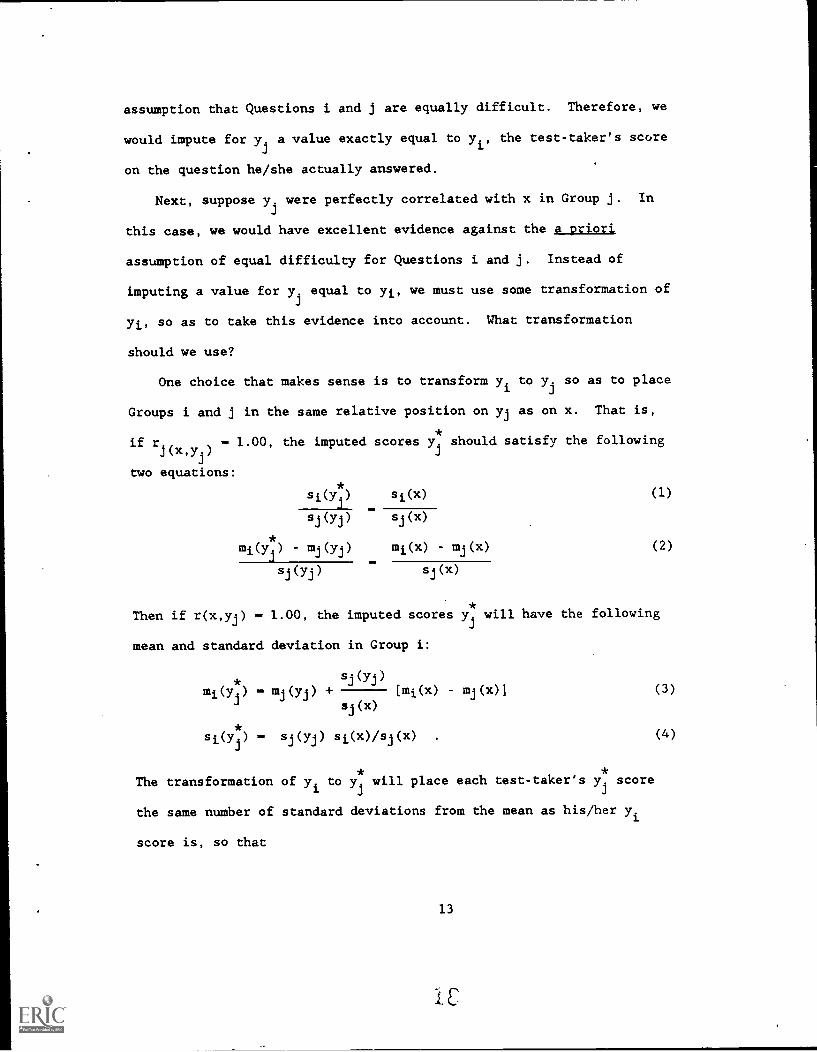
assumption that Questions i and j are equally difficult. Therefore, we
wouldimputefor Yj .avalue exactly equal to yi, the test-taker's score
on the question he/she actually answered.
Next, suppose Y . were perfectly correlated with x in Group j. In
this case, we would have excellent evidence against the a priori
assumption of equal difficulty for Questions i and j. Instead of
imputingavaluefor Yj .equal to yi, we must use some transformation of
yi, so as to take this evidence into account. What transformation
should we use?
Onechoicethatmakessenseistotransformyito yi .so as to place
Groups i and j in the same relative position on yj as on x. That is,
ifrj -1.00,theimputedscoresl.rshould satisfy the followingYj
two equations:
si(y*
) s(x) (1)
sj(yj) sj(x)
mi(4) - mj(yj) mi(x) - mj(x) (2)
-sj(yj) sj(x)
Then if r(x,yj) - 1.00, the imputed scores y*will have the following
mean and standard deviation in Group i:
sj(yj)
mi(Y ) mj(Yi) +j
(mi(x) mj(x)] (3)
sj(x)
si(yj) - sj(yj) si(x)/sj(x) (4)
The transformation of yi
to y*will place each test-taker's y
*score
the same number of standard deviations from the mean as his/her yi
score is, so that
13
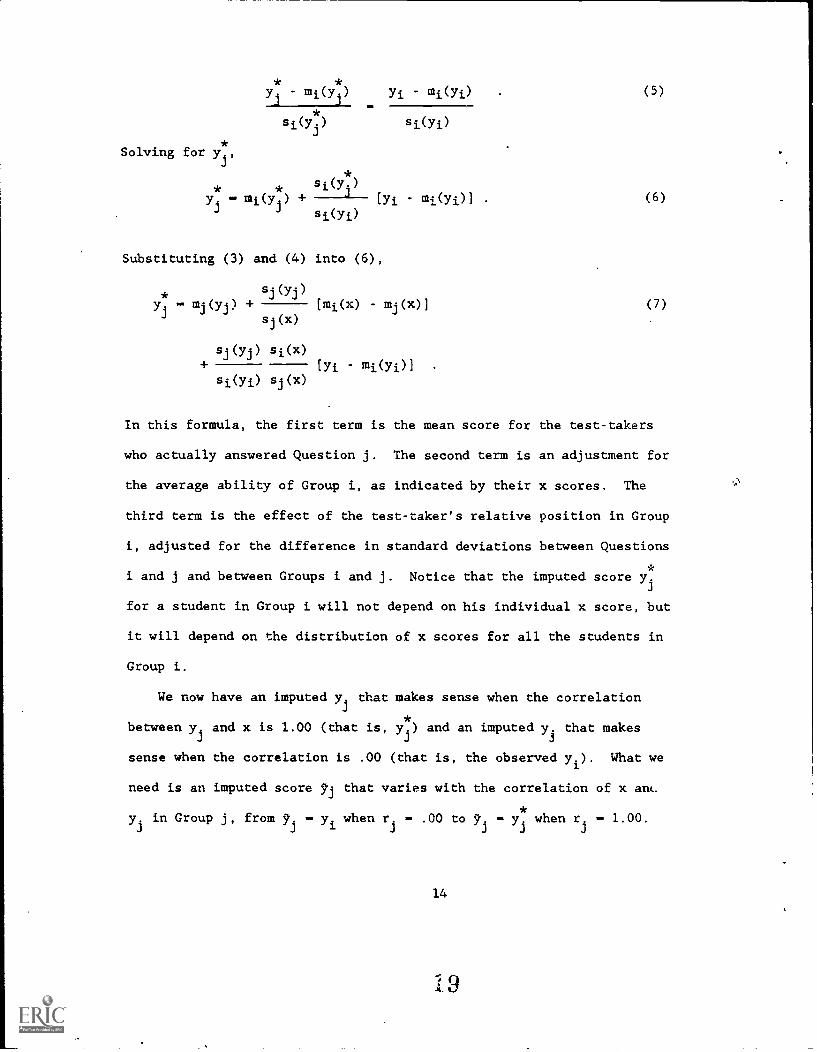
Yj mi(Yj) Yi mi(YO (5)
si (Y .) si(yi)
Solving for y*
j'
s(y)Y. - mi(Y )J si(yi)
[Yi mi(Yi)]
Substituting (3) and (4) into (6),
Yi
sj(yj)
mj(y.i)[mi(x) - mj(x)]
sj(x)
sj(yj) s(x)
[Yi mi(Yi)]si(yi) sj(x)
(6)
(7)
In this formula, the first term is the mean score for the test-takers
who actually answered Question j. The second term is an adjustment for
the average ability of Group i, as indicated by their x scores. The
third term is the effect of the test-taker's relative position in Group
i, adjusted for the difference in standard deviations between Questions
i and j and between Groups i and j. Notice that the imputed score .Yj
for a student in Group i will not depend on his individual x score, but
it will depend on the distribution of x scores for all the students in
Group i.
We now have an imputed yj that makes sense when the correlation
betweenyandxis1.00(thatis, Yj .)and an imputed y. that makes3
sense when the correlation is .00 (that is, the observed yi). What we
need is an imputed score yj that varies with the correlation of x ant.
y.inGroupj,fromy.-ys.rhenr.-.00 to y. y. when r. - 1.00.3 i J J
14

Onewaytocreateanimputedscore.that has these properties is byYj
the formula
. (1 - r.) y + r. y..5rJ J J
Note that this solution will still have the desired properties if
(8)
we substituteforr.anycontinuouslyincreasingfunctionofr.that
equalszero4henr..00andonewhenr.-1.00. Therefore, this
solution lacks a rationale that makes it thl correct solution. It is
only one of many acceptable solutions. (Note, however, that the same
criticism could be made of any statistical technique derived from the
principle of least squares. It would be just as reasonable, if less
convenient mathematically, to minimize the sum of the absolute
deviations, or of ly - y13/2
. The sum of any continuously increasing
function of the size of the deviations could be chosen as the quantity
to be minimized.)
Once we have either observed or imputed a score for the test-taker
on each alternate question, we need to do two more things. First,
average the observed and imputed scores over all the alternate
questions
Yadj (1/q) (Yi E 9.j)
where the sum is over all the alternate questions not answered by the
(9)
test-taker, and q is the number of alternate questions.
In the case of the AP history tests, the common portion consists of
two separate sections, measuring somewhat different abilities. The
preceding developm..mt applies in this multivariate case, but with a few
modifications. In place of a single x score, we must use a composite x
todeterminethemeanandstandarddeviationof Yj _It makes sense to
15
BEST COPY AVAILABLE
0

usethecompositethatbestpredicts yj .in Group j, that is, the
regression estimate 9j in the model
- bio bi2,j2 (10)
Inplaceofr.we must use the correlation of yj with this
compositeinGroupj,whichisthemultiplecorrelationR..The
formulas are parallel to those in the single-predictor case, except
that x is replaced by 3,j. Thus equation 7 becomes
sj(yj)
j(Yj) + A (mi(Yj) - mj(h)]yj msj (yj )
sj(yj) si(5;j)
[Yi mi(Yi)]si(yi) sj(yj)
and equation 8 becomes
yj - ( 1 - Rj ) yi + Rj y*j(12)
^Now substitute equation 11 into equation 12 and note that, since yj is
a regression estimate in Group j,
sj(yj) 1 (13)
sj(9j) Rj
The result is
yi - (1 - Rj) yi + Rj mj(yj) (mi(9j) mj(9j)]
si(yj)
[Yi mi(Yi)]si(yi)
16
(14)
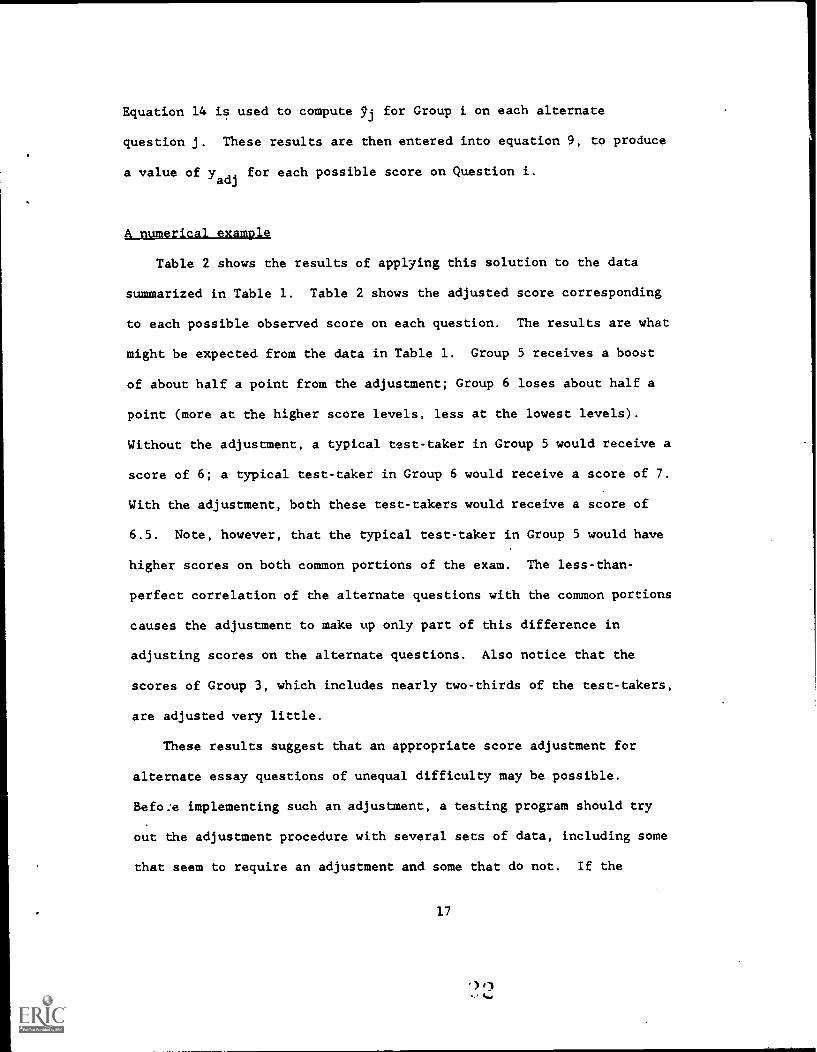
Equation 14 is used to compute yj for Group i on each alternate
question j. These results are then entered into equation 9, to produce
a value of yadj
for each possible score on Question i.
A numerical example
Table 2 shows the results of applying this solution to the data
summarized in Table 1. Table 2 shows the adjusted score corresponding
to each possible observed score on each question. The results are what
might be expected from the data in Table 1. Group 5 receives a boost
of about half a point from the adjustment; Group 6 loses about half a
point (more at the higher score levels, less at the lowest levels).
Without the adjustment, a typical test-taker in Group 5 would receive a
score of 6; a typical test-taker in Group 6 would receive a score of 7.
With the adjustment, both these test-takers would receive a score of
6.5. Note, however, that the typical test-taker in Group 5 would have
higher scores on both common portions of the exam. The less-than-
perfect correlation of the alternate questions with the common portions
causes the adjustment to make up only part of this difference in
adjusting scores on the alternate questions. Also notice that the
scores of Group 3, which includes nearly two-thirds of the test-takers,
are adjusted very little.
These results suggest that an appropriate score adjustment for
alternate essay questions of unequal difficulty may be possible.
Befo:e implementing such an adjustment, a testing program should try
out the adjustment procedure with several sets of data, including some
that seem to require an adjustment and some that do not. If the
17

Ati,results of these tryouts are reasonable, and if the adjustment can be
integrated into the scoring process, the result should be a set of
scores that are a fairer and more valid indication of the test-takers'
knowledge and ability.

References
Braun, H. (1986) Calibration of essay readers. Unpublishedmanuscript, Educational Testing Service, Princeton, NJ.
Cowell, W. R. (1972) A technique for equating essay question scores.Statistical Report SR-72-20. Princeton, NJ: Educational Testing
Service.
Rosenbaum, P. R. (1985) A generalization of direct adjustment, with anapplication to the scaling of essay scores. Program StatisticsResearch Technical Report No. 85-55. Princeton, NJ: Educational
Testing Service.
Rubin, D. B. and Thayer, D. (1978) Relating tests given to different
samples. Psychometrika, 43, 3-10.
19

Table 1. Example of scores suggesting the need for an adjustment.
Group Selecting Alternate Question
2 3 4 5 6
Number of test-takers 3,411 38,445 1,390 10,382 5,180
Common multiple-choicesection (100 points)
Mean 45.2 47.7 47.9 48.8 41.5
SD 16.7 15.6 18.1 15.6 17.4
Common essay(15 points)
Mean 6.0 6.8 7.1 6.6 6.2
SD 2.6 2.4 2.8 2.3 2.3
Alternate essay question(15 points)
Mean 6.4 6.9 6.6 5.9 7.1
SD 2.9 2.4 2.8 2.4 2.8

Unadjusted
Table 2. Example of adjusted scores.
Question
Score 2 3 4 5 6
0 0.3 0.1 0.2 0.6 -0.2
1 1.2 1.0 1.2 1.6 0.8
2 2.2 2.0 2.2 2.6 1.7
3 3.1 3.0 3.2 3.6 2.7
4 4.0 4.0 4.2 4.6 3.6
5 5.0 5.0 5.2 5.6 4.6
6 5.9 6.0 6.2 6.5 5.6
7 6.9 7.0 7.2 7.5 6.5
8 7.8 7.9 8.2 8.5 7.5
9 8.7 8.9 9.2 9.5 8.4
10 9.7 9.9 10.2 10.5 9.4
11 10.6 10.9 11.2 11.5 10.4
12 11.5 11.9 12.2 12.4 11.3
13 12.5 12.9 13.2 13.4 12.3
14 13.4 13.9 14.2 14.4 13.2
15 14.3 14.9 15.1 15.4 14.2
Recommended