Do you believe in Asia? The extraordinary opportunities opening up in Asian fixed income, Chinese bonds and the renminbi
Product specialist, Asian fixed income
Geoffrey Lunt
Non contractual document only intended for professional investors as defined by MiFID

AM
FR
_E
xt_
10
2_
20
14
2
AM
FR
_E
xt_
10
2_
20
14
2
Asian fixed income
Source: HSBC Global Asset Management, Bloomberg, as at 31 December 2013. Based on HSBC Asian Local Bond Index.
The conventional geographical
definition of Asian fixed income is
different to that of Asia
The market as a whole is worth
about USD8 billion
It comprises of hard currency and
local currency markets
Some are difficult for foreigners to
access
Philippines
Singapore
South Korea
Taiwan
Thailand
China
India
Malaysia Indonesia
Hong Kong
Non contractual document
AM
FR
_E
xt_
10
2_
20
14
3
AM
FR
_E
xt_
10
2_
20
14
3
Asian fixed income
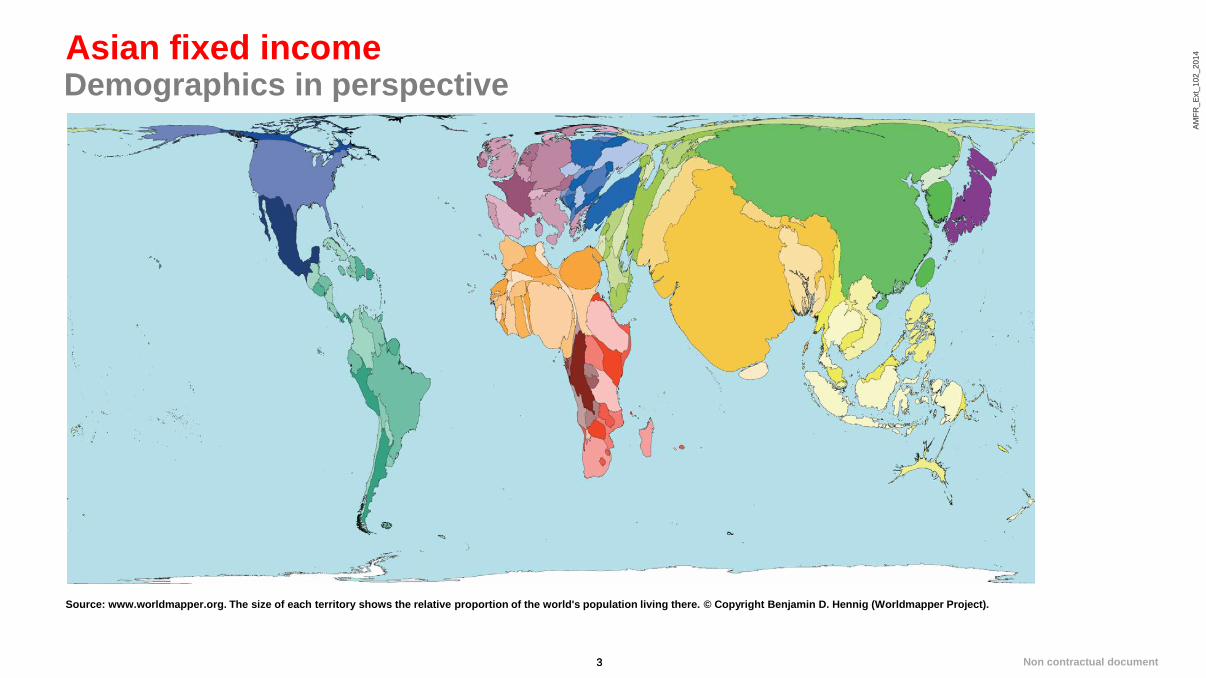
Source: www.worldmapper.org. The size of each territory shows the relative proportion of the world's population living there. © Copyright Benjamin D. Hennig (Worldmapper Project).
Demographics in perspective
Non contractual document

AM
FR
_E
xt_
10
2_
20
14
4
AM
FR
_E
xt_
10
2_
20
14
4
Representation of Asia in global bond indices
Source: Citigroup, WGBI Index, December 2013.
Asia is remarkably under represented
Despite the clear economic importance of the region, Asia ex Japan bond markets represent
less than 1% of the world government bond index
Country Weight (%)
US 28.65
Japan 26.45
France 7.57
Italy 7.46
Germany 6.69
UK 5.82
Spain 3.91
Netherlands 2.10
Belgium 2.07
Malaysia 0.38
Singapore 0.27
Other 8.63
0.65%
Non contractual document

AM
FR
_E
xt_
10
2_
20
14
5
AM
FR
_E
xt_
10
2_
20
14
5
… as well as within the emerging markets
Source: JP Morgan Morgan Markets, IMF, World Economic Outlook Database April 2013. *Countries included are those that are included in the GBI-EM Broad Index as of 31 March 2013.
While Asia accounts for more than 60% of the total GDP of the emerging market universe, the
current weighting of Asia within the investable GBI-EM Global Index is less than 20%
Weightings within GBI-EM Global vs % of GDP in Global EMs
17.0%
31.7% 26.3%
11.3%
62.3%
17.2% 14.8%
5.8%
0%
10%
20%
30%
40%
50%
60%
70%
EM Asia EM Latin America EM Europe EM ME & Africa
% % weights in GBI-EM Global Index % of GDP in Global Emerging Markets
Non contractual document

Asia today

AM
FR
_E
xt_
10
2_
20
14
7
AM
FR
_E
xt_
10
2_
20
14
7
2013 - Asian crisis Mk II?
Source: Bloomberg, data as at 31 December 2013. Based on HSBC Asian Local Bond Index, in USD terms.
The Asian local currency bond market has posted a positive return every year since 2001,
except 2013
7.7
19.3
7.0
10.4
2.0
13.3
8.2
1.0
6.3
12.2
5.0
8.9
-5.7 -8
-6
-4
-2
0
2
4
6
8
10
12
14
16
18
20
2001 2002 2003 2004 2005 2006 2007 2008 2009 2010 2011 2012 2013
Calendar year performance of the Asian local currency bond markets in USD (%)
Non contractual document

AM
FR
_E
xt_
10
2_
20
14
8
AM
FR
_E
xt_
10
2_
20
14
8
Severe weakness was confined to a few markets
Source: Bloomberg, data as at 31 December 2013. Based on HSBC Asian Local Bond Index, in USD terms.
The poor performance was not broad-based across the region
Performance of individual Asian local currency bond markets (in USD) in 2013 (%)
6.8
2.5
2.4
-2.5
-2.7
-4.3
-4.7
-5.9
-6.0
-10.3
-31.3
-40.0 -30.0 -20.0 -10.0 0.0 10.0
China offshore
China onshore
Korea
Hong Kong
Philippines
Thailand
Taiwan
Singapore
Malaysia
India
Indonesia
Non contractual document
AM
FR
_E
xt_
10
2_
20
14
9
AM
FR
_E
xt_
10
2_
20
14
9
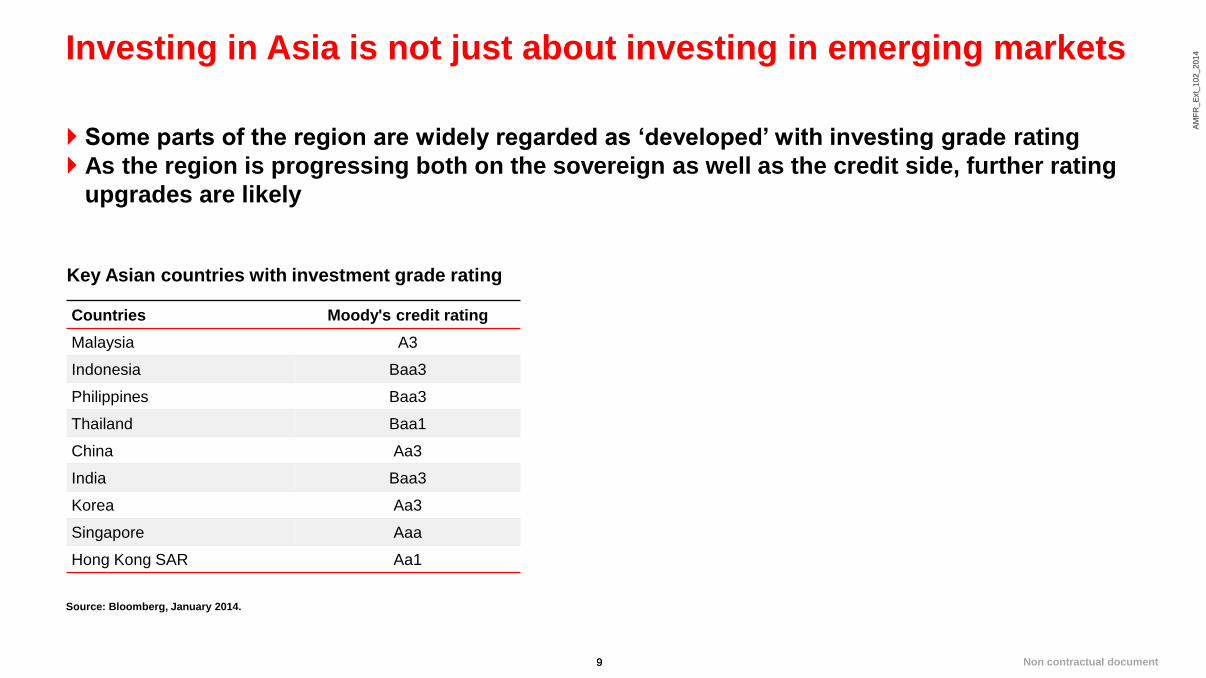
Investing in Asia is not just about investing in emerging markets
Source: Bloomberg, January 2014.
Some parts of the region are widely regarded as ‘developed’ with investing grade rating
As the region is progressing both on the sovereign as well as the credit side, further rating
upgrades are likely
Key Asian countries with investment grade rating
Countries Moody's credit rating
Malaysia A3
Indonesia Baa3
Philippines Baa3
Thailand Baa1
China Aa3
India Baa3
Korea Aa3
Singapore Aaa
Hong Kong SAR Aa1
Non contractual document

AM
FR
_E
xt_
10
2_
20
14
10
AM
FR
_E
xt_
10
2_
20
14
10
Asia is much more resilient now
Generally, current account positions are strong
Currencies are generally floating
Forex reserves are higher
Current account deficits generally better now…
Source: Haver Analytics, Goldman Sachs September 2013.
…as is total external debt to GDP
Non contractual document
AM
FR
_E
xt_
10
2_
20
14
11
AM
FR
_E
xt_
10
2_
20
14
11
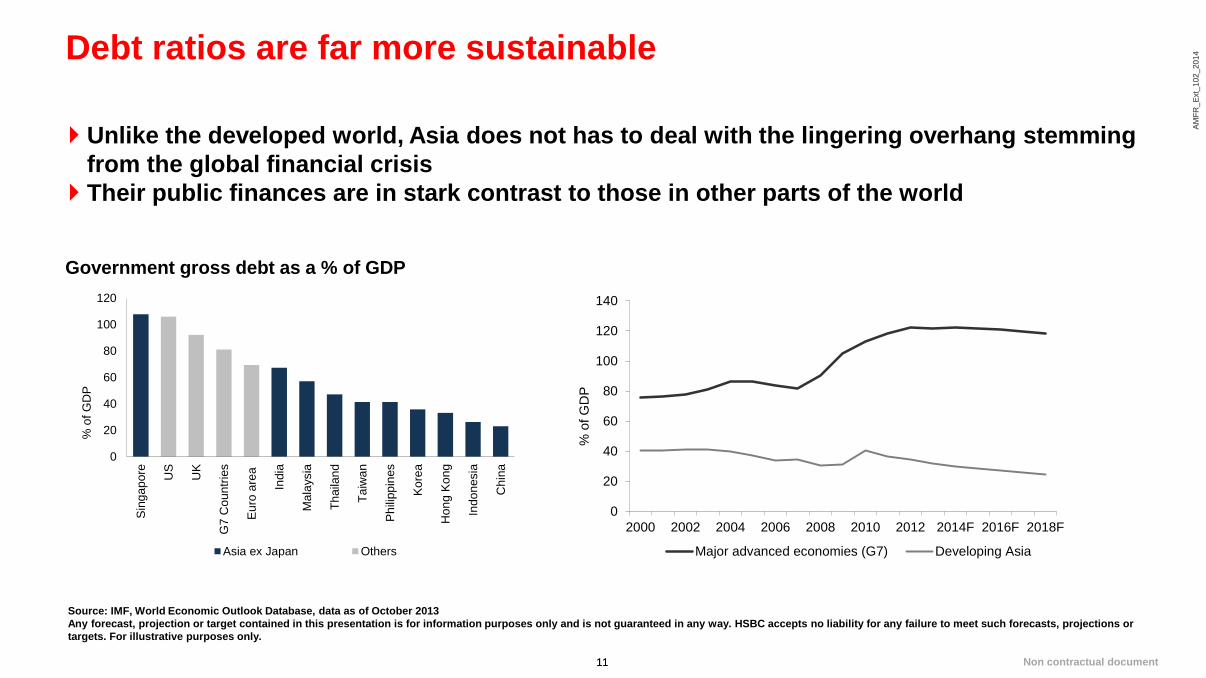
Debt ratios are far more sustainable
Source: IMF, World Economic Outlook Database, data as of October 2013
Any forecast, projection or target contained in this presentation is for information purposes only and is not guaranteed in any way. HSBC accepts no liability for any failure to meet such forecasts, projections or
targets. For illustrative purposes only.
Unlike the developed world, Asia does not has to deal with the lingering overhang stemming
from the global financial crisis
Their public finances are in stark contrast to those in other parts of the world
Government gross debt as a % of GDP
0
20
40
60
80
100
120
Sin
ga
pore
US
UK
G7
Co
un
trie
s
Eu
ro a
rea
India
Ma
laysia
Th
aila
nd
Ta
iwa
n
Ph
ilipp
ines
Ko
rea
Hon
g K
on
g
Indo
nesia
Chin
a
% o
f G
DP
Asia ex Japan Others
0
20
40
60
80
100
120
140
2000 2002 2004 2006 2008 2010 2012 2014F 2016F 2018F
% o
f G
DP
Major advanced economies (G7) Developing Asia
Non contractual document
AM
FR
_E
xt_
10
2_
20
14
12
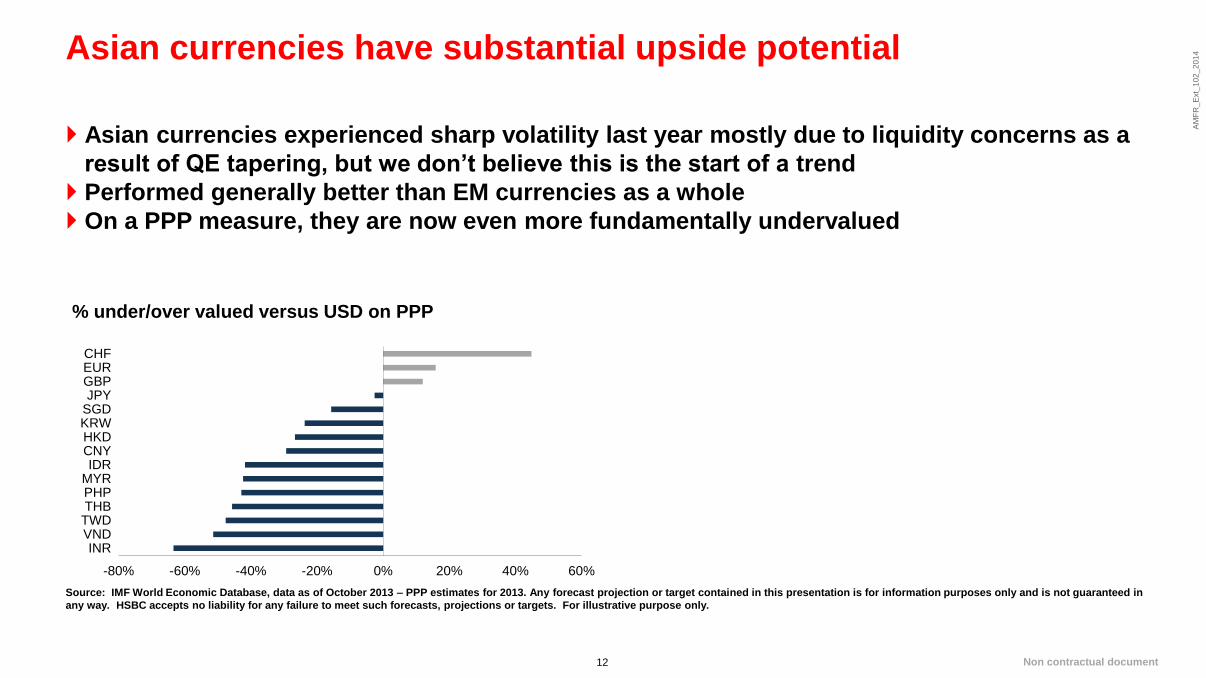
Asian currencies have substantial upside potential
Source: IMF World Economic Database, data as of October 2013 – PPP estimates for 2013. Any forecast projection or target contained in this presentation is for information purposes only and is not guaranteed in
any way. HSBC accepts no liability for any failure to meet such forecasts, projections or targets. For illustrative purpose only.
Asian currencies experienced sharp volatility last year mostly due to liquidity concerns as a
result of QE tapering, but we don’t believe this is the start of a trend
Performed generally better than EM currencies as a whole
On a PPP measure, they are now even more fundamentally undervalued
% under/over valued versus USD on PPP
-80% -60% -40% -20% 0% 20% 40% 60%
INRVNDTWDTHBPHPMYRIDR
CNYHKDKRWSGDJPYGBPEURCHF
Non contractual document

AM
FR
_E
xt_
10
2_
20
14
13
Asia compared to Europe- which would you prefer?
Source: 1. Bloomberg, as of December 2013. 2. IMF World Economic Outlook, October 2013. IMF estimates for 2013.
The valuations are striking
Korea Belgium China France
Moody’s credit rating1 Aa3 Aa3 Aa3 Aa1
10-yr govt yield1 3.6% 2.6% 4.6% 2.6%
GDP growth2 2.8% 0.09% 7.6% 0.19%
GDP in USD (bil)2 1,197.5 507.4 8,939.3 2,738.7
Debt to GDP2 35.7% 100.9% 22.9% 93.5%
Population (mil)2 50.2 11.1 1,360.8 63.7
Asia vs Europe
Non contractual document

AM
FR
_E
xt_
10
2_
20
14
14
….in the credit world as well as the sovereign
Source: Bloomberg, as of January 2014. Asia High Yield = JPMorgan Asia Credit Index non- investment grade; Euro High Yield = BofA Euro High Yield Index.
4.0
4.5
5.0
5.5
6.0
6.5
7.0
7.5
8.0
8.5
1/16/2013 2/27/2013 4/10/2013 5/22/2013 7/3/2013 8/14/2013 9/25/2013 11/6/2013 12/18/2013
Yie
ld t
o W
ors
t
Euro High Yield Asia High Yield
Asia vs Euro high yield
Non contractual document

Do you believe in Asia?

AM
FR
_E
xt_
10
2_
20
14
16
Should we be surprised that China is taking back its place as an
economic superpower?
Source: “Statistics on World Population, GDP and Per Capita GDP, 1-2008 AD”, Angus Maddison, University of Groningen.
Economic history of China and other major powers
Share of world GDP Non-Asian ancient civilisations
Non contractual document
AM
FR
_E
xt_
10
2_
20
14
17
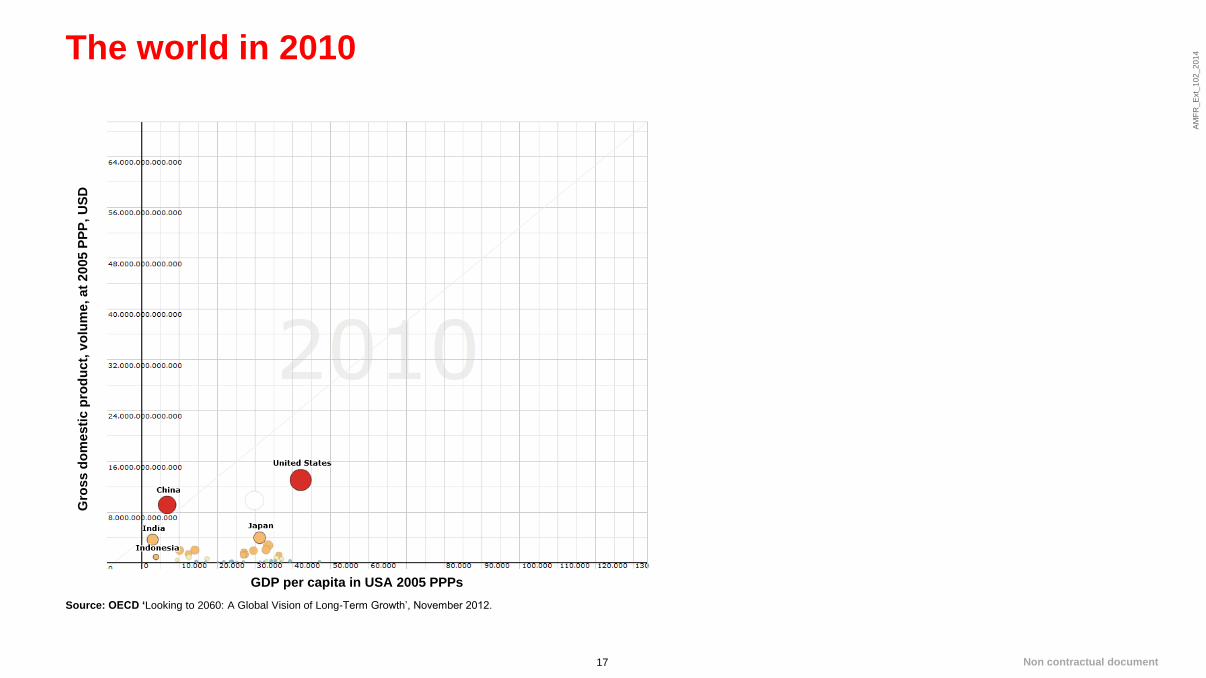
The world in 2010
Source: OECD ‘Looking to 2060: A Global Vision of Long-Term Growth’, November 2012.
Gro
ss d
om
esti
c p
rod
uct,
vo
lum
e, at
2005 P
PP
, U
SD
GDP per capita in USA 2005 PPPs
Non contractual document
AM
FR
_E
xt_
10
2_
20
14
18
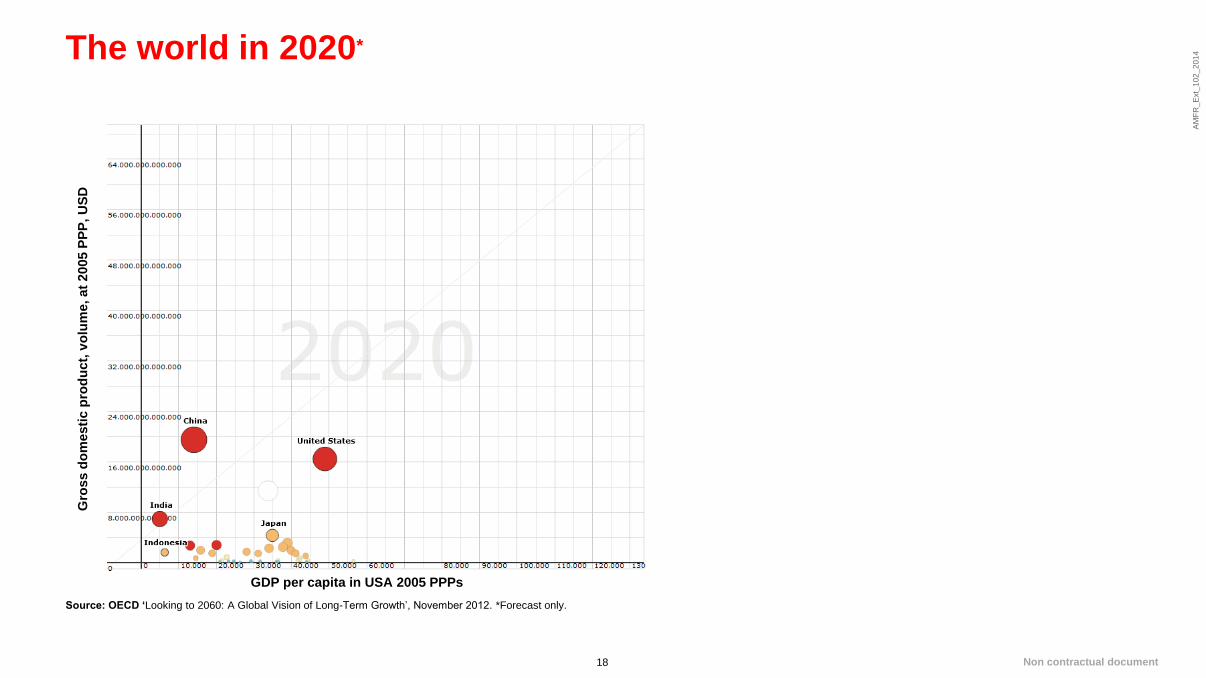
The world in 2020*
Source: OECD ‘Looking to 2060: A Global Vision of Long-Term Growth’, November 2012. *Forecast only.
Gro
ss d
om
esti
c p
rod
uct,
vo
lum
e, at
2005 P
PP
, U
SD
GDP per capita in USA 2005 PPPs
Non contractual document
AM
FR
_E
xt_
10
2_
20
14
19
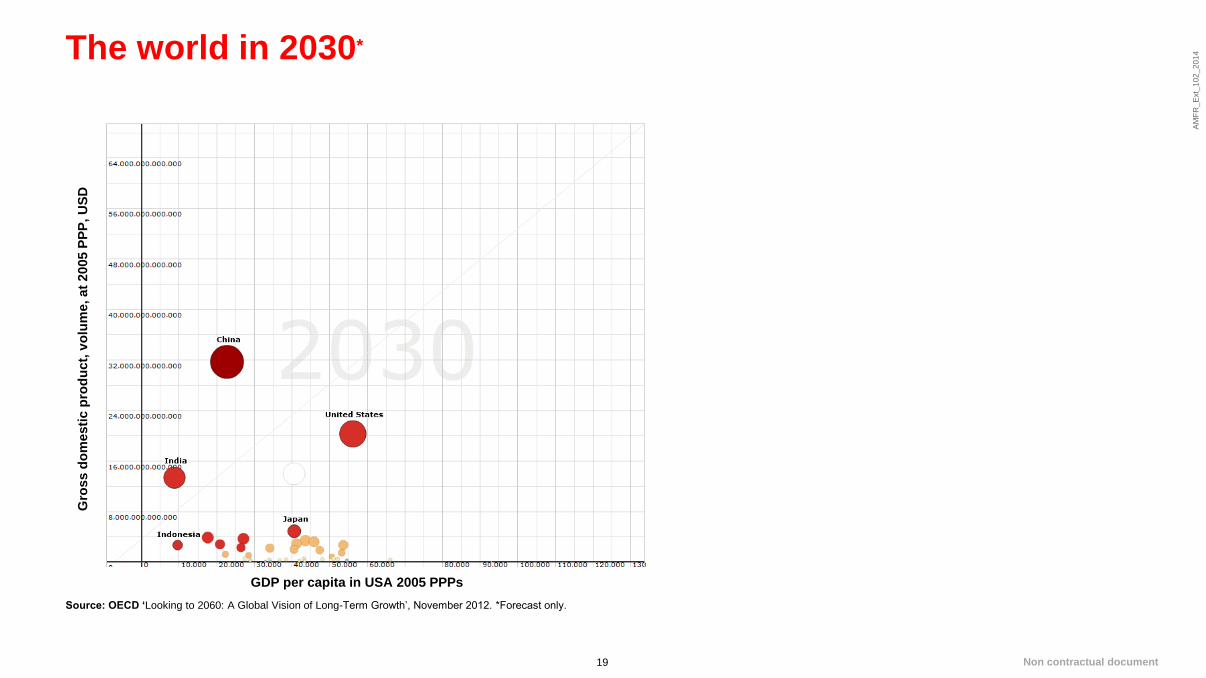
The world in 2030*
Source: OECD ‘Looking to 2060: A Global Vision of Long-Term Growth’, November 2012. *Forecast only.
Gro
ss d
om
esti
c p
rod
uct,
vo
lum
e, at
2005 P
PP
, U
SD
GDP per capita in USA 2005 PPPs
Non contractual document
AM
FR
_E
xt_
10
2_
20
14
20
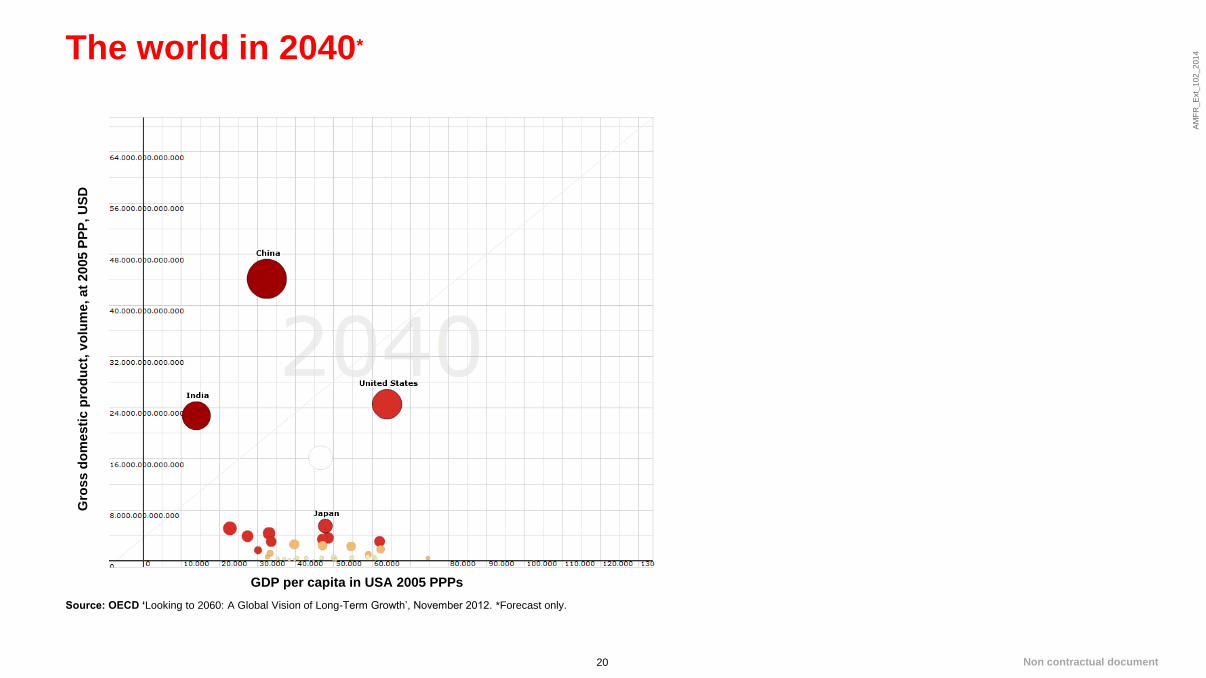
The world in 2040*
Source: OECD ‘Looking to 2060: A Global Vision of Long-Term Growth’, November 2012. *Forecast only.
Gro
ss d
om
esti
c p
rod
uct,
vo
lum
e, at
2005 P
PP
, U
SD
GDP per capita in USA 2005 PPPs
Non contractual document

AM
FR
_E
xt_
10
2_
20
14
21
The world in 2050*
Source: OECD ‘Looking to 2060: A Global Vision of Long-Term Growth’, November 2012. *Forecast only.
Gro
ss d
om
esti
c p
rod
uct,
vo
lum
e, at
2005 P
PP
, U
SD
GDP per capita in USA 2005 PPPs
Non contractual document

AM
FR
_E
xt_
10
2_
20
14
22
The world in 2060*
Source: OECD ‘Looking to 2060: A Global Vision of Long-Term Growth’, November 2012. *Forecast only.
Gro
ss d
om
esti
c p
rod
uct,
vo
lum
e, at
2005 P
PP
, U
SD
GDP per capita in USA 2005 PPPs
Non contractual document
AM
FR
_E
xt_
10
2_
20
14
23
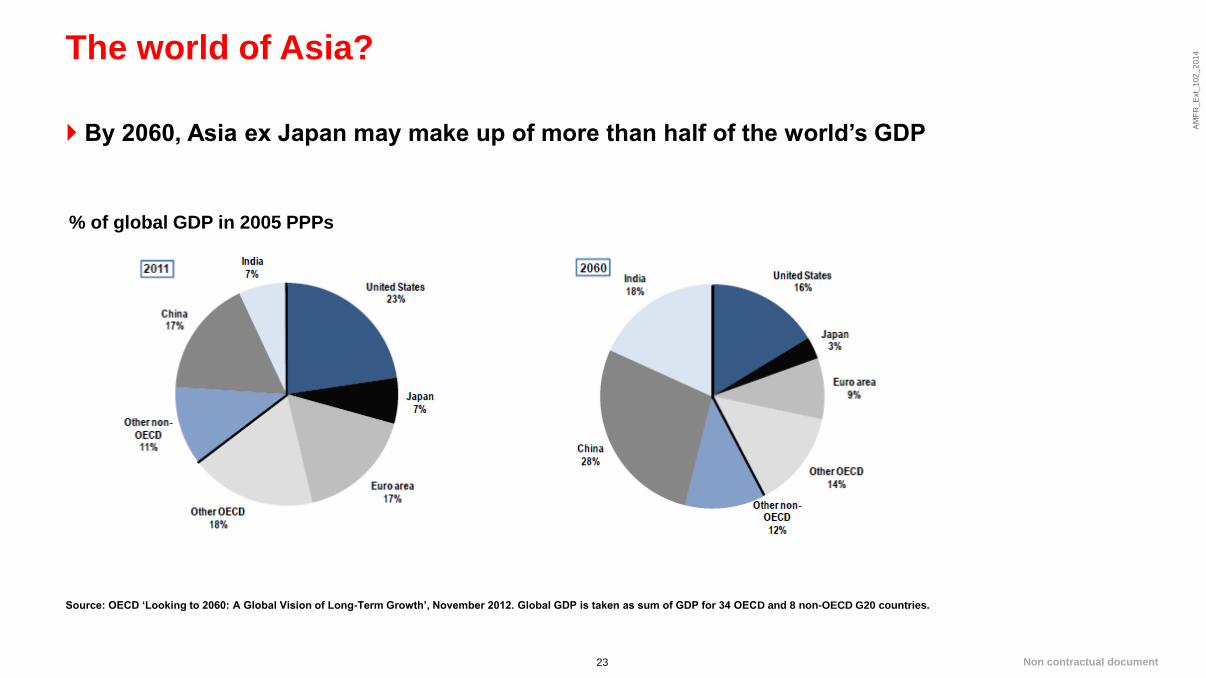
The world of Asia?
Source: OECD ‘Looking to 2060: A Global Vision of Long-Term Growth’, November 2012. Global GDP is taken as sum of GDP for 34 OECD and 8 non-OECD G20 countries.
By 2060, Asia ex Japan may make up of more than half of the world’s GDP
% of global GDP in 2005 PPPs
Non contractual document

AM
FR
_E
xt_
10
2_
20
14
24
The RMB bond markets
Source: HSBC, Asian Development Bank, as of November 2013. *Refer to CIBM.
Offshore market
Began mid 2010, but growing quickly
More broad based issuer and investor base
Can be accessed by all offshore investors
Onshore market*
One of the largest bond markets in the world
Accessible on a restricted basis
to certain foreign investor types
– RMB clearing banks
– RMB settlement banks
– Central banks
– Insurance companies
– Supranational entities
– RQFII (recently expanded)
– QFII
Offshore Onshore*
Size (RMBbn) 558 24,205
Eligible Investors Retail and institutional
Fund managers, private banks, commercial banks,
insurance companies, corporate and central banks are
all active investors in this market
No quota restriction
Onshore institutional investors
Offshore institutions must invest through
QFII and RQFII quota with restriction in proportion
Special quotas for foreign central banks, monetary
authorities, clearing & participating banks, insurers
Non contractual document
AM
FR
_E
xt_
10
2_
20
14
25
0
500
1,000
1,500
2,000
2,500
3,000
3,500
4,000
4,500
5,000
06/9
80
9/9
81
2/9
80
3/9
90
6/9
90
9/9
91
2/9
90
3/0
00
6/0
00
9/0
01
2/0
00
3/0
10
6/0
10
9/0
11
2/0
10
3/0
20
6/0
20
9/0
21
2/0
20
3/0
30
6/0
30
9/0
31
2/0
30
3/0
40
6/0
40
9/0
41
2/0
40
3/0
50
6/0
50
9/0
51
2/0
50
3/0
60
6/0
60
9/0
61
2/0
60
3/0
70
6/0
70
9/0
71
2/0
70
3/0
80
6/0
80
9/0
81
2/0
80
3/0
90
6/0
90
9/0
91
2/0
90
3/1
00
6/1
00
9/1
01
2/1
00
3/1
10
6/1
10
9/1
11
2/1
10
3/1
20
6/1
20
9/1
21
2/1
20
3/1
30
6/1
30
9/1
3
Govt (in USD Billions) Corp (in USD Billions)
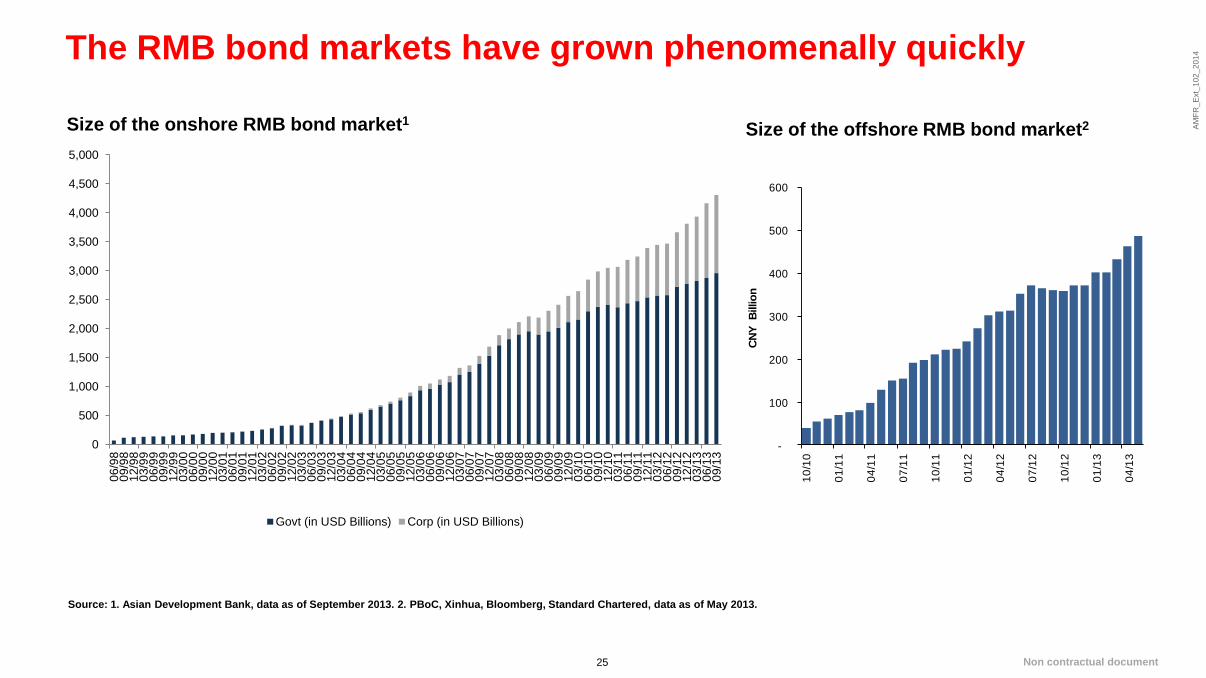
The RMB bond markets have grown phenomenally quickly
Source: 1. Asian Development Bank, data as of September 2013. 2. PBoC, Xinhua, Bloomberg, Standard Chartered, data as of May 2013.
Size of the onshore RMB bond market1 Size of the offshore RMB bond market2
-
100
200
300
400
500
600
10
/10
01
/11
04
/11
07
/11
10
/11
01
/12
04
/12
07
/12
10
/12
01
/13
04
/13
CN
Y
Billio
n
Non contractual document

AM
FR
_E
xt_
10
2_
20
14
26
If China is included, what might the world government bond index
look like?
Source: HSBC Global Asset Management, Chinabond, Citigroup. Based on WGBI Index, December 2013. Any forecast, projection or target contained in this presentation is for information purposes only and is not guaranteed in any way. HSBC accepts no liability for any failure to meet such forecasts, projections or targets. For illustrative purposes only.
The world government bond index does not cover China currently
If we include the Chinese onshore government bond market, it would account for around 13%
0
5
10
15
20
25
Market weight of the WGBI Index (with China)
US 25%
Japan 23%
China 13%
Europe 35%
Other 4%
Non contractual document

AM
FR
_E
xt_
10
2_
20
14
27
If China is included, what might the world government bond index
look like in 2030?
Assuming the size of the bond markets grows in the same rate as the projected GDP growth rate, the Chinese onshore government bond market would account for around 23% in 2030, catching up with the US
Market weight of the WGBI Index (with China)
Source: HSBC Global Asset Management, Chinabond, Citigroup. Based on WGBI Index, December 2013. Any forecast, projection or target contained in this presentation is for information purposes only and is not
guaranteed in any way. HSBC accepts no liability for any failure to meet such forecasts, projections or targets. For illustrative purposes only.
US 23.9
Japan 17.4
China 22.7
Europe 31.0
Other 5.0
Non contractual document
AM
FR
_E
xt_
10
2_
20
14
28
Tap the enormous potential in Asian fixed income and China’s
bond markets
Source: HSBC Global Asset Management, January 2014.
Our product offerings:
Asian hard currency bonds
Asian local currency bonds
Indian fixed income
Asian high yield bonds
Offshore RMB bonds
Onshore RMB bonds
Onshore RMB money market
Non contractual document

AM
FR
_E
xt_
10
2_
20
14
29
AM
FR
_E
xt_
10
2_
20
14
29
Key risks
Investor should be reminded that investment in some of the developing Asian countries may involve special considerations and risks. Political
changes, government regulation, social instability or diplomatic development , etc. could affect adversely the economies of such countries or
the value of the investment.
Change of interest rate may affect the value of the investments. Bonds and other fixed income securities are more susceptible to fluctuation in
interest rate and may fall in value if interest rates change.
The assets and liabilities of the investments may be denominated in Asian currencies which is different from the base currency of the
investments. Therefore, the investments maybe affected favorably or unfavorably by exchange control regulation or changes in the exchange
rates between the base currency and other currencies.
The investments may have exposure in credit risk whereby investments in non- investment grade debt obligations involves a high amount of
risk. An issuer suffering an adverse change in its financial condition could lower the credit quality of a security, leading to greater price volatility
of the security.
Investments made may have exposure in financial derivative instruments, such as futures, forwards and swaps, etc. Investments in financial
derivative instruments may involve a greater degree of risk than in case with conventional securities and may subject to liquidity and
counterparty risks.
Currency movement and market condition may affect the value of investments
Non contractual document

AM
FR
_E
xt_
10
2_
20
14
30
AM
FR
_E
xt_
10
2_
20
14
30
Important information
This presentation is distributed by HSBC Global Asset Management (France) and is only intended for professional investors as defined by MiFID.
It is incomplete without the oral briefing provided by the representatives of HSBC Global Asset Management (France). The information contained herein is subject to change without notice. All non-authorised reproduction or use of this commentary and analysis will be the responsibility of the user and will be likely to lead to legal proceedings. This document has no contractual value and is not by any means intended as a solicitation, nor a recommendation for the purchase or sale of any financial instrument in any jurisdiction in which such an offer is not lawful. The commentary and analysis presented in this document reflect the opinion of HSBC Global Asset Management on the markets, according to the information available to date. They do not constitute any kind of commitment from HSBC Global Asset Management (France). Consequently, HSBC Global Asset Management (France) will not be held responsible for any investment or disinvestment decision taken on the basis of the commentary and/or analysis in this document.
All data come from HSBC Global Asset Management unless otherwise specified. Any third party information has been obtained from sources we believe to be reliable, but which we have not independently verified. Representative overview of the investment process, which may differ by product, client mandate or market conditions.
The fund presented in this document may not be registered and/or authorised for sale in your country. The performance figures displayed in the document relate to the past and past performance should not be seen as an indication of future returns. It is important to remember that the value of investments and any income from them can go down as well as up and is not guaranteed. Please note that the fund is authorised to invest a in structured products and derivatives, which may be less liquid than standard bond issues. Please note that the fund is invested in investment grade, below investment grade and non rated issues. Non rated issues represent a higher risk of default compared to Investment Grade issues. Fluctuations in the rate of exchange of currencies may have a significant impact on fund performance. Please note that according to article 314-13 of AMF General Regulation, performance for periods of less than 12 months cannot be shown to non-professional investors, as defined by MiFID.
Any forecast, projection or target where provided is indicative only and is not guaranteed in any way. HSBC Global Asset Management (France) accepts no liability for any failure to meet such forecast, projection or target.
The above mentioned target/limits/objectives is/are to be considered on the recommended minimum investment period; there can be no assurance that the strategy of the fund will achieve this objective.
The fund is exposed to Over the Counter (OTC) markets for all or part of its total assets. The fund will therefore be subject to the risk that its direct counterparty will not perform its obligations under the OTC transactions and that the Sub-Fund will sustain losses.
Investment in Financial Derivative Instruments (FDI) may result in losses in excess of the amount invested. This is because a small movement in the price of the underlying financial instrument may result in a substantial movement in the price of the FDI. The performance figures displayed in the document relate to the past and past performance should not be seen as an indication of future returns.
All subscriptions in any fund presented in this document are accepted only on the basis of the current prospectus, available on request from HSBC Global Asset Management (France), the centralisation agent, the financial department or the usual representative. Before subscription, investors should refer to the Key Investor Information Document (KIID) and/or the simplified prospectus of the fund as well as its complete prospectus. For more detailed information on the risk associated with the sub-fund, investors should refer to the complete prospectus of the sub-fund. HSBC GIF RMB Fixed Income fund is a sub-fund of HSBC Global Investment Funds, a Luxemburg domiciled SICAV. The shares of HGIF have not been and will not be offered for sale or sold in the United States of America, its territories or possessions and all areas subject to its jurisdiction, or to United States Persons.
HSBC Global Asset Management (France) - 421 345 489 RCS Nanterre.
Portfolio management company authorised by the French regulatory authority AMF (no. GP99026) with capital of 8.050.320 euros
Postal address: 75419 Paris cedex 08
Offices: Immeuble Ile de France - 4 place de la Pyramide - La Défense 9 - 92800 Puteaux – France.
Copyright © 2014. HSBC Global Asset Management (France). All rights reserved. www.assetmanagement.hsbc.com/fr
Non contractual document, updated in January 2014
Recommended

![I Overview of the System and the Basic Statistics [1] General … · 2018-06-02 · 6 2010 2030 2055 2060 2010 2030 2055 2060 2010 2030 2055 2060 2010 2030 2055 2060 127.18 million!](https://img.pdfslide.us/doc/110x75/5f7bc0b24d489855d56d059e/i-overview-of-the-system-and-the-basic-statistics-1-general-2018-06-02-6-2010.jpg)