DDMMHHAASS EEDDWW RREEPPOORRTTSS
GGUUIIDDEE
DMHAS Information Systems Division
February 2015
2
TABLE OF CONTENTS
HOW TO ACCESS REPORTS ...................................................................................................... 3 Reports Documentation .............................................................................................................. 4 DMHAS EDW REPORTS QUICK REFERENCE GUIDE .............................................................. 6 DMHAS QUALITY DASHBOARD REPORT METRICS QUICK REFERENCE GUIDE ................ 7 NAVIGATION IN REPORTS ........................................................................................................ 10 EXPORTING A REPORT ............................................................................................................ 15 PRINTING A REPORT ................................................................................................................ 15 CLIENT LOOK-UP REPORTS .................................................................................................... 16 Program Roster Report ............................................................................................................. 16 Search Clients Report ................................................................................................................ 20 CLIENT DEMOGRAPHICS ......................................................................................................... 21 Agency Consumer Demographics Report ............................................................................... 21 SERVICE HISTORY REPORTS .................................................................................................. 22 Service Summary And Detail Report ........................................................................................ 22 Monthly Service Data Submission Report ............................................................................... 24 ASSESSMENT REPORTS .......................................................................................................... 25 Periodic Assessment 6-Month Tickler Report ......................................................................... 25 Required Assessment Report ................................................................................................... 26 NATIONAL OUTCOME MEASURES .......................................................................................... 27 NOMS Values Report ................................................................................................................. 27 UTILIZATION REPORTS ............................................................................................................ 28 Bed Utilization Report ................................................................................................................ 28 Outpatient Utilization By Loc .................................................................................................... 29 PROVIDER & PROGRAM INFORMATION ................................................................................. 30 Program LOC And Contract Measures Report ........................................................................ 30 Provider Program Information .................................................................................................. 31 DISCHARGE REPORTS ............................................................................................................. 32 Data Quality Admissions And Discharges Report .................................................................. 32 Program Completion Report ..................................................................................................... 33 FORMAT REPORT ...................................................................................................................... 35 HOW TO ENCRYPT (PROTECT) A DOCUMENT....................................................................... 38 HOW TO LOG OUT OF REPORTS ............................................................................................. 39
3
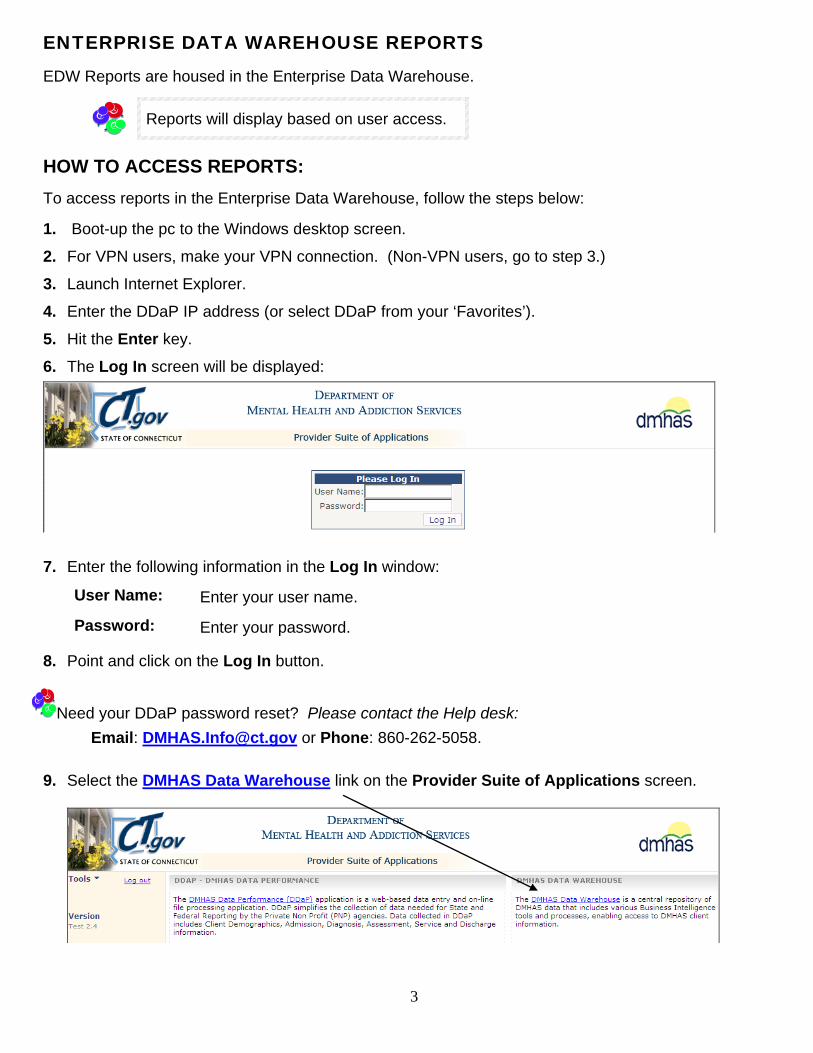
ENTERPRISE DATA WAREHOUSE REPORTS EDW Reports are housed in the Enterprise Data Warehouse.
Reports will display based on user access.
HOW TO ACCESS REPORTS: To access reports in the Enterprise Data Warehouse, follow the steps below: 1. Boot-up the pc to the Windows desktop screen.
2. For VPN users, make your VPN connection. (Non-VPN users, go to step 3.)
3. Launch Internet Explorer.
4. Enter the DDaP IP address (or select DDaP from your ‘Favorites’).
5. Hit the Enter key.
6. The Log In screen will be displayed:
7. Enter the following information in the Log In window:
User Name: Enter your user name.
Password: Enter your password.
8. Point and click on the Log In button.
Need your DDaP password reset? Please contact the Help desk:
Email: [email protected] or Phone: 860-262-5058.
9. Select the DMHAS Data Warehouse link on the Provider Suite of Applications screen.
4
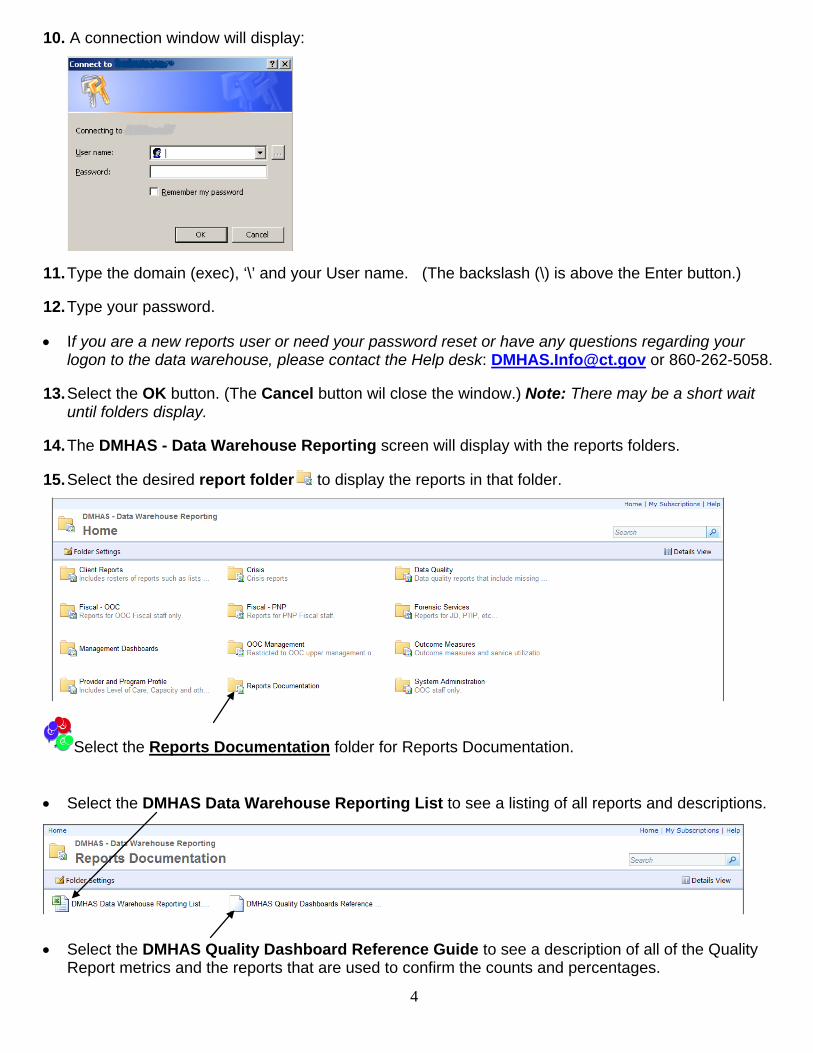
10. A connection window will display:
11. Type the domain (exec), ‘\’ and your User name. (The backslash (\) is above the Enter button.) 12. Type your password.
• If you are a new reports user or need your password reset or have any questions regarding your
logon to the data warehouse, please contact the Help desk: [email protected] or 860-262-5058.
13. Select the OK button. (The Cancel button wil close the window.) Note: There may be a short wait until folders display.
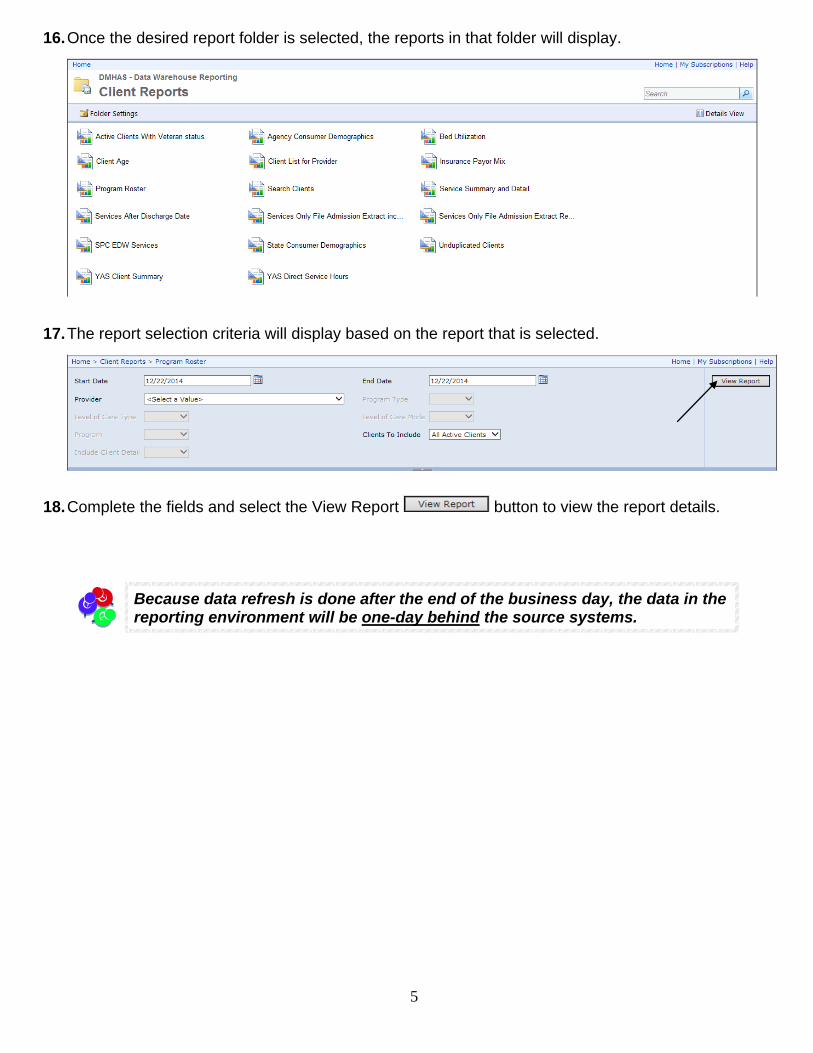
14. The DMHAS - Data Warehouse Reporting screen will display with the reports folders. 15. Select the desired report folder to display the reports in that folder.
Select the Reports Documentation folder for Reports Documentation.
• Select the DMHAS Data Warehouse Reporting List to see a listing of all reports and descriptions.
• Select the DMHAS Quality Dashboard Reference Guide to see a description of all of the Quality Report metrics and the reports that are used to confirm the counts and percentages.
5
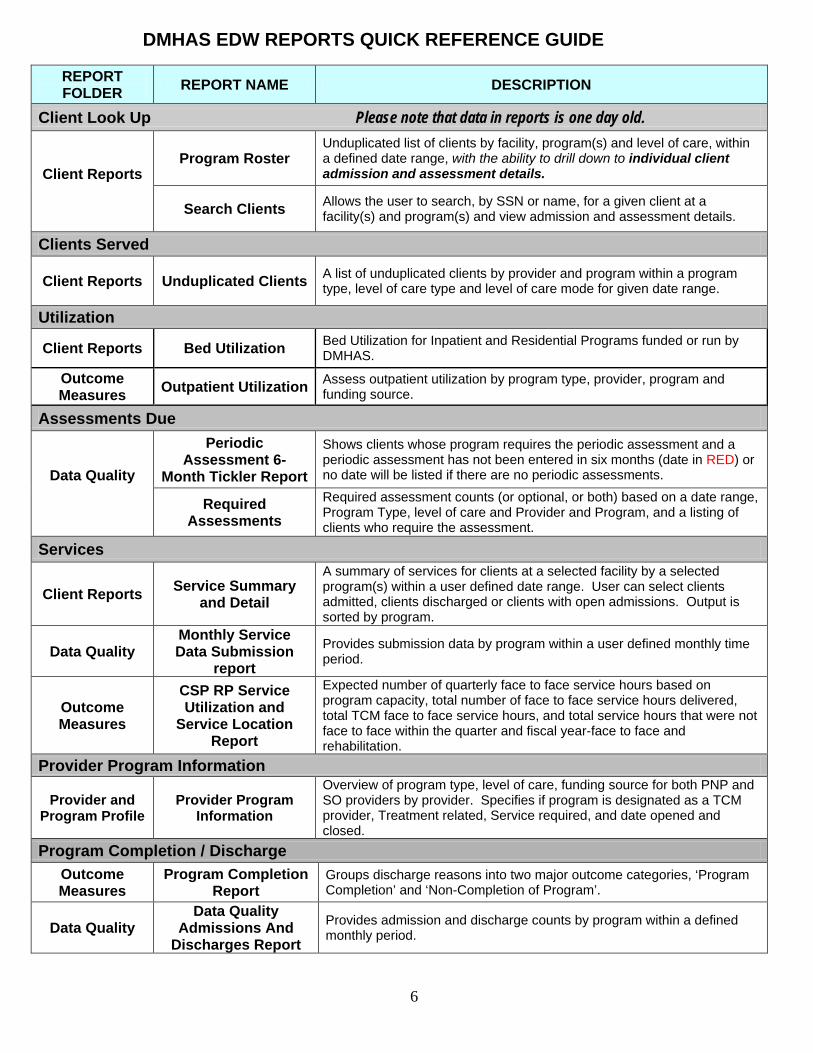
16. Once the desired report folder is selected, the reports in that folder will display.
17. The report selection criteria will display based on the report that is selected.
18. Complete the fields and select the View Report button to view the report details.
Because data refresh is done after the end of the business day, the data in the reporting environment will be one-day behind the source systems.
6
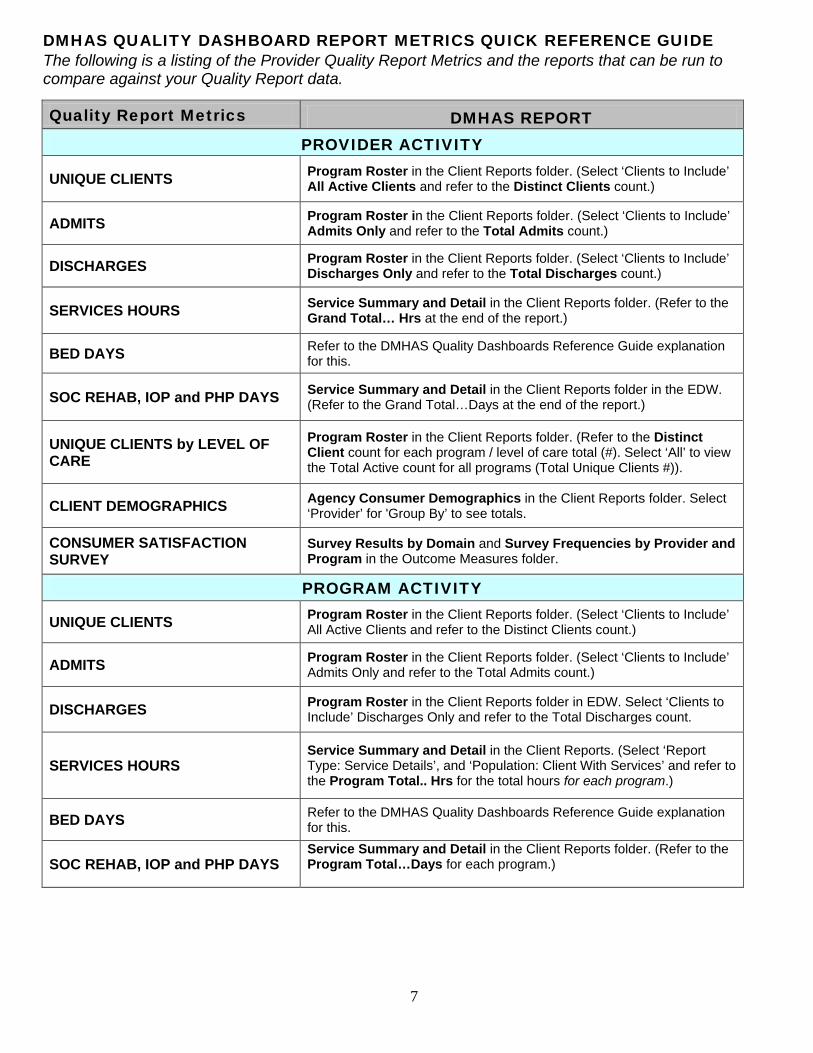
DMHAS EDW REPORTS QUICK REFERENCE GUIDE
REPORT FOLDER REPORT NAME DESCRIPTION
Client Look Up Please note that data in reports is one day old.
Client Reports
Program Roster Unduplicated list of clients by facility, program(s) and level of care, within a defined date range, with the ability to drill down to individual client admission and assessment details.
Search Clients Allows the user to search, by SSN or name, for a given client at a facility(s) and program(s) and view admission and assessment details.
Clients Served
Client Reports Unduplicated Clients A list of unduplicated clients by provider and program within a program type, level of care type and level of care mode for given date range.
Utilization
Client Reports Bed Utilization Bed Utilization for Inpatient and Residential Programs funded or run by DMHAS.
Outcome Measures Outpatient Utilization Assess outpatient utilization by program type, provider, program and
funding source.
Assessments Due
Data Quality
Periodic Assessment 6-
Month Tickler Report
Shows clients whose program requires the periodic assessment and a periodic assessment has not been entered in six months (date in RED) or no date will be listed if there are no periodic assessments.
Required Assessments
Required assessment counts (or optional, or both) based on a date range, Program Type, level of care and Provider and Program, and a listing of clients who require the assessment.
Services
Client Reports Service Summary and Detail
A summary of services for clients at a selected facility by a selected program(s) within a user defined date range. User can select clients admitted, clients discharged or clients with open admissions. Output is sorted by program.
Data Quality Monthly Service Data Submission
report Provides submission data by program within a user defined monthly time period.
Outcome Measures
CSP RP Service Utilization and
Service Location Report
Expected number of quarterly face to face service hours based on program capacity, total number of face to face service hours delivered, total TCM face to face service hours, and total service hours that were not face to face within the quarter and fiscal year-face to face and rehabilitation.
Provider Program Information
Provider and Program Profile
Provider Program Information
Overview of program type, level of care, funding source for both PNP and SO providers by provider. Specifies if program is designated as a TCM provider, Treatment related, Service required, and date opened and closed.
Program Completion / Discharge Outcome Measures
Program Completion Report
Groups discharge reasons into two major outcome categories, ‘Program Completion’ and ‘Non-Completion of Program’.
Data Quality Data Quality
Admissions And Discharges Report
Provides admission and discharge counts by program within a defined monthly period.
7
DMHAS QUALITY DASHBOARD REPORT METRICS QUICK REFERENCE GUIDE The following is a listing of the Provider Quality Report Metrics and the reports that can be run to compare against your Quality Report data.
Quality Report Metrics DMHAS REPORT PROVIDER ACTIVITY
UNIQUE CLIENTS Program Roster in the Client Reports folder. (Select ‘Clients to Include’ All Active Clients and refer to the Distinct Clients count.)
ADMITS Program Roster in the Client Reports folder. (Select ‘Clients to Include’ Admits Only and refer to the Total Admits count.)
DISCHARGES Program Roster in the Client Reports folder. (Select ‘Clients to Include’ Discharges Only and refer to the Total Discharges count.)
SERVICES HOURS Service Summary and Detail in the Client Reports folder. (Refer to the Grand Total… Hrs at the end of the report.)
BED DAYS Refer to the DMHAS Quality Dashboards Reference Guide explanation for this.
SOC REHAB, IOP and PHP DAYS Service Summary and Detail in the Client Reports folder in the EDW. (Refer to the Grand Total…Days at the end of the report.)
UNIQUE CLIENTS by LEVEL OF CARE
Program Roster in the Client Reports folder. (Refer to the Distinct Client count for each program / level of care total (#). Select ‘All’ to view the Total Active count for all programs (Total Unique Clients #)).
CLIENT DEMOGRAPHICS Agency Consumer Demographics in the Client Reports folder. Select ‘Provider’ for 'Group By’ to see totals.
CONSUMER SATISFACTION SURVEY
Survey Results by Domain and Survey Frequencies by Provider and Program in the Outcome Measures folder.
PROGRAM ACTIVITY
UNIQUE CLIENTS Program Roster in the Client Reports folder. (Select ‘Clients to Include’ All Active Clients and refer to the Distinct Clients count.)
ADMITS Program Roster in the Client Reports folder. (Select ‘Clients to Include’ Admits Only and refer to the Total Admits count.)
DISCHARGES Program Roster in the Client Reports folder in EDW. Select ‘Clients to Include’ Discharges Only and refer to the Total Discharges count.
SERVICES HOURS Service Summary and Detail in the Client Reports. (Select ‘Report Type: Service Details’, and ‘Population: Client With Services’ and refer to the Program Total.. Hrs for the total hours for each program.)
BED DAYS Refer to the DMHAS Quality Dashboards Reference Guide explanation for this.
SOC REHAB, IOP and PHP DAYS Service Summary and Detail in the Client Reports folder. (Refer to the Program Total…Days for each program.)
8
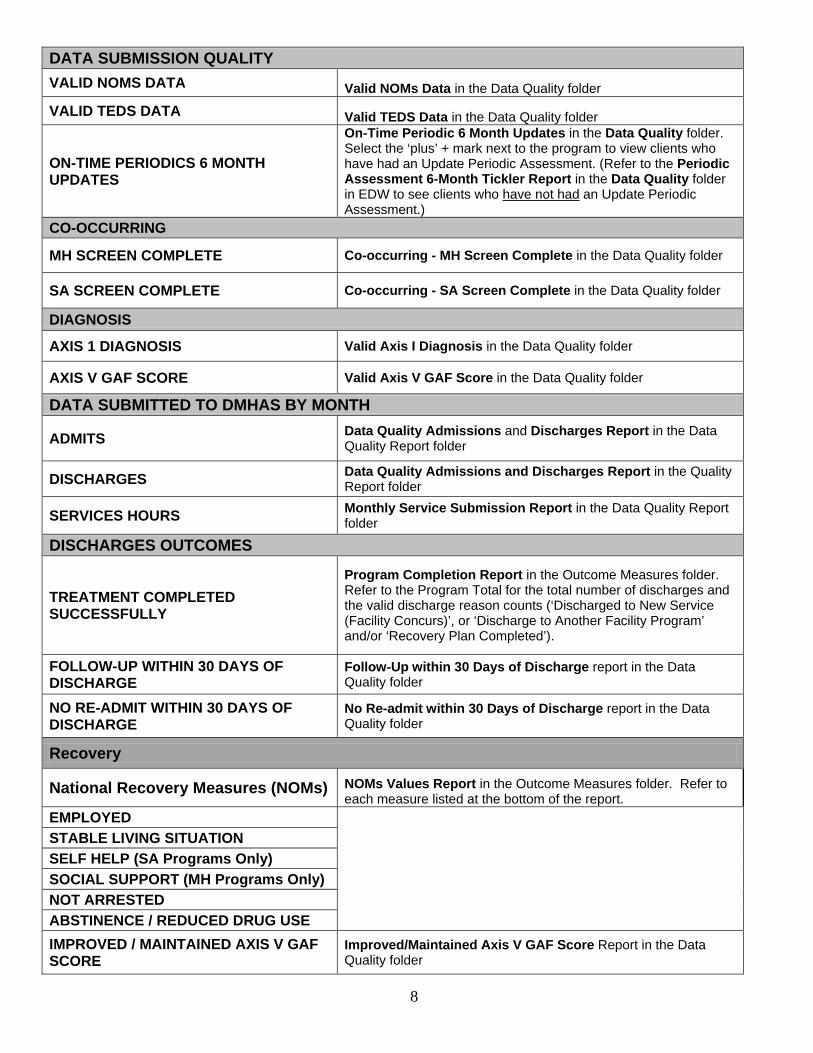
DATA SUBMISSION QUALITY VALID NOMS DATA Valid NOMs Data in the Data Quality folder
VALID TEDS DATA Valid TEDS Data in the Data Quality folder
ON-TIME PERIODICS 6 MONTH UPDATES
On-Time Periodic 6 Month Updates in the Data Quality folder. Select the ‘plus’ + mark next to the program to view clients who have had an Update Periodic Assessment. (Refer to the Periodic Assessment 6-Month Tickler Report in the Data Quality folder in EDW to see clients who have not had an Update Periodic Assessment.)
CO-OCCURRING
MH SCREEN COMPLETE Co-occurring - MH Screen Complete in the Data Quality folder
SA SCREEN COMPLETE Co-occurring - SA Screen Complete in the Data Quality folder
DIAGNOSIS
AXIS 1 DIAGNOSIS Valid Axis I Diagnosis in the Data Quality folder
AXIS V GAF SCORE Valid Axis V GAF Score in the Data Quality folder
DATA SUBMITTED TO DMHAS BY MONTH
ADMITS Data Quality Admissions and Discharges Report in the Data Quality Report folder
DISCHARGES Data Quality Admissions and Discharges Report in the Quality Report folder
SERVICES HOURS Monthly Service Submission Report in the Data Quality Report folder
DISCHARGES OUTCOMES
TREATMENT COMPLETED SUCCESSFULLY
Program Completion Report in the Outcome Measures folder. Refer to the Program Total for the total number of discharges and the valid discharge reason counts (‘Discharged to New Service (Facility Concurs)’, or ‘Discharge to Another Facility Program’ and/or ‘Recovery Plan Completed’).
FOLLOW-UP WITHIN 30 DAYS OF DISCHARGE
Follow-Up within 30 Days of Discharge report in the Data Quality folder
NO RE-ADMIT WITHIN 30 DAYS OF DISCHARGE
No Re-admit within 30 Days of Discharge report in the Data Quality folder
Recovery
National Recovery Measures (NOMs) NOMs Values Report in the Outcome Measures folder. Refer to each measure listed at the bottom of the report.
EMPLOYED
STABLE LIVING SITUATION SELF HELP (SA Programs Only) SOCIAL SUPPORT (MH Programs Only) NOT ARRESTED ABSTINENCE / REDUCED DRUG USE IMPROVED / MAINTAINED AXIS V GAF SCORE
Improved/Maintained Axis V GAF Score Report in the Data Quality folder
9
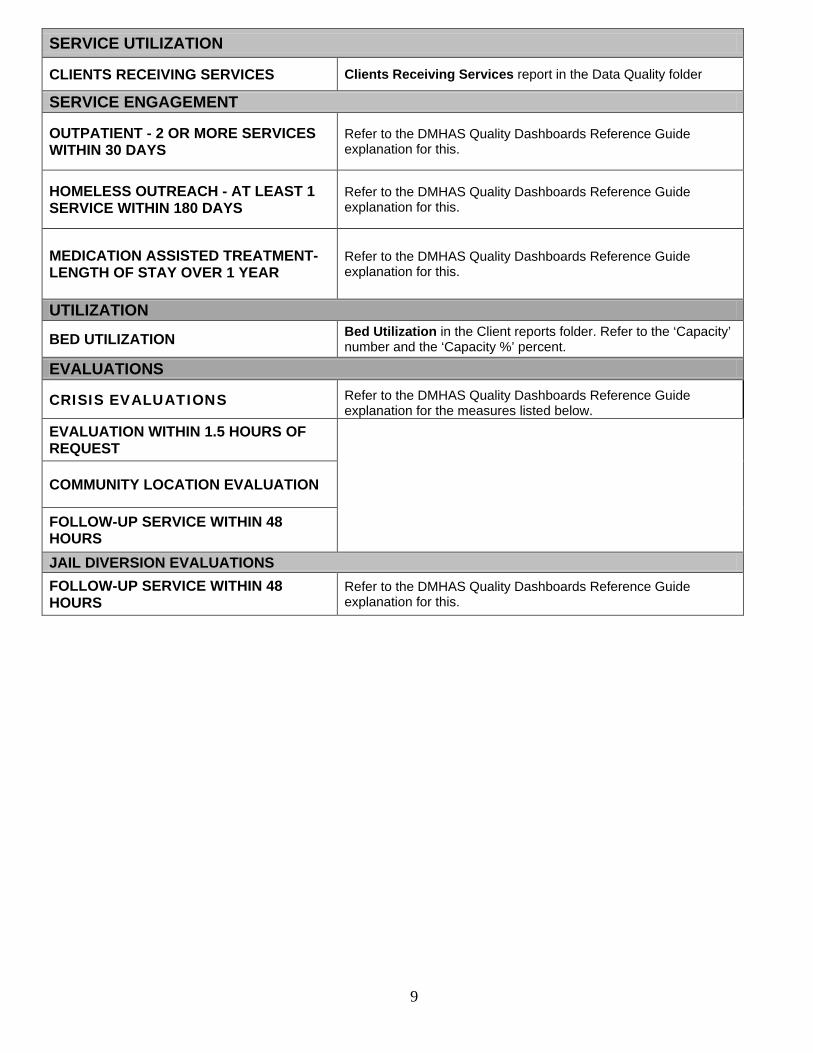
SERVICE UTILIZATION
CLIENTS RECEIVING SERVICES Clients Receiving Services report in the Data Quality folder
SERVICE ENGAGEMENT
OUTPATIENT - 2 OR MORE SERVICES WITHIN 30 DAYS
Refer to the DMHAS Quality Dashboards Reference Guide explanation for this.
HOMELESS OUTREACH - AT LEAST 1 SERVICE WITHIN 180 DAYS
Refer to the DMHAS Quality Dashboards Reference Guide explanation for this.
MEDICATION ASSISTED TREATMENT- LENGTH OF STAY OVER 1 YEAR
Refer to the DMHAS Quality Dashboards Reference Guide explanation for this.
UTILIZATION
BED UTILIZATION Bed Utilization in the Client reports folder. Refer to the ‘Capacity’ number and the ‘Capacity %’ percent.
EVALUATIONS
CRISIS EVALUATIONS Refer to the DMHAS Quality Dashboards Reference Guide explanation for the measures listed below.
EVALUATION WITHIN 1.5 HOURS OF REQUEST
COMMUNITY LOCATION EVALUATION
FOLLOW-UP SERVICE WITHIN 48 HOURS JAIL DIVERSION EVALUATIONS FOLLOW-UP SERVICE WITHIN 48 HOURS
Refer to the DMHAS Quality Dashboards Reference Guide explanation for this.
10
NAVIGATION IN REPORTS
SEARCHING FOR A REPORT
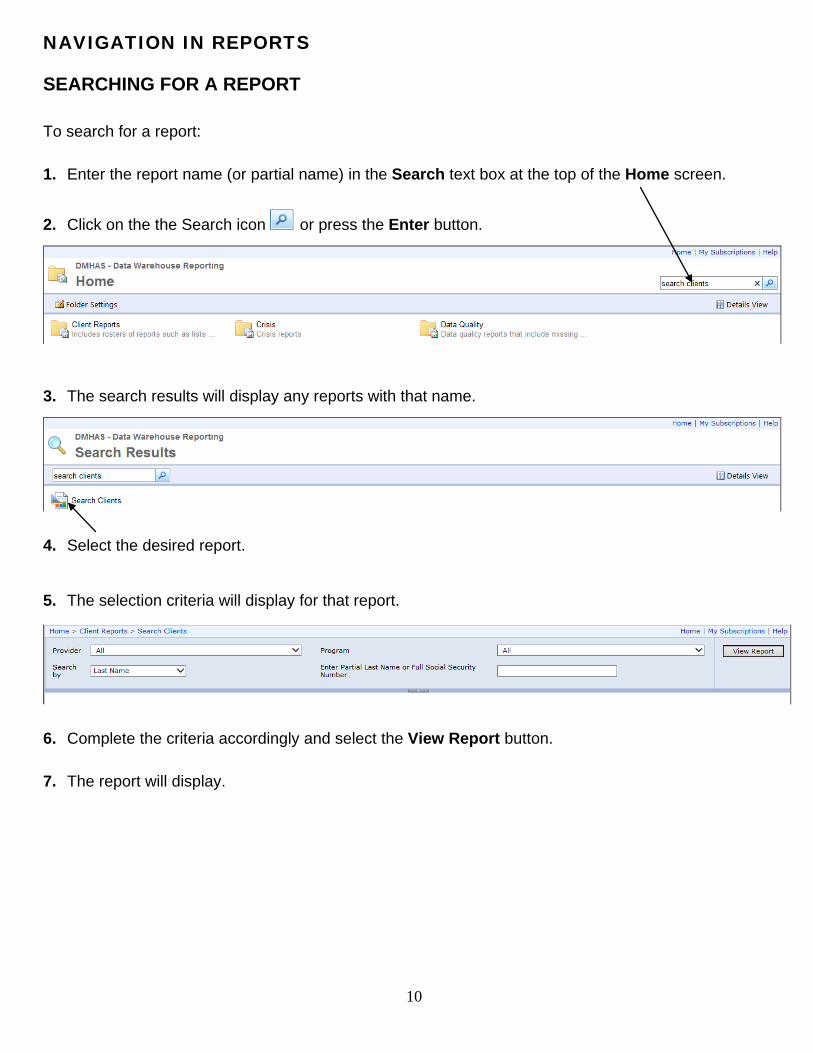
To search for a report: 1. Enter the report name (or partial name) in the Search text box at the top of the Home screen.
2. Click on the the Search icon or press the Enter button.
3. The search results will display any reports with that name.
4. Select the desired report.
5. The selection criteria will display for that report.
6. Complete the criteria accordingly and select the View Report button. 7. The report will display.
11
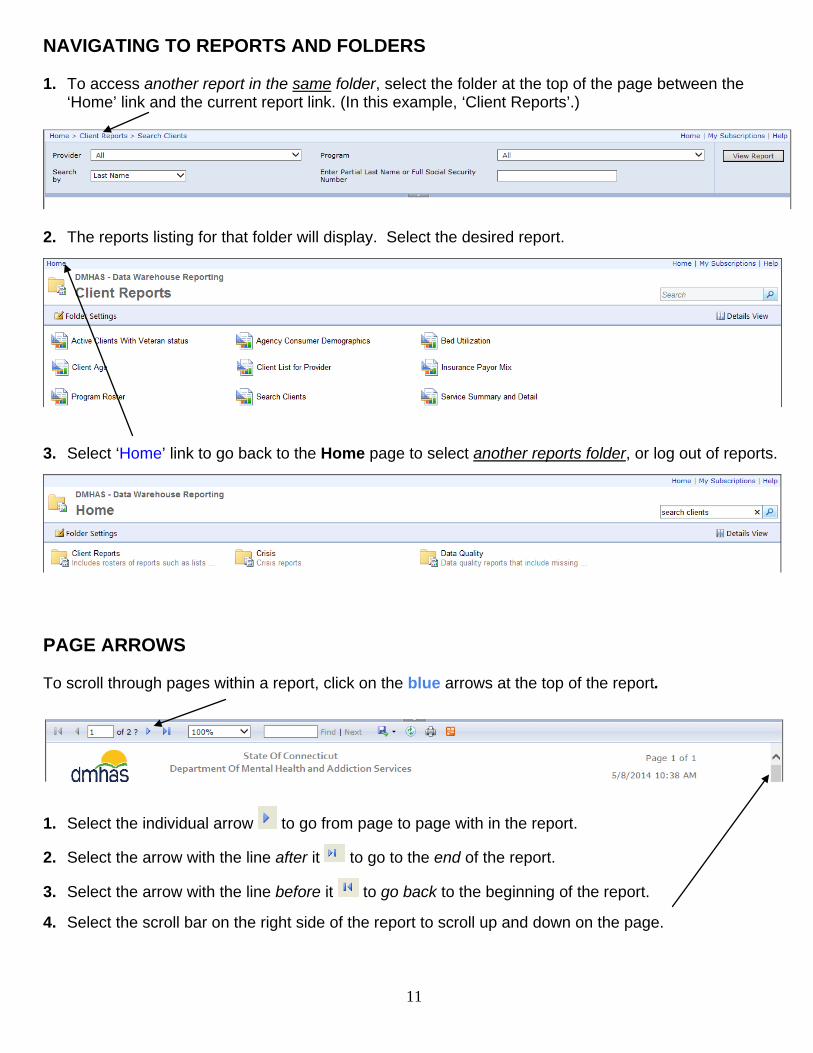
NAVIGATING TO REPORTS AND FOLDERS
1. To access another report in the same folder, select the folder at the top of the page between the ‘Home’ link and the current report link. (In this example, ‘Client Reports’.)
2. The reports listing for that folder will display. Select the desired report.
3. Select ‘Home’ link to go back to the Home page to select another reports folder, or log out of reports.
PAGE ARROWS To scroll through pages within a report, click on the blue arrows at the top of the report.
1. Select the individual arrow to go from page to page with in the report.
2. Select the arrow with the line after it to go to the end of the report.
3. Select the arrow with the line before it to go back to the beginning of the report. 4. Select the scroll bar on the right side of the report to scroll up and down on the page.
12
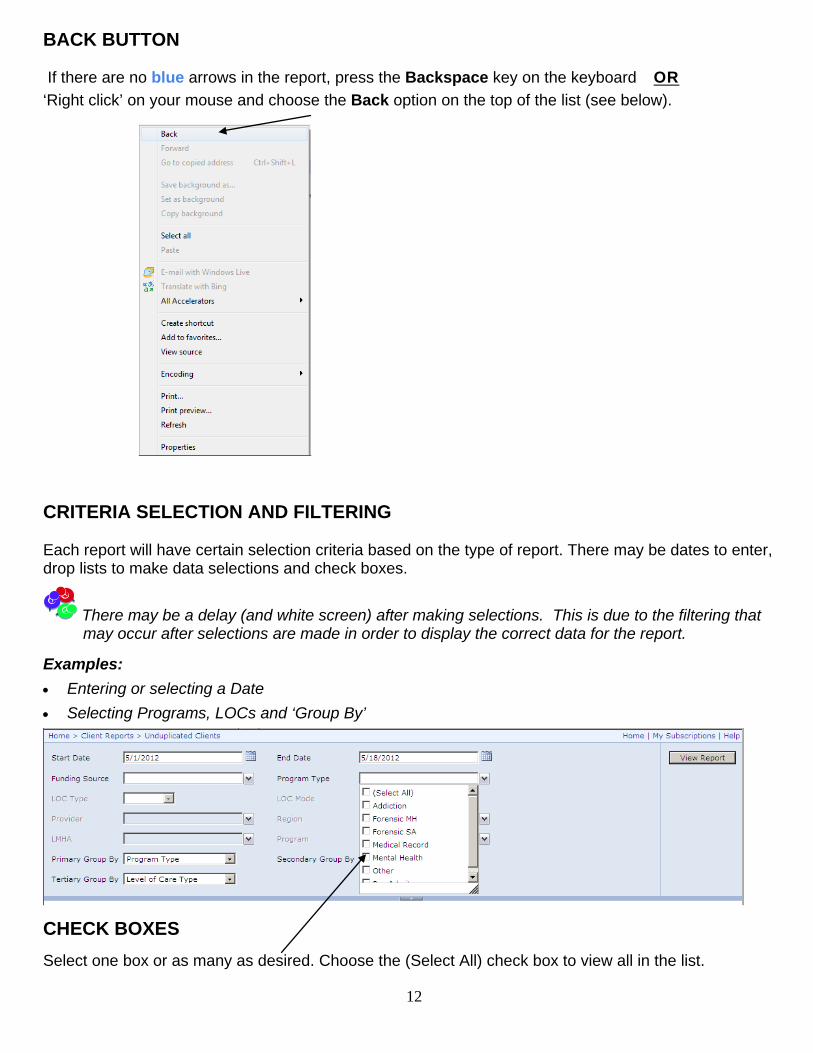
BACK BUTTON If there are no blue arrows in the report, press the Backspace key on the keyboard OR
‘Right click’ on your mouse and choose the Back option on the top of the list (see below).
CRITERIA SELECTION AND FILTERING
Each report will have certain selection criteria based on the type of report. There may be dates to enter, drop lists to make data selections and check boxes.
There may be a delay (and white screen) after making selections. This is due to the filtering that may occur after selections are made in order to display the correct data for the report. Examples:
• Entering or selecting a Date
• Selecting Programs, LOCs and ‘Group By’
CHECK BOXES Select one box or as many as desired. Choose the (Select All) check box to view all in the list.
13
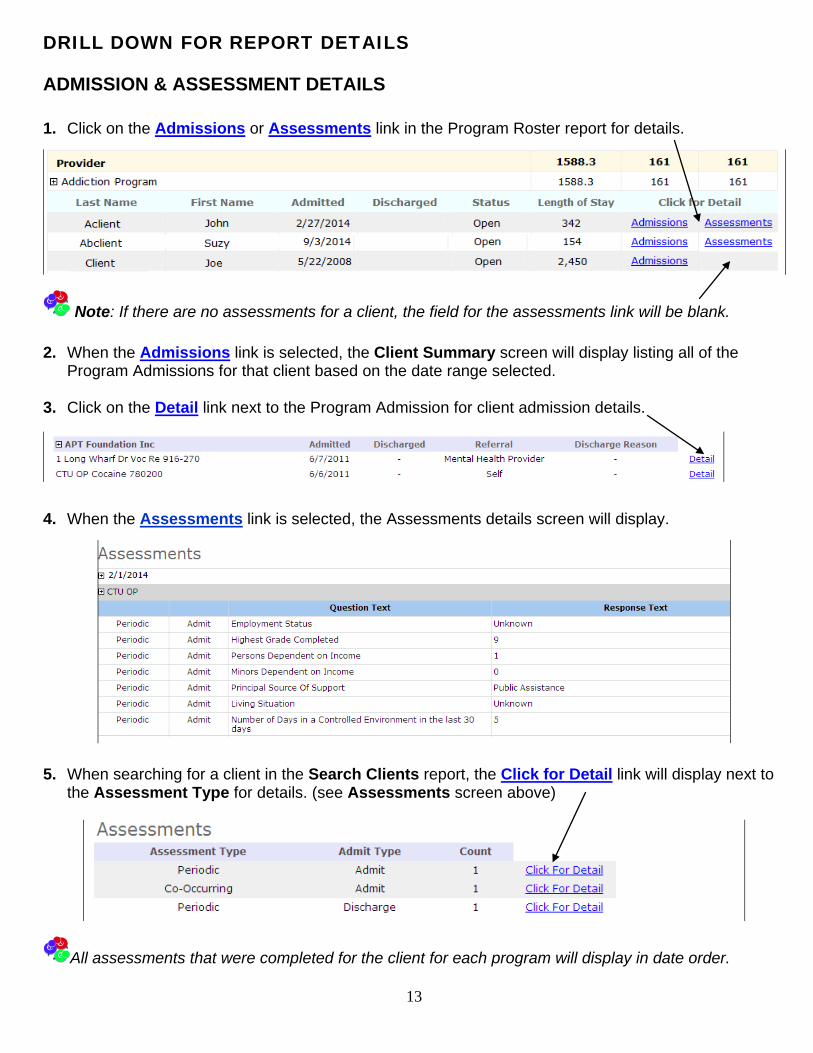
DRILL DOWN FOR REPORT DETAILS
ADMISSION & ASSESSMENT DETAILS
1. Click on the Admissions or Assessments link in the Program Roster report for details.
Note: If there are no assessments for a client, the field for the assessments link will be blank. 2. When the Admissions link is selected, the Client Summary screen will display listing all of the
Program Admissions for that client based on the date range selected. 3. Click on the Detail link next to the Program Admission for client admission details.
4. When the Assessments link is selected, the Assessments details screen will display.
5. When searching for a client in the Search Clients report, the Click for Detail link will display next to
the Assessment Type for details. (see Assessments screen above)
All assessments that were completed for the client for each program will display in date order.
14
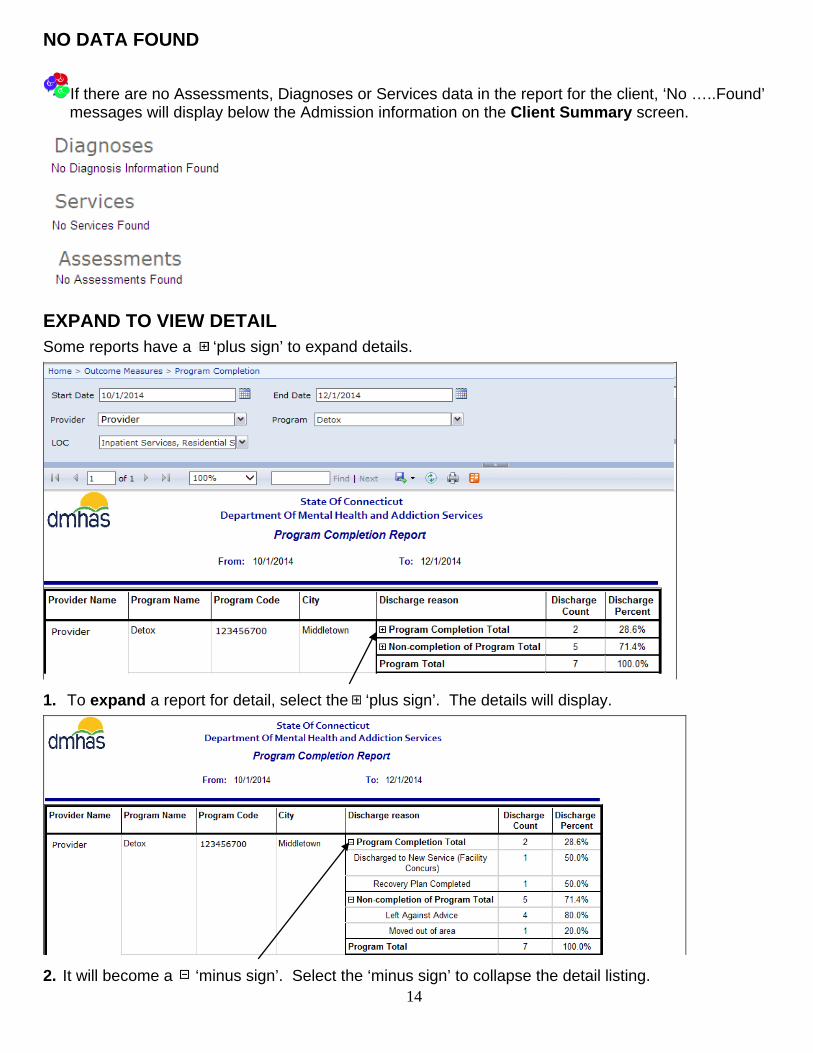
NO DATA FOUND
If there are no Assessments, Diagnoses or Services data in the report for the client, ‘No …..Found’ messages will display below the Admission information on the Client Summary screen.
EXPAND TO VIEW DETAIL
Some reports have a ‘plus sign’ to expand details.
1. To expand a report for detail, select the ‘plus sign’. The details will display.
2. It will become a ‘minus sign’. Select the ‘minus sign’ to collapse the detail listing.
15
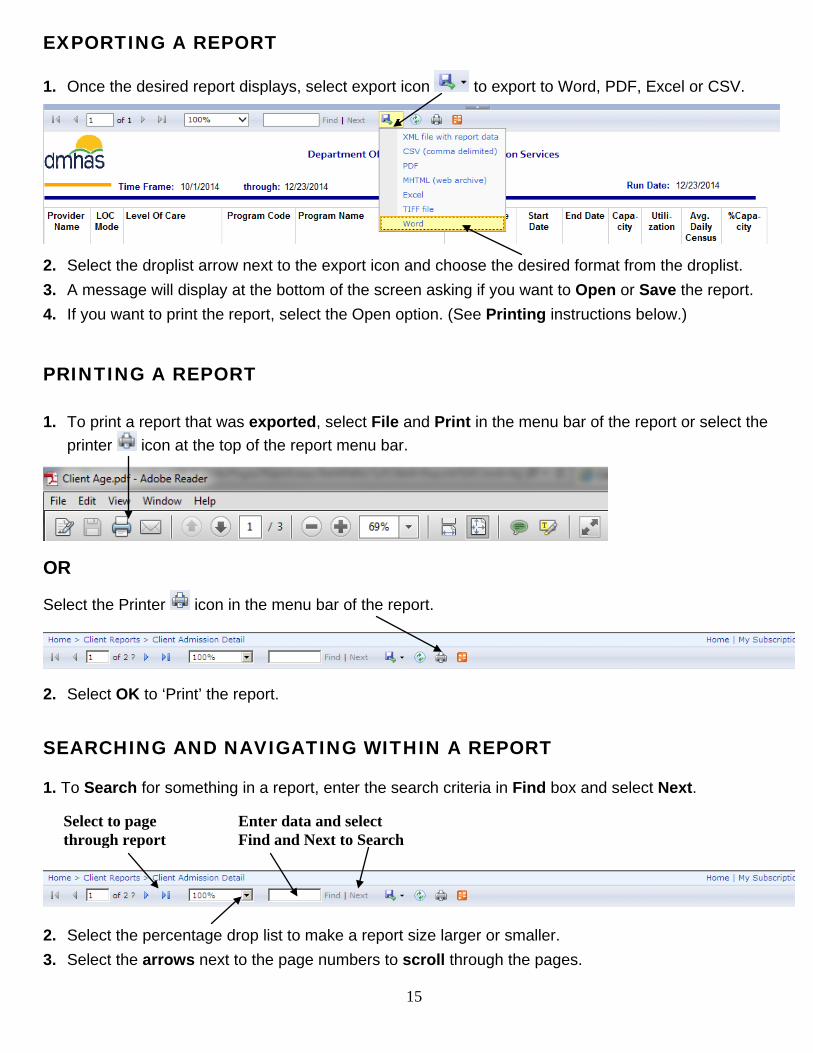
EXPORTING A REPORT
1. Once the desired report displays, select export icon to export to Word, PDF, Excel or CSV.
2. Select the droplist arrow next to the export icon and choose the desired format from the droplist.
3. A message will display at the bottom of the screen asking if you want to Open or Save the report.
4. If you want to print the report, select the Open option. (See Printing instructions below.)
PRINTING A REPORT 1. To print a report that was exported, select File and Print in the menu bar of the report or select the
printer icon at the top of the report menu bar.
OR
Select the Printer icon in the menu bar of the report.
2. Select OK to ‘Print’ the report.
SEARCHING AND NAVIGATING WITHIN A REPORT
1. To Search for something in a report, enter the search criteria in Find box and select Next.
2. Select the percentage drop list to make a report size larger or smaller.
3. Select the arrows next to the page numbers to scroll through the pages.
Select to page through report
Enter data and select Find and Next to Search
16
CLIENT LOOK-UP REPORTS
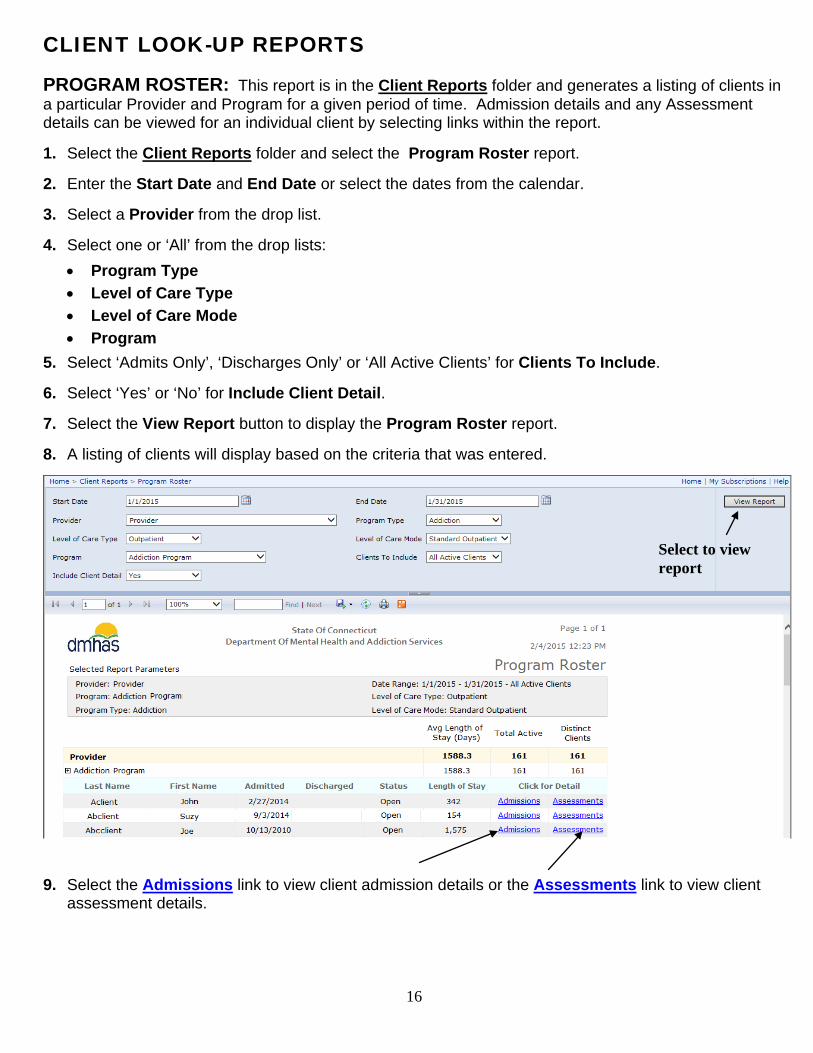
PROGRAM ROSTER: This report is in the Client Reports folder and generates a listing of clients in a particular Provider and Program for a given period of time. Admission details and any Assessment details can be viewed for an individual client by selecting links within the report.
1. Select the Client Reports folder and select the Program Roster report. 2. Enter the Start Date and End Date or select the dates from the calendar.
3. Select a Provider from the drop list. 4. Select one or ‘All’ from the drop lists:
• Program Type
• Level of Care Type
• Level of Care Mode
• Program
5. Select ‘Admits Only’, ‘Discharges Only’ or ‘All Active Clients’ for Clients To Include.
6. Select ‘Yes’ or ‘No’ for Include Client Detail.
7. Select the View Report button to display the Program Roster report. 8. A listing of clients will display based on the criteria that was entered.
9. Select the Admissions link to view client admission details or the Assessments link to view client assessment details.
Select to view report
17
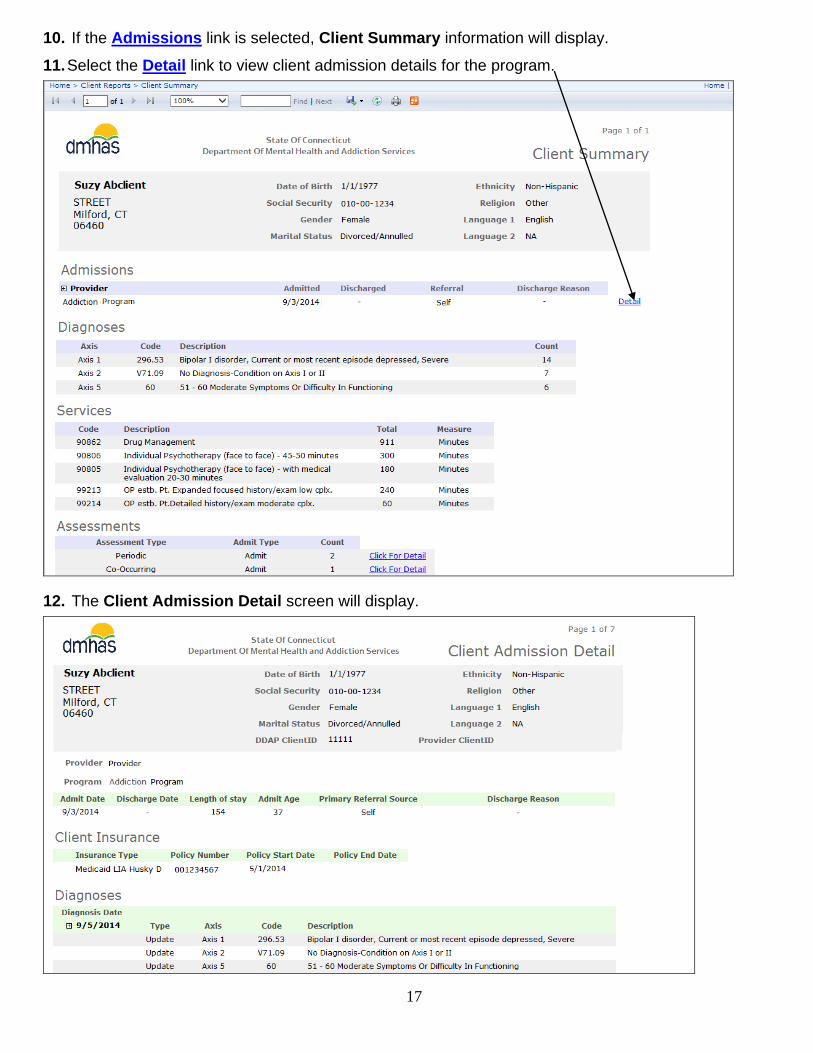
10. If the Admissions link is selected, Client Summary information will display.
11. Select the Detail link to view client admission details for the program.
12. The Client Admission Detail screen will display.
18
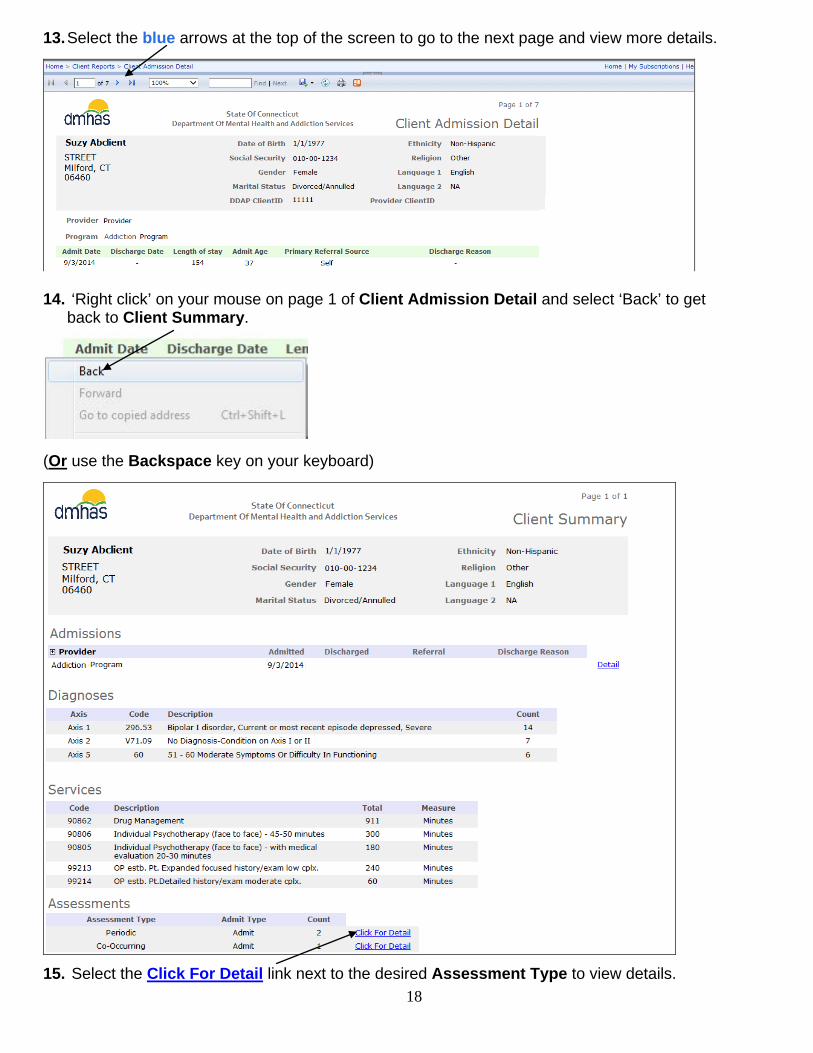
13. Select the blue arrows at the top of the screen to go to the next page and view more details.
14. ‘Right click’ on your mouse on page 1 of Client Admission Detail and select ‘Back’ to get back to Client Summary.
(Or use the Backspace key on your keyboard)
15. Select the Click For Detail link next to the desired Assessment Type to view details.
19
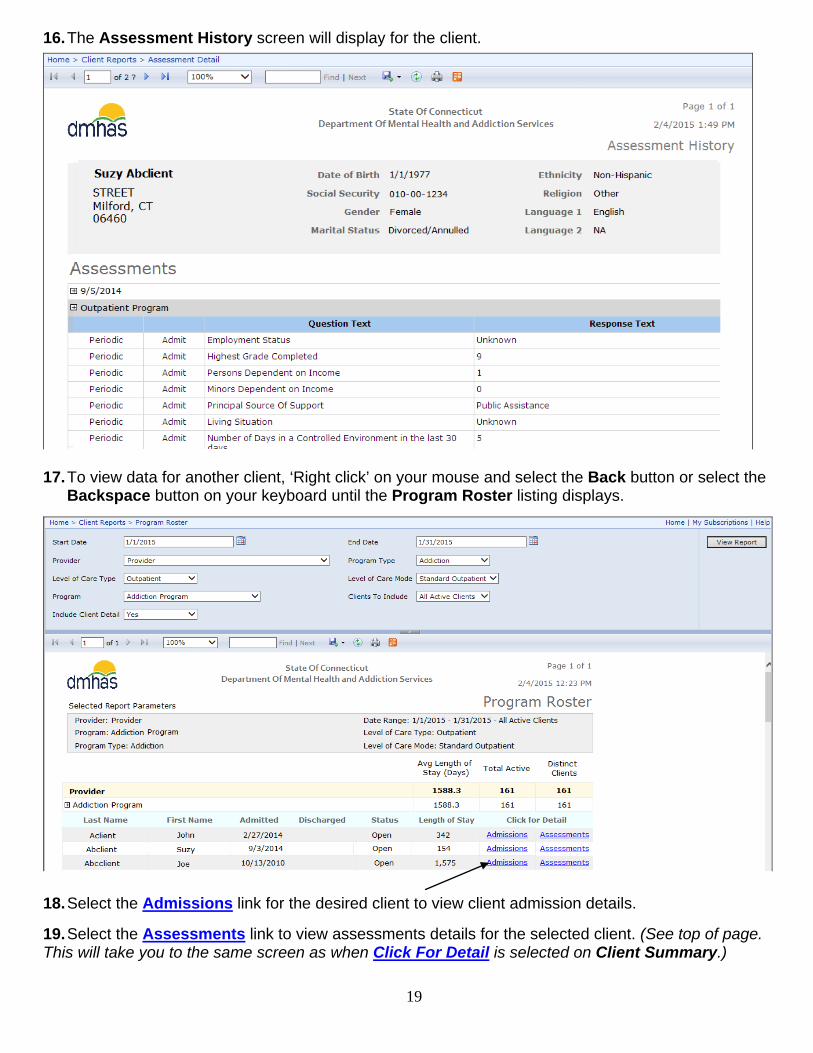
16. The Assessment History screen will display for the client.
17. To view data for another client, ‘Right click’ on your mouse and select the Back button or select the Backspace button on your keyboard until the Program Roster listing displays.
18. Select the Admissions link for the desired client to view client admission details. 19. Select the Assessments link to view assessments details for the selected client. (See top of page. This will take you to the same screen as when Click For Detail is selected on Client Summary.)
20
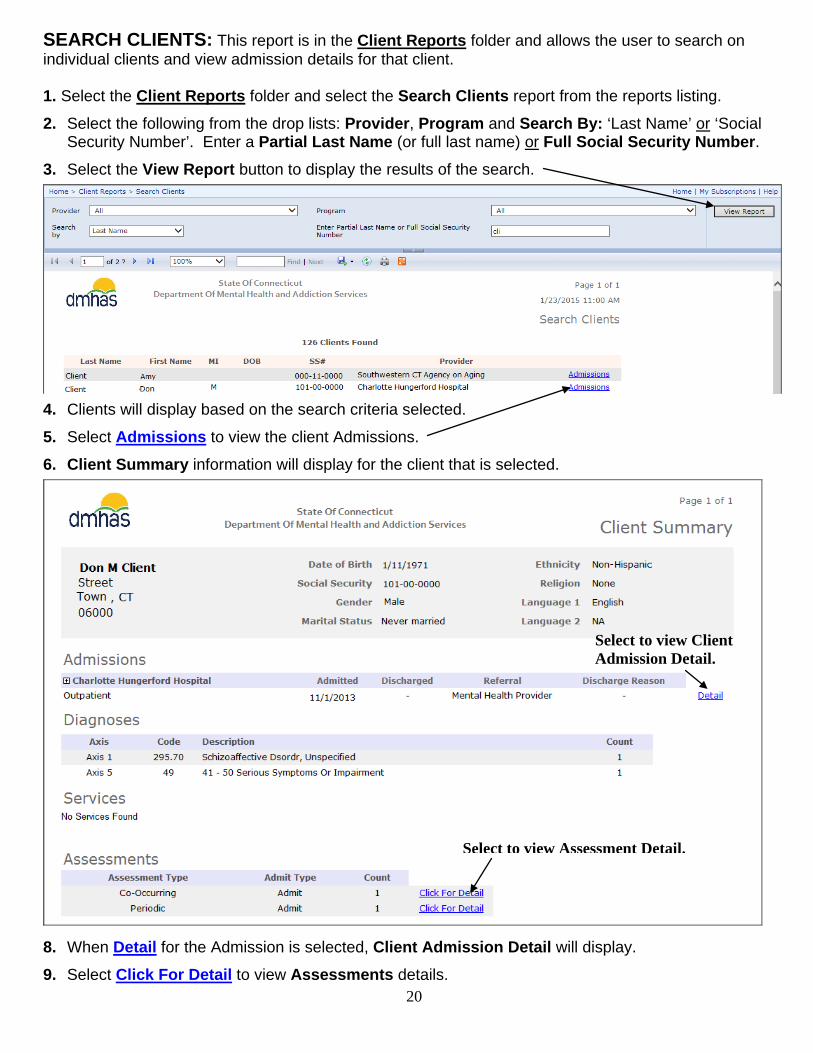
SEARCH CLIENTS: This report is in the Client Reports folder and allows the user to search on individual clients and view admission details for that client. 1. Select the Client Reports folder and select the Search Clients report from the reports listing.
2. Select the following from the drop lists: Provider, Program and Search By: ‘Last Name’ or ‘Social Security Number’. Enter a Partial Last Name (or full last name) or Full Social Security Number.
3. Select the View Report button to display the results of the search.
4. Clients will display based on the search criteria selected.
5. Select Admissions to view the client Admissions.
6. Client Summary information will display for the client that is selected.
8. When Detail for the Admission is selected, Client Admission Detail will display.
9. Select Click For Detail to view Assessments details.
Select to view Client Admission Detail.
Select to view Assessment Detail.
21
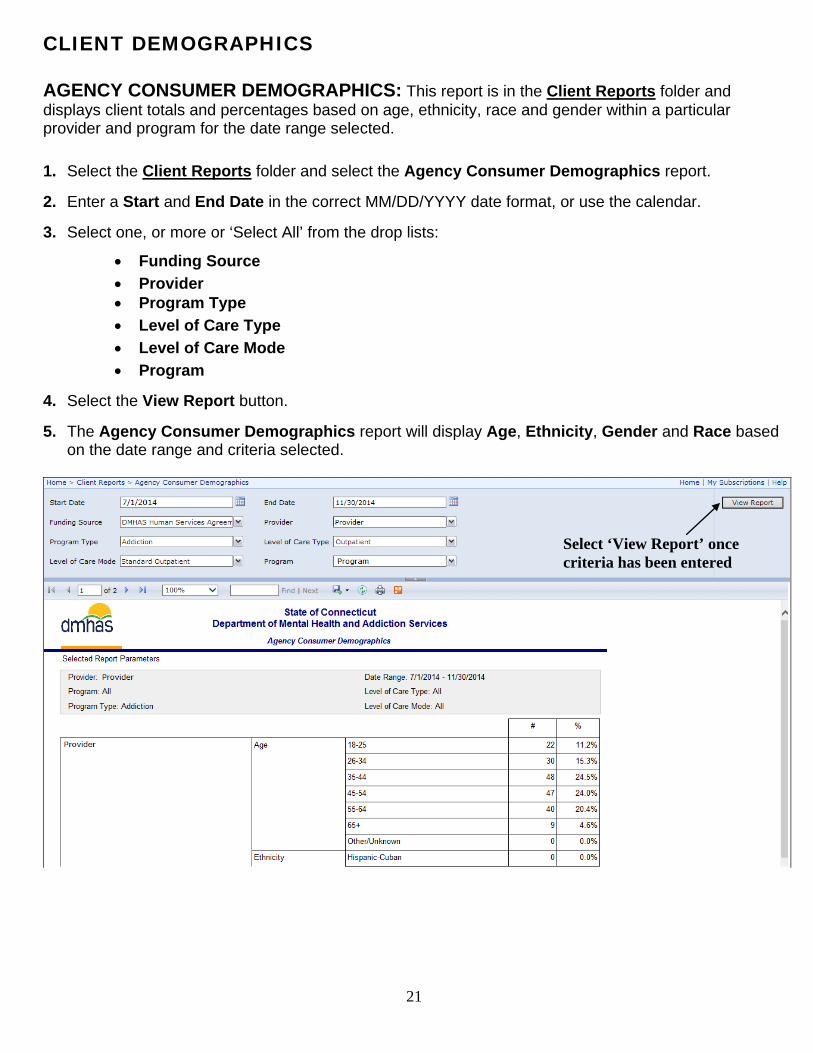
CLIENT DEMOGRAPHICS AGENCY CONSUMER DEMOGRAPHICS: This report is in the Client Reports folder and displays client totals and percentages based on age, ethnicity, race and gender within a particular provider and program for the date range selected. 1. Select the Client Reports folder and select the Agency Consumer Demographics report. 2. Enter a Start and End Date in the correct MM/DD/YYYY date format, or use the calendar. 3. Select one, or more or ‘Select All’ from the drop lists:
• Funding Source
• Provider • Program Type
• Level of Care Type
• Level of Care Mode
• Program
4. Select the View Report button. 5. The Agency Consumer Demographics report will display Age, Ethnicity, Gender and Race based
on the date range and criteria selected.
Select ‘View Report’ once criteria has been entered
22
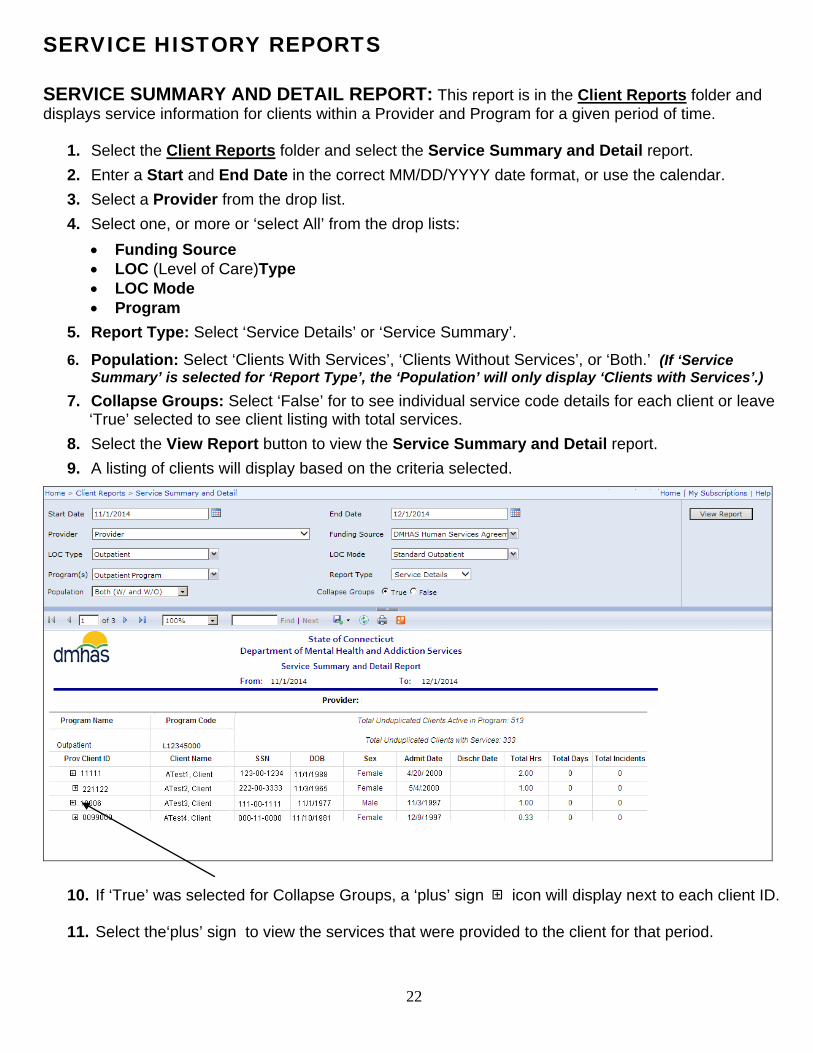
SERVICE HISTORY REPORTS
SERVICE SUMMARY AND DETAIL REPORT: This report is in the Client Reports folder and displays service information for clients within a Provider and Program for a given period of time.
1. Select the Client Reports folder and select the Service Summary and Detail report.
2. Enter a Start and End Date in the correct MM/DD/YYYY date format, or use the calendar.
3. Select a Provider from the drop list.
4. Select one, or more or ‘select All’ from the drop lists:
• Funding Source • LOC (Level of Care)Type • LOC Mode • Program
5. Report Type: Select ‘Service Details’ or ‘Service Summary’.
6. Population: Select ‘Clients With Services’, ‘Clients Without Services’, or ‘Both.’ (If ‘Service Summary’ is selected for ‘Report Type’, the ‘Population’ will only display ‘Clients with Services’.)
7. Collapse Groups: Select ‘False’ for to see individual service code details for each client or leave ‘True’ selected to see client listing with total services.
8. Select the View Report button to view the Service Summary and Detail report.
9. A listing of clients will display based on the criteria selected.
10. If ‘True’ was selected for Collapse Groups, a ‘plus’ sign icon will display next to each client ID.
11. Select the‘plus’ sign to view the services that were provided to the client for that period.
23
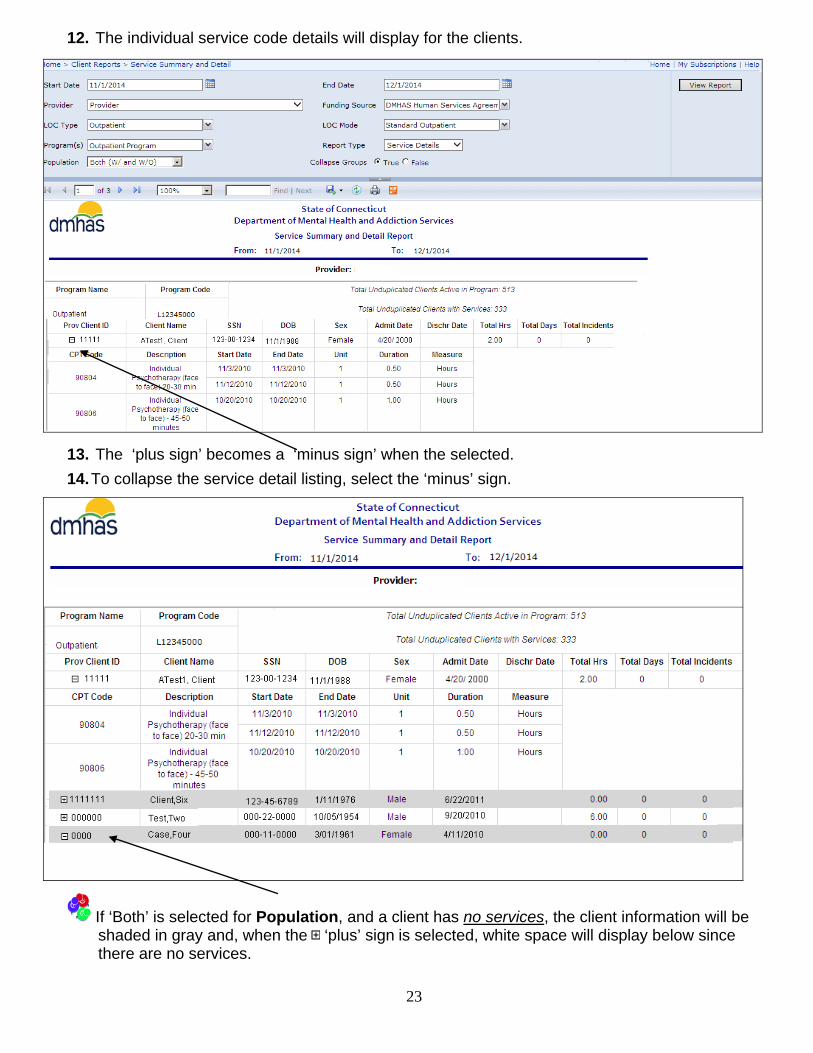
12. The individual service code details will display for the clients.
13. The ‘plus sign’ becomes a ‘minus sign’ when the selected.
14. To collapse the service detail listing, select the ‘minus’ sign.
If ‘Both’ is selected for Population, and a client has no services, the client information will be shaded in gray and, when the ‘plus’ sign is selected, white space will display below since there are no services.
24
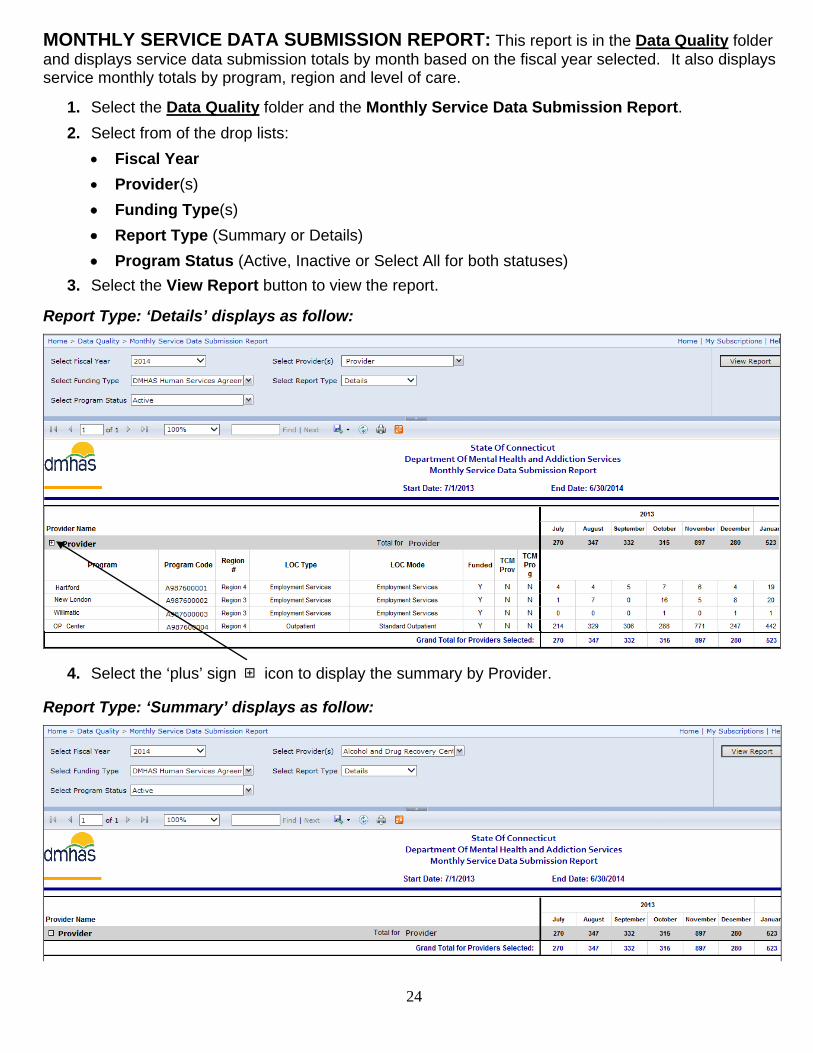
MONTHLY SERVICE DATA SUBMISSION REPORT: This report is in the Data Quality folder and displays service data submission totals by month based on the fiscal year selected. It also displays service monthly totals by program, region and level of care.
1. Select the Data Quality folder and the Monthly Service Data Submission Report.
2. Select from of the drop lists:
• Fiscal Year
• Provider(s)
• Funding Type(s)
• Report Type (Summary or Details)
• Program Status (Active, Inactive or Select All for both statuses)
3. Select the View Report button to view the report. Report Type: ‘Details’ displays as follow:
4. Select the ‘plus’ sign icon to display the summary by Provider. Report Type: ‘Summary’ displays as follow:
25
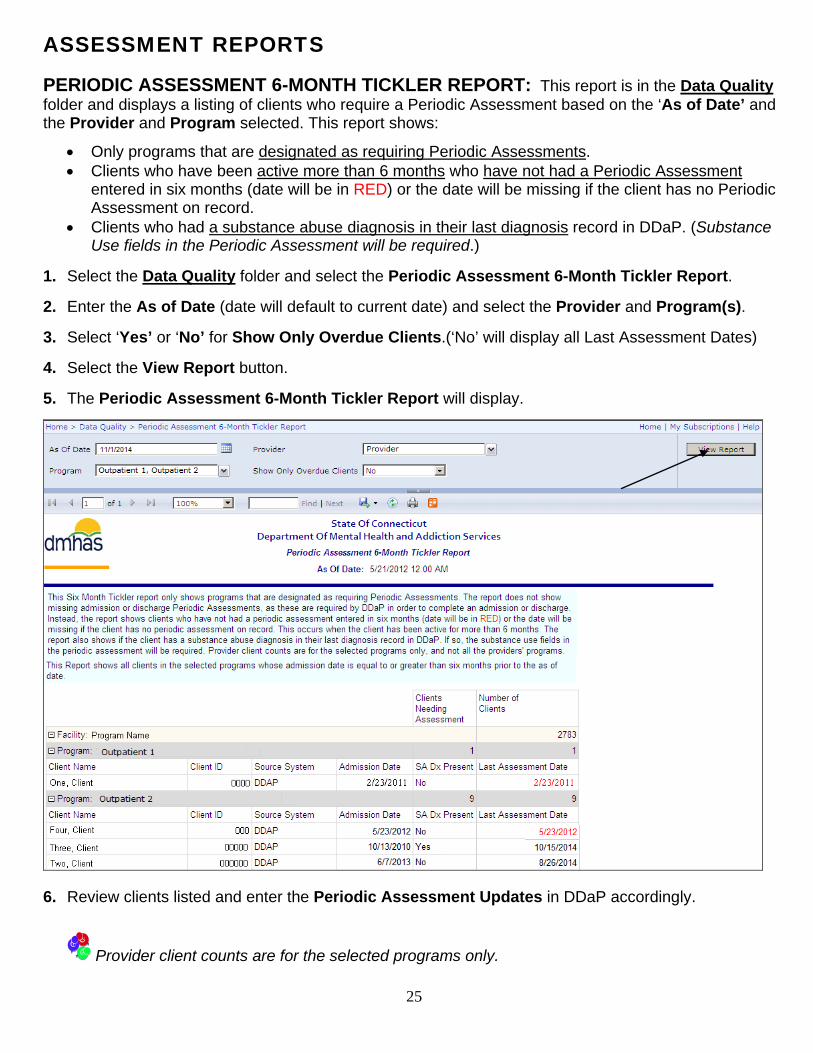
ASSESSMENT REPORTS PERIODIC ASSESSMENT 6-MONTH TICKLER REPORT: This report is in the Data Quality folder and displays a listing of clients who require a Periodic Assessment based on the ‘As of Date’ and the Provider and Program selected. This report shows:
• Only programs that are designated as requiring Periodic Assessments. • Clients who have been active more than 6 months who have not had a Periodic Assessment
entered in six months (date will be in RED) or the date will be missing if the client has no Periodic Assessment on record.
• Clients who had a substance abuse diagnosis in their last diagnosis record in DDaP. (Substance Use fields in the Periodic Assessment will be required.)
1. Select the Data Quality folder and select the Periodic Assessment 6-Month Tickler Report. 2. Enter the As of Date (date will default to current date) and select the Provider and Program(s).
3. Select ‘Yes’ or ‘No’ for Show Only Overdue Clients.(‘No’ will display all Last Assessment Dates) 4. Select the View Report button. 5. The Periodic Assessment 6-Month Tickler Report will display.
6. Review clients listed and enter the Periodic Assessment Updates in DDaP accordingly.
Provider client counts are for the selected programs only.
26
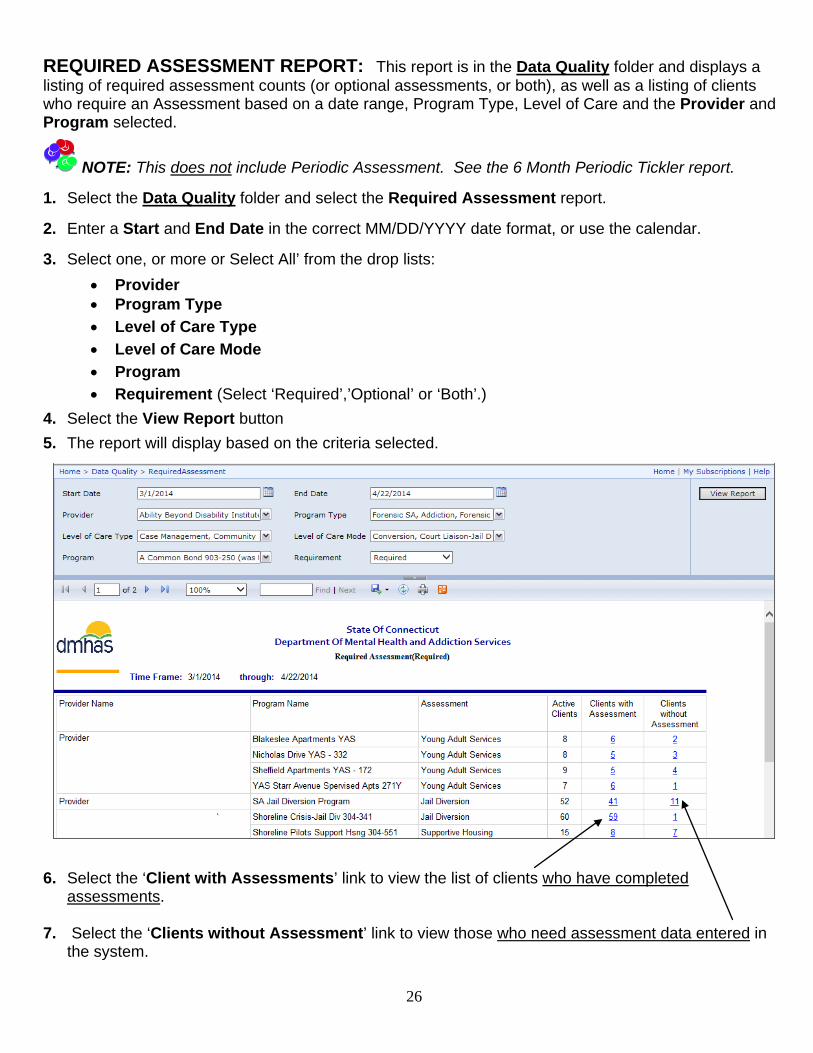
REQUIRED ASSESSMENT REPORT: This report is in the Data Quality folder and displays a listing of required assessment counts (or optional assessments, or both), as well as a listing of clients who require an Assessment based on a date range, Program Type, Level of Care and the Provider and Program selected.
NOTE: This does not include Periodic Assessment. See the 6 Month Periodic Tickler report. 1. Select the Data Quality folder and select the Required Assessment report.
2. Enter a Start and End Date in the correct MM/DD/YYYY date format, or use the calendar. 3. Select one, or more or Select All’ from the drop lists:
• Provider • Program Type
• Level of Care Type
• Level of Care Mode
• Program
• Requirement (Select ‘Required’,’Optional’ or ‘Both’.)
4. Select the View Report button
5. The report will display based on the criteria selected.
6. Select the ‘Client with Assessments’ link to view the list of clients who have completed
assessments. 7. Select the ‘Clients without Assessment’ link to view those who need assessment data entered in
the system.
27
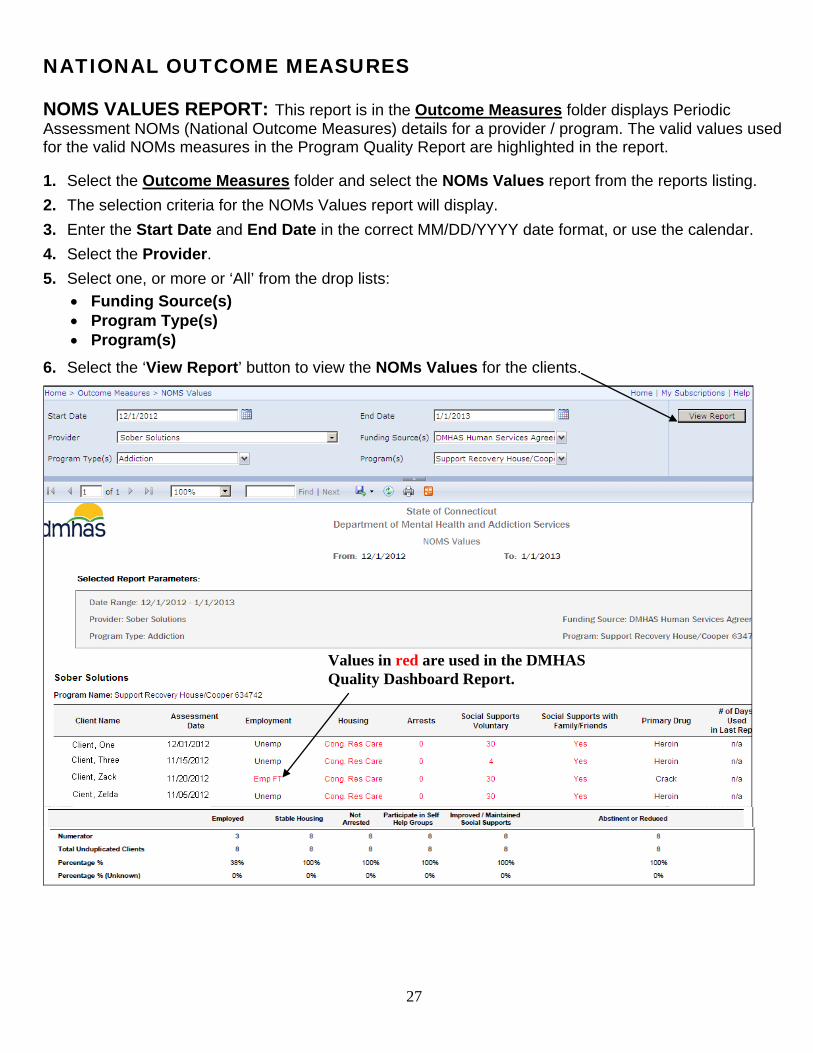
NATIONAL OUTCOME MEASURES NOMS VALUES REPORT: This report is in the Outcome Measures folder displays Periodic Assessment NOMs (National Outcome Measures) details for a provider / program. The valid values used for the valid NOMs measures in the Program Quality Report are highlighted in the report. 1. Select the Outcome Measures folder and select the NOMs Values report from the reports listing.
2. The selection criteria for the NOMs Values report will display.
3. Enter the Start Date and End Date in the correct MM/DD/YYYY date format, or use the calendar.
4. Select the Provider.
5. Select one, or more or ‘All’ from the drop lists:
• Funding Source(s) • Program Type(s) • Program(s)
6. Select the ‘View Report’ button to view the NOMs Values for the clients.
Values in red are used in the DMHAS Quality Dashboard Report.
28
UTILIZATION REPORTS
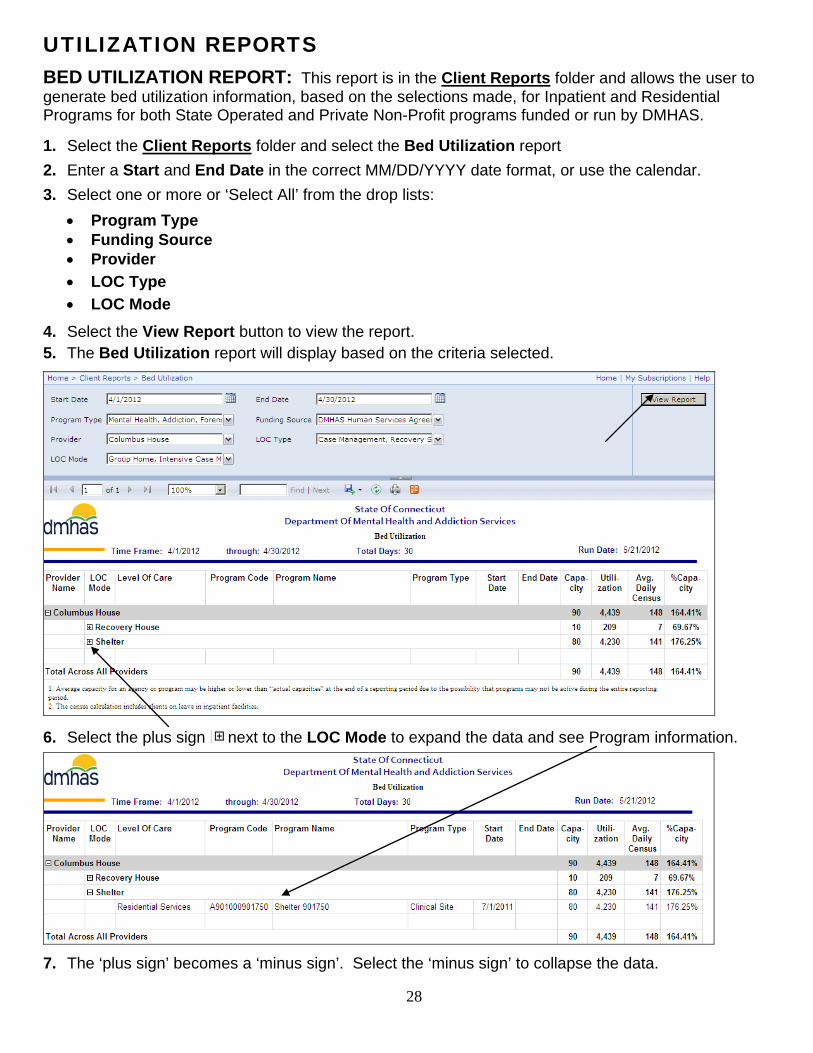
BED UTILIZATION REPORT: This report is in the Client Reports folder and allows the user to generate bed utilization information, based on the selections made, for Inpatient and Residential Programs for both State Operated and Private Non-Profit programs funded or run by DMHAS. 1. Select the Client Reports folder and select the Bed Utilization report
2. Enter a Start and End Date in the correct MM/DD/YYYY date format, or use the calendar.
3. Select one or more or ‘Select All’ from the drop lists:
• Program Type • Funding Source • Provider
• LOC Type
• LOC Mode
4. Select the View Report button to view the report.
5. The Bed Utilization report will display based on the criteria selected.
6. Select the plus sign next to the LOC Mode to expand the data and see Program information.
7. The ‘plus sign’ becomes a ‘minus sign’. Select the ‘minus sign’ to collapse the data.
29
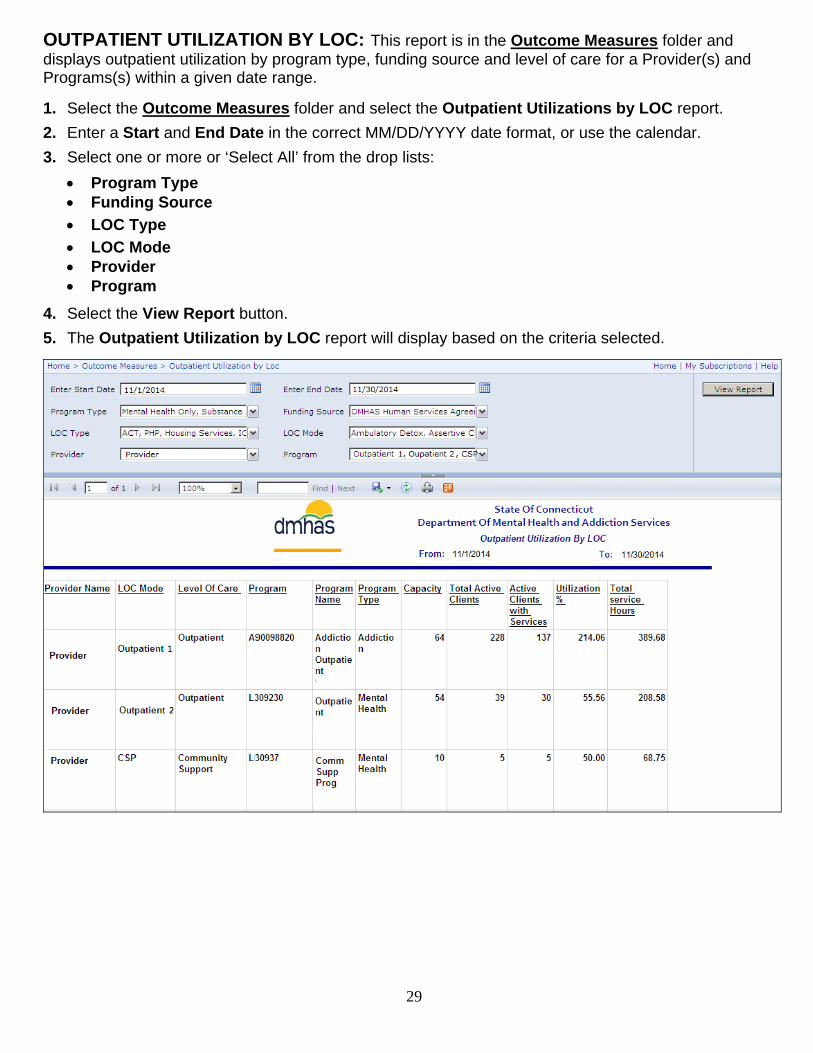
OUTPATIENT UTILIZATION BY LOC: This report is in the Outcome Measures folder and displays outpatient utilization by program type, funding source and level of care for a Provider(s) and Programs(s) within a given date range. 1. Select the Outcome Measures folder and select the Outpatient Utilizations by LOC report.
2. Enter a Start and End Date in the correct MM/DD/YYYY date format, or use the calendar.
3. Select one or more or ‘Select All’ from the drop lists:
• Program Type • Funding Source
• LOC Type
• LOC Mode • Provider • Program
4. Select the View Report button.
5. The Outpatient Utilization by LOC report will display based on the criteria selected.
30
PROVIDER & PROGRAM INFORMATION
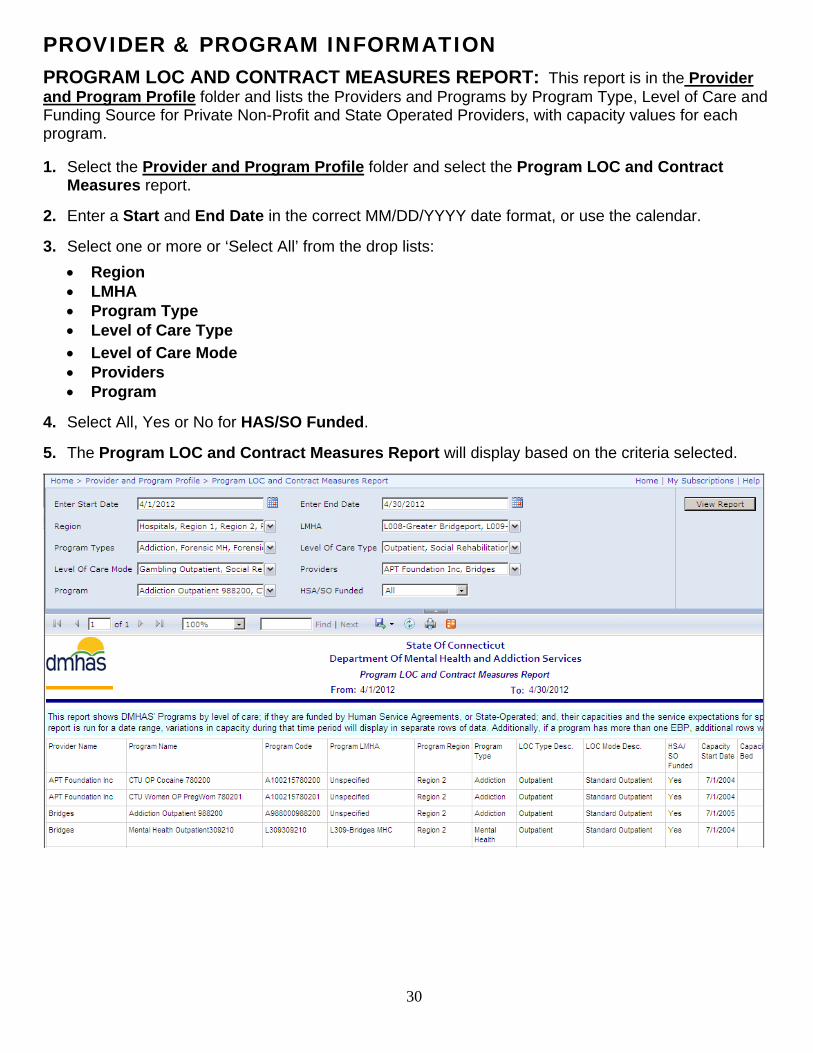
PROGRAM LOC AND CONTRACT MEASURES REPORT: This report is in the Provider and Program Profile folder and lists the Providers and Programs by Program Type, Level of Care and Funding Source for Private Non-Profit and State Operated Providers, with capacity values for each program. 1. Select the Provider and Program Profile folder and select the Program LOC and Contract
Measures report. 2. Enter a Start and End Date in the correct MM/DD/YYYY date format, or use the calendar. 3. Select one or more or ‘Select All’ from the drop lists:
• Region • LMHA • Program Type • Level of Care Type
• Level of Care Mode • Providers • Program
4. Select All, Yes or No for HAS/SO Funded. 5. The Program LOC and Contract Measures Report will display based on the criteria selected.
31
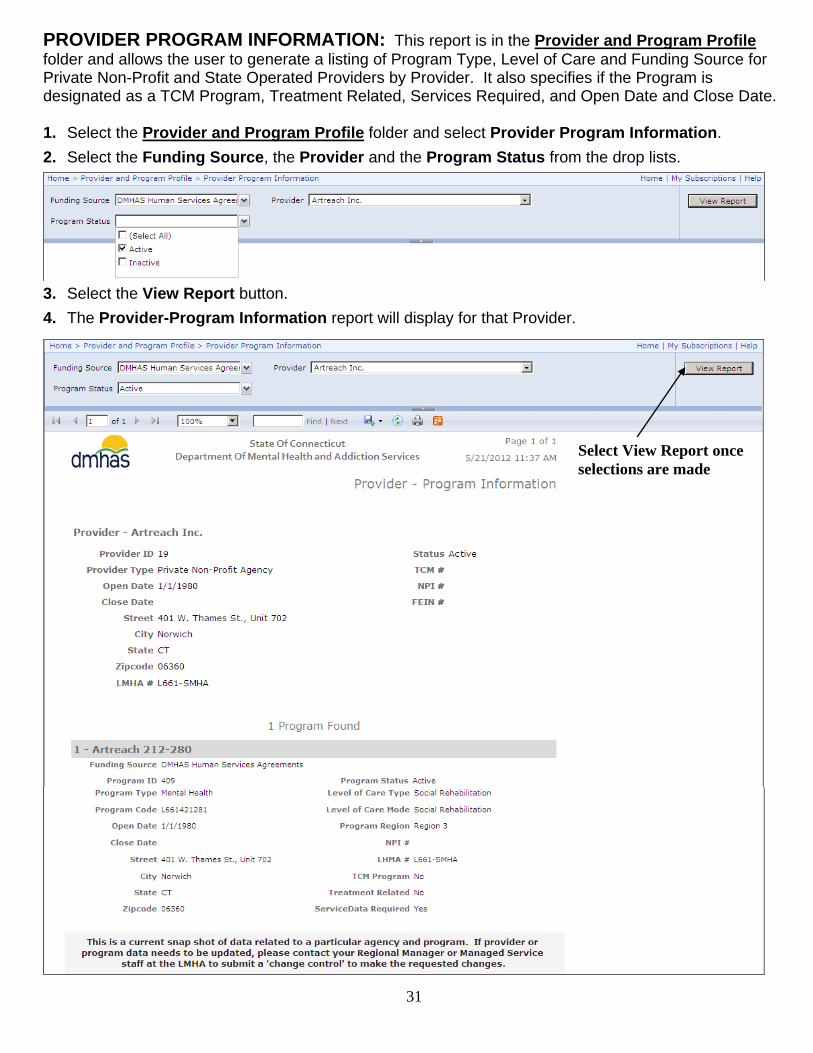
PROVIDER PROGRAM INFORMATION: This report is in the Provider and Program Profile folder and allows the user to generate a listing of Program Type, Level of Care and Funding Source for Private Non-Profit and State Operated Providers by Provider. It also specifies if the Program is designated as a TCM Program, Treatment Related, Services Required, and Open Date and Close Date. 1. Select the Provider and Program Profile folder and select Provider Program Information.
2. Select the Funding Source, the Provider and the Program Status from the drop lists.
3. Select the View Report button.
4. The Provider-Program Information report will display for that Provider.
Select View Report once selections are made
32
DISCHARGE REPORTS
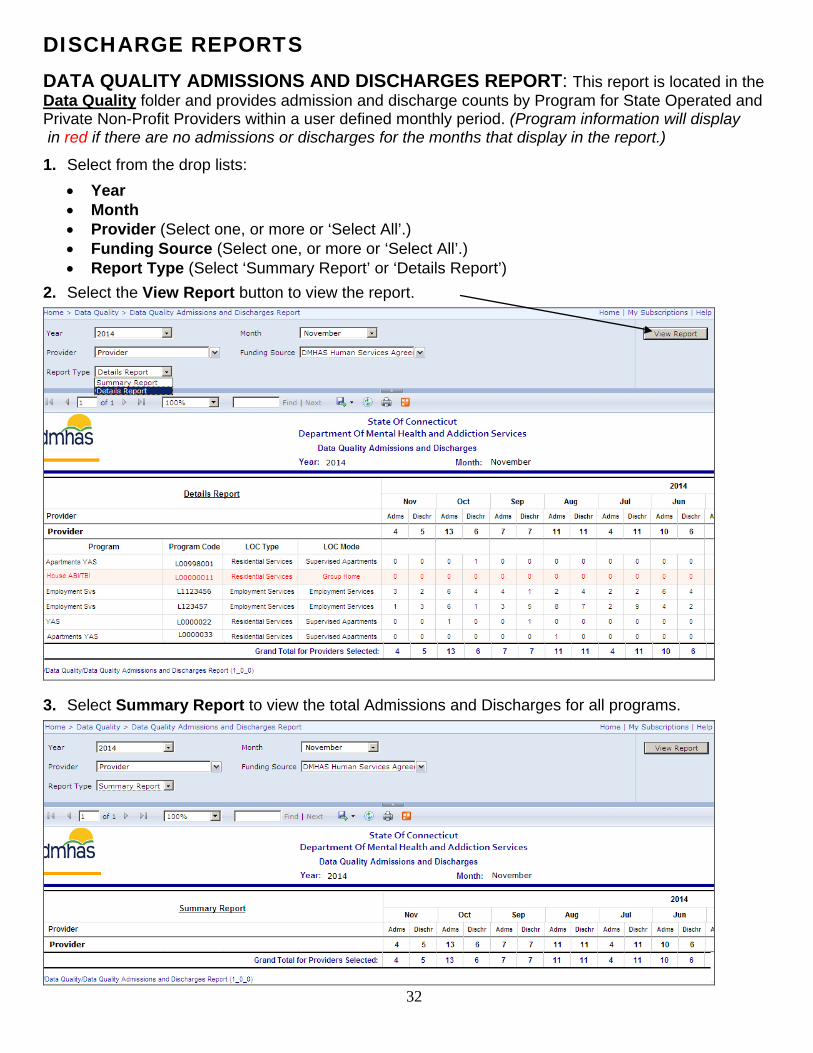
DATA QUALITY ADMISSIONS AND DISCHARGES REPORT: This report is located in the Data Quality folder and provides admission and discharge counts by Program for State Operated and Private Non-Profit Providers within a user defined monthly period. (Program information will display in red if there are no admissions or discharges for the months that display in the report.)
1. Select from the drop lists:
• Year • Month • Provider (Select one, or more or ‘Select All’.) • Funding Source (Select one, or more or ‘Select All’.) • Report Type (Select ‘Summary Report’ or ‘Details Report’)
2. Select the View Report button to view the report.
3. Select Summary Report to view the total Admissions and Discharges for all programs.
33
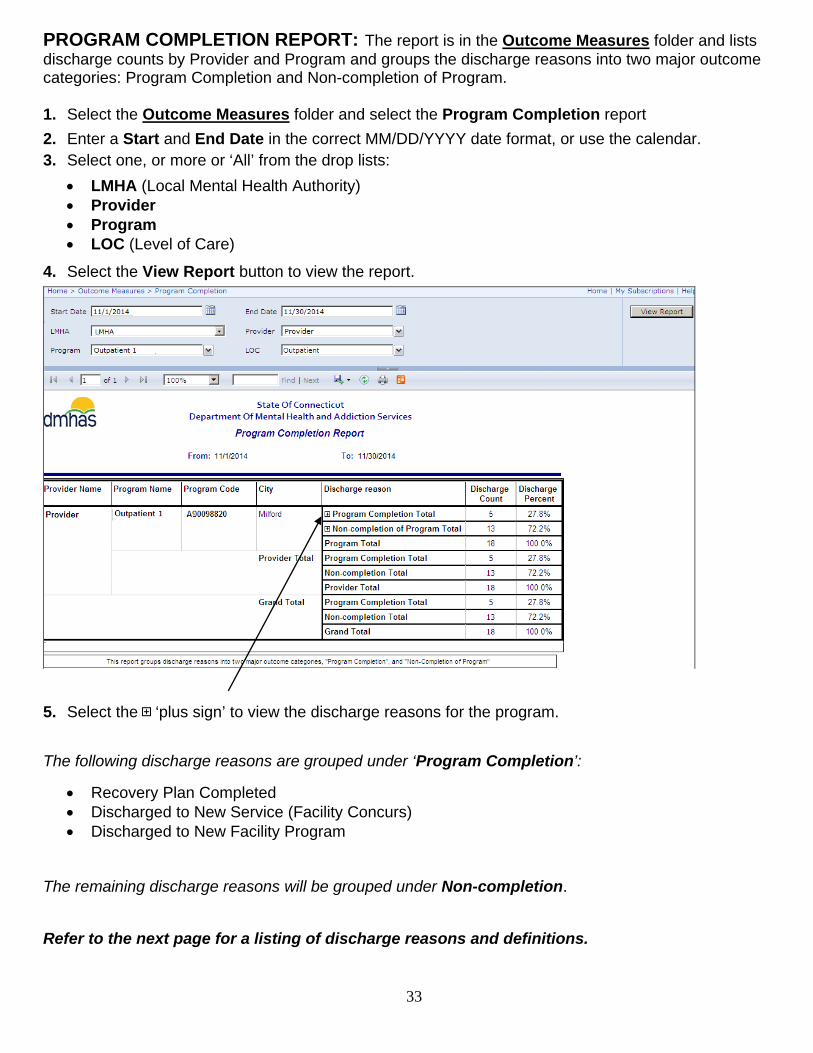
PROGRAM COMPLETION REPORT: The report is in the Outcome Measures folder and lists discharge counts by Provider and Program and groups the discharge reasons into two major outcome categories: Program Completion and Non-completion of Program. 1. Select the Outcome Measures folder and select the Program Completion report
2. Enter a Start and End Date in the correct MM/DD/YYYY date format, or use the calendar.
3. Select one, or more or ‘All’ from the drop lists:
• LMHA (Local Mental Health Authority) • Provider • Program • LOC (Level of Care)
4. Select the View Report button to view the report.
5. Select the ‘plus sign’ to view the discharge reasons for the program.
The following discharge reasons are grouped under ‘Program Completion’:
• Recovery Plan Completed • Discharged to New Service (Facility Concurs) • Discharged to New Facility Program
The remaining discharge reasons will be grouped under Non-completion. Refer to the next page for a listing of discharge reasons and definitions.
34
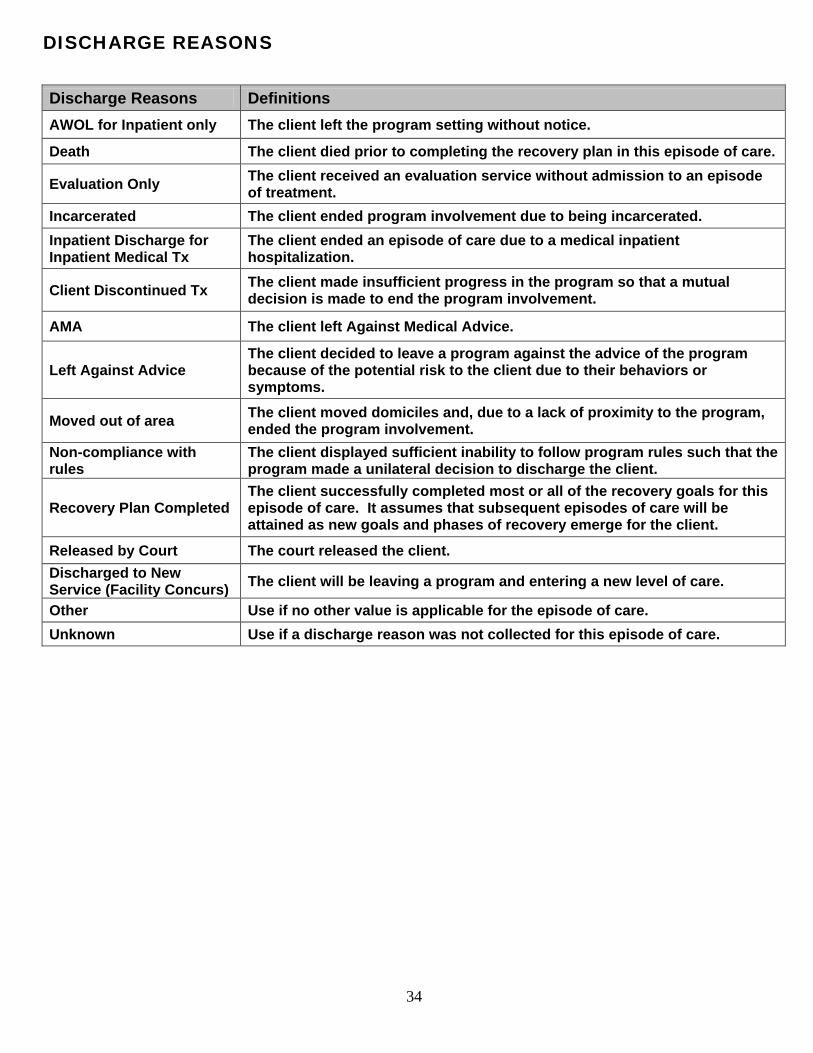
DISCHARGE REASONS
Discharge Reasons Definitions AWOL for Inpatient only The client left the program setting without notice.
Death The client died prior to completing the recovery plan in this episode of care.
Evaluation Only The client received an evaluation service without admission to an episode of treatment.
Incarcerated The client ended program involvement due to being incarcerated. Inpatient Discharge for Inpatient Medical Tx
The client ended an episode of care due to a medical inpatient hospitalization.
Client Discontinued Tx The client made insufficient progress in the program so that a mutual decision is made to end the program involvement.
AMA The client left Against Medical Advice.
Left Against Advice The client decided to leave a program against the advice of the program because of the potential risk to the client due to their behaviors or symptoms.
Moved out of area The client moved domiciles and, due to a lack of proximity to the program, ended the program involvement.
Non-compliance with rules
The client displayed sufficient inability to follow program rules such that the program made a unilateral decision to discharge the client.
Recovery Plan Completed The client successfully completed most or all of the recovery goals for this episode of care. It assumes that subsequent episodes of care will be attained as new goals and phases of recovery emerge for the client.
Released by Court The court released the client. Discharged to New Service (Facility Concurs) The client will be leaving a program and entering a new level of care.
Other Use if no other value is applicable for the episode of care. Unknown Use if a discharge reason was not collected for this episode of care.
35
FORMAT REPORT
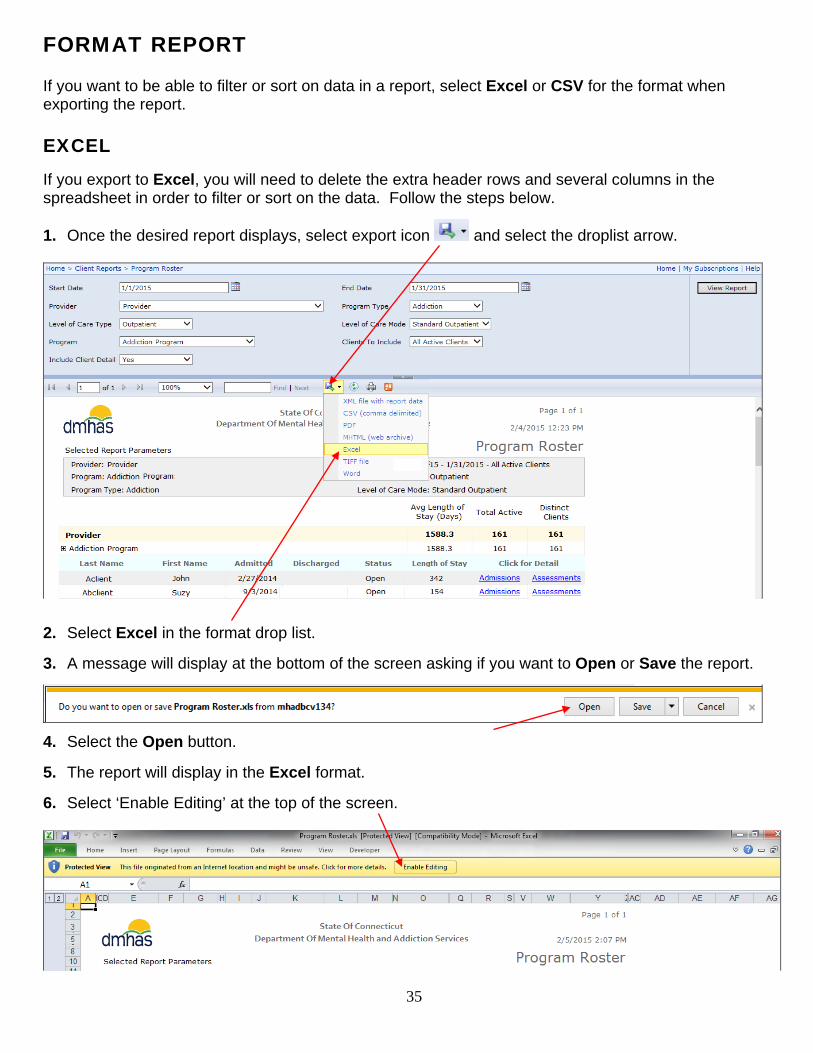
If you want to be able to filter or sort on data in a report, select Excel or CSV for the format when exporting the report. EXCEL If you export to Excel, you will need to delete the extra header rows and several columns in the spreadsheet in order to filter or sort on the data. Follow the steps below.
1. Once the desired report displays, select export icon and select the droplist arrow.
2. Select Excel in the format drop list.
3. A message will display at the bottom of the screen asking if you want to Open or Save the report.
4. Select the Open button. 5. The report will display in the Excel format. 6. Select ‘Enable Editing’ at the top of the screen.
36
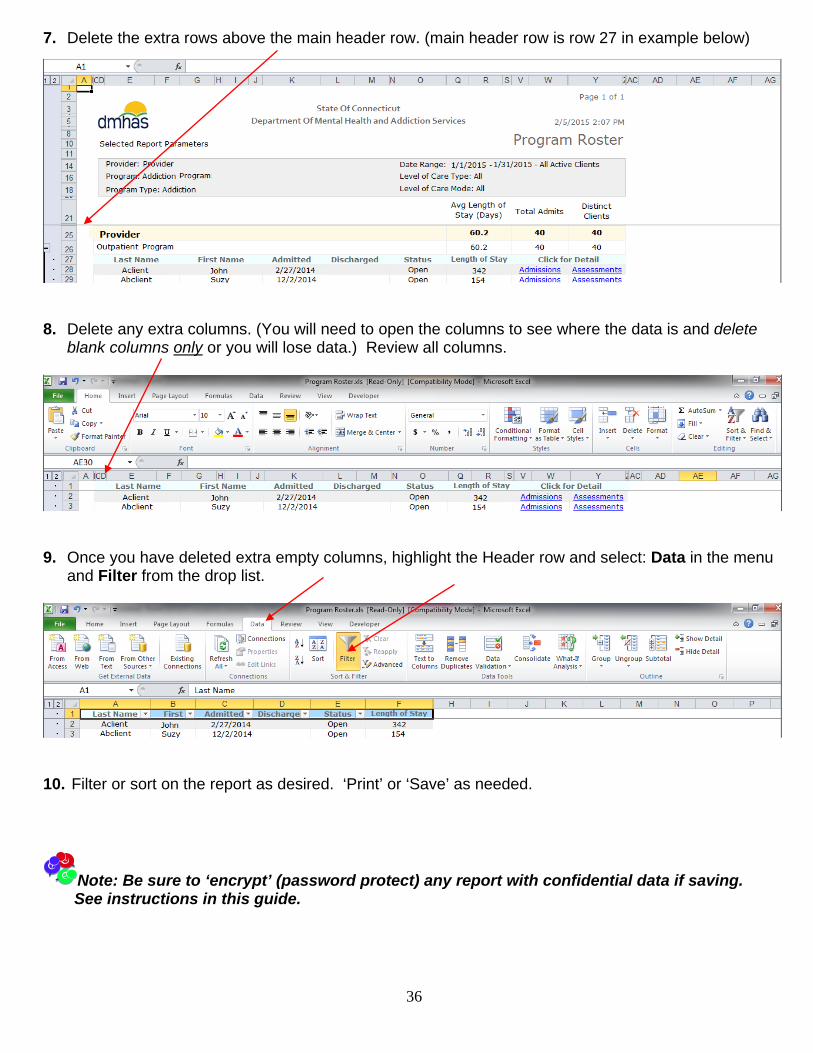
7. Delete the extra rows above the main header row. (main header row is row 27 in example below)
8. Delete any extra columns. (You will need to open the columns to see where the data is and delete
blank columns only or you will lose data.) Review all columns.
9. Once you have deleted extra empty columns, highlight the Header row and select: Data in the menu
and Filter from the drop list.
10. Filter or sort on the report as desired. ‘Print’ or ‘Save’ as needed.
Note: Be sure to ‘encrypt’ (password protect) any report with confidential data if saving. See instructions in this guide.
37
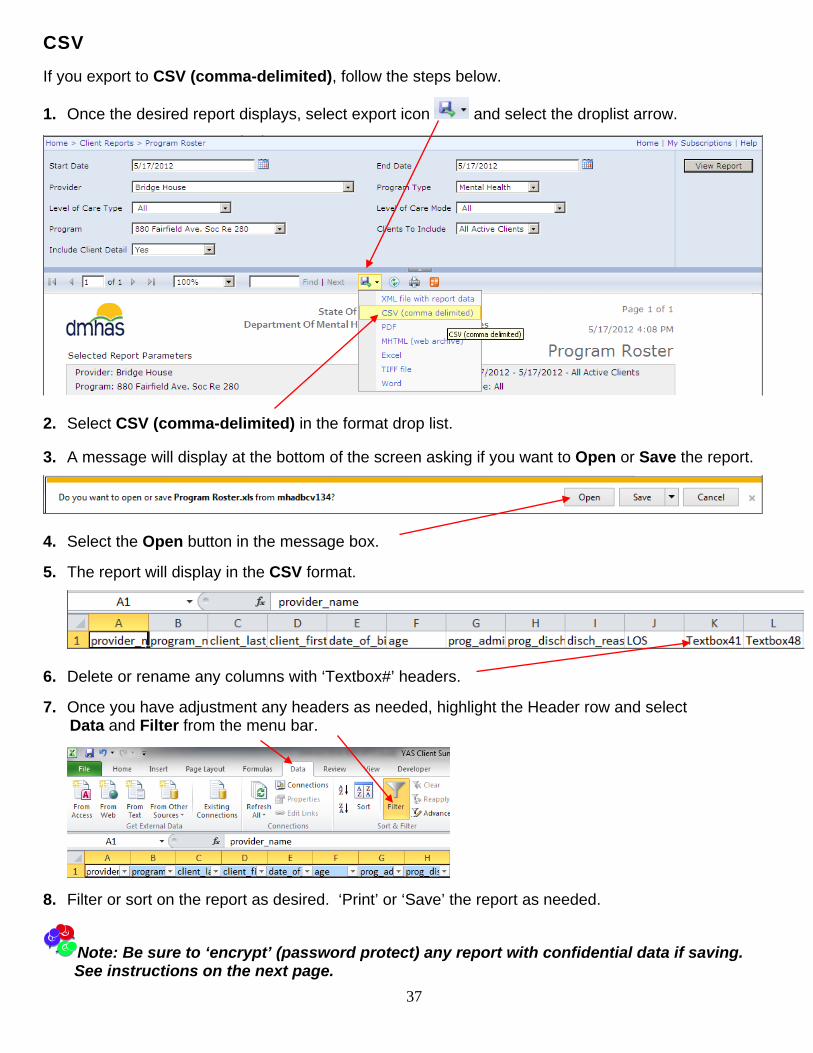
CSV If you export to CSV (comma-delimited), follow the steps below.
1. Once the desired report displays, select export icon and select the droplist arrow.
2. Select CSV (comma-delimited) in the format drop list.
3. A message will display at the bottom of the screen asking if you want to Open or Save the report.
4. Select the Open button in the message box. 5. The report will display in the CSV format.
6. Delete or rename any columns with ‘Textbox#’ headers. 7. Once you have adjustment any headers as needed, highlight the Header row and select Data and Filter from the menu bar.
8. Filter or sort on the report as desired. ‘Print’ or ‘Save’ the report as needed.
Note: Be sure to ‘encrypt’ (password protect) any report with confidential data if saving. See instructions on the next page.
38
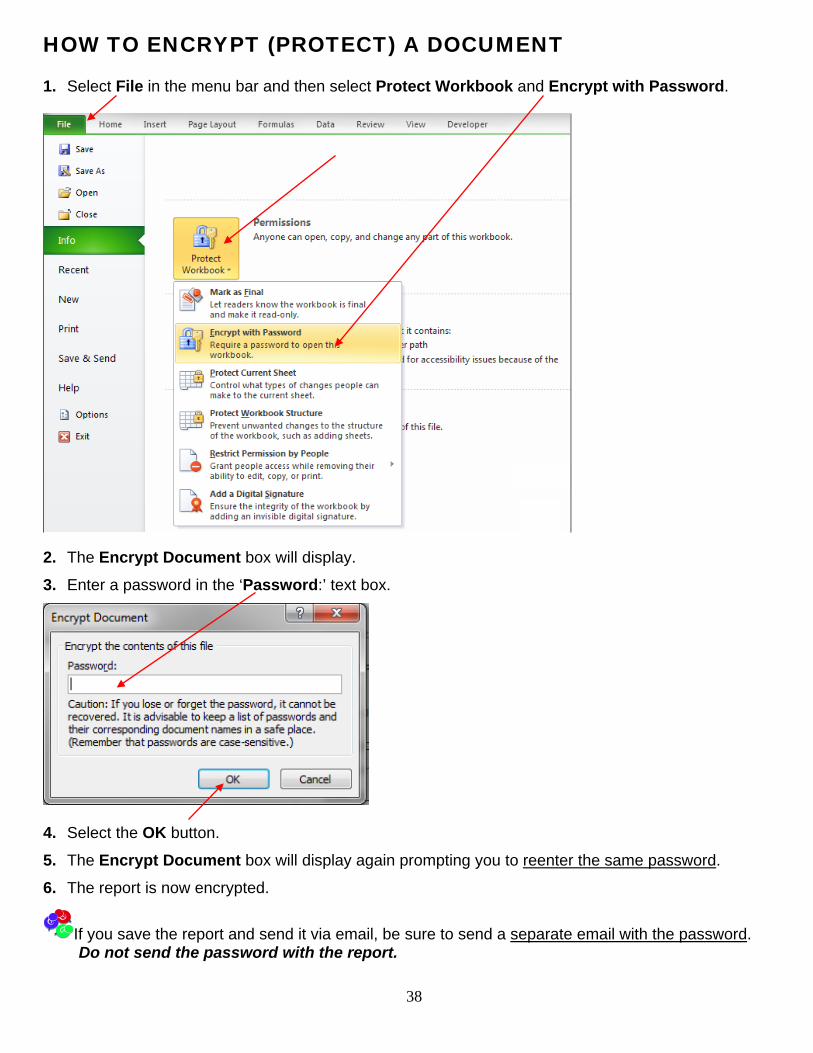
HOW TO ENCRYPT (PROTECT) A DOCUMENT 1. Select File in the menu bar and then select Protect Workbook and Encrypt with Password.
2. The Encrypt Document box will display.
3. Enter a password in the ‘Password:’ text box.
4. Select the OK button.
5. The Encrypt Document box will display again prompting you to reenter the same password.
6. The report is now encrypted.
If you save the report and send it via email, be sure to send a separate email with the password. Do not send the password with the report.
39
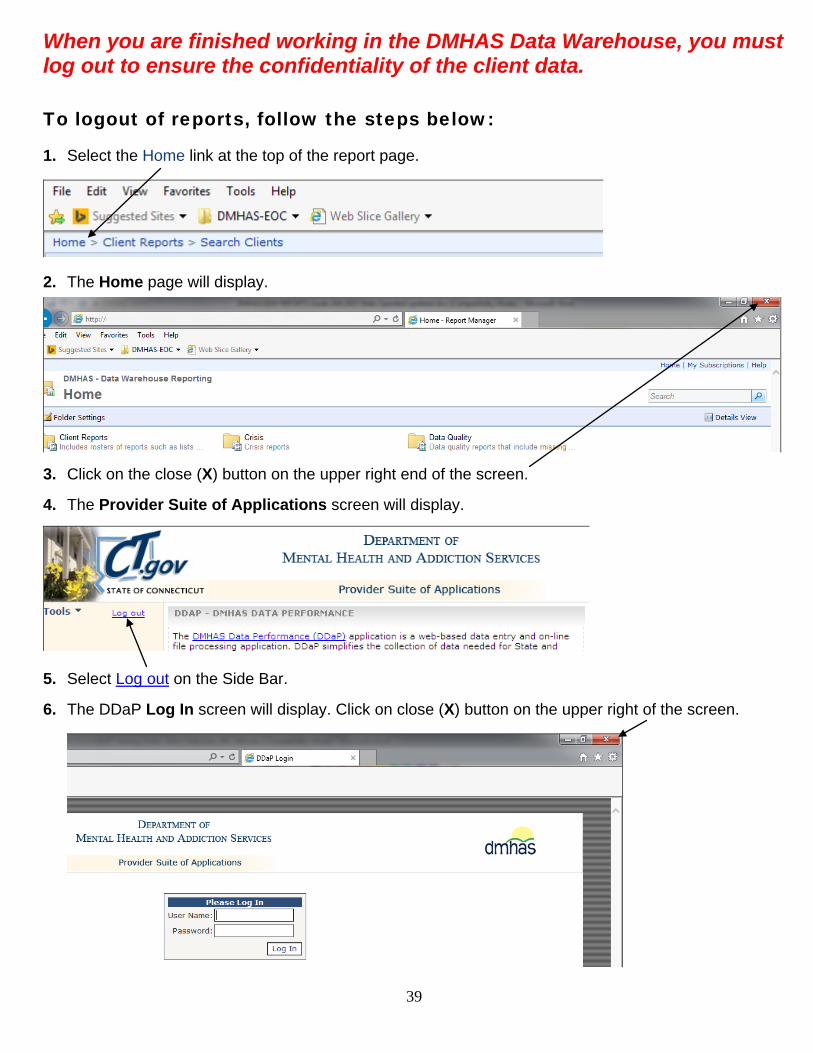
When you are finished working in the DMHAS Data Warehouse, you must log out to ensure the confidentiality of the client data.
To logout of reports, follow the steps below: 1. Select the Home link at the top of the report page.
2. The Home page will display.
3. Click on the close (X) button on the upper right end of the screen. 4. The Provider Suite of Applications screen will display.
5. Select Log out on the Side Bar. 6. The DDaP Log In screen will display. Click on close (X) button on the upper right of the screen.
Recommended