STATCOM Application to Address Grid Stability and Reliability: Part II
D.J. SHOUP, N.W. TENZA
Mitsubishi Electric Power Products, Inc.
G.F. REED
University of Pittsburgh
USA
SUMMARY As a follow-up to “STATCOM Application to Address Grid Stability and Reliability: Part I”, this
paper provides analysis for an example system to examine short-term voltage stability and to
demonstrate the performance of a STATCOM, SVC, and also a synchronous condenser. The
technologies are examined in relation to reliability criteria, short-term voltage stability, and fault-
induced delayed voltage recovery (FIDVR). The performance of the STATCOM, SVC, and
synchronous condenser are compared amongst the challenges utilities are facing in today's changing
generation portfolio and loading environment that are affecting overall grid stability and the device
characteristics required to address such challenges. Voltage correction performance, filtering needs,
spatial requirements, and adaptability, among other factors, are considered for a STATCOM, SVC,
and a synchronous condenser. This paper demonstrates careful attention needs to be given to
generation profile and load profile, along with load characteristics. FIDVR has provided a warning
that the characteristics of the load can have a significant impact on system stability. It is anticipated
that as loading profiles continue to change, attention will need to be paid to represent the
characteristics of such load adequately. For the example here, motor stalling can lead to the loss of
synchronism of local generation, system separation, and corresponding voltage collapse. Also, the
stalling of motors propagated throughout the load pocket of interest.
KEYWORDS
STATCOM, SVC, synchronous condenser, short-term voltage stability, Fault Induced Delayed
Voltage Recovery (FIDVR)
21, rue d’Artois, F-75008 PARIS CIGRE US National Committee
http : //www.cigre.org 2016 Grid of the Future Symposium
1
I. INTRODUCTION
The follow describes the example system chosen for this analysis:
• Focus is on a load pocket (20,000 MW) connected to a 138 kV system with a strong 345 kV
backbone. 40% of the load is served by remote generation that is 200 miles away and not able
to provide reactive power support. The remote generation consists of a large nuclear plant,
coal plants, gas turbines, and wind generation.
o Load pocket is expected to continue to have generation retirements because of aging
generation plants and clean air legislation. The local generation will be replaced with
remote generation, which will further exasperate voltage problems.
o Load is expected to continue to increase in the load pocket.
• Load is summer peaking. Of the total load pocket, 40% of the load is estimated to be single-
phase residential air-conditioner (a/c) motor load.
• Mechanically Switched Capacitors (MSC) provide compensation on the order of magnitude of
one-third of the total load in the region (7000 Mvar).
• Under-Voltage Load Shedding (UVLS) and Under-Frequency Load Shedding (UFLS) are to
be avoided as means for mitigating short-term voltage stability issues here.
The simulation program chosen for this work is the Power System Simulator for Engineering (PSS/E),
Version 32.1.1. Limiting cases are discussed to identify the location, rating, and response
characteristics of dynamic reactive power compensation to address short-term voltage stability
problems. Time-domain simulations are included here for critical breaker-to-breaker contingencies in
the load area, focusing on key 345 kV (Extra High Voltage (EHV) buses) and 138 kV (High Voltage
(HV) buses) buses serving the load area.
A complex load model was used to model the load in PSS/E based on conversion of the constant
impedance, current, and MVA (ZIP) load to a composite load model to represent motor and lighting
load for residential, commercial, and industrial areas. Most importantly large, small, and air-
conditioner (a/c) motor load was modeled based on percent estimates for that type of load in the area.
40% of the load was estimated to be single-phase residential air-conditioner (a/c) motor load and its
impedance was modified at certain voltage thresholds to represent stalled conditions.
II. BASE ANALYSIS
This paper focuses on a stuck breaker event resulting from a transmission line fault close to a 345kV
substation. Normal operation of the protection of the faulted line opens the far end of the line but
leaves a single pole of a near-end circuit breaker closed. The operation of primary and backup
protection opens three transmission lines and disconnects 1000 MW of local generation. The delay
between the partial operation of the primary breakers and the opening of the secondary breakers is a
parameter of the study.
The need for reactive power support in the load area is dependent on the character of the load and,
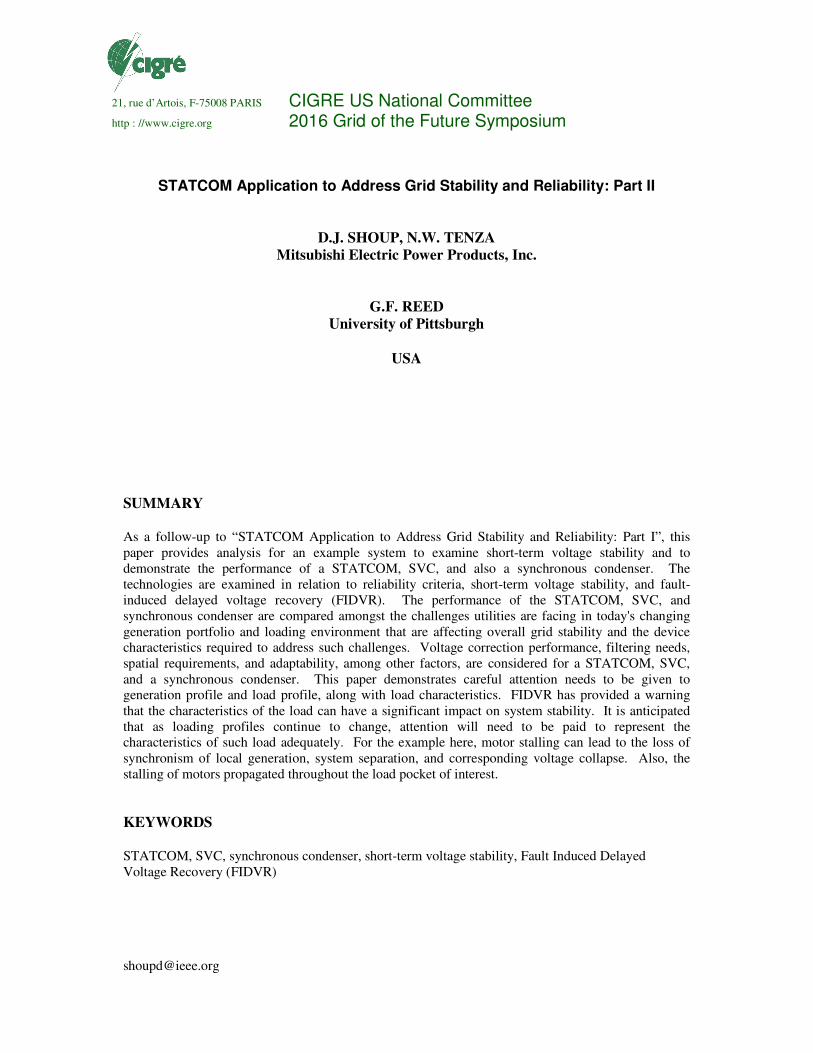
accordingly, it is essential that the appropriate model is used to represent it. Figure 1 shows the
voltage at a key bus in the load area for Case A (red) where the composite load model is used with
40% of each load represented as single-phase a/c and for Case F (green) where the load is represented
as constant-current-real and constant-suseptance-imaginary (constant I/B load model). Stuck breaker
(single-phase stuck pole) timing for these traces is 10 cycles (fault cleared 15 cycles relative to fault
inception). The voltages in the load area do not recover when the complex load model is used but they
recovery quickly when the constant I/B load model is used. This is because of the stalling of motors
when the complex load is used; where the constant I/B load model is not able to recognize the stalling
of motors.
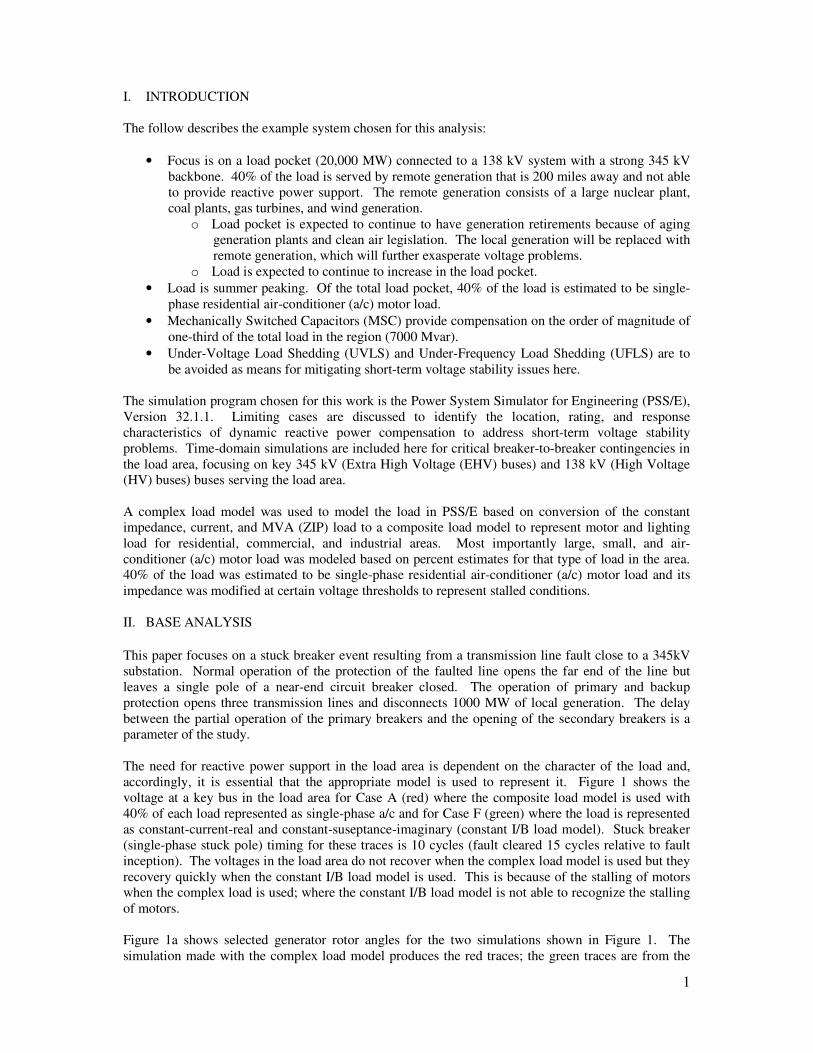
Figure 1a shows selected generator rotor angles for the two simulations shown in Figure 1. The
simulation made with the complex load model produces the red traces; the green traces are from the
2
simulation with the constant I/B load model. It is clear that a block of generators pulls out of step with
the main system in the simulation made with the complex load model but not in the simulation made
with the simpler load model.
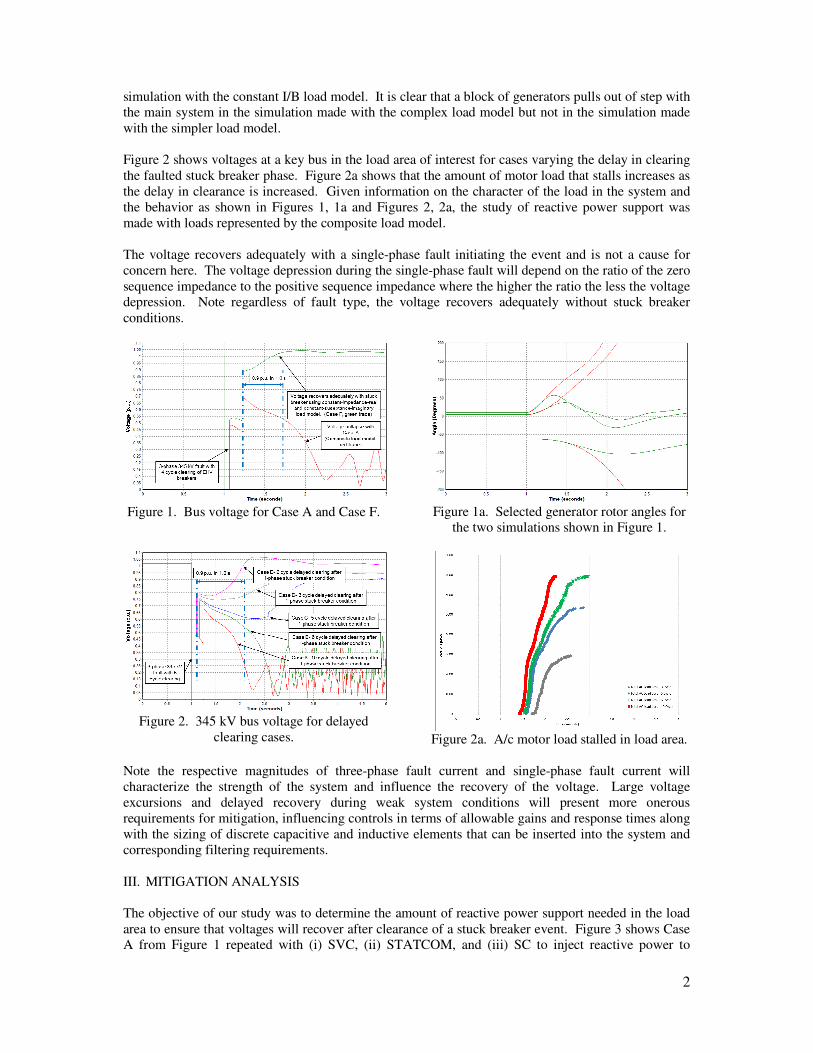
Figure 2 shows voltages at a key bus in the load area of interest for cases varying the delay in clearing
the faulted stuck breaker phase. Figure 2a shows that the amount of motor load that stalls increases as
the delay in clearance is increased. Given information on the character of the load in the system and
the behavior as shown in Figures 1, 1a and Figures 2, 2a, the study of reactive power support was
made with loads represented by the composite load model.
The voltage recovers adequately with a single-phase fault initiating the event and is not a cause for
concern here. The voltage depression during the single-phase fault will depend on the ratio of the zero
sequence impedance to the positive sequence impedance where the higher the ratio the less the voltage
depression. Note regardless of fault type, the voltage recovers adequately without stuck breaker
conditions.
Figure 1. Bus voltage for Case A and Case F.
Figure 2. 345 kV bus voltage for delayed
clearing cases.
Figure 1a. Selected generator rotor angles for
the two simulations shown in Figure 1.
Figure 2a. A/c motor load stalled in load area.
Note the respective magnitudes of three-phase fault current and single-phase fault current will
characterize the strength of the system and influence the recovery of the voltage. Large voltage
excursions and delayed recovery during weak system conditions will present more onerous
requirements for mitigation, influencing controls in terms of allowable gains and response times along
with the sizing of discrete capacitive and inductive elements that can be inserted into the system and
corresponding filtering requirements.
III. MITIGATION ANALYSIS
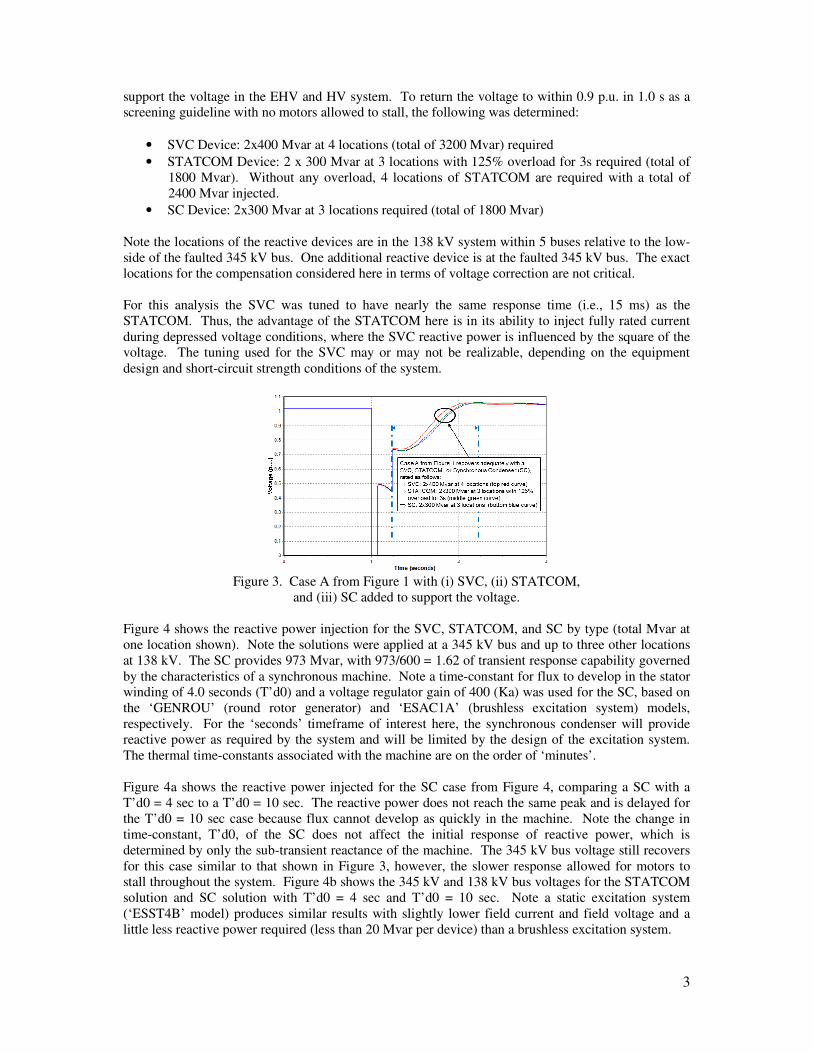
The objective of our study was to determine the amount of reactive power support needed in the load
area to ensure that voltages will recover after clearance of a stuck breaker event. Figure 3 shows Case
A from Figure 1 repeated with (i) SVC, (ii) STATCOM, and (iii) SC to inject reactive power to
3
support the voltage in the EHV and HV system. To return the voltage to within 0.9 p.u. in 1.0 s as a
screening guideline with no motors allowed to stall, the following was determined:
• SVC Device: 2x400 Mvar at 4 locations (total of 3200 Mvar) required
• STATCOM Device: 2 x 300 Mvar at 3 locations with 125% overload for 3s required (total of
1800 Mvar). Without any overload, 4 locations of STATCOM are required with a total of
2400 Mvar injected.
• SC Device: 2x300 Mvar at 3 locations required (total of 1800 Mvar)
Note the locations of the reactive devices are in the 138 kV system within 5 buses relative to the low-
side of the faulted 345 kV bus. One additional reactive device is at the faulted 345 kV bus. The exact
locations for the compensation considered here in terms of voltage correction are not critical.
For this analysis the SVC was tuned to have nearly the same response time (i.e., 15 ms) as the
STATCOM. Thus, the advantage of the STATCOM here is in its ability to inject fully rated current
during depressed voltage conditions, where the SVC reactive power is influenced by the square of the
voltage. The tuning used for the SVC may or may not be realizable, depending on the equipment
design and short-circuit strength conditions of the system.
Figure 3. Case A from Figure 1 with (i) SVC, (ii) STATCOM,
and (iii) SC added to support the voltage.
Figure 4 shows the reactive power injection for the SVC, STATCOM, and SC by type (total Mvar at
one location shown). Note the solutions were applied at a 345 kV bus and up to three other locations
at 138 kV. The SC provides 973 Mvar, with 973/600 = 1.62 of transient response capability governed
by the characteristics of a synchronous machine. Note a time-constant for flux to develop in the stator
winding of 4.0 seconds (T’d0) and a voltage regulator gain of 400 (Ka) was used for the SC, based on
the ‘GENROU’ (round rotor generator) and ‘ESAC1A’ (brushless excitation system) models,
respectively. For the ‘seconds’ timeframe of interest here, the synchronous condenser will provide
reactive power as required by the system and will be limited by the design of the excitation system.
The thermal time-constants associated with the machine are on the order of ‘minutes’.
Figure 4a shows the reactive power injected for the SC case from Figure 4, comparing a SC with a
T’d0 = 4 sec to a T’d0 = 10 sec. The reactive power does not reach the same peak and is delayed for
the T’d0 = 10 sec case because flux cannot develop as quickly in the machine. Note the change in
time-constant, T’d0, of the SC does not affect the initial response of reactive power, which is
determined by only the sub-transient reactance of the machine. The 345 kV bus voltage still recovers
for this case similar to that shown in Figure 3, however, the slower response allowed for motors to
stall throughout the system. Figure 4b shows the 345 kV and 138 kV bus voltages for the STATCOM
solution and SC solution with T’d0 = 4 sec and T’d0 = 10 sec. Note a static excitation system
(‘ESST4B’ model) produces similar results with slightly lower field current and field voltage and a
little less reactive power required (less than 20 Mvar per device) than a brushless excitation system.

4
During the fault the SC provides up to 5x change in current (based on 0.2 p.u. sub-transient reactance)
for a change in voltage, which is 0.12 p.u. here (at the location of the synchronous condenser), which
estimates the reactive power as 5 x 0.12 x 1000 = 600 Mvar provided during the fault. Following the
decay of the immediate response after fault clearing, the response is primarily influenced by the time it
takes flux to develop in the machine, under influence of the voltage regulator, shown in Figure 4 by
the build-up of the reactive power to its peak. Reactive power will be limited by the excitation system
in the timeframe of interest here. The 1.62x rated reactive power supplied is not a cause for concern
for the machine in the ‘seconds’ timeframe.
Sudden fault conditions cause a change in the speed and frequency of the machine where a momentary
speed difference of 29 RPM and associated frequency change of 0.36 Hz was observed. This provided
a momentary power output of 115 MW. While readily observable this has a negligible impact on the
system under study. Figure 5 provides a plot of the real power output for each of the SC locations for
reference. The blue trace corresponds to a SC located at 345 kV compared to the other two traces that
are for SC’s located at 138 kV at different locations relative to the fault. Swinging of turbine
generators in the system in response to the fault causes swinging of the phase of the voltages where the
SC are connected and this variation of phase causes the SC real power to swing.
Figure 4. Reactive power injection for
mitigation devices described in Figure 4.
Figure 4b. Bus voltage for comparison of
T’d0 = 4 sec to T’d0 = 10 sec cases for SC.
Figure 4a. Comparison of T’d0 = 4 sec to
T’d0 = 10 sec for SC case shown in Figure 5.
Figure 5. Real power output of the SC at
each of the three locations.
The following points are noted:
• The inertia of the synchronous condenser was set to H = 1.0 s; however, variations of H
between 0.8 s to 1.4 s have a negligible impact on the simulation results. Note fault ride-
through capability was not a parameter of study for this application.
• The reactive power supplied during the first 5 cycles of the fault for the SVC, STATCOM, and
SC at the compensation locations were similar. Over the next 5 cycles the SVC and
STATCOM provided more reactive power than the SC. Then, the response of the SC far
exceeded that of the SVC and STATCOM, because of the SC ability to provide a transient
response in significant excess of its steady state capability.
5
• There is a brief period of real power exchange with the system driven by a system induced
change in speed of the SC, which has no impact on the findings of the study here.
The focus here was to provide voltage support post-fault to prevent air-conditioner stalling conditions
(FIDVR). Note an inductive range on the order of 100 Mvar was identified to control voltages beyond
1.05 p.u., where even more inductive range could be required subject to the voltage suppression
required for light-load conditions and operating experience of the utility (not examined here). Such
inductive range is inherently supplied by the symmetrical rating of a STATCOM device, but must be
specifically accommodated for in an SVC solution by use and rating of a Thyristor Controlled Reactor
(TCR). Hybrid designs are realizable, but beyond the scope of this paper.
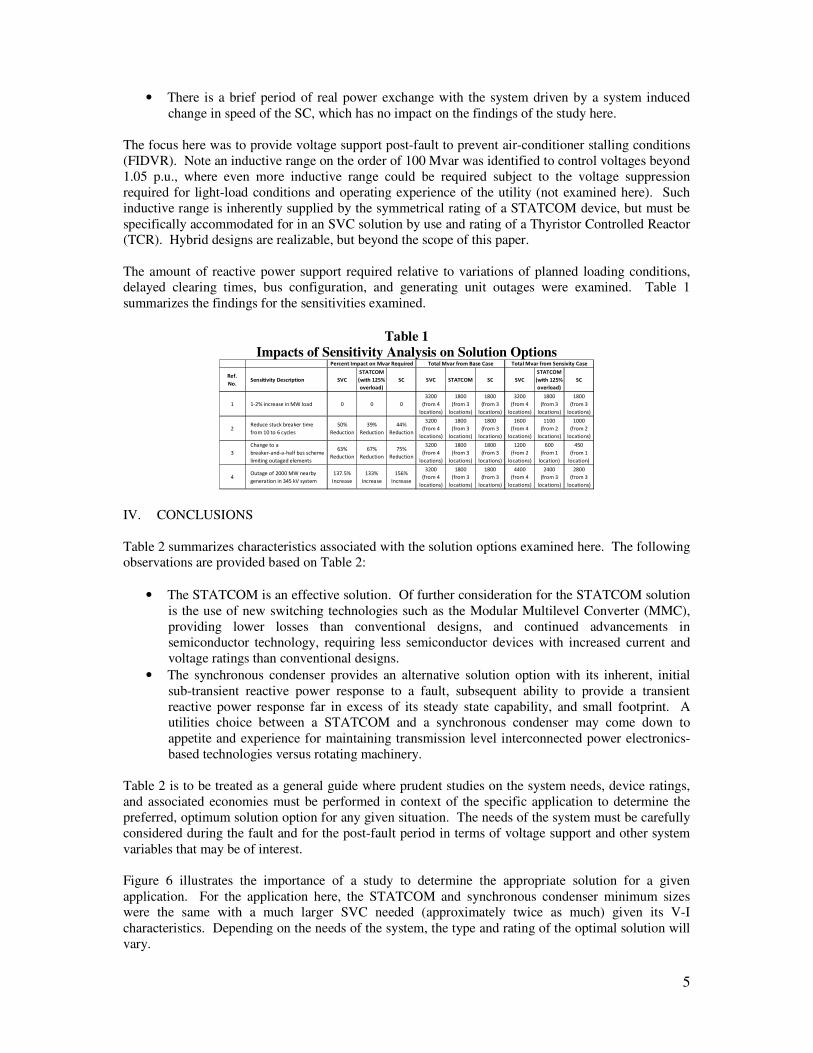
The amount of reactive power support required relative to variations of planned loading conditions,
delayed clearing times, bus configuration, and generating unit outages were examined. Table 1
summarizes the findings for the sensitivities examined.
Table 1
Impacts of Sensitivity Analysis on Solution Options
Ref.
No.Sensitivity Description SVC
STATCOM
(with 125%
overload)
SC SVC STATCOM SC SVC
STATCOM
(with 125%
overload)
SC
1 1-2% increase in MW load 0 0 0
3200
(from 4
locations)
1800
(from 3
locations)
1800
(from 3
locations)
3200
(from 4
locations)
1800
(from 3
locations)
1800
(from 3
locations)
2Reduce stuck breaker time
from 10 to 6 cycles
50%
Reduction
39%
Reduction
44%
Reduction
3200
(from 4
locations)
1800
(from 3
locations)
1800
(from 3
locations)
1600
(from 4
locations)
1100
(from 2
locations)
1000
(from 2
locations)
3
Change to a
breaker-and-a-half bus scheme
limiting outaged elements
63%
Reduction
67%
Reduction
75%
Reduction
3200
(from 4
locations)
1800
(from 3
locations)
1800
(from 3
locations)
1200
(from 2
locations)
600
(from 1
location)
450
(from 1
location)
4Outage of 2000 MW nearby
generation in 345 kV system
137.5%
Increase
133%
Increase
156%
Increase
3200
(from 4
locations)
1800
(from 3
locations)
1800
(from 3
locations)
4400
(from 4
locations)
2400
(from 3
locations)
2800
(from 3
locations)
Total Mvar from Base CasePercent Impact on Mvar Required Total Mvar from Sensivity Case
IV. CONCLUSIONS
Table 2 summarizes characteristics associated with the solution options examined here. The following
observations are provided based on Table 2:
• The STATCOM is an effective solution. Of further consideration for the STATCOM solution
is the use of new switching technologies such as the Modular Multilevel Converter (MMC),
providing lower losses than conventional designs, and continued advancements in
semiconductor technology, requiring less semiconductor devices with increased current and
voltage ratings than conventional designs.
• The synchronous condenser provides an alternative solution option with its inherent, initial
sub-transient reactive power response to a fault, subsequent ability to provide a transient
reactive power response far in excess of its steady state capability, and small footprint. A
utilities choice between a STATCOM and a synchronous condenser may come down to
appetite and experience for maintaining transmission level interconnected power electronics-
based technologies versus rotating machinery.
Table 2 is to be treated as a general guide where prudent studies on the system needs, device ratings,
and associated economies must be performed in context of the specific application to determine the
preferred, optimum solution option for any given situation. The needs of the system must be carefully
considered during the fault and for the post-fault period in terms of voltage support and other system
variables that may be of interest.
Figure 6 illustrates the importance of a study to determine the appropriate solution for a given
application. For the application here, the STATCOM and synchronous condenser minimum sizes
were the same with a much larger SVC needed (approximately twice as much) given its V-I
characteristics. Depending on the needs of the system, the type and rating of the optimal solution will
vary.

6
Table 2
Summary of Characteristics Associated with the Solution Options
Ref. No. Parameter SVC STATCOM
Synchronous
Condenser (SC)
(Brushless Excitation System)
1
Extra Capacitive Transient
Response Capability For
Application Here
(Seconds Timeframe)
None
(Passive Capacitive Devices)
125%
(Must be Designed Overload)
162%
(Based on Machine Characteristics
Up to Excitation System Limits)
2
Required Capacitive
Mvar Based on Above
For Application Here
3200
(4x 2x400)
1800
(3x 2x300)
(Most likely in units of 150 Mvar)
1800
(3x 2x300)
(Static Excitation System
Produces Similar Results Here)
3
Device Voltage/
System Voltage
For Application Here
15 kV to 25 kV / (345/138 kV) 15 kV to 25 kV / (345/138 kV) 13.8 kV to 18 kV / (345/138 kV)
4 During Fault ResponseSubject to V^2 effect
(Blocks at ~0.4 p.u.)
Injects Rated Device Current
(Blocks at ~0.2 p.u.)
Up to 5x Rated Reactive
Current (Sub-transient)
5Fast Response to
Post-Fault VoltageYes Yes Yes
6Post Fault Response
(Up to 15s)Subject to V^2 effect
Injects Rated Device Current
(Up to Designed Overload)
Mvar Capability
Determined by Excitation
System Limits
7 Controlled Response
40-50 ms
(Faster Tuning Possible
System/Design Dependent)
15-30 ms
(System/Design Dependent)
200-500 ms
(Brushless Excitation System)
8 InertiaNone
(No Moving Parts)
None
(No Moving Parts)
H = 1.0-1.5 (Negligible Impact
on Most Transmission Systems)
Note higher H values can be achieved
by slightly over-sized machine.
9 Real Power NoneNone
(Unless Energy Storage)
Negligible Impact on Most Systems
(External Event Causes Speed
Deviation) (Unless Flywheel)
10Unbalanced Operation
and Correction
Yes, On Design Basis
(May Need Filter)Yes, On Design Basis Limited
11Harmonic Generation
and Correction
Needs Filters (Unless TSC Only)
Active Correction Possible
MMC Eliminates Filters (100 Mvar+)
Active Correction Possible
Negligible
Can Absorb Harmonics
12 Site AdaptabilityLimited
(Large Passive Elements)
Yes
(Modular/Scalable/Upgradable)
No
(Rigid Foundation Required)
13Security/
Environment
Limited
(Outdoor Equipment)
Enclosed Building
(Except Step-Up XFMR)
Enclosed Building
(Except Step-Up XFMR)
14 Operating LossesDesign Dependent
(~0.5-1%, Excludes XFMR)
MMC Design
(~0.5-1%, Excludes XMFR)
~1.0%
(Excludes XMFR)
15 Spatial Requirements6-12 m^2/Mvar
(65-130 ft^2/Mvar)
3-6m^2/Mvar
(32-65 ft^2/Mvar)
3-5m^2/Mvar
(32-54 ft^2/Mvar)
16
Long-Term
Mainteance Items
To Consider
Cooling System
Spare Parts
Software Platform
Cooling System
Spare Parts
Software Platform
Lubrication and Cooling System
(Modern Designs Built for
Transmission Oriented Manuevering)
17Ability to Operate
in Weak System
Automatic Gain Control (AGC)
SCR > 2-3
Not Effective in Weak System
Automatic Gain Control (AGC)
SCR > 1; Check Harmonic Resonances
in Weak System
No Limits to SCR
Figure 6. Mvar response of the SVC, STATCOM, and SC for various timeframes.
V. ACKNOWLEDGEMENTS
The authors would like to extend thanks to Ken Donohoo of Oncor Electric and John O'Connor of
Duke Energy Carolinas for their support and contributions to this area of study. The authors would
also like to thank John Undrill for his contributions on synchronous condenser modeling and review.
7
BIBLIOGRAPHY [1] NERC Planning Standards, http://www.nerc.com.
[2] NERC, “A Technical Reference Paper Fault-Induced Delayed Voltage Recovery,” Version 1.2,
June 2009.
[3] CIGRE Brochure 144, “Static Synchronous Compensator (STATCOM),” WG 14.19, August
2000.
[4] Larsen EV, Miller NW, Lindgren SR, Nilsson SL, ”Benefits of GTO-based Compensation
Systems for Electric Utility Applications,” IEEE Transactions on Power Delivery, 1992;
7(4):2056−2064.
[5] John J. Paserba, Gregory F. Reed, Masatoshi Takeda, Tomohiko Aritsuka, “FACTS and Custom
Power Equipment for the Enhancement of Power Transmission System Performance and Power
Quality,” Symposium of Specialists in Electric Operational and Expansion Planning (VII
SEPOPE), Curitiba, Brazil, May 21-26, 2000.
[6] M. Yagi, T. Takano, T. Sato, I. Iyoda, K. Temma, “Role and New Technologies of STATCOM
for Flexible and Low Cost Power System Planning,” CIGRE 14-107, Session 2002.
[7] T. Fujii, K. Temma, N. Morishima, T. Akedani, T. Shimonosono, H. Harada, “450 MVA GCt-
STATCOM for Stability Improvement and Over-Voltage Suppression,” IEEE International
Power Electronics Conference 2010, pg. 1766-1772.
[8] T. Akedani, J. Hayashi, K. Temma, N. Morishima, “450 MVA STATCOM installation plan for
stability improvement,” CIGRE B4.207, Session 2010.
Recommended