Divestiture as Conglomerate Merger Remedy,
with Case Study of 2005 P&G-Gillette Merger ∗
Lydia Cheung
Auckland University of Technology †
June 13, 2017
Abstract
This paper closely follows a merger and divestiture in the deodorant market to doc-ument the efficacy of divestiture as a structural merger remedy. The divestiture haseliminated almost all increase in market share that would otherwise result in themerger. However, market concentration has increased to new levels, unseen beforethe merger, just three years after the transaction. On the one hand, the buyer ofdivested brands competes weakly; on the other hand, the two leading manufacturerscompete aggressively with new brand positioning, new product introduction, andheavy advertising. The data shows that their aggressive competitive behavior hasresulted in increased market shares. It is possible that the new competition intensityis partially due to the divestiture. This paper sheds light on the difference betweenthe outcome of competition (market shares and concentration) versus the substanceof competitive behavior (pricing, product positioning, advertising), and that anystructural merger remedy, by definition, addresses only the former, not the latter.
JEL classification: D12; L11; L13; L41
Keywords: merger; divestiture; remedy; deodorant
∗I thank seminar participants at the NZAE and APIOC 2016 conferences. All errors are my own.
†School of Economics, Faculty of Business, Economics, and Law, Auckland University of Technology.
1

1 Introduction
Divestiture of assets is one of the most commonly used structural merger remedies. When two
conglomerates have business in overlapping product categories, a merger between them would
result in a horizontal merger in these overlapping categories, thus an increase in market power.
Divestiture of assets from one of the merging parties to a third company with no existing business
in the market should eliminate the increase in market shares of the merging parties. However,
this does not necessarily lead to no change in market power or competitive landscape in the
market. In one extreme, the buyer might fail in the business and exit; in another extreme, the
buyer might be selected by the merging parties as a future collusion partner. In addition, any
number of external factors might influence this market to render the merger harmless or the
divestiture ineffectual. There are very few systematic studies on the effects of divestitures as a
merger remedy and their ability to return competition to pre-merger levels, partly due to their
idiosyncratic nature. The Federal Trade Commission (FTC) released its first merger remedy
study in 1999; recently in January 2017 it has released a second round of results.1 This paper
aims to complement this study by looking into one particular merger and divestiture in detail,
to document firms’ competitive behavior and market outcome post-transaction.
The FTC clears the merger between P&G and the Gillette Company in October 2005, with
the condition for P&G to divest business in overlapping categories. These include battery-
powered toothbrushes and teeth whitening products. Also, since they both have a best-selling
men’s deodorant brand in their portfolio (Old Spice and Right Guard, respectively), the FTC
requires P&G to divest the Right Guard brand. P&G is allowed to keep the Gillette brand of
deodorants because of marketing synergies with the Gillette brand of shaving razors, which P&G
is allowed to keep because it has no prior presence in the razors category. In addition, P&G
also voluntarily divested two smaller women’s deodorant brands, Dry Idea and Soft & Dri, both
formerly belonging to Gillette Co. Divestiture of these three deodorant brands is completed in
February 2006, with all three brands sold to Henkel Dial. The buyer has no existing presence
in the deodorant market but has substantial experience in other personal care categories, such
as soap and body wash.
Data shows that while the divestiture of three deodorant brands has almost eliminated all
increase in market share on the merging parties, the competitive behavior of firms, in particular
1https://www.ftc.gov/policy/studies/remedy-study
2

the two leading manufacturers in deodorants, P&G and Unilever, has changed soon after the
transaction. Within three years, measures of market concentration has increased to new high
levels never seen before the merger. P&G and Unilever have both raised the price points of their
deodorant brands, introduced expensive clinical strength products, and spent heavily on adver-
tising. These observed behavior match the narrative of brand re-positioning. Their increased
market shares suggest their success. The buyer of the divested brands is observed to compete
more weakly than the original owner, which might have enabled this competition intensity.
2 Literature
There are not many empirical merger retrospective studies. This is often due to the non-
availability of post-merger data: if industry data is not publicly available, merging firms have no
obligation to release information to the antitrust authorities after the merger. Notable studies
include Breen (2004) on rail, Peters (2006) on airlines, and Farrell, Pautler, and Vita (2009) on
hospitals.
There are even fewer empirical studies on merger remedies. Here I mention three recent
studies most similar to the approach in this paper. Tenn and Yun (2011) investigates six divested
brands from Johnson & Johnson’s acquisition of Pfizer’s consumer health division in 2006. They
find that three brands brands show similar pre- and post-divestiture performance, while the other
three remaining brands experience changes that do not appear to be related to the divestiture.
They conclude that divestitures maintain the pre-merger level of competition. Soetevent, Haan,
and Heijnen (2014) compares the redistribution of tenancy rights of highway gasoline stations
through annual auctions organized by the government versus obligated divestitures. They find
that auctions alone do not lead to much change in retail price, since the incumbent owner
is allowed to bid and often wins. However, when auctions are combined with an obligation
to divest, prices decrease by 1.3-2.3% on average. Friberg and Romahn (2015) looks at the
Carlsberg-Pripps merger Swedish beer market. Following the market for almost two years after
the merger, they find that divestitures have cut the price increase from the merger in half for
the entire beer market.
3

3 Data and Analysis
Data on prices, quantity sold, and product characteristics come from the IRI Academic Data Set,
documented by Bronnenberg, Kruger, and Mela (2008). This dataset contains weekly store data
in years 2001-2011, including both grocery stores and convenience stores. The dataset contains
the complete list of stores under that chain whenever a store chain is sampled. The resultant
sample of stores cover 47 geographic markets in the U.S. Within each sampled store, the entire
list of consumer products under the 30 defined categories is recorded. One of these categories is
deodorants; other categories include food (e.g. beer, carbonated beverage, coffee), personal care
(e.g. razors, shampoo, toothbrush), and household (e.g. laundry detergent, paper towel, toilet
tissue). Each product is defined by its unique UPC (universal product code) and observed at
weekly frequency in each store. Each week-store-UPC observation contains the number of units
sold, total revenue in dollars, and some information on store feature and display. In addition,
there are some textual description and category-specific characteristics for each product. In this
paper, I use all deodorant UPC’s from all grocery stores, across all available 11 years. I have
also aggregated all variables from weekly to monthly frequency, to smooth out some of the prices
and quantity shocks due to the weekly supermarket discount cycles.
Advertising data comes from the Ad $ Summary reports published annually by TNS Media
Intelligence (until 2008) and Kantar Media (starting 2009). These reports contain yearly adver-
tising spending by product line and media outlet, which includes print, television, and radio,
but not the internet. A deodorant “product line” (e.g. “Secret Clinical Strength solid”) is an
aggregation of UPC’s of different sizes and scents, under the same brand (“Secret”), line (“Clin-
ical Strength”), and form (“solid”). The vast majority of deodorant advertising expenditure is
spent on television, followed by magazines.
3.1 Industry concentration
The deodorant industry is characterized by about two dozens of best-selling brands, and a long
tail of much smaller brands. I focus on the former in my all my subsequent discussion, with
the latter accounting for 5% or less of total ounce sold or gross revenue. Leading personal
care product manufacturers, such as P&G, Gillette Co., and Unilever, own multiple best-selling
brands. Other major manufacturers include Adidas Group, Church Dwight, Carter Wallace,
Colgate-Palmolive, Helen of Troy, Kao Corp., Revlon, and Henkel Dial (after divestiture). I be-
4

gin my industry analysis on the parent company level. In the first half of the decade, before the
P&G-Gillette merger in late 2005, the four leading manufacturers of deodorants are (in descend-
ing order) P&G, Gillette Co., Colgate-Palmolive, and Unilever. Their combined market share
sums to about 80%, calculated in terms of either total ounce sold or total gross revenue. The
Herfindahl-Hirschman Index (HHI) calculated with the market shares of the major manufactur-
ers above, ignoring market shares of the long tail of much smaller brands, is around 1800, which
is usually considered as “moderately concentrated”. Figure 1 shows the 4-firm concentration
ratio and HHI from 2001 to 2011.
Figure 1: HHI and 4-firm concentration ratio of the deodorant industry
The spikes in figure 1 around the beginning of 2006 are caused by the P&G-Gillette merger
and subsequent divestiture. The FTC clears the merger in October 2005 (left edge of the spikes),
and divestitures to Henkel Dial are complete in February 2006 (right edge of the spikes), giving
the spikes on the graphs a duration of four months. Recall that P&G has divested all of Gillette
Co.’s deodorant brands, with the exception of the Gillette brand, which is then ranked close
to the bottom of men’s top-10 brands. In other words, P&G, the biggest manufacturer in the
deodorant industry, does gain one additional brand after the merger and divestiture, albeit a
smaller brand. This is reflected in figure 1: the end of the spikes sees the 4-firm concentration
ratio and HHI returning to almost their pre-spike levels, but not exactly. Comparing 2006Q2
against 2005Q3, the HHI has increased from about 1800 to 1950, and the 4-firm concentration
ratio has increased from about 0.80 to 0.82. (These graphs show another visible drop after the
divestiture, in September 2006. This drop is due to an unrelated divestiture by P&G of the Sure
brand of women’s deodorants. The buyer was the private company Innovative Brands. The
5

Sure brand ranks around 5th among women’s brands in terms of ounce sold or gross revenue in
2006.)
The second half of this decade sees both the 4-firm concentration ratio and HHI increasing,
such that both surpass levels prior to merger. These increases are particularly significant when
measured using gross revenue (as opposed to ounce sold). This divergence between gross revenue
and ounce sold is due to two changes in the industry: the price-repositioning of existing product
lines and the introduction of clinical strength product lines. They are practiced by both P&G
and Unilever. I will present these changes in detail in subsequent sections and brand-level
dynamics.
At the very least, the deodorant industry in this decade is one example showing that, even if
a divestiture remedy returns market concentration measures (such as the 4-firm concentration
ratio and HHI) to pre-merger levels, there is no guarantee that the competitive landscape in
the market or industry will remain unchanged, even within a short foreseeable future of, say,
five years. These measures of market concentration, commonly used in merger analysis, are
reflections on the outcomes of the competitive process, not of competition itself. Competition
between firms can be observed more directly in their prices, product characteristics, introduction
of new product lines, and advertising behavior. Firms’ competitive behavior can change rapidly,
as we see happening in major deodorant brands that I detail below. This raises the question
of the degree to which the antitrust agency should take potential changes in firm behavior into
account when contemplating a merger proposal or remedy. In the FTC’s 2017 study on merger
remedies, a merger remedy is considered a “success” if “competition in the relevant market
remained at its pre-merger level or returned to that level within a short time (two to three
years)”.2 In this deodorant case, divestitures are complete within four months after merger
approval, and some observable aspects of firm behavior, such as pricing, are comparable to pre-
merger levels. However, the competitive behavior of major manufacturers do change quickly
after the divestitures. Within three years, in 2009, both P&G and Unilever have repositioned
the prices of their brands and introduced clinical strength products; data shows that these
competitive behavior has resulted in a further increase of their market shares and industry
concentration. This deodorant case might illustrate the need for antitrust agencies to consider
2https://www.ftc.gov/system/files/documents/reports/ftcs-merger-remedies-2006-2012-report-
bureaus-competition-economics/p143100_ftc_merger_remedies_2006-2012.pdf, page 15.
6

potential changes in firm competitive behavior when analyzing merger proposal or remedy.
3.2 Brand-level comparison
Figure 2: Brand-level average price per ounce and aggregated ounce sold, by gender
We now explore changes in pricing and quantity sold at the brand-level. All prices are
nominal and normalized by product weight, and the brand-level price-per-ounce is the average
weighted by total ounce sold in each UPC.3 All quantities are expressed in terms of total ounce
sold, instead of units sold. This is because a brand often contains different product lines at
different price points, and within them products of different weights. Figure 2 shows the brand-
level price per ounce and total ounce sold for each major deodorant brand, separated into men’s
3I also have a version of these graphs where price-per-ounce is further normalized by the CPI, available upon
request. Normalization by the CPI does not change these graphs much, since inflation in this decade is quite low
and stable.
7

and women’s markets.4 The price-per-ounce graphs show that there is a range of different price
points between brands. Low-end brands average about $0.70 per ounce, while high-end brands
can exceed $1.50 per ounce. While the nominal price-per-ounce for some brands are surprisingly
flat and stable throughout the decade, a few brands are observed to raise its price point in the
second half of the decade. Secret and Gillette (both under P&G) both start to raise in 2007, and
stabilize around 2009. Secret’s average price-per-ounce has increased by about $0.40 (a roughly
33% increase, from $1.20), and Gillette’s average has increased by about $0.50 (a roughly 50%
increase, from $0.95). Degree and Dove (both under Unilever) in the women’s market also have
a price increase of similar magnitude, starting earlier in the beginning of 2006. As a result, these
brands have risen from the middle of the pack in the beginning of the decade, to being the most
expensive mid-range brands by the end of the decade. I will dig into the details of these price
changes in the following section.
Not all quantities fall as a response to these price increases. Secret is still the number one
women’s brand and there is little change to its quantity sold from 2007 to 2009. The same
is true for Dove in the women’s market: from the beginning of 2006 to the end of 2008, its
average price increased by almost 50%, yet there is not much observable decrease in its total
ounce sold, and it remains the number two brand in the women’s market. (It is curious to note
that Dove’s quantity sold does start to fall in 2009, when its price has already stabilized at its
new high level.) The Gillette brand does show some decline in total ounce sold from 2007 to
2009. However, it raises again in 2010 and 2011 to 2007 levels. Lastly, for the Degree brand,
although it is difficult to compare its total ounce sold in 2008 vs. 2006-07 (because of its new
gender-specific products in 2008), we can focus on its dynamics in the two years, 2006 and 2007,
alone. Its average price-per-ounce has increased by about $0.20, and its total ounce sold has
also increased mildly.
4The Degree brand was unisex prior to 2008. Since it would be arbitrary guesswork if I were to separate its
products by gender, I have included all its products in both the men’s and women’s graphs in years 2001-2007.
This is the reason why, on the two “total ounce sold” graphs, the two lines for the Degree brand are identical prior
to 2008. In 2008, the brand changed marketing strategy and introduced gender-specific products and advertising.
This is the reason why these two lines for the Degree brand’s total ounce sold show an obvious drop from December
2007 to January 2008: because starting 2008, only women’s products appear in the women’s graphs, and only
men’s products appear in the men’s graphs. I assign the “Degree Men” product line to the men’s market and all
other Degree product lines to the women’s market.
8
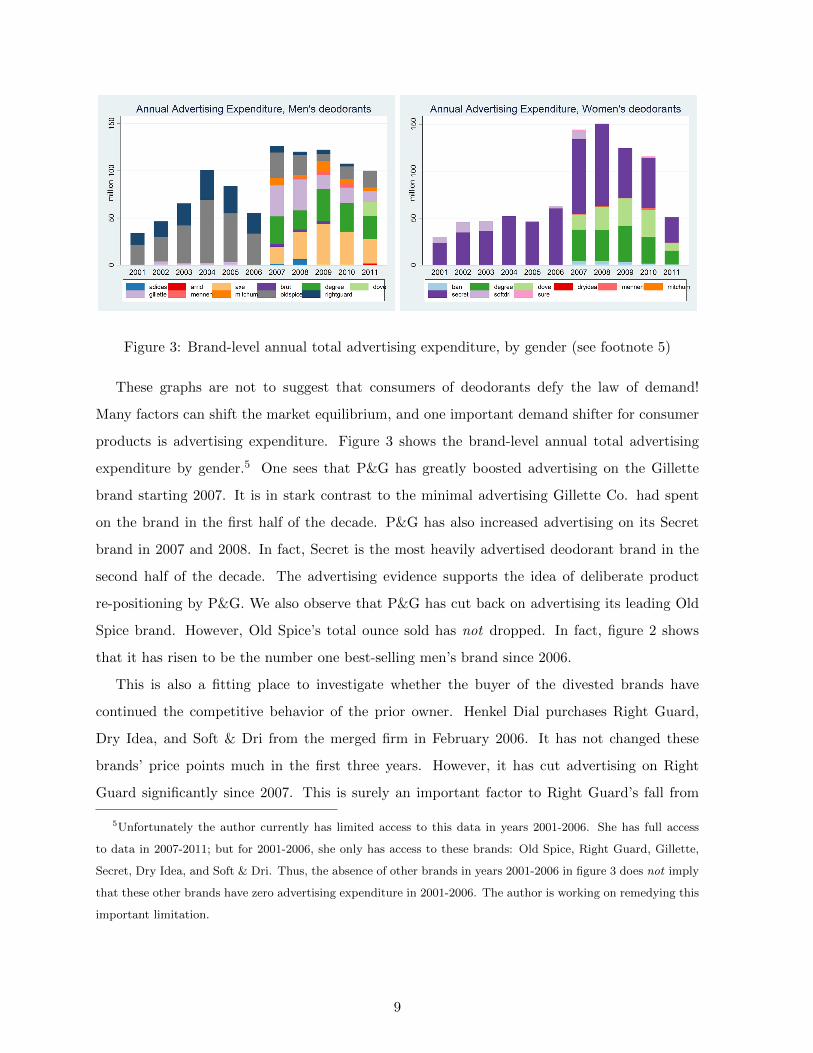
Figure 3: Brand-level annual total advertising expenditure, by gender (see footnote 5)
These graphs are not to suggest that consumers of deodorants defy the law of demand!
Many factors can shift the market equilibrium, and one important demand shifter for consumer
products is advertising expenditure. Figure 3 shows the brand-level annual total advertising
expenditure by gender.5 One sees that P&G has greatly boosted advertising on the Gillette
brand starting 2007. It is in stark contrast to the minimal advertising Gillette Co. had spent
on the brand in the first half of the decade. P&G has also increased advertising on its Secret
brand in 2007 and 2008. In fact, Secret is the most heavily advertised deodorant brand in the
second half of the decade. The advertising evidence supports the idea of deliberate product
re-positioning by P&G. We also observe that P&G has cut back on advertising its leading Old
Spice brand. However, Old Spice’s total ounce sold has not dropped. In fact, figure 2 shows
that it has risen to be the number one best-selling men’s brand since 2006.
This is also a fitting place to investigate whether the buyer of the divested brands have
continued the competitive behavior of the prior owner. Henkel Dial purchases Right Guard,
Dry Idea, and Soft & Dri from the merged firm in February 2006. It has not changed these
brands’ price points much in the first three years. However, it has cut advertising on Right
Guard significantly since 2007. This is surely an important factor to Right Guard’s fall from
5Unfortunately the author currently has limited access to this data in years 2001-2006. She has full access
to data in 2007-2011; but for 2001-2006, she only has access to these brands: Old Spice, Right Guard, Gillette,
Secret, Dry Idea, and Soft & Dri. Thus, the absence of other brands in years 2001-2006 in figure 3 does not imply
that these other brands have zero advertising expenditure in 2001-2006. The author is working on remedying this
important limitation.
9

the leading position in men’s brands starting 2006. Dry Idea and Soft & Dri are not advertised
much by Gillette Co., and this continues to be the case with Henkel Dial.
3.3 Products in detail
In this section, I detail the strategies each brand has used to raise its overall average price-per-
ounce. These strategies include product line overhaul and discontinuation of large sizes. Another
important industry trend emerging in 2007 is the introduction of clinical strength products. I
focus on the three brands that show the most unambiguous price re-positioning and their most
important product forms: Gillette (solid and gel); Secret (solid and gel); Dove (solid).6 Figures
4 to 6 show more disaggregated prices: each line is the average price-per-ounce for a product-line
and size combination. Thus, comparison between lines show two sources of variation in price-
per-ounce: different product lines (“classic” vs. “premium” lines), and different sizes (within
the same product line, larger sizes are usually cheaper per ounce, while small travel sizes are
the most expensive per ounce). Dashed parts of lines (as opposed to solid lines) indicate very
low sales, which usually occurs when a product is being discontinued. When sales are low, the
average prices are often found to be erratic, thus the dashed parts of the lines are best ignored.
Figure 4: Prices of Gillette by product line and size, solid and gel forms
Figure 4 shows the prices of Gillette by product line and sizes, in solid and gel forms.7 It
6Similar graphs for other brands, or other product forms, are available upon request. Total ounce sold for
these brands and product forms are also available upon request. These graphs are not included in this paper for
brevity.
7In all graphs in this section, not all existing product lines and sizes are show. The graphs would be overcrowded
10

clearly tells the story of product line overhaul. In early 2007, all “Gillette Series” products are
discontinued, to be replaced by more expensive “Gillette 3X” products. In early 2009, “Gillette
3X” is in turn discontinued and replaced by yet more expensive new product lines. These
comparisons are robust even after holding product size constant. One can consider the most
common size for solid form (2.6oz) and gel form (4oz). One should also note that the Gillette
brand introduced its clinical strength product (in solid form) in mid-2007, priced around $4.50
per ounce. It is the best-selling men’s clinical strength product (all in solid form), and accounts
for about one third of Gillette brand’s total ounce solid in solid form. Together, they explain
Gillette’s drastic increase in overall price-per-ounce in figure 2.
Figure 5: Prices of Secret by product line and size, solid and gel forms
Figure 5 shows the prices of Secret by product line and sizes, in solid and gel forms. It tells
a similar story of product line replacements, although the discontinuations and introductions
are less distinct. Among Secret’s solid products, new product lines are introduced in early 2008
and early 2009, and all these introductions are more expensive per ounce than existing product
lines. Cheaper product lines are discontinued in 2007 and 2009. Secret’s gel products again tell
a clear story of price increase through product overhaul. In addition, similar to Gillette, Secret
introduces its clinical strength product in early 2007, priced around $5.0 per ounce. It is first
women’s deodorant brand to introduce clinical strength products, and remains the best-selling
one in all following years.
Figure 6 shows the prices of Secret by product line and sizes, in solid form. Unlike Gillette,
if this were the case. Instead, the author has hand-picked the best-selling and, thus, most important product lines
and sizes in the dataset.
11
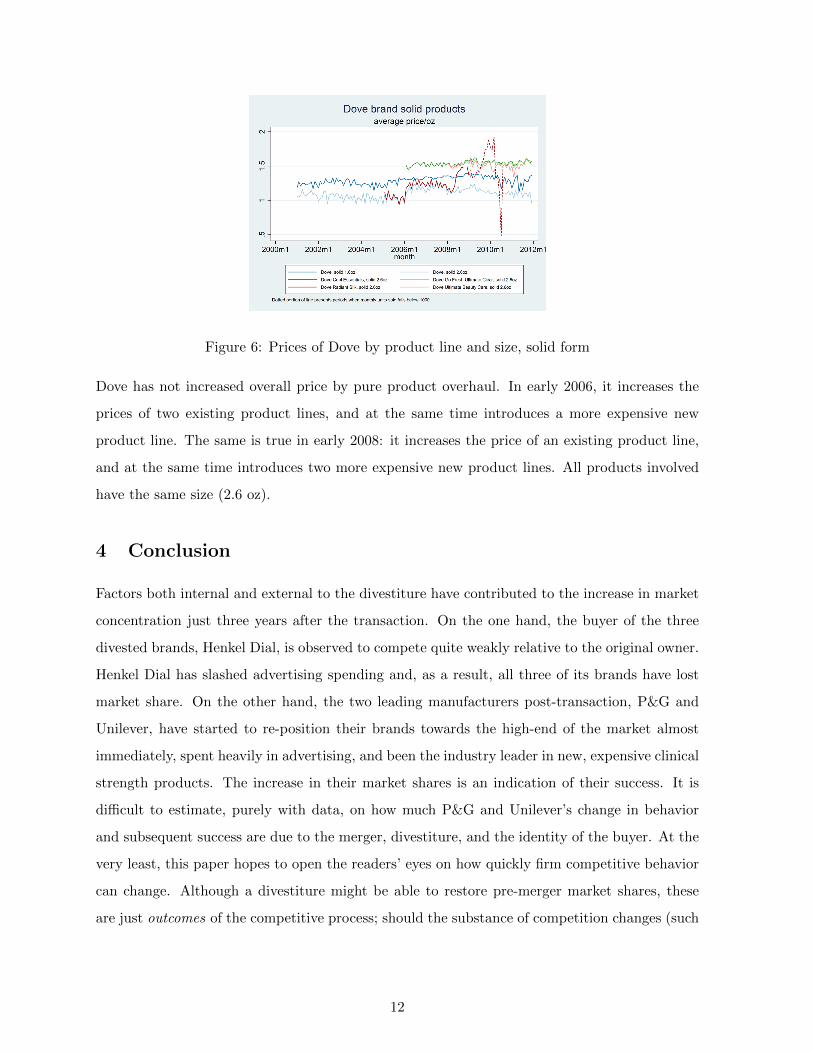
Figure 6: Prices of Dove by product line and size, solid form
Dove has not increased overall price by pure product overhaul. In early 2006, it increases the
prices of two existing product lines, and at the same time introduces a more expensive new
product line. The same is true in early 2008: it increases the price of an existing product line,
and at the same time introduces two more expensive new product lines. All products involved
have the same size (2.6 oz).
4 Conclusion
Factors both internal and external to the divestiture have contributed to the increase in market
concentration just three years after the transaction. On the one hand, the buyer of the three
divested brands, Henkel Dial, is observed to compete quite weakly relative to the original owner.
Henkel Dial has slashed advertising spending and, as a result, all three of its brands have lost
market share. On the other hand, the two leading manufacturers post-transaction, P&G and
Unilever, have started to re-position their brands towards the high-end of the market almost
immediately, spent heavily in advertising, and been the industry leader in new, expensive clinical
strength products. The increase in their market shares is an indication of their success. It is
difficult to estimate, purely with data, on how much P&G and Unilever’s change in behavior
and subsequent success are due to the merger, divestiture, and the identity of the buyer. At the
very least, this paper hopes to open the readers’ eyes on how quickly firm competitive behavior
can change. Although a divestiture might be able to restore pre-merger market shares, these
are just outcomes of the competitive process; should the substance of competition changes (such
12

as prices, product characteristics, and advertising behavior), the outcomes of competition will
surely change as well. In this case, competition between the two new industry leaders have
intensified, partially due to the divestiture.
References
Breen, D. A. (2004): “The Union Pacific/Southern Pacific Rail Merger: A Retrospective onMerger Benefits,” Review of Network Economics, 3(3).
Bronnenberg, B. J., M. W. Kruger, and C. F. Mela (2008): “Database Paper—The IRIMarketing Data Set,” Marketing Science, 27(4), 745–748.
Farrell, J., P. A. Pautler, and M. G. Vita (2009): “Economics at the FTC: RetrospectiveMerger Analysis with a Focus on Hospitals,” Review of Industrial Organization, 35(4), 369–385.
Friberg, R., and A. Romahn (2015): “Divestiture Requirements as a Tool for CompetitionPolicy: A Case from the Swedish Beer Market,” International Journal of Industrial Organi-zation, 42, 1–18.
Nain, A., and Y. Qian (2016): “The Role of Divestitures in Horizontal Mergers: Evidencefrom Product and Stock Markets,” Working Paper.
Peters, C. (2006): “Evaluating the Performance of Merger Simulation: Evidence from the USAirline Industry,” Journal of Law and Economics, 49(2), 627.
Soetevent, A. R., M. A. Haan, and P. Heijnen (2014): “Do Auctions and Forced Divesti-tures Increase Competition? Evidence for Retail Gasoline Markets,” The Journal of IndustrialEconomics, 62(3), 467–502.
Tenn, S., and J. M. Yun (2011): “The Success of Divestitures in Merger Enforcement: Ev-idence from the J&J–Pfizer Transaction,” International Journal of Industrial Organization,29(2), 273–282.
13
Recommended