
7015 2018
April 2018
Diversification Power of Real Estate Market Securities: The Role of Financial Crisis and Dividend Policy Metin Ilbasmis, Marc Gronwald, Yuan Zhao

Impressum:
CESifo Working Papers ISSN 2364‐1428 (electronic version) Publisher and distributor: Munich Society for the Promotion of Economic Research ‐ CESifo GmbH The international platform of Ludwigs‐Maximilians University’s Center for Economic Studies and the ifo Institute Poschingerstr. 5, 81679 Munich, Germany Telephone +49 (0)89 2180‐2740, Telefax +49 (0)89 2180‐17845, email [email protected] Editors: Clemens Fuest, Oliver Falck, Jasmin Gröschl www.cesifo‐group.org/wp An electronic version of the paper may be downloaded ∙ from the SSRN website: www.SSRN.com ∙ from the RePEc website: www.RePEc.org ∙ from the CESifo website: www.CESifo‐group.org/wp

CESifo Working Paper No. 7015 Category 7: Monetary Policy and International Finance
Diversification Power of Real Estate Market Securities: The Role of Financial Crisis and
Dividend Policy
Abstract This paper investigates dynamic conditional correlations between stock and REIT markets in both Turkey and the U.S. We use an Asymmetric DCC - GJR - GARCH model to estimate the dynamic conditional correlation at daily, weekly, and monthly frequencies. Our contribution is threefold. First, we find a that downward trend in the daily conditional correlation in the Turkish market, which is contrary to the literature, while the upward trend in the correlation of the two U.S. markets is consistent with the literature. Second, we observe that the trend in the correlation changes the direction with the 2008 Global Financial Crisis. The negative trend in Turkish market becomes positive and the positive trend in the U.S. market becomes negative after the crisis, which could indicate a structural break in the REIT market caused by the crisis. Third, we find that the dividend policy of REITs plays an important role on the dynamics of the correlation. Dividend payments by Turkish REITs decrease their conditional correlation with the Turkish stock market while no such relationship is detected in the U.S. We argue that both the relationship between dividend payments by REITs and REIT correlation with the stock index is associated with the different regulatory environment of REITs in Turkey.
JEL-Codes: C510, C580.
Keywords: REITs, equity, correlations, DCC-GARCH, deterministic trend, dividend policy.
Metin Ilbasmis* University of Aberdeen Business School Edward Wright Building, Bunbar Street United Kingdom – Aberdeen AB24 3QY
Marc Gronwald University of Aberdeen Business School Edward Wright Building, Bunbar Street United Kingdom – Aberdeen AB24 3QY
Yuan Zaho University of Aberdeen Business School Edward Wright Building, Bunbar Street United Kingdom – Aberdeen AB24 3QY
*corresponding author This Version: Friday 20th April, 2018

1 Introduction
The ultimate purpose of portfolio allocation is to acquire some level of diversification, which is
achieved by combining asses classes that have low or negative correlations. For instance, while
stock market index investors constantly search for asset classes that could further diversify their
portfolios, individual firms or industries implement policies that would lower their correlations
with the stock market index so they would become more attractive to these investors. This study
investigates whether the dividend payout policy affects the time-varying correlations between Real
Estate Investment Trusts (REITs) and stock market indices.
It is well known that REIT market is a major investment class that provides diversification
benefits to both equity and fixed income investors, and its relationship with risky income securi-
ties has been widely investigated in the literature.1 Using a unique dataset provided by Turkey
where REITs are not imposed a minimum dividend payout ratio and enjoy generous tax benefits,
and comparing this unique dataset with a well-developed REIT market from the U.S. where REITs
need to distribute at least 90% of their taxable income, we investigate: (i) the time varying evolu-
tion of conditional correlation between stock and REIT markets, (ii) trend and asymmetry in these
conditional correlations, and (iii) the effects of dividend payout ratios of REITs on their dynamic
conditional correlations with the stock market index. Specifically, we first estimate the dynamic
correlation between stock market and REIT indices. The time-varying nature of the correlation
between the two indices is investigated through the Asymmetric Dynamic Conditional Correlation
(ADCC) model developed by Cappiello et al. (2006) using recent data in three different data fre-
quencies; daily, weekly and monthly. After estimating dynamic correlations, we explore whether
the correlation process has a deterministic time trend and whether the dividend policy of REITs is
related to the time-varying correlation. In order to do this, we adapt the long-run trend regression
approach found in the literature by modifying it by including the dividend payout ratios of REITs.1E.g., Case et al. (2012b), Clayton and MacKinnon (2001), Cotter and Stevenson (2006), Yang et al. (2012).
2

We present the empirical results of the data from Turkey and the U.S. side by side for compari-
son. Employing data from these two countries provides several advantages. If firms can affect their
dynamic correlation with the stock market index, then we should observe a significant relationship
between dividend payments by REITs and their correlation with the stock market in Turkey where
REITs are free to determine their dividend payout ratio. However, since U.S. REITs are required to
distribute at least 90% of their earnings and there is not much uncertainty on the dividend payments
by U.S. REITs, such a significant relationship between REIT and stock market indices should not
be present in the U.S. Further, the data on Turkish REITs with their unusual regulatory structure
allows us to test whether the dynamic of the correlation behaves in a different way under these
unique regulations. The U.S. REIT market is accepted as a benchmark in the literature, and hence
using the U.S. REIT data introduce additional robustness in our empirical results and provides a
benchmark to compare the results from the Turkish data.
One of the overall results of this paper is that the direction of the time-varying correlations
between the stock and REIT market indices is independent of data frequency although it is depen-
dent on the sample period. Furthermore, the direction of the correlation between the two indices in
Turkey is different from both what the literature suggests and what we find in the U.S. markets.
Our empirical results from the regression analysis confirm the literature’s finding of a positive
trend in the conditional correlation between the U.S. real estate market and the U.S. stock market;
however, contrary to the literature findings, we find a downward trend in the conditional correlation
between these two major markets in Turkey. The sub-period analysis reveals additional insights.
In short, we find that the time-varying correlation between the Turkish markets has a significant
downward trend before the 2008 global financial crisis and this trend changes its sign to become a
significantly positive trend after the crisis. On the other hand, the direction of the time-varying cor-
relation between the two U.S. indices is significantly positive both before and during the financial
crisis; however, the trend becomes negative after the crisis. The change in the sign of the trend in
3

the correlations of the two indices in both countries with the 2008 global financial crisis indicates
that the crisis may have caused a structural break in the correlation.
Having assessed the trend in the conditional correlations, we now turn to the dividend policy
issue. To our knowledge, this study is the first attempt to examine and document the effect of
REIT dividend policy on the correlation of REIT market with overall stock market index. We
document the negative effects of dividend payments by REITs on their correlation with the general
stock market index. Our results show that as Turkish REITs choose to pay more dividends, the
conditional correlation between the two markets gets smaller. The same does not happen in U.S.
REITs since they do not have the ability to decrease their dividends because of the 90% minimum
dividend payout ratio requirement.
The evolution of the time-varying correlation between the two asset classes in different data
frequencies have important implications for asset allocation and risk management purposes. In-
vestors can take advantage and incorporate information on the time-dependent relationships into
their portfolio allocation choices at a convenient rebalancing frequency. Further, knowing whether
the dynamic correlation behaves differently at a different frequency of data may lead investors to
a different decision in portfolio allocation. Moreover, this information is relevant to market reg-
ulators. A clear understanding of the dynamic relationship between stock market and REITs at
different data frequencies is central for regulating and establishing a robust investment apparatus,
which consistently represents its underlying industry at all data frequencies.
Studies assessing an increasing or a decreasing trend in the correlation between the two markets
fail to provide a definite answer. The literature findings on the direction of the correlation between
these two markets are mixed and sensitive to multiple factors such as the frequency of data col-
lection, research methodology, and most importantly the time period of the sample. The mixed
results in the literature could be related to a possible structural break the relationship between the
two markets has undergone, in which case the direction of the correlation would change.
4

The studies whose sample periods are similar to ours mostly find that the dynamic conditional
correlation between stock and real estate markets has an upward trend regardless of their sample
data frequencies. However, the majority of these studies mentioning a trend do not test its statistical
significance. To cover this research gap, this paper tests the statistical significance of a possible
trend in the correlation process and compares the direction of the trend in the Turkish markets
with that in the U.S. markets. In addition, the whole sample period is divided into three sub-
periods taking the recent global financial crisis as a starting point and the direction of the correlation
between the stock market and REIT index is examined in these sub-periods.
The remainder of this paper is organised as follows. Section 2 explains the hypothesised re-
lationship of REIT dividend policy with the correlation in more detail; Section 3 provides the
literature review. Section 4 describes the data and the methodology. Section 5 presents the re-
sults, and finally, Section 6 gives overall remarks and conclusion. Some additional ideas for further
research are also provided in this section.
2 Motivation
To qualify as a REIT, most countries require a firm to generate a large portion of its income through
real estate market activities and to distribute most of that income, typically 90-95%, for the cur-
rent year, which makes REITs an investment asset providing a steady and secure income with the
exposure of real estate market risk.
Having complete flexibility in dividend distribution choices and yet maintaining their non-
taxable corporate entity status differentiates Turkish REITs from their counterparts in the rest of
the world. No minimum dividend payout policy may affect Turkish REIT market’s time-varying
correlation with stock market. We provide several possible explanations to this phenomenon. The
first possibility is as follows. Similar to general stocks, REITs in Turkey have the flexibility to
choose their internal source of financing, before seeking more costly alternatives. Thus, they are
5

likely to behave in a manner consistent with the pecking order theory of Myers and Majluf (1984),
through which ceteris paribus, would probably increase their overall time-varying correlation with
stock market since general stocks also would make financing decisions in a similar way.2
The second possible explanation argues that fluctuations in stock returns partly come from
the anticipation of discounted future cash flows. Dividends are the realisation of expected future
cash flows. Increased and early dividend payments indicate less future cash flow uncertainty for
shareholders. REITs that pay more dividends earlier are able to decrease information asymmetry
and mitigate uncertainties about future cash flows. However, REITs that pay no dividends introduce
more uncertainty about their future cash flows, all else being equal. Thus, compared to dividend
paying stocks, the present value of non-dividend paying stocks would be relatively impacted more
by random shocks to the market such as interest rate changes, as implied by the dividend discount
model. As a consequence, return fluctuations of dividend paying and non-paying stocks, and in
turn their correlations with the stock market, would be different.
The third possibility asserts that non-dividend paying stocks, despite having more uncertainty
about future dividends and being more vulnerable to market shocks according to dividend discount
model, are expected to have more cash, ceteris paribus, than stocks that make regular dividend
payments. According to the Going Concern theory, these REITs that do not pay dividends decrease
investor’s going-concern risk.3 Non-dividend paying stocks have more internal resources available
and when there is a liquidity crisis in the market, these stocks can take advantage of their non-
distributed dividends, which could play a crucial role in their survival. At the time of a liquidity
crisis, the stocks that have paid high dividends may be prone to higher risk premium since they are
comparatively short of cash. This approach postulates that the lower the dividend payout ratio in
REIT market, the lower its correlation with the stock market. The idea is that having excess cash2Pecking order theory postulates that the cost of financing increases with asymmetric information. When companies
need new capital, they prefer sources from internal funds, new debt, and issuing new equity, respectively.3 The Going Concern principle assumes an entity’s survival for the foreseeable future. To put it differently, an entity
will not be forced to stop its operations and go into liquidation at fire-sale prices in the short run.
6

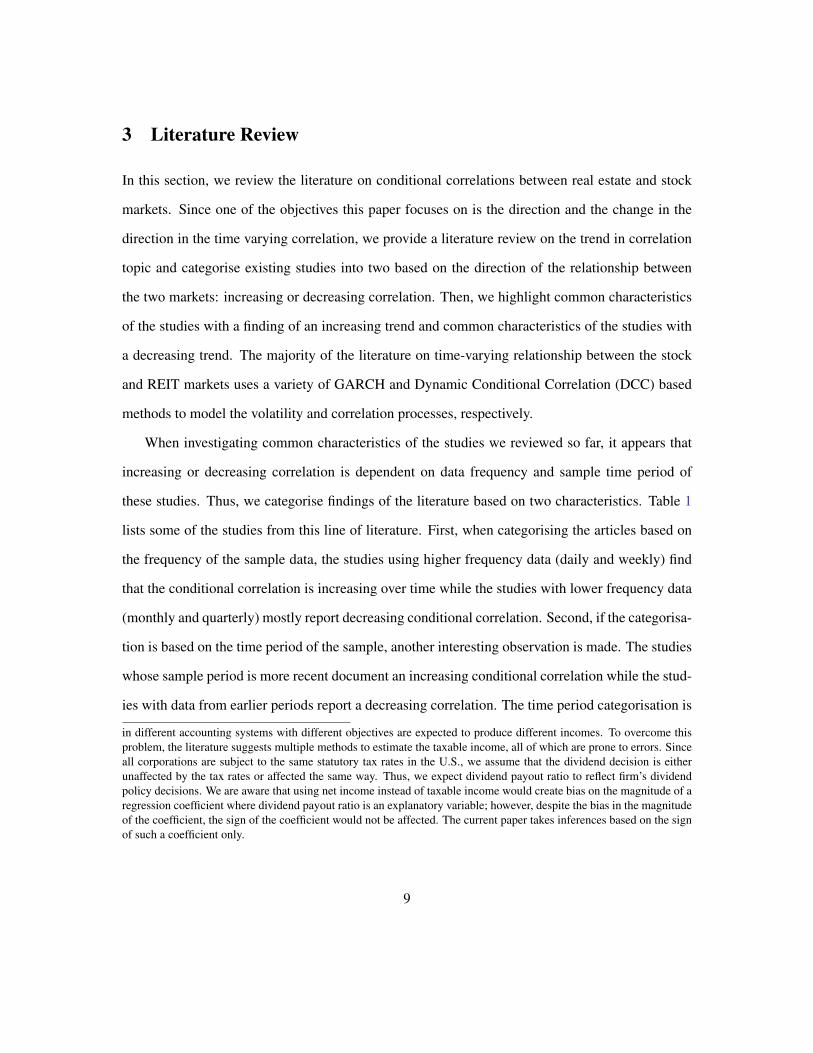
can help Turkish REITs protect themselves from negative market shocks better than U.S. REITs.
This behavioural prediction on REIT dividend policy is confirmed in Figure 1 which illustrates
the dividend payout changes of REITs in Turkey and REITs in the U.S. as a reaction to the 2008
global financial crisis.
0
0.12
0.24
0.36
0.48
0.6
Divide
nd Pa
yout
Ratio
Dec−01Jun−02
Dec−02Jun−03
Dec−03Jun−04
Dec−04Jun−05
Dec−05Jun−06
Dec−06Jun−07
Dec−07Jun−08
Dec−08Jun−09
Dec−09Jun−10
Dec−10Jun−11
Dec−11Jun−12
Dec−12Jun−13
Dec−13Jun−14
Dec−14Jun−15
Dec−15Jun−16
Dec−16
Turkish REITs' Dividend Payout Index U.S. REITs' Dividend Payout Index
Figure 1: Weighted Average of Dividend Payout Ratio of REITs
This figure presents REITs market’s weighted average dividend payout ratios in Turkey and in the U.S. The vertical
dashed lines mark December 2007 and June 2009, which represent the beginning and the end of the 2008 global financial
crisis, respectively, according to the National Bureau of Economic Research.
The figure displays that the average dividend payout per share for REITs in Turkey had been
lower than that for REITs in the U.S. prior to the financial crisis started in December 2007, which
indicates REITs in Turkey practised their flexibility in choosing dividend payout ratio. Since U.S.
REITs are imposed a high dividend payout ratio, when the crisis hit the markets, U.S. REITs
decreased their dividend distribution from over 20% before the financial crisis to around 5% after
the financial crisis, most likely as a result or in anticipation of losses in their income. However, the
7

Turkish REITs, on average, were able to increase the dividend payout per share from 10% before
the financial crisis to almost 60% after the financial crisis, thanks to the retained earnings they did
not distribute prior to the crisis.
Our argument regarding dividend distribution and correlation is as follows. When a firm is able
to deviate from market’s expectations regarding dividend distribution levels, either by increasing
or decreasing its dividends, its correlation with stock market is expected to decrease, given that
the deviation from expectations is sufficiently large. Having opposite structures in terms of their
regulations on REITs, Turkey and the U.S. provide a unique set of data to test this hypothesis.
We believe that it is important to document the time-varying evolution of the correlation between
REITs and stock market, and investigate its relationship with dividend policy because of Turkey’s
unique regulatory environment on REITs.
In the light of the theory and Turkish REITs’ dividend distribution behaviour given in the figure,
we argue that dividend payout policy of Turkish REITs is negatively related to the correlation of
these REITs with the Turkish stock market index. Accordingly, as a consequence of differential
regulations on the dividend payout ratio in Turkey and the U.S., we hypothesise a significantly
negative relationship between the dividend policy of REITs and their correlation with the stock
market in Turkey. However, we do not expect a significant relationship in the U.S. since their
ability to deviate substantially from market’s expectations is limited due to the underlying 90%
minimum dividend payout ratio requirement.4
4Dividend Payout Ratio data is collected from DataStream (Mnemonic: WC09504) and is described as dividend pershare divided by earnings per share. The mean payout ratio is 21% and 16% at index level, and 11% and 73% at firmlevel in Turkey and in the U.S., respectively. The reader should note that the requirement of 90% minimum dividendpayout ratio for U.S. REITs is applied to the taxable income which is an undisclosed item. Financial statements are oftenused to estimate taxable income by increasing net income to its pre-tax value using the statutory tax rate. For example,if a firm has a net income of $6.5 million and the statutory tax rate is 35% the taxable income would be estimated at $10million ($6.5/0.65). This example assumes that the firm paid $3.5 million as current tax; however, how much tax thisfirm actually paid is impossible to estimate. Several reasons are suggested for why taxable income cannot be estimatedusing financial statements. Ample evidence in the literature suggests that reported earnings in financial statementscan be manipulated upwards or downwards as needed. In addition, financial statements are prepared under financialobjectives, whereas the tax reported to the Internal Revenue Service is calculated under tax accounting systems. Thus,a firm’s reported tax and the actual tax paid to the authorities can be different. Not surprisingly, different sets of rules
8
3 Literature Review
In this section, we review the literature on conditional correlations between real estate and stock
markets. Since one of the objectives this paper focuses on is the direction and the change in the
direction in the time varying correlation, we provide a literature review on the trend in correlation
topic and categorise existing studies into two based on the direction of the relationship between
the two markets: increasing or decreasing correlation. Then, we highlight common characteristics
of the studies with a finding of an increasing trend and common characteristics of the studies with
a decreasing trend. The majority of the literature on time-varying relationship between the stock
and REIT markets uses a variety of GARCH and Dynamic Conditional Correlation (DCC) based
methods to model the volatility and correlation processes, respectively.
When investigating common characteristics of the studies we reviewed so far, it appears that
increasing or decreasing correlation is dependent on data frequency and sample time period of
these studies. Thus, we categorise findings of the literature based on two characteristics. Table 1
lists some of the studies from this line of literature. First, when categorising the articles based on
the frequency of the sample data, the studies using higher frequency data (daily and weekly) find
that the conditional correlation is increasing over time while the studies with lower frequency data
(monthly and quarterly) mostly report decreasing conditional correlation. Second, if the categorisa-
tion is based on the time period of the sample, another interesting observation is made. The studies
whose sample period is more recent document an increasing conditional correlation while the stud-
ies with data from earlier periods report a decreasing correlation. The time period categorisation is
in different accounting systems with different objectives are expected to produce different incomes. To overcome thisproblem, the literature suggests multiple methods to estimate the taxable income, all of which are prone to errors. Sinceall corporations are subject to the same statutory tax rates in the U.S., we assume that the dividend decision is eitherunaffected by the tax rates or affected the same way. Thus, we expect dividend payout ratio to reflect firm’s dividendpolicy decisions. We are aware that using net income instead of taxable income would create bias on the magnitude of aregression coefficient where dividend payout ratio is an explanatory variable; however, despite the bias in the magnitudeof the coefficient, the sign of the coefficient would not be affected. The current paper takes inferences based on the signof such a coefficient only.
9

consistent with literature documenting structural breaks in the early 1990s.5
Table 1: Literature Findings & CategorisationThis table lists the studies on the time-varying correlation between stock and real estate markets and reports the direction
of the correlation. Frequency reports the data frequency of the sample and Time Period is the years the sample covers.
Methodology gives the main method used to estimate the correlation.Direction of Correlations Frequency Time Period Methodology
Chong et al. (2009) Upwards Daily 1990 to 2005 DCC - GARCHChong et al. (2012) Upwards Daily 1990 to 2008 DCC - GARCHCotter and Stevenson (2006) Upwards Daily 1999 to 2003 BEKK - GARCH - VARNiskanen and Falkenbach (2010) Upwards Daily 2006 to 2009 50-day Rolling Corr & VolYang et al. (2012) Upwards Daily 1999 to 2008 AG-DCC-GJR-GARCH-VARHuang and Zhong (2013) Upwards Daily 1999 to 2010 DCC & 100-Day Rolling CorrLiow (2012) Upwards Weekly 1995 to 2009 ADCC - GJR - GARCHHuang and Zhong (2013) Upwards Monthly 1970 to 2010 DCC & 100-Day Rolling CorrCase et al. (2012b) Downwards Monthly 1991 to 2001 DCC - GARCH - VARCase et al. (2012b) Upwards Monthly 2001 to 2008 DCC - GARCH - VARFei et al. (2010) Downwards Monthly 1988 to 2001 AG-DCC - GJR - GARCHFei et al. (2010) Upwards Monthly 2001 to 2008 AG-DCC - GJR - GARCHBley and Olson (2005) Downwards Monthly 1993 to 2001 24-month Rolling CorrConover et al. (2002) Not Reported Monthly 1986 to 1995 12-month Rolling CorrLiang and McIntosh (1998) Downwards Monthly 1989 to 1997 5-year Trailing Rolling CorrChandrashekaran (1999) Upwards Monthly 175 to 1979 ARDL CointegrationChandrashekaran (1999) Downwards Monthly 1980 to 1996 ARDL CointegrationClayton and MacKinnon (2001) Downwards Quarterly 1979 to 1998 Factor Sensitivity - Regr.
REITs were first included in S&P Indexes in October 2001 (NAREIT, 2017). Case et al.
(2012b) consider this date as the end of Modern REIT Era and document an upward trend in the
correlation between REIT and stock markets with the inclusion of REITs in S&P Indexes.6 Further,
Table 1 indicates that the sensitivity of literature findings to time period is more dominant. When
the two categorisation constraints contradict, the direction of trend is dominated by time period
category. For instance, among the studies given in the table, those using monthly frequency data
report increasing correlation only when their sample period covers data mostly after 2001 and de-
creasing correlation before 2001. Two representative examples from the table to show that the time
period are more influential on the trend in correlation than data frequency is Case et al. (2012b) and
Fei et al. (2010). They both use monthly data and they divide their full sample into sub-samples.5Glascock et al. (2000) examine the integration of REITs and stock returns using co-integration and vector autore-
gressive models taking the long-run economic effects into account. They confirm Clayton and MacKinnon (2001)’sfinding of structural changes in the correlation in the early 1990s, and they conclude that benefit of diversification fromincluding REITs in a general portfolio may be diminished after these breaks.
6The data period of the current paper starts at the end of 2001, thus we don’t test for any structural break.
10

In their sub-sample covering late 1980s and 1990s, they find a decreasing correlation, but for the
sub-sample from 2001 to 2008, both find an increasing correlation.
Although the literature findings on the correlations between real estate and stock markets are
not robust and sensitive to the frequency and the time period of the study sample, the literature
fails to provide an insight into this differentiation. Whether the direction of the correlation between
the two markets changes with data frequency is an untested question. The current study aims to
fill this gap in the literature. Additionally, the papers listed in the table mention that they have
found increasing or decreasing correlation or a trend in the correlation; however, the majority of
them do not formally test for a time trend in the correlation process, except for Chong et al. (2009)
and Yang et al. (2012) who regress the estimated correlation on a time trend after controlling for
appropriate number of lags and several control variables. In keeping with the literature, we regress
our estimated time-varying correlations on a time trend variable. In order to test for the relationship
between the dividend policy and the dynamic correlation, we modify this time trend regression
model by additionally including a dividend payout ratio variable. Our motivation to include the
dividend payout ratio into the regression is to capture the effect REIT dividends on the conditional
correlation between REITs and stock market and thus on the diversification potential of REITs.
An important issue this paper focuses on is the effect of a REIT’s dividend policy on its cor-
relation with the stock market. To our knowledge, the current paper is the first to look at how and
why a firm’s correlation with stock market may change with its dividend distribution policy.7 To
shed light on this question, we summarise leading theories from dividend literature on why firms
pay dividend. We are specifically interested in a REIT’s dividend motivations.
The corporate finance literature on dividends identifies several factors explaining the dividend
payments of REITs.8 Agency costs, principle-agent problem, dividend signalling, and clienteles7In the case of U.S. REITs, not all dividends distributed come from the dividend decision made by the firm. U.S.
REITs must distribute at least 90% of their taxable income to keep their REIT status.8See Case et al. (2012a) and Denis and Osobov (2008) for more details.
11
are the traditional explanations for dividend payments. Agency cost theories argue that dividend
decisions of firms is dependent on the agency cost faced by these firms. Managers of dividend
paying firms are limited in their ability to misuse the excess cash flow of the firm. By paying
dividends, these firms are forced to raise new capital through capital markets, which corresponds to
an increase in monitoring of firms and managers. Jensen (1986)’s principle-agent problem proposes
that dividend reductions give managers extra room for wasting resources, and investors may react
to these reductions negatively. In order to mitigate the agency problem, firms can pay the excess
cash flow to investors in the forms of dividends.
Dividend signalling or information asymmetry theory (See Bhattacharya (1979), Miller and
Rock (1985) for more details) suggests that dividend payments are manager’s desire to commu-
nicate private information to shareholders, or to respond to the preference of dividend clienteles.
More recent literature brings new insights to this decision. Baker and Wurgler (2004) argue that
the time-varying demand of investors for dividend-paying stocks leads managers to rationally cater
investor demand. The model predicts that investors put a premium on the price of dividend payers
to increase the propensity to pay dividends when investors are demanding dividends. An alterna-
tive explanation about dividend decision comes from DeAngelo et al. (2006)’s life-cycle theory.
According to this theory, the optimal level of dividend payment is determined by a firm’s oppor-
tunity set. Firms in their early life-cycle pay less dividend because all internally generated cash
is demanded by firm’s opportunity set. Mature firms, on the other hand, may have fewer invest-
ment opportunities but are more profitable so they generate excess internal funds, which are paid
as dividends to prevent its waste.
Numerous empirical studies report evidence on these theories, including those that compliment
or disapproving them. The current paper does not seek to offer another explanation for the motiva-
tion of the dividend decision. Regardless of the motivation or cause, when a firm makes a dividend
decision, whether it is a dividend increase or a decrease, or whether the dividend theory predict a
12

positive or negative market reaction to the change in the dividend payment, this paper argues that
the change in the dividend payment of a firm would negatively affect its correlation with the stock
market, given the change is sufficiently large.
4 Data and Methodology
We use daily, weekly, and monthly data on returns of REITs and stock market indices of Turkey
and the U.S. Appendix A gives the descriptive statistics of the data. We acknowledge that both
high and low frequency data could have some shortcomings. On the one hand, one can argue that
daily data is noisier and the positive trend found in the correlation literature could be attributed
to the noise in daily data. On the other hand, it is quite common in the literature to assume that
index volatility measures have an additive measurement error, which is highlighted more in lower
frequency data. In such a case, the additive measurement error in the estimates would get larger
which in turn would increase the correlation in lower data frequency.9
However, to our knowledge, no theory suggests a differential direction in the correlations based
on data frequency. Therefore, this paper makes use of data in multiple frequencies. Although we
make no prediction in term of a differential trend based on data frequency, we focus on daily data.
As technology permits speedy information transmission between market participants and between
asset classes, daily frequency may be more appropriate than other less frequent data in capturing
high-frequency dynamic linkages between the two markets.
While rolling regression, co-integration tests, factor sensitivity, and pattern examination are
some of the models used to estimate the dynamic correlation, the majority of the recent studies use
various versions of DCC model developed by Engle and Sheppard (2001) and Engle (2002), since
the DCC model outperforms the other methods while being a parsimonious model.9In the presence of a measurement error, coefficient estimates in GARCH and DCC processes will be biased and the
degree of bias is a direct function of the measurement error in variance.
13

The Dynamic Conditional Correlation (DCC) model is a popular approach used to assess the
relationship between different markets or asset classes (Cappiello et al., 2006, Chong et al., 2009,
Yang et al., 2012). To address our research questions on the dynamic correlation, this paper adopts
an Asymmetric DCC (ADCC) framework of Cappiello et al. (2006), which is an extension of the
DCC model to allow for asymmetries in conditional correlation dynamics.
The time varying conditional correlations of the two markets is estimated from the ADCC
model, where the conditional standard deviation (variance) for each market is estimated from a
GARCH framework, which also allows for asymmetric effects. The model used in the current
paper allows for the incremental effects of negative news on both the time-varying volatility and
dynamic correlation processes.
Further, when investigate a trend in the conditional correlation between the stock and REIT
index returns, we use a linear deterministic trend model. All empirical models of this paper are ran
using data from both Turkey and the U.S. in daily, weekly, and monthly data frequencies. In order
to be able to compare the results from both countries, our empirical findings are produced for the
two countries separately.
The Asymmetric Dynamic Conditional Correlation (ADCC) Model
This paper considers the asymmetric impact in both the volatility and the correlation processes and
employs an ADCC-GJR-GARCH model which can be estimated with a two-stage procedure based
on a likelihood function.
In the first stage, we follow Glosten et al. (1993) approach and utilise a univariate GJR(1)-
GARCH(1,1) model to capture the asymmetry in the volatility and estimate the conditional variance
for real estate and stock market respectively. Case et al. (2012b) propose that using a DCC model
for large and time-varying covariance matrices of multiple assets can produce a dynamic path of
correlation behaviour while preserving consistency.
14
The ARMA(p,q)-GJR(1)-GARHC(1,1) model is defined as follows:
ri,t = δi,0 +
p∑k=1
δi,1ri,t−k +
q∑l=0
εi,t−l, εi,t ∼ N(0, hi,t) (1)
εi,t =√hi,tηi,t (2)
hi,t = ωi + αiε2i,t−1 + γiIi,t−1ε
2i,t−1 + βihi,t−1 (3)
In Equations 1, p and q are determined based on the Bayesian information criterion (BIC).
Residuals are then used in the following univariate GARCH process.
Equation 3 defines volatility process. hi,t is the conditional variance of the disturbances, εi,t
is the innovation of asset i at time t, and rt = log(indexi,t) − log(indexi,t−1) are the excess
return rates.10 i is the stock market index or REITs index. The parameter γi in Equation 3 captures
the asymmetric effect of negative shocks. Ii,t−1 is an indicator function that takes value of 1
when residuals are negative and is 0 otherwise. To ensure a non-negative volatility process from
GARCH(1,1) model, coefficients are restricted with non-negativity; the intercept, the coefficient of
past shocks α and that of past conditional variance β. Also, αi + βi < 1 ensures that the process
is stationary.
In the second stage, the conditional variance estimated from the first step is used in Equation 4
to obtain the dynamic correlation between the two markets using ADCC(1,1).
qij,t = (1− a− g − b)ρij + aηi,t−1ηi,t−1 + gIij,t−1ηi,t−1ηi,t−1 + bqij,t−1 (4)
ηi,t = εi,tD−1i,t =
εi,t√hi,t
(5)
where qij,t is conditional-covariance, ρij is unconditional correlation between residuals of market
i and j, and standardised disturbances, ηi,t, are derived from the first step estimation of conditional
10In this paper, return and excess return terms are used interchangeably.
15
volatility.
The estimates a and b are parameters representing the effect of past shocks and past conditional
covariance on current covariance, and g is the asymmetric effect parameter and represents the
impact of negative news on conditional correlations. The reverting process implies a + b < 1 and
the non-negativity of coefficients a and b. The persistence of the correlation gets stronger as the
sum of the two coefficients gets closer to unity.
The conditional correlations are obtained using the conditional variances from the first stage
via the GJR-GARCH model run for each time series separately and conditional covariance from
the second stage via the ADCC model run for all-time series at once: ρij,t =qij,t√
hi,t√
hj,t, where
ρik,t represents conditional correlations. Finally, the ADCC-GARCH model is estimated from a
two-step maximum likelihood estimation method by Engle (2002).
Time Series Analysis
After estimating the conditional correlation process, in the second part of this chapter, we exercise
a time series analysis. Using the estimated dynamic correlation between real estate and stock
markets, we investigate whether the index level time trend exists in the dynamic correlation, and
the relationship between the time varying correlation and REIT dividend policy after controlling
for real estate industry size and foreign direct investment (FDI).11 Using a commonly used long run
trend model, we test for a deterministic time trend in and the effect of dividends on the conditional
correlation while controlling for several industry and market variables:11Market size captures industry specific effects on the correlation. FDI is included in the regression because Turkish
economy heavily depends on foreign investment (around 60%).
16

CORRt = α+ λ1Trendt + λ2Div.Payout+ λ3MktCapt + λ4FDI + β CORR,t−1 + εi,t
(6)
CORRt = ω + θ1Trendt + θ2Div.Payout+ θ3MktCapt + θ4FDI + ξi,t (7)
where CORR refers to the conditional correlation between the two market indices estimated from
the Asymmetric DCC-GARCH framework. Trend is a linear time trend variable, Div.Payout
is the weighted average of dividend payout ratio of each REIT. Weights are calculated on a daily
basis using market capitalisation of REITs. FDI is the foreign direct investment to the markets
and it aims to capture the correlation sensitivity to foreign investors. MktCap is sum market
capitalisation of all REITs. All data are collected from the DataStream.
5 Empirical Results
This section presents the empirical results of this paper. The first part of this section provides
empirical results of the GJR(1) - GARCH(1,1), and ADCC(1,1) models. Additionally, we present
the graphical analysis on the conditional correlation of the stock market index with the REIT index.
In the second part, empirical results of time series analysis are presented.
GJR(1)-GARCH(1,1), and ADCC(1,1) Models
Panels A of Table 2 report the parameter estimates of the GJR-GARCH processes over the full
study period from December 2001 to December 2016. All of the parameters estimated using daily
frequency data are statistically significant, which implies that GJR-GARCH(1,1) model adequately
captures the temporal dependence and asymmetry of the real estate and stock markets. Therefore,
a common assumption of constant variance is empirically not supported.
17
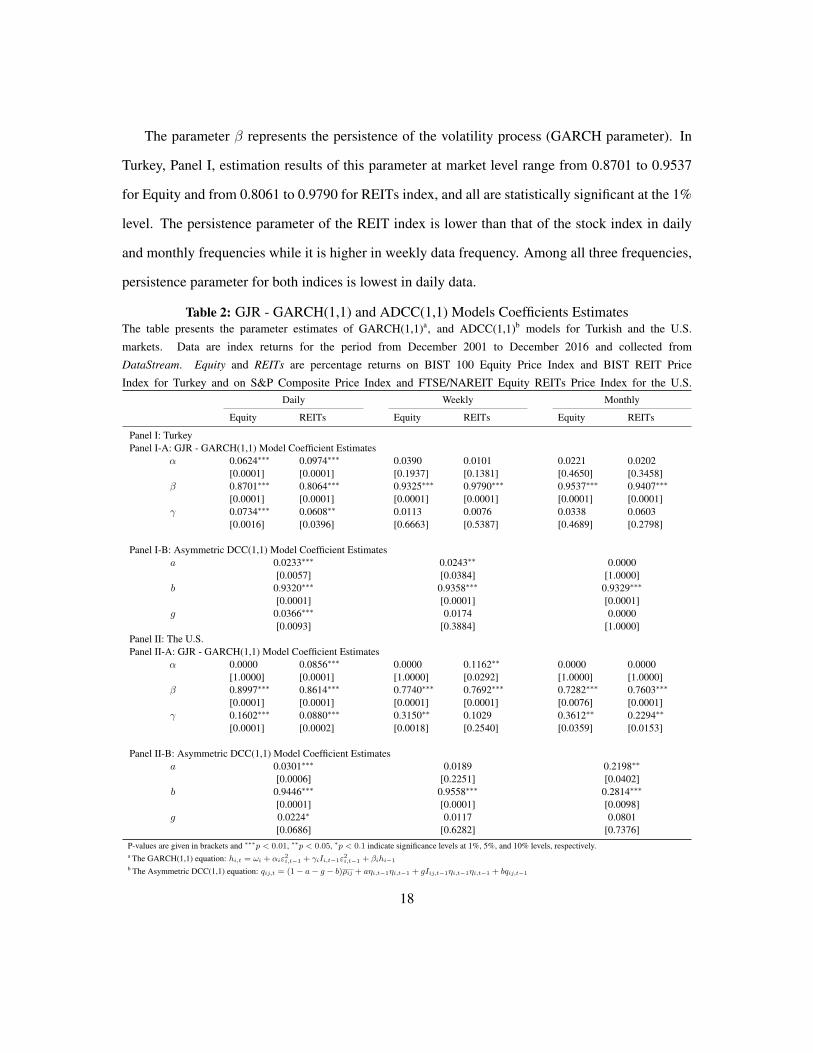
The parameter β represents the persistence of the volatility process (GARCH parameter). In
Turkey, Panel I, estimation results of this parameter at market level range from 0.8701 to 0.9537
for Equity and from 0.8061 to 0.9790 for REITs index, and all are statistically significant at the 1%
level. The persistence parameter of the REIT index is lower than that of the stock index in daily
and monthly frequencies while it is higher in weekly data frequency. Among all three frequencies,
persistence parameter for both indices is lowest in daily data.
Table 2: GJR - GARCH(1,1) and ADCC(1,1) Models Coefficients EstimatesThe table presents the parameter estimates of GARCH(1,1)a, and ADCC(1,1)b models for Turkish and the U.S.
markets. Data are index returns for the period from December 2001 to December 2016 and collected from
DataStream. Equity and REITs are percentage returns on BIST 100 Equity Price Index and BIST REIT Price
Index for Turkey and on S&P Composite Price Index and FTSE/NAREIT Equity REITs Price Index for the U.S.Daily Weekly Monthly
Equity REITs Equity REITs Equity REITs
Panel I: TurkeyPanel I-A: GJR - GARCH(1,1) Model Coefficient Estimates
α 0.0624∗∗∗ 0.0974∗∗∗ 0.0390 0.0101 0.0221 0.0202[0.0001] [0.0001] [0.1937] [0.1381] [0.4650] [0.3458]
β 0.8701∗∗∗ 0.8064∗∗∗ 0.9325∗∗∗ 0.9790∗∗∗ 0.9537∗∗∗ 0.9407∗∗∗
[0.0001] [0.0001] [0.0001] [0.0001] [0.0001] [0.0001]γ 0.0734∗∗∗ 0.0608∗∗ 0.0113 0.0076 0.0338 0.0603
[0.0016] [0.0396] [0.6663] [0.5387] [0.4689] [0.2798]
Panel I-B: Asymmetric DCC(1,1) Model Coefficient Estimatesa 0.0233∗∗∗ 0.0243∗∗ 0.0000
[0.0057] [0.0384] [1.0000]b 0.9320∗∗∗ 0.9358∗∗∗ 0.9329∗∗∗
[0.0001] [0.0001] [0.0001]g 0.0366∗∗∗ 0.0174 0.0000
[0.0093] [0.3884] [1.0000]Panel II: The U.S.Panel II-A: GJR - GARCH(1,1) Model Coefficient Estimates
α 0.0000 0.0856∗∗∗ 0.0000 0.1162∗∗ 0.0000 0.0000[1.0000] [0.0001] [1.0000] [0.0292] [1.0000] [1.0000]
β 0.8997∗∗∗ 0.8614∗∗∗ 0.7740∗∗∗ 0.7692∗∗∗ 0.7282∗∗∗ 0.7603∗∗∗
[0.0001] [0.0001] [0.0001] [0.0001] [0.0076] [0.0001]γ 0.1602∗∗∗ 0.0880∗∗∗ 0.3150∗∗ 0.1029 0.3612∗∗ 0.2294∗∗
[0.0001] [0.0002] [0.0018] [0.2540] [0.0359] [0.0153]
Panel II-B: Asymmetric DCC(1,1) Model Coefficient Estimatesa 0.0301∗∗∗ 0.0189 0.2198∗∗
[0.0006] [0.2251] [0.0402]b 0.9446∗∗∗ 0.9558∗∗∗ 0.2814∗∗∗
[0.0001] [0.0001] [0.0098]g 0.0224∗ 0.0117 0.0801
[0.0686] [0.6282] [0.7376]P-values are given in brackets and ∗∗∗p < 0.01, ∗∗p < 0.05, ∗p < 0.1 indicate significance levels at 1%, 5%, and 10% levels, respectively.a The GARCH(1,1) equation: hi,t = ωi + αiε
2i,t−1 + γiIi,t−1ε
2i,t−1 + βihi−1
b The Asymmetric DCC(1,1) equation: qij,t = (1− a− g − b)ρij + aηi,t−1ηi,t−1 + gIij,t−1ηi,t−1ηi,t−1 + bqij,t−1
18

In the U.S., Panel II, estimation results of β parameter range from 0.7282 to 0.8997 for Equity
and 0.7282 to 0.8614 for the REITs index, and all are statistically significant at the 1% level. The β
parameter of the REITs is lower than that of the stock index in daily and weekly frequencies while
it is higher in monthly frequency. Different from the estimates for Turkey and consistent with the
literature findings, persistence parameter for both indices is highest in daily frequency.
The asymmetry parameter γ does not have any restrictions in terms of its sign, which implies
that this parameter estimate may have negative or positive values. Significant and positive values
of the asymmetry parameter would indicate that the market’s response to negative shocks, such
as a financial crisis, is stronger compared to positive shocks. The empirical results demonstrate
that in Turkey the asymmetry parameter γ is positive for all frequencies; ranging from 0.0113 to
0.0734 for equity index and from 0.0076 to 0.0608 for REITs index; however, only the estimates
of γ coefficient of both daily stock and REIT volatilities in Turkey are statistically significant.
This suggests that negative shocks to both market indices positively affect and increase the
market level volatility of returns, and asymmetric effect of negative shocks is significant only at
daily level. This is probably caused by market’s initial overreaction to negative news, which dies
out at most in a week. In the U.S., the estimates of γ parameters range from 0.1602 to 0.3612 for
the stock market index and from 0.0880 to 0.2294 for the REIT index and are significant at almost
all data frequencies at the 1% level. The significance of the asymmetry parameter in the U.S. in
low frequency volatility is novel. The literature has found no evidence of the leverage effect in the
REIT volatility in weekly or monthly data.
Fei et al. (2010), Jirasakuldech et al. (2009) and Yang et al. (2012) all explore the dynamic
volatility of Equity REITs in a GARCH framework using daily or monthly returns. The combined
results of these studies suggest that while asymmetry can be detected in daily data, there is no
statistical proof of asymmetry in monthly data. Consistent with these studies, Jirasakuldech et al.
(2009) investigate the volatility behaviour of U.S. EREITs using a large dataset from 1972 to 2006.
19

They document that more than one third of conditional volatility of REITs can be explained by the
volatility of some macroeconomic variables. The paper documents that REIT volatility changes
significantly over time and future REIT volatility is predictable. The authors further report that
the conditional volatility of REITs increased in the post-1993 period compared to pre-1993. Al-
though their results indicate that the volatility of REITs is time-varying, they find no indication of
asymmetry effect in the conditional volatility in the pre- or post-1993 periods.
However, one common characteristics of these studies is that their samples do not include
the data from both 2008 global financial crisis and later periods. We further investigate whether
the significance of the asymmetry parameter in the U.S. volatility is affected by the 2008 global
financial crisis. Unreported results show that while the asymmetry parameter is not significant for
both stock market and equity REITs in the U.S. before the crisis, it becomes significant during and
after the crisis. The magnitude of the parameter estimate is highest during the crisis period. The
size of the asymmetry parameter reveals additional information. In almost all frequencies in both
countries, the size of γ is larger for the volatility of stock index than that of the REIT index, which
implies higher sensitive of the stock market to negative news than the REITs market. Appendix B
gives the evolution of all GJR-GARCH parameters.
The relationship between data frequency and the magnitude of parameter estimates reveal dis-
parate results for the two countries. In Turkey, we do not observe a systematic change in the mag-
nitude of the parameter estimates across data frequencies. However, in the U.S., the estimates of β
and γ parameters decrease as the frequency of data becomes lower. That is, while daily data have
the highest persistence, monthly data have the lowest persistence. Further, the effect of negative
news on the volatility process is highest with monthly data and lowest with daily data.
Panels B of Tables 2 exhibit estimation results for the ADCC model over the full sample period.
The parameter a represents the influence of past shocks on correlations. As clearly shown in the
tables, the influence of past shocks on the correlation process is statistically significant.
20

The parameter b stands for the effect of the lag one variance-covariance on the current variance-
covariance, which measures the persistence of the correlation process. The variance-covariance
process has a statistically significant persistent parameter, ranging from 0.9320 to 0.9358 for
Turkey and from 0.2814 to 0.9458 for the U.S.
The parameter g represents the so-called leverage effect, which shows how the variance-covariance
process, or equivalently, the correlations process behaves when the economy is in recession or
when there are negative shocks to the market. The tables suggest that the asymmetry effect in
daily correlations of both the Turkish and the U.S. markets is positive and significant. That means
negative shocks to the variance-covariance matrix increase the conditional correlation between the
two markets in both countries and this increase is highlighted after the crisis. The leverage effect
parameters of the correlation processes in both countries are not significant at weekly and monthly
data frequencies, which indicates that the market quickly adjusts itself to the effect of the negative
news and the effect disappears.
These results indicate that not only correlations increase in times of economic downturns but
also correlations have become more sensitive to negative shocks to the entire economy after the
2008 financial crisis. This evidence suggests that the asymmetric effect of shocks has become
more important over the period examined in this paper.
Figure 2 depicts the coefficient estimates produced by the ADCC model with a rolling window
technique using daily data from January 2007 to December 2016.12 The first 5 years are used to
estimate the initial variance covariance matrix. We use a rolling window of 60-months over 1-
day step.13 The window length is chosen to ensure it is large enough that it provides satisfactory
statistical significance and small enough that it retains sensitivity to changes occurring over time.
The rolling ADCC is estimated to examine time evolution of each coefficient in ADCC model.
The figures indicate that the persistence parameter GJR-GARCH process has similar time-12Weekly and monthly data reveal qualitatively similar results and the related figures are available upon request.13A rolling window of 60-months over 30-days yields qualitatively similar outcomes.
21

0.013
0.016
0.020
0.023
0.026a
Jan−
06
Jul−06
Jan−
07
Jul−07
Jan−
08
Jul−08
Jan−
09
Jul−09
Jan−
10
Jul−10
Jan−
11
Jul−11
Jan−
12
Jul−12
Jan−
13
Jul−13
Jan−
14
Jul−14
Jan−
15
Jul−15
Jan−
16
Jul−16
Jan−
17
Evolution of 'ARCH' Coefficient
0.900
0.911
0.923
0.935
0.946
b
Jan−
06
Jul−06
Jan−
07
Jul−07
Jan−
08
Jul−08
Jan−
09
Jul−09
Jan−
10
Jul−10
Jan−
11
Jul−11
Jan−
12
Jul−12
Jan−
13
Jul−13
Jan−
14
Jul−14
Jan−
15
Jul−15
Jan−
16
Jul−16
Jan−
17
Evolution of 'Persistance' Coefficient
0.035
0.046
0.057
0.068
0.079
g
Jan−
06
Jul−06
Jan−
07
Jul−07
Jan−
08
Jul−08
Jan−
09
Jul−09
Jan−
10
Jul−10
Jan−
11
Jul−11
Jan−
12
Jul−12
Jan−
13
Jul−13
Jan−
14
Jul−14
Jan−
15
Jul−15
Jan−
16
Jul−16
Jan−
17
Evolution of 'Asymmetry' Coefficient
ADCC (1,1) Estimates−Turkish Stock Market & REITs Indices
0.014
0.018
0.022
0.027
0.031
a
Jan−
06
Jul−06
Jan−
07
Jul−07
Jan−
08
Jul−08
Jan−
09
Jul−09
Jan−
10
Jul−10
Jan−
11
Jul−11
Jan−
12
Jul−12
Jan−
13
Jul−13
Jan−
14
Jul−14
Jan−
15
Jul−15
Jan−
16
Jul−16
Jan−
17
Evolution of 'ARCH' Coefficient
0.943
0.952
0.960
0.969
0.978
b
Jan−
06
Jul−06
Jan−
07
Jul−07
Jan−
08
Jul−08
Jan−
09
Jul−09
Jan−
10
Jul−10
Jan−
11
Jul−11
Jan−
12
Jul−12
Jan−
13
Jul−13
Jan−
14
Jul−14
Jan−
15
Jul−15
Jan−
16
Jul−16
Jan−
17
Evolution of 'Persistance' Coefficient
0.007
0.013
0.018
0.024
0.029
g
Jan−
06
Jul−06
Jan−
07
Jul−07
Jan−
08
Jul−08
Jan−
09
Jul−09
Jan−
10
Jul−10
Jan−
11
Jul−11
Jan−
12
Jul−12
Jan−
13
Jul−13
Jan−
14
Jul−14
Jan−
15
Jul−15
Jan−
16
Jul−16
Jan−
17
Evolution of 'Asymmetry' Coefficient
ADCC (1,1) Estimates − The U.S. Stock Market & REITs Indices
Figure 2: Evolution of the DCC Process for Stock Market Index - Daily
varying evolution across countries; however, its behaviour across each market within each countries
is dissimilar. Also, there seems to be a linear relationship between the persistence and asymmetry
parameters. The volatility of the stock market index becomes less persistent in both countries while
the leverage parameter of the stock market index increases its effect on volatility. The volatility of
REIT index has a different behaviour across countries. On the one hand, the Turkish REITs index
volatility has a similar evolution to the Turkish stock market index volatility. It has a decreasing
persistence and an increasing leverage effect on parameter estimates. On the other hand, the evo-
lution of the U.S. REITs index volatility is different from the U.S. stock market index volatility.
While persistence parameter of the volatility of the U.S. REITs index increases, the leverage effect
decreases. The volatility of the U.S. REITs index is more sensitive to negative news during the
crisis and this sensitivity decreases in the period after the crisis.
22

With regard to the evolution of the correlation between stock and REIT indices in both coun-
tries, the figures show that the correlation has a different evolution process in both countries. Fig-
ure 2 shows that the persistence of the correlation process decreases during the crisis and increases
in the last six years of the sample in Turkey while, in the U.S., however, the persistence parameter
estimate decreases during full sample period. An analysis of estimates of parameter b and g in the
figures show that there is a significant relationship between the estimates the persistence and the
asymmetry coefficients of the correlation process in both countries. The leverage effect parameter
g has a direct link with persistence parameter b of correlation. In line with our sub-period analysis,
while persistence of the correlation decreases, the effect of negative news on the correlation process
increases in the U.S. The leverage effect in Turkey decreases in the recent years.
Comparison of Daily, Weekly, and Monthly Correlations
Figures 3 and 4 plot the evolution of the correlation between the stock market and the REIT in-
dices and the time-varying volatility of the stock market index in daily, weekly, and monthly data
frequencies in Turkey and in the U.S., respectively. First, conditional correlation processes in all
data frequencies in Turkey are generally high for the full sample period, but most importantly, a
significant and slightly downward trend is present in weekly and monthly conditional correlations,
although the trend in daily correlation is not significant.1415 High correlations with a downward
slope indicate that the diversification power of the REITs is low but increasing over time.
14Several reasons for the high correlation between stock and real estate markets are possible. One reason is that theREITs appearing in both the stock market index and the real estate market index cause an upward bias in the correlation.
15The trend coefficient in the figures is estimated as follows: Corri,t = α + βTrendt + εit where Trend is adeterministic time trend variable starting from 1 and increases for by 1 for each day, week, or month.
23

0.0
10
0.0
21
0.0
33
0.0
44
0.0
55
Daily Varinace
Dec
−01 Ju
n−02 D
ec−0
2 Jun−
03 Dec
−03 Ju
n−04 D
ec−0
4 Jun−
05 Dec
−05 Ju
n−06 D
ec−0
6 Jun−
07 Dec
−07 Ju
n−08 D
ec−0
8 Jun−
09 Dec
−09 Ju
n−10 D
ec−1
0 Jun−
11 Dec
−11 Ju
n−12 D
ec−1
2 Jun−
13 Dec
−13 Ju
n−14 D
ec−1
4 Jun−
15 Dec
−15 Ju
n−16 D
ec−1
6
0.4
8
0.6
0
0.7
2
0.8
4
0.9
6
Daily Correlation
slo
pe
= 2
.0e
−0
7
Co
rre
latio
nV
ari
an
ce
0.0
27
0.0
38
0.0
50
0.0
62
0.0
73
Weekly Varinace
Dec
−01 Ju
n−02 D
ec−0
2 Jun−
03 Dec
−03 Ju
n−04 D
ec−0
4 Jun−
05 Dec
−05 Ju
n−06 D
ec−0
6 Jun−
07 Dec
−07 Ju
n−08 D
ec−0
8 Jun−
09 Dec
−09 Ju
n−10 D
ec−1
0 Jun−
11 Dec
−11 Ju
n−12 D
ec−1
2 Jun−
13 Dec
−13 Ju
n−14 D
ec−1
4 Jun−
15 Dec
−15 Ju
n−16 D
ec−1
6
0.7
1
0.7
7
0.8
2
0.8
7
0.9
2
Weekly Correlation
slo
pe
= −
4.9
e−
06
Co
rre
latio
nV
ari
an
ce
0.0
60
0.0
81
0.1
02
0.1
23
0.1
44
Monthly Varinace
Dec
−01 Ju
n−02 D
ec−0
2 Jun−
03 Dec
−03 Ju
n−04 D
ec−0
4 Jun−
05 Dec
−05 Ju
n−06 D
ec−0
6 Jun−
07 Dec
−07 Ju
n−08 D
ec−0
8 Jun−
09 Dec
−09 Ju
n−10 D
ec−1
0 Jun−
11 Dec
−11 Ju
n−12 D
ec−1
2 Jun−
13 Dec
−13 Ju
n−14 D
ec−1
4 Jun−
15 Dec
−15 Ju
n−16 D
ec−1
6
0.8
5
0.8
5
0.8
5
0.8
5
0.8
5
Monthly Correlation
slo
pe
= −
6.9
e−
12
Co
rre
latio
nV
ari
an
ce
Figu
re3:
Turk
ish
RE
ITs
&St
ock
Mar
ketC
ondi
tiona
lCor
rela
tions
and
Vola
tiliti
es-D
aily
,Wee
kly,
and
Mon
thly
Thi
sfig
ure
pres
ents
time-
vary
ing
vola
tility
and
corr
elat
ion
estim
ates
with
GJR
-GA
RC
H(1
,1)
-A
DC
C(1
,1)
Mod
elin
the
Turk
ish
mar
ket
usin
gda
ily,
wee
kly,
and
mon
thly
data
freq
uenc
ies.
slop
eis
theβ
coef
ficie
ntinCorr i,t=α+βTrendt+ε it
and
give
nin
bold
font
whe
nth
eco
effic
ient
isst
atis
tical
ly
sign
ifica
nt.
24

0.0
05
0.0
18
0.0
31
0.0
44
0.0
58
Daily Varinace
Dec
−01 Ju
n−02 D
ec−0
2 Jun−
03 Dec
−03 Ju
n−04 D
ec−0
4 Jun−
05 Dec
−05 Ju
n−06 D
ec−0
6 Jun−
07 Dec
−07 Ju
n−08 D
ec−0
8 Jun−
09 Dec
−09 Ju
n−10 D
ec−1
0 Jun−
11 Dec
−11 Ju
n−12 D
ec−1
2 Jun−
13 Dec
−13 Ju
n−14 D
ec−1
4 Jun−
15 Dec
−15 Ju
n−16 D
ec−1
6
0.2
4
0.4
0
0.5
7
0.7
3
0.9
0
Daily Correlation
slo
pe
= 1
.1e
−0
5C
orr
ela
tio
nV
ari
an
ce
0.0
13
0.0
41
0.0
69
0.0
97
0.1
25
Weekly Varinace
Dec
−01 Ju
n−02 D
ec−0
2 Jun−
03 Dec
−03 Ju
n−04 D
ec−0
4 Jun−
05 Dec
−05 Ju
n−06 D
ec−0
6 Jun−
07 Dec
−07 Ju
n−08 D
ec−0
8 Jun−
09 Dec
−09 Ju
n−10 D
ec−1
0 Jun−
11 Dec
−11 Ju
n−12 D
ec−1
2 Jun−
13 Dec
−13 Ju
n−14 D
ec−1
4 Jun−
15 Dec
−15 Ju
n−16 D
ec−1
6
0.4
5
0.5
4
0.6
3
0.7
3
0.8
2
Weekly Correlation
slo
pe
= 9
.6e
−0
6C
orr
ela
tio
nV
ari
an
ce
0.0
23
0.0
51
0.0
79
0.1
07
0.1
34
Monthly Varinace
Dec
−01 Ju
n−02 D
ec−0
2 Jun−
03 Dec
−03 Ju
n−04 D
ec−0
4 Jun−
05 Dec
−05 Ju
n−06 D
ec−0
6 Jun−
07 Dec
−07 Ju
n−08 D
ec−0
8 Jun−
09 Dec
−09 Ju
n−10 D
ec−1
0 Jun−
11 Dec
−11 Ju
n−12 D
ec−1
2 Jun−
13 Dec
−13 Ju
n−14 D
ec−1
4 Jun−
15 Dec
−15 Ju
n−16 D
ec−1
6
−0
.03
0.2
0
0.4
3
0.6
6
0.8
9
Monthly Correlation
slo
pe
= −
2.4
e−
06
Co
rre
latio
nV
ari
an
ce
Figu
re4:
U.S
.RE
ITs
&St
ock
Mar
ketC
ondi
tiona
lCor
rela
tions
and
Vola
tiliti
es-D
aily
,Wee
kly,
and
Mon
thly
Thi
sfig
ure
pres
ents
time-
vary
ing
vola
tility
and
corr
elat
ion
estim
ates
with
GJR
-GA
RC
H(1
,1)-
AD
CC
(1,1
)Mod
elin
the
U.S
.mar
ketu
sing
daily
,wee
kly,
and
mon
thly
data
freq
uenc
ies.
slop
eis
theβ
coef
ficie
ntinCorr i,t
=α+βTrendt+ε it
and
give
nin
bold
font
whe
nth
eco
effic
ient
isst
atis
tical
ly
sign
ifica
nt.
25

A careful eye would observe that the correlation and volatility tend to move together. In times of
spikes in the volatility of the Turkish stock index, its correlation with the REIT index also increases.
From a portfolio allocation point of view, this is an undesired feature of the correlation. Investors
would prefer lower correlations between these asset classes in times of higher market volatility for
diversification purposes. Further, the magnitude of the negative trend in the correlations is highest
in weekly correlation, and the level of the correlation is also lowest in this frequency.
Overall correlations between the stock and the REIT indices in the U.S. are lower than that in
Turkey. Contrary to the negative trend in Turkey, the correlation process between stock and REIT
indices in the U.S. has a positive and significant trend in daily and weekly frequencies.16 The
relationship between the variance and the correlation is less obvious in the U.S. data. However,
the correlation process is at its highest level between December 2007 and June 2009, the period
spanning the 2008 global financial crisis. The correlation increases when the volatility process has
spikes. An increase in the correlation when the market volatility is high reduces the diversification
potential of REITs. The stock market volatility is positively connected to the correlation between
the stock market and the REIT indices, which is also supported by the literature (Chong et al.,
2009). Further, the U.S. correlation has a declining trend after the financial crisis. The decrease
is more obvious in the weekly correlation. While the weekly correlation is above 0.8 during the
crisis, it declines to around 0.45 in early 2015.
Although a downward slope in Turkish and an upward slope in the U.S. correlations is apparent
in the figures, a formal investigation to determine the presence of a deterministic trend, which we
undertake in Section 5, is required. The downward slope in the Turkish correlation is an important
finding of this paper which separates this study from the literature. When implementing DCC -
GJR - GARCH family methods, rolling correlations, or other co-integration tests to daily, weekly,
monthly, or quarterly data, the literature does not agree on the direction in the conditional correla-16See Footnote 15
26
tion between equity and real estate markets. As suggested in Table 1, the direction of the correlation
changes with data frequency and time period of the samples in these studies. Whether these mixed
results are time- or -sample specific is not known and no study proposes an explanation.
To our knowledge, this is the first study to report the time-varying correlation in daily, weekly,
and monthly frequencies at the same time. In this approach, we aim to answer whether the direction
of the correlation between the stock and the real estate markets is time- or -sample specific or, in
other words, whether it depends on the frequency of data or the sample period of the study.17
We conclude in this paper that the direction of the correlation not only depends on time period
of the study but also on the data itself. Our data are from two countries that have very different
regulations on REIT dividend policy and their taxation. We argue that 0% minimum dividend
requirement on REITs might be related to the negative trend in the correlation of the stock and the
REIT indices in Turkey. We undertake a formal investigation of this in the following section.
Time Series Analysis
In this section, we provide empirical results from our time series analysis. Conditional correlation
between the stock market and the REIT indices in daily, weekly, and monthly data frequencies are
regressed on a constant, a deterministic time trend, the index of REIT dividend payout ratios, two
control variables, and the lag of the correlation using full period and sub-periods data. Since the
lag variable is expected to have high correlations with the explanatory variables, we run the model
with and without the lag of the correlation variable.
Yang et al. (2012) document the evidence for a structural break, caused by the financial crises,
in 2007 in the correlation between real estate and stock markets. We do not formally test for a17The unconditional correlation between the returns of the stock market and the REIT indices in Turkey is 0.83 at daily
level. This could be an indication of immature Turkish REIT market. Considered to have a mature securities market,the unconditional correlation between stock and REITs markets in the U.S. is 0.68. Thus, the decreasing daily timevarying correlation documented in this paper may be interpreted as the Turkish REITs market becoming more matureand presents more exposure to the Turkish real estate market in time.
27

structural break in the correlation. However, in order to see whether the financial crisis caused any
change in the direction of the correlations between the two markets in Turkey and the U.S., we
divide our sample into three sub-samples; pre-, peri-, and post- global financial crisis. According
to the National Bureau of Economic Research, the 2008 Financial Crisis lasted 18 months from
December 2007 to June 2009. We centre our sub-samples around these dates.
Table 3 presents the coefficient estimates of the trend equation for the full sample and sub-
samples in Turkey. The estimates reveal interesting interpretations. In Panel A, as predicted, a
negative deterministic time trend is observed in daily observations, which contradicts to literature
findings. For the full sample period, the trend coefficient is significant only in daily data when the
trend regression is run without lag correlations. The sub-period analysis reveal a clearer picture. A
negative and statistically significant trend coefficient is found using all data frequencies before the
global financial crisis. The trend loses its significance during the crisis and, most interestingly, it
changes its sign in the period starting with the end of the crisis and becomes positive. The trend
coefficient is significant after the crisis in daily and weekly frequency when the lag correlations are
not included in the model.
One possible explanation for the negative coefficient estimate of trend in the correlation be-
tween the Turkish markets is the increased diversification level of the REIT index. At the begin-
ning of our sample, in 2001, there are a total of 8 REITs in the Turkish REIT index. By the end
of 2016, the number of REIT firms in our index is 31. Although some REIT stocks are excluded
from the REIT index, number of stocks in the REIT index increases with the number of existing
REIT firms. As the number of firms in the REIT index increases, the index will be more diversified
and less risky. Consistent with this notion, the volatility of the Turkish REIT index in Figure B.2
in Appendix B confirms that the level of REIT index volatility decreases over time. Decreasing
risk driven by the increasing number of firms in the REIT index may be causing the time varying
correlation between the stock and the REIT indices to decrease over time.
28

Table 3: Time Trend Model Estimates - TurkeyThe table presents the parameter estimates of a deterministic time trend* for the correlation series: CORRt refers to the
conditional correlation between the returns on the stock market and REIT indices at time t and Trend is a linear time
trend. MktCap is the value weighted average of market capitalisations of REITs in Turkey, FDI.Inflow is foreign
direct investment inflow to Turkey. Finally, Div.Payout is weighted average of the dividend payout ratios of REITs
in Turkey. The full sample contains 3924 daily, 840 weekly, and 181 monthly observations. Sub-period 1 contains data
after December 2001 and before December 2007. Sub-period 2 contains data between June 2009 and December 2016.Dependent Variable
Explanatory CORRdaily CORRweekly CORRmonthly
Variables Model1 Model2 Model1 Model2 Model1 Model2
Panel A: Full Sample (December 2001 - December 2016)Corrt−1 0.9683∗∗∗ 0.9802∗∗∗ 0.9705∗∗∗
[0.0000] [0.0000] [0.0000]Trend −0.0000 −0.0000∗∗∗ 0.0000 −0.0000 −0.0000 −0.0000
[0.1627] [0.0051] [0.7779] [0.3870] [0.9133] [0.5913]Div.Payout −0.0013 −0.0851∗∗∗ −0.0088∗ −0.0938∗∗∗ −0.0132 −0.1092∗∗∗
[0.5778] [0.0000] [0.0866] [0.0000] [0.2742] [0.0089]MktCap 0.0000 0.0000∗∗∗ 0.0000 0.0000 0.0000 0.0000
[0.1280] [0.0003] [0.4403] [0.1576] [0.4856] [0.2962]FDI.Inflow 0.0000 0.0000∗∗∗ 0.0000 0.0000∗∗∗ 0.0000 0.0000∗∗
[0.1800] [0.0000] [0.4346] [0.0001] [0.4554] [0.0176]Adj. R2 0.9402 0.0370 0.9440 0.0375 0.9213 0.0503Num. obs. 3924 3924 785 785 181 181
Panel B: Sub-Period 1 : Pre - 2008 Financial Crisis (December 2001 - December 2007)Corrt−1 0.9606∗∗∗ 0.9752∗∗∗ 0.9794∗∗∗
[0.0000] [0.0000] [0.0000]Trend −0.0000∗∗ −0.0001∗∗∗ 0.0000 −0.0001∗∗∗ −0.0000 −0.0001∗
[0.0192] [0.0000] [0.5829] [0.0000] [0.8954] [0.0507]Div.Payout 0.0106 0.0928∗∗∗ 0.0108 0.0879 0.0132 0.0176
[0.1483] [0.0005] [0.4534] [0.1415] [0.6834] [0.8852]MktCap −0.0000∗∗ −0.0004∗∗∗ −0.0000∗∗ −0.0004∗∗∗ −0.0000 −0.0004∗∗∗
[0.0462] [0.0000] [0.0223] [0.0000] [0.3422] [0.0056]FDI.Inflow 0.0000∗∗∗ 0.0000∗∗∗ 0.0000 0.0000∗∗∗ 0.0000 0.0000∗∗∗
[0.0007] [0.0000] [0.1229] [0.0000] [0.3274] [0.0000]Adj. R2 0.9469 0.2977 0.9589 0.2882 0.9464 0.2402Num. obs. 1564 1564 313 313 72 72
Panel C: Sub-Period 2 : Peri - 2008 Financial Crisis (December 2007 - Jun 2009)Corrt−1 0.9586∗∗∗ 0.9970∗∗∗ 0.9982∗∗∗
[0.0000] [0.0000] [0.0000]Trend 0.0000 −0.0001 0.0001 −0.0001 −0.0000 0.0004
[0.8676] [0.2697] [0.3103] [0.6598] [0.4449] [0.2795]Div.Payout −0.0009 −0.0684∗ −0.0073 −0.0781 −0.1373 1.9820∗∗
[0.9360] [0.0763] [0.8071] [0.3945] [0.4342] [0.0267]MktCap 0.0000 −0.0001 0.0000 −0.0001 −0.0000 0.0001
[0.8812] [0.1193] [0.8150] [0.3825] [0.1890] [0.4947]FDI.Inflow 0.0000 0.0000∗∗ 0.0000 0.0000 0.0000 −0.0000∗∗
[0.7641] [0.0422] [0.2842] [0.3362] [0.4504] [0.0327]Adj. R2 0.9208 0.0261 0.8935 -0.0192 0.9755 0.1598Num. obs. 391 391 78 78 18 18
Panel D: Sub-Period 3 : Post - 2008 Financial Crisis (Jun 2009 - December 2016)Corrt−1 0.9631∗∗∗ 0.9674∗∗∗ 0.9441∗∗∗
[0.0000] [0.0000] [0.0000]Trend 0.0000 0.0001∗∗∗ −0.0000 0.0001∗∗∗ 0.0000 0.0000
[0.6814] [0.0000] [0.8934] [0.0013] [0.9570] [0.4365]Div.Payout −0.0046 −0.1574∗∗∗ −0.0380∗ −0.2421∗∗∗ −0.0340 −0.3676∗∗∗
[0.6534] [0.0000] [0.0672] [0.0015] [0.4701] [0.0032]MktCap −0.0000 −0.0000∗∗∗ −0.0000 −0.0000∗∗∗ −0.0000 −0.0000∗
[0.6274] [0.0000] [0.7645] [0.0000] [0.9723] [0.0883]FDI.Inflow 0.0000 0.0000∗∗∗ 0.0000∗ 0.0000∗∗∗ 0.0000 0.0000∗∗∗
[0.1836] [0.0000] [0.0686] [0.0000] [0.4869] [0.0013]Adj. R2 0.9374 0.1743 0.9391 0.1718 0.8870 0.1645Num. obs. 1970 1970 394 394 91 91
P-values are given in brackets and ∗∗∗p < 0.01, ∗∗p < 0.05, ∗p < 0.1 indicate significance levels.*The time trend model is following: Model 1: CORRt = α + λ1
CORRt−1 + λ2Trendt + λ3DivPayout + λ4MktCapt + λ5FDIt + εi,t Model 2: CORRt = ω + θ1Trendt + θ2Div.Payout + θ3MktCapt + θ4FDI + ξi,t
29

Table 4: Time Trend Model Estimates - The U.S.The table presents the parameter estimates of a deterministic time trend* for the correlation series: CORRt refers to the
conditional correlation between the returns on the stock market and REIT indices at time t and Trend is a linear time
trend. MktCap is the value weighted average of market capitalisations of REITs in the U.S., FDI.Inflow is foreign
direct investment inflow to the U.S. Finally, Div.Payout is weighted average of the dividend payout ratios of REITs in
the U.S. The full sample contains 3924 daily, 840 weekly, and 181 monthly observations. Sub-period 1 contains data
after December 2001 and before December 2007. Sub-period 2 contains data between June 2009 and December 2016.Dependent Variable
Explanatory CORRdaily CORRweekly CORRmonthly
Variables Model1 Model2 Model1 Model2 Model1 Model2
Panel A: Full Sample (December 2001 - December 2016)Corrt−1 0.9706∗∗∗ 0.9933∗∗∗ 0.9598∗∗∗
[0.0000] [0.0000] [0.0000]Trend 0.0000∗∗∗ 0.0002∗∗∗ 0.0000 0.0002∗∗∗ 0.0000 0.0002∗∗∗
[0.0000] [0.0000] [0.1971] [0.0000] [0.5207] [0.0000]Div.Payout 0.0059 −0.0250 0.0053 −0.0208 0.0013 −0.0391
[0.4318] [0.4329] [0.4823] [0.7659] [0.9611] [0.7810]MktCap −0.0000∗∗∗ −0.0001∗∗∗ −0.0000 −0.0001∗∗∗ 0.0000 −0.0000∗∗∗
[0.0000] [0.0000] [0.1710] [0.0000] [0.9950] [0.0000]FDI.Inflow 0.0000∗∗ 0.0000∗∗∗ 0.0000 0.0000∗∗∗ 0.0000 0.0000∗∗
[0.0365] [0.0000] [0.4954] [0.0000] [0.9424] [0.0106]Adj. R2 0.9610 0.3025 0.9920 0.3119 0.9723 0.2736Num. obs. 3924 3924 785 785 180 180
Panel B: Sub-Period 1 : Pre - 2008 Financial Crisis (December 2001 - December 2007)Corrt−1 0.9610∗∗∗ 0.9955∗∗∗ 0.9578∗∗∗
[0.0000] [0.0000] [0.0000]Trend 0.0000∗ 0.0002∗∗∗ 0.0000 0.0002∗∗∗ 0.0000 0.0003∗∗
[0.0552] [0.0000] [0.3855] [0.0002] [0.6459] [0.0212]Div.Payout −0.0113 −0.0693 −0.0093 −0.0392 −0.0814 −0.6144
[0.6498] [0.4463] [0.6975] [0.8425] [0.4072] [0.2518]MktCap −0.0000 0.0000 −0.0000 0.0000 0.0000∗ 0.0000
[0.7988] [0.3256] [0.7622] [0.6570] [0.0869] [0.7904]FDI.Inflow −0.0000 −0.0000∗∗∗ −0.0000 −0.0000∗∗∗ −0.0000 −0.0000∗∗
[0.1676] [0.0000] [0.6020] [0.0015] [0.2401] [0.0497]Adj. R2 0.9400 0.2043 0.9883 0.2031 0.9733 0.1965Num. obs. 1564 1564 313 313 71 71
Panel C: Sub-Period 2 : Peri - 2008 Financial Crisis (December 2007 - Jun 2009)Corrt−1 0.9012∗∗∗ 1.0032∗∗∗ 0.9233∗∗∗
[0.0000] [0.0000] [0.0000]Trend 0.0001∗∗∗ 0.0005∗∗∗ −0.0000 0.0006∗∗∗ 0.0001∗∗ 0.0005∗∗
[0.0041] [0.0000] [0.7090] [0.0000] [0.0304] [0.0187]Div.Payout 0.0466 0.6039∗∗∗ −0.0206 0.6114∗∗∗ 0.1513 −1.4375
[0.1586] [0.0000] [0.5257] [0.0001] [0.8136] [0.7410]MktCap 0.0000 0.0000∗∗∗ −0.0000 0.0000 0.0000 0.0000
[0.6491] [0.0041] [0.9395] [0.1511] [0.4867] [0.6028]FDI.Inflow 0.0000∗∗ 0.0000∗∗∗ −0.0000 0.0000∗∗∗ 0.0000 0.0000
[0.0231] [0.0000] [0.9119] [0.0000] [0.7555] [0.2706]Adj. R2 0.9070 0.5151 0.9820 0.5461 0.9866 0.3763Num. obs. 391 391 78 78 18 18
Panel D: Sub-Period 3 : Post - 2008 Financial Crisis (Jun 2009 - December 2016)Corrt−1 0.9642∗∗∗ 0.9868∗∗∗ 0.9326∗∗∗
[0.0000] [0.0000] [0.0000]Trend −0.0000 −0.0001∗∗∗ −0.0000 −0.0001∗∗∗ 0.0000 −0.0000
[0.5527] [0.0000] [0.8389] [0.0001] [0.9905] [0.3324]Div.Payout 0.0204 −0.0544 0.0197 0.0535 0.0009 −0.6332∗∗
[0.4182] [0.5726] [0.4736] [0.8053] [0.9911] [0.0438]MktCap −0.0000 −0.0000∗∗∗ −0.0000 −0.0000 −0.0000 −0.0000
[0.1211] [0.0002] [0.4198] [0.1226] [0.9369] [0.5699]FDI.Inflow 0.0000∗∗ 0.0000∗∗∗ 0.0000 0.0000∗∗∗ 0.0000 0.0000
[0.0418] [0.0000] [0.3740] [0.0000] [0.8789] [0.2654]Adj. R2 0.9600 0.4141 0.9909 0.4299 0.9541 0.3566Num. obs. 1970 1970 394 394 91 91
P-values are given in brackets and ∗∗∗p < 0.01, ∗∗p < 0.05, ∗p < 0.1 indicate significance levels.*The time trend model is following: Model 1: CORRt = α + λ1
CORRt−1 + λ2Trendt + λ3DivPayout + λ4MktCapt + λ5FDIt + εi,t Model 2: CORRt = ω + θ1Trendt + θ2Div.Payout + θ3MktCapt + θ4FDI + ξi,t
30
On the other hand, the number of REIT firms in the U.S. increased from 130 to 7,095 in the
same time period; however, the volatility process of the U.S. REIT index does not show a relation
with the increased number of REIT firms.
To test whether the negative trend found in this paper is caused by increased diversification
level of the REIT index, we include the size of the REIT market as an exogenous variable into our
time series equation and results show that the negative time trend coefficient is still significant.18
Because of the obvious positive relationship between the number of REITs and the sum of their
market capitalisation, the diversification effects on the correlation process will be captured by the
market capitalisation variable. As the REIT index becomes more diversified as a results if its
increased market capitalisation and correlation with stock market is expected to decrease. Pre- and
-post crisis sub-samples of Tables 3 and 4 confirm our expectation of negative coefficient estimate
for the size of the REIT market.
Table 4 reports the coefficient estimates of the trend equation for the full sample and sub-
samples in the U.S. In Panel A, a positive deterministic time trend, which is supported by literature
findings, is observed in daily, weekly, and monthly observations. For the full sample period, the
positive trend coefficient is more pronounced with a larger coefficient estimate when lag correla-
tions variables are excluded from trend regression. The positive and statistically significant trend
in the correlations remains present both before and during the financial crisis. The positive trend
in the correlation implies less diversification power of REITs in the U.S. for stock market investors
over time. However, the trend coefficient changes its sign after the crisis and becomes negative. In
both Turkey and the U.S., the financial crisis seems to change the direction of the correlation be-
tween stock and REIT indices. The table indicates that the diversification power of the U.S. REITs
for stock market investors decreased before and during the financial crisis, and the diversification
potential increased after the crisis.18When the number of REITs in included into the regression instead of the size of the REIT market, the undocumented
results are qualitatively similar.
31

In terms of the direction of the correlation with different data frequency, this paper suggests
that the direction of the correlation does not change with data frequency; instead it changes with
time period and the sample data. In all frequencies, the sign of the trend coefficient remains the
same within a given period and it changes with the global financial crisis. However, the sign of the
trend is different between Turkey and the U.S. Thus, active portfolio managers may be interested
in taking this trend into their trading strategies.19 This is consistent with the literature finding
indicating structural breaks in the correlations caused by the 2008 financial crisis. Our results
suggest that the crisis may have caused structural changes in the conditional correlation between
stock and real estate market indices in all frequencies.
The next variable of interest is dividend payout ratio. Figure 1 depicts the changes in the value
weighted dividend payout ratio of REITs in Turkey and in the U.S. Before the financial crisis, on
average, Turkish REITs pay lower dividends. With the arrival of the crisis, low- or -zero dividend
payout policy is abandoned and Turkish REITs increase their dividend payouts.
According to our hypothesis, an increase or a decrease in the dividend payout ratio of REITs is
expected to change their correlation with the stock market index. Our expectation is that dividend
payout ratio is negatively related to the correlation process in Turkey. REITs in the U.S. decrease
their dividend payout with the crisis. If the dividend decrease by U.S. REITs during the crisis is
large enough, our hypothesis that dividend changes lead to a decrease in the correlation, which
would imply a positive coefficient estimate of dividend payout policy in the U.S. case. However,
because of the 90% minimum dividend payout ratio requirement, U.S. REITs are not expected
to make dividend payout changes that are large enough to affect their correlation with the stock
market index. Thus, we do not make any prediction with regard to the effect of dividend payout
policy on the correlation in the U.S., or we expect a non-significant coefficient estimate.19The linear time trend coefficients in daily data for all significant cases is 0.0005 at the maximum. By multiplying
the sample size (3924), the decrease of the conditional correlation over time is small (around 1.96%) over the mentionedperiod time. This suggest that the trending behaviour is not a major force of the conditional correlation movement.However, it has a larger effect compared to control variables under consideration.
32

Table 3 reports that the effects of dividend payout ratio on the correlations is negative and
significant in daily, weekly, and monthly data when full sample is considered in Turkey. The
estimates indicate the correlations between the stock market and REIT indices in Turkey at all
frequencies decreased as individual REITs paid more dividends, triggered by the financial crisis.
Table 4 shows that the effects of the dividend payout ratio index of the U.S. REIT market on the
correlations between the two U.S. markets is not significant in most cases. During the financial
crisis, we observe a positive coefficient estimate, which is consistent with the behaviour of REITs
in the U.S. in terms of dividend policy given in Figure 1. Similar to Turkish REITs, U.S. REITs
use dividends as a tool to decrease their correlation with the stock market. A positive coefficient of
dividend payout ratio implies that the correlation between the U.S. REITs index and the U.S. stock
index decreases as REITs in the U.S. decreases their dividend payouts as a response to the crisis.
In the sub-period analysis, we do not find consistently significant estimates on the effect of
dividend payout in different time periods using different data frequencies. Insignificance of divi-
dend policy coefficient estimate in sub-periods may be resulted by insufficient variation in dividend
policy in each sub-period. Thus, in the analysis of dividend payout variable, we focus on the full
sample. Mostly non-significant coefficients of dividend payout ratio variable supports this notion.
Cyclical behaviour of the sensitivity of REIT returns to stock market returns is documented in
Clayton and MacKinnon (2001). Time varying correlations in Figures 3 and 4 raise the possibility
that there are cyclical variations in correlation series, especially in daily data. A careful examination
of the figures can reveal that there is a cyclical component which repeats twice a year, in the
correlation series. Thus, to formally test the existence of cyclical variation in the correlation series
in both countries, and Appendix C presents the empirical results.
33

6 Conclusion
This paper offers a unique contribution to the literature focusing on the dynamics of correlation
between two major asset classes: REIT and stock markets. One goal is to evaluate and compare the
correlation dynamics between real estate securities and equity markets at different data frequencies.
In order to achieve this goal, an asymmetric DCC model is employed and the time-varying correla-
tions between REIT and stock market indices are estimated using daily, weekly, and monthly data
over a period from December 2001 to December 2016. Contrary to the literature findings, we docu-
ment that data frequency is not related to the direction of the correlations between the two markets,
whereas the sample period is. Our analysis contributes to the literature by documenting differential
directions of trend in the correlation with respect to data period. We also confirm the influence of
the recent global financial crisis on the covariance structure. We support the literature findings that
the 2008 global financial crisis may have caused a structural break in the REITs - stock market
relationship. Further, this paper, for the first time in this area of literature, incorporates dividend
policy into dynamic correlations and documents its effects on the correlation process.
In detail, this paper produces a number of valuable and statistically significant findings for
REIT markets in Turkey and in the U.S.: (i) The conditional correlations of REITs with stock mar-
kets have a downward trend in Turkey and upward trend in the U.S. Our empirical results suggest
that the different regulatory structures on REITs in both countries is related to the differential trend
in the correlations. We additionally document that the direction of the correlations does not change
with data frequency within each country, one of the main findings of this paper. (ii) The 2008
global financial crisis has changed the direction of the correlation process in both countries. The
downward trend in Turkish markets’ correlation disappears after the crisis and it turns into an up-
ward trend. The opposite happens in the U.S. The upward trend in the correlation before the crisis
changes direction. The downward trend before the financial crisis in the Turkish markets’ correla-
tion suggests that the diversification potential of Turkish REITs for investors in the Turkish equity
34

market has increased while the upward trend in the correlation before the crisis in the U.S. suggests
decreased diversification potentials of U.S. REITs for the U.S. stock market index investors. After
the crisis, diversification power of REITs in both countries reversed with respect to the pre-crisis
period. Furthermore, the correlations at all data frequencies are higher during the crisis period.
(iii) The most important finding of this paper is that REIT dividend policy has some implications
on the dynamic correlation of REITs with the stock market. No dividend payment requirement for
Turkish REITs gives them the ability to use dividends as a tool to change their correlation with
the stock market. Consistent with our hypothesis, Turkish REITs choose to pay more dividends
as a response to the crisis, and in turn this decreases their correlation with the stock market. U.S.
REITs, on the other hand, choose to cut their dividend payouts. Although the dividend payout ratio
of U.S. REITs is mostly non-significantly related to the correlations between the two U.S. indices,
the overall correlations are lower after the crisis. To our knowledge, this paper is the first to report
a relationship between dividend policy of a firm and its correlation with the market.
Currently, Turkey is the only country not imposing a minimum dividend payout ratio on REITs
while letting them benefit from REIT tax advantages. Our analysis on REITs in Turkey suggests
that freedom on dividend payout ratio helps Turkish REIT market to mature, which in turn will
make REITs a better representative of the real estate market in the country. An extension of this
paper would be to investigate whether consistent results can be observed when more countries
adopt similar regulations, or when countries with strict inflexibility (high-payout ratio) and flex-
ibility (low- or zero-payout ratio) in dividend policy are analysed in one sample. This question,
however, is left for future studies. Another fruitful area for future research is to seek more optimal
portfolio designs based on the information produced in this paper regarding the dynamic condi-
tional correlations between the two asset classes studied in this paper. Since these correlations are
public information, their effects are expected to be incorporated into stock prices already. Thus, in
an efficient market, these correlations should not lead to abnormal portfolio returns.
35
References
Baker, M. and Wurgler, J. (2004). A catering theory of dividends. The Journal of Finance,
59(3):1125–1165.
Bhattacharya, S. (1979). Imperfect information, dividend policy, and" the bird in the hand" fallacy.
The Bell Journal of Economics, pages 259–270.
Bley, J. and Olson, D. O. (2005). An analysis of relative return behavior: Reits vs stocks. Academy
of Accounting and Financial Studies Journal, 9(2):71–88.
Cappiello, L., Engle, R. F., and Sheppard, K. (2006). Asymmetric dynamics in the correlations of
global equity and bond returns. Journal of Financial Econometrics, 4(4):537–572.
Case, B., Hardin, W. G., and Wu, Z. (2012a). REIT dividend policies and dividend announcement
effects during the 2008–2009 liquidity crisis. Real Estate Economics, 40(3):387–421.
Case, B., Yang, Y., and Yildirim, Y. (2012b). Dynamic correlations among asset classes: REIT and
stock returns. The Journal of Real Estate Finance and Economics, 44(3):298–318.
Chandrashekaran, V. (1999). Time-series properties and diversification benefits of REIT returns.
Journal of Real Estate Research, 17(1):91–112.
Chong, J., Krystalogianni, A., and Stevenson, S. (2012). Dynamic correlations between REIT
sub-sectors and the implications for diversification. Applied Financial Economics, 22(13):1089–
1109.
Chong, J., Miffre, J., and Stevenson, S. (2009). Conditional correlations and real estate investment
trusts. Journal of Real Estate Portfolio Management, 15(2):173–184.
Clayton, J. and MacKinnon, G. (2001). The time-varying nature of the link between REIT, real
estate and financial asset returns. Journal of Real Estate Portfolio Management, 7(1):43–54.
Conover, M., Friday, S., and Sirmans, S. (2002). Diversification benefits from foreign real estate
investments. Journal of Real Estate Portfolio Management, 8(1):17–25.
Cotter, J. and Stevenson, S. (2006). Multivariate modeling of daily REIT volatility. The Journal of
36

Real Estate Finance and Economics, 32(3):305–325.
DeAngelo, H., DeAngelo, L., and Stulz, R. M. (2006). Dividend policy and the earned/contributed
capital mix: a test of the life-cycle theory. Journal of Financial Economics, 81(2):227–254.
Denis, D. J. and Osobov, I. (2008). Why do firms pay dividends? international evidence on the
determinants of dividend policy. Journal of Financial Economics, 89(1):62–82.
Engle, R. (2002). Dynamic conditional correlation: A simple class of multivariate generalized au-
toregressive conditional heteroskedasticity models. Journal of Business & Economic Statistics,
20(3):339–350.
Engle, R. F. and Sheppard, K. (2001). Theoretical and empirical properties of dynamic conditional
correlation multivariate GARCH. Technical report, National Bureau of Economic Research.
Fei, P., Ding, L., and Deng, Y. (2010). Correlation and volatility dynamics in REIT returns: per-
formance and portfolio considerations. Journal of Portfolio Management, 36(2):113.
Glascock, J. L., Lu, C., and So, R. W. (2000). Further evidence on the integration of REIT, bond,
and stock returns. The Journal of Real Estate Finance and Economics, 20(2):177–194.
Glosten, L. R., Jagannathan, R., and Runkle, D. E. (1993). On the relation between the ex-
pected value and the volatility of the nominal excess return on stocks. The Journal of Finance,
48(5):1779–1801.
Huang, J.-z. and Zhong, Z. K. (2013). Time variation in diversification benefits of commodity,
REITs, and TIPS. The Journal of Real Estate Finance and Economics, 46(1):152–192.
Jensen, M. C. (1986). Agency costs of free cash flow, corporate finance, and takeovers. The
American Economic Review, 76(2):323–329.
Jirasakuldech, B., Campbell, R. D., and Emekter, R. (2009). Conditional volatility of equity real
estate investment trust returns: a pre-and post-1993 comparison. The Journal of Real Estate
Finance and Economics, 38(2):137–154.
Liang, Y. and McIntosh, W. (1998). REIT style and performance. Journal of Real Estate Portfolio
37

Management, 4(1):69–78.
Liow, K. H. (2012). Co-movements and correlations across asian securitized real estate and stock
markets. Real Estate Economics, 40(1):97–129.
Miller, M. H. and Rock, K. (1985). Dividend policy under asymmetric information. The Journal
of Finance, 40(4):1031–1051.
Myers, S. C. and Majluf, N. S. (1984). Corporate financing and investment decisions when firms
have information that investors do not have. Journal of Financial Economics, 13(2):187–221.
NAREIT (2017). REIT Industry Timeline. Available at: https://www.reit.com/investing/reit-
basics/reit-industry-timeline#34 (Accessed: 1 October 2017).
Niskanen, J. and Falkenbach, H. (2010). REITs and correlations with other asset classes: A euro-
pean perspective. Journal of Real Estate Portfolio Management, 16(3):227–239.
Yang, J., Zhou, Y., and Leung, W. K. (2012). Asymmetric correlation and volatility dynamics
among stock, bond, and securitized real estate markets. The Journal of Real Estate Finance and
Economics, 45(2):491–521.
38

Appendix A: Descriptive Statistics
This section reports descriptive statistics table. Panel A of Table A.1 reports descriptive statistics of
annualised returns on stock market and REITs indices in daily, weekly, and monthly frequencies.
It provides the mean, median, maximum, minimum, standard deviations, skewness, kurtosis, and
the test statistics of Jarque-Bera test of normality for return series. Note that if standard deviation
is considered as a proxy of risk, risk-return relationships in both countries reveal different obser-
vations. In both countries, REIT market is more risky; however, while the U.S. REIT index offers
higher returns than the corresponding stock market index, the return on the Turkish REIT index
offers little more than half of the return on the country’s stock market.
The distributions of returns over time have non-significant and negative skewness in both the
stock and the real estate market indices in both countries in all data frequencies. In addition,
returns on both indices from the two countries have excess kurtosis at all frequencies, which reveal
the leptokurtic behaviour of return distributions. The returns of all series have fatter tails and
higher peaks compared to normal distribution. The Jarque-Bera test of normality strongly rejects
the normality of all return series in all data frequencies. The overall correlation between the stock
market and REIT indices in Turkey is higher than that in the U.S. in all three data frequencies.
39

Table A.1: Descriptive StatisticsData are annualised index returns for the period from December 2001 to December 2016 and obtained from
DataStream. Equity is percentage return on BIST National All Price Index (TKNATA(PI)) and S&P 500
Composite Price Index (S&PCOMP(PI)) in Turkey and in the U.S., respectively. REITs is the percentage
return on BIST REAL ESTATE Price Index (TKRLEST(PI)) and FTSE/NAREIT Equity REITs Price Index
(NAREQR$(PI)) in Turkey and in the U.S., respectively. Mean, median, maximum, minimum, standard devia-
tion, skewness, kurtosis, Jarque-Berra test of normality, and unconditional correlation of index returns are reported.
Daily Weekly Monthly
Equity REITS Equity REITS Equity REITS
Panel A: Descriptive Statistics - TurkeyMean (%) 12.454 7.254 12.4956 7.306 12.0432 7.0008Median (%) 9.516 5.408 27.222 11.6168 19.3272 13.248Maximum (%) 3029.4 2934.6 1305.0 1798.1 307.6 384.4Minimum (%) -3392.4 -3309.9 -1011.2 -1065.3 -305.8 -458.0Std. Dev. (%) 28.41 30.50 28.32 31.02 29.37 35.21Skewness -0.1983 -0.4408 -0.2154 -0.0664 -0.2366 -0.2373Kurtosis 7.9304 7.6569 3.7134 7.3091 0.7425 1.6149Jarque-Bera Test Statistic 4000 ∗∗∗ 3672 ∗∗∗ 456 ∗∗∗ 1745 ∗∗∗ 6 ∗∗∗ 21 ∗∗∗
N 3924 3924 784 784 180 180CORRequity 0.8052 0.8265 0.8598
Panel B: Descriptive Statistics - The U.S. MarketsMean (%) 4.498 5.59 4.446 5.6212 4.5828 5.6544Median (%) 7.358 7.436 9.4432 16.458 11.916 16.5192Maximum (%) 2848.9 4387.6 590.5 1075.4 122.8 319.5Minimum (%) -2462.1 -5598.4 -1044.4 -1044.6 -222.8 -461.2Std. Dev. (%) 19.40 31.34 17.26 25.49 14.56 23.35Skewness -0.2287 -0.197 -0.8597 -0.4652 -0.8961 -1.5816Kurtosis 12.9675 21.2449 8.3017 8.2767 2.1721 8.4046Jarque-Bera Test Statistic 16278 ∗∗∗ 54450 ∗∗∗ 2347 ∗∗∗ 2266 ∗∗∗ 59 ∗∗∗ 601 ∗∗∗
N 3924 3924 784 784 179 179CORRequity 0.7402 0.7021 0.6901***, **, and * indicate statistical significance at 1%, 5%, and 10% levels, respectively.
40

Appendix B: GJR-GARCH Process
This section reports the figure showing the evolution parameters and time-varying correlation, co-
variance, and variance series estimated with GJR-GARCH (1,1) model in both Turkey and the
U.S.
41

0.0
57
0.0
61
0.0
65
0.0
69
0.0
72
alpha
Jan−
06Ju
l−06
Jan−
07Ju
l−07
Jan−
08Ju
l−08
Jan−
09Ju
l−09
Jan−
10Ju
l−10
Jan−
11Ju
l−11
Jan−
12Ju
l−12
Jan−
13Ju
l−13
Jan−
14Ju
l−14
Jan−
15Ju
l−15
Jan−
16Ju
l−16
Jan−
17
Evo
lutio
n o
f 'A
RC
H' C
oe
ffic
ien
t
0.8
60
0.8
73
0.8
85
0.8
98
0.9
10
beta
Jan−
06Ju
l−06
Jan−
07Ju
l−07
Jan−
08Ju
l−08
Jan−
09Ju
l−09
Jan−
10Ju
l−10
Jan−
11Ju
l−11
Jan−
12Ju
l−12
Jan−
13Ju
l−13
Jan−
14Ju
l−14
Jan−
15Ju
l−15
Jan−
16Ju
l−16
Jan−
17
Evo
lutio
n o
f 'P
ers
ista
nce
' C
oe
ffic
ien
t
0.0
14
0.0
32
0.0
50
0.0
69
0.0
87
gamma
Jan−
06Ju
l−06
Jan−
07Ju
l−07
Jan−
08Ju
l−08
Jan−
09Ju
l−09
Jan−
10Ju
l−10
Jan−
11Ju
l−11
Jan−
12Ju
l−12
Jan−
13Ju
l−13
Jan−
14Ju
l−14
Jan−
15Ju
l−15
Jan−
16Ju
l−16
Jan−
17
Evo
lutio
n o
f 'A
sym
me
try' C
oe
ffic
ien
t
GJR
−G
AR
CH
(1
,1)
Estim
ate
s−
Tu
rkis
h S
tock M
ark
et
Ind
ex
0.0
77
0.0
85
0.0
93
0.1
00
0.1
08
alpha
Jan−
06Ju
l−06
Jan−
07Ju
l−07
Jan−
08Ju
l−08
Jan−
09Ju
l−09
Jan−
10Ju
l−10
Jan−
11Ju
l−11
Jan−
12Ju
l−12
Jan−
13Ju
l−13
Jan−
14Ju
l−14
Jan−
15Ju
l−15
Jan−
16Ju
l−16
Jan−
17
Evo
lutio
n o
f 'A
RC
H' C
oe
ffic
ien
t
0.7
95
0.8
25
0.8
55
0.8
85
0.9
15
beta
Jan−
06Ju
l−06
Jan−
07Ju
l−07
Jan−
08Ju
l−08
Jan−
09Ju
l−09
Jan−
10Ju
l−10
Jan−
11Ju
l−11
Jan−
12Ju
l−12
Jan−
13Ju
l−13
Jan−
14Ju
l−14
Jan−
15Ju
l−15
Jan−
16Ju
l−16
Jan−
17
Evo
lutio
n o
f 'P
ers
ista
nce
' C
oe
ffic
ien
t
−0
.01
6
0.0
08
0.0
33
0.0
58
0.0
82
gamma
Jan−
06Ju
l−06
Jan−
07Ju
l−07
Jan−
08Ju
l−08
Jan−
09Ju
l−09
Jan−
10Ju
l−10
Jan−
11Ju
l−11
Jan−
12Ju
l−12
Jan−
13Ju
l−13
Jan−
14Ju
l−14
Jan−
15Ju
l−15
Jan−
16Ju
l−16
Jan−
17
Evo
lutio
n o
f 'A
sym
me
try' C
oe
ffic
ien
t
GJR
−G
AR
CH
(1
,1)
Estim
ate
s−
Tu
rkis
h R
EIT
s I
nd
ex
0.0
00
0.0
00
0.0
00
0.0
00
0.0
00
alpha
Jan−
06Ju
l−06
Jan−
07Ju
l−07
Jan−
08Ju
l−08
Jan−
09Ju
l−09
Jan−
10Ju
l−10
Jan−
11Ju
l−11
Jan−
12Ju
l−12
Jan−
13Ju
l−13
Jan−
14Ju
l−14
Jan−
15Ju
l−15
Jan−
16Ju
l−16
Jan−
17
Evo
lutio
n o
f 'A
RC
H' C
oe
ffic
ien
t
0.8
99
0.9
13
0.9
27
0.9
40
0.9
54
beta
Jan−
06Ju
l−06
Jan−
07Ju
l−07
Jan−
08Ju
l−08
Jan−
09Ju
l−09
Jan−
10Ju
l−10
Jan−
11Ju
l−11
Jan−
12Ju
l−12
Jan−
13Ju
l−13
Jan−
14Ju
l−14
Jan−
15Ju
l−15
Jan−
16Ju
l−16
Jan−
17
Evo
lutio
n o
f 'P
ers
ista
nce
' C
oe
ffic
ien
t
0.0
80
0.1
01
0.1
22
0.1
42
0.1
63
gamma
Jan−
06Ju
l−06
Jan−
07Ju
l−07
Jan−
08Ju
l−08
Jan−
09Ju
l−09
Jan−
10Ju
l−10
Jan−
11Ju
l−11
Jan−
12Ju
l−12
Jan−
13Ju
l−13
Jan−
14Ju
l−14
Jan−
15Ju
l−15
Jan−
16Ju
l−16
Jan−
17
Evo
lutio
n o
f 'A
sym
me
try' C
oe
ffic
ien
t
GJR
−G
AR
CH
(1
,1)
Estim
ate
s −
Th
e U
.S.
Sto
ck M
ark
et
Ind
ex
0.0
83
0.0
99
0.1
14
0.1
3
0.1
45
alpha
Jan−
06Ju
l−06
Jan−
07Ju
l−07
Jan−
08Ju
l−08
Jan−
09Ju
l−09
Jan−
10Ju
l−10
Jan−
11Ju
l−11
Jan−
12Ju
l−12
Jan−
13Ju
l−13
Jan−
14Ju
l−14
Jan−
15Ju
l−15
Jan−
16Ju
l−16
Jan−
17
Evo
lutio
n o
f 'A
RC
H' C
oe
ffic
ien
t
0.7
53
0.7
82
0.8
11
0.8
40
0.8
69
beta
Jan−
06Ju
l−06
Jan−
07Ju
l−07
Jan−
08Ju
l−08
Jan−
09Ju
l−09
Jan−
10Ju
l−10
Jan−
11Ju
l−11
Jan−
12Ju
l−12
Jan−
13Ju
l−13
Jan−
14Ju
l−14
Jan−
15Ju
l−15
Jan−
16Ju
l−16
Jan−
17
Evo
lutio
n o
f 'P
ers
ista
nce
' C
oe
ffic
ien
t
0.0
71
0.0
83
0.0
95
0.1
08
0.1
20
gamma
Jan−
06Ju
l−06
Jan−
07Ju
l−07
Jan−
08Ju
l−08
Jan−
09Ju
l−09
Jan−
10Ju
l−10
Jan−
11Ju
l−11
Jan−
12Ju
l−12
Jan−
13Ju
l−13
Jan−
14Ju
l−14
Jan−
15Ju
l−15
Jan−
16Ju
l−16
Jan−
17
Evo
lutio
n o
f 'A
sym
me
try' C
oe
ffic
ien
t
GJR
−G
AR
CH
(1
,1)
Estim
ate
s −
Th
e U
.S.
RE
ITs I
nd
ex
Figu
reB
.1:E
volu
tion
ofth
eG
JR-G
AR
CH
Proc
ess
-Dai
ly
42

Sto
ck M
arke
t &
RE
IT In
dic
es
Tre
nd
in
Co
rre
latio
ns
0.4
0
0.5
5
0.7
0
0.8
5
1.0
0
Correlation
Dec
−01 Ju
n−02 D
ec−0
2 Jun−
03 Dec
−03 Ju
n−04 D
ec−0
4 Jun−
05 Dec
−05 Ju
n−06 D
ec−0
6 Jun−
07 Dec
−07 Ju
n−08 D
ec−0
8 Jun−
09 Dec
−09 Ju
n−10 D
ec−1
0 Jun−
11 Dec
−11 Ju
n−12 D
ec−1
2 Jun−
13 Dec
−13 Ju
n−14 D
ec−1
4 Jun−
15 Dec
−15 Ju
n−16 D
ec−1
6
Sto
ck M
arke
t &
RE
IT In
dic
es
0.0
00
0.0
01
0.0
02
0.0
03
0.0
03
Covariance
Dec
−01 Ju
n−02 D
ec−0
2 Jun−
03 Dec
−03 Ju
n−04 D
ec−0
4 Jun−
05 Dec
−05 Ju
n−06 D
ec−0
6 Jun−
07 Dec
−07 Ju
n−08 D
ec−0
8 Jun−
09 Dec
−09 Ju
n−10 D
ec−1
0 Jun−
11 Dec
−11 Ju
n−12 D
ec−1
2 Jun−
13 Dec
−13 Ju
n−14 D
ec−1
4 Jun−
15 Dec
−15 Ju
n−16 D
ec−1
6
Sto
ck M
arke
t In
dex
0.0
10
0.0
21
0.0
33
0.0
44
0.0
55
Variance
Dec
−01 Ju
n−02 D
ec−0
2 Jun−
03 Dec
−03 Ju
n−04 D
ec−0
4 Jun−
05 Dec
−05 Ju
n−06 D
ec−0
6 Jun−
07 Dec
−07 Ju
n−08 D
ec−0
8 Jun−
09 Dec
−09 Ju
n−10 D
ec−1
0 Jun−
11 Dec
−11 Ju
n−12 D
ec−1
2 Jun−
13 Dec
−13 Ju
n−14 D
ec−1
4 Jun−
15 Dec
−15 Ju
n−16 D
ec−1
6
RE
IT In
dex
0.0
12
0.0
25
0.0
38
0.0
51
0.0
64
Variance
Dec
−01 Ju
n−02 D
ec−0
2 Jun−
03 Dec
−03 Ju
n−04 D
ec−0
4 Jun−
05 Dec
−05 Ju
n−06 D
ec−0
6 Jun−
07 Dec
−07 Ju
n−08 D
ec−0
8 Jun−
09 Dec
−09 Ju
n−10 D
ec−1
0 Jun−
11 Dec
−11 Ju
n−12 D
ec−1
2 Jun−
13 Dec
−13 Ju
n−14 D
ec−1
4 Jun−
15 Dec
−15 Ju
n−16 D
ec−1
6
Figu
reB
.2:T
urki
shR
EIT
s&
Stoc
kM
arke
tInd
ices
Con
ditio
nalC
orre
latio
n,C
ovar
ianc
e,an
dV
aria
nces
-Dai
lyT
his
figur
epr
esen
tstim
e-va
ryin
gco
rrel
atio
n,co
vari
ance
,and
vari
ance
seri
eses
timat
edw
ithG
JR-G
AR
CH
(1,1
)-A
DC
C(1
,1)M
odel
usin
gda
ilyda
tafr
om
Turk
ey.
43

Sto
ck M
arke
t &
RE
IT In
dic
es
Tre
nd
in
Co
rre
latio
ns
0.0
0
0.2
5
0.5
0
0.7
5
1.0
0
Correlation
Dec
−01 Ju
n−02 D
ec−0
2 Jun−
03 Dec
−03 Ju
n−04 D
ec−0
4 Jun−
05 Dec
−05 Ju
n−06 D
ec−0
6 Jun−
07 Dec
−07 Ju
n−08 D
ec−0
8 Jun−
09 Dec
−09 Ju
n−10 D
ec−1
0 Jun−
11 Dec
−11 Ju
n−12 D
ec−1
2 Jun−
13 Dec
−13 Ju
n−14 D
ec−1
4 Jun−
15 Dec
−15 Ju
n−16 D
ec−1
6
Sto
ck M
arke
t &
RE
IT In
dic
es
0.0
00
0.0
01
0.0
03
0.0
04
0.0
05
Covariance
Dec
−01 Ju
n−02 D
ec−0
2 Jun−
03 Dec
−03 Ju
n−04 D
ec−0
4 Jun−
05 Dec
−05 Ju
n−06 D
ec−0
6 Jun−
07 Dec
−07 Ju
n−08 D
ec−0
8 Jun−
09 Dec
−09 Ju
n−10 D
ec−1
0 Jun−
11 Dec
−11 Ju
n−12 D
ec−1
2 Jun−
13 Dec
−13 Ju
n−14 D
ec−1
4 Jun−
15 Dec
−15 Ju
n−16 D
ec−1
6
Sto
ck M
arke
t In
dex
0.0
05
0.0
18
0.0
31
0.0
44
0.0
58
Variance
Dec
−01 Ju
n−02 D
ec−0
2 Jun−
03 Dec
−03 Ju
n−04 D
ec−0
4 Jun−
05 Dec
−05 Ju
n−06 D
ec−0
6 Jun−
07 Dec
−07 Ju
n−08 D
ec−0
8 Jun−
09 Dec
−09 Ju
n−10 D
ec−1
0 Jun−
11 Dec
−11 Ju
n−12 D
ec−1
2 Jun−
13 Dec
−13 Ju
n−14 D
ec−1
4 Jun−
15 Dec
−15 Ju
n−16 D
ec−1
6
RE
IT In
dex
0.0
05
0.0
33
0.0
60
0.0
88
0.1
15
Variance
Dec
−01 Ju
n−02 D
ec−0
2 Jun−
03 Dec
−03 Ju
n−04 D
ec−0
4 Jun−
05 Dec
−05 Ju
n−06 D
ec−0
6 Jun−
07 Dec
−07 Ju
n−08 D
ec−0
8 Jun−
09 Dec
−09 Ju
n−10 D
ec−1
0 Jun−
11 Dec
−11 Ju
n−12 D
ec−1
2 Jun−
13 Dec
−13 Ju
n−14 D
ec−1
4 Jun−
15 Dec
−15 Ju
n−16 D
ec−1
6
Figu
reB
.3:U
.S.R
EIT
&St
ock
Mar
ketI
ndic
esC
ondi
tiona
lCor
rela
tion,
Cov
aria
nce,
and
Var
ianc
es-D
aily
Thi
sta
ble
pres
ents
time-
vary
ing
corr
elat
ion,
cova
rian
ce,a
ndva
rian
cese
ries
estim
ated
with
GJR
-GA
RC
H(1
,1)-
AD
CC
(1,1
)Mod
elus
ing
daily
data
from
the
U.S
.
44

Appendix C: Cyclical Variation
This section reports the cyclical behaviour of the correlation. We adjust Equation 7 by including
a dummy variable indicating the first half of each year. We make a further adjustment to the
equation by interacting MktCap and Div.Payout variables. We include this interaction variable to
test whether the effect of dividend payout policy on the correlation changes with the market size of
REITs.
The cyclical behaviour of the correlation and the effect of dividend payout on the correlation
across market size is investigated using the following equation:
CORRt = ω+θ1Trendt+θ2Div.Payout+θ3MktCapt+θ4FDI+θ51stHalf+θ62008+ξi,t
(C.1)
where 1stHalf is a dummy variable that is equal to one for the first half of the year (Jan - Jun)
and is zero otherwise. Additionally, we include another dummy variable indicating the 2008 crisis.
This variable is included to examine whether the correlations increase during the crisis period. A
positive coefficient estimate would indicate an increase in the correlation process with the crisis.
Parameter estimates of Equation C.1 are given in Table C.1. First, we note that coefficient
estimates of Trend and Div.Payout variables, in most cases, remain qualitatively similar to the
estimates given in Tables 3 and 4 with the addition of 1stHalf and 2008 dummy variables into
the regression. The table confirms the cyclical variation that was suspected in daily correlation
series. The positive coefficient estimates of the 1stHalf variable in Turkey indicates that the time-
varying correlation is higher in the first half of the year (from January to June) while the correlation
between the U.S. markets is lower in the first half of the year as indicated by the negative coefficient
estimate. Further, the estimates of 2008 are positive and significant in almost all cases. The positive
estimate of the θ6 means that the correlations between the two asset classes increased during the
2008 crisis in both countries and in all data frequencies considered in this paper.
45
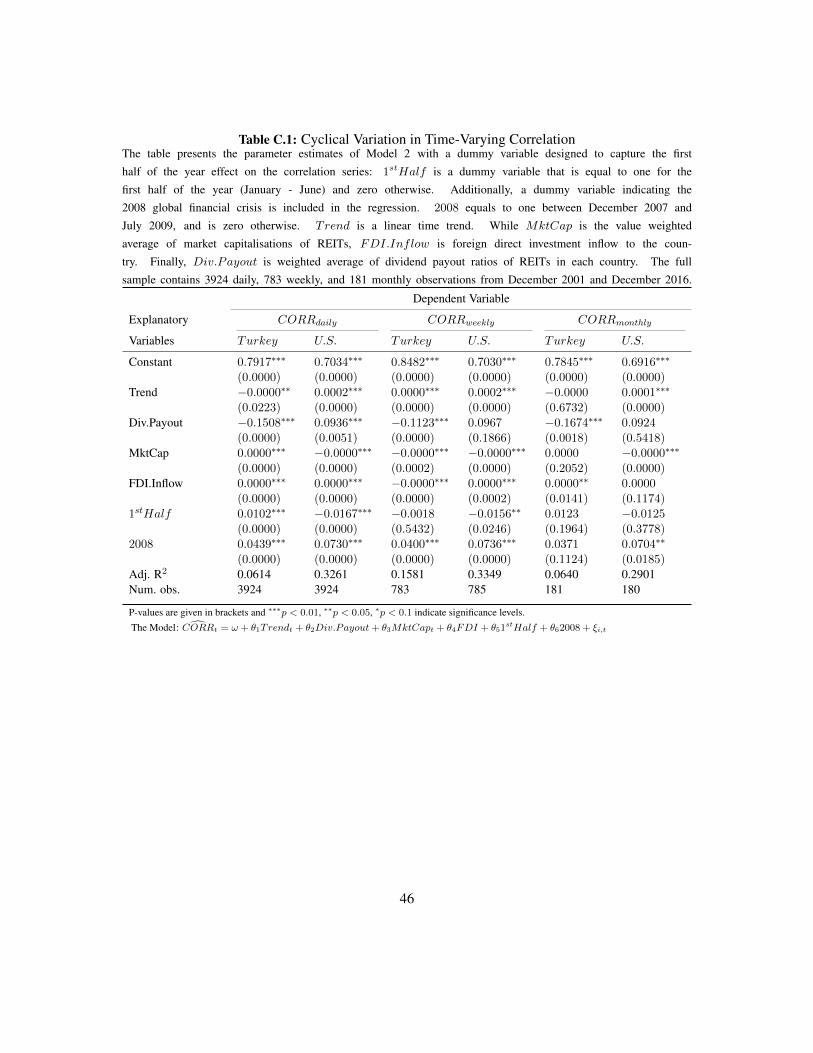
Table C.1: Cyclical Variation in Time-Varying CorrelationThe table presents the parameter estimates of Model 2 with a dummy variable designed to capture the first
half of the year effect on the correlation series: 1stHalf is a dummy variable that is equal to one for the
first half of the year (January - June) and zero otherwise. Additionally, a dummy variable indicating the
2008 global financial crisis is included in the regression. 2008 equals to one between December 2007 and
July 2009, and is zero otherwise. Trend is a linear time trend. While MktCap is the value weighted
average of market capitalisations of REITs, FDI.Inflow is foreign direct investment inflow to the coun-
try. Finally, Div.Payout is weighted average of dividend payout ratios of REITs in each country. The full
sample contains 3924 daily, 783 weekly, and 181 monthly observations from December 2001 and December 2016.
Dependent Variable
Explanatory CORRdaily CORRweekly CORRmonthly
Variables Turkey U.S. Turkey U.S. Turkey U.S.
Constant 0.7917∗∗∗ 0.7034∗∗∗ 0.8482∗∗∗ 0.7030∗∗∗ 0.7845∗∗∗ 0.6916∗∗∗
(0.0000) (0.0000) (0.0000) (0.0000) (0.0000) (0.0000)Trend −0.0000∗∗ 0.0002∗∗∗ 0.0000∗∗∗ 0.0002∗∗∗ −0.0000 0.0001∗∗∗
(0.0223) (0.0000) (0.0000) (0.0000) (0.6732) (0.0000)Div.Payout −0.1508∗∗∗ 0.0936∗∗∗ −0.1123∗∗∗ 0.0967 −0.1674∗∗∗ 0.0924
(0.0000) (0.0051) (0.0000) (0.1866) (0.0018) (0.5418)MktCap 0.0000∗∗∗ −0.0000∗∗∗ −0.0000∗∗∗ −0.0000∗∗∗ 0.0000 −0.0000∗∗∗
(0.0000) (0.0000) (0.0002) (0.0000) (0.2052) (0.0000)FDI.Inflow 0.0000∗∗∗ 0.0000∗∗∗ −0.0000∗∗∗ 0.0000∗∗∗ 0.0000∗∗ 0.0000
(0.0000) (0.0000) (0.0000) (0.0002) (0.0141) (0.1174)1stHalf 0.0102∗∗∗ −0.0167∗∗∗ −0.0018 −0.0156∗∗ 0.0123 −0.0125
(0.0000) (0.0000) (0.5432) (0.0246) (0.1964) (0.3778)2008 0.0439∗∗∗ 0.0730∗∗∗ 0.0400∗∗∗ 0.0736∗∗∗ 0.0371 0.0704∗∗
(0.0000) (0.0000) (0.0000) (0.0000) (0.1124) (0.0185)Adj. R2 0.0614 0.3261 0.1581 0.3349 0.0640 0.2901Num. obs. 3924 3924 783 785 181 180
P-values are given in brackets and ∗∗∗p < 0.01, ∗∗p < 0.05, ∗p < 0.1 indicate significance levels.
The Model: CORRt = ω + θ1Trendt + θ2Div.Payout+ θ3MktCapt + θ4FDI + θ51stHalf + θ62008 + ξi,t
46
Recommended