Distr ibution of Gains from Cattle Development in a Multi-Stage Production System: The Case of the Bali Beef Industry
I Gusti Agung Ayu Ambarawatia, Xueyan Zhaob, Garry Griffithac, and
Roley Piggotta*
ABSTRACT
Beef production in Bali is dominated by smallholders, just like the majority of Indonesian
agriculture. A wide range of policies has been implemented to enhance development of the
Bali beef industry. Knowledge about the distribution of the returns from the development of
the cattle industry, including marketing, informs decision making. This paper examines the
benefits from cattle development in a multi-stage production representation of the Bali beef
industry using equilibrium displacement modelling (EDM). Benefits are measured as
changes in economic surplus. The distribution of benefits among farmers, processors and
retailers is also examined.
Key words: beef production, government policy, EDM, economic surplus.
Paper presented to the 47th Annual Conference of the Australian Agr icultural and
Resource Economics Society, Fremantle, Per th, Australia
11 – 14 February 2003
* a School of Economics, University of New England, Armidale, NSW 2351; b Department of Econometrics and
Business Statistics, Monash University, Clayton, VIC 3800 ; c NSW Agriculture Beef Industry Centre,
University of New England, Armidale, NSW 2351.
2
Introduction
Changes in food consumption patterns in Indonesia resulting from increases in income,
urbanisation and population growth have led to changes in Indonesian agricultural production
and trade. There have been some attempts to improve productive capacity, but in many cases
such as beef cattle, production has not been able to keep pace with the increase in
consumption, encouraging imports of live cattle and beef products. Smallholder farms using
basic technology with relatively low levels of productivity dominate beef production, just like
the majority of the Indonesian agriculture.
In an attempt to improve the productivity of the traditional beef sector, the Indonesian
government has set out a wide range of policies to enhance development. The most notable
development program is the Beef Nucleus-Estate Smallholder (Beef NES) scheme which was
implemented in 1980. This scheme was aimed to provide smallscale farmers with capital and
to transfer technology. The government has also encouraged the involvement of the private
sector in the feedlot system using imported feeder cattle. However, the impact of the financial
crisis in mid 1997 made imports more expensive and highlighted the problem of a heavy
reliance on imports. The Government policy since the financial crisis has focussed on
optimising the utilisation of local resources.
Two more recent schemes in cattle development are the Food Safety Credit (Kredit
Ketahanan Pangan/KKP) and the Food Safety Project (Proyek Ketahanan Pangan/PKP).
The broad objective of the schemes is to increase smallholds’ income by improving their
productivity. In addition, the schemes are expected to provide higher quality beef through the
implementation of improved technology such as better nutrition, artificial breeding
technology and better management (see Ambarawati et al. 2002 for details).
The island of Bali is one of the cattle producing areas for Indonesia. An indigenous
Indonesian cattle breed, Bali cattle (Bos sondaicus), is kept pure on the island of Bali despite
the wide spread of this breed throughout the country. This policy was enacted to maintain and
improve domestic animal genetic resources. Bali cattle are known for their desirable traits.
These include good adaptation to arid conditions, high fertility and good meat production.
They are highly efficient in producing lean with a low fat percentage beef (Masudana 1990).
3
There are no cattle imported into Bali due to the absolute protection of Bali cattle. However,
cattle from Bali are highly demanded outside Bali, especially in Jakarta. DPPB (2000) noted
that about 60 per cent of cattle traded in Bali are sent off the island. The island is also known
for its extensive tourist sector. Frozen and chilled beef are imported to fulfil the tourist
demand. This imported beef competes with the local beef in the tourist sector.
The Bali government has put in place policies for developing this indigenous cattle breed to
increase inter-island cattle trade and to improve beef quality to compete with imported beef.
A wide range of policies has been implemented to enhance development of Bali cattle
including feed supplementation programs, artificial insemination programs and subsidised
credit, as well as the national policies mentioned above (Beef NES, KKP and PKP).
However, adding value to livestock through marketing seems to be of little concern.
Moreover, the implementation of local autonomy policies and budget self-reliance at the
beginning 2001 has encouraged the Bali government to develop local resources such as cattle.
Previous studies of the Bali cattle industry were mainly concerned with the physical
productivity of the breed such as feed conversion and carcass weight, and there are very few
policy evaluation analyses of the beef sector. Ambarawati et al. (2002) assessed the impact
of cattle development schemes on farm performance in Bali, but they did not include any
links to the marketing sectors. Knowledge about the distribution of the returns from the
development of the cattle industry, including marketing, informs decision making.
The objective of this paper is to develop an economic model of the Bali beef industry to
simulate various policies and other exogenous changes. The impact of these changes on
various industry groups such as smallholders, processor and consumers, can be estimated in
terms of their welfare changes. In addition, this paper also models the impact of the Bali
bombings in October 2002 on the Bali beef sector. The Bali bombings have caused the tourist
industry to collapse and this impact has been passed down to the demand for local and
imported beef.
4
The Bali Beef Industry
The Bali beef industry in this study refers to beef industry on the geographical entity, Bali
island (also the Province of Bali). The Bali beef industry involves multiple markets and
marketing stages. Demand for beef in Bali comes from two different markets: the wet and
higher end markets. The higher end market is also known as the HRI (hotel, restaurant and
institutional) market. Demand for fresh beef at the wet market comes from the local
population, while frozen and chilled beef are demanded to satisfy the star-rated hotels,
selected supermarkets and catering companies. The quality of beef going to the wet market is
not as well graded as the beef supplied to the HRI market. The wet market, which comprises
some 80 per cent of the total beef demand in Bali, is fully supplied by Bali beef. On the other
hand, the Bali HRI market is currently satisfied by both Bali beef and imported beef. Before
the financial crisis in mid 1997, imported beef dominated beef supply to the HRI market and
Bali beef accounted for only a small amount of the total beef demand. However, since the
financial crisis Bali beef has increasingly been accepted to fulfil demand from the HRI
market. Bali beef is now a substitute for imported beef in the HRI market. However,
imported beef is not a substitute for Bali beef in the wet market because of preference and
quality differences.
Beef production for the wet market
Beef processing for the wet market in Bali is undertaken by public abattoirs. Retailers at the
wet market cut the carcasses and sell to final consumers. Beef cuts at the wet market are not
well-graded as the consumers seem to be indifferent to beef quality. Carcass production from
public abattoirs is derived solely from Bali cattle.
In terms of cattle requirements for slaughtering, there are no specific standards of cattle such
as weight and age for carcass production at public abattoirs. However, the weight of cattle
sold at cattle markets for this market is usually above 300 kg. There is no specification of a
production system for cattle in Bali for different purposes such as for wet or HRI markets.
Cattle are usually grazed on public fields or maintained under a shed by smallscale farmers.
Cattle are sometimes fed with feed supplementation such as rice bran. Heavier cattle are
5
usually selected for the higher end market and for the inter-island trade owing to better
quality.
Beef production for the HRI market
Bali beef production for the HRI market is a different process from the wet market
production in terms of cattle selection, processing and marketing phases. Bali beef for the
HRI market comes from carcass production from private slaughtering houses. The carcasses
produced from private abattoirs are of higher quality to meet retailers’ demand. Certain
criteria are usually used for carcass production such as carcass weight and its composition
(percentage muscle, bone and fatty tissue). Retailers and packers at the HRI market cut and
trim the carcasses and sell to the consumers. Beef cuts at the HRI market are graded to meet
consumers’ requirements.
Cattle are selected at the market by private abattoir operators to obtain higher quality
carcasses. This selection is mainly based on physical appearance and cattle weight. The
average cattle weight for the HRI market is 375 kg. Some private slaughtering houses have
their own cattle contracts with farmers so they can control their cattle weight and quality.
While carcasses produced from private abattoirs are mainly directed to the HRI market, by-
products and off-cuts of these carcasses are sold to the wet market. It is estimated that 20 per
cent of total carcass production from private abattoirs are sent to the wet market. Hence,
carcass production from private abattoirs has a multi-output production function. The main
difference between private abattoirs and the public abattoirs is in the processing facilities.
Private abattoir operations are more mechanised than public slaughtering houses to meet
certain grading criteria.
Bali beef competes with imported beef at the HRI market. Hence, the link between the Bali
beef and imported beef at the HRI market should be considered in developing the conceptual
model. Also, the inter-island cattle trade to the rest of Indonesia market (ROI) should be
included in a conceptual model of the Bali cattle market.
Although Bali cattle are sold to different markets, there are no specific cattle producers for
each market. All cattle traded come from the same smallholder producers without any
6
product specification. Cattle are valued based on their liveweights with the same price per
kilogram live weight.
This review of the Bali beef industry will assist the development of a conceptual model of
the industry. A disaggregated model along both horizontal and vertical lines is required to
capture policy changes occurring in the different markets.
A Conceptual Model of the Bali Beef Industry
The Bali beef industry is disaggregated into a horizontal and vertical structure to examine the
benefits of government policies and research that occurs in various industry sectors and
markets, as well as the distribution of benefits among different industry groups. Horizontally,
the market is segmented based on the type of beef demanded: wet and HRI markets.
Vertically, beef production and marketing are disaggregated into cattle supply, processing,
marketing and consumption. This segmentation enables separate analyses of various policies
at different stages of marketing. Inputs other than the cattle input are treated as a general
‘marketing input’ in all sectors.
The demand for imported beef at the HRI market is included in this segmentation. The
quantity of imported beef is treated as an endogenous variable in the model, but the price of
imported beef is treated as an exogenous variable. As Indonesia is not a major player in beef
imports in the world market, it is considered that the supply of imported beef is perfectly
elastic. On the other hand, the demand for imported beef is assumed to be downward sloping.
The model also includes the rest of Indonesia (ROI) market in order to capture the impacts of
inter-regional trade on Bali cattle production. It is believed that any changes in beef demand
outside Bali will affect cattle production in Bali. The Bali geographical market and the ROI
market are linked through quantity of cattle traded and the cattle price. Any policy changes
occurring in the ROI market is treated as an exogenous shifter to the Bali cattle production.1
1 A larger version of the model is also available where the ROI sector is fully endogenous. However, given the
relative sizes of the beef markets in the two geographic sectors, little extra information is provided by using this
version.
7
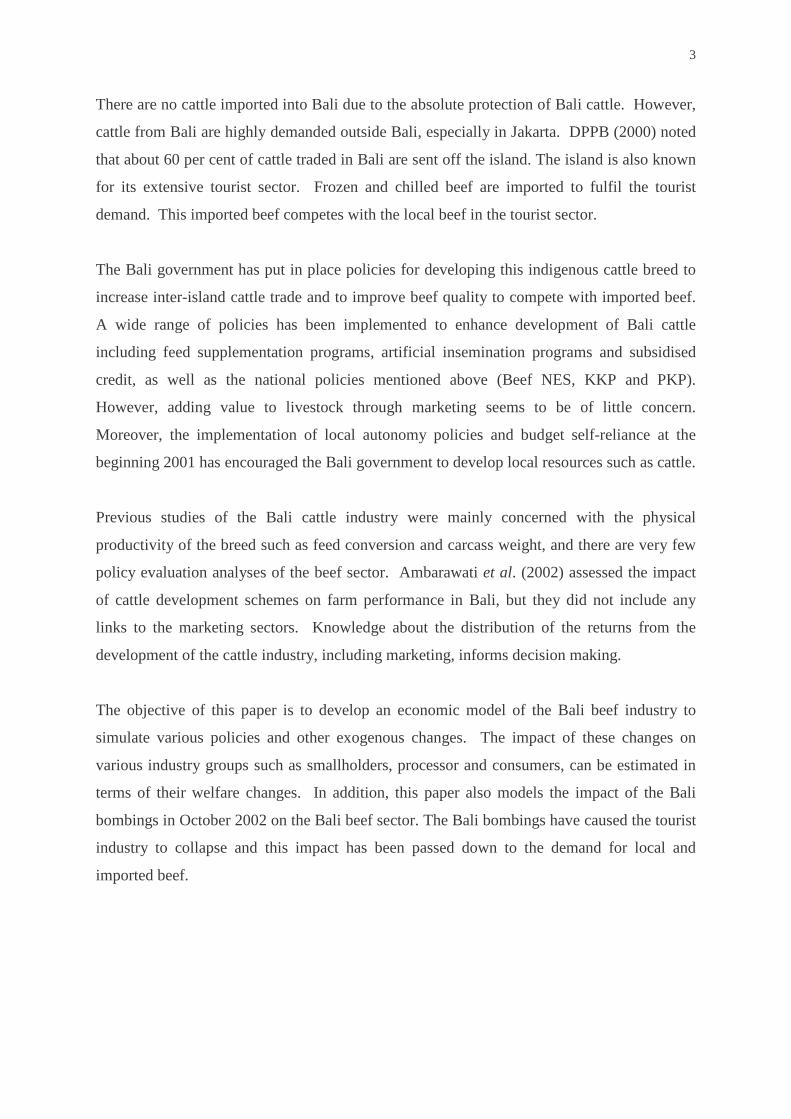
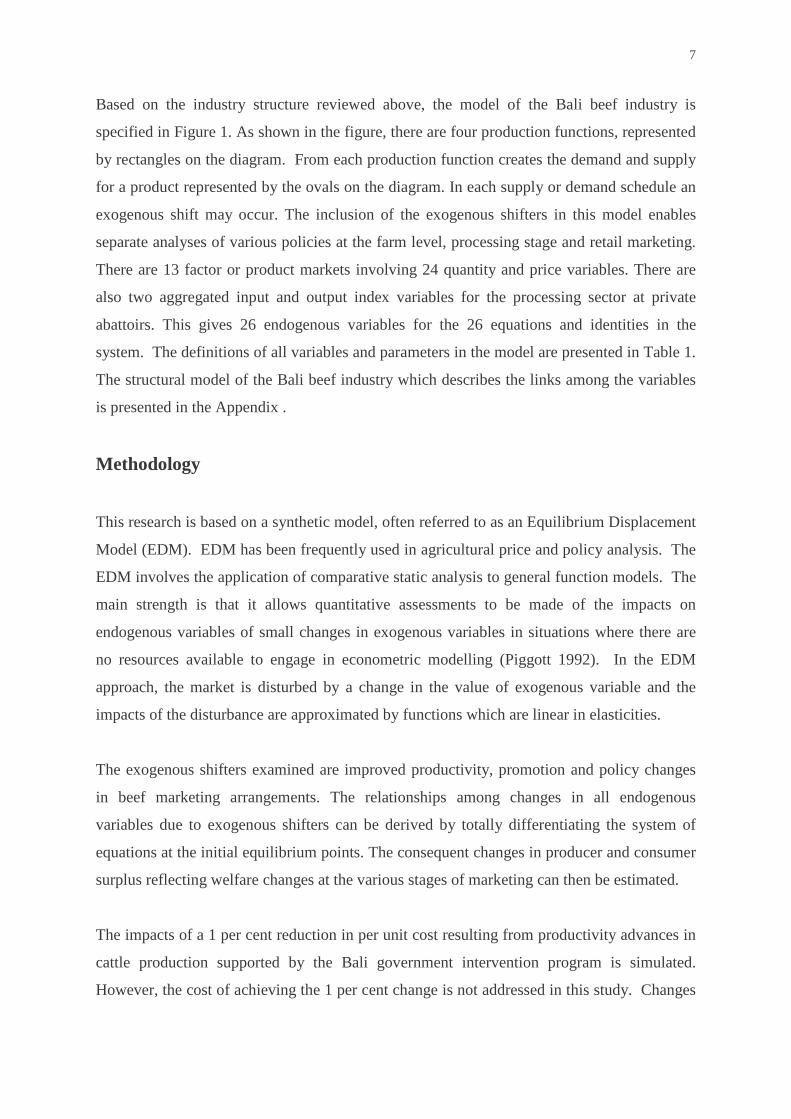
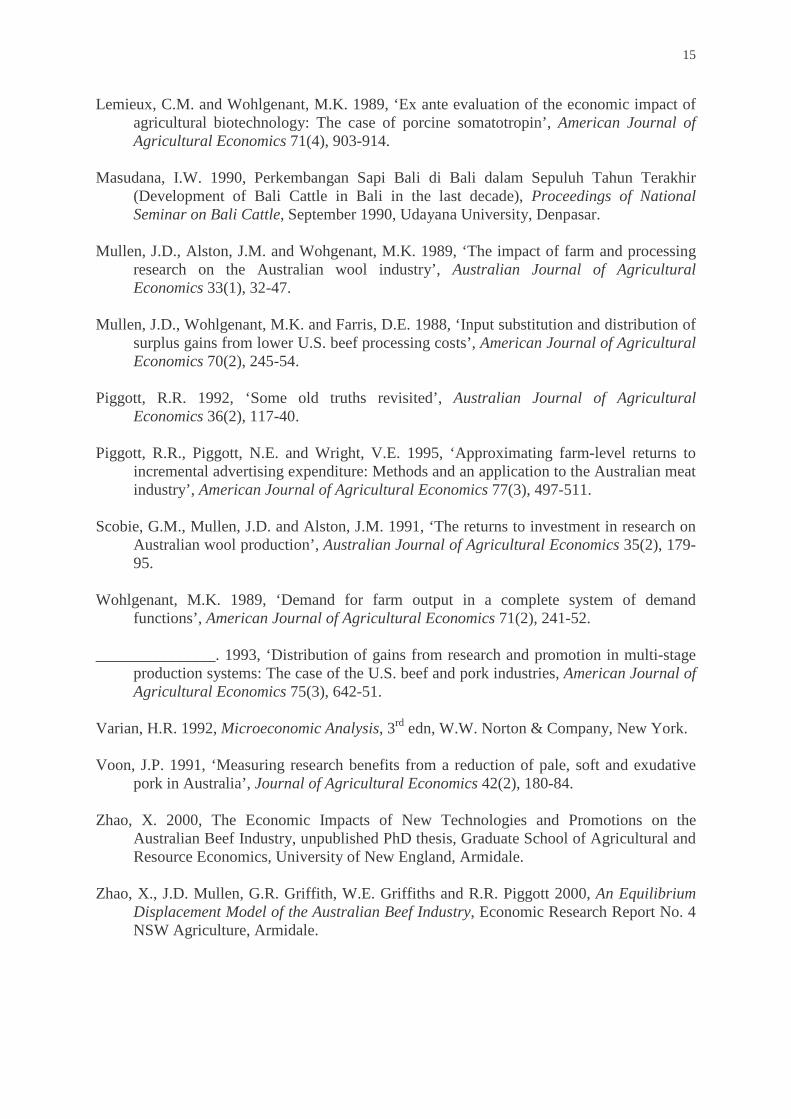
Based on the industry structure reviewed above, the model of the Bali beef industry is
specified in Figure 1. As shown in the figure, there are four production functions, represented
by rectangles on the diagram. From each production function creates the demand and supply
for a product represented by the ovals on the diagram. In each supply or demand schedule an
exogenous shift may occur. The inclusion of the exogenous shifters in this model enables
separate analyses of various policies at the farm level, processing stage and retail marketing.
There are 13 factor or product markets involving 24 quantity and price variables. There are
also two aggregated input and output index variables for the processing sector at private
abattoirs. This gives 26 endogenous variables for the 26 equations and identities in the
system. The definitions of all variables and parameters in the model are presented in Table 1.
The structural model of the Bali beef industry which describes the links among the variables
is presented in the Appendix .
Methodology
This research is based on a synthetic model, often referred to as an Equilibrium Displacement
Model (EDM). EDM has been frequently used in agricultural price and policy analysis. The
EDM involves the application of comparative static analysis to general function models. The
main strength is that it allows quantitative assessments to be made of the impacts on
endogenous variables of small changes in exogenous variables in situations where there are
no resources available to engage in econometric modelling (Piggott 1992). In the EDM
approach, the market is disturbed by a change in the value of exogenous variable and the
impacts of the disturbance are approximated by functions which are linear in elasticities.
The exogenous shifters examined are improved productivity, promotion and policy changes
in beef marketing arrangements. The relationships among changes in all endogenous
variables due to exogenous shifters can be derived by totally differentiating the system of
equations at the initial equilibrium points. The consequent changes in producer and consumer
surplus reflecting welfare changes at the various stages of marketing can then be estimated.
The impacts of a 1 per cent reduction in per unit cost resulting from productivity advances in
cattle production supported by the Bali government intervention program is simulated.
However, the cost of achieving the 1 per cent change is not addressed in this study. Changes
8
in prices and quantities in all markets due to this exogenous shift are estimated, and
consequent changes in producer and consumer surplus in the relevant markets are presented.
Furthermore, alternative scenarios of exogenous shifters resulting from increased efficiencies
and policy changes in different industry sectors are simulated. Finally, a scenario of a
reduction in HRI beef demand resulting from the impact of the Bali bombing is simulated.
Comparisons of welfare changes among different scenarios are conducted.
Data Requirements
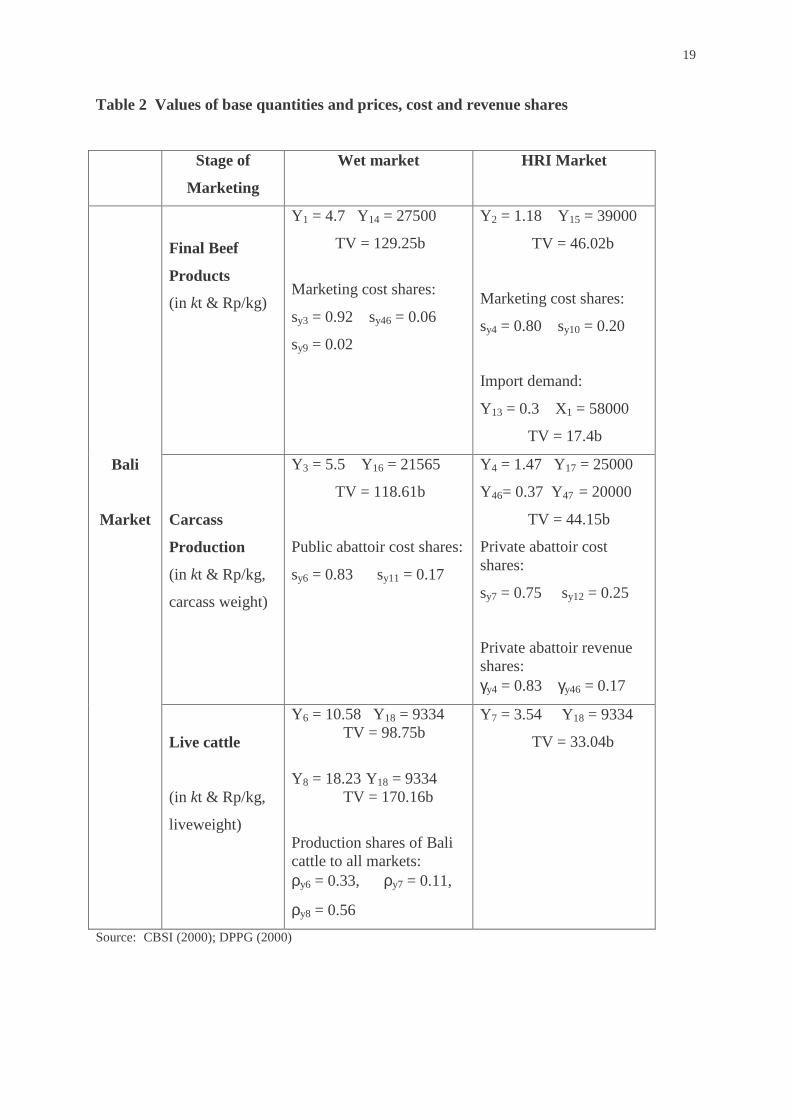
Operation of the EDM requires three different sets of information. Firstly, base price and
quantity values are needed for all endogenous variables to portray the base equilibrium status
of the system. Secondly, various elasticity values are needed. Finally, values all exogenous
shifters are needed to quantify the impact of policy changes at different levels of marketing.
The availability of data is very limited. The Central Bureau of Statistics of Indonesia (CBSI)
and the Directorate General of Livestock Services (DGLS) provide annual data on beef
production for all provinces in Indonesia, measured in kilotons carcass weight. However,
there is no published information on final beef products such as the quantity of beef entering
the wet and HRI markets respectively. Information on the quantities of carcass produced from
public and private abattoirs is also lacking. Hence, assumptions are made on the proportion
of carcasses produced at different abattoirs and beef produced for the wet and HRI markets
based on the information provided by DGLS staff, Bali Regional Livestock Services staff and
other industry agencies. Considerable effort has been made in this study to assemble a set of
equilibrium quantities and prices at different stages. These include a survey of public and
private abattoirs, hotels and restaurants in Bali to obtain the required information. A
combination of published information and the survey information has been used to estimate
the data required at the different levels and market segments.
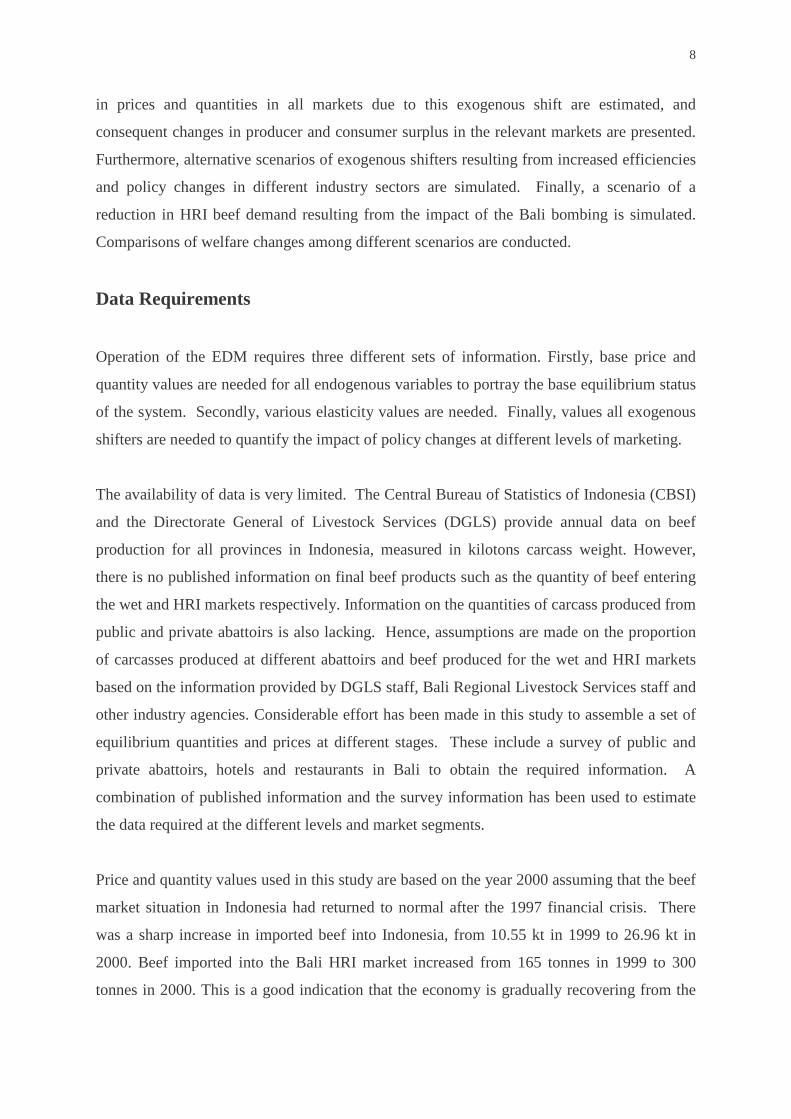
Price and quantity values used in this study are based on the year 2000 assuming that the beef
market situation in Indonesia had returned to normal after the 1997 financial crisis. There
was a sharp increase in imported beef into Indonesia, from 10.55 kt in 1999 to 26.96 kt in
2000. Beef imported into the Bali HRI market increased from 165 tonnes in 1999 to 300
tonnes in 2000. This is a good indication that the economy is gradually recovering from the
9
financial crisis. Values of base equilibrium quantities and prices for all endogenous variables
including the cost and revenue shares for all sectors are presented in Table 2.
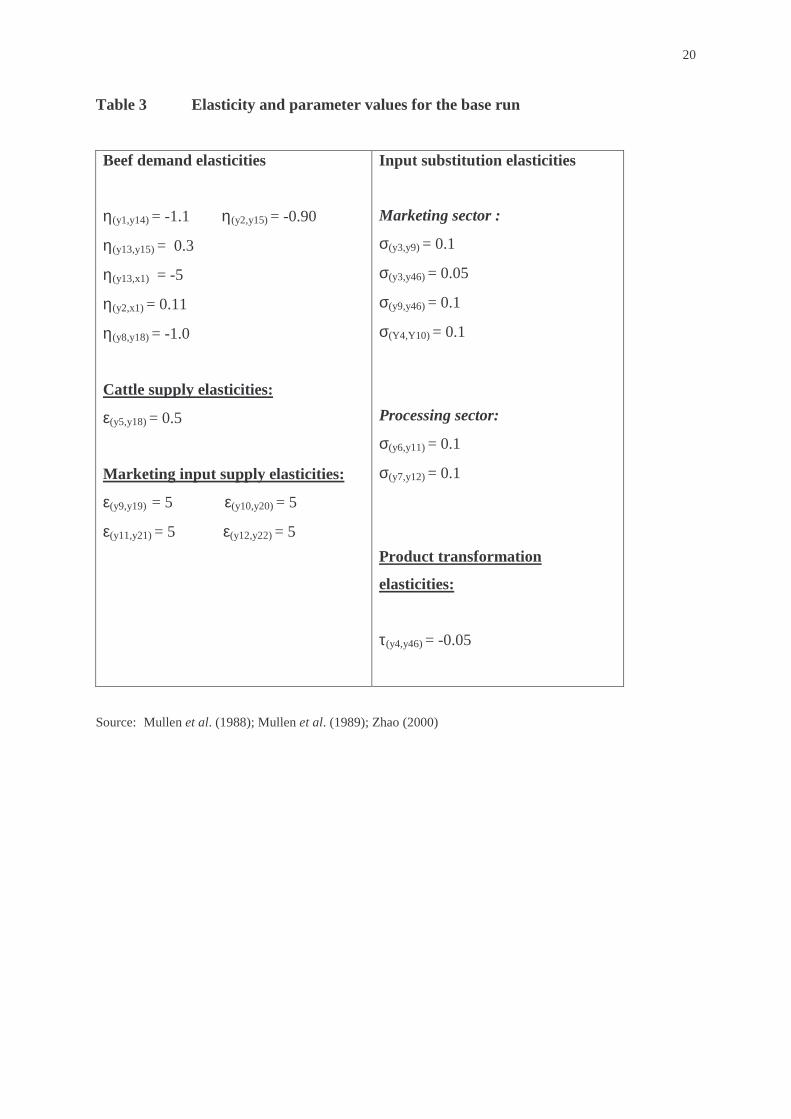
Market parameters required in the model include the elasticity values of various beef demand
and input supplies, input substitution and product transformation. Parameter values are
selected on the basis of economic theory, past studies of the beef industry and intuition. The
values of market parameters are presented in Table 3.
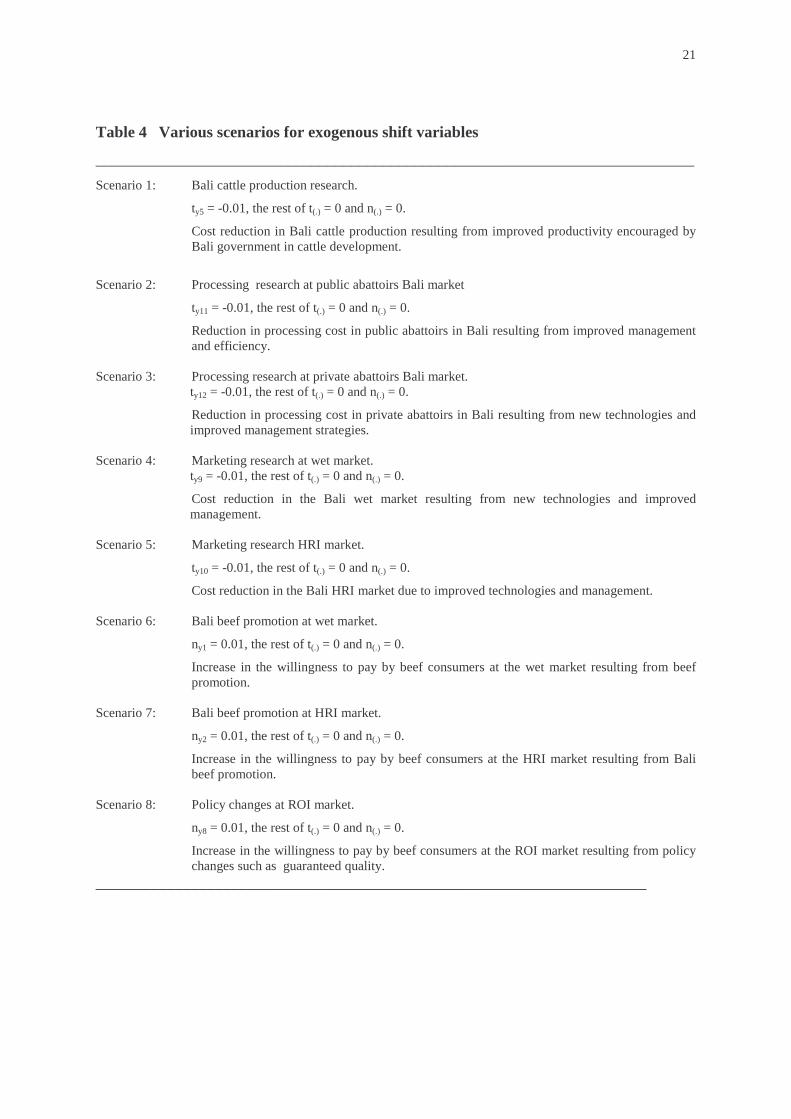
There are eight exogenous shift variables in this study allowing different scenarios resulting
from different policies and research in the Bali beef industry to be examined. Improved
productivity of cattle production and increased efficiencies in processing and marketing
sectors are modelled as reducing cost of production in the relevant sectors. This can be seen
as an outward or downward supply shift. Beef promotion in the Bali market and policy
changes in the ROI market are modelled as an outward shift in demand. Equal 1 per cent
vertical shifts in the relevant supply and demand curves are assumed for all eight main
scenarios. This allows for the simulation of the impacts of 1 per cent cost reductions in
different production, processing and marketing sectors as well as 1 per cent increase in
consumer’s willingness to pay at the final stage of the products. These are explained in Table
4. The incidence of the Bali bombings is modelled as an inward shift of the demand curve for
beef at the HRI market.
Returns from Alternative Cattle Development Policies
Having specified initial prices and quantities and market elasticities, the resulting percentage
changes in all prices and quantities are calculated by simulating the model described in the
Appendix for each of the scenarios described in Table 4. Using the changes in prices and
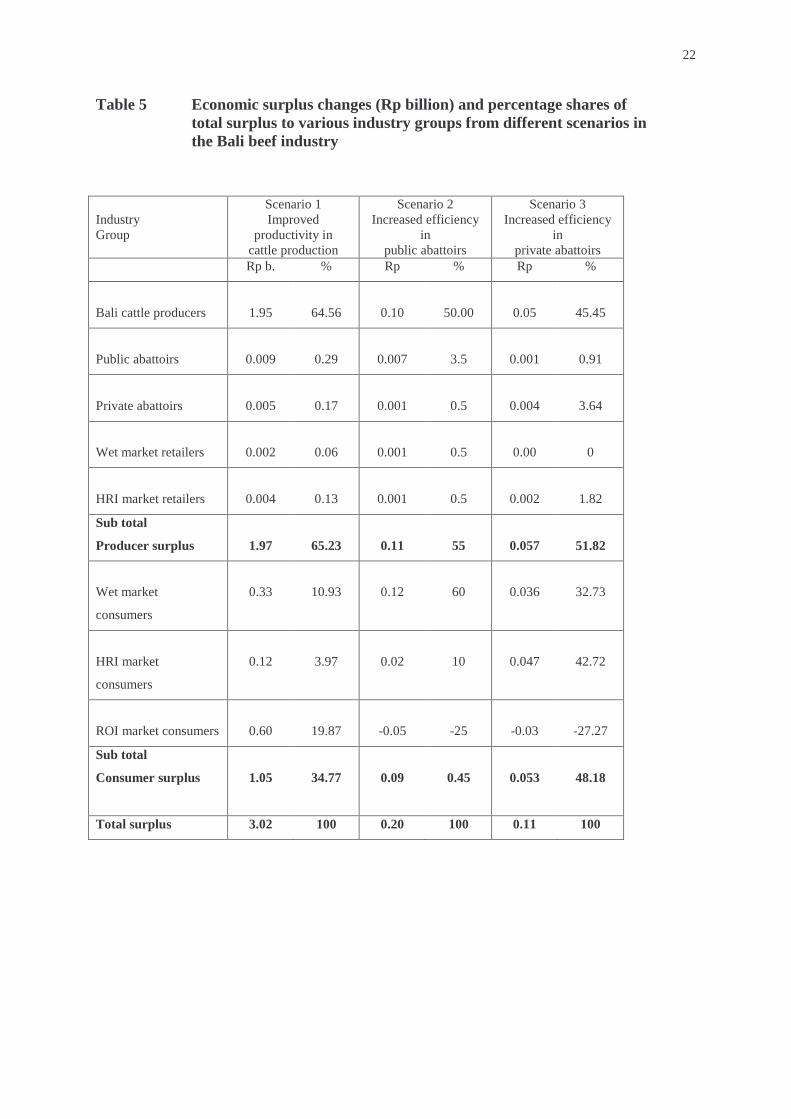
quantities, the changes in economic surplus for the various groups are calculated. The results
of the total welfare changes and their distribution among industry groups such as cattle
producers, processors, retailers and consumers for each of the eight scenarios are presented in
Table 5.
Some prerequisite of the results should be noticed before any comparison is undertaken. This
study relates to equal 1 per cent exogenous shifts in the relevant supply and demand curves
10
but the costs required to bring about 1 per cent shift is not addressed here. Therefore, the
monetary benefits from alternative scenarios in Table 5 are only comparable under the
assumption of equal investment efficiency, in the sense that the investment costs of the 1 per
cent shifts in all sectors are the same. This indeed is unlikely to be true in reality. Issues
regarding the efficiency of investments have been discussed by a number of authors include
Lemieux and Wohlgenant (1989), Scobie et al. (1991) and Zhao (2000). Zhao (2000) also
pointed out that despite the same amount of investments at different points of the industry
may cause demand and supply shifts of different magnitudes, and despite the actual returns in
monetary terms are dependent on the magnitudes of the initial shifts, the distribution of the
total benefits among industry groups is independent of the size of the initial shift.
Accordingly, it is always worthwhile to compare shares of benefits among alternative
investment scenarios without knowledge of the efficiency of research investment.
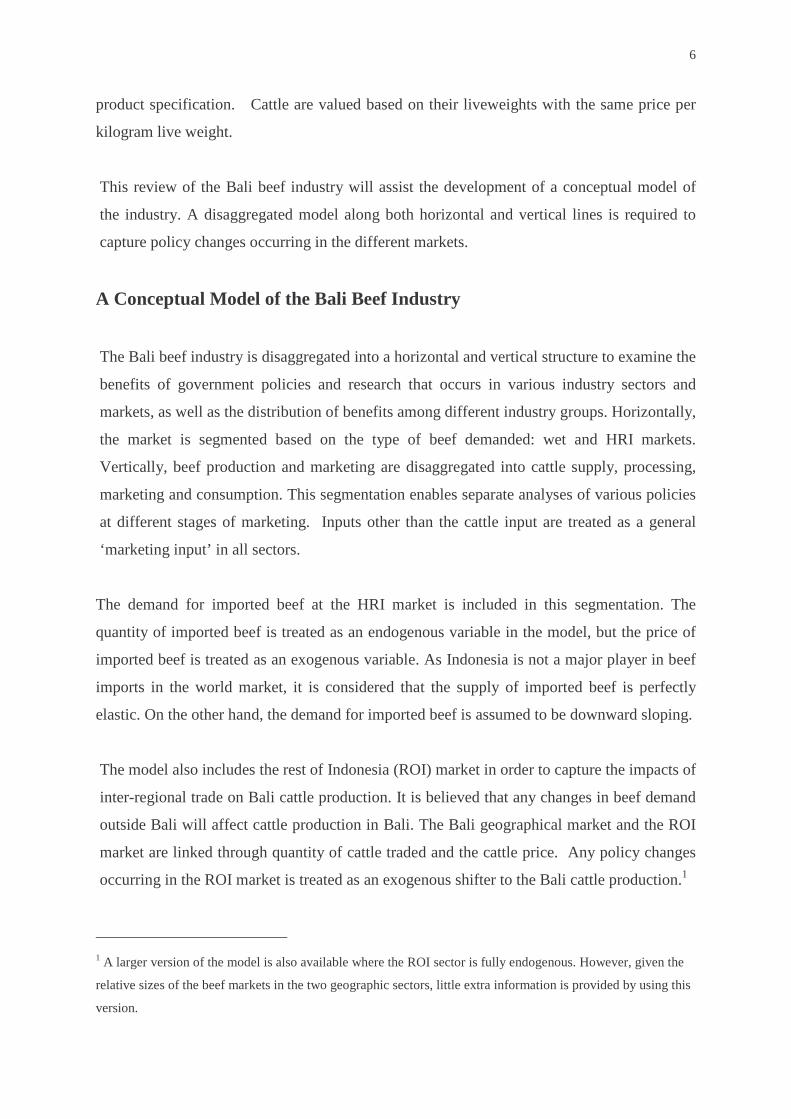
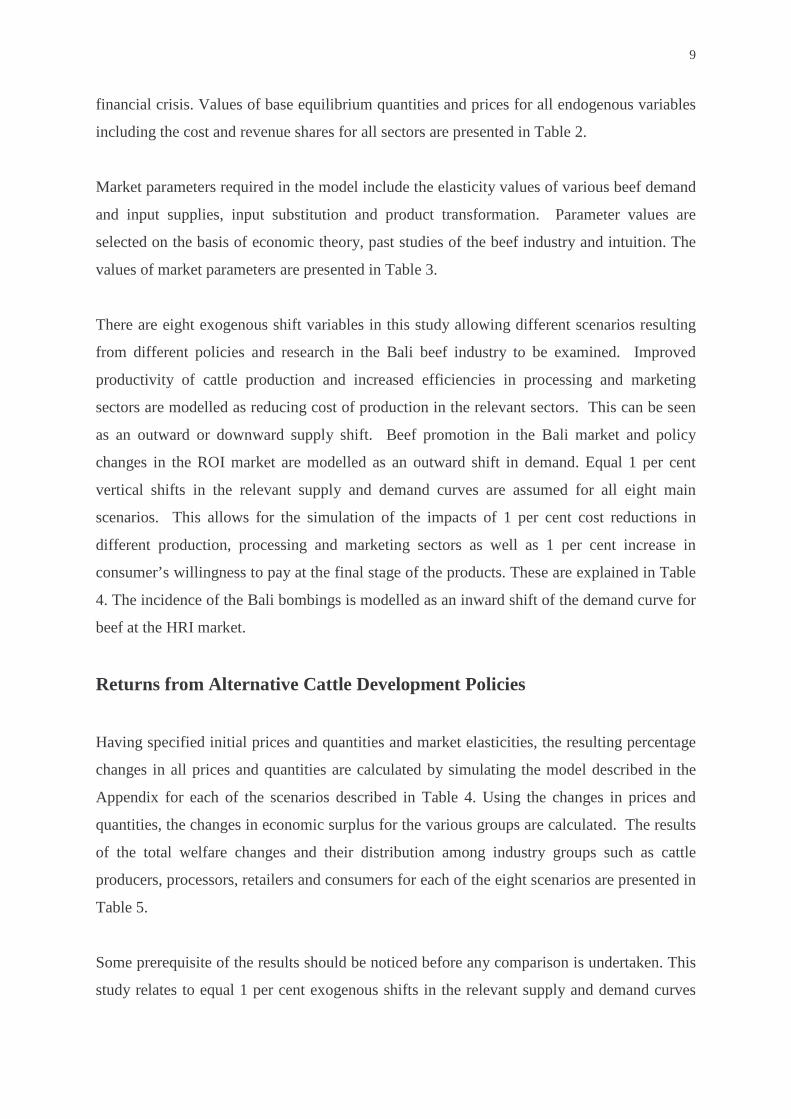
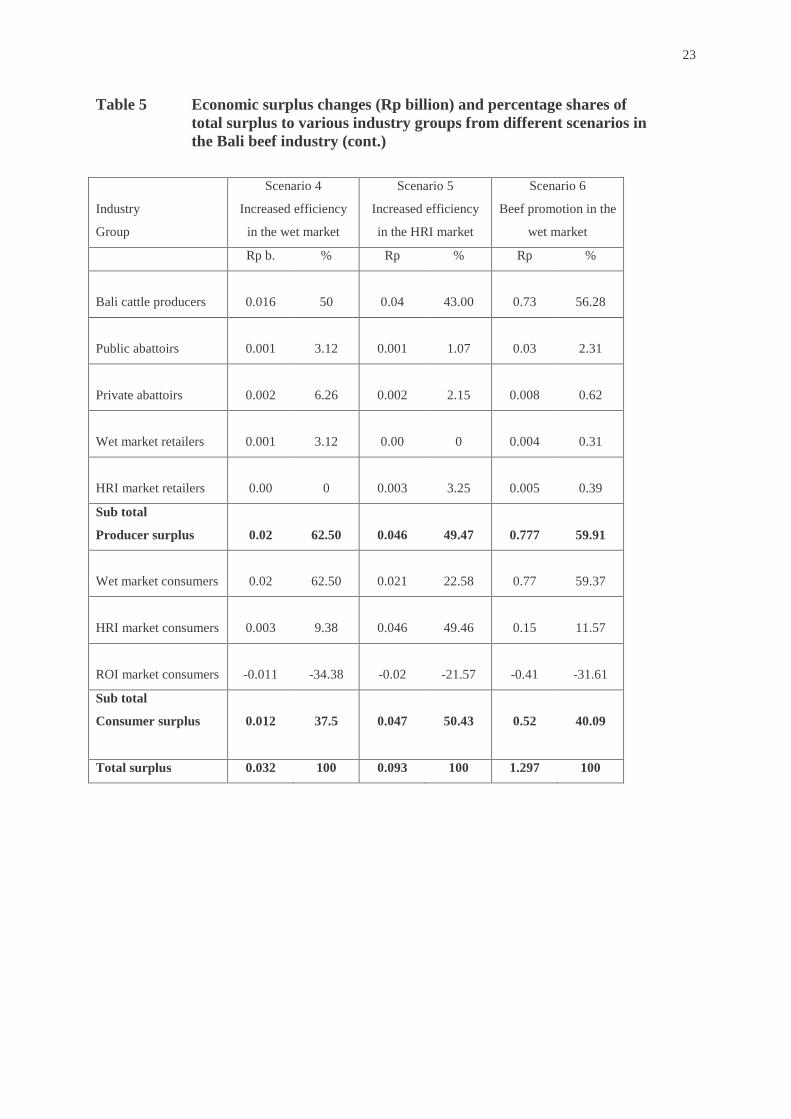
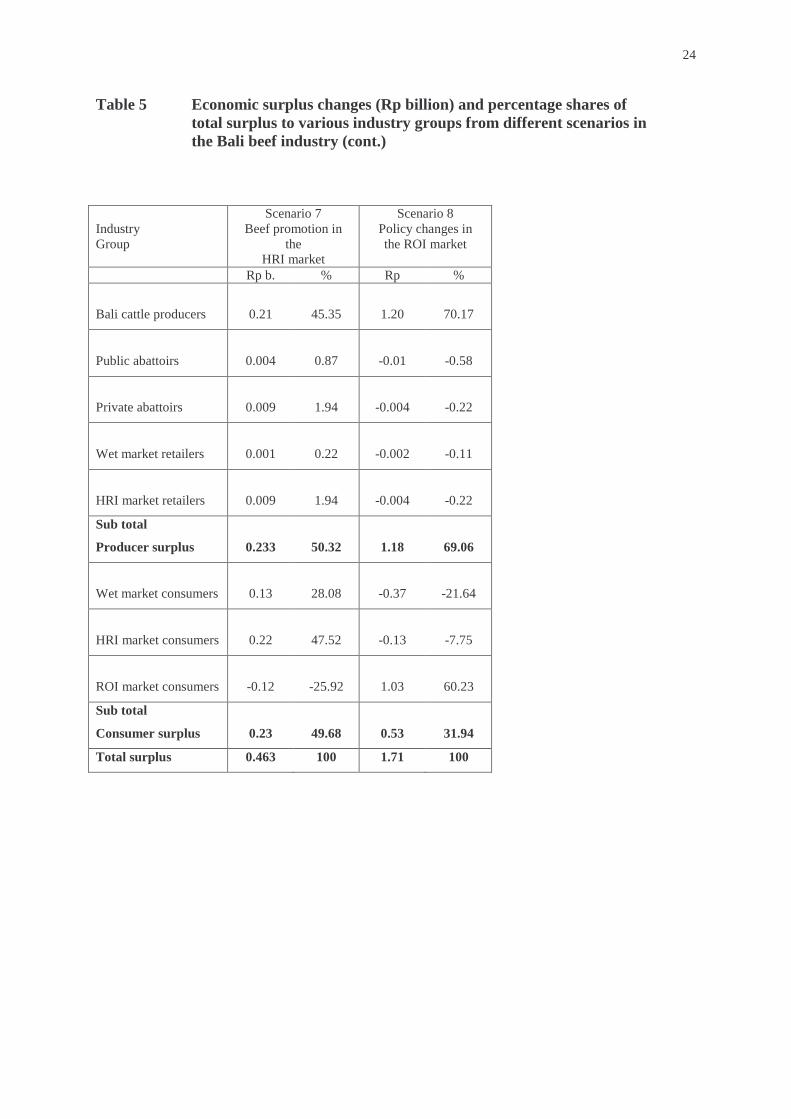
The results indicate that the size of total economic surplus changes is determined largely by
the total value of the sector where the exogenous shift occurs. As can be seen from Table 5,
for the same 1 per cent exogenous shift in the relevant market, improved productivity of Bali
cattle production resulting from government intervention (Scenario 1) has the largest total
benefits (Rp 3.02 billion, about A$ 0.60 million). This is about 1 per cent of the total value
of Rp 301.83 billion at the farm gate. Meanwhile, policy changes from the ROI market
(Scenario 8) amounts to Rp 1.71 billion (A$ 0.34 million). The total returns from the beef
promotion scenario in the wet market is Rp 1.297 billion (A$ 0.26 million) but those are
much smaller returns for beef promotion in the HRI market (Rp 0.463 billion). The total
benefits from improved efficiencies in the processing and marketing sectors (Scenario 2 – 5)
are very small, ranging from Rp 0.032 billion to Rp 0.20 billion. These small returns are due
to the small value added to the beef products in those sectors and the highly elastic nature of
the supply of other inputs.
In terms of the distribution of returns among various industry groups, Bali cattle producers
receive substantial benefits (43 per cent to 70.17 per cent of total returns) from any cost
reduction or improved efficiency scenarios. This is because cattle production has the highest
value within the industry group. On the other hand, Bali beef consumers in both the wet and
HRI markets gain much less surplus than cattle farmers. Moreover, the ROI consumers only
receive gains from the cost reduction in Bali cattle production but the benefits are much
bigger than for beef consumers. The total value of cattle shipped outside Bali is much bigger
11
than the beef value at the final stage in Bali. However, any improved efficiencies at the
marketing level in Bali (Scenario 2 –5) result in a welfare loss to the ROI consumers. This is
because less cattle are traded to the ROI market. The small portion of welfare gains to the
processing and retails sectors are due to the assumption of very elastic supply curve for
marketing inputs (with an elasticity of 5). This means that marketing firms can purchase
more inputs without paying suppliers substantially higher prices.
The results of these simulations also suggest that the quantity of imported beef entering the
HRI market is reduced by 0.08 per cent for a 1 per cent cost reduction in any of the marketing
stages. This implies that government policy aimed at reducing beef imports can be met by
increasing efficiencies in the relevant sector, such as reducing the cost of Bali cattle
production, resulting in more Bali beef entering to the HRI market.
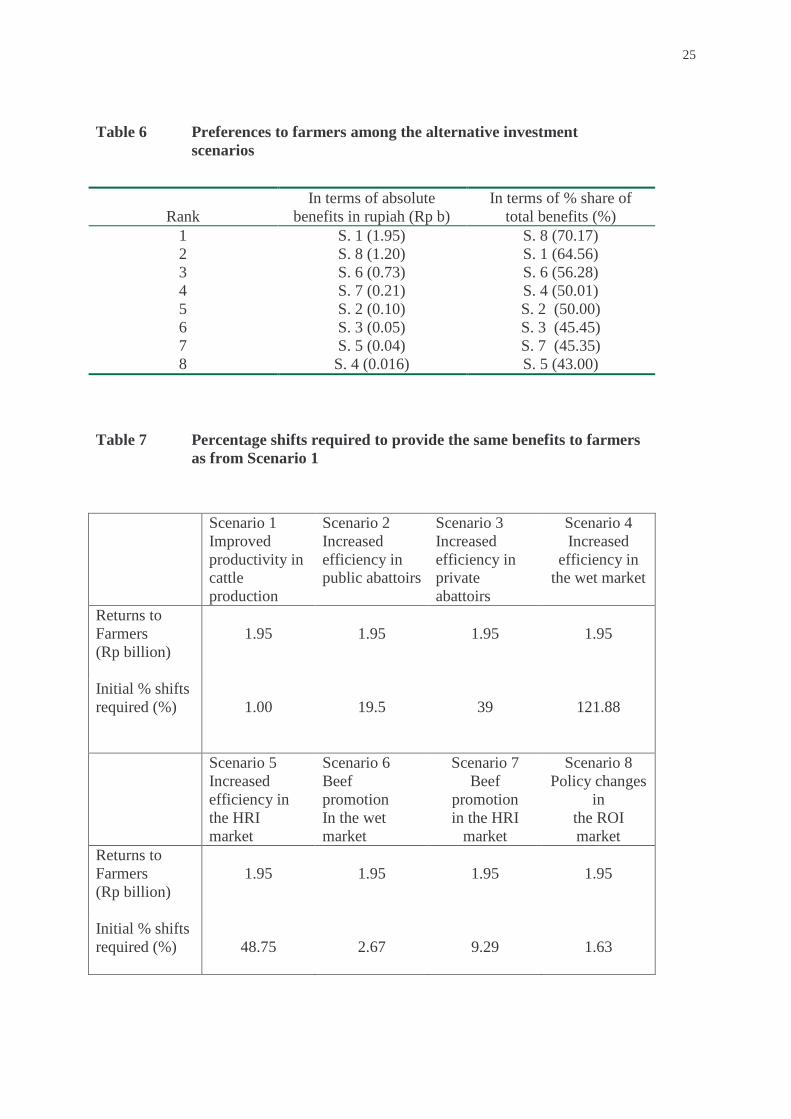
These results can be ranked according to various criteria. Here we rank them according to
both absolute returns to farmers and the percentage share of total returns going to farmers
(Table 6). Farmers are the focal point because the stated objectives of the cattle development
policies are to enhance the livelihoods of the smallholder cattle producers. Scenarios 1 and 8,
and to a lesser extent Scenario 6, dominate both rankings. Thus decreasing the cost of
producing cattle, generating greater demand from the inter-island market, or inducing
consumers in the Bali wet market to pay more for beef, are the three main ways that Bali
cattle producers can benefit from industry development.
Another way of looking at these results is to calculate the percentage shifts required in the
other market sectors to provide the same return to cattle producers (Rp1.95 billion, about A$
0.39 million) as greater efficiencies in cattle production (Table 7). Again, Scenarios 6 and 8
require greater shifts than Scenario 1 but of the same broad order of magnitude, while the
other Scenarios require shifts between nine and 122 times larger, to provide Rp 1.95 billion to
farmers.
Impact of the Bali Bombings
The October 2002 Bali bombings have caused a significant decline in tourists to Bali.
Erawan (2002) estimated a drop of 14 per cent in tourist numbers. He estimated that the Bali
bombing tragedy has caused a loss of Rp 10,889 billion (about A$ 2,118 million) to the Bali
12
economy. Before the tragedy, the tourist sector accounted for about 60 per cent of gross
regional domestic product (GRDP), but the attack is estimated to have reduced the GRDP by
4 per cent. Sectors that are most affected by this tragedy are the trade, hotels and restaurants
(36.14 per cent), manufacturing industry (21.58 per cent), agriculture (18.44 per cent) and
transport and communication (11.89 per cent). Hence, the Bali tragedy has impacted on more
than 88 per cent to the economy. Consequently, the expected rate of growth of the Bali
economy of 4.85 per cent in 2002 cannot be sustained in coming years. The growth of the
Bali economy is now estimated at only 3.1 per cent. This will increase the unemployment
rate by 1 per cent, from 2.88 per cent to 3.88 per cent.
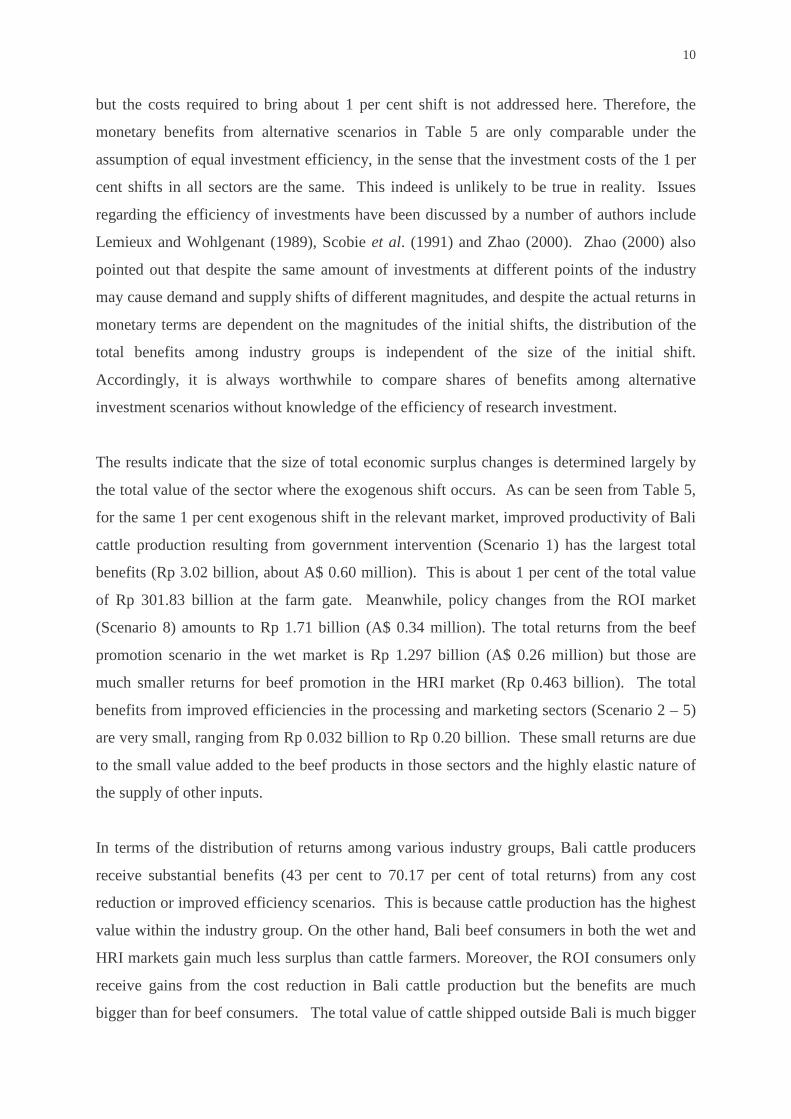
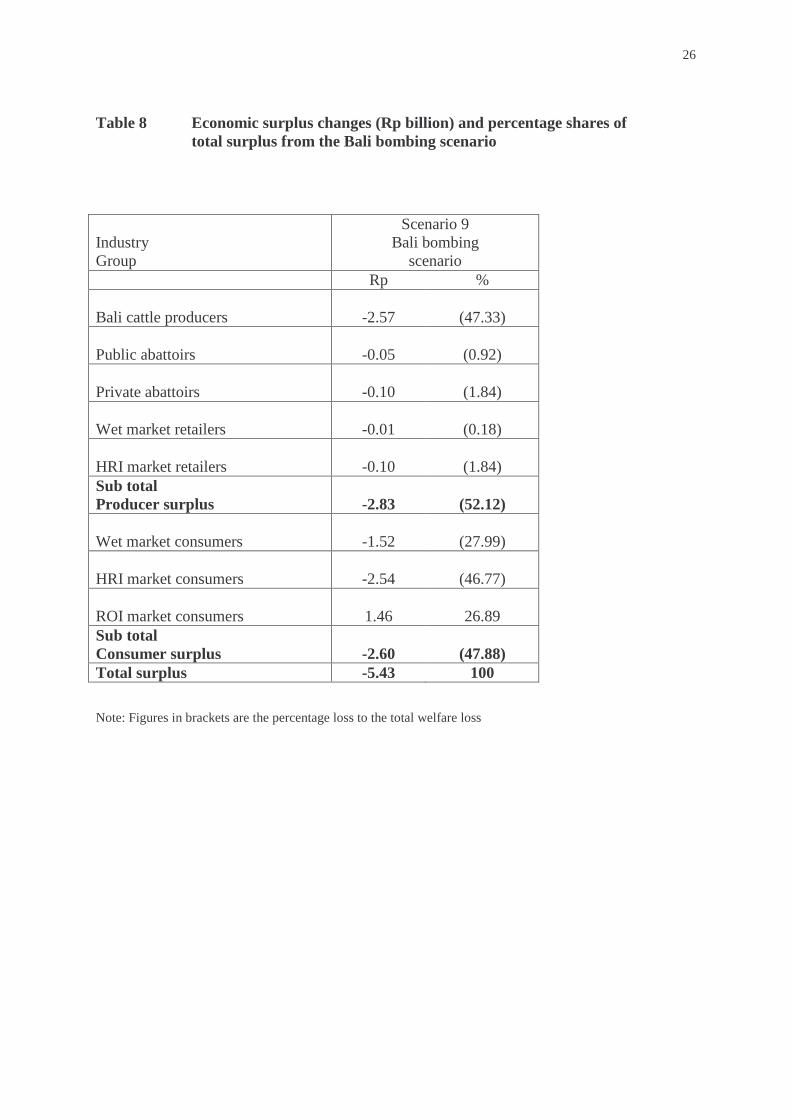
The decline in tourists has affected the hotels and restaurants sector particularly and therefore
the demand for hotel beef as part of the HRI market. The impact of the bombing on the Bali
beef industry is simulated in this study (Table 8). Considering that 80 per cent of good
quality of Bali beef at the higher end market is consumed by the tourists and there is a 14 per
cent reduction in tourist numbers, thus the estimate reduction in demand for beef at HRI
market is about 11 per cent. In this study, a 11 per cent reduction in beef demand at HRI
market is simulated. The result shows that there is a significant welfare loss of Rp 5.43
billion (about A$ 1.09 million) to the Bali beef industry. Of this, Bali cattle producers lose Rp
2.57 billion (47 per cent of the welfare loss). The quantity of Bali beef demanded by the HRI
markets is forecasted to have dropped by 5.09 per cent, while imported beef demand is
forecasted to have been reduced by 1.9 per cent. Accordingly, more Bali cattle get shipped
outside the island and ROI consumers receive gains of Rp 1.46 billion. If the tourism
industry starts to recover in a couple of years, a 1 per cent increase in demand of Bali beef in
the HRI market will provide gross benefits of Rp 0.46 billion.
Summary and Conclusions
The Bali government has put in place policies for developing the Bali cattle breed to increase
the inter-island live cattle trade and to improve Bali beef quality to compete with imported
beef in the tourist sector in Bali. Information on the benefits from development of the cattle
industry is limited and therefore evaluation of the policies is required to guide future policy
development. In this paper, an economic model of the Bali beef industry was developed to
13
simulate various policies and exogenous changes. The impacts of these changes on various
industry groups were examined in terms of their welfare changes.
For a 1 per cent exogenous shift in the relevant market, improved productivity of Bali cattle
production has the largest total benefits (Rp 3.02 billion, about A$ 0.6 million). Increased
demand from the ROI market amounts to Rp 1.71 billion (A$ 0.34 million), and from the wet
market is Rp 1.297 billion (A$ 0.26 million). The total benefits from improved efficiencies
in the processing and marketing sectors are very small, ranging from Rp 0.032 billion to Rp
0.20 billion. In terms of the distribution of returns among various industry groups, Bali cattle
producers receive substantial benefits (43 to 70 per cent of total returns) from any cost
reduction or improved efficiency scenarios. This is because cattle production has the largest
value within the industry sectors. Bali beef consumers in both the wet and HRI markets gain
much less surplus than cattle farmers.
An attempt was made to estimate the impacts on the Bali beef industry of the recent bombing.
An estimate of a 11 per cent reduction in the demand for beef in the HRI market was used.
The result shows that there is a significant welfare loss of Rp 5.43 billion (A$ 1.09 million) to
the Bali beef industry. Of this, Bali cattle producers lose Rp 2.57 billion (47 per cent). The
quantity of Bali beef demanded by the HRI markets is forecasted to have dropped by 5.09 per
cent, while imported beef demand is forecasted to have been reduced by 1.9 per cent.
Accordingly, more Bali cattle get shipped outside the island and ROI consumers receive
gains of Rp 1.46 billion.
The model seems appropriate for examining different types of R&D and policy scenarios to
those described above. For example, estimates of the cost savings from particular types of
policies (see Ambarawati et al. 2002) can be used as input rather than hypothetical 1 per cent
shifts. However more research is needed in several areas. In particular, since the data are
quite scarce and there is much uncertainty about some of the assumptions made, formal
sensitivity analyses are required to ensure that the generated results are not highly dependent
on particular assumed values.
14
References
Alston, J.M. 1991, ‘Research benefits in a multimarket setting: A review’ , Review of Marketing and Agricultural Economics 59 (1), 23-52.
Alston, J.M., G.W. Norton and P.G. Pardey 1995, Science Under Scarcity: Principles and
Practice for Agricultural Research Evaluation and Priority Setting, Cornell University Press, Ithaca and London.
Alston, J.M. and Scobie, G.M. 1983, ‘Distribution of gains in multistage production systems:
Comment’ , American Journal of Agricultural Economics 65 (2), 353-56. Ambarawati, I.A., G.R. Griffith and H-S. Chang 2002, Assessment of Beef Cattle
Development Schemes on Farm Performance in Bali, Paper presented to the 46th Annual Conference of the Australian Agricultural and Resource Economic Society, 12-15 February 2002, Canberra.
CBSI 2000, Statistical Book on Wholesaler Prices, Badan Pusat Statistik, Jakarta. Chiang, A.C. 1984, Fundamental Methods of Mathematical Economics, 3rd edition, McGraw
Hill, Singapore. DGLS 1998, Livestock Development in Indonesia, Direktorat Jenderal Peternakan,
Departemen Pertanian, Jakarta. DGLS 2000, Statistical Book on Livestock, Direktorat Jenderal Peternakan, Departemen
Pertanian, Jakarta. DPPB 2000, Informasi Data Peternakan Propinsi Daerah Tingkat I Bali (Information on
Livestock Data), Dinas Peternakan Propinsi Bali, Denpasar. Erawan, N. 2002, Berdayakan Petani, Hapus Kesenjangan (Empowering Farmers, Remove
Gaps), Bali Post Online, 24 December, http://www.balipost.co.id/balipostcetak/2002/12/24/n5.html.
Freebairn, J.W., Davis, J.S. and Edwards, G.W. 1982, ‘Distribution of gains in multistage
production systems’ , American Journal of Agricultural Economics 64(1), 39-46. Freebairn, J.W., Davis, J.S. and Edwards, G.W. 1983, ‘Distribution of gains in multistage
production systems: Reply’ , American Journal of Agricultural Economics 65(2), 357-59.
Gardner, B.L. 1975, ‘The farm-retail price spread in a competitive food industry’ , American
Journal of Agricultural Economics 57(3), 399-409. Holloway, G.J. 1989, ‘Distribution of gains in multistage production systems: further results’ ,
American Journal of Agricultural Economics 71(2), 338-43.
15
Lemieux, C.M. and Wohlgenant, M.K. 1989, ‘Ex ante evaluation of the economic impact of agricultural biotechnology: The case of porcine somatotropin’ , American Journal of Agricultural Economics 71(4), 903-914.
Masudana, I.W. 1990, Perkembangan Sapi Bali di Bali dalam Sepuluh Tahun Terakhir
(Development of Bali Cattle in Bali in the last decade), Proceedings of National Seminar on Bali Cattle, September 1990, Udayana University, Denpasar.
Mullen, J.D., Alston, J.M. and Wohgenant, M.K. 1989, ‘The impact of farm and processing
research on the Australian wool industry’ , Australian Journal of Agricultural Economics 33(1), 32-47.
Mullen, J.D., Wohlgenant, M.K. and Farris, D.E. 1988, ‘ Input substitution and distribution of
surplus gains from lower U.S. beef processing costs’ , American Journal of Agricultural Economics 70(2), 245-54.
Piggott, R.R. 1992, ‘Some old truths revisited’ , Australian Journal of Agricultural
Economics 36(2), 117-40. Piggott, R.R., Piggott, N.E. and Wright, V.E. 1995, ‘Approximating farm-level returns to
incremental advertising expenditure: Methods and an application to the Australian meat industry’ , American Journal of Agricultural Economics 77(3), 497-511.
Scobie, G.M., Mullen, J.D. and Alston, J.M. 1991, ‘The returns to investment in research on
Australian wool production’ , Australian Journal of Agricultural Economics 35(2), 179-95.
Wohlgenant, M.K. 1989, ‘Demand for farm output in a complete system of demand
functions’ , American Journal of Agricultural Economics 71(2), 241-52. _______________. 1993, ‘Distribution of gains from research and promotion in multi-stage
production systems: The case of the U.S. beef and pork industries, American Journal of Agricultural Economics 75(3), 642-51.
Varian, H.R. 1992, Microeconomic Analysis, 3rd edn, W.W. Norton & Company, New York. Voon, J.P. 1991, ‘Measuring research benefits from a reduction of pale, soft and exudative
pork in Australia’ , Journal of Agricultural Economics 42(2), 180-84. Zhao, X. 2000, The Economic Impacts of New Technologies and Promotions on the
Australian Beef Industry, unpublished PhD thesis, Graduate School of Agricultural and Resource Economics, University of New England, Armidale.
Zhao, X., J.D. Mullen, G.R. Griffith, W.E. Griffiths and R.R. Piggott 2000, An Equilibrium
Displacement Model of the Australian Beef Industry, Economic Research Report No. 4 NSW Agriculture, Armidale.
16
Figure 1 The Structural model of the Bali beef industry
Bali beef
Wet market
Bali beef
HRI market
Imported
beef
Public
Abattoirs
Private
Abattoirs
Marketing input 2
Marketing
input 1
Marketing
input 3 Y6
Y7
Y8
Marketing
input 4
ROI
Market
Bali cattle
Y5 = Y6+Y7+Y8
(Y18)
Y3
(Y16)
Y4
(Y17)
Y1 (Y14) Y2 (Y15)
Y9 (Y19)
Y46 (Y47)
Y10 (Y20)
Y11 (Y21) Y12 (Y22)
Y13 (X1)
17
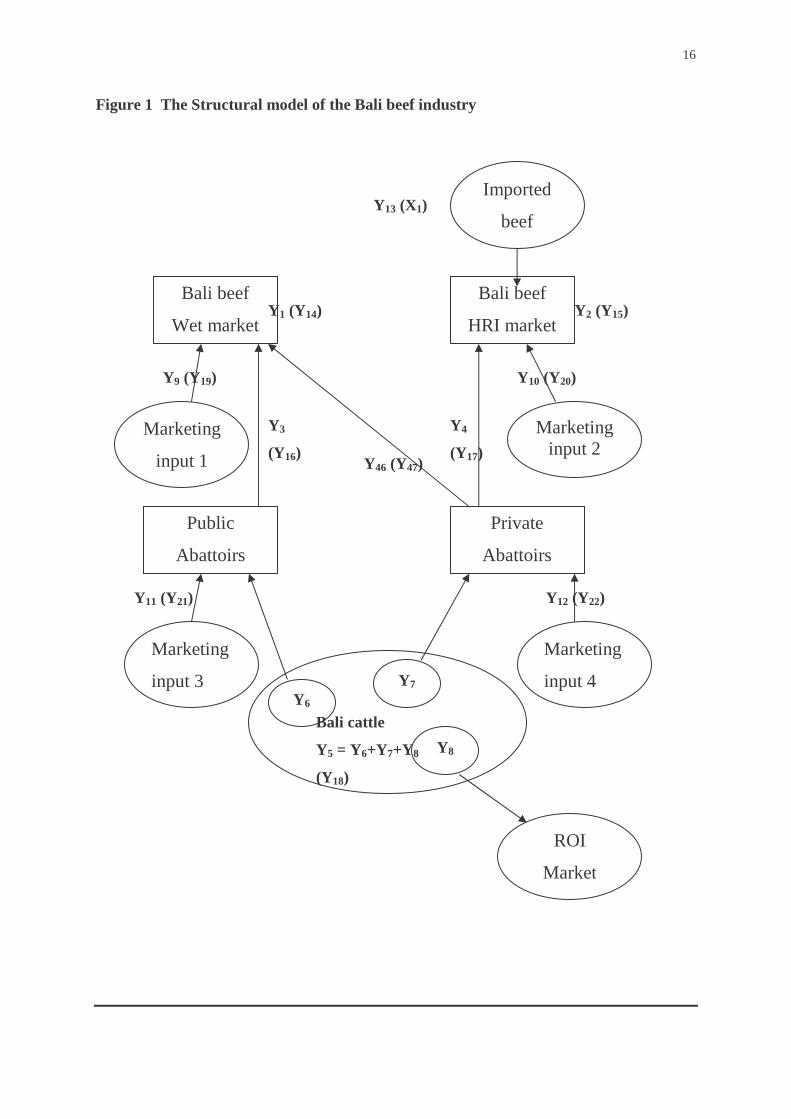
Table 1 Definitions of var iables and parameters in the model
Endogenous variables
Y1 quantity of Bali beef at wet market.
Y2 quantity of Bali beef at HRI market.
Y3 quantity of carcasses from public abattoirs for the wet market.
Y4 quantity of carcasses from private abattoirs for the HRI market.
Y5 quantity of Bali cattle total.
Y6 quantity of Bali cattle for public abattoirs.
Y7 quantity of Bali cattle for private abattoirs.
Y8 quantity of Bali cattle traded to the rest of Indonesia (ROI) market.
Y9 quantity of marketing input 1.
Y10 quantity of marketing input 2.
Y11 quantity of marketing input 3.
Y12 quantity of marketing input 4.
Y13 quantity of imported beef to HRI market.
Y14 price of Bali beef at wet market.
Y15 price of Bali beef at HRI market.
Y16 price of carcasses at public abattoirs.
Y17 price of carcasses at private abattoirs.
Y18 price of Bali cattle.
Y19 price of marketing input 1.
Y20 price of marketing input 2.
Y21 price of marketing input 3.
Y22 price of marketing input 4.
Y46 quantity of carcasses from private abattoirs for the wet market.
Y47 price of carcass from private abattoirs for the wet market.
ZBI aggregated input index for carcass production at private abattoirs.
ZBO aggregated output index for carcass production at private abattoirs.
Exogenous variables
X1 price of imported beef.
NYi Demand shifter shifting up demand curve of Y i vertically due to quality
improvement or promotion that increase the demand in Y i, where Y i = Y1, Y2, Y8. TYi Supply shifters shifting down supply curve of Yi vertically due to cost reduction
in production of Y i, where Y i = Y5, Y9, Y10, Y11, Y12.
18
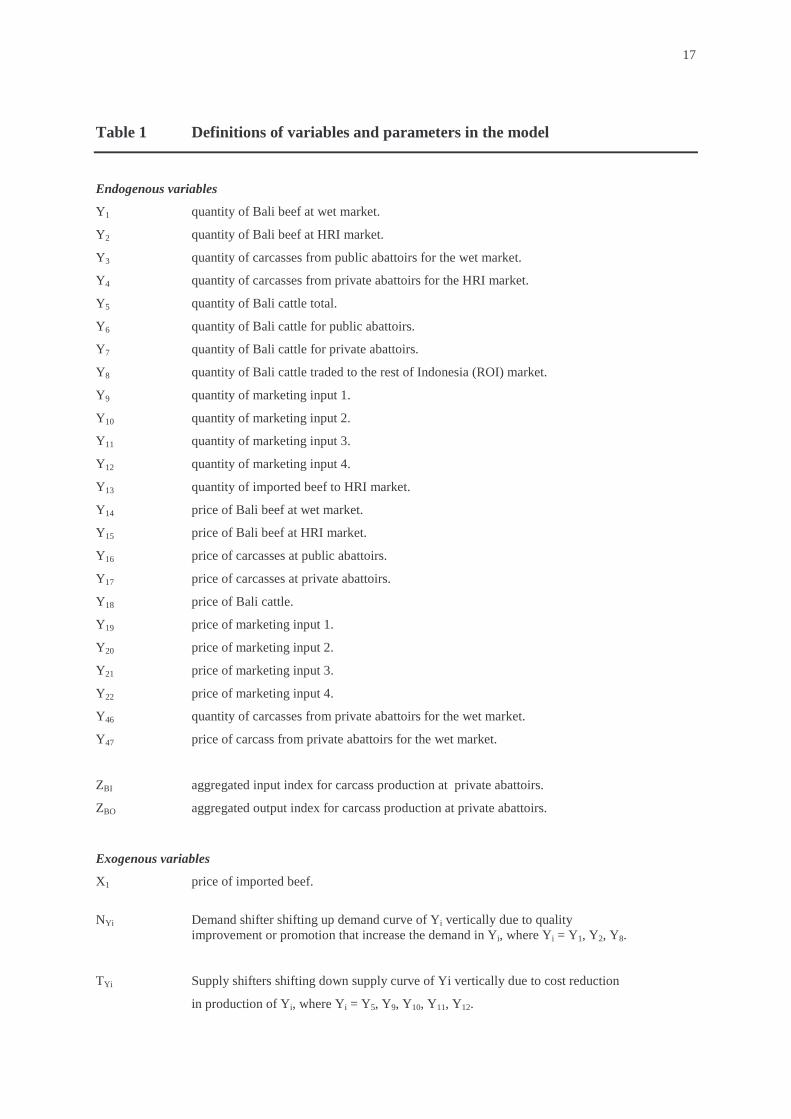
Parameters
( )yx,η Elasticity of demand for commodity x with respect to variable y.
( )yx,ε Elasticity of supply of commodity x with respect to variable y.
( )yx,σ Allen’s elasticity of input substitution between input x and input y.
( )yx,τ Allen’s elasticity of product transformation between output x and output y.
is cost share of input x (x = y3, y4, y6, y7, y8, y9, y10, y11, y12, y46)
where 146,9,3
=�=i
yis , 111,6
=�=i
yis , 110,4
=�=i
yis , 112,7
=�=i
yis .
yγ Revenue share of output y (y = y4,y46) where
146,4
=�=i
yiγ .
xρ Quantity shares of x (x= y6, y7, y8), where �=
=8,7,6
1i
yiρ .
___________________________________________________________________
19
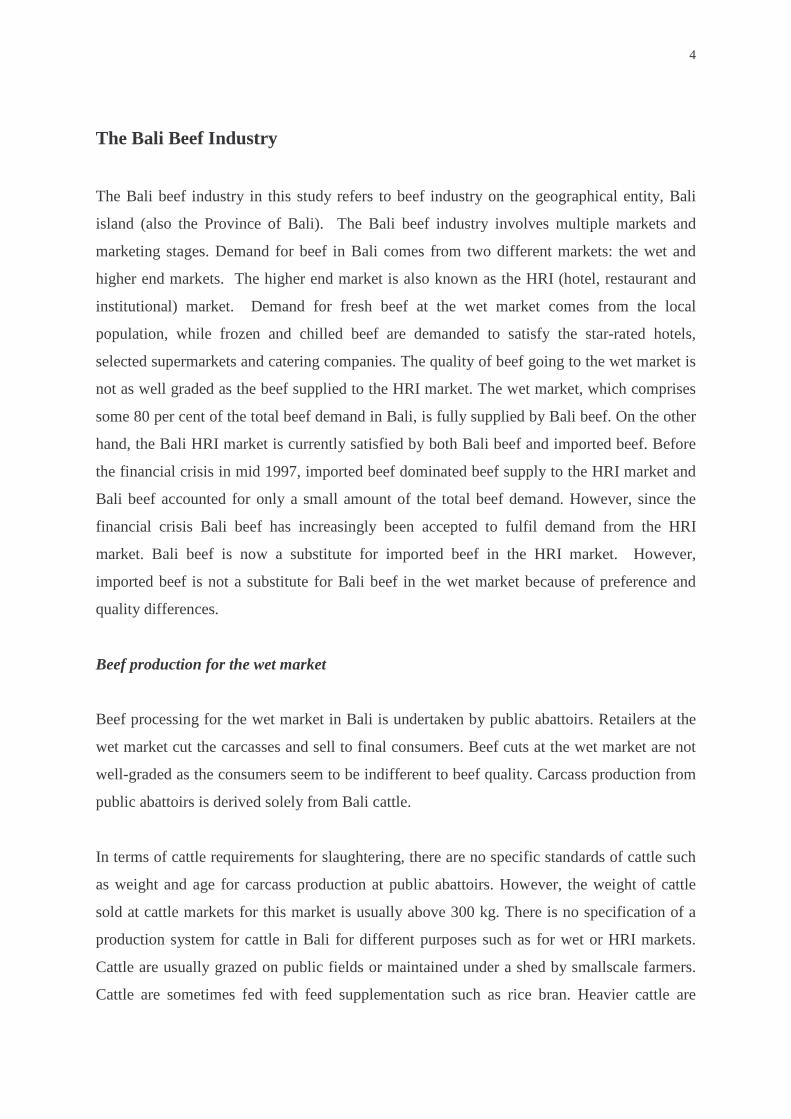
Table 2 Values of base quantities and pr ices, cost and revenue shares
Stage of
Marketing
Wet market HRI Market
Final Beef
Products
(in kt & Rp/kg)
Y1 = 4.7 Y14 = 27500
TV = 129.25b
Marketing cost shares:
sy3 = 0.92 sy46 = 0.06
sy9 = 0.02
Y2 = 1.18 Y15 = 39000
TV = 46.02b
Marketing cost shares:
sy4 = 0.80 sy10 = 0.20
Import demand:
Y13 = 0.3 X1 = 58000
TV = 17.4b
Bali
Market
Carcass
Production
(in kt & Rp/kg,
carcass weight)
Y3 = 5.5 Y16 = 21565
TV = 118.61b
Public abattoir cost shares:
sy6 = 0.83 sy11 = 0.17
Y4 = 1.47 Y17 = 25000
Y46= 0.37 Y47 = 20000
TV = 44.15b
Private abattoir cost shares:
sy7 = 0.75 sy12 = 0.25
Private abattoir revenue shares: γy4 = 0.83 γy46 = 0.17
Live cattle
(in kt & Rp/kg,
liveweight)
Y6 = 10.58 Y18 = 9334 TV = 98.75b
Y8 = 18.23 Y18 = 9334 TV = 170.16b
Production shares of Bali cattle to all markets: ρy6 = 0.33, ρy7 = 0.11,
ρy8 = 0.56
Y7 = 3.54 Y18 = 9334
TV = 33.04b
Source: CBSI (2000); DPPG (2000)
20
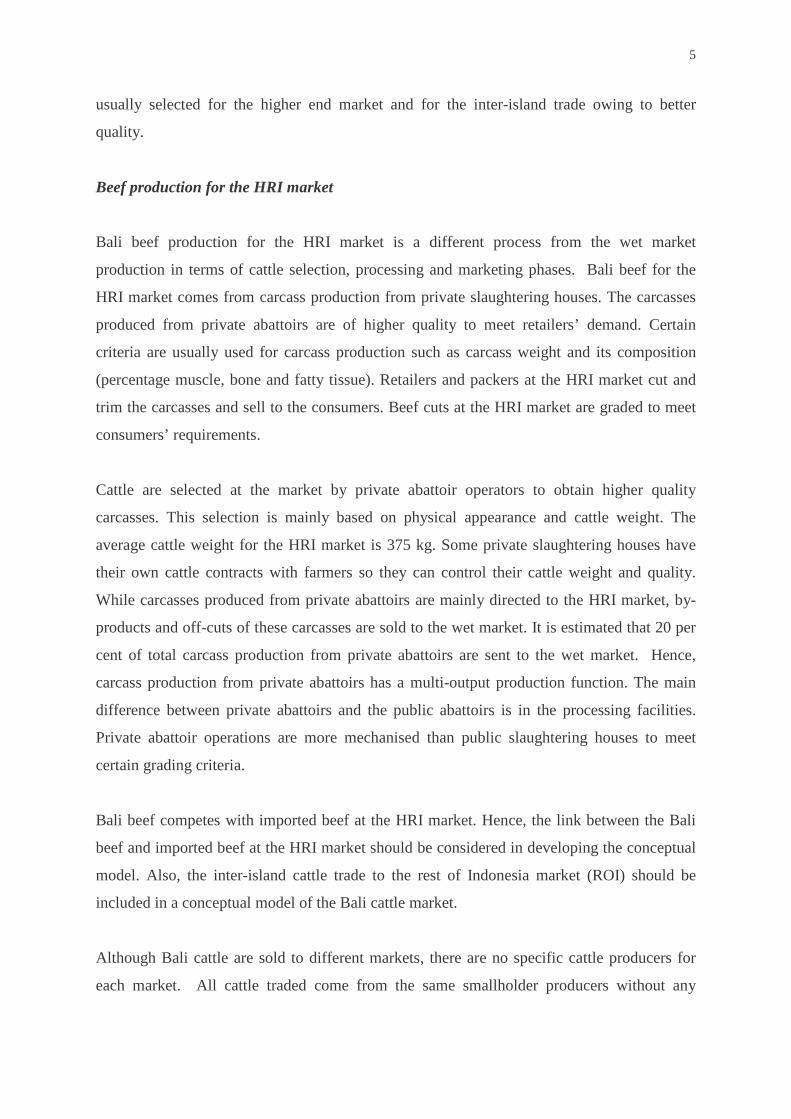
Table 3 Elasticity and parameter values for the base run
Beef demand elasticities
η(y1,y14) = -1.1 η(y2,y15) = -0.90
η(y13,y15) = 0.3
η(y13,x1) = -5
η(y2,x1) = 0.11
η(y8,y18) = -1.0
Cattle supply elasticities:
ε(y5,y18) = 0.5
Marketing input supply elasticities:
ε(y9,y19) = 5 ε(y10,y20) = 5
ε(y11,y21) = 5 ε(y12,y22) = 5
Input substitution elasticities
Marketing sector :
σ(y3,y9) = 0.1
σ(y3,y46) = 0.05
σ(y9,y46) = 0.1
σ(Y4,Y10) = 0.1
Processing sector:
σ(y6,y11) = 0.1
σ(y7,y12) = 0.1
Product transformation
elasticities:
τ(y4,y46) = -0.05
Source: Mullen et al. (1988); Mullen et al. (1989); Zhao (2000)
21
Table 4 Var ious scenar ios for exogenous shift var iables
___________________________________________________________________________
Scenario 1: Bali cattle production research.
ty5 = -0.01, the rest of t(.) = 0 and n(.) = 0.
Cost reduction in Bali cattle production resulting from improved productivity encouraged by Bali government in cattle development.
Scenario 2: Processing research at public abattoirs Bali market
ty11 = -0.01, the rest of t(.) = 0 and n(.) = 0.
Reduction in processing cost in public abattoirs in Bali resulting from improved management and efficiency.
Scenario 3: Processing research at private abattoirs Bali market.
ty12 = -0.01, the rest of t(.) = 0 and n(.) = 0.
Reduction in processing cost in private abattoirs in Bali resulting from new technologies and improved management strategies.
Scenario 4: Marketing research at wet market.
ty9 = -0.01, the rest of t(.) = 0 and n(.) = 0.
Cost reduction in the Bali wet market resulting from new technologies and improved management.
Scenario 5: Marketing research HRI market.
ty10 = -0.01, the rest of t(.) = 0 and n(.) = 0.
Cost reduction in the Bali HRI market due to improved technologies and management.
Scenario 6: Bali beef promotion at wet market.
ny1 = 0.01, the rest of t(.) = 0 and n(.) = 0.
Increase in the willingness to pay by beef consumers at the wet market resulting from beef promotion.
Scenario 7: Bali beef promotion at HRI market.
ny2 = 0.01, the rest of t(.) = 0 and n(.) = 0.
Increase in the willingness to pay by beef consumers at the HRI market resulting from Bali beef promotion.
Scenario 8: Policy changes at ROI market.
ny8 = 0.01, the rest of t(.) = 0 and n(.) = 0.
Increase in the willingness to pay by beef consumers at the ROI market resulting from policy changes such as guaranteed quality.
_____________________________________________________________________
22
Table 5 Economic surplus changes (Rp billion) and percentage shares of total surplus to var ious industry groups from different scenar ios in the Bali beef industry
Industry Group
Scenario 1 Improved
productivity in cattle production
Scenario 2 Increased efficiency
in public abattoirs
Scenario 3 Increased efficiency
in private abattoirs
Rp b. % Rp % Rp %
Bali cattle producers
1.95
64.56
0.10
50.00
0.05
45.45
Public abattoirs
0.009
0.29
0.007
3.5
0.001
0.91
Private abattoirs
0.005
0.17
0.001
0.5
0.004
3.64
Wet market retailers
0.002
0.06
0.001
0.5
0.00
0
HRI market retailers
0.004
0.13
0.001
0.5
0.002
1.82
Sub total
Producer surplus
1.97
65.23
0.11
55
0.057
51.82
Wet market
consumers
0.33
10.93
0.12
60
0.036
32.73
HRI market
consumers
0.12
3.97
0.02
10
0.047
42.72
ROI market consumers
0.60
19.87
-0.05
-25
-0.03
-27.27
Sub total
Consumer surplus
1.05
34.77
0.09
0.45
0.053
48.18
Total surplus 3.02 100 0.20 100 0.11 100
23
Table 5 Economic surplus changes (Rp billion) and percentage shares of total surplus to var ious industry groups from different scenar ios in the Bali beef industry (cont.)
Industry
Group
Scenario 4
Increased efficiency
in the wet market
Scenario 5
Increased efficiency
in the HRI market
Scenario 6
Beef promotion in the
wet market
Rp b. % Rp % Rp %
Bali cattle producers
0.016
50
0.04
43.00
0.73
56.28
Public abattoirs
0.001
3.12
0.001
1.07
0.03
2.31
Private abattoirs
0.002
6.26
0.002
2.15
0.008
0.62
Wet market retailers
0.001
3.12
0.00
0
0.004
0.31
HRI market retailers
0.00
0
0.003
3.25
0.005
0.39
Sub total
Producer surplus
0.02
62.50
0.046
49.47
0.777
59.91
Wet market consumers
0.02
62.50
0.021
22.58
0.77
59.37
HRI market consumers
0.003
9.38
0.046
49.46
0.15
11.57
ROI market consumers
-0.011
-34.38
-0.02
-21.57
-0.41
-31.61
Sub total
Consumer surplus
0.012
37.5
0.047
50.43
0.52
40.09
Total surplus 0.032 100 0.093 100 1.297 100
24
Table 5 Economic surplus changes (Rp billion) and percentage shares of total surplus to var ious industry groups from different scenar ios in the Bali beef industry (cont.)
Industry Group
Scenario 7 Beef promotion in
the HRI market
Scenario 8 Policy changes in the ROI market
Rp b. % Rp %
Bali cattle producers
0.21
45.35
1.20
70.17
Public abattoirs
0.004
0.87
-0.01
-0.58
Private abattoirs
0.009
1.94
-0.004
-0.22
Wet market retailers
0.001
0.22
-0.002
-0.11
HRI market retailers
0.009
1.94
-0.004
-0.22
Sub total
Producer surplus
0.233
50.32
1.18
69.06
Wet market consumers
0.13
28.08
-0.37
-21.64
HRI market consumers
0.22
47.52
-0.13
-7.75
ROI market consumers
-0.12
-25.92
1.03
60.23
Sub total
Consumer surplus
0.23
49.68
0.53
31.94
Total surplus 0.463 100 1.71 100
25
Table 6 Preferences to farmers among the alternative investment scenar ios
Rank
In terms of absolute benefits in rupiah (Rp b)
In terms of % share of total benefits (%)
1 2 3 4 5 6 7 8
S. 1 (1.95) S. 8 (1.20) S. 6 (0.73) S. 7 (0.21) S. 2 (0.10) S. 3 (0.05) S. 5 (0.04) S. 4 (0.016)
S. 8 (70.17) S. 1 (64.56) S. 6 (56.28) S. 4 (50.01) S. 2 (50.00) S. 3 (45.45) S. 7 (45.35) S. 5 (43.00)
Table 7 Percentage shifts required to provide the same benefits to farmers as from Scenar io 1
Scenario 1 Improved productivity in cattle production
Scenario 2 Increased efficiency in public abattoirs
Scenario 3 Increased efficiency in private abattoirs
Scenario 4 Increased
efficiency in the wet market
Returns to Farmers (Rp billion)
1.95
1.95
1.95
1.95
Initial % shifts required (%)
1.00
19.5
39
121.88
Scenario 5 Increased efficiency in the HRI market
Scenario 6 Beef promotion In the wet market
Scenario 7 Beef
promotion in the HRI
market
Scenario 8 Policy changes
in the ROI market
Returns to Farmers (Rp billion)
1.95
1.95
1.95
1.95
Initial % shifts required (%)
48.75
2.67
9.29
1.63
26
Table 8 Economic surplus changes (Rp billion) and percentage shares of
total surplus from the Bali bombing scenar io
Industry Group
Scenario 9 Bali bombing
scenario Rp % Bali cattle producers
-2.57
(47.33)
Public abattoirs
-0.05
(0.92)
Private abattoirs
-0.10
(1.84)
Wet market retailers
-0.01
(0.18)
HRI market retailers
-0.10
(1.84)
Sub total Producer surplus
-2.83
(52.12)
Wet market consumers
-1.52
(27.99)
HRI market consumers
-2.54
(46.77)
ROI market consumers
1.46
26.89
Sub total Consumer surplus
-2.60
(47.88)
Total surplus -5.43 100
Note: Figures in brackets are the percentage loss to the total welfare loss
27
Appendix Model specification of the Bali beef industry
Demand for Bali beef at Bali wet market:
(1) Y14= a(Y1, Ny1)
Supply function of Bali beef at Bali wet market (market clearing condition):
(2) Y14=c(Y16, Y19, Y47)
This equation expresses the long-run equilibrium condition that output price equals average
per unit cost c(.)
When the production function shows constant return to scale, the industry total cost function
can be written as:
CY1=Y1*cY1(Y16, Y19, Y47)
CY1 is the total cost of producing output Y1 and cy1(.) is the unit cost function. The output-
constrained input demand functions can be derived by applying Shephard’s lemma.
Imposing zero homogeneity in input prices allows the cross-price elasticity terms to be
expressed in terms of cost shares and the elasticity of substitution between inputs via the
Allen decomposition of output-constrained input demand elasticities.
The output-constrained input demand of Bali beef production at Bali wet market:
(3) Y3 = Y1 c’Y1,Y3(Y16, Y19, Y47) demand for carcass from public
abattoirs
(4) Y9 = Y1 c’Y1,Y9(Y16, Y19, Y47) demand for marketing input 1
(5) Y46 = Y1 c’Y1,Y46(Y16, Y19, Y47) demand for carcass from private abattoirs
c’Y1,Yn(Y16, Y19, Y47) (n=3, 9 ,46) are partial derivatives of the unit cost functions cy1(Y16, Y19, Y47). Marketing input supply to Bali beef production at Bali wet market:
(6) Y19=b(Y9, Ty9) supply of marketing input 1
28
Bali public abattoir carcass production function
(7) Y16=d(Y18, Y21)
This equation expresses the long-run equilibrium condition that output price equals average
per unit cost d(.).
Total cost function at public abattoirs can be written as:
CY3=Y3*cY3(Y18, Y21)
CY3 is the total cost of producing output Y3 and cy3(.) is the unit cost function. The output-
constrained input demand functions can be derived by applying Shephard’s lemma.
Imposing zero homogeneity in input prices allows the cross-price elasticity terms to be
expressed in terms of cost shares and the elasticity of substitution between inputs via the
Allen decomposition of output-constrained input demand elasticities.
Output-constrained input demand of carcass production at Bali public abattoirs
(8) Y6=Y3*c’Y3,Y6(Y18, Y21) demand for Bali cattle at public abattoirs
(9) Y11=Y3*c’Y3,Y11(Y18, Y21) demand for marketing input 3
c’Y3,Yn(Y18, Y21) (n=6, 11) are partial derivatives of the unit cost functions cy3(Y18, Y21).
Marketing input supply to carcass production at Bali public abattoirs
(10) Y21=e(Y11, Ty11) supply of marketing input 3
Demand for Bali beef at Bali HRI market
(11) Y15=f(Y2, Ny2, X1)
Supply function of Bali beef at Bali HRI market
(12) Y15=g(Y17, Y20)
Output-constrained input demand of Bali beef production at Bali HRI market
(13) Y4=Y2*c’Y2,Y4(Y17, Y20) demand for carcass at private abattoirs
(14) Y10=Y2*c’Y2,Y10(Y17, Y20) demand for marketing input 2
29
Marketing input supply to Bali beef production at Bali HRI market
(15) Y20=h(Y10, Ty10) supply of marketing input 2
Bali private abattoir carcass production function
(16) ZBO(Y4, Y46) = ZBI(Y7, Y12) quantity equilibrium of carcass production
Equation (16) is the product transformation function for the processing sector that equalises
the aggregated output index ZBO with the aggregated input index ZBI.
(17) rZBO(Y17, Y47) = cZBI(Y18, Y22) value equilibrium
Equation (17) is an equilibrium condition stating that the unit revenue rZBO earned per unit of
aggregated input ZBI equals the unit cost cZBI of producing a unit of aggregated output ZBO.
Input-constrained output supply of carcass at Bali private abattoirs
(18) Y4=ZBI* r’ ZBI, Y4(Y17, Y47)
(19) Y46=ZBI* r’ZBI, Y46(Y17, Y47)
Output-constrained input demand of carcass production at Bali private abattoirs
(20) Y7=ZBO*c’ ZBO,Y7(Y18, Y22)
(21) Y12=ZBO*c’ZBO,Y12(Y18, Y22)
Marketing input supply to carcass production at private abattoirs in Bali
(22) Y22=i(Y12, Ty12) supply of marketing input 4
Demand for imported beef in Bali
(23) Y13=j(X1, Nx1, Y15)
Inter-island Bali cattle demand
(24) Y8=k(Y18, Ny8)
Bali cattle supply to Bali and ROI markets
(25) Y18=q(Y5, Ty5)
30
Market clearance of Bali cattle
(26) Y5=Y6+Y7+Y8
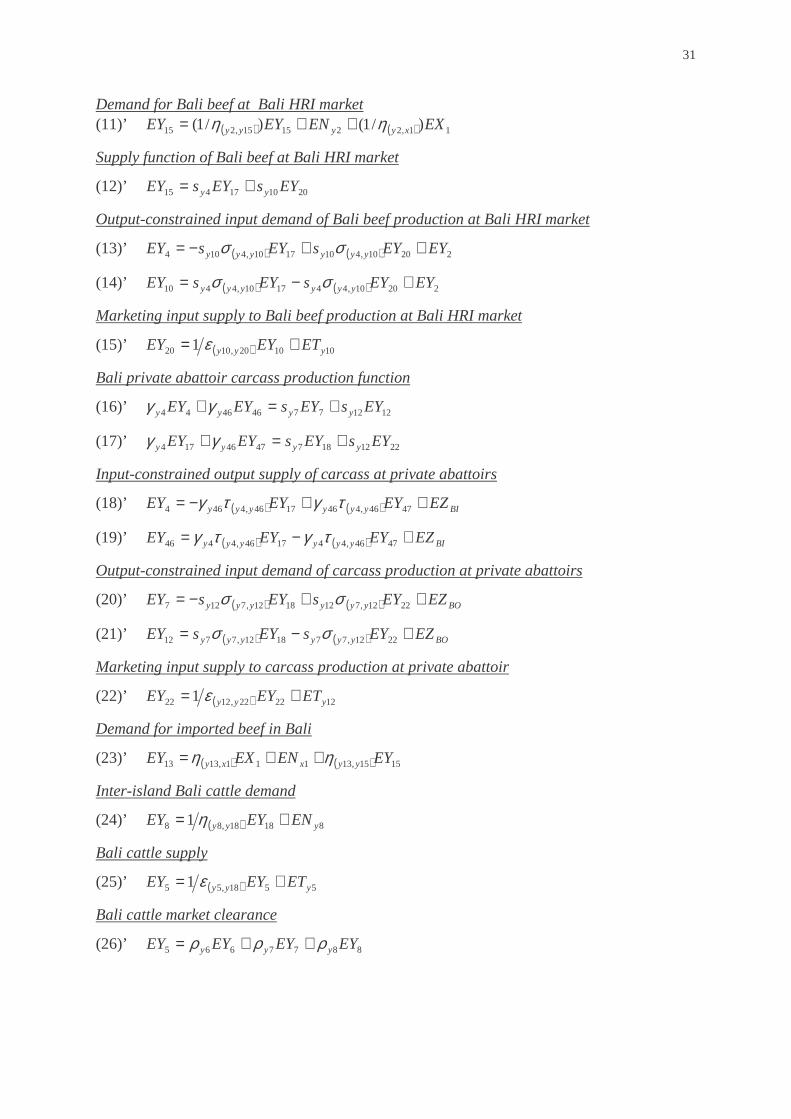
The Model in Equilibr ium Displacement Form
The Equation (1)- (26) defines the equilibrium status of all markets included in the model.
When there is improved productivity in cattle production or other government policy causes a
small shift from equilibrium, changes in prices and quantities can be approximated linearly
by totally differentiating the equations (1)-(26) and converting them to elasticity form. The
model in displacement form is presented in Equation (1)’ – (26)’ . E(.) = ∆(.)/(.) denotes a
percentage change of variable (.).
Demand for Bali beef at wet market (1)’ ( ) 1114,114 1 yyy ENEYEY += η
Supply function of Bali beef at Bali wet market
(2)’ 474619916314 EYsEYsEYsEY yyy ++=
Output-constrained input demand of Bali beef production at Bali wet market
(3)’ ( ) ( )( ) ( )
( ) 14746,346
199,391646,3469,393
EYEYs
EYsEYssEY
yyy
yyyyyyyyy
++
++−=
σσσσ
(4)’ ( ) ( ) ( )( )
( ) 14746,946
1946,9469,33169,339
EYEYs
EYssEYsEY
yyy
yyyyyyyyy
++
+−=
σσσσ
(5)’ ( ) ( )
( ) ( )( ) 14746,9946,33
1946,991646,3346
EYEYss
EYsEYsEY
yyyyyy
yyyyyy
++−
+=
σσσσ
Marketing input supply to Bali beef production at Bali wet market (6)’ ( ) 9919,919 1 yyy ETEYEY += ε
Bali public abattoir carcass production function (7)’ 211118616 EYsEYsEY yy +=
Output-constrained input demand of carcass production at Bali public abattoirs (8)’ ( ) ( ) 32111,6111811,6116 EYEYsEYsEY yyyyyy ++−= σσ
(9)’ ( ) ( ) 32111,661811,6611 EYEYsEYsEY yyyyyy +−= σσ
Marketing input supply to carcass production at Bali wet market (10)’ ( ) 111121,1121 1 yyy ETEYEY += ε
31
Demand for Bali beef at Bali HRI market (11)’ ( ) ( ) 11,221515,215 )/1()/1( EXENEYEY xyyyy ηη ++=
Supply function of Bali beef at Bali HRI market
(12)’ 201017415 EYsEYsEY yy +=
Output-constrained input demand of Bali beef production at Bali HRI market
(13)’ ( ) ( ) 22010,4101710,4104 EYEYsEYsEY yyyyyy ++−= σσ
(14)’ ( ) ( ) 22010,441710,4410 EYEYsEYsEY yyyyyy +−= σσ
Marketing input supply to Bali beef production at Bali HRI market
(15)’ ( ) 101020,1020 1 yyy ETEYEY += ε
Bali private abattoir carcass production function
(16)’ 121277464644 EYsEYsEYEY yyyy +=+ γγ
(17)’ 22121874746174 EYsEYsEYEY yyyy +=+ γγ
Input-constrained output supply of carcass at private abattoirs
(18)’ ( ) ( ) BIyyyyyy EZEYEYEY ++−= 4746,4461746,4464 τγτγ
(19)’ ( ) ( ) BIyyyyyy EZEYEYEY +−= 4746,441746,4446 τγτγ
Output-constrained input demand of carcass production at private abattoirs
(20)’ ( ) ( ) BOyyyyyy EZEYsEYsEY ++−= 2212,7121812,7127 σσ
(21)’ ( ) ( ) BOyyyyyy EZEYsEYsEY +−= 2212,771812,7712 σσ
Marketing input supply to carcass production at private abattoir
(22)’ ( ) 122222,1222 1 yyy ETEYEY += ε
Demand for imported beef in Bali
(23)’ ( ) ( ) 1515,13111,1313 EYENEXEY yyxxy ηη ++=
Inter-island Bali cattle demand
(24)’ ( ) 81818,88 1 yyy ENEYEY += η
Bali cattle supply
(25)’ ( ) 5518,55 1 yyy ETEYEY += ε
Bali cattle market clearance
(26)’ 8877665 EYEYEYEY yyy ρρρ ++=
Recommended