UNITED STATES DEPARTMENT OF THE INTERIOR, Stewart L. Udall, Secretary
FISH AND WILDLIFE SERVICE, Clarence F. Pautzke, Commissioner
BUREAU OF COMMERCIAL FISHERIES, DONALD L. McKERNAN, Director
DISTRIBUTION AND ABUNDANCE OFSKIPJACK IN THE HAWAII FISHERY, 1952-53
By HERBERT H. SHIPPEN
FISHERY BULLETIN 188
From Fishery Bulletin of the Fish and Wildlife Service
VOLUME 61
Published by the U.S. Fish and Wildlife Service. Washington. 1961
Printed at the U.S. Government Printing Office, Washington, D.C.
For B.le by the Superintendent of DocumentB, U.S. Government Printing Office, W.Bhlngton 25, D.C. - Price ZO centa

Library of Congress catalog card for the series, Fishery Bulletin of the Fishand Wildlife Series:
U.S. Fish and Wildlife Service.Fishery bulletin. v. 1-
Washington, U.S. Govt. Print. Off., 1881-19
v. in illus., maps (pa.rt fold.) 23-28 em.
Some vols. issued in the congressional series as Senate or Housedocuments.
Bulletins composing v. 47- . also numbered 1-Title varies: v. 1-49, Bulletin.Vols. 1-49 issued by Bureau of Fisheries (called Fish Commission,
v. 1-23)
1. Fisheries-U. S. 2. Fish-culture-U. S. I. Title.
II
SH11.A25
Library of Congress
639.206173 9-35239 rev 2*

CONTENTSHawaii skipjack fishery _
Purposes of this study _Utilization of data _Choice of unit of fishing eJfort _
Sources of error _Error in determination of fish size _Error in estimation of fishing effort _Other sources of error _Conclusions on sources of error _
Results and discussion _Geographical distribution of 1952 and 1953 catches _Catch per unit-of-effort in the Hawaii skipjack fishery _Size of skipjack and pounds caught per unit of effort _Distribution of 1952 and 1953 catches by biweekly periods _
Catches for the entire fishery ~ _Effects of small craft warnings _
Movements of skipjack within the fishery _Largeskipjack _Srnallskipjack _
Oahu skipjack fishery, 1952 and 1953 _Statistical comparisons _Relationships between catch statistics _Use of catch records to determine population composition _
Fluctuations in the catch of large skipjack in the Oahu region _
~~:j:~~~~~~~~~=====~~~~=~==~~====~=========~=~=~==~=~~=~~======~=~Summary . _Literature cited _
l'age
281281282282286286287287287287288288289292292292292294294294294294295296297297300300
UI

ABSTRACT
Commerdal catch re<'ords of the Hawaii skipjack fishery for 1952 (a poor year) and1953 (a good year) are summarized by area and time of catch and by size composition. Aunit of fishing effort and its appropriateness are discussed. Geographical distribution ofthe catch amI effort is (letermined and the two years aloe compared. Movements of skipjackthroughout the fishery are analyzed. The usefulness of the raw catch and the catch perunit of effort as indexes of abundance are considered, and some conjectures as to the natureof the population supporting the fishery are offered.

DISTRIBUTION AND ABUNDANCE OF SKIPJACK IN THEHAWAII FISHERY, 1952-53
By HERB~RTH. SHIPPEN, Fishery Research Biologist.
BUREAU OF COMMERCIAL FISHERIES
A study of the environmental factors that mayinfluence the availability of the skipjack ([(atsu.wonus pelamiJJ) to the Hawaii fishery was begunby the staff of the U.S. Fish and Wildlife ServiceBiological Ln,borlttory (Honolulu, Hawaii). Because the index of availability is to be based onrecords of commercial skipjack limdings, an analysis of these records is an essential part of thisstudy.
HAWAII SKIPJACK FISHERY
The skipjack, or aku, is the most important commercial species of fish in Hawaii, both in terms ofquantity landed and dollar value. The 11 millionpounds caught and sold for $1,260,000 in 1956 constituted about 70 percent of the total catch ofmarine species and 40 percent of the value receivedby Hawaii fishermen during that year. Most ofthe catch is canned, but a small amount, estimatedat less than 10 percent, is sold fresh.
June (1951) and Yamashita (1958) have described the fishery in some detail. Since WorIdWar II, the skipjack fleet has consisted of approximately 15 to 20 sampans based in Honolulu, witha few boats based itt the islands of Kauai, Maui,and HawaiL A sampan usually carries a crew of8 to 15 men. The fishermen rely on the presenceof flocks of wild birds to locate skipjack schools.The fish are caught on pole-and-line after beingattracted to the boat by dllunming with live ba.it.
The fishery is seasonal with large cat.ches generally occurring in the summer and small catches inthe winter months. Catches have fluctuatedwidely in recent years (fig. 1). The sliipjacktaken weigh from 2 to 30 pounds. The. mostsought after size is t.he 17- to 22-pound fish, knownto the fishermen as "season fish." Brock (19M, p.
NOTE.-Approved for publication February 24.' 1961. FisheryBulletin 195.
96) estimates these to be either in their second orthird year of life. The reason for the seasonalfluctuation in the catch nppears to be the migration of season fish into and out of the. area of thefishery, but the direction and signifieance of thismigration in the life history of the species arelargely wlknown~
6I I I I I
4
2 r--- r-
t--- .--- r---- r- r--
8 t-- t-- e- r---- c- c- e-
6 e- r r t-- e- e- e- t-- e- t-
o r r t- l- e- e- l- t-- e- I-
2 l- t- t-- l- t- r l- I- t- e-
o ....l lJ. l.L .....!... U U l.!.. .....!... lJ. U1948 1949 1950 1951 1952 1953 1954 1955 1956 1957 1958
FIGURE I.-Annual Hawaii skipjack catch, 1948-58.
PURPOSES OF THIS STUDY
The purposes of this study are (1) to examinethe raw ea.tch data and the ca.tch per unit of effort
ns measures of the apparent abundance of skipjack; (2) to seareh the data for differences between good and poor years in the fishe.ry; (3) tostudy movements of skipjaek within the fisheryduring the course of the season; (4) to examine thedistribution of pounds of skipjack caught, cntehper unit of effort, total effort, and size composition of the catch throughout the fishery.
281
282· FISHERY BULLETIN OF THE FISH AND WILDLIFE SERVICE
I wish t.o thank the staff of the Hawn.ii Divisionof Fish and Game who collected the fish-cat.ch reports that form the basis of this study. Vernon E.Brock and Tumotsu Shimizu made t.heir -dataavailable for study. AdditiolUtl information wasreceived from Saul Price of the U.S. ·Weat.her Bureltu who furnished the datlt on smlt11 cmft. warnings. Pet.er 'Wilson of Hawaiian Tuna Packel'S,Ltd., WitS instrumental in obtaining the logbooksfrom two fishing sampans; and Dr. Robert Riffenburgh suggest.ed certain useful statist.icalprocedures.
UTILIZATION OF DATA
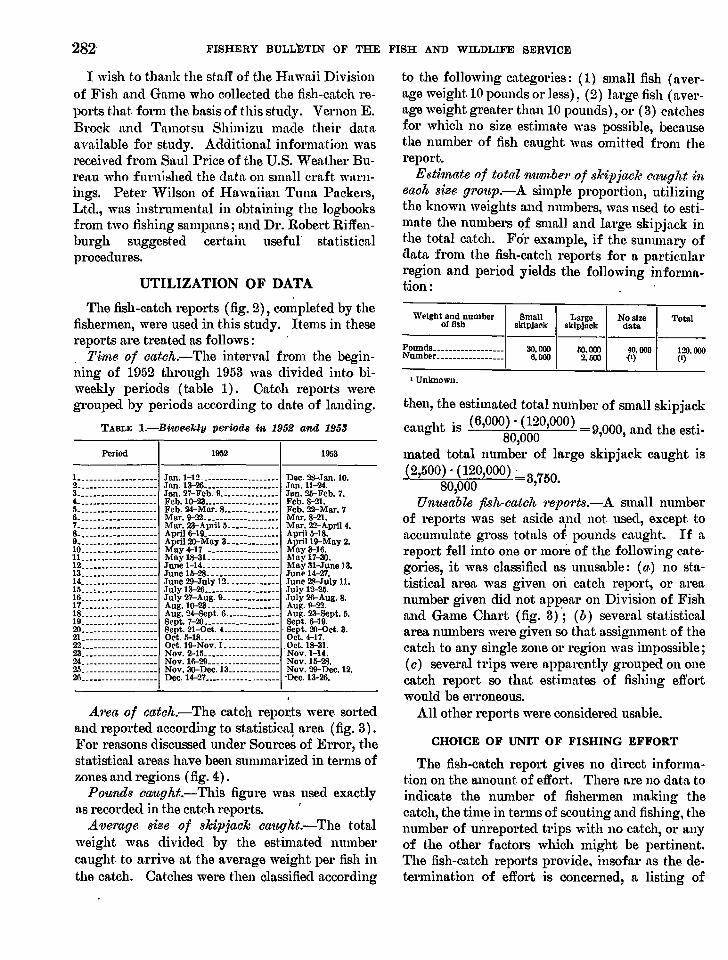
to the following categories: (1) small fish (average weight.10 pounds or less), (2) large fish (average weight greater than 10 pounds), or (3) clttchesfor which no size estimate was possible, becausetb.e number of fish caught. was omitted from thereport..
Esti1ll,ate of total11.1{.m.be'l' of 81dpjach.~ e£1.u.ghtineach size grOttp.-A simple proportion, utilizingthe known weights and numbers, was used to est.imate the numbers Clf small and large skipjack int.he total cn,tch. For example, if the summary ofaata from the fish-catch reports for a part.icularregion and period yields the following informat.ion:
The fish-catch reports (fig. 2), completed by thefishermen, were used in this study. Items in t.hesereports are treated as follows:. T·i:me of catch.-The interva.I from t.he beginning of 1952 through 1953 was divided into biweekly periods (table 1). Catch reports weregrouped by periods according to date of landing.
TABLE I.-Biwe.e.kly periods in 1952 and 1953
A1'ea of catch.-The catch repOl~ts were. sortedand reported according to statistica~ area (fig. 3).For reasons discussed under Sources of Error, thestatistical areas have been sUlllmarized in terms ofzones and regions (fig. 4) .
PO'U'1uls cau.ght.-This figure was used exactlyas recorded in the cat.ch reports. '
Average size of skipjack ca'll.ght.-The t.otalweight was divided by the estimated numbercaught to arrive at the avemge weight per fish inthe catch. Catches were then classified according
L ••• ._ Jan.1-12. •__ Dec. 28-Jan. 10.2_._•• ._. Jan.l3-26_ •• •••• _._._ •• __ Jnn.11-24.3_. __ ._. • Jan. 27-Feb. 9._._ ••••• _._ •• _ Jan. 25-Feb. 7.4_. ._. • Feb.1{}-23••• ••• ._ •• _ Feb. 8-21.5_. •• _.___________ Feb. 24-Mar. 80._•• ._ •• _ Feb. 2Z-Mar. 76 •__ ._. Mar.9-22_. ._ Mar. 8-21.7 Mar. 23-Aplil 5 Mar. 22-April4.8_. .____________ April &-19 • April 5-18.9 ._•• April20-May 3 • April 19-May 2.10 .__________ May 4--17. 0 May 3-16.11 ._. ._. May 18-aL ••• May 17-30.12 • • • June 1-14 ._. ._____ May 31~Tune13.13 June 15-28 • • June 14--27.14 • June 29-July 12. __ • June 2...'l-July 11.15 , • July 13-26 • •• __ July 12-25.16 •• July 27-Aug. 9 •__ July 2&-Aug. 8.17 •• Aug.IO-23. Aug. P-22.18 Aug. 24-Sept. 6.• Aug. 23-Sept. 5.19 • Sept.7-20 ._ Sept. &-19.20 •__ • Sept. 21-0ct. 4. . Sept. 2O-0ct. 3.2L • Oct.5-18_. Oct. 4-17.22. • ._ Oct. 19-Nov. L. .Oct.I8-a1.23__ • •••• __ Nov. Z-15 'Nov. 1-14.24 ._. Nov.1&-29 •. • Nov. 15-28.25 • Nov.30-Dec.13__ •• Nov. 29-Dec. 12.26__ • Dec.14--27_•• ••• • ·Dec.13-26.
Period 1952 1953
Weight and number Small Large No size Totalof fish skipjack skipjack data
Pounds__________________ 30,000 50,000 40.000 120.000Number. ________________ 6,000 2,500 ·(1) (1)
1 Unknown.
then, the est.imated total mUhber of small skipjack. (6000)' (120000) .
caught IS ' 80000' =9,000, and the estl-,mated total number of large skipjack caught is(2,500)' (120,000)' 3750
80,000 ,.Unusable fiJJh-eatch ·l'epo1'ts.-A small number
of reports was set. aside ttpd not used, except. toaccumulat.e gross totals of· pounds caught. If areport fell into one or more of t.he following categories, it was classified as unusable: (a.) no statistical area was given OIl catch report, or areanumber given did not appear on Division of Fishand Game Chart. (fig. 3)'j (b) several st.atist.icalarea numbers were given so that assignment. of thecatch to any single zone or region was impossible j
(c) several trips were npparently grouped on onecatch report so that estimates of fishing effortwould be erroneous.
All other reports were conside.red usable.
CHOICE OF UNIT OF FISHING EFFORT
The fish-catch report gives no direct information on the amount of effort. There are no dat.a toindicate the number of fishermen making thecatch, the time in terms of scout.ing and fishing, thenumber of unreport.ed trips with no catch, or anyof the ot.her factors which might be pertinent.The fish-eatch reports provide, insofar as the determinat.ion of effort is concerned, a listing of

SKIPJACK IN HAWAII FISHERY 283
dates on which fish were unloaded from the vessel. Each boat hils an official number-oi-crew, whichIt. is from this list, and ot.her dnta, that fishing is reported to the U.S. Customs (Yamashita, 1958,effort. was est.imated. t.able A-I). This figure, a constant for eac·h ve..<;sel,
Each usable catch report. was assumed to de- was assigned as a weight. to each usable catch re-scribe the result.s of a single trip of the vessel. port to represent the amount of effort expended in
TERRITORY OF HAWAIIBOARD OF' COMMISSIONERS OF AGRICULTURE AND FORESTRY
DIVISION OF FISH AND GAME
FISH CATCH REPORTName of Permittee Boat Permit No .
Name of Boat FG No .
Type of Fishing · ····.·· · ·DFORM C_I 5·193851 10M SETS·'·51
Fishing Gear ~ D
Date of Landing.................. . 19 .. Mo. Da,'
.- .. - ..
SPECIES CAUGHT I No. LIS. LIS.
IVALUE-
CAUGHT CAUGHT SOLD
Aku (Skipjack) 002-0 Ahi (Yellowfin) (Shibi) 0030 -----. >--------- ------1ft
Ahipalaha (Albocore) (Tombo-shibi) 004
C Japanese Bluefln (Black Tuna) (Masuro) 005Z I
::) Bis-eye (Menpachi-shibij ("Blu.fln") 006...Kawakawa 007 j-
Striped Marlin 009lit1M Black Marlin 1°10
--z.litO ~-
;:0 Short-nose Marlin
1
10711:II-.~ Silver Marlin 10&O·~~ Broadbill Swordfish 011lit -
Au lepe (Sailfish) 012 --Mahlmahi 013
Ono 014 IBAIT REPORT
BAIT FISH DAn TAKEN ~"M~I LOCALITY TAKEN QUANTITY TAKEN QUANTITY USEDDAY NIGHT
Nehu 41 buckets bucketslao 42 I buckets bucketsOpelu 20 II I fish fishSardines 07 Ii pounds
i,
- Val,!e ..p....n'. the...amount of mone, A8celved b, the fi.herman for total pounds of fish said. Do natrecord proce per pound. .
t Check one Ie! iridicate whether baiting was dane at do, or at night. Applies to Iivebaitinll ani,.
The above reports are true, correct, and complete to the best of my knowledge and~~ .
Signature _ Port of Landing.............•.............DPermitt.. or Authorized Agent
Island .
FIGURE 2.-I1awaii Division of Fish and Game, Fish Catch Report il95Q-54).

284 FISHERY BULLETIN OF THE FISH AND WILDLIFE SERVICE
'0'
• n
'I'
... ......•••
•...OT .,.
--. .-"'.
570.'
!
,..
...
..,
,..
'"
,..'I'
,n
...,..,..55'
...
...
...z., ..z
".f---
,n '"~
I ·~v15' . 110 .1'
THli (.HART IS NUT I:"loTr"UEU FUR lI\E IS :'\IAV1C:.\TION.
,., ,.' ,..(
... ,., \
'57
--"ot. .... ITI
--".
,n
FIGURE 3.-Hawaii Division of Fish and Game. Fisheril"S Chart No.2, Statistical Areas.
'l'ABLE 2.-Fi.fJhing effort in 1952 an.a 1953 for t'U'o Hon.ollll1t-1Jasea sk-i,pjack boats
1 2 3 4 5 6 7 8 9 10 11
Number Average Average Average Averagebiweekly Number Number Percent number Number number number number
Boat ilnd period periods Number productive non- non- trips pte'r days fishing days fish- l.rlEs per pl'Oductivewith trips trips productive productive biweekly (includes Ing per sys trips per
fishing trips trips period scouting) biweekly fishing days fishingperiod
BOAT A (196!)Jan. I-May 31; Oct. 5-Dec. 27-- 9 42 37 5 12 4.7 51 5.7 0.82 0.7lIJune I-Oct. 4___________________
9 61 56 5 8 6.8 66 7.3 .92 .l!liJan. I-Dec. 27, 1952_____________
18 103' 93 10 10 5.7 117 6.5 .88 .7\1BOAT A. (1963)
Dec. 28, 1952-May 30, Oct.82 84-Dec.26____________________ 15 74 10 5.5 85 5.7 .96 .87May 31-0ct. 3__________________ 9 58 55 3 5 6.4 59 6.6 .98 .93
>~
Dec. 28, 1952-Dec. 26, 1953______ 24 140 129 11 8 5.8 144 6.0 .97 .90BOAT B (196:2) -,
Jan. I-May 31; Oct. 5-Dec. 27__ 11 29 22 7 24 2.6 55 5.0 .53 .411June I-Oct. 4___________________ 9 33 31 2 6 3.7 55 6.1 .60 .56Jan. I-Dec. 27. 1952_____________ 20 112 63 \} 14 3.1 110 5.5 .56 .~
BOATB 8968)Dec. 28-May 30; ct. 4-Dec. 26_
16 69May 31-0ct. 3__________________ 60 \} 13 4.3 91 5.7 .76 .669 50 47 3 6 5.6 65 7.2 .77 .72
Dec. 28, 1952-Dec. 26, 1953______25 119 107 12 10 4.8 156 6.2 .76 .611

SKIPJACK IN HAWAII FISHERY
•
~~&
--
& & 2W~. .". '. . . &
./,~.j. IW1t;~5\;)· &
& &"A&. . •
~0
. - ./• -""& & . ,~ .... &"--.& &
• ·'OAHU··• • &.. •\ & "".ie" :(& • & ~'~ • && & & & & • .J. • ~. & &
• • • • ~~ L~ (£:::;;>:..~ ·/W''{ •. .~~~. ,& • & 2 &"Ai- • '" ,.:~/~r:. >r.".~ • &
• ". • &. & '. :MA~~
• • •• o' 4"k~& &
• •••• ~ &. ""
IL & 1'- -- ....... tfu.- && & &• D.~····i?·· 3•ZONES REGION •- ..".:0((.1 /'~ .• '" .&
I L I: 11• ..............OCEANIC & [& ,"/#~pj{b. _. •. ZJ, I: 2W...............OFFSHORE OAHU
./....; .,........~. ".' ......
- IL I: I W...............HAWAII ·,I·"·;:~..../;f7;.~t •4L I: 4 W...............MAUI • \. .~ .!f,~/J!~.f ... )
t.. ~: .....l .. :~.'i ... :; ...... •x....
IL I: SW................INSHORE OAHU & ~~ f '"j(I-l.<.--- &-
IL I: .W................KAUAI y.1f" \! /. /ZJ, I: SL................LEEWARD OAHU "h" ,/i
- IWI: SW................wINDWARO OAHU ,.~;~. \rZL.2W.SUSW....OAHU
- "L" INDICATES LEEWARD '-./or INDICATES WINDWI\RD
• 1952}STATlSTICAL AREAS,- & 1953 REPORTING CATCHES _._----'
FIGURE 4.-Hnwaii skipjack fishery fishing zones and regions and the extent of fishing in 1952 and 1953.
285
making the cat.ch. The number of fishermen isused as a factor in t.he computation of fishing effortbecause it seems reasonable that in pole-and-linefishing the efficiency of a vessel is more 01' less directly relat.ed to t.he number of men hooking fish.No adjustments were made for differences in triptime or for deviations from the official number offishermen. Inasmuch as a fish-catch report is required only if fish are caught., the unit of effortemployed in this study is the product.ive fisherman-t.rip. Thus, if a vessel with a registered crewof 10 men reported a catch of 20,000 pounds, theeffort is considered to be 10 units and the catchpel' unit of effort is 2,000 pounds.' If two 01' morecatch reports .were combined, the sum of thecatches was divided by tile sum of the effort toobtain the catch per unit of effort..
596560 0 -6Z ·z
To gain some knowledge of the reliability of theproductive trip ns a fact.or in the unit. of effort,the logbooks of two Honolulu-based skipjack fishing sampans were analyzed to determine the ratioof productive trips to the actual number of daysspent fishing; i.e., the time SPel~t in scouting forand catching skipjack. The result.s of this analysisappear in table 2. Boat. A is typical of the fleetas a whole in that it makes frequent trips of seldom more than a single day. Boat B, on the otherhand, is probably the most atypical in the fleetsince it. ventures far afield and may remain at seafor as many as 4 days, especially when skipjackare relatively scarce. The differences between thetwo boats are apparent in the number of trips perbiweekly period (col. 7) and the number of tripsper day's fishing (col. 10) .

286 FISHERY BULLETIN OF THE FISH AND WILDLIFE SERVICE
Eaeh year is divided int.o t.he more productiveand less product.ive parts; for eonvenience theseare called summer and winter, respect.ively (rows1 and 2 for each boat. nnd year). The number oftrips per biweekly period (col. 7) nnd number ofday's fishing pel' biweekly period (col. 9) nregren.ter duri.ng summer, but the mlio of trips today's fishing (col. 10) is not markedly different. inthe two seasons, although t.rips are somewhat.longer in winter.
Nonproductive trips (col. 5) occur with greaterfl-equency (col. 6) in winter than in summer, andthere is a tendency for the number of productivetrips pel' day's fishing to be greater in summer.Differences in the number of product.ive t.rips pel'dn,y's fishing are a.1so apparent. bet.ween years, asin 1953 t.here were generany more productive tripspel' day's fishing than in 1952.
To summarize the performances of t.he twoboat.s, it. appears that t.he rat.io of productive t.ripsto t.he number of day's fishing is greater duringt.imes of good fishing a,nd smaller during times ofpoor fishing. Since trips are shorter when the fishing is good and there are also fewer nonproduct.ivetrips, the actual effort in terms of day's fishing willusually be underestimated during the p'eriods ofpoor fishing as compared with periods of goodfishing.
Variations from the officialllllluber of crew willalso affect. the accuracy of t.he estimate of fishingeffort.. The official number is n maximum andvariations will usually mean that. fewer t.han theofficial number nre aboard. In the Hn,waiian skipjn,ck fleet, boats ordinarily carry the maximumnumber of crew during the summer season, nfterwhich some men leave to find other employment..In this study, since the official (maximum) number of crew has been used throughout. the year asa weight for the individual trip, t.he "fisherman"factor in t.he productive fisherman-trip is probablyoverestimated during t.he times of poor fishing.
Thus, the biases in the productive fishermn,n-t.ripbet.ween t.imes of good and poor fishing tend tocancel each other because during the winter seasonand years of generally poor fishing, longer tripsand t.he increased frequency of nonproductivet.rips cause an underestimation of the act.ual t.imespent fishing while, at. the same time, the act.ualnumber of fishermen on the boat is likely to befewer than the official number. The converse will
hold true during t.he summer season and in yearswhen good fishing attrncts the maximum numberof fishermen to the fleet..
Information is not. available to permit. t.he examination of the actual variations in the numberof fishermen n,nd the extent. to which t.hey offset.t.he bias int.roduced by nonproductive trips, but ifboat A is assmned to represent the average situation, the number of productive t.rips per day's fishing (col. 11) appears to be about. 10 percent great.erin summer than in winter. Since the crew of t.heaverage skipjack boat is about 10 men, the absenceof one of these men on the avemge during thewinter season represents a 10-percent overestinmtion of the number of fishermen. Thus, t.he absence of one fisherman per boat. during'the winterseason would be sufficient to equalize the bins inthe productive trip factor introduced duri~lg thewinter season.
SOURCES OF ERROR
Unreported catches or forms containing incomplete or inaccurate information are an obvioussource of error. Yamashita (1958, p. 258) estimates t.hat. the reported portion of the 1952 catchincluded 94 percent of the pounds, but, only 88 percent of the trips, indicat.ing a bias in favor of thereporting of large catches. Since small catches aremost likely t.o occur in the slack part of the year,there ma.y be a tendency for an estimate of the fishing effort, which is a function of t.he number oftrips, to be correspondingly reduced.
Inaccumte information is difficult to detectwit.hout. dat.a from other sources with which tocompare the catch records. On the basis of int.erview records, Yamnshita (1958, p. 258) est.imatesthat. only 45 percent. of the st.atistical areas imlieated in the 1952 eatch report.s were reasonablyaccumte. By means of broad geogmphical divisions to summarize the data (fig. 4), it is assumedt.hat the effects of such err<;weous information willbe minimized.
ERROR IN DETERMINATION OF FISH SIZE
Dividing the total weight caught by t.he estimated number as indicated in the catch report,yields the average size of fish caught, but providesno indication of the mnge or variabilit.y of sizes.Since the entire catch is assigned to eit.her thesmall or large category on the basis of the avemge

SKIPJACK IN HAWAII FISHERY 287
weight. per fish, a certain amount of enol' will re·suIt from mixed catches of small nnd lnrge fish;t.his error should distribute itself more or less randomly, however, so t.hat neither size· group isconsist.ently favored.
ERROR IN ESTIMATION OF FISHING EFFORT
There is no way to determine from the cat.chrecords the actual effort, i.e., t.he fishermnn-dayswhether productive or not., put forth on a skipjackboat.. In this study only pasitive fishing results(cnt.ch· reports) are available, and the productivefisherman-t.rip is of necessit.y used in lieu of thefisherman-day. Sources of error in the product.ivefisherman-t.rip have been discussed in the section,Choice of the Unit of Fishing Effort., and on thebasis of the performance of two skipjack boats forwhich logbooks are nvailable, it. appears to be. 'areasonable substitute.
OTHER SOURCES OF ERROR
The weight of the catch of skipjack t.aken in theHa\vaiian live-bait fishery is affected by complexfactors which present. sources of error t.hat. aredifficult to estimate.. Among these factors arevariat.ions in bait. supply, response of skipjnck tochum, behavior nnd number of birds in t.he flockswhich serve to locate schools, t.he size nnd behaviorof the skipjack schools, selection by the fishermen,and probably several others.
Yamashit.a (1958, p. 270) has discussed theproblem of ascertaining the influence of variat.ionsin bait. supply on the skipjack catch in t.erms ofannual production and suggests thnt in certainyears, when skipjack have been plentiful, theavailability of bait may be a limiting factor in thefishery. Royce and Otsu (1955) have investigatedmany aspects of behavior of skipjack schools andbirds; Yuen (1959) has studied the response ofskipjack to live bait.
In the present study no attempt has been madeto evaluate the sources of error introduced by thefactors considered above. Information availableis not adequate to discern which of these may beimportant nt any particular time. It seems r~ason
able that most of these fnctors act relatively independent of.one another so that over a period oftime their combined effects should not introducebias. However, it. is just as plausible that at certain times several of these elements may act in
unison resulting in considerable deviation fromthe normal state. The investigat.ion of the role ofthese factors in the fishery awnits a more sophisticated study than is attempted here or is possiblewith the present sources of information.
CONCLUSIONS ON SOURCES OF ERROR
None of the sources of error appears to be so extensive as to dest.roy the usefulness of the catchreport as the basis for a study of distribution ll,ndabundance. Some of the sources of error tend toreduce t.he bias int.roduced by others. 1Vit.h respect. to time, geography, and size, the categoriesemployed in this study have deliberately beenmade broad. We.re the study concerned with onlya few vessels, very short time periods, or severalsize groups, the probability of error would be increased, but as only the most general of categoriesare used, the influence of error on t.he result.sshould be slight.
RESULTS AND DISCUSSION
There are small discrepancies bet.ween the officialt.otal catches for 1952 and 1953 as listed by Yamashita (1958, table 2) a,nd the totals obt.ained in thepresent study (table 3) . These differences amountto 1 percent. and are probably the result of catchreports, which were turned in too late to be included in official summaries and to records lost ormisplac.ed during t.he interval of storage. Theproportion of unusable data in 1953 was greate.!'than in 1952 (table 4), largely because. of the poor
TABLE 3.-00mparatit'e du·ta ff'om :e stud1·es of the Hu·waU.a-n skipjack catch for 1952 aml 1953
YearPounds skipjack caught
Difference Percentdifference
Yamllllhita I Shippen •
1952__________________ 7,291,851 7,390,882 99,031 1.31953__________________ 12,059,406 11,928,965 -130,441 -1.1
1 Source: YamaslJita (1958, table 2).2 Figures adjusted to correspond with calendar year.
TABLE 4.-[Tsa.biUty of 1952 and 1953 cate1/. "epol't data
1952 1953
POWlds Percent Pounds Perrenl
Usable_______________ 7,270,990 98.6 11,345.013 95.0Unusable. ____________ 105,453 1.4 598.391 5.0
TotaL _________ 7,376, 443 100.0 11,943,404 100.0

288 FISHERY BULLETIN OF THE FISH AND WILDLIFE SERVICE
reports from the master of one sampan who consistently summarized his catches by weeksthroughout much of the year.
GEOGRAPHICAL DISTRIBUTIONOF 1952 AND 1953 CATCHES
Despite the large differences in total landings in1952 and 1953, the geographieal distribution ofcatch and effort (table 5, fig. 5) is mueh the same.In both years the leeward Oahu and Hawaii regions furnished approximately 50 and 16 percentof the total catch, respeetively, and the oceanieregion and Maui were relat.ively unimportant withless than 8 pereent in ~he aggregate., The combined windward Oahu and Kauai regiOlis contributed about 25 percent of the total catch in eachyear, but in 1953 a mueh larger proportion of thiseame from windward Oahu.
Within the vicinity of Oahu, the distribution of
effort. appears to be related to the distance fromthe home port.; the amount of effort expended inthe zones decreases as their distance from Honolulu inereases. This is probably because of thefragile nature of the nehu (8tolepllO'rUs ]J'u/rp'lJlreus) , the most important. bait spedes.
CATCH PER UNIT OF EFFORT IN THEHAWAII SKIPJACK FISHERY
If the re.gions of the fishery from Hawaii in thesoutheast to Kauai in the northwest are arrangedin sequential order (fig. 6), there is some suggestion of an increasing eatch per unit-of-effort in thedheetion of Kauai, but the: inequities in the distribution of effort. and eertain known differences inthe local fisheries make it doubtful t.hat the apparent trend is of biologieal signifieance. TheHilo (Hawaii) fishermen usually make short trips.and land each day's catch on the day it was made,
TABLE 5.-GeographicaZ distrib,/tUo'll of the 1952 a.nd 1953 usabZe catch data
[See fig. 4 for location of zones; C/E=catch/effort]
1952 1953
Regions and zones Catch Eflort Catch EffortCIE C/E
Pounds Percent Units Percent Pounds Percent Units Percent
Oceanic:1L_______________________183,729 2.5 244 1.2 753 274,358 2.4 439 1.7 6251W ______________________128, 458 1.8 348 1.8 369 191,531 1.7 236 0.9 812
TotaL_______________ 312,187 4.3 592 3.0 527 465,889 4.1 675 2.6 690
HawaII:3L_______________________252,659 3.5 1,073 5.4 235 4115,317 4.3 1,572 6.2 3093W__________________~___ 881,673 12.1 2.869 14.6 307 1.288,967 11.4 3,676 14.4 351
TotaL ______________ 1,134.332 15.6 3,942 20.0 288 1,774,284 15.6 5,248 20.6 338
Maul:4L___ ~___________________115.113 1.6 119 0.6 967 25,257 0.2 62 0.2 4074W______________________139,939 1.9 463 2.4 302 179.291 1.6 452 1.8 397
TotaL ______________ 255.052 3.5 582 3.0 438 204,548 1.8 514 2.0 398
Inshore Oahu:·5L___________ -___________ 2,259.734 31.1 7,350 37.3 307 3.365.5018 29.7 9,116 35.7 3695W__________ •___________719,780 9.9 1.95~ 9.9 369 1.742.242 15.3 3,266 12.1\ 534
TotaL __ •___________ 2,979.514 41.0 9,30* 47.2 320 5.107,780 45.0 12,382 48.5 413
Otlshore Oahu:·2L_______________________1,486,181 20.4 3,519 17.9 422 2,656.150 23.4 5.022 19.7 5292W______________________
157,854 2.2 361 1.8 437 415.346 3.7 674 2.6 616
TotaL_______________ 1.644.035 22.6 3.880 19.7 424 3,071,496 27.1 5.696 22.3 539
Oahu region subtotals:·10.869 345 6,077.707 53.6 14,242 427
L ________________________3,745,915 51.5 55.2 55.8W _______________________
877,634 12.1 2,31~ 11.7 379 2,212.112 19.5 3,990 15.6 554-
Region totaL ________ 4,623.549 63.6 13,182 66.9 351 8,289.819 73.1 18,232 71.5 455
Kauai:6L_______________________284,845 3.9 560 2.8 509 217.722 1.9 373 1.5 5846W______________________661.025 9.1 844 4.3 783 392.751 3.5 462 1.8 850
TotaL_______________ 945,870 13.0 1,404 7.1 674 RIO, 473 ~.4 835 3.3 731
Orand totaL________ 7,270,900 100.0 19,702 100.0 369 11,345,013 100.0 25.504 100.0 445
·The Oahu region includes inshore and offshore OahU, 2L, 6L, 2W, and 5\'/. For lA53, a few additional catch~s were made across zone boundli.ries withinthe Oahu region.

SKIPJACK IN HAWAII FISHERY 289
C·2.4E' 1.7
C·2.!!E' 1.2
~~ E.i:a/' /-e
"~COI.9 \V 1::01.5 '.
"Y'----{
]!'IGURE 5.---Geograpbical <listrHmtion of catch and effort in the Hawaiian skipjack fisbery, 1952 and 1953.
whereas the trips by Honolulu-based fishermen tothe vicinity of Kauai are longer than a single day;therefore, the differences in time-of-trip betweenthe two areas are probably significant.
Similarly, eatch per unit, of effort tends to increase with increasing distance from shore (fig. 7).Only a fraction of the total effort was expendedin the oceanic region as compared with the effort.inshore, and a few good catches of large fish mayhave l)roduced an index far out. of proportion tot.he actual apparent abundance. Royce and Otsu(1955, p. 18) , however, report. sighting more tunaschools per day's scouting beyond 19 miles fromshore than were seen within 19 miles of shore.
SIZE OF SKIPJACK AND POUNDS CAUGHTPER UNIT OF EFFORT
There is a positive correlation (fig. 8) betwe.enthe average size of skipjack caught in zones of thefishery during the year (table 6) and cOlTesponding catch per unit of effort (ta.ble 5). Zones wit.hless than 5 percent of the total annual effort arenot included in the analysis beeause they are unlikely to represent fishing conditions throughoutthe year. This correlation appears to substantiatethe observation that the larger skipjack usuallycan be caught more effieiently than the smaller, upto the size at which individuals must be gaffed inlanding and the efficiency drops.

290 FISHERY BULLETIN OF THE FISH AND WILDLIFE SERVICE
IOOO..--,-------r----,------r----,-----.HAWAII MAUl
LEEWARD WINDWARDOAHU OAHU KAUAI
INSHORE OFFSHORE
looor--__OA~H.::U=------~OA:.:..;:.H=U-----~O_C-=ErA_NIC--,
2.6
1953
22.3
·..·..·..,..·....·..·..·r..··..·....·........,.,............................ SMALL SKIPJACK
48.5
SMALL SKIPJACI\
LARGE. SKIPJACK _".-'
. .-'-.-----0--------
,/.1'
'"'",/LARGE SKIPJACK ,/,/
,/
"".,/,/
'".,A'''' ALL SKIPJACK,., ...... .",.. I-----
1952oL__.......l.1 l...1::- ----=":::1__----'
47.2 19.7 3.0
IOOO..------r-------,....--------r-----,
eoo;;;'"z::>~I-a: 600~...'"l!;I-Z::> 400a:~~
~..u
200
0
BOO
;;;'"zB2:
~600
'"~I-Z::> 400a:~~u
5200
1953
1952
2.0
ALL SKIPJACK ,D
~·_---_._~._.----·--T---·_·///SMALL SKIPJACI\
I'/
//
//
/LARGE SKIPJACK /
/ _",,/_.-0-_..1.. "",0'-_...... --~..,.,.
/\, Ii'" , LARGE SKIPJACK /
I ',;, /I ,/ /
I '," // , /" ~-----// ALL SKIPJACK
I
' ..,•••••• \ ..,.••••••••••••••••••••.0
SMALL SKIPJACK
20.6
800 -;;;'"zB2:i: 600~i:;
ts!::z::> olOOa:~~u
5200
0
1000
800:gz
~I-a:
600
~~!::z::>
~400
~ut<u
200
.1PERCENT EFFORT PERCEIH EFFORT
FIGURE 6.-Pounds caught per unit of effort by islandregions.
FIGURE 7.-Poumls caught pel' unit of effol;; by distancefrom shore.
TABLE 6.-Average weight 01 skipjack cattght in each zoneof the fishery
6UO'r----.----,----r---,---,------r--r----,
AvERAGE WEIGHT OF SKIPJACK
FIGURE S.-Regression of catch pel' unit of effol·t onaverage weight of fish caught.
16
• 1952500 o 1953
I-'100..
~...'" 3W~ :lOO •I-Z
'-------~ =116.4 +28.85IX)::>..~
200:I:
8 r= +.90
'00p<.OI
00Each year the small fish are caught in Hawaii
(zones' 3L and 3W) ; the larger fish are. from inshore windward Oahu (5'W) , and offshore leewardOahu (2L). The association of small fish with
°Indlcates zones receiving more than 5 percent of the total fishing effortduring the year.
1952 I 1953 1952 1953
Zone ZoneAverage Average Average Averageweight weight weight weight
(pounds) (pounds) (pounds) (pounds)
1L_________ 15.5 18.2 4L_________14.5 12.11W________
7.9 14.7 4W________ 11.9 13.02L.________ °9.0 °13.9 5L_________ °8.2 °11.22W______._ 17.2 15.9 5W________ °9.2 °12. 83L.______._ °4.8 °7.7 6L_________ 6.7 11.53W______._ °4.8 °7.56W________
12. 8 8.1

SKIPJACK IN HAWAII FISHERY 291
Hawaii may be explained by the nat.ure of thefishery there, which is bl1,sed lnrgely on semiresident populations of small skipjack. Otherpopulat.ions of small fish are known to occur ininshore areas of leeward Oahu (5L), and t.hese areusually exploited when t.he large skipjack are inlow abundance and prOduce the int.ermediat.e aver-
age weight for zone 5L. Zones 5W and 2L aremore remote from Honolulu than is 5L, and itseems probable that. the fishery in these zones maybe biased in favor of periods when large skipjackare ava;iIa.ble, which could account. for the relat.ively greater average weight. per fish in thesezones of the fishery.
23 6 20 4 IB I 15 29 13 27 .0 24 , 21 5 19I I I I I I I I I I I I I I I I5 19 3 17 31 14 2B 12 26 9 23 6 20 4 IB I
APR MAY JUN JUL AUG SEP OCT
.1952: 7,376,443 POUNDS
[2] 1953: ",943,404 POUNDS
'953 DATES FOR BIWEEKLY PERIODSARE ONE DAy DISPLACED EXCEPT ATno£: BEGINNING OF THE yEAR WHENTHEy ARE TWO DAYS DISPLACED FROM1952
1200
"001-
10001-
900-
800-
U>c
~700-.....
0U>
600-c
~2I-
500-i!::I:U
~u
400 I-
300I-
2001-
.' ". ;~
1001- 'f i:: :.~r-:iI " .
eJ, ~ .•. ,~~,o I' 13 27 10 ~ I.u ~
I I I I I I12 26 9 23 B 22
JAN FEB MAR
.~
/
~ "'"....~ ,'.
;,;
'.{';-,.
P.? " r;.'~
"
'"I""'
i1;: .'
:; ;,
(~'/
I:' "::,-; .,
~V
//. ./.
/. : j'. ,
;-'
7-
~:}
~.,/ .'
.'. ,;.
'" ;
(f
·r
-
-
-
-
-
-
-
-
-
-
~ jjw' 30 14, , , .;,15 29 13
NOV DEC
r ':rn,n: : ' : : : :' :9:3 :~:~:D:J
~L: ::~:.: :.~ :::.: ::::.: :9~2: :lW2 3 4 5 6 7 B 9 10 " 12 13 14 IS 16 17 IB 19 20 2' 22 23 24 25 26
BIWEEKLY PERIODS
FIGURE 9.-Catdu-s (pounds) of the Hawaii skipjack fishery. 1952--1953, by biweekly periods, Periods of sDlall craftwarnings are shown below.

292 FISHERY BULLETIN OF THE FISH AND WILDLIFE SERVICE
DISTRIBUTION OF 1952 AND 1953 CATCHESBY BIWEEKLY PERIODS
Catches for the Entire Fishery
Only during July and August (periods 14-17)and briefly in December (period 25) did the 1952skipjack catches reach the magnitude of the 1953totals (fig. 9). In particular, t.he spring of 1953and, to a lesser extent, the autumn months provided much larger catches t.han oecurred in 1952.
Effects of Small Craft WarninAs
There were 49 days with small craft warningsduring 1952 and 17 during 1953 (fig. 9), but only6 of these fell in the interval from April throughSeptember in 1952 and none in 1953. The effectsof tough weatiler, therefore, appear t.o be relatively minor in comparison with the seasonalfluctuation in tile availability of skipjack.
The immediate effects of poor weat.her may beindieated by the relatively small catches made during periods 1, 2, 5, 6, 23, and 24 of 1952, each ofwhich had several days with small craft warnings.Period 25, on the ot.her hand, shows an increase incatch despite 5 days of poor weather.
MOVEMENTS OF SKIPJACK WITHINTHE FISHERY
Local changes in the skipjack catch within theentire range of the fishery may result from changesin the amount of fishing effort or from changes inavailability. The latter may include horizontalmovement of the fish into or out of a; particulararea or, within an area, a c.hange in the verticaldistribution or behavior such that the catch rateby live bait fishing is affected. The records of thefishery, however, provide no means by which oneor the other cause may be, determined, and it is
. therefore assumed for the purposes of this (liscussion that all Changes in the catch are caused by.movements of fish from one area to another.Thus, errors, if any, are likely to be on the side ofpostulating a horizontal movement of fish whenthere has been a change in vertical distribution,behavior, or fishing effort. This approach seemsto be the most reasonable one, because tagging experiments show that individual skipjack travel thelength and breadtil of the fishery, while knowledgeof changes in availability and fishing effort, particularly if nonproductive, remains quite limited.
Larie Skipjack
After an interval of low abundance throughout.the islands during the early part of 1952, largeskipjack (fig. 10) appeared simultaneously insmall numbers in leeward Oahu and Kauai inperiod 8. In period 10 the fish arrived in windward Oahu and Hawaii. This sequence suggestsan approach from the west. In period 12, a· concentration centered in wiI}.dward Oahu occurred;it appears to have sllifted northward to Kauai byperiods 15 and 16. In period 17, however, thecatches of large skipjack ceased in Hawaii andbegan to dwindle in Kauai, but at the same timethe largest catches of the year were being made inleeward Oahu. All tilese changes seem to indicatethat the large skipjack had returned to the leewardside of the island chain. The gradually diminishing catches from Kauai and leeward Oahu inperiods 18 through 20 indicated t.he withdrawal ofseason fish to the westward. After period 20, thenumbers of large skipjack in the catch returned tothe state of low variable abunda.nce which dlaracterizes the off-season of the fishery.
During the interval from period 25 (1952) untilperiod 4 (1953) the number of large skipjack takenin all regions of the fishery was uniformly low, acondition typical of the winter season. In period5, however, a sharp increase occurred in the catchof large skipjack in the leeward Oahu region. Tojudge from the variation in average weights (fig.12), these fish were 1952-season fish, being somewhat heavier than 1953-season fish which enteredthe fishery in period 9. These 1952-season fish appeared in the cat.ches during periods '5, 7, 8, and9 and were the ca.use of the apparent early beginning of t.he "season" in 1953 (fig. 9).
In period 9 of 1953, the season fish were present.t.hroughout most of the fishery (not.e the decliningaverage weights in periods 9 and 10, fig. 12) but.the large cat.ches in leeward Oahu in periods 10through 12 suggest that t.he direction of the approach of the main body of fish was from the leeward. As in the previous year, a peak occurredearly in the season in windward Oahu (period 12,1952; p~riod 13, 1953), and in succeeding periodsthe fish dispersed southward to leeward Oahu andHawaii where large catches were made in periods15-17. Following the excellent catc.hes of period17, tile best of the year, a gradual decrease in catchoccurred, and by period 23 the sea.son was over.

SKIPJACK IN HAWAII FISHERY 293
18&2 18&312
I() lAUAI lAVAl
6
4
0.4
38,195
12 WIIDWARD WIIDWIID10 OAHU OAHU
8
6
LIEWARDOAHU
LIIWARDOAHU22
24
0,'--------26,....-----------...-=-:,,----------,
-30,611
20
18
16
14
12
10
8
6
4
o'----"L.-IL......I..
l0r------------------. ,-------------------.
8 HAWAII HAWAII
10 15
BIWEEKLY PERIOOS
20 10 15
BIWEEKLY PERIODS
20 25
FIGURE lO.-Number of large skipjack caught il952-53) ; biweekly periods.
Certain features common to both years are to benoted: (1) the approach of the large fish at thestart of the season, apparently from the leeward;(2) the concentrations on the windward and leeward sides of Oahu in June and August, respectively; and (3) the final disappearance of fishto the leeward. Differences in the 2 years are asfollows: (1) the appearance in the early part of1953 (period 5) of large skipjack, and (2) thedirection of movement of the season fish betweenthe time of the windward Oahu· peak catches
(periods 12-13) and the leeward Oahu: peak(period 17). In 1952 the fish ,vent northward toKauai and thus close to the limit of the fishery.In 1953 they returned to leeward Oahu andHawaii to remain well within the range of theHonolulu and Hilo based vesse.Is.
In general, the movements of large skipjack, asindicated by their occurrence in the commercialcatch, do not suggest an orderly migration alongthe island chain. The reason for this may be inthe direction of approach of the migrating schools,

294 FISHERY BULLETIN OF THE FISH AND WILDLIFE SERVICE
9
992
88
80
3077
RELATIONSHIPS BETWEEN CATCH STATISTICS
The population indices derived from the catchreports are t.he raw catch and the relative catch;i.e., cat.ch per unit of effort. Eithe.r inde.x may bein tenns of weight or number of fish and may beealeulated for the entire cat.ch or for limited categories. Since 1954, however, no informat.ion on:the number or size of fish in the catch has been included in t.he catch report, so the only indiceswhich may be considered for recent years in thefishery are t.he pounds caught and the. cRtch perunit. of effort. without respect to size categories.
The biweekly statistics for pounds caught, catchper unit of effort., and effort. wit.hin t.he Oahuregion for 1952 and 1953 are plotted in figure 11.Of pa.rticular interest he.re is the relation between the raw c.atch and the catch per unit ofeffort, for if the two show essentially t.he samevariation, there is little or no advantage to begained in employing cateh per unit of effort as theindex of apparent abundance. .
It is obvious from figure 11 that there is muchsimilarity in the fluctuations of all three indices;each has a seasonal variation on which lesser fluct.uations are supe.rimpose.d.. Additionally, there isa secular trend from 1952 to 1953. The catchcurve tends to change gradually and peak sharply,while tJle effort curve changes rapidly at. the startand close of ~he season, with little trend duringmidyear.
TABLE 7.-(Jompal'ati'Ve sta·ti-stics tOI' the Oahu /f.sh61'1J,1952 a·t14 1958
1952 1953 1953/1952
1. Total pounds caught. ________________ 4,623.549 8,715,958 1.8(Percent of total for skipjack flshery.!_ (63) (73) -----Tii-a. Large skipjack onlv. _________ •___ 2,058,'921 6,366,336
b. Small skipjack only_____________ 2,564,628 2.349.6222. Total productive effort_______________ 13,182 19,169 1.45
a. Large skipjack, percent_____ .' ___ 34 55 ----------b. Small skipjack, percent _________ 66 45 ---_._----3. Pounds caught per unit of effort. all
usable catches_______________ •___ 351 455 1.30a. Large skipjack only_____________ 462 533 1.15b. Small skipjack only_____________ 270 261 .m
4. Total num~~ o.f ~h caughL________ 521,500 677,000 1.a. Large s IPISC only_____________ 123, 500 330,500 2.6b. Small skipjack only_____________ 398, 000 346.500 .8
5. Average number caught per biweeklyperlod_________________________ : ___ 20,577 26,038 1.276. Median number ofskipjack caught in
each year for the 26 biweekly periods. 18,044 25,833 1.437. Number of lIsh caught per unit ofeffort. ___________________________ 40 35
a. Large skipjack only_____________ 28 31 1.11b. Small skipjack only_____________ 46 40 .87
8. Numb0r of biweekly periods wlth-a. more than 300.000 pounds catl'h_ 5 14 2.b. more than !lOO units lIshlng ef-fort____________________________ 5 11 2.20c. more than 400 pounds catch perunit of effort______________ •___ 5 14 2.80
which appe~rs to be perpe.ndicular rather thanparallel to the barrier formed by tile islands. Therelative speed with which schools travel, whichmay reach 15 knots (Royce and Otsu, p. 18), maybe such that a period of 2 weeks is too long to discern a migratory pattern within an area as smallas that encompassed by the Hawaiian skipjaekfishery.
OAHU SKIPJACK FISHERY, 1952 AND 1953
STATISTICAL COMPARISONS
The comparative statistics for 1952 and 1953 inthe Oahu region are summarized in table 7. Inalmost every way, 1953 reflects the greater availability of skipjack than in the previous year, asevidenced by (1) a much large,r catch, (2) ah~osthalf as much fishing effort, and (3) a larger catchper unit of effort. The number of smaH skipjackeaught (4b) and pounds caught per unit of effort(3b) are not markedly different between years, butthe eatch of large fish, both in absolute numbers(4a) and on a relative basis (Sa), is considerablygreater in 1953. Most of the differences betweenthe 2 years can be attributed to the abundance ofthis size group in the fishery.
Independently of size considerations, the number of fish taken per biweekly period in 1953 waslarger than the corresponding number in 1952 (5and 6). The relative abundance of large and smallskipjack in the 2 years is indicated by the numbercaught per unit of effort (7) which is greater forthe small fish in 1952 and for the large fish in1953. The. importance of the abundance of largefish to the success of the fishery may be measuredby the comparative number of biweekly periods inthe various categories (8).
Small Skipjack
Examination of the numbers of small skipjaekeaught and the corresponding eatch per unit-ofeffort data revealed no discernibl~ pattern of movement within the fishe.ry. Large skipjack are theprime objective of the. fishery and the smaller sizesare usually taken as a second choice. The numberof small skipjack in the catch, there.fore, te.nds tobe a function of the number of large fish available.The relationships between the numbers of largeand small fish in the cateh are discussed under thesection, Size Composition.

SKIPJACK IN HAWAII FISHERY 295
I
r." III I.
f' "
" "I, I'I I ",A,:' : tt, I \, \ I ""\
:'v' V.\: I, ....... I \
j 1\ ~ \,'\: l \
~': ":\ I \, ~.1 ,I ..
,'\ : "." \""""'"~ \
\ ...........\\.\
\........-....
•.•...•. POUNDS CAUGHT liN THOUSANOS)
-- - EFFORT (NO. OF F'SHERMAN ·TRIPS)
- CATCH PER UN'T OF EFFORT (POUNDS)
("\, I
~\ :, ,/ \ .....-,
I,(,,,,,
II,
'------8IWEEKLy PERIODS-19SZ---~
oL..Ld:.::J.-L..:Jt:::L.L.1.....L..l...J.....LL....L..l...J.....L.....L...I:-l....,L-L.::'::-...L....L-'-.L..J...~....,L-L..I...7...L...I.g-'-,LI '-:':-'3...L....L'S-'-'':-7.LL,g...L....LZ...., LZ:':-3.LLZS....L..l
'------BiWEEKLy PERIODS-'9S3------'1
200
roo
600
50D
800
400
900
1100
1200
1000
1:100
E'IGUBE ll.-oahu region catch statistics, 1952 and 1953, biweekly periods.
The results of these tendencies in catch andeffort curves on the ca.tch per wlit-of-effort curveare as follows: (1) During midyear when efforttends to be constant, the catch per unit of effortwill closely follow the fluctuations in, catch. (2)During the onset and decline of the season, effort ischanging more rapidly than catch and the catchper unit of effort will change at an intermediaterate. Random fluctuations in the catch per unitof-effort at this time may be somewhat at variancewith those in the catch, as occurred in the intervalfrom period 24, 1952, to period 3, 1953.
Correlation analysis between raw catch andcatch per unit-of-effort data yields a coefficient of-+:0.92. It was necessary to use rank correlationmethods (Snedecor, 1956, p. 190) because the distribution of catches is skewed toward smallcatches. In order to determine the amount ofagreement 'between the random fluctuations in thetwo indices, the first differences were correlatedand yielded a coefficient of +0.79. Conventionalmethods were used here because the first differences are distributed more normally tha!l theoriginal series. The probability that correla.tioncoefficients this large would occur by chance is lessthan 0.01.
The variate-difference technique (Kendall, vol.II, p. 387-390) was used to obtain an estimate ofthe variance in the random component of eachindex compared to the varianCe of the original
series. The values obtained for the random components were 24 percent for the raw-catch seriesand 18 percent for the catch per unit-of-effortseries. Since it exhibits a smaller random component, the catch per unit-of-effort series appearsto be somewhat more reliable than the catch as anindex of skipjack availability, but only slightly so.
In summary, the raw catch is almost as accurateas the catch per unit of effort in indieating t.heseasonal variat.ion in skipjack abundance in theHa.waiian fishery. During the middle of the yearthe raw catch is in good agreement with the random fluctuat.ions in catch per unit of effort., but.during the off-season of the fishery, when effortand catch are eithe.r declining rapidly or are at alow level, random flnctuations in catch per unit ofeffort may not. vary in agreement wit.h fluctuationsin "catch. For most purposes, total catch ,vouldappear to be as useful an indicator of availabilityas the cat.ch per unit of effort, espeeially in problems where t.he seasonal trend in the fishery isa.pparent.
USE OF CATCH RECORDS TO DETERMINEPOPULATION COMPOSITION
The catch statistics of the Hawaiian fishery aret.he only continuous sonrce of information whichprovides a means of assessing the nature of theskipjack popula.tion which supports the fishery.Inferences about. this population must be made

296 FISHERY BULLETIN OF THE FISH AND WILDLIFE SERVICE
81WEEKLY PERIODS
10
12
~18 ~
~
16 ~
14 1I
'2
24
26
24
22 8~
20 !
18 ~~
16 ~
14 ~
_1B..............J'o
r----------------~;26
FIGURE 12.-Catch of large skipjack in the Oahu region,1952 and 1953.
number of large fish caught) with the interval ofunifonp. weight increase suggests that in 1953 asingle population of season skipjack was availableto the fishery, but the erratic fluctuation in thenunlbers taken indicates that variations in thisavailability were quite marked.
Period 5 of 1953, with its unusual numbers ofvery large fish, must consist of skipjack gre~ter insize than the 1953-season fish. It seems probablethat these very large skipjack are 1952-season fish,which were present only briefly that year. Therelatively high average weights during otherperiods of early 1953 imply that 1952-season fishmay have been generally present during that time.In early 1952, on the other hand, few of the previ'o~s year's season fish were present, as judged bythe average weights during periods 4 to 7.
40
35 1952;;;0
30z;A::>2 25l-
i!!I- 20J:
'"::>..u
150:..II>::&::> 10z
5
0
55
50
195345
Vi 400z..'" 35a~i!: 30I-J:
'"::> 25..U0:..II> 20::&::>z
15
10
5
0
1 Conversions of length (millimeters) to weigh (pounds) weremade accorddng to the formula: Log weight= -8.2755+3.34913log total length.
Fluctuations in the Catch of Large Skipjack in theOahu Region
The growth rate of Hawaiian skipjack has beenstudied by Brock (1954, pp. 96-97) by means oflength frequency distributions. During the summer there are two dist.inct modes, one at about 45em. (4 pounds) and one at abOut 70 em. (18pounds).l The mode of large skipjack representsseason-fish and presumably a smaller number ofthe previous year's season-fish. It is this mode.that is considered here as large skipjack. The timeof year when a mode, which Brock assumes to be ayear class, passes through the weight (10 pounds)which separates small and large fish in this study,is apparently wint.er or early spring. During theperiod from May to October, it may be assumedwith reasonable certainty that the s~ll\.1l skipjackare a year younger t.han the large skipjack.
In 1952 there appears to be little consistency inthe average weight for large skipjack (fig. i2),which fluctuates widely from one biweekly periodto t.he next. By c,ontrast, 1953 has an intervalfrom May 3 through Oct~ber 3 (periods 10-20)with a regularly increasing weight for large fish.!he rate of this increase, 0.25 pound per week, isIII agreement wit.h Brock's curve for skipjackgrowth, which yields a linear weight increase of0.25 pound per week. The coincidence of the season of greatest productivity (as indicated by the
with caution, however, because the fishery islimited geographically to the immediate islandarea (fig. 4). Furthermore, the catches are alsoinfluenced by availability, fishing effort, and selectivity on the part of the fishermen, which may notbe constant throughout the year. Brock (1954, p.100-103) llas shown, by means of sex ratios, thatthe availability of female skipjack is not constant.He suggests that spawning activity ma.y be thecrucial element. The cyclical nature of fishingeffort has been shown previously (fig. 11), and thefact that the fishermen are selective in the schoolsthey fish is common knowledge. These binsesappear to have an annual cycle and between-yearcomparisons may. not be affected by them to theextent of within-year comparisons.

SKIPJACK IN HAWAII FISHERY 297
Size Composition
Small skipjack are usually sought by the fishermen only when tJIey a·re unable to locate la.rgerfish. One would expect, therefore, that the occurrence of small fish in the catch would be inverselyrelated to the presence of the larger skipjack, andthis does seem to be the situation. The numbers oflarge and small skipjack taken in the Oahu fisheryin each biweekly period of the 2 years under studyis plotted in figure 13. In 28 biweekly periods(1952,8-20; 1953,8-22) when large skipjack weregenerally present, a tabulation was made to seehow frequently the changes in the number of onesize group were associat.ed wit.h similar or opposite'changes in the other. Opposite trends, e.g., thenumber of large skipjack decreases from the preceding period while the number of small skipjackincreases, occur in 22 periods while similar trendsoccur in 6. The probability of obtaining such adistribution if the numbers of large and small fishin the catch fluctuate independently of one anotheris less than 0.01.
Size composition appears t.o be important in thedetermination of the general level of catch (fig.14) and the pounds caught per unit.-of-effort (fig.15). Both increase rapidly with an increasingproportion of large fish up to a ratio of 11arO'e fisho .for 1 small fish. Above this ratio the t.otal catchcontinues to increase at a fairly rapid rate, but
eatch per unit of effort increases at a slower rate.The likelihood of catches of large numbers of
indiv:.duals seems to be loosely linked with the sizecomposition. During the interval inclu~ed in tlusst.udy, the largest numbers of skipjack were takeneither when small fish were especially numerousand very few large fish were available or whenlarge skipjack were in a majority (fig. 16). Whensmall fish outnumber the large, but are less than 10times as numerous, there seem to be faetors thatwork against the capture of a large number ofindividuals. These faet.ors, if they exist, are probably related to the distribution of the various sizegroups in the population which supports the fishery. A hypot.hesis conceming the structure of thispopulation is offered below.
ConJecture
In order to account for tJIe variations in apparent abundance of part.icular size groups in thecatches, it is necessary to hypot.hesize a skipjackpopulation consisting of at least three and possibly one additional element. In the approximateorder of their importance to the success of thefishery in 1952--53, these are as follows:
Group A: "Season fish," approximately 17-22pounds ill weight, whieh Brock assumes to be ineither their second or third year of life. Thisgroup is migratory.
FIGURE lS.-Estimated nUilIlJbers of large and small skipjack taken in the Oahu fishery, 1952-53, by biweekly periods.

298 FISHERY BULLETIN OF THE FISH AND WILDLIFE SERVICE
10I I I I I I
.:19- ..;-'.,] ...
• 17 I A 11.2 BIWEEKLY PERIODS IB- • lIsa BIWEEKLY PERIOOS -
'" AI7az 7- -::>aa.azcr .'2'" 61- -::>0 ---J:: ------I- ---a .'& --- .'5
'" ---II: 51- --- -az.'6 .,.. ... ,., .... --::>
A'.J:: .'9 -;;!; -- A'&.11
J:: 4i--£'s / - -u ,. /
.-Ii 0/u ,go ...::> .. , 21110J:: ,.&cr 31- .5 .20 -a ,...J
, .22 A'2I! /II£.
e .1.2(1 ,/ 113
I2t-. ' -'1:, 6"7
2'rftA22
.2' 1911-"-·25 .24 -'260
I I I I I I0 .2 4 .6 B 2 3 7 II 15 19 23
NUMBER OF LARGE I SMALL SKIPJACK IN THE CATCH
FIGURE 14.-Size composition and the total catch in the Oahu skipjack fishery, 1952-53.
Group B: Nonmigratory small fish, whichduring the summer months a.re abQut 4 to 8 poundsin weight. These fish occur in semi-permllnent aggregations which are to be found in certainlocalitil3S, usually near shore, where presumably oceanographic conditions are suitable for the concentration of food organisms. These fish, according toBrock's hypothesis, are a yellr younge.r than theseason fish. This group serves as the main sourceof supply for some of the fishermen, but. in genernl it functions as a reserve supply where most.of the fishermen can use·theirbait., when largerfish are not available.
Group C: Large migratory skipjae.k, 28-32poundS, which may be a year older than the seasonfish. TIns group seems to have been abundant during the first. part of 1953 and accounts for the apparent early begining of the season in t.hat. year.
Group D: Migratory small skipja.ck. The existence of this group is not. well est.ablished; however, the large numbers of small fish which appearsuddenly in the fishery in periods 14, 15, and 20 of
1952 suggests that there may be a migratory groupof small fish as well as the semiresident. group.
In figure 16, catches of large skipjack numbering in excess of 15,000 were all made when seasonfish (group A) were apparently dominant. in thefishery; the large catches of small skipjack, thosein excess of 40,000, are presmned to result from thepresence of migratory small fish (group D). Thesharp decline in the number of periods withcatches of small skipjack greater than 25,000 mayindicate that t.his number is about the maximumnumber of nonmigratory fish (group B), whichare available during a biweekly period. Except.for period 17, 1953, the number of small fish int.he catch declines as the number of large fish increases, which is consist.ent with the assumptionthat the number of small fish caught is inverselyrelated to the availabilit.y of large fish. The extralarge migratory fish (groupe) are distinguishedby their greater average weight relatjve to theseason fish, and not, at. least during 195,2-53, bytheir unusually large numbers. At the time of

SKIPJACK IN HAWAII FISHERY 299900
I I I I I IIA 18S2 BIWEEKLY PERIODSlBOOl- • IISI BIWEEKLY PERIODS -
."700I- .'2 .'3 -
.";;; _---41':1"0z 600I- ------------- -::J0 ---~ .'6 AI•f-
.,.0:0 500 I-AI. •• -...
..5'......1.'9
, ,... 16
/.- e21.ro0 AI5 /
f-I- 4'9~~Z 400 .11 -
::J /
0: .1;/ .10 AI2
~ .7" -9113
J: A20 ,u 300I- , -f- ,...
21~,U .23
~IO.2_
200~A22 -A9
1001- -
00I I I I I I
.2 A .6 .8 2 3 7 II 15 19 23
NUMBER OF LARGE I SMALL SKIPJACK IN THE CATCH
FIGURE 15.-Size composition and catch per unit-of-effort in the Oahu skipjack fishery, 195~.
NUMBER OF SMALL SKIPJACK IN CATCH (IN THOUSAND'S)
FIGURE l6,-Size composition and the numbp.r of skipjackcaught in the Oahu":lishery, 1952--53.
their appearance in the catch during periods 5 and7-9,1953 (fig. 12), they were associated with fairlylarge numbers of the nonmigratory sma.ll fish.
The fact that the three migratory groups seemto occur at different times suggests that there islittle overlap in their distribution, but. the catchrecords do not show this with certa.inty, for (see
Sources of Error) the avern·ge weight of fish inthe cateh is a none too adequate index of size composition. The actual distribution of small skipjack is not defined by their appearance in thecateh. It is possible that during the periods whenthe cat.ch consists predominantly of large fish,small skipjack are also available, but have beenrejected by the fishermen. In order to obtain information as to t.he quantity of small fish actuallypresent., a method such as maintenance of logbooks in which the fishermen could record theirobservations of all fish sighted, whether fished ornot, would be required.
The catch records provide little means of determining the relations between the four groups ofskipjack which seem to make up the populationexploited by the Hawaii fishery. It is quiteproba.ble that. t.he small fish in both the migratoryn.nd semiresident groups furnish recruits for theseason fish. The season fish of a given year maybe the In.rge fish of the next year. The long-termrecovery of tltgged specimens would appear tooffer the best means of ascertaining the relationsbetween these different groups of fish.
80
1 1812 rPERIODS WITH CATCH]••ISI >75,000 POUNDS
.,g
.07
.,.14.e18
60
~z
~ soJ: .,3f-
!x
8 40
i!!
" .,, 107
li 30il .'5;c'""' .11..
200:......J
~ ".0:10"'lD
'"::JZ
00

300 FISHERY BULLETIN OF THE FISH AND WILDLIFE SERVICE
SUMMARY
1. The staff of the Honolulu Biological Laboratory is trying to determine the environmental condi~io.ns which influence the local availability ofskIpJack. Commercial catch records are a sourceof information.
2. Methods and sources of error are considered.Fish catch reports for 1952 (a poor year) and1953 (a good year) were summarized by areasof the fishery and biweekly fishing periods. Theunit of fishing effort, the productive fisherm&nt.rip, is discussed.
3. The distribution of catches and effort in the2 yeM'S was generally similar, with leew&rd Oahucontributing one-half the catch. Hawaii, windward Oahu, and Kauai fell well below leewardOahu in productivity, while Maui and the oceanicregion contributed insignificant proprotions.
4. Pounds caught per unit of effort increasedfrom southeast to northwest in the fishery andfrom inshore to offshore, but these trends may result from differences in the fishery r&ther th&11 todistribution of fish.
5. There W&S &positive correlation between theaverage weight per skipjack caught in V&riouszones of the fishery and catch per unit of effort.
6: Catches (in pounds) during the fishingperIods of 1953 were, with few e.xceptions, largerthan those made during the corresponding periodsof 1952.
7. In comparison with the seasonal trend in thefishery, the effects of rough weather (as indicatedby periods of small cr&ft warnings), were unimportant.
8. Large skipjac.k, from their appearance inthe catches, seemed to have arrived first in leeward areas, and at the end of the season they lastappeared in catches from leewa.rd areas. In.Tuneand August of both years, concentrat.ions of season fish occurre.d in ,vindward Oahu a.nd leewardOahu, respectively.
9. Th~ numbers of small fish taken by the Oahufishery In 1952 and 1953 were approximatelyequal, but almost three times as many large fishwere caught in 1953. In t.he Oahu region, therewas almost. one and one-half times the fishing effort in 1953 in comparison with 1952, and a much
u. s. COVERNMENT PRINTING O:"-"FICE: 1962. 0 - 596500
larger proportion was directed toward catchinglarge skipj'ack.
10. Catch, effort a.nd catc.h per unit of effortindexes have similar sen.sonal variations. Thepo~itive corre~ation between catch and c&tch perumt-of-effort IS so close that there is little to begained in using the catch per unit-of-e:fIort as &nindex of apparent abundance in the fishery.
11. During t.he middle of 1953, the &verageweight of large skipjn.ck increased at 0.25 poundper week, the growth rate for H&waii skipjackestimated by Brock. This suggests that fish ofthe. s.'Lme age were constantly &vailable to thefishery during this period.
12. The number of small skipjack in the catchvaried inversely with the number of l&rge fish.
13. A hypotJlesis for the structure of the skipjack population supporting the fishery is offered.The popul&tion has four groups: (1) season fishand (2) extra-l&rge fish, both of which are migratory, and (3) a semiresident and (4) a migratorygroup of smaller skipj&ck.
LITERATURE CITEDBROCK, V. E.
1954. Some aspects of tbe biology of tbe aku, Kats!ttVonus peZamia, In tbe Hawaiian Islands. PacificSclence 8(1) : p.94--104.
JUNE, F. C.1951. Preliminary ftsberies survey of the Hawaiian
Line Isloncls area. Part III. The live-bait skipjack fisbery of tbe Hawaiian Islands. U.S. Fisband Wildlife Service, Commercial Fisheries Review13(2) : p. 1-18. .
KENDALL, M. G.1951. The advanced tbeory of statistics. Vol. II.
Third edition. Charles Griffin & Co., Ltd., London,England. 521 p.
ROYCE, W. F .• and T. OTsu.1955. Observation of skipjack scbools in Hawaiian
waters, 1953. U.S. Fisb and Wildlife Service,Special Scientific Report-Fisberles No. 147, 81 p.
SNEDECOB, G. W.1956. Statistical methods, 5th edition. The Iowa
State College Press, Ames, Iowa. 584 p.YAMASHI1'A, D. T.
1958. Analysis of catcb statistics of tbe Hawaiianskipjack fishery. U.S. Fisb and Wildlife Service,Fisbery Bulletin 134. vol. 58. p. 253-278.
YUEN, H. S. H. .1959. Variability of skipjack response to live balt.
U.S. Fisb and Wildlife Service, Fishery Bulletin160. vol. 60, p. 87-106.
Recommended