Ain Shams Engineering Journal (2015) xxx, xxx–xxx
Ain Shams University
Ain Shams Engineering Journal
www.elsevier.com/locate/asejwww.sciencedirect.com
ELECTRICAL ENGINEERING
Distributed generations planning using flower
pollination algorithm for enhancing distribution
system voltage stability
* Corresponding author. Tel.: +20 102 193 0088; fax: +20 643 218
977.
E-mail addresses: [email protected] (E.S. Oda), aaabdelsalam
@eng.suez.edu.eg (A.A. Abdelsalam), [email protected]
(M.N. Abdel-Wahab), [email protected] (M.M. El-Saadawi).
Peer review under responsibility of Ain Shams University.
Production and hosting by Elsevier
http://dx.doi.org/10.1016/j.asej.2015.12.0012090-4479 � 2015 Faculty of Engineering, Ain Shams University. Production and hosting by Elsevier B.V.This is an open access article under the CC BY-NC-ND license (http://creativecommons.org/licenses/by-nc-nd/4.0/).
Please cite this article in press as: Oda ES et al., Distributed generations planning using flower pollination algorithm for enhancing distribution system volbility, Ain Shams Eng J (2015), http://dx.doi.org/10.1016/j.asej.2015.12.001
Eyad S. Odaa, Abdelazeem A. Abdelsalam
a,*, Mohamed N. Abdel-Wahaba,
Magdi M. El-Saadawi b
aDepartment of Electrical Engineering, Faculty of Engineering, Suez Canal University, 41522 Ismailia, EgyptbDepartment of Electrical Engineering, Faculty of Engineering, Mansoura University, Mansoura, Egypt
Received 13 February 2015; revised 13 October 2015; accepted 4 December 2015
KEYWORDS
Distributed generation;
Optimization;
Flower pollination;
Voltage stability
Abstract Distributed generations (DGs) have been utilized in some electric power networks.
Power loss reductions, voltage improvement, increasing reliability, postponement of system upgrad-
ing and environmental friendliness are some advantages of DG-unit applications. This paper pre-
sents a new optimization approach that employs a flower pollination algorithm (FPA) to
determine the optimal DG-unit’s size and location in order to minimize the total system real power
loss and improve the system buses voltage. The FPA is a new metaheuristic optimization technique
and it is inspired by the reproduction strategy of the flow pollination process of flowering plants. To
reveal the validity of the FPA algorithm, IEEE 33-bus, 69-bus and 136-bus radial distribution test
systems are examined with different test cases of the objective function using the MATLAB.
Furthermore, the results obtained by the proposed FPA algorithm are compared with other meta-
heuristic optimization techniques such as backtracking search optimization algorithm, artificial bee
colony, and selection algorithm. The outcomes verify that the FPA algorithm is efficient, robust,
and capable of handling mixed integer nonlinear optimization problems.� 2015 Faculty of Engineering, Ain Shams University. Production and hosting by Elsevier B.V. This is an
open access article under the CC BY-NC-ND license (http://creativecommons.org/licenses/by-nc-nd/4.0/).
1. Introduction
The interest in distributed generation (DG) in power systemnetworks has been growing rapidly. This increase can beexplained by factors such as environmental concerns, therestructuring of electricity businesses, and the development
of technologies for small-scale power generation. DG can bealternative to the industrial, commercial and residential appli-cation. Several definitions are available for DG all over the
world, depending upon plant rating, generation voltage level,
tage sta-
2 E.S. Oda et al.
point of connection, etc. It can be concluded that the DG is anelectrical power generation within distribution system or onthe customer side of the system [1].
DGs are anticipated to play a great role in developing ofelectrical power systems. Studies have predicted that they areabout 20% of the new generations being installed [2]. The
increment in active power loss represents loss in savings tothe utility as well as a reduction in feeder utilization. Studieshave shown that 70% of power losses are due to distribution
system and the losses resulting from Joule effect only accountfor 13% of the generated energy [3]. This non-negligibleamount of losses has a direct impact on the financial resultsand the overall efficiency of the system.
DG affects the power flow and the voltage on the buses ofthe system. The non-optimal placement of DG can increase thesystem losses and thus make the voltage profile lower than the
allowable limit. It must also be reliable of proper size so that itcan give the positive impacts or be known as ‘system supportbenefits’. These benefits include improved voltage profile,
reduce the losses, increase the distribution capacity, andimprove the reliability of utility system [4,5].
In practice, in the distribution network, load pattern is
varying with time. The optimal location and size of DGdetermined under invariant loads may not be optimal undertime-varying loads and the optimal DG size may vary withvarying load demand. But in practice, it is not economically
feasible to change the DG size with changing load demand.Therefore, for planning purpose, an optimal size and locationof DGs can be determined by considering peak, average, or
combination of the two loading conditions to get the maxi-mum benefit of DGs [6].
Previously, different methodologies have been developed to
determine the optimum size and location of DG [7]. A simplesearch algorithm for optimal sizing and placement of DGbased on the minimization of losses in a radial distribution sys-
tem is proposed in [8]. This method consumes more computa-tional time to solve and is not valid for multi-objectiveoptimization problem. Optimization based algorithm has alsobeen proposed by [9] to find the optimal location for DG with
maximum profit using dynamic based programming. In [10],Clonal selection algorithm (CSA) is proposed to determinethe optimal DG-unit’s size and location is determined by loss
sensitivity index. Other studies have been conducted on DGinstallations which consider sizing and allocation usingEmbedded Meta Evolutionary-Firefly Algorithm (EMEFA)
[11]. This method focused on the effect of population size onloss and cost minimization while improving the performanceof the system. In [12], an optimization algorithm based onthe genetic algorithm was introduced to address the optimal
distributed generation sizing and siting for voltage profileimprovement, power losses, and total harmonic distortion(THD) reduction in a distribution network with high penetra-
tion of nonlinear loads. The proposed planning methodologytakes into consideration the load profile, the frequency spec-trum of nonlinear loads, and the technical constraints such
as voltage limits at different buses (slack and load buses) ofthe system, feeder capacity, THD limits, and maximum pene-tration limit of DG units. In [13] a probabilistic planning
approach is proposed for optimally allocating different typesof distributed generator (i.e. wind-based DG, solar DG andnon-renewable DG) into a harmonic polluted distributionsystem so as to minimize the annual energy losses and reduce
Please cite this article in press as: Oda ES et al., Distributed generations planning ubility, Ain Shams Eng J (2015), http://dx.doi.org/10.1016/j.asej.2015.12.001
the harmonic distortions. The performance of DG in distribu-tion networks was also being studied in [5] using the techniqueof Hybrid Mutation-Evolutionary Programming (HM-EP)
and Particle swarm Optimization (PSO). Calculation oflocation and size of the DG are determined separately, whichmeans different method is applied for sizing and location.
Thus, it may result in the solution trap in local optimum soRef. [14] provides a solution to the output power and locationof multiple DG sources by using modified Artificial Bee
Colony algorithm to avoid this issue. Big bang big crunchmethod was used in [15] to find optimal site and size of DGto minimize power loss for balanced and unbalanceddistribution systems. The backtracking search optimization
algorithm (BSOA) was used in DS planning in [16] with multitype DGs while in [17], BSOA was used to study the impact ofvarious load models on DG placement and sizing and also the
time of calculation to find optimal size and location wasobtained.
The flower pollination algorithm (FPA) is a new meta-
heuristic optimization technique and it is inspired by the repro-duction strategy of the flow pollination process of floweringplants [18–20]. The FPA is used to solve real optimization
problems [21,22]. In [21] the FPA is used to select the optimallocation of distribution transformers in a low-voltage grid,while in [22], the optimal control in multi-machine system withgeneralized unified power flow controller was discussed.
In this paper, the FPA is used to determine the optimal sizeand location of single and multi-DGs to minimizing the powerlosses of the distribution system as much as possible and
enhancing voltage profile of the system using voltage index.IEEE 33-bus, 69-bus and 136-bus systems are examined as testcases with different scenarios of the objective function. The
results in this paper are compared with performance of BSOA,artificial bee colony (ABC), and clonal selection algorithm(CSA).
2. Problem formulation
2.1. Load flow
On account of the some inherent features of distribution sys-tems such as radial structure, large number of nodes and a high
R/X ratio, the conventional techniques such as Newton–Raphson and fast decoupled method may fail or haveproblems when dealing with distribution networks. In this
paper, the load flow is based on the forward/backward sweeptechnique because it is a powerful method and has been widelyused in distribution [23].
2.2. Objective functions
The objective function proposed in this study is defined as
follows:
OF ¼ min½ðWL � f1Þ þ ðWv � f2Þ� ð1Þwhere OF is the objective function, f1 is the total real powerlosses, f2 is the voltage index (VI), WL is the weighting factorfor power loss and Wv is the weighting factor for VI.
WL and Wv are the weighting coefficients representing therelative importance of the objectives. It is usually assumed that[24]:
sing flower pollination algorithm for enhancing distribution system voltage sta-
Distributed generations planning using flower pollination algorith
0 6 WL 6 1; and WL þWv ¼ 1 ð2ÞThe value of weighing factors depends on the objective
function which is more important. If DG is implementing to
mitigate a certain objective to overcome a specific problem,the corresponding weighing factor is increased. In this paperdifferent values of weighing factors for both real power lossesand VI are studied.
2.2.1. Power losses
After electrical power is generated, it is transferred through the
transmission line to many distribution circuits that the utilityoperates. So, distribution system will take the power and sentit to the consumer to serve their needs. However, not all thepower are delivered hundred percent efficiently due to the
losses occur at the transformer and distribution lines. Powerlines or distribution lines connect the substation to the loads.Practically, all real power that is lost in distribution system is
due to the copper losses. Thus, it can be calculated as equationbelow:
Ploss ¼Xn
j¼1
I2j Rj ð3Þ
where Ij is current magnitude in ampere, Rj is resistance atbranch j in ohm, n is number of buses.
From the equation, it can be said that amount of power lossin the line can be affected by the change of current or line resis-tance. Thus, minimizing the real power loss is considered for
the placement and sizing of DG in distribution system as theequation shown below:
f1 ¼Ploss
MVAb
ð4Þ
The whole power loss is divided by MVA base to be nor-
malized (a value between 0 and 1).To show the impact of installing WT at distribution feeder
on power loss reduction (PLR) the following relation used:
PLR% ¼ Ploss � PDGloss
Ploss
� 100 ð5Þ
where PDGloss is system loss after DG installation
2.2.2. Voltage index VI
The main objective of voltage indices (VIs) is to estimate the
distance from the current operating point to the system voltagemarginally stable point. Numerical indices help operators tomonitor how close the system is to collapse or to initiate auto-matic remedial action schemes to prevent voltage collapse.
Most of the VIs that have been proposed are based on steadystate power flow. An index, which can be evaluated at all busesin radial distribution systems, was presented in [25]. The Equa-
tion represents the voltage index VI is given by the following:
VIj ¼ 1
n
Xn
i
jVi � VDGi j
Vi
� �ð6Þ
where VDGi is the voltage at bus i after DG installation.
2.3. Constraints
The operating constraints are defined as follows:
Please cite this article in press as: Oda ES et al., Distributed generations planning ubility, Ain Shams Eng J (2015), http://dx.doi.org/10.1016/j.asej.2015.12.001
� Voltage limitation
m 3
sing flow
Vmin 6 Vi 6 Vmax ð7Þ
where Vmin and Vmax are the minimum and maximumallowed voltage (±10%) and Vi is the voltage at bus i.� Power balance constraints
XNDG
Ps þk¼1
PDG ¼ Pd þ Ploss ð8Þ
� Size of each DG
0:1 6 PDG 6 2:00 MW for 33 and 69 bus systems
0:1 6 PDG 6 5:00 MW for 136 bus system
ð9Þ
where NDG is total number of DGs, Ps is feeder power, andPd is load power.3. The optimization methodology
3.1. Flower pollination algorithm (FPA)
Flower pollination algorithm is a meta-heuristic search algo-rithm which has been proposed recently by Yang and Deb
[18–20]. The algorithm is inspired by the reproduction strategyof the flow pollination process of flowering plants. For simplic-ity, the following four rules are used:
� Rule #1: Biotic and cross-pollination can be considered pro-cesses of global pollination, and pollen-carrying pollinators
move in a way that obeys Levy flights.� Rule #2: For local pollination, abiotic pollination and self-pollination are used.
� Rule #3: Pollinators such as insects can develop flower con-stancy, which is equivalent to a reproduction probabilitythat is proportional to the similarity of two flowersinvolved.
� Rule #4: The interaction or switching of local pollinationand global pollination can be controlled by a switchprobability p 2 ½0; 1�, slightly biased toward local
pollination.
To formulate the updating formulas, these rules have to be
converted into proper updating equations. Rule #1 and flowerconstancy, Rule #3, can be represented mathematically asfollows:
Xtþ1i ¼ Xt
i þ cLðkÞðg� � xtiÞ ð10Þ
where Xtþ1i is the solution vector xi at iteration t, g� is the cur-
rent best solution found among all solutions at the current gen-eration/iteration, c is a scaling factor and LðkÞ is a step-sizeparameter. A Levy flight can be used to mimic this character-
istic efficiently. That is, L > 0 is drawn from a Levydistribution.
L � kCðkÞ sinðpk=2Þp
� 1
S1þk ; ðS � S0 > 0Þ ð11Þ
er pollination algorithm for enhancing distribution system voltage sta-
4 E.S. Oda et al.
CðkÞ is the standard gamma function, and this distribution is
valid for large steps S > 0. Mantegna algorithm is used fordrawing step size S by using two Gaussian distributions Uand V by the following transformation:
S ¼ U
jVj1=kð12Þ
U � Nð0; r2Þ; V � Nð0; 1Þ ð13ÞU � Nð0; r2Þ means that the samples are drawn from a Gaus-
sian normal distribution with a zero mean and a variance of r2.The variance can be calculated by the following:
r2 ¼ Cð1þ kÞkCðð1þ kÞ=2Þ :
sinðpk=2Þ2ðk�1Þ=2
� �1=kð14Þ
For the local pollination, both Rule #2 and Rule #3 can be
represented as follows:
Xtþ1i ¼ Xt
iþ 2 ðxtj � xt
kÞ ð15Þwhere xt
j and xtk are pollen from different flowers of the same
plant species and 2 is drawn from a uniform distribution in
[0,1].
3.2. Implementation of FPA
Flower pollination algorithm is developed by the idea of flower
pollination process. There are only two parameters in thisalgorithm, the population size n, and probability switch(p 2 ½0; 1�). Once n is fixed, p essentially controls the pollinators
and the balance of the randomization and local search. Fewparameters make an algorithm less complex and thus poten-tially more generic. In this paper p = 0.8 and n = 25 [18],
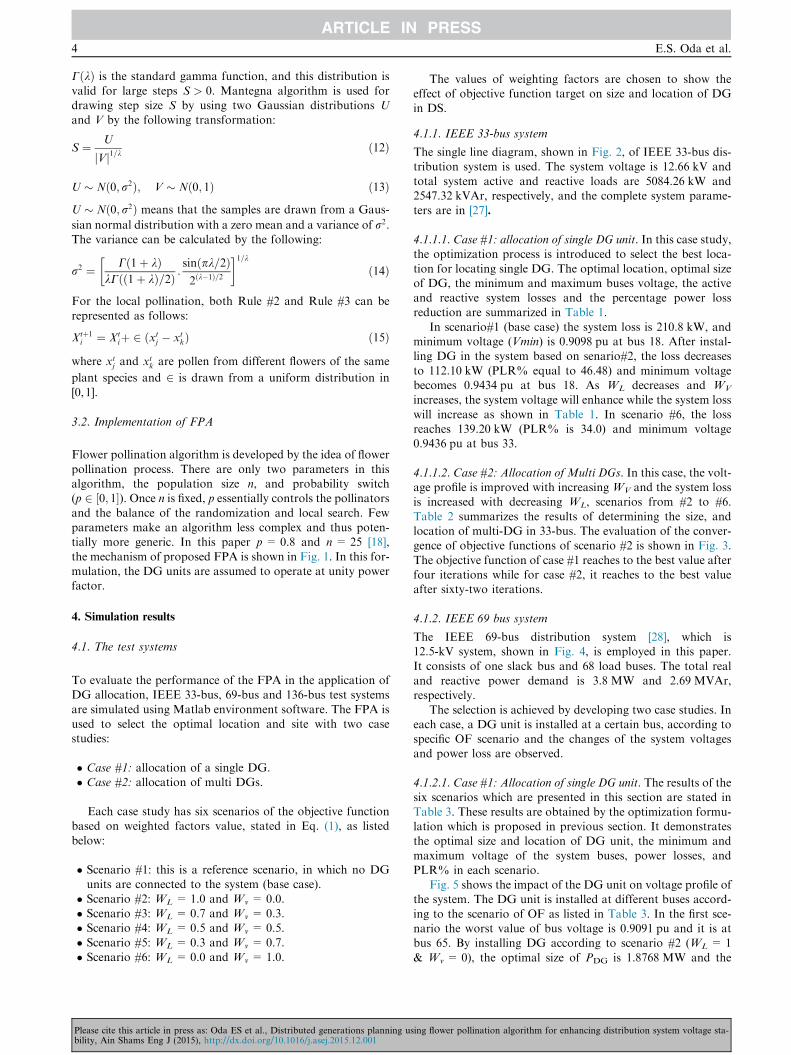
the mechanism of proposed FPA is shown in Fig. 1. In this for-mulation, the DG units are assumed to operate at unity powerfactor.
4. Simulation results
4.1. The test systems
To evaluate the performance of the FPA in the application ofDG allocation, IEEE 33-bus, 69-bus and 136-bus test systems
are simulated using Matlab environment software. The FPA isused to select the optimal location and site with two casestudies:
� Case #1: allocation of a single DG.� Case #2: allocation of multi DGs.
Each case study has six scenarios of the objective functionbased on weighted factors value, stated in Eq. (1), as listed
below:
� Scenario #1: this is a reference scenario, in which no DGunits are connected to the system (base case).
� Scenario #2: WL = 1.0 and Wv = 0.0.� Scenario #3: WL = 0.7 and Wv = 0.3.� Scenario #4: WL = 0.5 and Wv = 0.5.
� Scenario #5: WL = 0.3 and Wv = 0.7.� Scenario #6: WL = 0.0 and Wv = 1.0.
Please cite this article in press as: Oda ES et al., Distributed generations planning ubility, Ain Shams Eng J (2015), http://dx.doi.org/10.1016/j.asej.2015.12.001
The values of weighting factors are chosen to show theeffect of objective function target on size and location of DGin DS.
4.1.1. IEEE 33-bus system
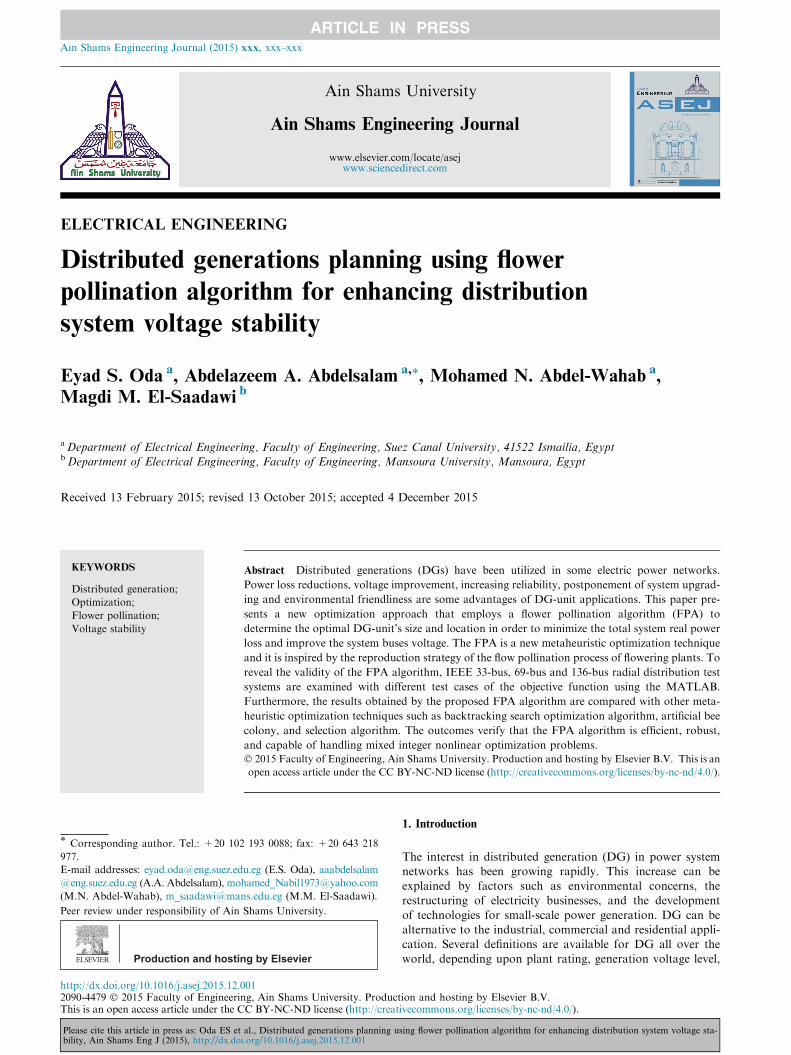
The single line diagram, shown in Fig. 2, of IEEE 33-bus dis-tribution system is used. The system voltage is 12.66 kV and
total system active and reactive loads are 5084.26 kW and2547.32 kVAr, respectively, and the complete system parame-ters are in [27].
4.1.1.1. Case #1: allocation of single DG unit. In this case study,the optimization process is introduced to select the best loca-
tion for locating single DG. The optimal location, optimal sizeof DG, the minimum and maximum buses voltage, the activeand reactive system losses and the percentage power lossreduction are summarized in Table 1.
In scenario#1 (base case) the system loss is 210.8 kW, andminimum voltage (Vmin) is 0.9098 pu at bus 18. After instal-ling DG in the system based on senario#2, the loss decreases
to 112.10 kW (PLR% equal to 46.48) and minimum voltagebecomes 0.9434 pu at bus 18. As WL decreases and WV
increases, the system voltage will enhance while the system loss
will increase as shown in Table 1. In scenario #6, the lossreaches 139.20 kW (PLR% is 34.0) and minimum voltage0.9436 pu at bus 33.
4.1.1.2. Case #2: Allocation of Multi DGs. In this case, the volt-age profile is improved with increasing WV and the system lossis increased with decreasing WL, scenarios from #2 to #6.
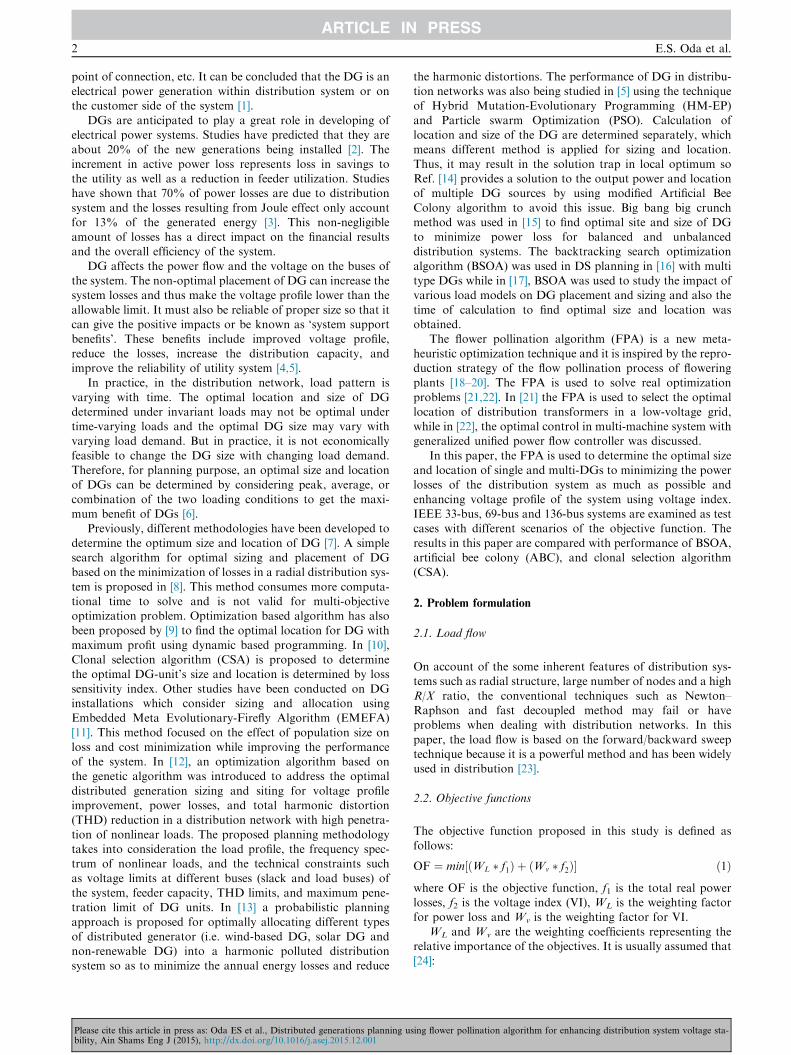
Table 2 summarizes the results of determining the size, andlocation of multi-DG in 33-bus. The evaluation of the conver-gence of objective functions of scenario #2 is shown in Fig. 3.
The objective function of case #1 reaches to the best value afterfour iterations while for case #2, it reaches to the best valueafter sixty-two iterations.
4.1.2. IEEE 69 bus system
The IEEE 69-bus distribution system [28], which is12.5-kV system, shown in Fig. 4, is employed in this paper.
It consists of one slack bus and 68 load buses. The total realand reactive power demand is 3.8 MW and 2.69 MVAr,respectively.
The selection is achieved by developing two case studies. Ineach case, a DG unit is installed at a certain bus, according tospecific OF scenario and the changes of the system voltagesand power loss are observed.
4.1.2.1. Case #1: Allocation of single DG unit. The results of thesix scenarios which are presented in this section are stated in
Table 3. These results are obtained by the optimization formu-lation which is proposed in previous section. It demonstratesthe optimal size and location of DG unit, the minimum and
maximum voltage of the system buses, power losses, andPLR% in each scenario.
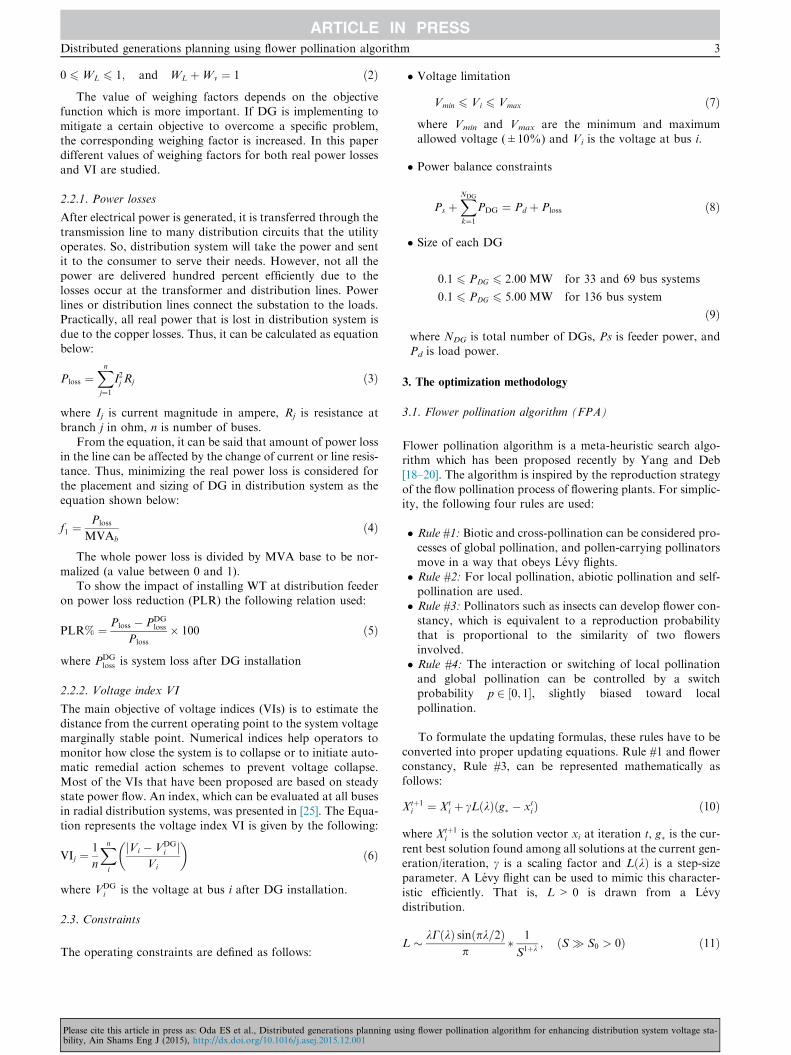
Fig. 5 shows the impact of the DG unit on voltage profile ofthe system. The DG unit is installed at different buses accord-
ing to the scenario of OF as listed in Table 3. In the first sce-nario the worst value of bus voltage is 0.9091 pu and it is atbus 65. By installing DG according to scenario #2 (WL = 1
& Wv = 0), the optimal size of PDG is 1.8768 MW and the
sing flower pollination algorithm for enhancing distribution system voltage sta-
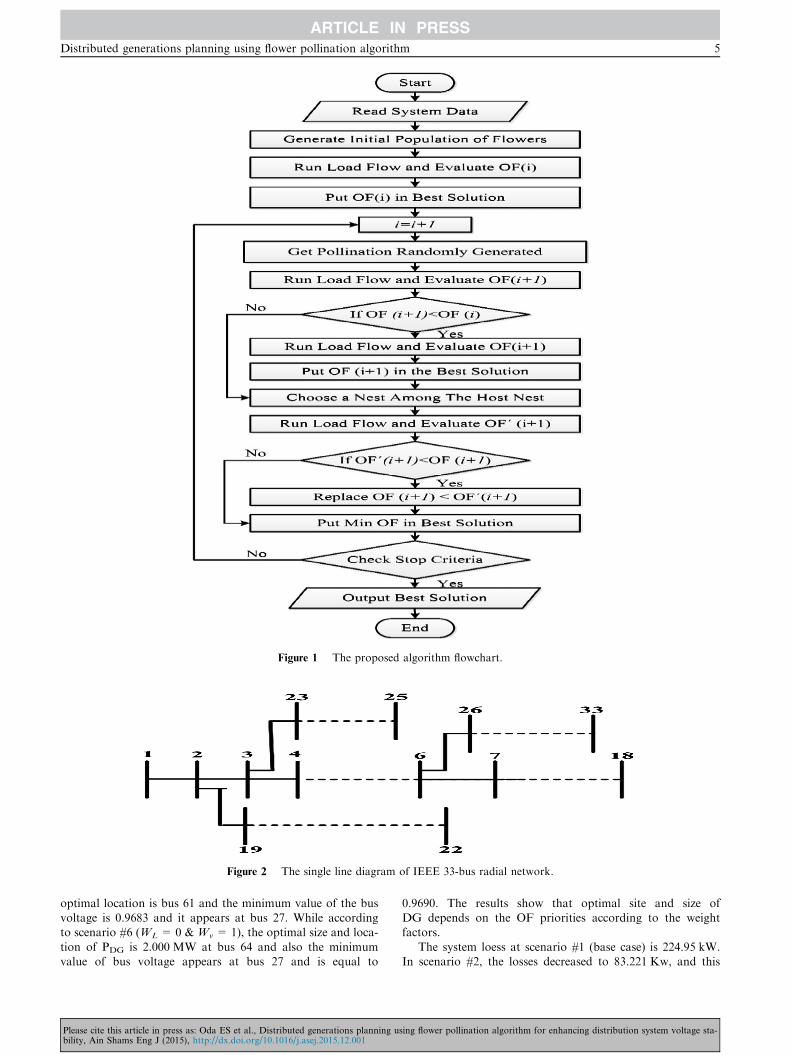
Figure 1 The proposed algorithm flowchart.
Figure 2 The single line diagram of IEEE 33-bus radial network.
Distributed generations planning using flower pollination algorithm 5
optimal location is bus 61 and the minimum value of the busvoltage is 0.9683 and it appears at bus 27. While accordingto scenario #6 (WL = 0 & Wv = 1), the optimal size and loca-
tion of PDG is 2.000 MW at bus 64 and also the minimumvalue of bus voltage appears at bus 27 and is equal to
Please cite this article in press as: Oda ES et al., Distributed generations planning ubility, Ain Shams Eng J (2015), http://dx.doi.org/10.1016/j.asej.2015.12.001
0.9690. The results show that optimal site and size ofDG depends on the OF priorities according to the weightfactors.
The system loess at scenario #1 (base case) is 224.95 kW.In scenario #2, the losses decreased to 83.221 Kw, and this
sing flower pollination algorithm for enhancing distribution system voltage sta-
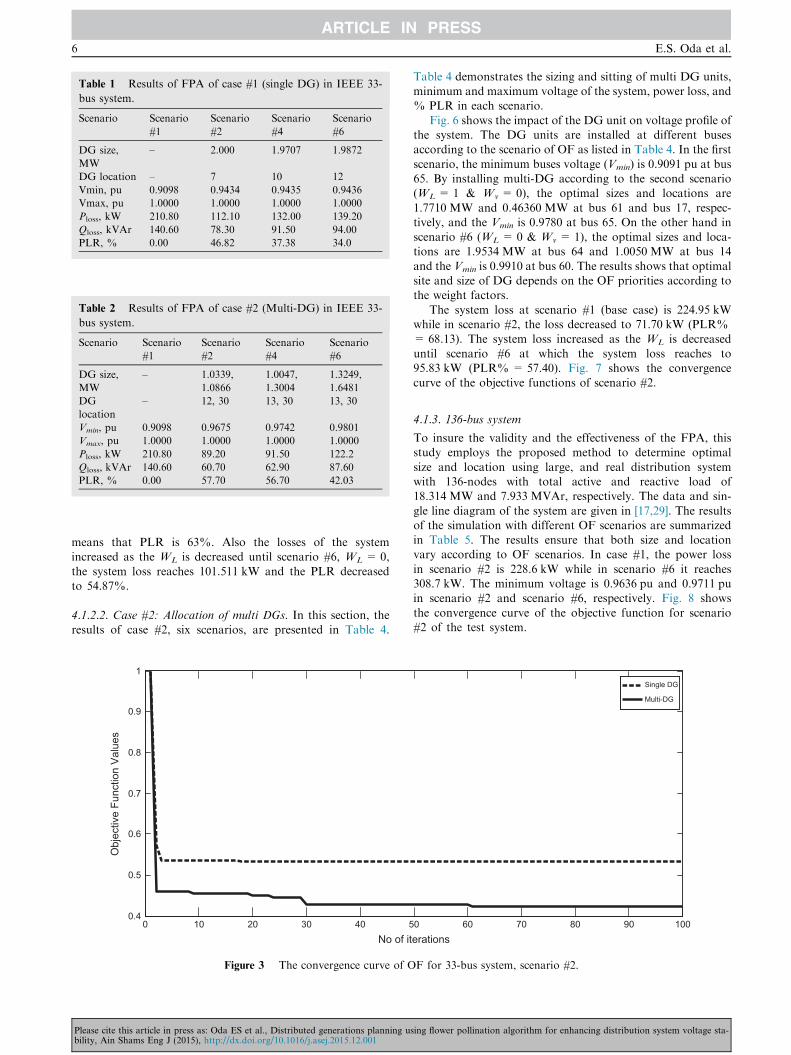
Table 1 Results of FPA of case #1 (single DG) in IEEE 33-
bus system.
Scenario Scenario
#1
Scenario
#2
Scenario
#4
Scenario
#6
DG size,
MW
– 2.000 1.9707 1.9872
DG location – 7 10 12
Vmin, pu 0.9098 0.9434 0.9435 0.9436
Vmax, pu 1.0000 1.0000 1.0000 1.0000
Ploss, kW 210.80 112.10 132.00 139.20
Qloss, kVAr 140.60 78.30 91.50 94.00
PLR, % 0.00 46.82 37.38 34.0
Table 2 Results of FPA of case #2 (Multi-DG) in IEEE 33-
bus system.
Scenario Scenario
#1
Scenario
#2
Scenario
#4
Scenario
#6
DG size,
MW
– 1.0339,
1.0866
1.0047,
1.3004
1.3249,
1.6481
DG
location
– 12, 30 13, 30 13, 30
Vmin, pu 0.9098 0.9675 0.9742 0.9801
Vmax, pu 1.0000 1.0000 1.0000 1.0000
Ploss, kW 210.80 89.20 91.50 122.2
Qloss, kVAr 140.60 60.70 62.90 87.60
PLR, % 0.00 57.70 56.70 42.03
6 E.S. Oda et al.
means that PLR is 63%. Also the losses of the systemincreased as the WL is decreased until scenario #6, WL = 0,
the system loss reaches 101.511 kW and the PLR decreasedto 54.87%.
4.1.2.2. Case #2: Allocation of multi DGs. In this section, theresults of case #2, six scenarios, are presented in Table 4.
0 10 20 30 40 50.4
0.5
0.6
0.7
0.8
0.9
1
No of it
Obj
ectiv
e Fu
nctio
n V
alue
s
Figure 3 The convergence curve of O
Please cite this article in press as: Oda ES et al., Distributed generations planning ubility, Ain Shams Eng J (2015), http://dx.doi.org/10.1016/j.asej.2015.12.001
Table 4 demonstrates the sizing and sitting of multi DG units,minimum and maximum voltage of the system, power loss, and% PLR in each scenario.
Fig. 6 shows the impact of the DG unit on voltage profile ofthe system. The DG units are installed at different busesaccording to the scenario of OF as listed in Table 4. In the first
scenario, the minimum buses voltage (Vmin) is 0.9091 pu at bus65. By installing multi-DG according to the second scenario(WL = 1 & Wv = 0), the optimal sizes and locations are
1.7710 MW and 0.46360 MW at bus 61 and bus 17, respec-tively, and the Vmin is 0.9780 at bus 65. On the other hand inscenario #6 (WL = 0 & Wv = 1), the optimal sizes and loca-tions are 1.9534 MW at bus 64 and 1.0050 MW at bus 14
and the Vmin is 0.9910 at bus 60. The results shows that optimalsite and size of DG depends on the OF priorities according tothe weight factors.
The system loss at scenario #1 (base case) is 224.95 kWwhile in scenario #2, the loss decreased to 71.70 kW (PLR%= 68.13). The system loss increased as the WL is decreased
until scenario #6 at which the system loss reaches to95.83 kW (PLR% = 57.40). Fig. 7 shows the convergencecurve of the objective functions of scenario #2.
4.1.3. 136-bus system
To insure the validity and the effectiveness of the FPA, thisstudy employs the proposed method to determine optimal
size and location using large, and real distribution systemwith 136-nodes with total active and reactive load of18.314 MW and 7.933 MVAr, respectively. The data and sin-
gle line diagram of the system are given in [17,29]. The resultsof the simulation with different OF scenarios are summarizedin Table 5. The results ensure that both size and locationvary according to OF scenarios. In case #1, the power loss
in scenario #2 is 228.6 kW while in scenario #6 it reaches308.7 kW. The minimum voltage is 0.9636 pu and 0.9711 puin scenario #2 and scenario #6, respectively. Fig. 8 shows
the convergence curve of the objective function for scenario#2 of the test system.
0 60 70 80 90 100erations
Single DG
Multi-DG
F for 33-bus system, scenario #2.
sing flower pollination algorithm for enhancing distribution system voltage sta-
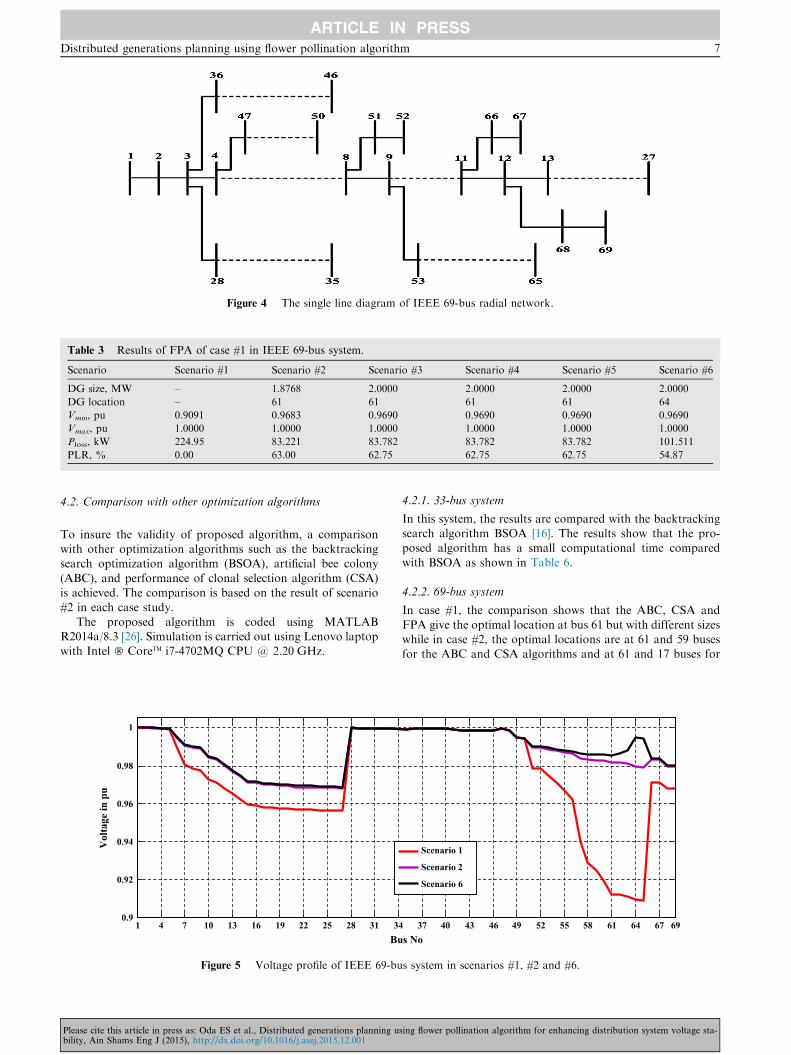
Figure 4 The single line diagram of IEEE 69-bus radial network.
Table 3 Results of FPA of case #1 in IEEE 69-bus system.
Scenario Scenario #1 Scenario #2 Scenario #3 Scenario #4 Scenario #5 Scenario #6
DG size, MW – 1.8768 2.0000 2.0000 2.0000 2.0000
DG location – 61 61 61 61 64
Vmin, pu 0.9091 0.9683 0.9690 0.9690 0.9690 0.9690
Vmax, pu 1.0000 1.0000 1.0000 1.0000 1.0000 1.0000
Ploss, kW 224.95 83.221 83.782 83.782 83.782 101.511
PLR, % 0.00 63.00 62.75 62.75 62.75 54.87
Distributed generations planning using flower pollination algorithm 7
4.2. Comparison with other optimization algorithms
To insure the validity of proposed algorithm, a comparisonwith other optimization algorithms such as the backtrackingsearch optimization algorithm (BSOA), artificial bee colony
(ABC), and performance of clonal selection algorithm (CSA)is achieved. The comparison is based on the result of scenario#2 in each case study.
The proposed algorithm is coded using MATLABR2014a/8.3 [26]. Simulation is carried out using Lenovo laptopwith Intel � CoreTM i7-4702MQ CPU @ 2.20 GHz.
1 4 7 10 13 16 19 22 25 28 31 340.9
0.92
0.94
0.96
0.98
1
Bu
Vol
tage
in p
u
Figure 5 Voltage profile of IEEE 69-bu
Please cite this article in press as: Oda ES et al., Distributed generations planning ubility, Ain Shams Eng J (2015), http://dx.doi.org/10.1016/j.asej.2015.12.001
4.2.1. 33-bus system
In this system, the results are compared with the backtrackingsearch algorithm BSOA [16]. The results show that the pro-posed algorithm has a small computational time compared
with BSOA as shown in Table 6.
4.2.2. 69-bus system
In case #1, the comparison shows that the ABC, CSA and
FPA give the optimal location at bus 61 but with different sizeswhile in case #2, the optimal locations are at 61 and 59 busesfor the ABC and CSA algorithms and at 61 and 17 buses for
37 40 43 46 49 52 55 58 61 64 67 69s No
Scenario 1
Scenario 2
Scenario 6
s system in scenarios #1, #2 and #6.
sing flower pollination algorithm for enhancing distribution system voltage sta-
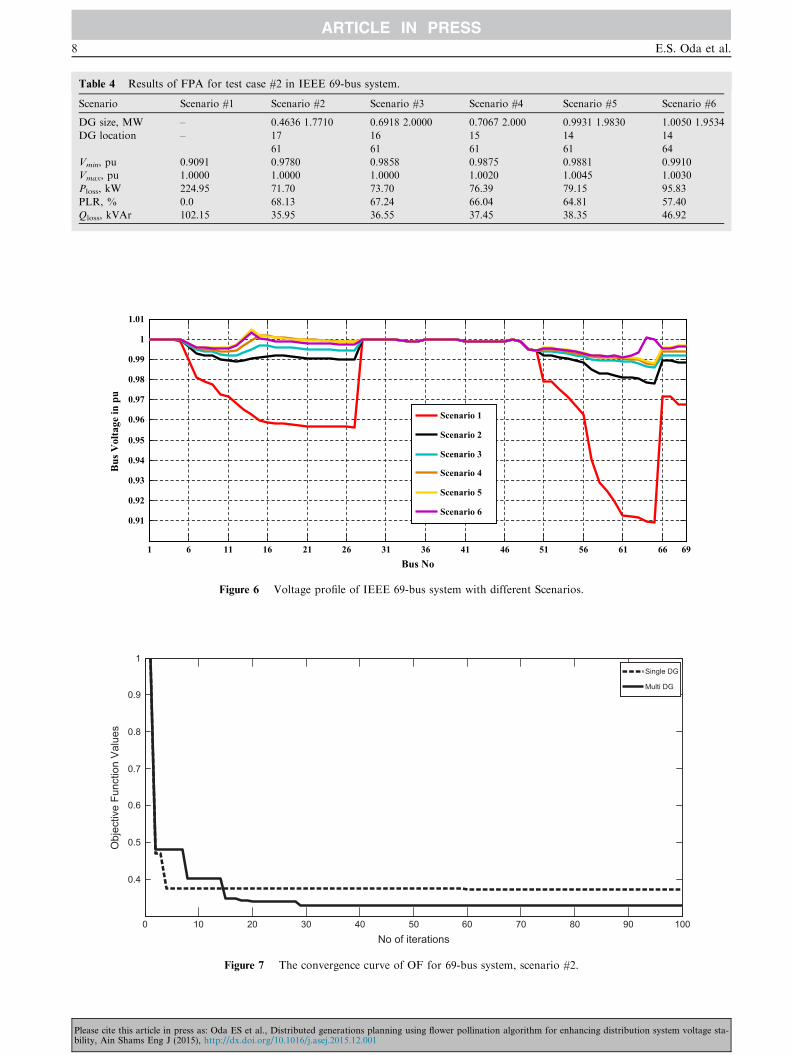
Table 4 Results of FPA for test case #2 in IEEE 69-bus system.
Scenario Scenario #1 Scenario #2 Scenario #3 Scenario #4 Scenario #5 Scenario #6
DG size, MW – 0.4636 1.7710 0.6918 2.0000 0.7067 2.000 0.9931 1.9830 1.0050 1.9534
DG location – 17 16 15 14 14
61 61 61 61 64
Vmin, pu 0.9091 0.9780 0.9858 0.9875 0.9881 0.9910
Vmax, pu 1.0000 1.0000 1.0000 1.0020 1.0045 1.0030
Ploss, kW 224.95 71.70 73.70 76.39 79.15 95.83
PLR, % 0.0 68.13 67.24 66.04 64.81 57.40
Qloss, kVAr 102.15 35.95 36.55 37.45 38.35 46.92
1 6 11 16 21 26 31 36 41 46 51 56 61 66 69
0.91
0.92
0.93
0.94
0.95
0.96
0.97
0.98
0.99
1
1.01
Bus No
Bus
Vol
tage
in p
u
Scenario 1
Scenario 2
Scenario 3
Scenario 4
Scenario 5
Scenario 6
Figure 6 Voltage profile of IEEE 69-bus system with different Scenarios.
0 10 20 30 40 50 60 70 80 90 100
0.4
0.5
0.6
0.7
0.8
0.9
1
No of iterations
Obj
ectiv
e Fu
nctio
n V
alue
s
Single DG
Multi DG
Figure 7 The convergence curve of OF for 69-bus system, scenario #2.
8 E.S. Oda et al.
Please cite this article in press as: Oda ES et al., Distributed generations planning using flower pollination algorithm for enhancing distribution system voltage sta-bility, Ain Shams Eng J (2015), http://dx.doi.org/10.1016/j.asej.2015.12.001
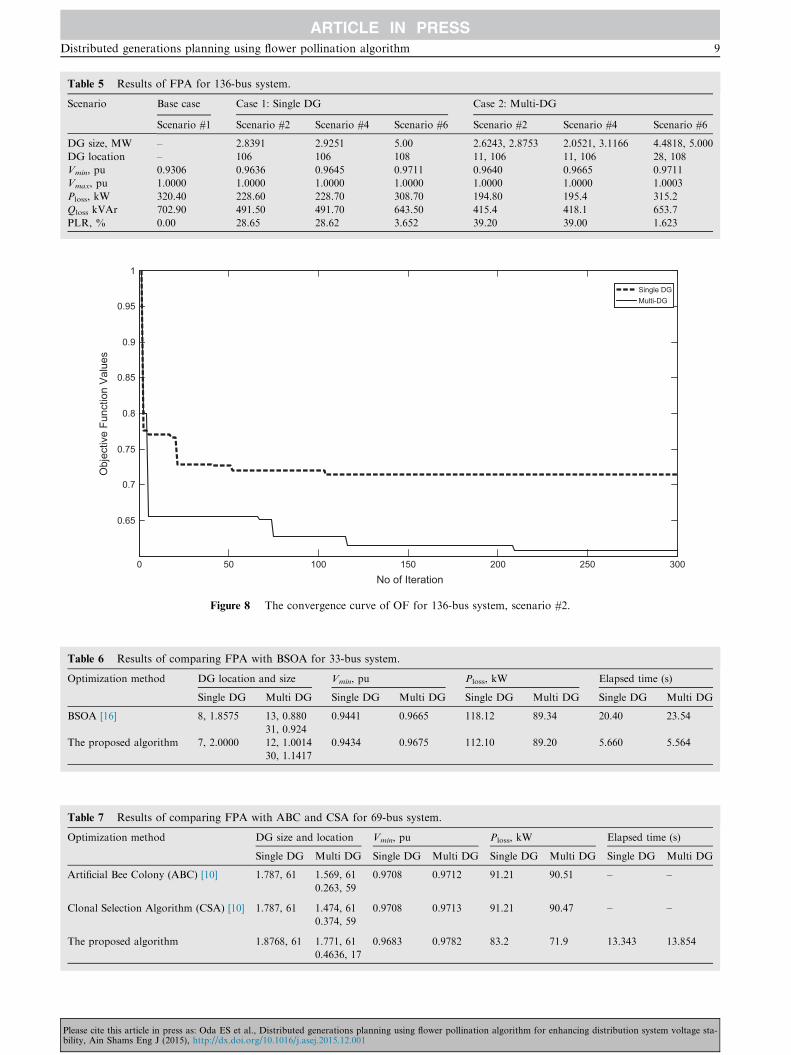
Table 5 Results of FPA for 136-bus system.
Scenario Base case Case 1: Single DG Case 2: Multi-DG
Scenario #1 Scenario #2 Scenario #4 Scenario #6 Scenario #2 Scenario #4 Scenario #6
DG size, MW – 2.8391 2.9251 5.00 2.6243, 2.8753 2.0521, 3.1166 4.4818, 5.000
DG location – 106 106 108 11, 106 11, 106 28, 108
Vmin, pu 0.9306 0.9636 0.9645 0.9711 0.9640 0.9665 0.9711
Vmax, pu 1.0000 1.0000 1.0000 1.0000 1.0000 1.0000 1.0003
Ploss, kW 320.40 228.60 228.70 308.70 194.80 195.4 315.2
Qloss kVAr 702.90 491.50 491.70 643.50 415.4 418.1 653.7
PLR, % 0.00 28.65 28.62 3.652 39.20 39.00 1.623
0 50 100 150 200 250 300
0.65
0.7
0.75
0.8
0.85
0.9
0.95
1
No of Iteration
Obj
ectiv
e Fu
nctio
n V
alue
s
Single DGMulti-DG
Figure 8 The convergence curve of OF for 136-bus system, scenario #2.
Table 6 Results of comparing FPA with BSOA for 33-bus system.
Optimization method DG location and size Vmin, pu Ploss, kW Elapsed time (s)
Single DG Multi DG Single DG Multi DG Single DG Multi DG Single DG Multi DG
BSOA [16] 8, 1.8575 13, 0.880 0.9441 0.9665 118.12 89.34 20.40 23.54
31, 0.924
The proposed algorithm 7, 2.0000 12, 1.0014 0.9434 0.9675 112.10 89.20 5.660 5.564
30, 1.1417
Table 7 Results of comparing FPA with ABC and CSA for 69-bus system.
Optimization method DG size and location Vmin, pu Ploss, kW Elapsed time (s)
Single DG Multi DG Single DG Multi DG Single DG Multi DG Single DG Multi DG
Artificial Bee Colony (ABC) [10] 1.787, 61 1.569, 61 0.9708 0.9712 91.21 90.51 – –
0.263, 59
Clonal Selection Algorithm (CSA) [10] 1.787, 61 1.474, 61 0.9708 0.9713 91.21 90.47 – –
0.374, 59
The proposed algorithm 1.8768, 61 1.771, 61 0.9683 0.9782 83.2 71.9 13.343 13.854
0.4636, 17
Distributed generations planning using flower pollination algorithm 9
Please cite this article in press as: Oda ES et al., Distributed generations planning using flower pollination algorithm for enhancing distribution system voltage sta-bility, Ain Shams Eng J (2015), http://dx.doi.org/10.1016/j.asej.2015.12.001
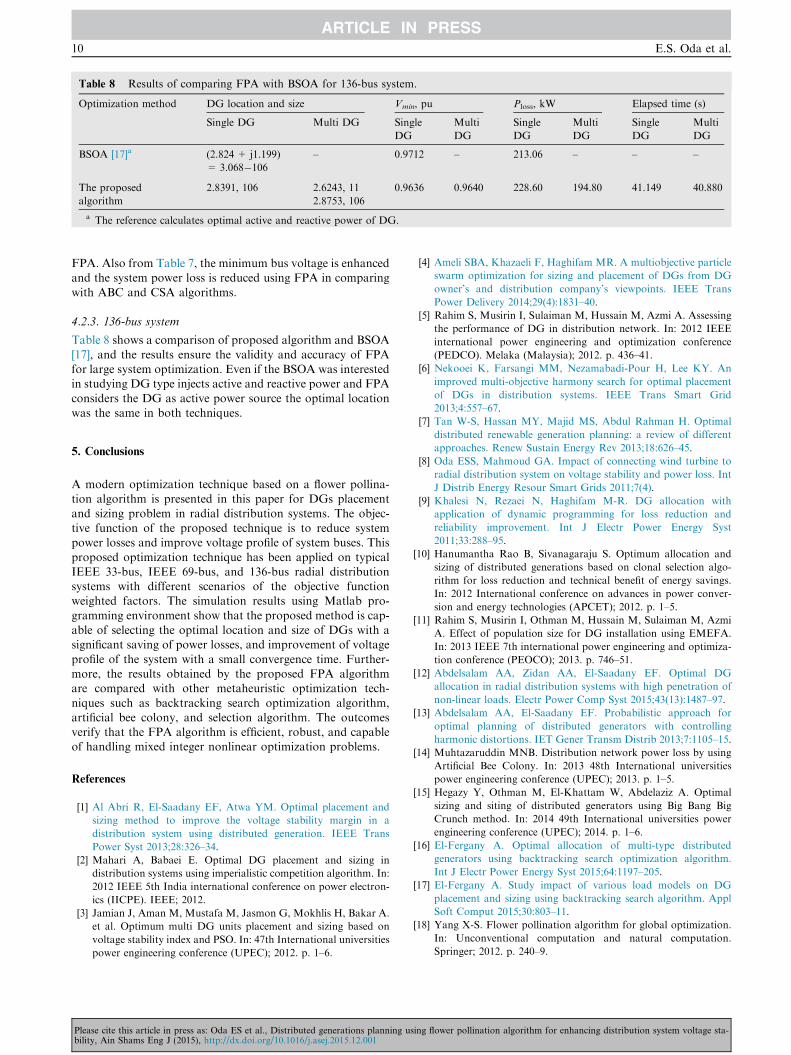
Table 8 Results of comparing FPA with BSOA for 136-bus system.
Optimization method DG location and size Vmin, pu Ploss, kW Elapsed time (s)
Single DG Multi DG Single
DG
Multi
DG
Single
DG
Multi
DG
Single
DG
Multi
DG
BSOA [17]a (2.824 + j1.199)
= 3.068�106
– 0.9712 – 213.06 – – –
The proposed
algorithm
2.8391, 106 2.6243, 11 0.9636 0.9640 228.60 194.80 41.149 40.880
2.8753, 106
a The reference calculates optimal active and reactive power of DG.
10 E.S. Oda et al.
FPA. Also from Table 7, the minimum bus voltage is enhancedand the system power loss is reduced using FPA in comparing
with ABC and CSA algorithms.
4.2.3. 136-bus system
Table 8 shows a comparison of proposed algorithm and BSOA
[17], and the results ensure the validity and accuracy of FPAfor large system optimization. Even if the BSOA was interestedin studying DG type injects active and reactive power and FPA
considers the DG as active power source the optimal locationwas the same in both techniques.
5. Conclusions
A modern optimization technique based on a flower pollina-tion algorithm is presented in this paper for DGs placement
and sizing problem in radial distribution systems. The objec-tive function of the proposed technique is to reduce systempower losses and improve voltage profile of system buses. This
proposed optimization technique has been applied on typicalIEEE 33-bus, IEEE 69-bus, and 136-bus radial distributionsystems with different scenarios of the objective functionweighted factors. The simulation results using Matlab pro-
gramming environment show that the proposed method is cap-able of selecting the optimal location and size of DGs with asignificant saving of power losses, and improvement of voltage
profile of the system with a small convergence time. Further-more, the results obtained by the proposed FPA algorithmare compared with other metaheuristic optimization tech-
niques such as backtracking search optimization algorithm,artificial bee colony, and selection algorithm. The outcomesverify that the FPA algorithm is efficient, robust, and capableof handling mixed integer nonlinear optimization problems.
References
[1] Al Abri R, El-Saadany EF, Atwa YM. Optimal placement and
sizing method to improve the voltage stability margin in a
distribution system using distributed generation. IEEE Trans
Power Syst 2013;28:326–34.
[2] Mahari A, Babaei E. Optimal DG placement and sizing in
distribution systems using imperialistic competition algorithm. In:
2012 IEEE 5th India international conference on power electron-
ics (IICPE). IEEE; 2012.
[3] Jamian J, Aman M, Mustafa M, Jasmon G, Mokhlis H, Bakar A.
et al. Optimum multi DG units placement and sizing based on
voltage stability index and PSO. In: 47th International universities
power engineering conference (UPEC); 2012. p. 1–6.
Please cite this article in press as: Oda ES et al., Distributed generations planning ubility, Ain Shams Eng J (2015), http://dx.doi.org/10.1016/j.asej.2015.12.001
[4] Ameli SBA, Khazaeli F, Haghifam MR. A multiobjective particle
swarm optimization for sizing and placement of DGs from DG
owner’s and distribution company’s viewpoints. IEEE Trans
Power Delivery 2014;29(4):1831–40.
[5] Rahim S, Musirin I, Sulaiman M, Hussain M, Azmi A. Assessing
the performance of DG in distribution network. In: 2012 IEEE
international power engineering and optimization conference
(PEDCO). Melaka (Malaysia); 2012. p. 436–41.
[6] Nekooei K, Farsangi MM, Nezamabadi-Pour H, Lee KY. An
improved multi-objective harmony search for optimal placement
of DGs in distribution systems. IEEE Trans Smart Grid
2013;4:557–67.
[7] Tan W-S, Hassan MY, Majid MS, Abdul Rahman H. Optimal
distributed renewable generation planning: a review of different
approaches. Renew Sustain Energy Rev 2013;18:626–45.
[8] Oda ESS, Mahmoud GA. Impact of connecting wind turbine to
radial distribution system on voltage stability and power loss. Int
J Distrib Energy Resour Smart Grids 2011;7(4).
[9] Khalesi N, Rezaei N, Haghifam M-R. DG allocation with
application of dynamic programming for loss reduction and
reliability improvement. Int J Electr Power Energy Syst
2011;33:288–95.
[10] Hanumantha Rao B, Sivanagaraju S. Optimum allocation and
sizing of distributed generations based on clonal selection algo-
rithm for loss reduction and technical benefit of energy savings.
In: 2012 International conference on advances in power conver-
sion and energy technologies (APCET); 2012. p. 1–5.
[11] Rahim S, Musirin I, Othman M, Hussain M, Sulaiman M, Azmi
A. Effect of population size for DG installation using EMEFA.
In: 2013 IEEE 7th international power engineering and optimiza-
tion conference (PEOCO); 2013. p. 746–51.
[12] Abdelsalam AA, Zidan AA, El-Saadany EF. Optimal DG
allocation in radial distribution systems with high penetration of
non-linear loads. Electr Power Comp Syst 2015;43(13):1487–97.
[13] Abdelsalam AA, El-Saadany EF. Probabilistic approach for
optimal planning of distributed generators with controlling
harmonic distortions. IET Gener Transm Distrib 2013;7:1105–15.
[14] Muhtazaruddin MNB. Distribution network power loss by using
Artificial Bee Colony. In: 2013 48th International universities
power engineering conference (UPEC); 2013. p. 1–5.
[15] Hegazy Y, Othman M, El-Khattam W, Abdelaziz A. Optimal
sizing and siting of distributed generators using Big Bang Big
Crunch method. In: 2014 49th International universities power
engineering conference (UPEC); 2014. p. 1–6.
[16] El-Fergany A. Optimal allocation of multi-type distributed
generators using backtracking search optimization algorithm.
Int J Electr Power Energy Syst 2015;64:1197–205.
[17] El-Fergany A. Study impact of various load models on DG
placement and sizing using backtracking search algorithm. Appl
Soft Comput 2015;30:803–11.
[18] Yang X-S. Flower pollination algorithm for global optimization.
In: Unconventional computation and natural computation.
Springer; 2012. p. 240–9.
sing flower pollination algorithm for enhancing distribution system voltage sta-
Distributed generations planning using flower pollination algorithm 11
[19] Yang X-S, Karamanoglu M, He X. Flower pollination algorithm:
a novel approach for multiobjective optimization. Eng Optim
2014;46:1222–37.
[20] Yang X-S. Nature-inspired optimization algorithms. Elsevier; 2014.
[21] Huang S-J, Gu P-H, Su W-F, Liu X-Z, Tai T-Y. Application of
flower pollination algorithm for placement of distribution trans-
formers in a low-voltage grid. In: 2015 IEEE international
conference on industrial technology (ICIT); 2015. p. 1280–5.
[22] Pambudy M, Musofa M, Hadi SP, Ali HR. Flower pollination
algorithm for optimal control in multi-machine system with
GUPFC. In: 2014 6th International conference on information
technology and electrical engineering (ICITEE); 2014. p. 1–6.
[23] Abu-Mouti FS. Radial distribution feeders compensation using
distributed generation, Master of Applied Science. Dalhousie
University; 2008.
[24] Coello CAC. An updated survey of evolutionary multiobjective
optimization techniques: state of the art and future trends. In:
Proceedings of the 1999 congress on evolutionary computation,
CEC 99; 1999.
[25] Freitas W, Vieira JC, Morelato A, Da Silva LC, Da Costa VF,
Lemos FA. Comparative analysis between synchronous and
induction machines for distributed generation applications. IEEE
Trans. Power Syst. 2006;21:301–11.
[26] MathWorks <http://www.mathworks.com>.
[27] KashemM,GanapathyV, JasmonG,BuhariM.Anovelmethod for
loss minimization in distribution networks. In: Proceedings of the
international conference on electric utility deregulation and restruc-
turing and power technologies 2000, DRPT 2000; 2000. p. 251–6.
[28] Baran ME, Wu FF. Optimal sizing of capacitors placed on a radial
distribution system. IEEE Trans Power Delivery 1989;4:735–43.
[29] Mantovani JR, Casari F, Romero RA. Reconfiguracao de
sistemas de distribuicao radiais utilizando o criterio de queda de
tensao. Controle and Automacao 2000:150–9.
Eyad S. Oda is an assistant lecturer at Suez
Canal University, Egypt. He received his B.Sc
and M.Sc. degrees in Electrical Engineering
from Suez Canal University, Egypt, in 2006,
and 2012. His current research areas include
power quality issues, distributed energy
resources planning and application of artificial
intelligent techniques on power systems.
Please cite this article in press as: Oda ES et al., Distributed generations planning ubility, Ain Shams Eng J (2015), http://dx.doi.org/10.1016/j.asej.2015.12.001
Abdelazeem A. Abdelsalam is an Assistant
Professor at Suez Canal University, Egypt. He
was a post doctorate fellow at University of
Ontario Institute of Technology (UOIT),
Canada. He received his B.Sc., M.Sc. and Ph.
D. degrees in Electrical Engineering from Suez
Canal University, Egypt, in 2001, 2005 and
2011, respectively. His current research areas
include power quality issues, FACTS tech-
nology, distributed energy resources interface
and control and application of artificial
intelligent techniques on power systems.
Mohamed N. Abdel-Wahab had his B.Sc. from
Zagazig University, and then he had his M.Sc.
and Ph.D. from Mansoura University, Egypt.
He worked as a super-intended engineer in
(Naval Medical Research Unit) NAMRU-3 in
Cairo then he participated in upgrading elec-
trical network of Abu Hamad Air Base as an
external electrical officer engineer then he
moved to Egyptian Electricity Transmission
Company (EETC) as a consultant engineer.
Eventually, Dr. Abdel-Wahab had been
appointed as an assistant professor in Electrical Engineering Depart-
ment, Faculty of Engineering, Suez Canal University, Egypt. He
published fourteen papers in international journals, national and
international conferences.
Magdi M. El-Saadawi was born in Mansoura,
Egypt in 1959. He received his B.Sc. and
M.Sc. from Mansoura University, Egypt in
1982 and 1988, respectively, and his Ph.D.
fromWarsaw University of Technology in 1997.
He was a teaching assistant at Mansoura
University from 1983–1992. From 1997, he
was a staff member of the Electrical Engi-
neering Department, Mansoura University,
and has been a professor since May 2011. His
fields of interest include power system analy-
sis, Renewable energy applications, DG systems, and AI applications
in power systems.
sing flower pollination algorithm for enhancing distribution system voltage sta-
Recommended