Distortions to Agricultural Incentives
in the Philippines
Cristina C. David, Ponciano Intal and Arsenio M. Balisacan
Philippine Institute for Development Studies
De La Salle University [email protected]
SE Asian Regional Center for Graduate Study and Research in Agriculture [email protected]
Agricultural Distortions Working Paper 28, December 2007 This is a product of a research project on Distortions to Agricultural Incentives, under the leadership of Kym Anderson of the World Bank’s Development Research Group (www.worldbank.org/agdistortions). The authors are grateful for helpful comments from workshop participants, for computational assistance from Ernesto Valenzuela, and for funding from World Bank Trust Funds provided by the governments of Ireland, Japan, the Netherlands (BNPP) and the United Kingdom (DfID). This Working Paper series is designed to promptly disseminate the findings of work in progress for comment before they are finalized. The views expressed are the authors’ alone and not necessarily those of the World Bank and its Executive Directors, nor the countries they represent, nor of the institutions providing funds for this research project.

Distortions to Agricultural Incentives in the Philippines
Cristina David, Ponciano Intal, and Arsenio Balisacan
The economic performance of the Philippines has lagged behind most other developing countries
in Asia. Whereas the Philippine economy and its agriculture sector performed moderately well in
the 1960s and 1970s, because of the early advent of the Green Revolution in rice and the world
commodity boom, the country has had the lowest average growth rates in gross domestic
product, gross value added in agriculture, and agricultural exports over the past two decades in
South and Southeast Asia (Table 1).
Past studies have argued that the country’s poor agricultural performance has been due
largely to weaknesses in the policy and institutional frameworks governing the sector, and not so
much to real domestic and external market factors (David 2003; Balisacan, Fuwa and Debuque
2004). Government price and trade policies have distorted economic incentives, and the choice
of policy instruments used have promoted rent seeking and raised the economic cost of
government interventions. The lack of market infrastructure, underinvestment in agricultural
research, distortions in land markets due to the agrarian reform program, and other weaknesses in
governance have all contributed to the poor performance of the sector.
The declining trend in tariff protection since the 1980s — through a series of unilateral
tariff reform programs and multilateral and regional trade agreements — have been well-
documented (Manasan and Pineda 1999; Aldaba 2005a and 2005b; Pasadillo 2006). All ex-ante
impact assessments of the welfare impacts of trade liberalization using computable general
equilibrium models consistently report positive effects (Habito and Cororaton 2000; Cororaton
2000; Clarete 1991). International studies, mostly using the GTAP model, likewise, show
generally favorable results from trade reform. Yet after more than two decades of trade
liberalization efforts, the country’s economic performance did not significantly improve: per
capita income continued to stagnate, domestic employment opportunities remained low, and
poverty reduction lagged behind most other Asian neighbors.
2
Although the country appears to have become more open — as evidenced by the
substantial rise in the ratio of the traded value of imports and exports to gross domestic product
(Table 2) — that increase was not accompanied by an equivalent growth of gross domestic
product. The rise in those trade openness indicators was primarily achieved through the rapid
export growth of semi-conductors and electronic components with very high import content and
low value added ratios. The growth rate of food and agriculture exports continued to drop, and
the country’s dependence on agricultural imports rose sharply (Table 2).1
There are several complex factors that might explain why the predicted impacts of trade
liberalization have not been realized in the Philippines. One explanation, at least with respect to
the agricultural sector, could be that the rate of trade liberalization as measured by the trends in
average tariffs (typically used by both local and international analysts) do not accurately reflect
the extent nor the direction of change in agricultural protection over the past several decades.
The objectives of this study are to quantify the trends and patterns of agricultural
distortions from the early 1960s to 2004, and to explain the reasons behind those changes over
time. In the next section, the historical patterns of agricultural performance and structural change
are briefly described. The second section examines the evolution of both economy-wide and
agriculture-specific policies that have distorted price incentives in the sector. The estimated
impact of these policies on agricultural incentives is presented in the third section. The fourth
section analyzes the reasons behind the evolution of policy choices, including the role of
multilateral and regional trade agreements in the changes observed in recent years. Finally, we
draw out the prospects for national policy reform: likely versus desirable policy direction
through to 2020, implications for the trend level of distortions to agricultural incentives and for
the choice of policy instruments, and policy lessons and consequences for other developing and
transition economies.
Agricultural performance and structural change
1 Real wages did not decrease only because of the acceleration of labor migration abroad. Migration increased foreign exchange earnings, with remittances now accounting for at least 10% share of gross national product.

3
Despite the relatively slow growth of the Philippine economy, the usual structural transformation
in the course of economic development has taken place. The contribution of agriculture to the
gross domestic product declined somewhat slowly from 1960 (30 percent) to 1980 (24 percent),
and more rapidly in recent years (to 14 percent by 2004). This was accompanied by a steady
decrease in the share of the sector in total employment from 61 percent in 1960 to 37 percent in
2000. The share has remained constant since then (Table 2).
Unlike the rapid industrialization that characterized the nature of economic growth
among the so-called Asian tigers, however, the share of industry in the Philippines – which
increased from 31 percent in 1960 to 39 percent in 1980 – has fallen back to the low 30s by
2004. Food manufacturing accounts for about 40 percent of the industrial sector, and half of this
consists of light processing of rice and maize, sugar, coconut, livestock and poultry. Services
have provided the highest contribution to gross domestic product and total employment. While
growth in services was driven primarily by domestic demand for logistical support, trading and
financial services, the rapid expansion of business process outsourcing in recent years is
changing the nature and prospects for growth of this sector.
Growth rate and composition
The average annual growth rates of gross value added by major agricultural commodities were
quite erratic over time. The crop sector grew rapidly prior to 1980, due to the Green Revolution
in rice and the world commodity boom, but it performed poorly after that: the average growth
rate was far below that of the population. This marked slowdown can be observed generally
across commodities (Table 3).
Rice is the the main staple and the single most important crop in the Philippines. Whilst
the growth rate of rice declined since 1970, it grew faster than population. It continues to receive
the bulk of public expenditure for the crop sector, and it has also benefited from increasing price
protection (see later). Imports of rice as a proportion of total supply have risen since the 1980s,
reflecting the effect of increasing incomes and a shift away from maize as a food staple. Maize
production experienced declining growth rates in spite of a rapid expansion of demand for maize
as feed for the pigmeat and poultry industries, and despite rising price protection.

4
The poorest performers are the traditional export crops—coconut, sugar, abaca, and
tobacco, each of which experienced a decreasing growth rate. By contrast, some non-traditional
export crops — such as bananas, pineapples, and mangoes — experienced high growth rates.
However, the crop diversification, particularly towards high-valued horticultural crops that raised
the growth rates of the agricultural sector in Thailand, Chile and some other developing
countries, was not so pronounced in the Philippine case.
Growth rates of livestock accelerated after 1980, their contribution to gross value added
(GVA) rising from 18 percent to nearly 25 percent within just 25 years. That remarkable
performance was due to increasing domestic demand as well as to productivity gains from the
shift to larger-scale operations and the adoption of new technologies embedded in imported
breeds, veterinary medicines, and feed ingredients.
Agricultural trade and trade openness
Agriculture has historically been a net foreign exchange earner, contributing nearly two-thirds of
total exports and accounting for only less than 20 percent of total imports in the 1960s (Table 2).
The sector’s share in total exports dropped sharply to just 5 or 6 percent after the 1980s. By
2004, the agricultural sector had ceased to be a net earner of foreign exchange, as agricultural
imports rose from about 30 percent of agricultural exports in the 1960s and 1970s to nearly 140
percent since the turn of the century. The relatively high growth rate of agricultural exports in the
1970s was due mainly to the world commodity boom and the expansion of non-traditional
commodities (bananas, pineapples and fishery products) – but world commodity prices fell
sharply in the 1980s and continued to be low until recently. Further, the growth of non-
traditional agricultural exports leveled off by the 1990s. This is in stark contrast to the
performance of neighboring countries, which experienced major export booms in cash crops
even after the 1980s. For example, Thailand had dramatic success in rubber, Malaysia in palm
oil, and Indonesia in palm oil and cocoa.
The composition of agricultural exports changed over the years in the Philippines.
Coconut products continued to be the top foreign exchange earner, but its share decreased from
nearly 70 percent of agricultural exports in 1970 to less than 30% in recent years. The
contribution of sugar to agricultural exports, which was second only to coconut in the 1970s (30

5
percent), is now only 3 percent. The export value of bananas alone was about twice that of sugar;
and this has been exceeded by exports of pineapples since the 1990s. Fruits and vegetables as a
group now account for nearly 30 percent of agricultural exports.2
The rapid growth of agricultural imports stemmed from several factors. First, economic
development increased demand for food products with higher income elasticities. Many of these
products — such as wheat, milk and other dairy products, and beef — are commodities in which
the Philippines does not have a comparative advantage. Second, livestock and poultry require
agricultural inputs — soybean meal, maize, fishmeal and other feed ingredients — that are
cheaper to import than to produce domestically. Third, agricultural modernization induced
greater reliance on modern manufactured inputs that are mostly imported, such as fertilizers,
agricultural chemicals, farm and agro-processing machinery, and veterinary medicines. Lastly,
trade liberalization increased imports of previously highly protected agricultural commodities
including fruits and beef.
There has been an apparent decrease in agriculture’s trade openness as measured by
imports plus exports as a percentage of gross value added (last row of Table 2). While
agriculture was relatively more open than the rest of the economy up to the 1970s, the reverse
has been true since then. This was due not so much to the reduction of imports to gross value
added ratios (as these increased for both agriculture and non-agriculture sectors), but rather to
decreasing export ratios for agriculture in contrast to the steadily rising trend for the rest of the
economy. The declining trend in agriculture’s trade openness in the 1970s and 1980s gradually
reversed in the 1990s; but the rate of increase in the import ratios continued to be higher than its
export ratios.
Comparative advantage and productivity trends
The slower growth of Philippine agriculture compared to other developing Asian countries, and
stagnation of agricultural exports, suggest that the country has been losing its former
comparative advantage in the sector. Indeed, measures of revealed comparative advantage
decreased sharply for agriculture as a whole, and for all major agricultural exports (Table 4). For
2Fishery products, led by tuna and shrimps, have become major agricultural exports contributing about 20 percent of total agricultural exports in recent years.

6
example, the country’s share of the world market in coconut products fell, and sugar began to be
imported (as exports are limited to preferential access to the high-priced US market). Even for
non-traditional exports, such as bananas and pineapples, the shares of Philippine products on
world markets have declined since the mid-1980s.
The apparent loss in comparative advantage in agriculture is consistent with the reported
trends in labor and land productivity indicators (David 2003). Both labor and land productivities
increased up to the late 1970s, particularly during the Green Revolution period in rice. Whereas
labor productivity for agriculture as a whole recovered after dropping sharply in the early 1980s,
labor productivity in the crop sub-sector stagnated since then. Land productivity for the crop sub-
sector grew slowly, particularly in the most recent period, with yields per hectare of traditional
exports generally remaining constant or even declining. Higher growth in yields can be observed
in rice, maize, and non-traditional exports such as bananas, pineapples and mangoes. Growth in
productivity appears to have occurred in the livestock sector though, where international
technology transfer, greater scale of operations, and other management-related innovations have
increased production efficiencies significantly.
Historical evolution of price intervention policies
Before estimating rates of assistance it is helpful to first describe policy trends since the 1960s,
beginning with economywide policies and then turning to policies specific to agriculture.
Economy-wide policies
An import substitution industrialization strategy dominated Philippine economic policies up to
the late 1970s. The groundwork for this was laid by comprehensive foreign exchange and import
controls that were instituted in response to the severe balance of payments crisis that occurred in
the late 1940s, shortly after the country’s political independence from the United States. The
government’s use of “essentiality” criteria in allocating foreign exchange and import licenses
during the 1950s encouraged domestic production at the finishing stages of primarily

7
nonessential and semi-essential consumer goods, against backward integration for the production
of raw materials, intermediate and capital goods. These policies defended an overvalued peso
and thus clearly penalized exports and agriculture.
A tariff system was instituted as a decontrol measure in 1957. The system, however,
largely preserved the biases in the incentive structure: tariffs depended again on essentiality
criteria. Import duties were higher for semi-finished products as compared to raw materials and
capital goods, and even higher for finished products. Moreover, quantitative trade restrictions
continued to exist for substantial number of agricultural and non-agricultural products. Indeed,
the subsequent balance of payments problem encountered in the early 1960s rendered tariff
protection redundant as import and foreign exchange controls were predominant. Adoption of a
multiple exchange rate system further penalized traditional agricultural exports.
In the early 1970s, a balance of payments crisis resulted in a major devaluation of the
peso. By this time the high economic cost of the import substitution industrialization strategy and
its detrimental effects on export potentials were being increasingly recognized. Nonetheless, the
policy response was to provide industrial incentives directly through tax holidays and the like to
selected firms, including exporting enterprises (Bautista and Tecson 2003). No attempt was made
to modify the highly protective tariff system. In fact, tariff protection was raised on many
import-competing products such as primary and processed food and agricultural products,
chemical products, metal manufactures, electrical appliances and machineries, and transport
equipment. During this period, the Philippines had the highest average tariff rate in Southeast
Asia (Intal and Power 1991). In addition, the number of imported products (based on 7-digit
PSIC classification) subject to quantitative restrictions rose from 26 percent in 1970 to 52
percent in 1980 (Bautista and Tecson 2003).
In the early 1980s, the government adopted various structural adjustment and
stabilization measures to correct fundamental distortions in economic incentives and imbalances
in the external and public sector accounts. These measures included trade policy reforms to
remove quantitative trade restrictions and reduce the level and dispersion of tariffs, and
liberalization of the foreign exchange market. The first of the unilateral trade liberalization
programs, called TRP 1, was instituted in 1981 as a condition for a World Bank structural
adjustment loan package.
8
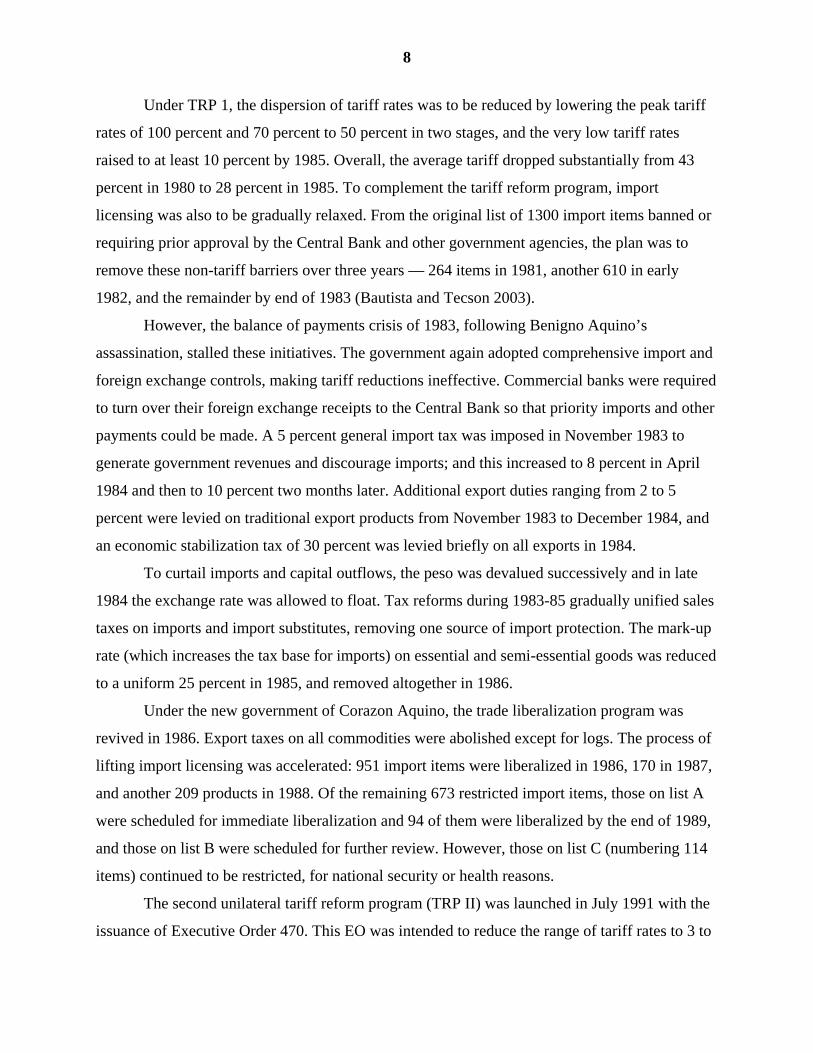
Under TRP 1, the dispersion of tariff rates was to be reduced by lowering the peak tariff
rates of 100 percent and 70 percent to 50 percent in two stages, and the very low tariff rates
raised to at least 10 percent by 1985. Overall, the average tariff dropped substantially from 43
percent in 1980 to 28 percent in 1985. To complement the tariff reform program, import
licensing was also to be gradually relaxed. From the original list of 1300 import items banned or
requiring prior approval by the Central Bank and other government agencies, the plan was to
remove these non-tariff barriers over three years — 264 items in 1981, another 610 in early
1982, and the remainder by end of 1983 (Bautista and Tecson 2003).
However, the balance of payments crisis of 1983, following Benigno Aquino’s
assassination, stalled these initiatives. The government again adopted comprehensive import and
foreign exchange controls, making tariff reductions ineffective. Commercial banks were required
to turn over their foreign exchange receipts to the Central Bank so that priority imports and other
payments could be made. A 5 percent general import tax was imposed in November 1983 to
generate government revenues and discourage imports; and this increased to 8 percent in April
1984 and then to 10 percent two months later. Additional export duties ranging from 2 to 5
percent were levied on traditional export products from November 1983 to December 1984, and
an economic stabilization tax of 30 percent was levied briefly on all exports in 1984.
To curtail imports and capital outflows, the peso was devalued successively and in late
1984 the exchange rate was allowed to float. Tax reforms during 1983-85 gradually unified sales
taxes on imports and import substitutes, removing one source of import protection. The mark-up
rate (which increases the tax base for imports) on essential and semi-essential goods was reduced
to a uniform 25 percent in 1985, and removed altogether in 1986.
Under the new government of Corazon Aquino, the trade liberalization program was
revived in 1986. Export taxes on all commodities were abolished except for logs. The process of
lifting import licensing was accelerated: 951 import items were liberalized in 1986, 170 in 1987,
and another 209 products in 1988. Of the remaining 673 restricted import items, those on list A
were scheduled for immediate liberalization and 94 of them were liberalized by the end of 1989,
and those on list B were scheduled for further review. However, those on list C (numbering 114
items) continued to be restricted, for national security or health reasons.
The second unilateral tariff reform program (TRP II) was launched in July 1991 with the
issuance of Executive Order 470. This EO was intended to reduce the range of tariff rates to 3 to

9
30 percent over a 5-year period. By the end of 1995, even though about 10 percent of the
commodity lines were still subjected to tariffs outside the target range, the average tariff rate had
declined from 33 percent in 1990 to 27 percent.
As part of the TRP II, EO 8 was also issued that converted quantitative restrictions of 153
agricultural products into their tariff equivalent rates and realigned tariffs on 48 commodities.
But this was soon reversed based on the Magna Carta of the Small Farmers (RA7606) passed in
1991, which provided, among other things, blanket authority for restricting agricultural imports
competing with domestic production.
It should be emphasized that the price and trade protection of most major import-
competing agricultural products were largely untouched by the series of unilateral trade
liberalization efforts since the late 1980s. Even with the WTO and other regional trade
agreements, a number of non-tariff trade barriers continue to distort prices of some of the most
important of commodities.
Agriculture-specific policies to the mid-1980s
Although import tariffs are generally levied on all agricultural products and inputs, these are
more commonly in effect only on agricultural inputs and agricultural products which are not
locally produced in any significant quantity. Such products include milk, wheat and soybeans.
Tariff protection is essentially redundant on exportable products that are competitive in world
markets, and on non-traded commodities because of prohibitive transport and other marketing
costs.
Over the period under study, a wide variety of policy instruments that influence price
incentives were applied to major agricultural commodities. These include government monopoly
control on international trade and domestic marketing operations, import bans, quantitative trade
restrictions, import licensing, export taxes, and export bans.3 Furthermore, despite serious efforts
at unilateral trade liberalization, some of these policy instruments applicable to the more
important import-competing agricultural products were largely kept intact. Indeed, some of these
3 Even for relatively minor crops, specific laws were passed prohibiting imports of onion, garlic, potatoes, and cabbages (RA 1296) in 1955, coffee (RA2712) in 1960, and tobacco/cigarettes except for blending purposes (RA4155 and other PDs) in 1964.

10
interventions had a long history, starting in the Commonwealth period that began in 1935. Under
the Marcos’ Martial Law era that began in late 1972, the government had considerably more
leeway to intervene in prices and the marketing of agricultural products, and it did so. The
following discussion, therefore, distinguishes the evolution of agricultural price intervention
policies before and after 1986 when the Aquino government took over the reins of government.
Rice and maize
When bad weather caused a drastic shortfall of staple food grains in 1936, the National Rice and
Corn Administration (NARIC) was established to ensure stable and low prices for consumers,
and adequate price incentives for farmers. To achieve these conflicting objectives, NARIC was
granted monopoly control over imports and exports of rice and maize, as well as budgetary
support and a credit line to undertake domestic market operations to defend price floors and
retail ceilings and narrow geographical and seasonal dispersion of prices.
With the high world commodity prices in the early 1970s, government monopoly control
over food commodities under this agency, which by then was renamed the National Food
Authority (NFA), was expanded beyond rice and maize. This was to allow tariff-free
importations of wheat, maize, soybeans, soybean meal, ruminant livestock and beef.
Sugar
The sugar industry has historically been the most highly assisted industry. This is due to
preferential access to the US market (that began in 1902) and the authority given to the
Philippine government to administer its sugar export quota to the US in 1934 through the Jones-
Costigan Act.
Initially, the domestic quota system was established for the orderly distribution of the US
quota among sugar producers. In the 1960s, this quota system was also designed to reduce the
burden on domestic consumers of the higher export prices resulting from the 1962 devaluation
and the greater US quota allocation arising from the Cuban crisis. Under this system —which has
continued to the present— producers are paid a composite price derived as an average of the
export price, a lower domestic wholesale price, and a reserve price weighted by the quantity
allocations targeted for US exports, the domestic market, and as a reserve.

11
As the Laurel-Langley Agreement ended in 1974, sugar trading was effectively
nationalized, first under the Philippine Exchange Inc. (PHILEX, Inc.) and subsequently under the
National Sugar Trading Association (NASUTRA). The latter was the sole wholesale buyer and
seller of sugar in both the domestic and international market until the end of the Marcos regime
in early 1986. It also established new refineries, operated sugar centrals, and acquired leading
enterprises involved in the transport, storage, and handling of sugar for export.
Export commodities
Except in the aftermath of the 1970 devaluation and the sharp increases in world commodity
prices in the mid-1970s, there have been few attempts to intervene in the production and trade of
exportable agricultural products. Initially as part of the stabilization measures, export taxes from
4 to 6 percent were imposed on major agricultural and other primary exports, and continued to be
in place until the mid-1980s for revenue generation. The higher rate of 6 percent was imposed on
traditional exports of coconut (copra) and centrifugal sugar to promote new and greater
processing of agricultural exports. The lower rate of 4 percent was applied to coconut oil,
dessicated coconut and coconut cake and meal, molasses, abaca, bananas, and pineapple
products.4
In 1974 with the world commodity boom, additional export premium duties were briefly
imposed, ranging from 20 to 30 percent of the difference between the ruling export price and a
February 1974 base price. Consequently, windfall gains from the devaluation and the commodity
boom in the early seventies were partially siphoned off from the producers of these agricultural
and primary exportable commodities.
The Coconut Consumers’ Stabilization Fund further levied the coconut industry in 1973
(commonly known as coco levy). This was partly to protect domestic consumers from a sharp
rise in coconut oil prices on the world market, and partly to raise funds for the development of
the coconut industry.5 There was also the belief that taxing or restricting coconut exports could
be beneficial as the Philippines was considered to have some monopoly power on the world
4 Export taxes were also imposed on logs at 10 percent, copper ore at 6 percent, and shrimps and prawns, lumber, plywood and veneer, and other metal ores at 4 percent. 5 About 20 percent of the revenues from the tax briefly supported the direct subsidy on domestic consumption of coconut oil products. The remainder was supposed to finance development programs in the coconut industry such as replanting, vertical integration and scholarships. Later research showed that very little benefit, if any, accrued to farmers from these expenditures (Clarete and Roumasset 1990).
12
market. (While the Philippines accounted for a high share of total world coconut and coconut oil
exports, any monopoly power was curtailed by the fact that coconut oil comprises only about 7
percent of the world lauric oil market). Part of the revenue from this levy was used to buy out 80
percent of the coconut oil milling industry and put it under the newly created, “privately owned”
United Coconut Oil Mills, Inc. (UNICOM). This eventually acted as a monopsonist buyer of
coconut from the farm sector. As world prices of coconut oil fell in 1982, the levy was lifted –
only to be replaced by a policy of banning coconut exports to protect coconut oil mills.
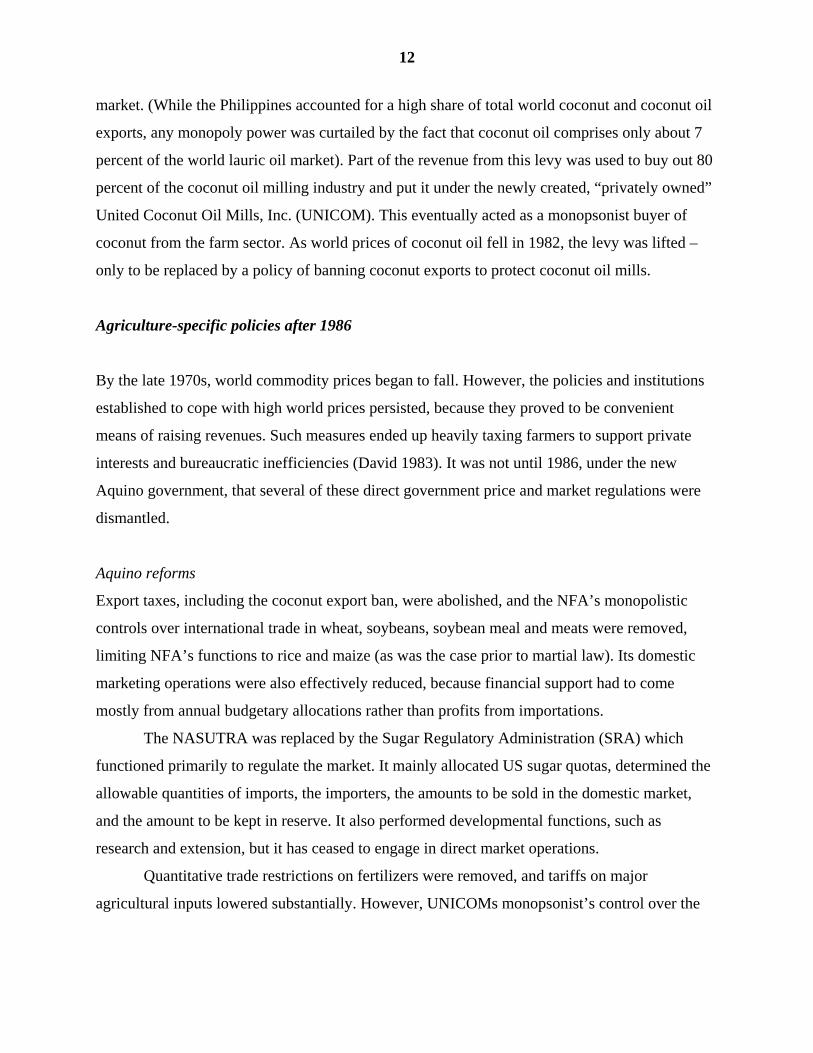
Agriculture-specific policies after 1986
By the late 1970s, world commodity prices began to fall. However, the policies and institutions
established to cope with high world prices persisted, because they proved to be convenient
means of raising revenues. Such measures ended up heavily taxing farmers to support private
interests and bureaucratic inefficiencies (David 1983). It was not until 1986, under the new
Aquino government, that several of these direct government price and market regulations were
dismantled.
Aquino reforms
Export taxes, including the coconut export ban, were abolished, and the NFA’s monopolistic
controls over international trade in wheat, soybeans, soybean meal and meats were removed,
limiting NFA’s functions to rice and maize (as was the case prior to martial law). Its domestic
marketing operations were also effectively reduced, because financial support had to come
mostly from annual budgetary allocations rather than profits from importations.
The NASUTRA was replaced by the Sugar Regulatory Administration (SRA) which
functioned primarily to regulate the market. It mainly allocated US sugar quotas, determined the
allowable quantities of imports, the importers, the amounts to be sold in the domestic market,
and the amount to be kept in reserve. It also performed developmental functions, such as
research and extension, but it has ceased to engage in direct market operations.
Quantitative trade restrictions on fertilizers were removed, and tariffs on major
agricultural inputs lowered substantially. However, UNICOMs monopsonist’s control over the

13
coconut market has continued, as the government’s attempts to wrest ownership of this entity
continue to be bogged down in court proceedings.
In spite of trade liberalization efforts in the late 1980s, most major importable agricultural
commodities with any significant domestic production remain subject to quantitative import
restrictions (QRs), particularly those protected by laws passed by Congress. Efforts to remove
QRs were pre-empted by the passage of the Magna Carta of the Small Farmers (RA 7606) in
1991 which provided, among other things, blanket authority for restricting agricultural imports
competing with domestic production. In addition, the Seed Law (RA 7308) was passed to
regulate the import of seeds and planting materials.
Uruguay Round Agreement on Agriculture
The country’s ratification of the GATT/WTO Uruguay Round Agreement in 1995 promised to
set a decisive path towards trade liberalization in agriculture. It aimed to replace all QRs with
tariffs, impose a ceiling on tariff rates, and reduce tariff protection over time. Unfortunately, the
specific agreements and the manner of implementation did not live up to the promise (David
1994; David 2003).
First of all, rice — one of the most heavily regulated commodities — was exempted from
tariffication until 2004, similar to the case of Japan and South Korea.6
Second, the quantitative trade restrictions (QRs) lifted in April 1996 under EO 313 were
replaced by tariff rate quotas which initially raised the out-of-quota tariffs to the maximum
(bound) tariffs committed under the WTO, while the in-quota tariffs were set mostly at the levels
existing in 1995. The initial out-of-quota tariffs of 100 percent were typically higher than the
nominal protection rates implied by the QRs in 1990-94. These were also higher than the book
tariff rates under the earlier EO 470 which programmed the unilateral tariff reductions of a wide
range of agricultural and industrial goods. Despite the scheduled reductions in the out-of-quota
tariffs by 2004, these are equal to or even higher than tariff rates back in 1995 under EO 470.
These rates are definitely higher than the government’s target average tariff of 5 percent by the
end of that period.
Furthermore, where QRs of the primary and lightly processed products were to be lifted,
tariffs were raised on a number of imported agricultural products considered to be close 6 The Philippines is still negotiating in the WTO’s Doha Round to keep government monopoly control over rice imports.

14
substitutes of commodities (e.g., feed wheat and barley, as substitutes for maize). Tariffs were
also increased to the same level on the more heavily processed products using these commodities
as the main raw materials (e.g., preserved and canned meat products, milled rice and maize, and
roasted coffee).
Third, the manner in which the minimum access volume (MAV) provision or the tariff
rate quota system of the Agreement was administered for major import-competing commodities
in effect simply perpetuated quantitative trade restrictions. The quantities that may be imported
at the lower in-quota tariffs were sometimes changed to prevent domestic prices from rising
sharply whenever production shortfalls occurred. Thus, tariffs were operationally no different
from QRs. For certain commodities, the right to import was given mostly to domestic producers
of the same products (e.g., pork and poultry) who often choose not to utilize their import
allocation so as to protect their domestic production. Moreover, since most of the MAV volumes
are lower than import demand at the in-quota tariff rate, and the rights to import the MAV
volume were not auctioned, large quota rents accrued to those given access to the MAV
allocation, at least in the early period of its implementation.
Finally, the Agreement’s lack of provision regarding market operations of parastatals
allowed the Sugar Regulatory Administration to continue exercising its regulatory functions with
respect to import levels and market destinations of domestic sugar production. In fact, the
domestic market operations of the NFA to support producer prices were expanded in the late
1990s to include sugar.7
Regional trade agreements
In 1992, the six original ASEAN member countries agreed to form the ASEAN Free Trade Area
(AFTA). The aim of the area was to reduce tariffs to between 0 and 5 percent and to abolish
quantitative trade restrictions and other non-tariff trade barriers by 2010. Under the Common
Effective Preferential Tariff (CEPT) Scheme, unprocessed agricultural products were commonly
included in the Sensitive List (SL), and thus they start trade liberalization later (between 2001-
2003) and are required to achieve the 0 to 5 percent tariff targets by 2010. A recent study
7 The government also occasionally used the WTO sanctioned safeguard mechanism when additional tariffs were imposed on poultry.

15
indicated that thus far, the effective protection rates of agriculture are still largely unaffected by
the CEPT (Pimentel 2006).
Unlike other FTAs, which usually delay or totally exclude trade liberalization of
agriculture, the China-AFTA Agreement signed in 2002 specifically covered a significant
portion of agricultural products in the Early Harvest Program (EHP). It called for the elimination
of tariffs on live animals, meat and edible meat offals, fish, dairy products, other animal
products, live trees, vegetables, fruits and nuts, and a few commodities from other chapters of the
HS. The changes were to start January 2004 and be in place no later than January 2006 for
ASEAN6, although some exceptions were allowed depending upon negotiations with China.
The Philippines signed its EHP with China in early 2006 and the agreement covered
proportionately fewer commodities compared to other ASEAN countries, suggesting there is less
interest in engaging with China in more open agricultural trade (Pasadilla 2006). Consumers, in
general, will benefit from lower prices on covered commodities, while producers of exportable
bananas, pineapples, mangoes and other tropical fruits, and coconut and coconut oil, are
expected to gain from greater access to the vast Chinese market. Producers of vegetables,
leguminous crops and pigmeat, together with producers of fruits for the local market, however, at
least initially will be hurt by the entry from China of relatively cheap frozen meat and other meat
products, potatoes, carrots, onions, garlic, peanuts, pears, apples, oranges and other fruits and
vegetables.
Estimates of nominal and relative rates of assistance
Measuring the distortions to incentives caused by price and trade policies has had a long history
in the Philippines. The first effort was by John Power (1971) for 1965, which was followed by
studies conducted by Norma Tan (1979) for 1974, Elizabeth Tan (1994) for the 1980s, Manasan
and Pineda (1999) for the 1990s, and Aldaba (2005a,b) for recent years. These studies estimate
the effective protection rates of all industries, both agricultural and non-agricultural. However,
the main interest and analysis were concentrated on the manufacturing sector.

16
The first studies on agricultural protection were conducted by David (1983), Intal and
Power (1991), and more recently David (2003). Unlike the industrial protection studies that
quantified the effects of tariffs and indirect sales taxes, these agricultural protection studies were
based on domestic and border price comparisons. This enabled the effects of non-tariff trade
barriers to be measured and redundancy of tariffs, if any, to be taken into account. The indirect
impacts of industrial protection and other economy-wide factors on agricultural incentives
(through their effects on the exchange rate) were also analyzed.
Methodology
In this study, nominal rates of assistance to industries are estimated. The main focus of the
present study’s methodology (Anderson et al. 2008) is on government-imposed distortions that
create a gap between domestic prices and what they would be under free markets. Since it is not
possible to understand the characteristics of agricultural development with a sectoral view alone,
the project’s methodology not only estimates the effects of direct agricultural policy measures,
but it also generates estimates of distortions in non-agricultural sectors for comparative
evaluation.
More specifically, this study computes a Nominal Rate of Assistance (NRA) for
producers of the main farm products, which are shown in Figure 1. It also generates an NRA for
nonagricultural tradables, for comparison with that for agricultural tradables via the calculation
of a Relative Rate of Assistance (RRA – see Anderson et al. 2008). This provides a consistent
time series annual measure of distortions over more than four decades using the value of
production as weights to compute sectoral and sub-sectoral averages. This contrasts with
previous studies which, except for Manasan and Pineda (1999), have computed sectoral averages
using trade volume as weights.
A small open economy is assumed so that the country’s trade level does not affect world
prices.8 Border prices are estimated based on world price series reported by the World Bank. For
importables these are adjusted to c.i.f. values by assuming the cost of transport and insurance to
8 Only in coconut products is the country a significant trader, being the world’s largest producer and exporter for most of the period under study. However, coconut products are to a large extent substitutable with competing products such as palmoil and soybean oil. Coconut oil – the most important coconut product – constitutes only a small (7 percent) share of world trade in vegetable oils.

17
be a constant 20 percent of f.o.b. world prices. The country’s officially recorded import or export
unit values were not chosen because foreign exchange controls, export taxes and other taxes
mean export unit values are significantly undervalued, particularly in the period up to the mid-
1980s. For rice, maize, and sugar, either the import unit values may be overvalued (in the case of
imports by NFA) or undervalued (as private importers seek to lower their tariff payments by
under-invoicing). There were also many years when no imports were made for some importable
products.
Rice, maize, sugar, pigmeat, beef, and poultry are consistently classified as importables
even though there were no imports in some years. In the case of sugar, imports started only in the
1990s, but even in the 1960s and 1970s exports of sugar were confined to the high-priced United
States market to which the Philippines had preferential access, and were not competitive at the
free market world price. Sugar is thus also treated as an importable.
In the absence of detailed time series data on marketing costs, the domestic price is
defined as the wholesale price which is the closest to the same point in the marketing chain as the
border price.
For most of the agricultural commodities where domestic and border prices are
compared, the commodity that is internationally traded is lightly processed rather then the
primary product sold at the farm level: milled rice vs paddy, raw or refined sugar vs sugarcane,
frozen pigmeat, beef, or poultry vs hog, cattle or chicken birds. In the case of sugar, the rates of
protection received by farmers and millers are the same because the revenues derived from the
sale of raw and refined sugar in both the domestic and United States markets is shared
proportionately between the two in the ratio 70-30.9 The ratio of the farm price of paddy to the
retail price of rice did not significantly change, suggesting that farmers and rice millers together
with traders share proportionately from the protection accorded the rice industry. For rice, maize,
pigmeat, beef, and poultry, it is assumed that NRAs of the processed and farm products are
9According to Borrell et al. (1994), the quedan system, which allocates products produced to the various markets in fixed proportions, lowers incentives to increase production and invest in yield-increasing technology. This is because higher production reduces gross revenues. Also, because export allocation to the US is in a fixed ratio, there is no incentive to improve milling quality for export that will increase net returns. On the other hand, the sugar sharing arrangement (60 to 70 percent to growers and 30 to 40 percent to millers depending on the recovery rate) — instituted by law (RA 809) to provide millers a share of the benefits from the price protection — also reduces both growers’ and millers’ incentives to raise productivity. That is, growers receive only 60 to 70 percent of benefits from productivity-enhancing investments, while millers receive only 30 percent to 40 percent.

18
equivalent. In fact, import tariffs on these farm products are generally the same as their lightly
processed variety.
Aside from the major agricultural commodities specified above, NRAs are assumed for
the other, non-covered crops within the sector. Since price comparisons are more difficult to
perform for non-covered exportables— including pineapples, mangoes, abaca, and tobacco —
their average NRA is assumed to be zero or equal to the export tax whenever it applied. For
products that are non-traded because of prohibitive marketing costs, such as roots and tuber
crops, zero NRA values are assigned.10 For the many import-competing vegetables, other fruits,
and other minor crops, their NRA as a group is assumed to be the same as the average for
covered importable products.11 We assume that the weights are one-third each for exportables,
importables, and nontadables in the non-covered part of farm production (which in aggregate
amounts to around one-fifth of the agricultural sector’s value of production at undistorted prices).
For non-agricultural importable products, NRAs are generally based on book tariff
rates,12 apart from lightly processed food manufacturing industries — rice and maize milling,
sugar milling and refinery, coconut oil production and refining, etc. — where the NRAs are
based on price comparisons. For a number of non-agricultural primary industries in fishery,
forestry, and mining, we use the export taxes that applied from 1970 to 1985. Definitions of a
product’s tradability and industry weights used were the same as for agriculture.
10As prescribed in Anderson et al (2008), a commodity is considered non-tradable when the proportion of imports and exports to total value of production is less than 5 percent. When a commodity/or commodity group is both exported and imported in significant amounts (that is, more than 2.5 percent of total value of output) the NRA is estimated as the average of the NRA of that commodity as an exportable and as an importable weighted by their respective proportions of export and import values to the total traded value. 11 Despite the supposed removal of quantitative trade restrictions for all agricultural commodities except rice, non-tariff barriers appear to be significant in many commodities, such as in vegetables, fruits, and meat. Price comparisons are difficult to perform on many of these products because of the lack of consistent world price series, difficulties in making adjustments for quality differences, and the complexity of measuring the impact of increased imports of a commodity that may not be grown in the country on the price of a highly substitutable product that is produced domestically. One clear indication, however, is the very substantial smuggling of vegetables and fruits and nuts from China. Reported exports of these commodities to the Philippines in the Chinese trade statistics have been up to ten times higher than recorded imports of these commodity groups in the Philippine official trade statistics, despite the already low tariffs on these smuggled products (mostly 3 percent, but with some up to 10 percent since the late 1990s). 12 From 1960 up to the early 1980s, differences in the indirect tax on domestically produced and imported products imposed during this period were added to tariffs in the computation of NRAs. While the tax rates were in most cases the same, it is effectively greater because the tax base for imports is the tariff-inclusive price augmented by a percentage mark-up. In 1974, the weighted average nominal tariff rate alone equaled 22 percent for manufacturing, but the nominal rate of protection increased significantly to 31 percent when the effect of the difference in tax base is included (Tan 1979).

19
NRAs for agriculture
Estimates of the nominal rates of assistance of agricultural commodities from 1962 to 2004 are
summarized in Table 5. Although the estimated NRAs are highly variable over time (see the
annual estimates in Appendix Table A5), several general patterns emerge from the 5-year
averages.
First, import-competing industries have enjoyed much more assistance than exportables.
Coconut production has been penalized by negative NRAs over the entire period of the study,
averaging around -20 to -25 percent from the 1970s up to the mid-1980s. Apart from the multiple
exchange rate policy prior to 1970 (not measured here), this was due to the imposition of several
measures: the export tax, the coconut levy, and the coconut export ban to siphon off windfall
gains from the 1970 devaluation; the subsequent world commodity boom of 1973-74 that was
incompletely transmitted to the domestic market; and lower raw material costs for the coconut oil
milling industry. Despite the abolition of these policy instruments in 1986, however, coconut
farmers continued to be implicitly taxed, albeit at a lower rate of around 15 percent of border
prices. Evidently, the government’s failure to dismantle the former UNICOM’s ownership of 70
to 80 percent of the coconut oil milling industry up to the present time has allowed the
continuation of its monopsonist’s power over coconut’s domestic prices.
Second, among import competing commodities, the level of NRAs differed significantly
and the differences widened between two groups of import-competing products over time: the
NRAs for the most important commodities — rice, maize, and sugar — increased, while those
for the minor but numerous and high-valued commodities declined. Each of these commodities is
considered in more detail below.
Third, the increasing level of NRA observed since the 1980s may be due in part to the
government’s efforts to reduce the burden of adjustment of the agricultural sector to a secular
long-term decline of world commodity prices. This declining trend is visible in real domestic
prices compared to real world prices for several commodities in Appendix Figures A1 to A8.
Fourth, the dispersion of NRAs among agricultural products within the farm sector (as
measured by the standard deviation of those NRAs, reported near the bottom of Table 5) has not
dimished over time. Nor has the trade bias index (Table 6), indicating that the NRA for
importable farm products has persistently remained above that for exportables. Both of these

20
indicators imply that the efficiency of resource use within the farm sector has been substantially
compromised by agricultural policies.
And fifth, NRAs fluctuate from year to year (see Figure 2 and Appendix Table A5)
mostly in response to world price changes and sometimes in response to exchange rate
adjustments. For example, the NRA for import-competing agricultural products is below trend in
the 1973-74 and 1980 years of high international prices, and above trend in the low-priced mid-
1980s period. This suggests that domestic price stabilization has been an important objective of
agricultural price and trade policy. Table 7 indicates that the estimated coefficients of variation
of domestic prices tended to be considerably lower than those of world prices, particularly for
major import-competing commodities.
Rice
The trends in the nominal rate of assistance to rice reflected the NFA’s inability to
simultaneously attain its inherently conflicting objectives of providing low prices to consumers
and remunerative incentives to farmers. Prior to the late 1980s, the domestic price of rice was, on
average, about equal to the long term level of the border price. The negative levels of protection
from the 1970s to the early 1980s were due to unusually high world prices during this period.
This did not discourage farmers though, as the Green Revolution and rice farming land reform
were transforming tenants to owner-operators.13
With the drop in the world price of rice, a sharp fall in irrigation investments, and
stagnation of the yield potential of newer modern varieties, growth in demand for rice increased
faster than production from the late 1980s. The NRA for rice became positive and rose to about
50 percent by the early 2000s. This is despite much higher imports than ever before, reflecting
the country’s rising comparative disadvantage in rice production.
Maize
Maize is a food staple for about 10 to 15 percent of the population and a major feed ingredient
for livestock. In contrast to rice, however, domestic production has been consistently protected,
with the NRA steadily rising over time from about 25 percent in the late 1970s and early 1980s
13 In fact, the new seed-fertilizer technology and the accompanying irrigation expansion increased the country’s comparative advantage in rice production, briefly turning the country from being a net importer to being self-sufficient and reducing the domestic price in real terms by the late 1970s.

21
up to nearly 80 percent by the late 1990s. Unlike rice, there is less political pressure to lower
maize prices for poor consumers, because maize is mostly eaten as a subsistence crop among
upland farmers in the southern part of the country.
Sugar
When sugar is categorized as an importable and the world price of sugar — and not the export
unit value to the US premium market — is used as the border price in the calculation of the
NRA, the domestic sugar industry is clearly the most highly protected industry throughout the
period under study. US consumers paid a large part of the income transfer to the sector in the
1960s and early 1970s when nearly all domestic production was exported. However, the burden
shifted to Filipino consumers and food processors at the end of the Laurel-Langley Agreement in
1974. At that time, the US sugar quota dropped sharply. Exports which continue to be confined
to the protected United States market now account for only one-tenth of domestic production.
Yet, because of import restrictions, the average nominal rate of assistance to the sugar industry
has increased over time, and has averaged around 90 percent during the past decade.14
Poultry and other livestock
Poultry producers received a high level of protection. A slightly increasing trend in the NRA is
discernable over time: from about 40 percent prior to 1985, when the high tariff protection (70
percent) was redundant to a significant extent, to about 50 percent in later years.
The pigmeat industry had significant tariff protection, although generally it has been
lower than poultry. After 1995, the government adopted the same level of high in- and out-of-
quota tariffs for both poultry and pigmeat under the WTO Agreement. However, the low tariff
was largely redundant up to the 1980s, as were the relatively high tariffs after 1995.
Tariff protection for beef was historically less than that for pigmeat: the NRA averaged
around 10 percent until the late 1980s. Beef was not included among the sensitive products
whose tariffs were raised in the aftermath of the WTO Agreement. Nonetheless, an upward trend
in its estimated NRA can also be observed during the 1990s. It appears that the government’s
attempt to promote cattle fattening activities, by allowing duty-free imports of young cattle
14 Even the large margins conferred on importers of sugar as a result of this high level of nominal protection have been mostly received by the sugar cane growers, who receive most of the rights to import dispensed by the Sugar Regulatory Authority.

22
imported from Australia, was accompanied by more restrictive non-tariff trade barriers on beef to
increase incentives. The expansion of the cattle fattening business was short-lived, however, as
tariffs on beef were reduced in the late 1990s and import restrictions became untenable.15 The
lower protection for beef compared to the poultry industry may be explained by the prevalence
of large-scale integrators producing poultry through contract farming, in contrast to the beef
industry which is dominated by backyard producers. However, pigmeat is also dominated by
backyard producers, and it had relatively high protection rates.
Agricultural inputs
To infer the effect of price intervention policies on value added, trends of the NRA on major
intermediate inputs commonly used in agricultural production are reported in Appendix Table
A1. Until the mid-1980s, the government’s industrial promotion policies significantly raised
domestic prices of manufactured inputs to agriculture. The consumer tax equivalent of import
protection on agricultural inputs such as fertilizers, agricultural chemicals, farm machinery and
even water pumps was generally higher than the NRAs for agricultural outputs, except for sugar
in some years. With the exception of subsidies for gravity irrigation in rice, there was no
significant offsetting input assistance to agriculture. Indeed, despite price controls, tax free
importations, and direct subsidies to fertilizer companies in this early period, the consumer tax
equivalent on farm inputs was negative only during 1970-1974 (due to the four-fold jump in
world prices of oil). These are not incorporated in the aggregate NRA for crop agriculture but, if
they had been in the manner described in Anderson et al. (2008), they would have lowered the
estimated NRA for crops by a small number of percentage points, and more so in the earlier
decades than in recent times. The estimated NRAs for livestock also would be lower if the
impact on feedmix prices of import restrictions on maize were taken into account.
NRA for non-agriculture and RRA for agriculture
15 During this period, imports of live cattle averaged more than 200,000 heads. This number has declined significantly as the cattle fattening business is now limited to the Del Monte and Monterey (San Miguel) companies which use by-products of their other business, i. e., pineapple canning and beer manufacturing, respectively, as their main feed ingredient. Earlier, live cattle were mostly imported for almost immediate slaughtering, and thus the government’s policy was promoting the slaughtering business, more than cattle production.

23
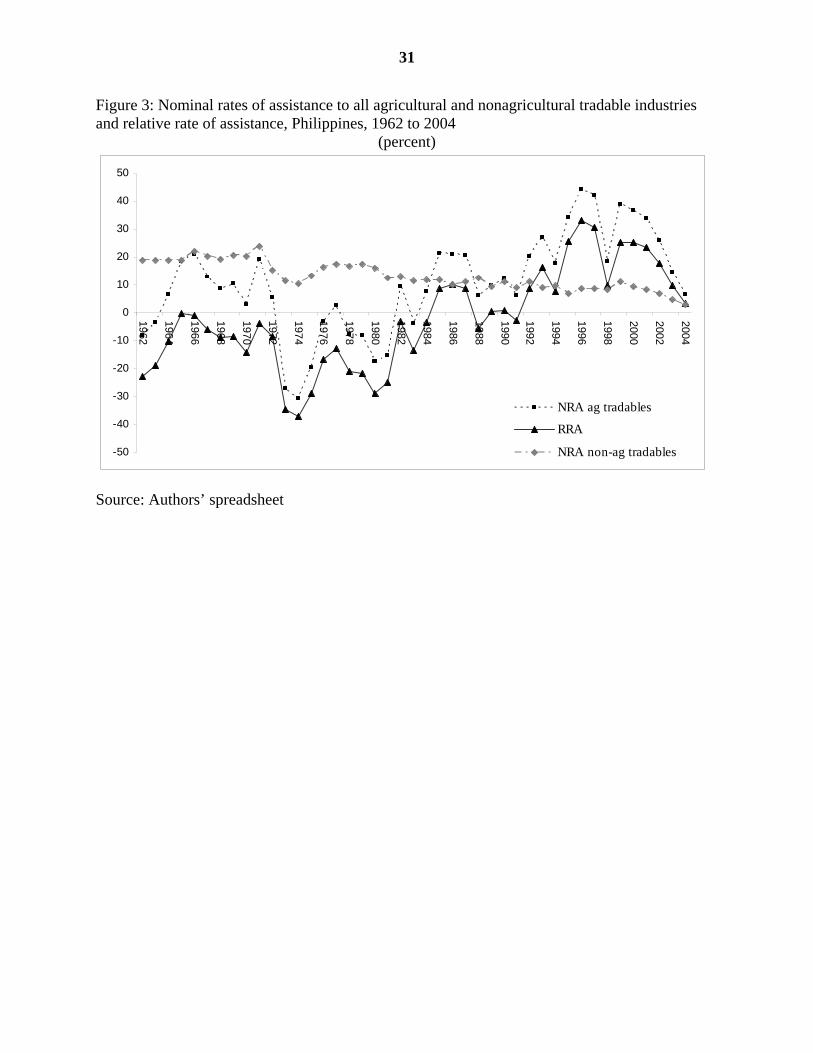
Agricultural incentives are also affected indirectly by rates of assistance to non-agriculture.
Mobile resources move according to the relative incentives across sectors or industries. Figure 3
and Table 7 show the trends in the average nominal rates of assistance of the agricultural and
non-agricultural sectors, as well as the relative rate of assistance to agriculture. The contrast in
the trends between the two sectors is quite striking. Whereas the average NRA for agriculture
was lower than non-agriculture prior to the mid-1980s, it rose to an average of more than 30
percent in the most recent decade or so. On the other hand, with the series of unilateral trade
liberalization measures, the NRA for non-agriculture steadily declined from nearly 20 percent in
the 1960s and 1970s to only 7 percent by the early 2000s.
As a consequence, assistance to agriculture is now much higher than to non-agriculture,
so the relative rate of assistance has gone from an average of around -15 percent prior to the mid-
1980s to an average of more than +20 percent in recent years. This trend indicates that the
efficiency of resource use as between farming and production of non-agricultural tradables first
increased as the RRA became less negative but then decreased as the RRA became increasingly
more positive. That is, there were too few resources in the country’s agricultural sector up to the
mid-1980s, but since then there have been too many on average (and especially in import-
competing agriculture).
Explaining patterns of distortion to agricultural incentives
In general, countries switched from taxing to subsidizing their agricultural sector in the course of
economic development, primarily due to political economy factors (Anderson, Hayami and
others 1986; Lindert 1991; Anderson 1995). In a country which would be self-sufficient in food
in a world of free agricultural trade, that shift is expected to occur when its per capita income
reaches 2.6 times the global average (Tyers and Anderson 1992). For a country that would be
only 65 percent self-sufficient in food under free trade, the shift would occur when its per capita
income reached the global average ($4300 in 1992). In the Philippine case, the shift from taxing
to assisting agriculture directly through price interventions occurred at a lower level of economic

24
development than predicted by earlier studies, as per capita income in the Philippines was only
about $1200 even by the late 1990s.
Why did the switch towards higher agricultural protection occur early in the Philippines?
The explanation lies in a set of unique historical events, political economy factors, the political
system, and a strong nationalist sentiment for food self-sufficiency, especially in the case of rice.
As discussed earlier, the highly skewed land ownership distribution and dualistic agrarian
structure arising from the country’s colonial land policies and agro-ecological conditions meant
there were large landowners and plantation operators who were able to effectively lobby for their
vested interests. These farmers were historically the major political leaders at the helm of
Congress and the national and local executive branches of the government. The landed oligarchs
were also the business elite, who successfully pushed for an industrial protection policy that
biased incentives against the agricultural sector (Hara 1994). But as the international pressure for
trade liberalization mounted during the past two decades, it was easier to resist the opening of
domestic markets for food staples by playing up the national sentiment for food self-sufficiency.
Political pressure to raise agricultural protection was strengthened by the expanded lobby groups
consisting of farmer organizations, large land owners, and agri-business firms such as livestock
and poultry, millers, seed companies, and the input suppliers.
There has been little resistance to high prices of white maize as food because it is
primarily a subsistence crop. The livestock (including poultry) producers and feed millers who
use mostly yellow maize have chosen to lobby more for higher livestock output protection to
offset the high maize prices than for a more rational maize-livestock policy. Objections to the
highly restrictive maize import policy have been addressed by providing import allocations at
lower tariffs to the large, more organized, and vocal sector of the feed, poultry, and pigmeat
industries. In addition, large feed mills and livestock producers also own flour mills, and are thus
able to substitute low-grade wheat subject to only a 10 percent tariff for the artificially high-
priced maize. That policy structure provides the large-scale feed and livestock producers a cost
advantage over the small ones who have to rely on the domestic market for their maize supplies.
Aside from the large size of farms and mills, the sugar sector has historically had strong
political power because of its close relationship and common interest with the government in
lobbying for protecting the country’s preferential market access share of the US sugar market. In
contrast, the share of sugar in direct household expenditure is very small and therefore

25
consumers have generally tolerated or been unaware of high sugar prices. Resistance from the
food processing sector against high sugar prices was mitigated by granting larger, more vocal
food processors some tariff-free sugar import privileges.
Concluding remarks
Price intervention policies became more favorable from the mid-1980s in the Philippines
agricultural sector. Protection of major import-competing commodities was increased and a
series of unilateral trade liberalizations lowered implicit tariffs on inputs and the protection of the
non-agricultural sector. Thus, improvements in agricultural incentives occurred at the cost of
inefficiencies in resource allocation arising from widening distortions in prices within
agriculture, and between agriculture and non-agriculture.
Artificially raising the profitability of major import-competing commodities directly
increased the cost of land for other crop production. As well, it indirectly reduced the
competitive advantage of exportable agricultural products in world markets. The high maize
price policy also lowered the international competitiveness of the pigmeat industry, in which the
Philippines may well have a comparative advantage. The very high protection for sugar hurts not
only consumers but also the food processing industry, which accounts for over 20 percent of
value added and employment in manufacturing. Excessively high protection for major staple
food commodities reduces the welfare of rural landless and urban poor households and puts
pressure on wages, making labor-intensive manufacturing industries less competitive relative to
the low wage, cheap food economies such as Vietnam and China.
The economic waste caused by price intervention policies is magnified by the continued
use of quantitative trade restrictions instead of tariffs. In particular, the government’s monopoly
on rice imports and domestic marketing operations through the NFA not only have been
extremely costly but also have failed to achieve the basic conflicting objectives of lowering food
prices to consumers, raising producer prices, and stabilizing both sets of prices. Use of
quantitative restrictions promote rent-seeking, reduces government revenue, incurs significant
bureaucratic costs, and worsens price uncertainties.

26
Unfortunately, recent policy changes in response to the WTO agreement seem to have
exacerbated, rather than mitigated, such problems: nominal protection rates for major import-
competing commodities were not only raised, but the scope of NFA operations was inadvertently
expanded. Rice market interventions and the use of quantitative restrictions have persisted
because the economic costs, and even some of the financial costs, are not readily apparent to the
general public. Meanwhile, the bureaucracy is corrupted through commissions, bribes, and other
rents typically involved in government procurement and import licensing, making it even more
difficult to effect trade liberalization.
There are no indications that the Philippine government will move towards greater trade liberalization in agriculture in the near future. In the current negotiations under the Doha Round, efforts are being made to retain the relatively high level of tariff protection on the major import- competing agricultural commodities. Furthermore, the government is not taking any step to dis- mantle the institutions and other policy instruments that regulate the imports of rice, sugar, and other commodities. With the sharp rise in world grain prices in recent years, the government will all the more be politically compelled to continue with the food self-sufficiency strategy, rather than reliance on open international markets, to achieve food security.
References
Aldaba, R.M. (2005a), “Policy Reversals, Lobby Groups and Economic Distortions”, Discussion
Paper Series No. 2005-04, Philippine Institute of Development Studies, Makati City.
Aldaba, R.M. (2005b), “The Impact of Market Reforms on Competition, Structure and
Performance of the Philippine Economy”, Discussion Paper Series No. 2005-24,
Philippine Institute of Development Studies, Makati City.
Anderson, K. (1995), “Lobbying Incentives and the Pattern of Protection in Rich and Poor
Countries”, Economic Development and Cultural Change 43(2): 401-23, January.
Anderson, K., Y. Hayami and others (1986), The Political Economy of Agricultural Protection:
East Asia in International Perspective, London: Allen and Unwin.

27
Anderson, K., M. Kurzweil, W. Martin, D. Sandri and E. Valenzuela (2008), “Methodology for
Measuring Distortions to Agricultural Incentives”, Agricultural Distortions Working
Paper 02, World Bank, Washington DC, revised January.
Balisacan A.M., N. Fuwa and M.H. Debuque (2004), “The Political Economy Of Philippine
Rural Development since the 1960s”, in T. Akiyama and D.F. Larson, Rural
Development and Agricultural Growth in Indonesia, the Philippines, and Thailand,
Washington DC: World Bank.
Bautista, R.M. and G. Tecson (2003), “International Dimensions”, in A.M. Balisacan and H. Hill
(eds.), The Philippine Economy: Development, Policies, and Challenges, New York:
Oxford University Press.
Borrell, B., D. Quirke, B. de la Pena and L. Noveno (1994), Philippine Sugar: An Industry
Finding Its Feet, Canberra: Center for International Economics.
Clarete, R.L. (1991), E.O. 470: the Economic Effects of the 1991 Tariff Policy Reforms, Report
prepared for the USAID, Washington, DC: USAID.
Clarete, R.L. and J.A. Roumasset (1990), “The Relative Welfare Cost of Industrial and
Agricultural Policy Distortions: a Philippine Illustration”, Oxford Economic Papers
42(2).
Cororaton, C.B. (2000), “Philippine Tariff Reform: A CGE Analysis”, Discussion Paper Series
No. 2000-35, Makati City: Philippine Institute of Development Studies.
David, C.C. (1983), “Economic Policies and Philippine Agriculture”, Working Paper No. 83-03,
Makati City: Philippines Institute for Development Studies.
David, C.C. (1994), “GATT-UR and Philippine Agriculture: Facts and Fallacies”, Journal of Philippine Development, 21(1&2). David, C.C. (2003), “Agriculture”, in A. M. Balisacan and H. Hill (Eds.), The Philippine
Economy: Development, Policies, and Challenges, New York: Oxford University Press.
Habito, C.F. and C.B. Cororaton (2000), “WTO and the Philippine Economy: An Empirical and
Analytical Assessment of Post-WTO Reforms in the Philippines”, Study Report for the
USAID/Philippines, AGILE Program, Manila.
Hara, Y. (1994), Tonan Ajia Shokoku no Keizai Hatten (The Economic Development of Southeast
Asian Countries), Tokyo: Institute of Oriental Culture, University of Tokyo.

28
Intal, P.S. and J.H. Power (1991), “The Philippines”, in A.O. Krueger, M. Schiff and A Valdes
(Eds.), The Political Economy of Agricultural Pricing Policy, Vol 2: Asia, Baltimore and
London: Johns Hopkins University Press.
Lindert, P. (1991), “Historical Patterns of Agricultural Protection”, in Agriculture and the State,
edited by P. Timmer, Ithaca: Cornell University Press.
Manasan, R.G. and V.S Pineda (1999), “Assessment of Philippine Tariff Reform: A 1998
Update”, Unpublished paper funded by the USAID.
Medalla, E.M., G.R. Tecson, R.M. Bautista, J.H. Power and Associates (1995), Catching Up
With Asia's Tigers, Makati City: Philippine Institute for Development Studies.
Pasadilla, G.O. (2006), “Preferential Trading Agreements and Agricultural Liberalization in East
and Southeast Asia”, Working Paper Series No. 11, Asia-Pacific Research and Training
Network on Trade.
Power, J.H. (1971), “The Structure of Protection in the Philippines”, in Balassa and Associates,
The Structure of Protection in Developing Countries, Johns Hopkins University,
Baltimore.
Pimentel, A. (2006), “A Study on the Impact of Philippine Tariff Reform Program: An Input-
Output Model”, mimeo, Los Banos: Southeast Asia Research Center for
Agriculture.
Tan, E.S. (1994), “Trade Policy Reforms in the 1990s: Effects of EO470 and the Import
Liberalization Program”, Research Paper Series No.94-11, Philippine Institute of
Development Studies, Makati City.
Tan, N.A. (1979), “The Structure of Protection and Resource Flows in the Philippines”, in R.M.
Bautista, J.H. Power and Associates, Industrial Promotion Policies in the Philippines,
Makati City: Philippine Institute Development Studies.
Tyers, R. and K. Anderson (1992), Disarray in World Food Markets: A Quantitative
Assessment, Cambridge and New York: Cambridge University Press.

29
Figure 1: Value shares of primary production of covered and non-covered products, Philippines, 1966 to 2004
(percent, at distorted prices)
0102030405060708090
100
1966
1969
1972
1975
1978
1981
1984
1987
1990
1993
1996
1999
2002
ResidualBananaBeefChickenCoconutMaizePigmeatSugarRice
Source: Authors’ calculations, based on producer price and production data from FAOSTAT

30
Figure 2: Nominal rates of assistance to exportable, import-competing and all covered agricultural products, Philippines, 1962 to 2004
(percent)
-40
-30
-20
-10
0
10
20
30
40
50
60
1962
1964
1966
1968
1970
1972
1974
1976
1978
1980
1982
1984
1986
1988
1990
1992
1994
1996
1998
2000
2002
2004
Import-competing
Total
Exportables
Source: Authors’ spreadsheet
31
Figure 3: Nominal rates of assistance to all agricultural and nonagricultural tradable industries and relative rate of assistance, Philippines, 1962 to 2004
(percent)
-50
-40
-30
-20
-10
0
10
20
30
40
50
1962
1964
1966
1968
1970
1972
1974
1976
1978
1980
1982
1984
1986
1988
1990
1992
1994
1996
1998
2000
2002
2004
NRA ag tradables
RRA
NRA non-ag tradables
Source: Authors’ spreadsheet

32
Table 1: Average growth rates of gross domestic product, gross value added in agriculture, and agriculture exports, the Philippines and other selected Asian countries, 1960 to 2004
(percent)
1960 - 1980 1980 - 2004 GDP Ag GVA Ag Exports GDP Ag GVA Ag Exports Philippines 5.3 4.1 12.0 2.7 2.0 1.6 Indonesia 7.9* 4.6* 11.6 5.4 2.9 7.2 Malaysia 7.2 4.8* 12.7 6.6 2.2 5.7 Thailand 7.5 4.8 13.5 6.0 2.7 6.7 India 3.6 2.2 9.0 5.4 3.4 5.8 Pakistan 5.8 3.6 14.2 4.7 3.7 7.2 Bangladesh 2.6 1.6 3.1 4.3 2.7 1.3 China 5.5 4.3 15.0 9.5 4.2 6.6 Vietnam - - - 6.6 3.7** 18.2 a Growth rates estimated by regression. * Refers to 1970-1980. ** Refers to 1985-2004. Sources of basic data : World Development Indicator (WDI) World Bank; FAOSTAT

33
Table 2: Changing structure and trade openness of the Philippine economy, 1960 to 2004
(percent)
1960 1970 1980 1990 2000 2004
Agriculture's share in: GDP 30 28 24 22 20 14 Employment 61 52 48 45 37 37 Imports 19 14 8 10 9 8a Exports 64 44 35 15 5 6 Trade openness indicators: Ag imports/GVA 6 10 9 13 22 26a [9] [16] [23] [27] [45] [51] Ag exports/GVA 33 44 26 14 15 19 [9] [15] [17] [19] [51] [46] Ag imports & exports/GVA 38 54 35 28 37 45 [18] [36] [43] [48] [96] [97] a When agricultural inputs are included, the ratio of agricultural imports to gross value added in agriculture is significantly higher, reaching 39 percent in 2004. The ratio of agricultural inputs to total imports based on that broader definition is 11 percent in 2004. Note: Figures in square brackets refer to trade openness for the whole economy. Sources of basic data: National Statistical Coordination Board; Bureau of Labor and Employment Statistics; National Statistics Office

34
Table 3: Growth rates of gross value added of major agricultural commodities, Philippines, 1960 to 2004
(at constant 1985 prices, percent)
1960-70 1970-80 1980-90 1990 - 2004
Crops 4.3 6.2 1.1 1.9 Rice - 4.3 2.9 3.6 Maize - 5.2 3.1 1.9 Coconuta - 7.8 -3.9 1.1 Sugar - 5.2 -1.8 4.1 Banana - 13.9 -1.8 4.0 Other crops - 8.1 2.2 0.8 Livestock and poultry 3.1 3.1 5.7 4.4 Livestock - 0.8 4.8 3.5 Poultry - 8.5 7.5 5.7
a Throughout the word coconut is used to also cover the main farm product known as copra. Source: Authors’ compilation using basic data from the National Statistical Coordination Board

35
Table 4: Revealed comparative advantagea of major agricultural commodities, Philippines, 1960 to 2004
1960 1970 1980 1990 2000 2004
All agricultureb 3.0 2.6 2.9 1.6 0.6 0.8 Coconut 116 145 224 212 71 97 Sugarc 18 21 12 4 1 1 Banana - - 3 23 11 14 Pineapple Canned - - 82 70 27 29 Fresh - - 49 55 10 8
a Estimated as the ratio of the share of a commodity group in a country's exports to that commodity group's share in world exports. Except for 1960 and 2004, all are 3-year averages centered at year shown. b Includes fisheries. c Note that sugar has been historically exported to the US typically at a preferential price (i.e., higher than world prices). Hence a value greater than unity in this case does not reveal comparative advantage. However, the sharp declining trend may still be interpreted as a rapid deterioration in comparative advantage. Source of basic data: FAOSTAT

Table 5: Nominal rates of assistance to covered products, Philippines, 1962 to 2004
(percent)
1962-64 1965-69 1970-74 1975-79 1980-84 1985-89 1990-94 1995-99 2000-04
Exportables a -9.0 -7.6 -14.3 -14.6 -22.6 -16.5 -11.4 -5.4 -8.7
Coconut -24.4 -20.2 -25.3 -16.7 -27.1 -20.6 -15.3 -7.8 -14.1 Banana 0.0 0.0 -4.0 -4.0 -4.0 -0.8 0.0 0.0 0.0
Import-competing products a -1.1 17.4 -5.6 -5.8 2.2 30.2 25.1 48.1 31.4
Rice -3.4 -1.4 -9.7 -17.9 -16.3 14.5 20.9 52.7 50.7 Maize 0.5 38.4 14.0 24.3 20.1 59.8 62.6 78.5 54.5 Sugar -8.2 120.7 -11.7 -1.7 59.5 123.2 49.3 97.2 79.3 Beef 15.0 15.0 12.0 10.0 5.0 17.0 28.0 28.0 10.0 Pigs -30.0 13.6 3.2 -5.5 35.8 51.0 25.1 20.6 -8.3 Chicken 8.9 67.1 28.9 28.1 38.4 42.9 56.5 42.2 52.1
Total of covered products a -1.9 15.3 -6.5 -8.1 -5.1 16.1 17.5 37.9 24.9 Dispersion of covered products b 17.1 29.6 25.2 22.3 28.6 29.9 27.5 27.9 30.4 % coverage (at undistorted prices) 78 79 79 74 73 73 77 77 80
a Weighted averages, with weights based on the unassisted value of production. b Dispersion is a simple 5-year average of the annual standard deviation around the weighted mean of NRAs of covered products. Source: Authors’ spreadsheet

2
Table 6: Nominal rates of assistance to agricultural relative to non-agricultural industries, Philippines, 1962 to 2004
(percent)
1962-64 1965-69 1970-74 1975-79 1980-84 1985-89 1990-94 1995-99 2000-04
Covered products a -1.9 15.3 -6.5 -8.1 -5.1 16.1 17.5 37.9 24.9 Non-covered products -0.4 5.8 -2.3 -2.4 0.3 10.0 8.4 16.0 12.3 All agricultural products a -1.6 13.3 -5.6 -6.6 -3.6 14.4 15.4 33.0 26.0 Non-product specific (NPS) assistance 0.0 0.0 0.0 0.0 0.0 0.0 0.0 0.0 0.0 Total agricultural NRA (incl. NPS) b -1.6 13.3 -5.6 -6.6 -3.6 14.4 15.4 33.0 26.0 Trade bias index c -0.03 -0.18 0.04 -0.03 -0.15 -0.31 -0.26 -0.34 -0.31 Assistance to just tradables: All agricultural tradables -1.7 14.3 -6.0 -7.2 -4.0 15.8 16.7 35.7 27.9 All non-agricultural tradables 19.0 20.3 16.3 16.3 12.9 11.0 9.9 8.6 7.3 Relative rate of assistance, RRA d -17.4 -5.0 -19.8 -20.3 -14.9 4.3 6.1 24.9 19.1
a NRAs including product-specific input subsidies. b NRAs including product-specific input subsidies and non-product-specific (NPS) assistance. Total of assistance to primary factors and intermediate inputs divided to total value of primary agriculture production at undistorted prices (%). c Trade bias index is TBI = (1+NRAagx/100)/(1+NRAagm/100) – 1, where NRAagm and NRAagx are the average percentage NRAs for the import-competing and exportable parts of the agricultural sector. d The RRA is defined as 100*[(100+NRAagt)/(100+NRAnonagt)-1], where NRAagt and NRAnonagt are the percentage NRAs for the tradables parts of the agricultural and non-agricultural sectors, respectively. Source: Authors’ spreadsheet

Table 7: Coefficient of variation of real international and Philippine wholesale prices of major agricultural commodities, 1960 to 2004 .
1960 - 2004 1960 - 1980 1980 - 2004
Rice World 47 32 34 Domestic 19 12 11 Maize World 38 17 27 Domestic 23 17 14 Coconut World 49 27 40 Domestic 45 31 36 Coconut oil World 50 27 43 Domestic 43 32 33 Sugar World 80 71 60 Domestic 19 14 18 Beef World 33 21 23 Domestic 28 35 17 Pigmeat EUV Sing 46 44 23 Domestic 13 12 14 Poultry EUV Sing 37 33 14 Domestic 29 17 15
Source: Estimates based on data in authors’ spreadsheet

Appendix Figure A1: Trends in (a) nominal rates of assistance and import tariffs, (b) domestic wholesale price, border price and exchange rate, and (c) indices of real domestic wholesale and world price, Rice, 1960-2004
-60
-40-20
0
20
4060
80
100120
140
1960 1965 1970 1975 1980 1985 1990 1995 2000 2005NRA5 year moving aveTariff
0
100
200
300
400
500
600
1960 1965 1970 1975 1980 1985 1990 1995 2000 20050
10
20
30
40
50
60
Border priceDomestic wholesale priceExchange rate
0
50
100
150
200
250
1960 1965 1970 1975 1980 1985 1990 1995 2000 2005
Real world priceReal domestic wholesale price
(1980=100)
(%) (a)
(b)
(c)
($/mt) ( P/$ )
44

2
Apendix Figure A2: Trends in (a) nominal rates of assistance and import tariffs, (b) domestic wholesale price, border price and exchange rate, and (c) indices of real domestic wholesale and world price, Maize, 1960-2004
-60
-40
-20
0
20
40
60
80
100
120
140
1960 1965 1970 1975 1980 1985 1990 1995 2000 2005NRA5 year moving aveTariff
0
50
100
150
200
250
300
350
1960 1965 1970 1975 1980 1985 1990 1995 2000 20050
10
20
30
40
50
60
Border priceDomestic wholesale priceExchange rate
0
20
40
60
80
100
120
140
160
180
200
1960 1965 1970 1975 1980 1985 1990 1995 2000 2005
Real world priceReal domestic wholesale price
(a)
(b)
(c)
(%)
($/mt) ( P/$ )
(1980=100)
44

3
Appendix Figure A3: Trends in (a) nominal rates of assistance and import tariffs, (b) domestic wholesale price, border price and exchange rate, and (c) indices of real domestic wholesale and world price, Sugar, 1960-2004
-100
-50
0
50
100
150
200
250
300
1960 1965 1970 1975 1980 1985 1990 1995 2000 2005NRA5year moving aveTariff
0
100
200
300
400
500
600
700
800
900
1960 1965 1970 1975 1980 1985 1990 1995 2000 20050
10
20
30
40
50
60
Border price Domestic wholesale price Exchange rate
020406080
100120140160180200
1960 1965 1970 1975 1980 1985 1990 1995 2000 2005
Real world priceReal domestic wholesale price
(%)
($/mt)
(a)
(b) ( P/$ )
(c)(1980=100)

4
Appendix Figure A4: Trends in (a) nominal rates of assistance and import tariffs, (b) domestic wholesale price, border price and exchange rate, and (c) indices of real domestic wholesale and world price, Coconut, 1960-2004
-60
-40
-20
0
20
40
60
80
100
1960 1965 1970 1975 1980 1985 1990 1995 2000 2005
NRA5 year moving aveTariff
0
100
200
300
400
500
600
700
800
1960 1965 1970 1975 1980 1985 1990 1995 2000 20050
10
20
30
40
50
60
Border priceDomestic wholesale priceExchange rate
0
50
100
150
200
250
300
1960 1965 1970 1975 1980 1985 1990 1995 2000 2005
Real world priceReal domestic wholesale price
(%) (a)
($/mt) (b) ( P/$ )
(1980=100) (c)

5
Appendix Figure A5: Trends in (a) nominal rates of assistance and import tariffs, (b) domestic wholesale price, border price and exchange rate, and (c) indices of real domestic wholesale and world price, Coconut Oil, 1960-2004
-60
-40
-20
0
20
40
60
80
100
1960 1965 1970 1975 1980 1985 1990 1995 2000 2005
NRA5 year moving aveTariff
0
200
400
600
800
1000
1200
1400
1960 1965 1970 1975 1980 1985 1990 1995 2000 20050
10
20
30
40
50
60
Border priceDomestic wholesale priceExchange rate
0
50
100
150
200
250
300
350
1960 1965 1970 1975 1980 1985 1990 1995 2000 2005
Real world priceReal domestic wholesale price
(%) (a)
( P/$ )(b)($/mt)
(c)(1980=100)

6
Appendix Figure A6: Trends in (a) nominal rates of assistance and import tariffs, (b) domestic wholesale price, border price and exchange rate, and (c) indices of real domestic wholesale and world price, Pigmeat, 1960-2004
-80-60-40-20
020406080
100120140
1960 1965 1970 1975 1980 1985 1990 1995 2000 2005
NPR5-year moving aveTariff
0
500
1000
1500
2000
2500
3000
3500
1960 1965 1970 1975 1980 1985 1990 1995 2000 20050
10
20
30
40
50
60
Border priceWholesale priceExchange rate
0
50
100
150
200
250
1960 1965 1970 1975 1980 1985 1990 1995 2000 2005
Real wholesale priceReal world price
(%) (a)
($/mt) (b) ( P/$ )
(1980=100)
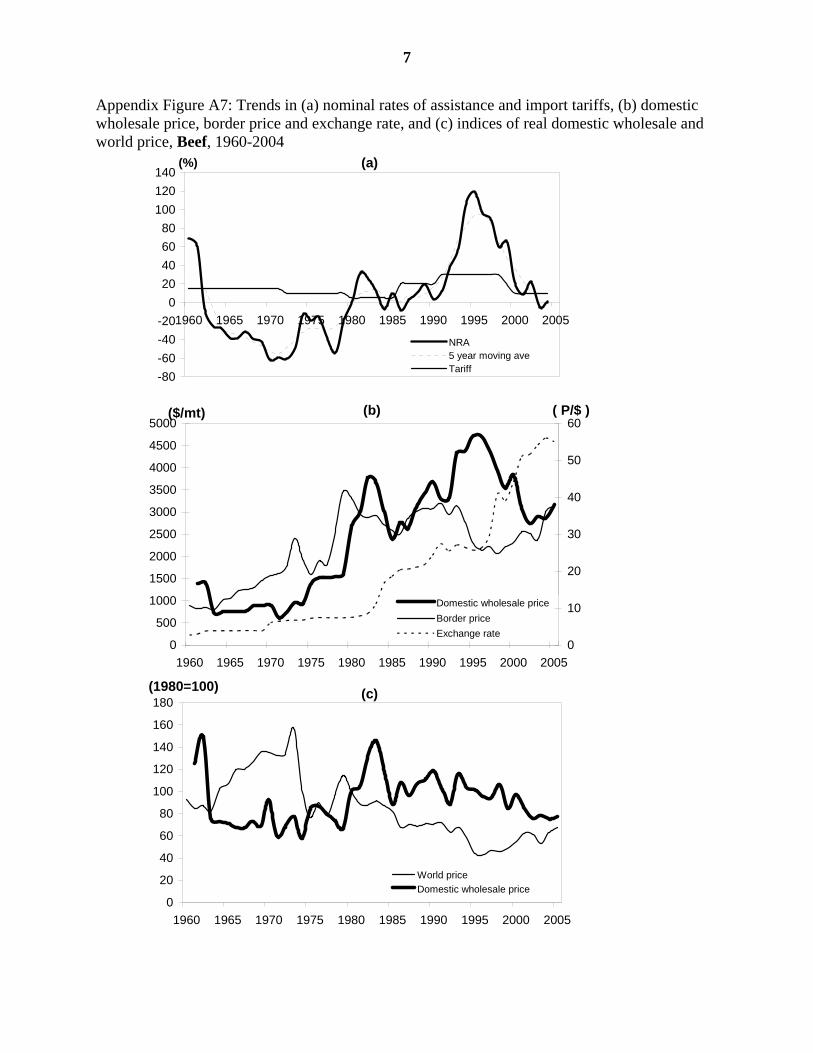
7
Appendix Figure A7: Trends in (a) nominal rates of assistance and import tariffs, (b) domestic wholesale price, border price and exchange rate, and (c) indices of real domestic wholesale and world price, Beef, 1960-2004
-80-60-40-20
020406080
100120140
1960 1965 1970 1975 1980 1985 1990 1995 2000 2005
NRA5 year moving aveTariff
0
500
1000
1500
2000
2500
3000
3500
4000
4500
5000
1960 1965 1970 1975 1980 1985 1990 1995 2000 20050
10
20
30
40
50
60
Domestic wholesale priceBorder priceExchange rate
0
20
40
60
80
100
120
140
160
180
1960 1965 1970 1975 1980 1985 1990 1995 2000 2005
World priceDomestic wholesale price
(%) (a)
( P/$ )($/mt) (b)
(1980=100) (c)

8
Appendix Figure A8: Trends in (a) nominal rates of assistance and import tariffs, (b) domestic wholesale price, border price and exchange rate, and (c) indices of real domestic wholesale and world price, Poultry, 1960-2004
-80-60-40-20
020406080
100120140
1960 1965 1970 1975 1980 1985 1990 1995 2000 2005NRA5-year moving aveTariff
0
500
1000
1500
2000
2500
3000
1960 1965 1970 1975 1980 1985 1990 1995 2000 20050
10
20
30
40
50
60
Border price
wholesale domestic price
Exchange rate
0
50
100
150
200
250
1960 1965 1970 1975 1980 1985 1990 1995 2000 2005
Real world priceReal domestic wholesale
(%) (a)
($/mt) (b) ( P/$ )
(1980=100) (c)
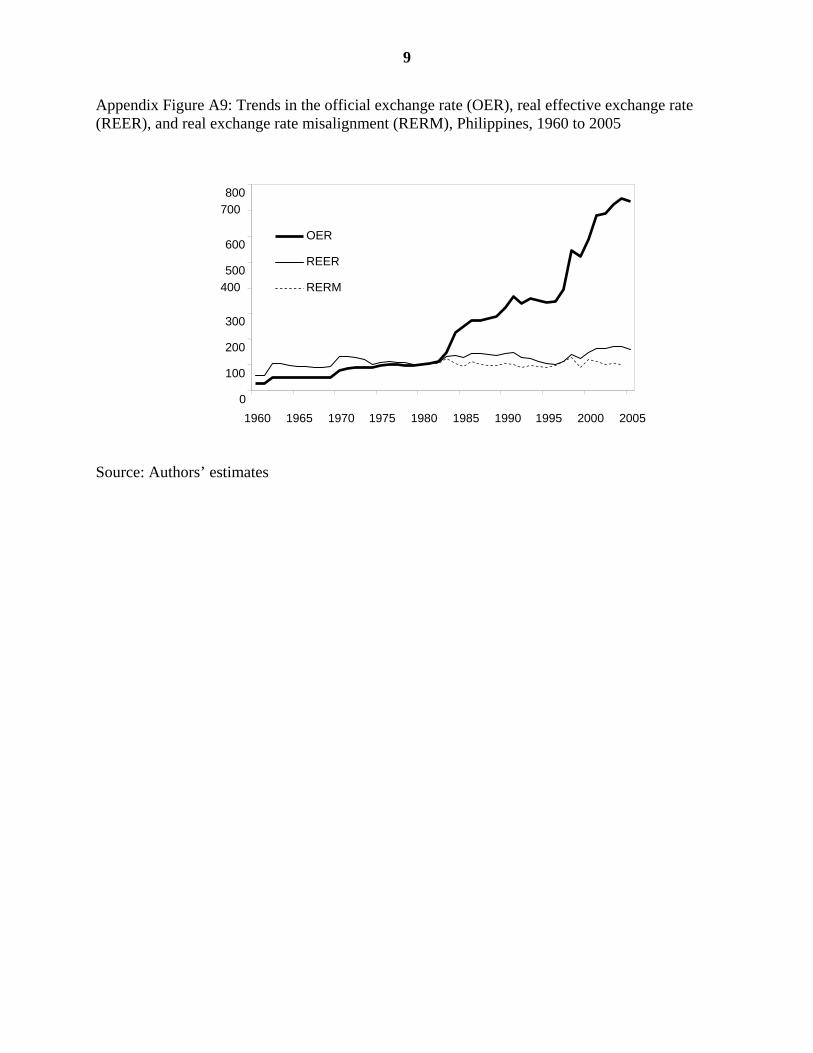
9
Appendix Figure A9: Trends in the official exchange rate (OER), real effective exchange rate (REER), and real exchange rate misalignment (RERM), Philippines, 1960 to 2005 Source: Authors’ estimates
400
100
700
0
200 300
500 600
800
1960 1965 1970 1975 1980 1985 1990 1995 2000 2005
OER
REER
RERM

10
Appendix Table A1: Distribution of gross value added in agriculture by major commodities at current and constant prices, Philippines, 1960 to 2004
(percent)
1960 1970 1980 1990 2000 2004
Crops 69 77 82 74 73 70 (77) (79) (83) (75) (69) (68) Rice - 17 16 21 21 20 - (23) (20) (22) (23) (24) Maize - 6 7 9 6 7 - (9) (8) (10) (7) (8) Coconut - 13 11 7 5 5 - (13) (12) (6) (4) (5) Sugar - 8 6 4 3 3 - (7) (5) (3) (3) (4) Banana - 3 3 3 4 5 - (2) (4) (2) (3) (3) Other crops - 30 38 30 34 30 - (25) (33) (32) (28) (25) Livestock 31 23 18 26 27 30 (23) (21) (17) (25) (31) (32) Poultry - 4 7 9 10 11 - (5) (7) (11) (14) (15) Other livestock - 18 10 16 16 17 - (17) (10) (15) (17) (17) Figures in parentheses are percentage shares at constant prices. Source of basic data: National Statistical Coordination Board

11
Appendix Table A2: Consumer tax equivalent of import protection on agricultural inputs, Philippines, 1960 to 2004
(percent)
1960-64 1965-69 1970-74 1975-79 1980-84 1985-89 1990-94 1995-99 2000-04
Fertilizersa Urea 49 55 -13 28 21 11 5 3 3 Ammophos 17 32 -9 54 19 15 12 3 3 Pesticidesb 24 24 29 35 35 20 16 7 3 Tractorsb 2 wheel 24 20 21 46 46 30 28 10 3 4 wheel 24 20 21 24 24 12 10 10 3 Threshersb 24 24 24 24 24 30 22 10 3 Water pumpsb 46 46 46 46 46 30 24 10 3
a Based on price comparison, i.e., the percentage difference between the ex-warehouse price and the CIF import unit value.
b Based on book tariff rates. Implicit tariff from 1960-84 includes the import tariff and advance sales tax (10 percent and 25 percent) mark-up respectively. The advance sales tax was abolished in 1986 and hence the implicit tariffs from 1985 onward includes only the tariff rate.
Sources: Tariff Code of the Philippines (various issues) and Fertilizer and Pesticide Authority

12
Appendix Table A3: Trends in nominal rate of assistance to non-agricultural industries, Philippines, 1967 to 2004
1965-69
1970-74
1975-79
1980-84
1985-89
1990-94
1995-99
2000-04
All non-agriculture 20 16 16 13 8 9 8 7
Other primary industries 0 -3 1 2 4 7 0 0
Food manufacturing 20 8 0 -3 3 7 16 21 Lightly processed 16 -1 -9 -7 1 7 19 28 Heavily processed 25 26 22 11 7 7 9 8 Other manufacturing 29 31 33 26 13 12 6 3
Source: Authors’ estimates

13
Appendix Table A4: Estimated effective protection rates for major economic sectors, Philippines, 1974 to 2004
(percent)
Agriculture Manufacturing All Sectors
Tan, N. (1979) 1974 9 44 36 Tan, E. (1994) 1983 10 79 53 1985 9 74 49 1986 5 61 40 1988 5 56 36 Manasan and Pineda (1999) 1990-94 26 32 29 1995-99 26 24 21 2000 24 19 18 Aldaba (2005) 1998 19 7 9 1999 18 6 8 2000 16 6 7 2001 17 6 7 2002 14 5 6 2003 14 5 6 2004 15 5 6 Sources: Tan (1979), Tan (1994), Medalla et al. (1995), Manasan and Pineda (1999), Aldaba (2005)

14
Appendix Table A5: Nominal rates of assistance to covered agricultural products, Philippines, 1962 to 2004
(percent) Rice Maize Beef Pigs Chicken Coconut Banana Sugar All covered
1962 -18 -14 15 -30 -13 -24 0 38 -9 1963 -6 8 15 -27 6 -25 0 -39 -4 1964 14 8 15 -34 34 -25 0 -24 7 1965 10 42 15 -23 49 -25 0 103 20 1966 12 29 15 -4 48 -20 0 157 23 1967 -5 39 15 10 66 -23 0 134 14 1968 -14 44 15 44 80 -18 0 142 9 1969 -10 38 15 40 92 -16 0 67 11 1970 -8 -10 15 13 67 -28 -4 38 3 1971 29 49 15 25 35 -27 -4 16 21 1972 23 43 10 -10 25 -29 -4 -31 6 1973 -39 -8 10 -18 -1 -23 -4 -48 -29 1974 -53 -3 10 6 18 -19 -4 -34 -33 1975 -29 6 10 -23 13 -21 -4 -44 -21 1976 0 22 10 -12 5 -18 -4 -19 -4 1977 -4 41 10 -9 42 -14 -4 14 2 1978 -32 37 10 -15 42 -12 -4 24 -9 1979 -24 16 10 31 38 -18 -4 16 -9 1980 -38 25 5 48 48 -25 -4 -18 -19 1981 -36 28 5 42 46 -21 -4 -15 -17 1982 3 42 5 30 44 -31 -4 73 9 1983 -10 -2 5 21 27 -36 -4 64 -5 1984 0 7 5 39 26 -23 -4 193 7 1985 43 41 5 59 50 -37 -4 273 21 1986 26 62 20 32 40 -27 0 114 22 1987 11 96 20 43 44 -17 0 126 22 1988 -9 46 20 65 43 -14 0 70 6 1989 2 54 20 56 37 -9 0 33 10 1990 16 51 20 25 34 -17 0 29 12 1991 1 24 30 24 39 -15 0 56 6 1992 21 88 30 16 84 -19 0 75 21 1993 46 69 30 24 68 -15 0 51 28 1994 21 82 30 36 57 -10 0 35 19 1995 55 94 30 -2 50 -9 0 80 36 1996 71 48 30 31 37 -4 0 80 47 1997 63 84 30 53 39 -22 0 60 45 1998 21 66 30 -2 25 -5 0 95 20 1999 53 100 20 23 60 2 0 171 41 2000 73 96 10 6 66 -23 0 77 39 2001 69 72 10 0 51 -23 0 67 36 2002 54 45 10 -7 55 -5 0 105 27 2003 41 25 10 -22 49 -8 0 84 15 2004 17 35 10 -19 40 -11 0 64 7
Source: Authors’ spreadsheet.

15
Appendix Table A6: Nominal and relative rates of assistance to alla agricultural products, to exportableb and import-competing b agricultural industries, and relativec to non-agricultural industries, Philippines, 1962 to 2004
(percent) Total ag NRA
Covered products
Inputs Outputs
Non-covered products
All products (incl NPS)
Ag tradables NRA
Non-ag tradables
NRA RRA 1962 0 -9 -3 -8 -8 19 -23 1963 0 -4 -1 -3 -3 19 -19 1964 0 7 3 6 7 19 -10 1965 0 20 8 17 19 19 0 1966 0 23 8 19 21 22 -1 1967 0 14 5 12 13 20 -6 1968 0 9 4 8 9 19 -9 1969 0 11 4 10 10 21 -9 1970 0 3 1 3 3 20 -14 1971 0 21 8 18 19 24 -4 1972 0 6 2 5 5 15 -9 1973 0 -29 -11 -25 -27 11 -35 1974 0 -33 -12 -29 -31 10 -37 1975 0 -21 -8 -18 -20 13 -29 1976 0 -4 -1 -3 -3 17 -17 1977 0 2 2 2 2 18 -13 1978 0 -9 -3 -7 -8 17 -21 1979 0 -9 -2 -7 -8 17 -22 1980 0 -19 -7 -16 -17 16 -29 1981 0 -17 -6 -14 -15 13 -25 1982 0 9 7 8 9 13 -3 1983 0 -5 1 -4 -4 11 -14 1984 0 7 7 7 8 12 -4 1985 0 21 17 20 22 12 9 1986 0 22 12 19 21 10 10 1987 0 22 11 19 21 11 9 1988 0 6 4 6 6 13 -6 1989 0 10 5 9 10 9 0 1990 0 12 7 11 12 11 1 1991 0 6 3 6 6 9 -3 1992 0 21 10 19 20 11 9 1993 0 28 13 25 27 9 17 1994 0 19 8 17 18 10 8 1995 0 36 15 32 34 7 26 1996 0 47 19 41 44 8 33 1997 0 45 20 39 42 9 31 1998 0 20 8 17 19 8 10 1999 0 41 18 36 39 11 25 2000 0 39 17 34 37 9 25 2001 0 36 15 32 34 8 24 2002 0 27 11 24 26 7 18 2003 0 15 6 14 15 5 10 2004 0 7 3 6 6 3 3
a NRAs including assistance to nontradables and non-product specific assistance. b NRAs including products specific input subsidies. c The Relative Rate of Assistance (RRA) is defined as 100*[(100+NRAagt)/ (100+NRAnonagt)-1], where NRAagt and NRAnonagt are the percentage NRAs for the tradables parts of the agricultural and non-agricultural sectors, respectively. Source: Authors’ spreadsheet

16
Appendix Table A7: Value shares of primary production of covered and non-covered products,a Philippines, 1962 to 2004
(percent)
Rice Maize Sugar Beef Pigs Chicken Coconut Banana Covered Non-
covered 1962 39 9 3 7 12 5 3 5 77 23 1963 39 10 4 4 13 4 3 5 77 23 1964 36 9 6 4 14 4 3 5 77 23 1965 36 9 7 4 14 4 3 5 77 23 1966 38 9 6 4 14 5 2 4 78 22 1967 44 7 6 4 13 4 3 4 80 20 1968 46 7 6 3 10 3 3 4 79 21 1969 40 8 11 3 9 3 3 5 77 23 1970 32 12 13 4 11 3 3 4 77 23 1971 32 12 16 3 12 3 3 6 80 20 1972 28 9 18 3 12 2 4 4 76 24 1973 35 10 17 2 8 2 4 2 78 22 1974 42 11 11 3 6 1 5 3 79 21 1975 30 10 16 2 7 1 9 3 76 24 1976 26 10 15 2 6 1 13 2 74 26 1977 26 7 10 2 9 1 15 2 71 29 1978 29 7 7 3 9 1 15 3 71 29 1979 26 7 9 2 7 1 22 4 74 26 1980 29 7 11 4 6 1 14 4 71 29 1981 30 7 11 3 6 1 12 3 71 29 1982 26 8 9 4 8 1 15 4 72 28 1983 24 9 7 4 8 1 17 4 70 30 1984 22 9 5 3 10 1 23 4 73 27 1985 24 11 4 3 7 1 25 4 74 26 1986 25 10 6 3 10 1 15 5 69 31 1987 27 8 5 3 10 1 15 4 71 29 1988 28 9 7 3 9 1 18 5 74 26 1989 28 8 9 3 10 1 13 4 73 27 1990 24 9 9 3 12 2 14 4 73 27 1991 37 7 6 3 12 1 11 4 77 23 1992 32 7 7 3 14 1 13 4 77 23 1993 30 7 8 4 14 1 13 4 77 23 1994 37 6 7 3 12 1 11 5 77 23 1995 34 6 6 3 19 1 9 4 78 22 1996 34 7 6 4 14 2 10 4 77 23 1997 34 6 6 4 13 2 11 5 76 24 1998 29 5 5 5 17 2 11 4 74 26 1999 33 5 3 6 15 2 12 6 76 24 2000 31 6 5 8 18 2 9 5 78 22 2001 31 6 7 7 20 2 7 5 79 21 2002 31 6 4 5 22 2 9 5 80 20 2003 30 6 5 5 24 1 8 5 79 21 2004 32 6 4 4 22 1 11 4 79 21
a At farmgate undistorted prices. Source: Authors’ spreadsheet
Recommended