DISCLAIMER
"The opinions, findings and conclusions expressed in this publication are
those of the authors and not necessarily those of the Florida Department of
Transportation or the U.S. Department of Transportation.
Prepared in cooperation with the State of Florida Department of
Transportation and the U.S. Department of Transportation."

TENSILE BEHAVIOR AND DESIGN OF
SINGLE ADHESIVE ANCHORS
By
Ronald A. Cook, P.E.
Fernando E. Fagundo, P.E.
Michael H. Biller
Daniel E. Richardson
Department of Civil Engineering
College of Engineering
University of Florida
Gainesville, Florida
Engineering and Industrial Experiment Station
September 1991

TABLE OF CONTENTS CHAPTERS
1 INTRODUCTION.………………………………………………………………..1 1.1 Problem Statement …………………………………………………………...1 1.2 Scope and Objectives…….…………………………………………………..2
1.2.1 Scope ………………………………………………………………2 1.2.2 Objectives ………………………………………………………….3
2 BACKGROUND……………….…………………………………………………4 2.1 Behavior of Adhesive Anchors……….………………………………….…..4 2.2 Other Factors Affecting Adhesive Anchor Behavior…………………….…..7 2.3 Current Qualification specifications……………………………………..…..8 3 DE VELOPMENT.OF EXPERIMENTAL PROGRAM…………………………9
3.1 General………………………………………………………………….…...9 3.2 Test Specimens………………………………………………………………9 3.3 Test Method………………………………………………………………..10
4 IMPLEMENTATION OF TEST PROGRAM………………………………….12 4.1 Design and Construction of Concrete Test Slabs…………………………..12
4.1.1 Formwork……..………………………………………………….12 4.1.2 Test Slab………………………………………………………….13
4.2 Anchor Installation…………………………………………………………14 4.2.1 Anchor Bolt Preparation…………………………………………14
4.2.2 Hole Preparation…………………………………………………14 4.2.3 Anchor Installation……………………………………………….15
4.3 Test Equipment and Procedure……………………………………………..17 4.3.1 Confined Testing…………………………………………………17 4.3.2 Data Acquisition………………………………………………..19 4.3.3 Unconfined Testing………………………………………………21
4.4 Test Matrix…………………………………………………………………21 5 TEST RESULTS…………………………………………………………………23
5.1 General……………………………………………………………………..23 5.2 Failure Modes………………………………………………………………23
ii
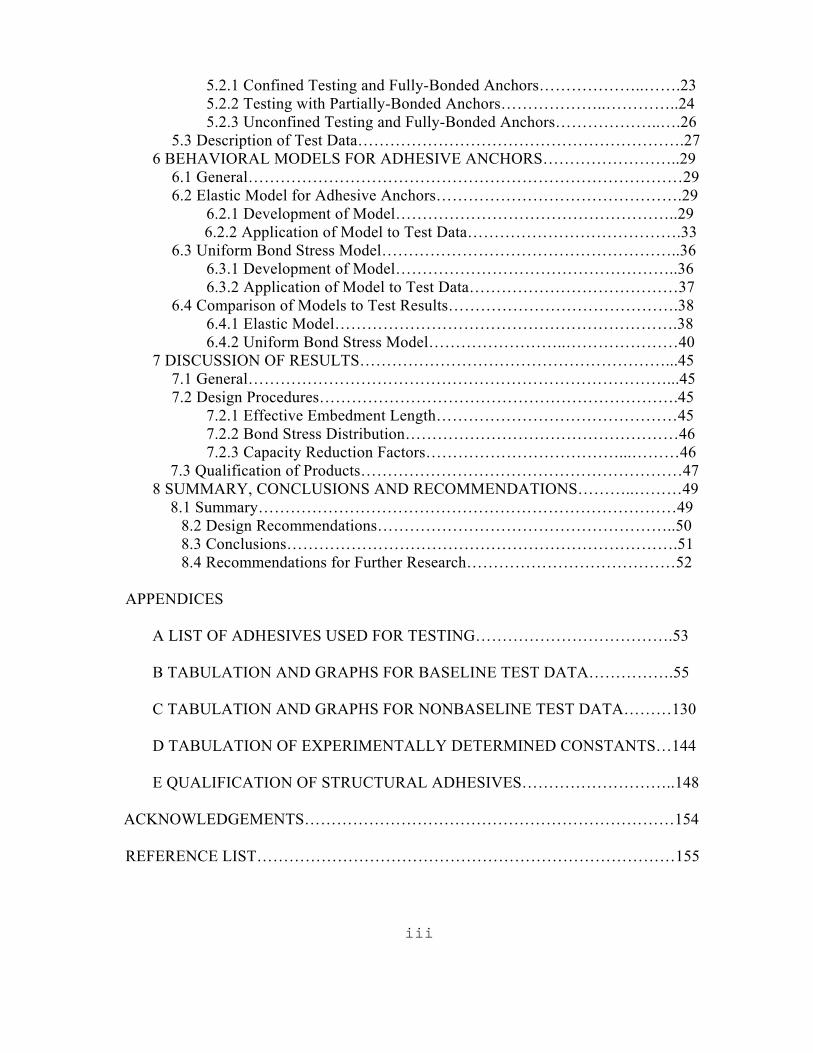
5.2.1 Confined Testing and Fully-Bonded Anchors………………..…….23 5.2.2 Testing with Partially-Bonded Anchors………………..…………..24 5.2.3 Unconfined Testing and Fully-Bonded Anchors………………..….26 5.3 Description of Test Data…………………………………………………….27
6 BEHAVIORAL MODELS FOR ADHESIVE ANCHORS……………………..29 6.1 General………………………………………………………………………29 6.2 Elastic Model for Adhesive Anchors……………………………………….29
6.2.1 Development of Model……………………………………………..29 6.2.2 Application of Model to Test Data………………………………….33
6.3 Uniform Bond Stress Model………………………………………………..36 6.3.1 Development of Model……………………………………………..36 6.3.2 Application of Model to Test Data…………………………………37 6.4 Comparison of Models to Test Results…………………………………….38
6.4.1 Elastic Model……………………………………………………….38 6.4.2 Uniform Bond Stress Model……………………..…………………40
7 DISCUSSION OF RESULTS…………………………………………………...45 7.1 General……………………………………………………………………...45 7.2 Design Procedures………………………………………………………….45 7.2.1 Effective Embedment Length………………………………………45 7.2.2 Bond Stress Distribution……………………………………………46
7.2.3 Capacity Reduction Factors………………………………...………46 7.3 Qualification of Products……………………………………………………47
8 SUMMARY, CONCLUSIONS AND RECOMMENDATIONS………..………49 8.1 Summary……………………………………………………………………49
8.2 Design Recommendations………………………………………………..50 8.3 Conclusions……………………………………………………………….51 8.4 Recommendations for Further Research…………………………………52
APPENDICES
A LIST OF ADHESIVES USED FOR TESTING……………………………….53
B TABULATION AND GRAPHS FOR BASELINE TEST DATA…………….55
C TABULATION AND GRAPHS FOR NONBASELINE TEST DATA………130
D TABULATION OF EXPERIMENTALLY DETERMINED CONSTANTS…144
E QUALIFICATION OF STRUCTURAL ADHESIVES………………………..148
ACKNOWLEDGEMENTS……………………………………………………………154
REFERENCE LIST……………………………………………………………………155
iii
CHAPTER 1 INTRODUCTION
1.1 Problem Statement
The Florida Department of Transportation (FDOT) presently does not have standard
specifications for adhesive-bonded anchors in structural applications. An adhesive-
bonded anchor is a reinforcing bar or threaded rod inserted into a drilled hole in hardened
concrete with a structural adhesive acting as a bonding agent between the concrete and
the steel. Such adhesives are packaged as two component units comprised of an epoxy,
polyester, or vinylester resin and a catalyst or curing agent.
These anchors provide a viable, economical method for adding new concrete sections or
attaching steel members to existing concrete structures. Presently, most designers follow
the adhesive manufacturer's recommendations which are based on laboratory testing
specific to individual products and applications. The increasing amount of retrofit and
rehabilitation work encountered today exemplifies the need for a standard specification
for this type of anchor.
1
2
1.2 Scope and Objectives
1.2.1 Scope
The purpose of this project was to study the tensile behavior of adhesive-
bonded anchors when subject to static loading and to identify parameters specific to
each adhesive. Previous research (Klingner et al., 1982) has shown that if a structural
anchor has been sufficiently embedded for tension, it will also be adequate for shear.
Therefore, the tensile behavior should provide the information necessary to describe
the bond failure of an adhesive anchor.
The adhesives tested were all self-mixing and intended for structural applications. The
diameters and embedment lengths of the anchors were varied to provide a broad range of
contact surface areas and length-to-diameter ratios. The embedment lengths were chosen
as to prevent steel failure and concentrate on the bond strengths of the individual
adhesives.
A series of baseline tests was used to determine bond and stiffness characteristics that
are specific to each adhesive. These properties were utilized to develop a design
equation for structural adhesive anchors.
Other tests were performed to confirm the results from the baseline tests.
3
1.2.2 Objectives
Experimental data will be employed to develop a qualification specification that can be
used to establish the basic parameters necessary to design a structural adhesive bonded
anchor.
CHAPTER 2
BACKGROUND
2.1 Behavior of Adhesive Anchors
The main- function of a structural adhesive is to transfer load from the steel anchor to
the surrounding concrete. Daws (1978) suggests four factors that contribute to the load
transfer capability of an adhesive anchor: Mechanical interlock on the adhesive-
concrete interface, chemical bond along the adhesive-concrete interface, mechanical
interlock on the adhesive-steel interface, and chemical bond along the adhesive-steel
interface. The actual failure mode of an adhesive anchor is often a combination of
mechanical interlock and chemical bond failure.
The quantity of documented research pertaining to the behavior and the bond stress
distribution of structural adhesive anchors is currently limited. One study at the
University of Texas at Austin (Collins et al., 1989) investigated the load-deflection
behavior of retrofit and cast-in-place anchors. Five-eighths inch diameter ASTM A193
Grade B7 threaded rods were installed in concrete with a specified compressive
strength of 3600 psi (actua1 4500-6750 psi). The embedment lengths ranged from 7 to
12 in. and the anchors were allowed to cure for either 7 days or 24 hours.
4
15
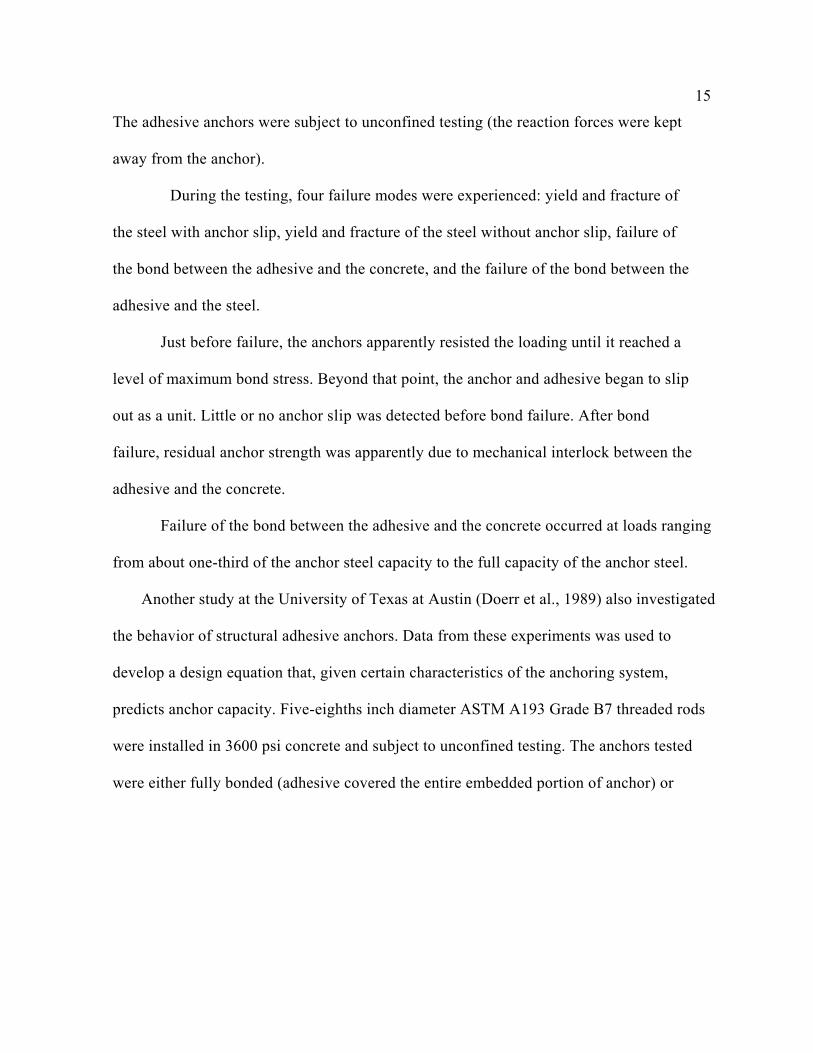
The adhesive anchors were subject to unconfined testing (the reaction forces were kept
away from the anchor).
During the testing, four failure modes were experienced: yield and fracture of
the steel with anchor slip, yield and fracture of the steel without anchor slip, failure of
the bond between the adhesive and the concrete, and the failure of the bond between the
adhesive and the steel.
Just before failure, the anchors apparently resisted the loading until it reached a
level of maximum bond stress. Beyond that point, the anchor and adhesive began to slip
out as a unit. Little or no anchor slip was detected before bond failure. After bond
failure, residual anchor strength was apparently due to mechanical interlock between the
adhesive and the concrete.
Failure of the bond between the adhesive and the concrete occurred at loads ranging
from about one-third of the anchor steel capacity to the full capacity of the anchor steel.
Another study at the University of Texas at Austin (Doerr et al., 1989) also investigated
the behavior of structural adhesive anchors. Data from these experiments was used to
develop a design equation that, given certain characteristics of the anchoring system,
predicts anchor capacity. Five-eighths inch diameter ASTM A193 Grade B7 threaded rods
were installed in 3600 psi concrete and subject to unconfined testing. The anchors tested
were either fully bonded (adhesive covered the entire embedded portion of anchor) or
16
partially bonded (top 2 in. of the embedded portion of the anchor treated with
a debonding agent) and embedment depths ranged from 4 to 8 in.
During the testing, the fully bonded anchors failed either by fracture of
the steel or by the formation of a shallow (about l to 2 in.) concrete cone
accompanied by pullout of the adhesive. The partially bonded anchors failed
either by fracture of the steel or by the pullout of an adhesive core. Concrete
cone failures did not occur with the partially bonded anchors. Test data
revealed that fully bonded anchors had only slightly higher capacities than the
partially bonded anchors of the same embedment length.
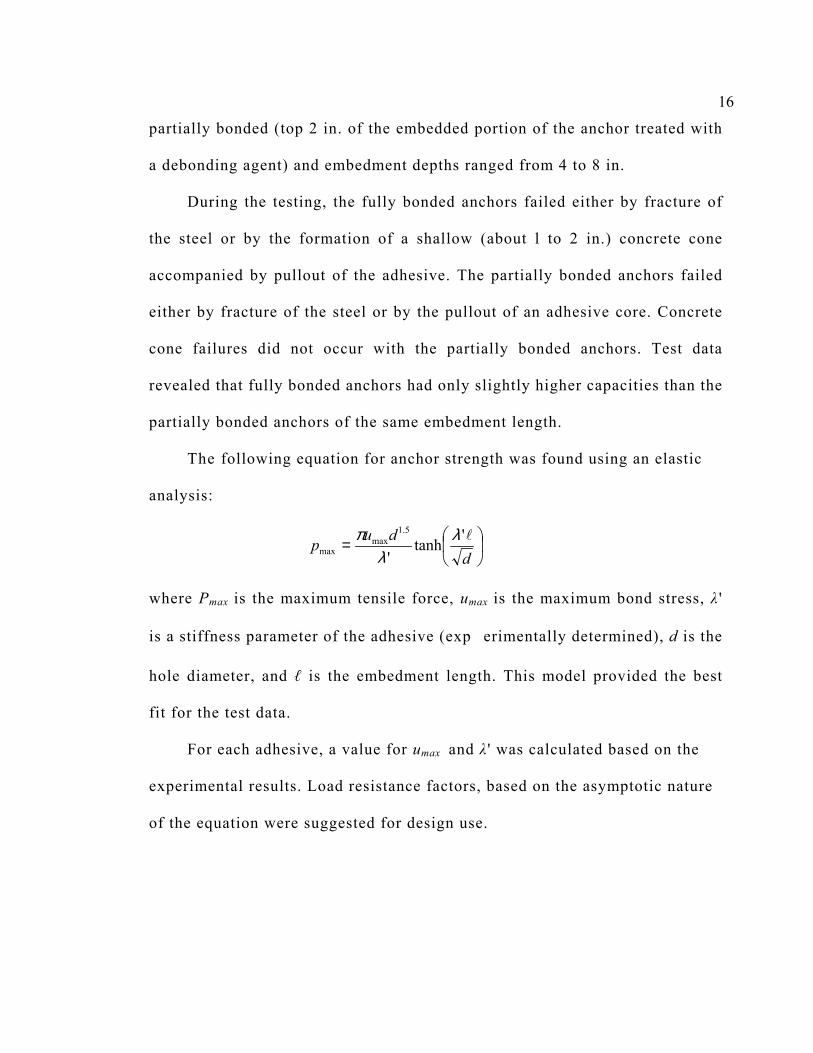
The following equation for anchor strength was found using an elastic
analysis:
=d
dup l'tanh'
5.1max
maxλ
λπ
where Pmax is the maximum tensile force, umax is the maximum bond stress, λ '
is a stiffness parameter of the adhesive (exp erimentally determined), d is the
hole diameter, and ℓ is the embedment length. This model provided the best
fit for the test data.
For each adhesive, a value for umax and λ ' was calculated based on the
experimental results. Load resistance factors, based on the asymptotic nature
of the equation were suggested for design use.
7
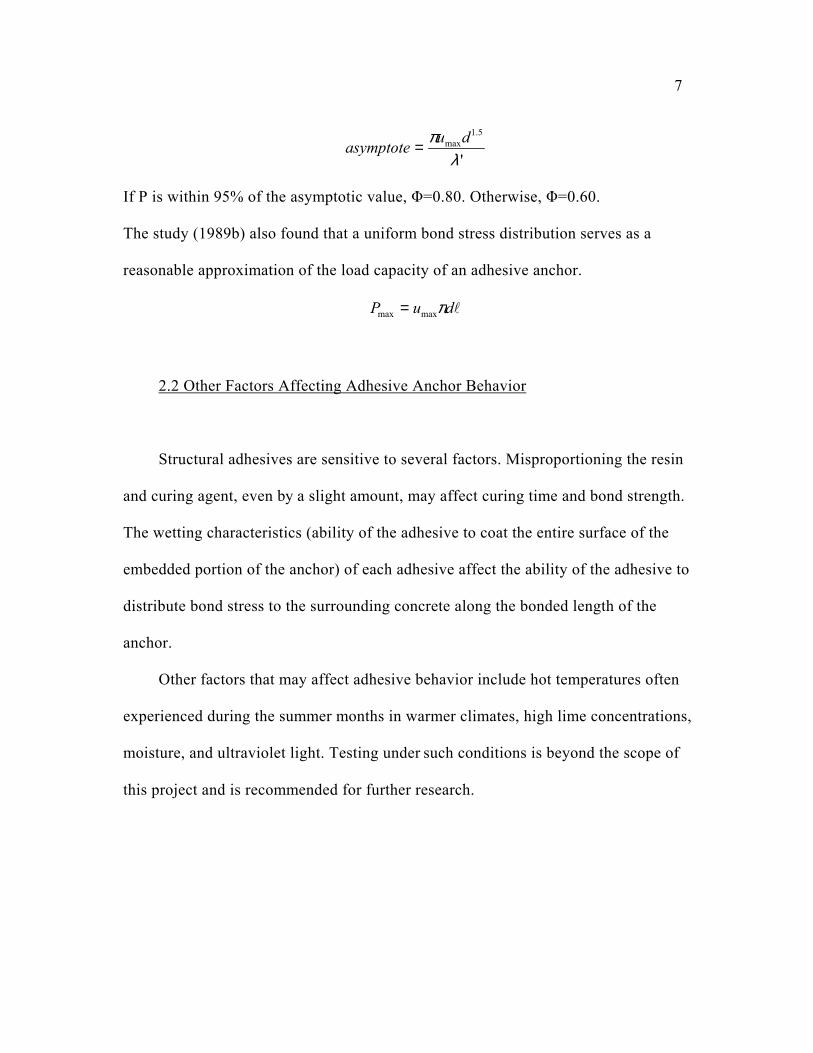
'
5.1max
λπ duasymptote =
If P is within 95% of the asymptotic value, Φ=0.80. Otherwise, Φ=0.60.
The study (1989b) also found that a uniform bond stress distribution serves as a
reasonable approximation of the load capacity of an adhesive anchor.
lduP πmaxmax =
2.2 Other Factors Affecting Adhesive Anchor Behavior
Structural adhesives are sensitive to several factors. Misproportioning the resin
and curing agent, even by a slight amount, may affect curing time and bond strength.
The wetting characteristics (ability of the adhesive to coat the entire surface of the
embedded portion of the anchor) of each adhesive affect the ability of the adhesive to
distribute bond stress to the surrounding concrete along the bonded length of the
anchor.
Other factors that may affect adhesive behavior include hot temperatures often
experienced during the summer months in warmer climates, high lime concentrations,
moisture, and ultraviolet light. Testing under such conditions is beyond the scope of
this project and is recommended for further research.
18
2.3 Current Qualification Specifications
The Florida Department of Transportation (FDOT) does not currently have a
specification for adhesive anchors in structural applications. Section 460-30 of the
current FDOT code (1986) contains specifications pertaining to setting and furnishing
anchor bolts (i.e. bolt composition, cleaning and drilling holes, etc.). Classification of
each type of adhesive compound is listed in Section 926-1. A Type J adhesive is "an
epoxy for anchor bolts where strength of the overall structure is not a factor such as
for hanging telephone lines or other utility attachments" (1986, p. 644). Section 926-2
lists specifications for each type of adhesive and makes a reference to the FDOT
Qualified Products List (1990).
One current qualification test for structural adhesive anchors is specified by the
Missouri Highway and Transportation Department (MHTD). Section 1039.3 and T49-
2-90 in MHTD Standard Specifications (1990) specifies a pull-out test for chemical
bonding agents. Given a standardized concrete compressive strength, hole depth and
diameter, anchor diameter, anchor length, adhesive curing time, and loading rate, the
adhesive anchor must withstand a specified minimum load.
The method of testing (confined or unconfined) is not specified.
CHAPTER 3
DEVELOPMENT OF EXPERIMENTAL PROGRAM
3.1 General
The test program consisted of baseline tests that were performed on each of 16
adhesives. The purpose of these tests was to determine bond and stiffness properties
specific to each adhesive. These characteristics were utilized to develop a design
equation for adhesive anchors. Additional tests were used to verify the results of the
baseline tests.
3.2 Test Specimens
The structural adhesive anchors tested were ASTM A193 Grade B7 threaded rods.
The anchor diameters were ½”, 5/8”, and ¾” and their respective embedment lengths
were 5”, 3.5”, and 7": These combinations of dimensions were chosen to provide a wide
range in the specimens ℓ/ d ratio. This relationship was determined to be important in
modeling the behavior of adhesive anchors (see Chapter 6).
High strength (minimum specified tensile strength of 125 ksi) threaded rod was used to
ensure that the bond would fail before the steel began to yield under tensile loading. The
adhesives tested are intended to be used in structural
10
applications. Many of the products are currently included in the FDOT Qualified
Products List (1990).
3.3 Test Methods
Static tensile tests were performed two ways--confined and unconfined. A
confined test requires that the reaction force be kept close to the anchor. An
unconfined test requires the reaction force to be kept away from the anchor. For both
testing methods, the adhesive anchors were either fully bonded or partially bonded.
The fully-bonded anchors had the adhesive over the entire embedded length of the
steel. Partially-bonded anchors were debonded at the top 2 in. of the embedded length.
The baseline tests involved confined testing with fullybonded anchors. The tests
were performed in accordance with ASTM Z1706z (1991). This method of testing
prevented spalling at the surface of the concrete. By eliminating concrete cone
formations, confined testing allowed for the study of the bond strength while
neglecting the tensile strength of the concrete.
Unconfined tests were performed in accordance with ASTM E488. Fully bonded
anchors were studied under this loading condition since it is often encountered in
many engineering applications. Since concrete cone formation is possible with
unconfined testing, concrete tensile strength may be a factor.
11
The results of these tests are compared with the baseline tests.
Partially bonded anchors were studied under both confined and unconfined
testing. Previous tests (Doerr et al., 1989) have shown that the depth of a typical concrete
cone formed during failure is about 2 in. To avoid cone formation, these anchors were
debonded along the top 2 in. of the embedded length. The strength of the partially-
bonded anchors were compared to that of the fully-bonded anchors of the same diameter
and embedment depth. Design equations, derived using results of the baseline tests, were
used to predict the capacity of the debonded anchors. The accuracy of the design
equation was investigated by comparing the calculated values with the actual test data.
CHAPTER 4
IMPLEMENTATION OF TEST PROGRAM
4.1 Design and Construction of Concrete Test Slabs
4.1.1 Formwork
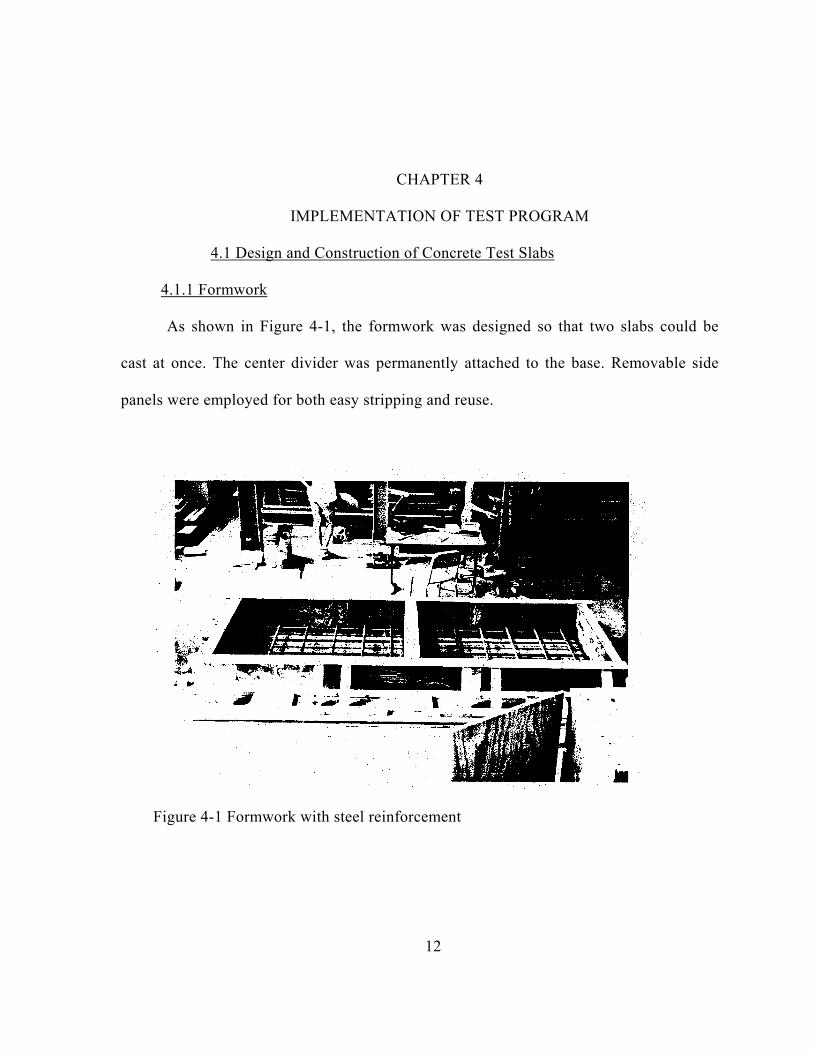
As shown in Figure 4-1, the formwork was designed so that two slabs could be
cast at once. The center divider was permanently attached to the base. Removable side
panels were employed for both easy stripping and reuse.
Figure 4-1 Formwork with steel reinforcement
12
23
4.1.2 Test Slab
The concrete slabs measured 72 x 54 x 15 in. They were reinforced at the bottom to
control cracking and' shrinkage (Figure 4-1). The reinforcing bars were spaced at 12in. in
both the longitudinal and transverse directions. Bent #3 bars were used for lifting hooks.
The slabs were cast using readymix 3500 psi FDOT Class II concrete. Test beams
and cylinders cured along the sides of the forms under the same atmospheric conditions as
the slabs.
Results of the cylinder tests show the compressive strength of the concrete to be
well over the minimum specified strength of 3500 psi at the time of testing. The
compressive strengths were `all above 5000 psi ('see table 4-1). This was the same as that
in the tests performed at the University of Texas (Doerr et al., 1989). The concrete tensile
strength
24
(modulus of rupture) ranged from about 471 to 624 psi. Since the baseline anchor
pull-out tests were designed to study bond strength (in the absence of concrete cone
formation), the tensile strength of the concrete should not affect test results.
4.2 Anchor Installation
4.2.1 Anchor Bolt Preparation
ASTM A193 Grade B7 threaded rods were used for all of the adhesive anchors.
The rods were cut to their desired length using a horizontal band saw. Sharp edges
were removed with a grinding wheel. The rods were then soaked in paint thinner
and wiped clean to rid the steel of any oily residue. Duct tape served as a bond-
breaker for the partially-bonded adhesive anchors. The tape was wrapped around the
top 2 in. of the embedded length.
4.2.2 Hole Preparation
The procedure presented in this section was consistent for each individual test.
Drill bits were measured with a micrometer before and after each series of tests to
detect any trace of deterioration. No deterioration was detected.
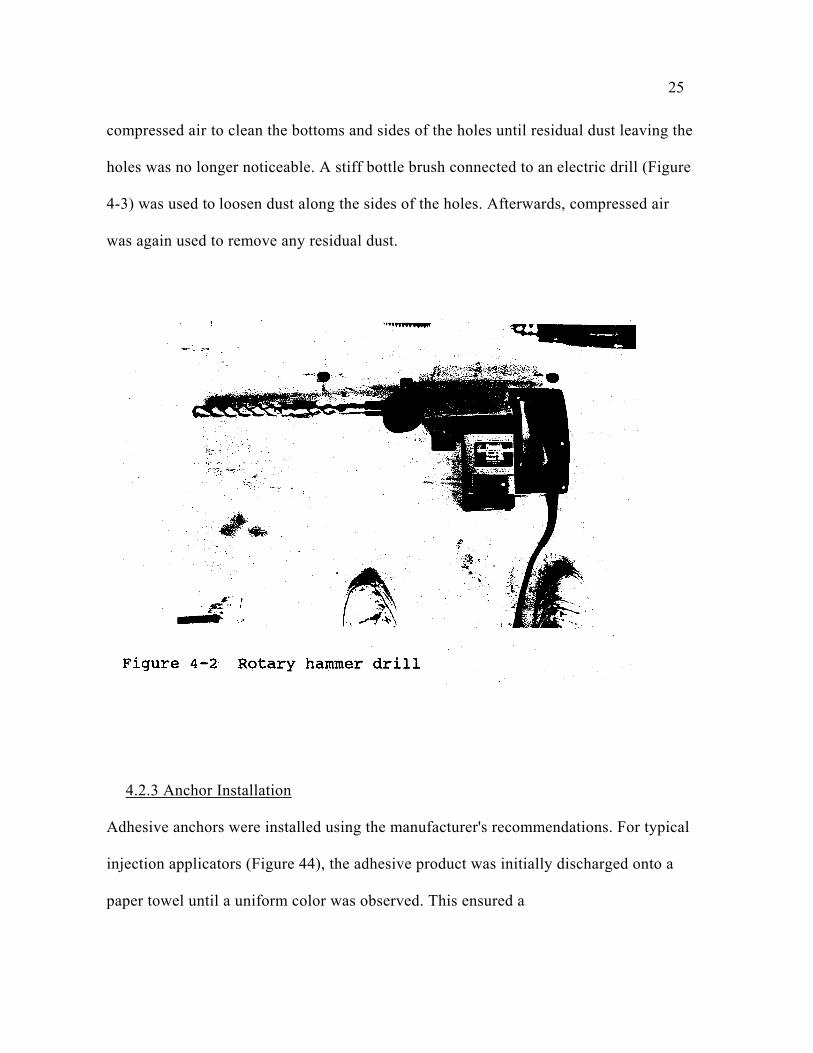
Holes were drilled into the concrete using a rotary hammer drill (Figure 4-2).
Laboratory assistants observed the drilling to ensure proper alignment. The holes
were then cleaned out with compressed air. A plastic tube enabled the
25
compressed air to clean the bottoms and sides of the holes until residual dust leaving the
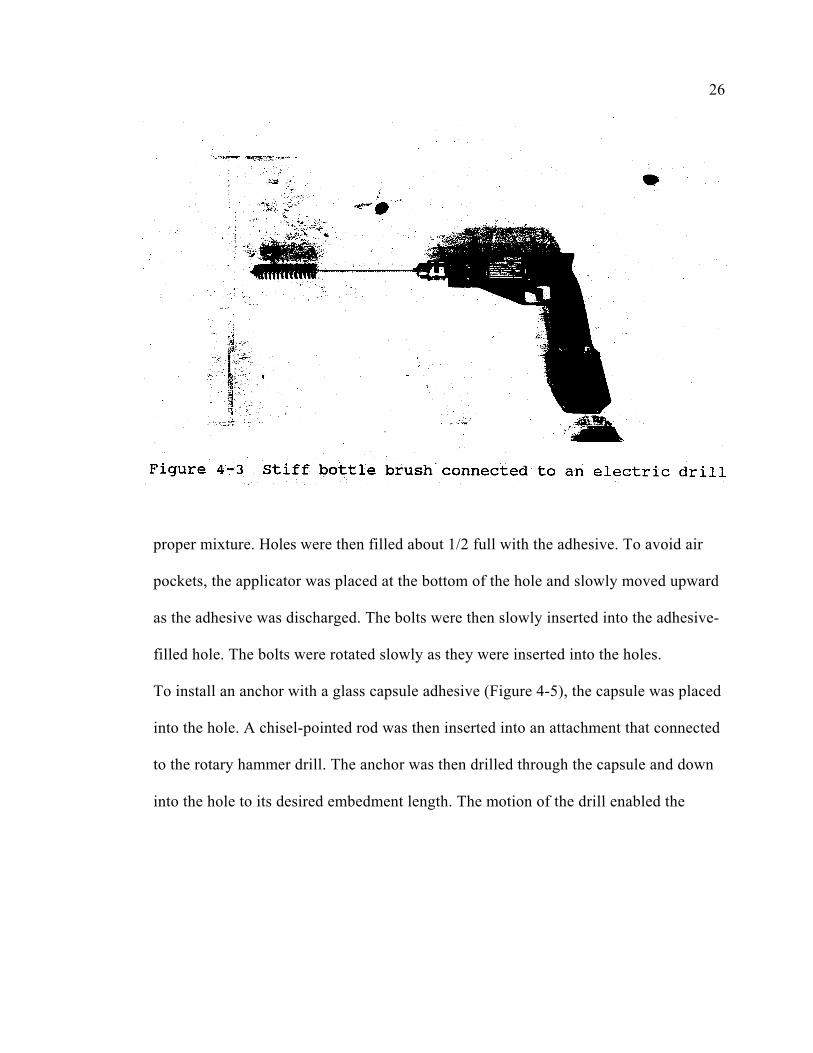
holes was no longer noticeable. A stiff bottle brush connected to an electric drill (Figure
4-3) was used to loosen dust along the sides of the holes. Afterwards, compressed air
was again used to remove any residual dust.
4.2.3 Anchor Installation
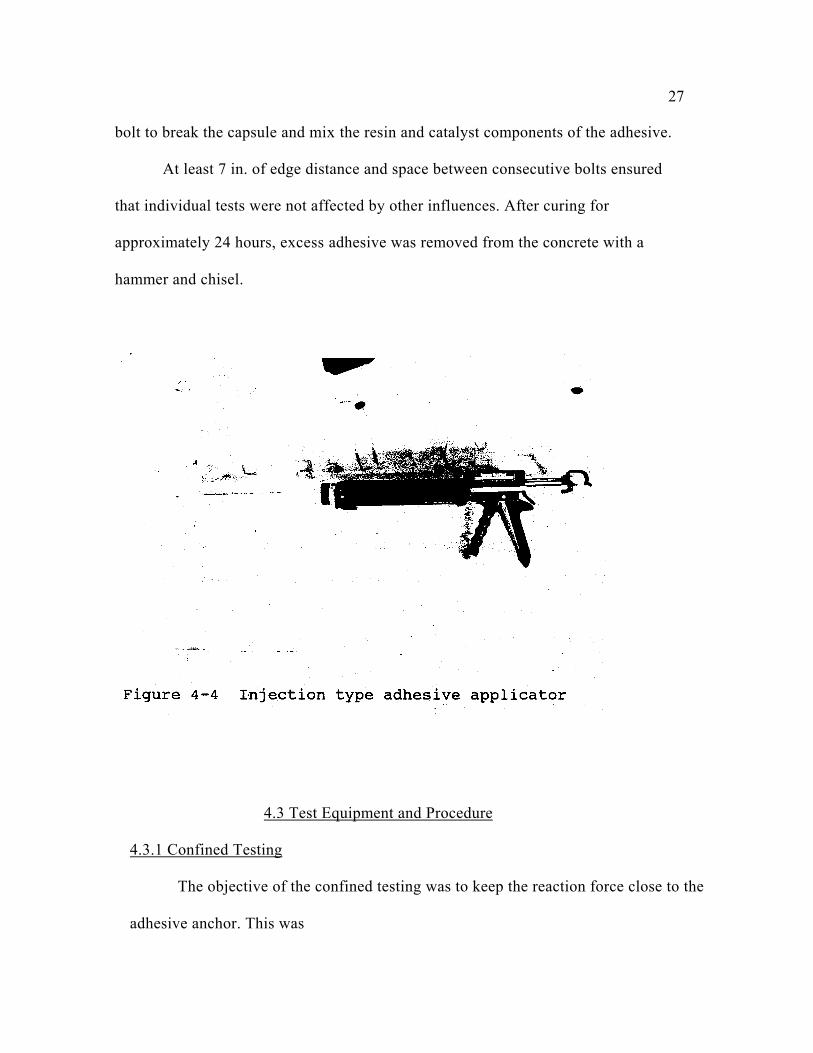
Adhesive anchors were installed using the manufacturer's recommendations. For typical
injection applicators (Figure 44), the adhesive product was initially discharged onto a
paper towel until a uniform color was observed. This ensured a
26
proper mixture. Holes were then filled about 1/2 full with the adhesive. To avoid air
pockets, the applicator was placed at the bottom of the hole and slowly moved upward
as the adhesive was discharged. The bolts were then slowly inserted into the adhesive-
filled hole. The bolts were rotated slowly as they were inserted into the holes.
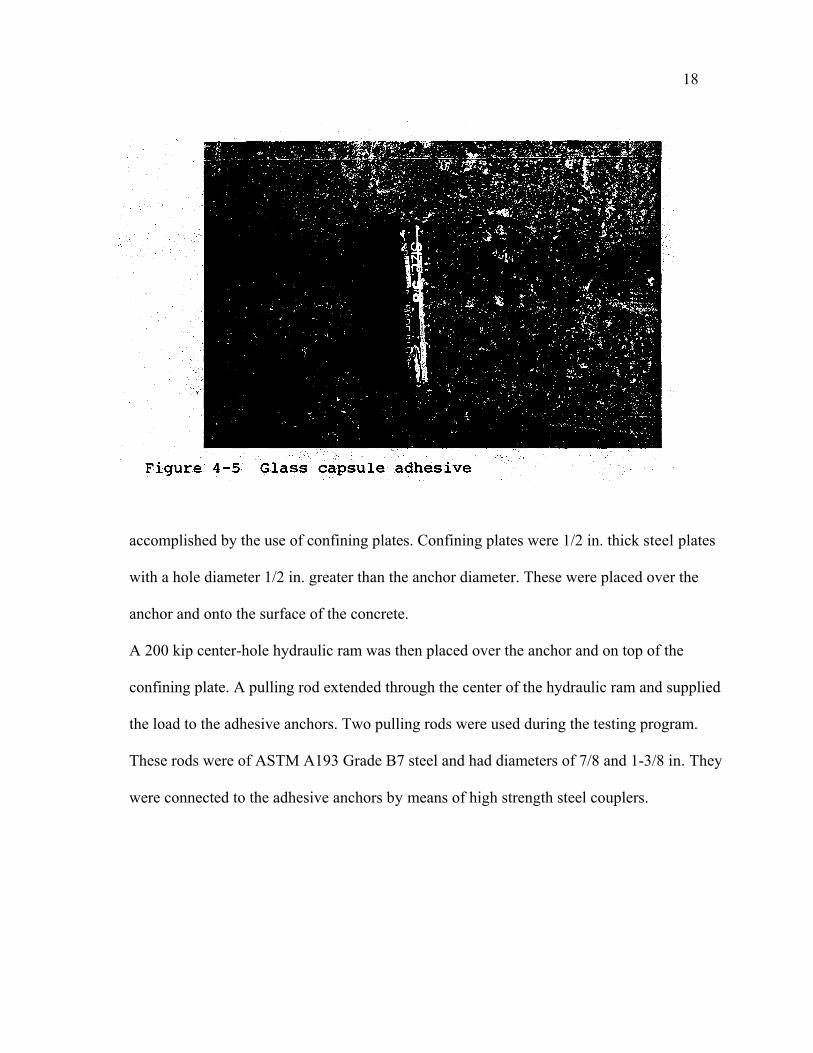
To install an anchor with a glass capsule adhesive (Figure 4-5), the capsule was placed
into the hole. A chisel-pointed rod was then inserted into an attachment that connected
to the rotary hammer drill. The anchor was then drilled through the capsule and down
into the hole to its desired embedment length. The motion of the drill enabled the
27
bolt to break the capsule and mix the resin and catalyst components of the adhesive.
At least 7 in. of edge distance and space between consecutive bolts ensured
that individual tests were not affected by other influences. After curing for
approximately 24 hours, excess adhesive was removed from the concrete with a
hammer and chisel.
4.3 Test Equipment and Procedure
4.3.1 Confined Testing
The objective of the confined testing was to keep the reaction force close to the
adhesive anchor. This was
18
accomplished by the use of confining plates. Confining plates were 1/2 in. thick steel plates
with a hole diameter 1/2 in. greater than the anchor diameter. These were placed over the
anchor and onto the surface of the concrete.
A 200 kip center-hole hydraulic ram was then placed over the anchor and on top of the
confining plate. A pulling rod extended through the center of the hydraulic ram and supplied
the load to the adhesive anchors. Two pulling rods were used during the testing program.
These rods were of ASTM A193 Grade B7 steel and had diameters of 7/8 and 1-3/8 in. They
were connected to the adhesive anchors by means of high strength steel couplers.
29
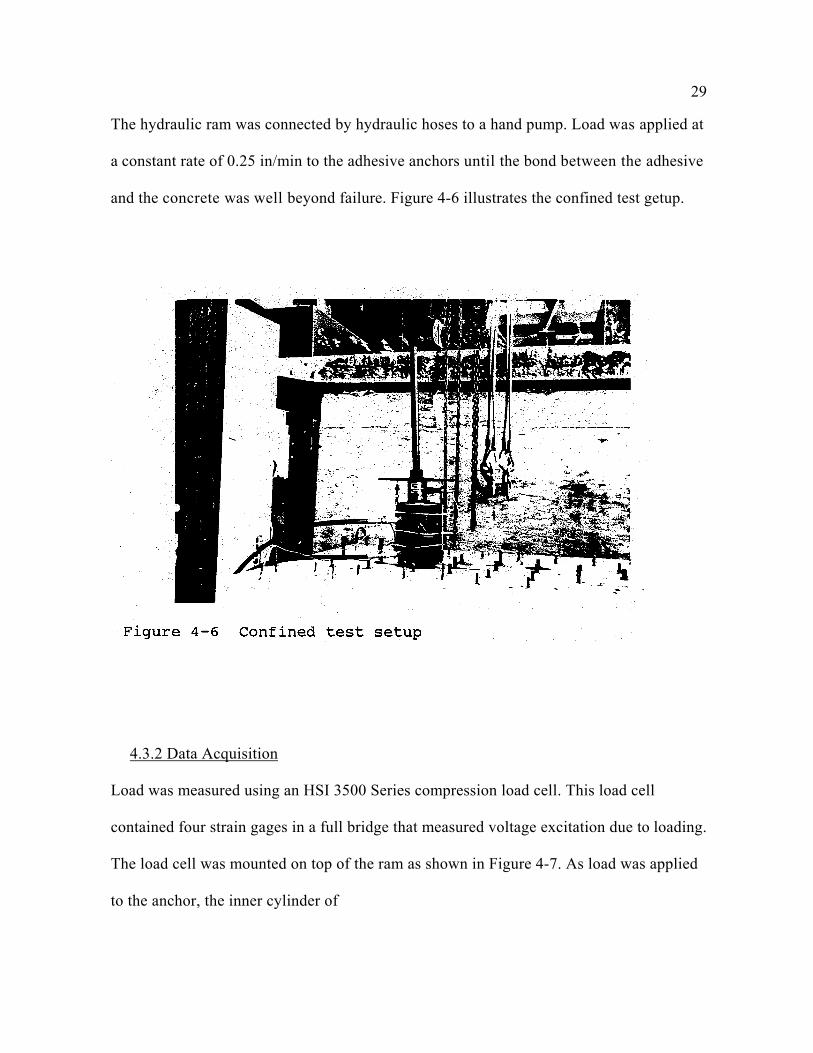
The hydraulic ram was connected by hydraulic hoses to a hand pump. Load was applied at
a constant rate of 0.25 in/min to the adhesive anchors until the bond between the adhesive
and the concrete was well beyond failure. Figure 4-6 illustrates the confined test getup.
4.3.2 Data Acquisition
Load was measured using an HSI 3500 Series compression load cell. This load cell
contained four strain gages in a full bridge that measured voltage excitation due to loading.
The load cell was mounted on top of the ram as shown in Figure 4-7. As load was applied
to the anchor, the inner cylinder of
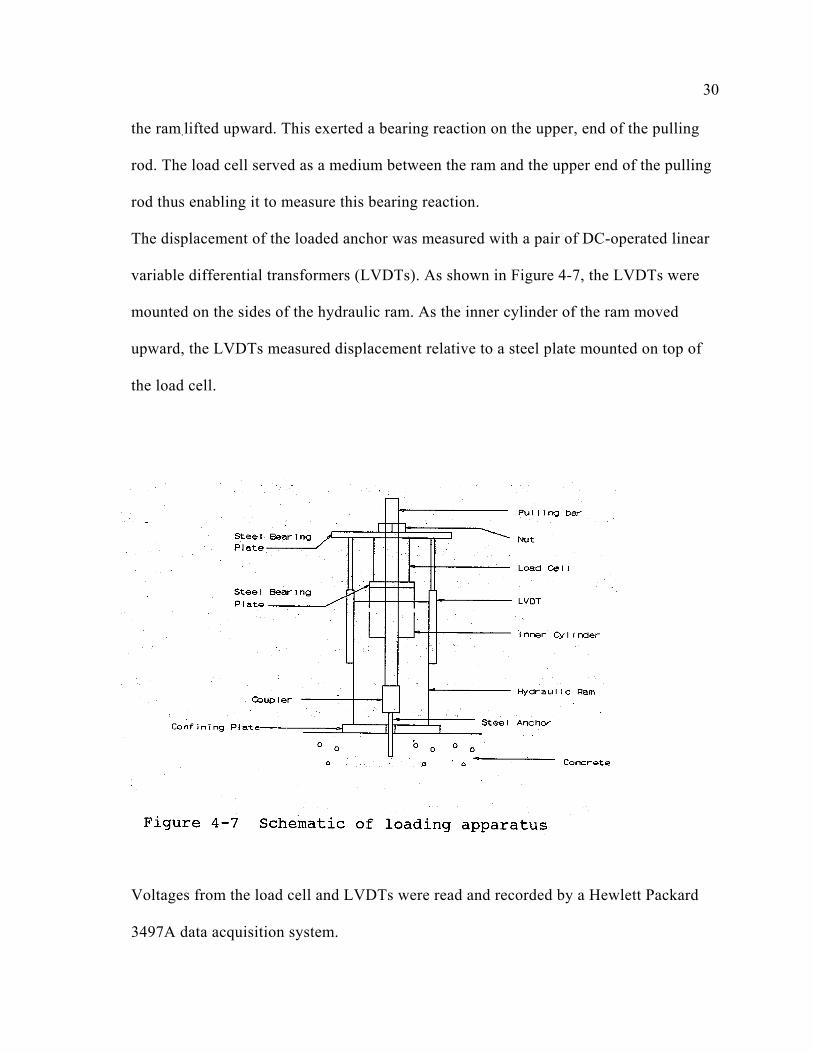
30
the ram.lifted upward. This exerted a bearing reaction on the upper, end of the pulling
rod. The load cell served as a medium between the ram and the upper end of the pulling
rod thus enabling it to measure this bearing reaction.
The displacement of the loaded anchor was measured with a pair of DC-operated linear
variable differential transformers (LVDTs). As shown in Figure 4-7, the LVDTs were
mounted on the sides of the hydraulic ram. As the inner cylinder of the ram moved
upward, the LVDTs measured displacement relative to a steel plate mounted on top of
the load cell.
Voltages from the load cell and LVDTs were read and recorded by a Hewlett Packard
3497A data acquisition system.
31 This was connected to a Club 386 personal computer equipped with a Hewlett Packard
I/O interface card. A computer program written in Hewlett Packard Basic stored the
voltage readings from the data acquisition system in an ASCII file. The ASCII file was
read by a spreadsheet program to average the readings from the LVDTs and produce
load-deflection plots.
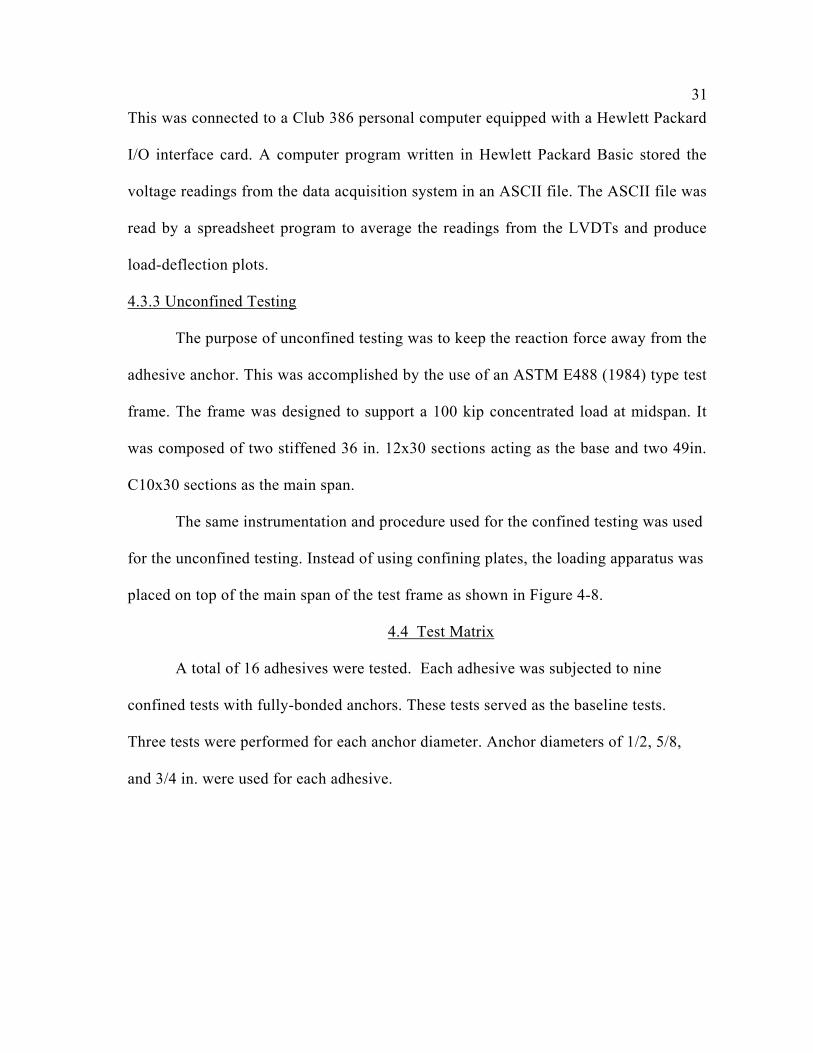
4.3.3 Unconfined Testing
The purpose of unconfined testing was to keep the reaction force away from the
adhesive anchor. This was accomplished by the use of an ASTM E488 (1984) type test
frame. The frame was designed to support a 100 kip concentrated load at midspan. It
was composed of two stiffened 36 in. 12x30 sections acting as the base and two 49in.
C10x30 sections as the main span.
The same instrumentation and procedure used for the confined testing was used
for the unconfined testing. Instead of using confining plates, the loading apparatus was
placed on top of the main span of the test frame as shown in Figure 4-8.
4.4 Test Matrix
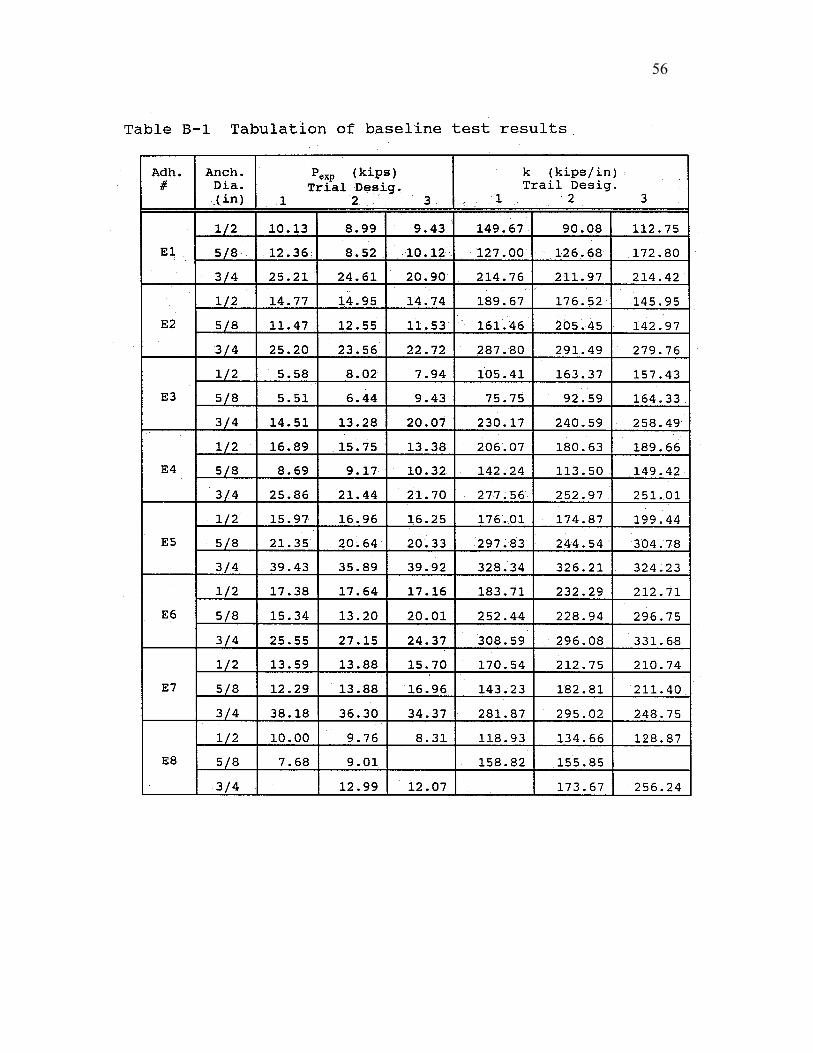
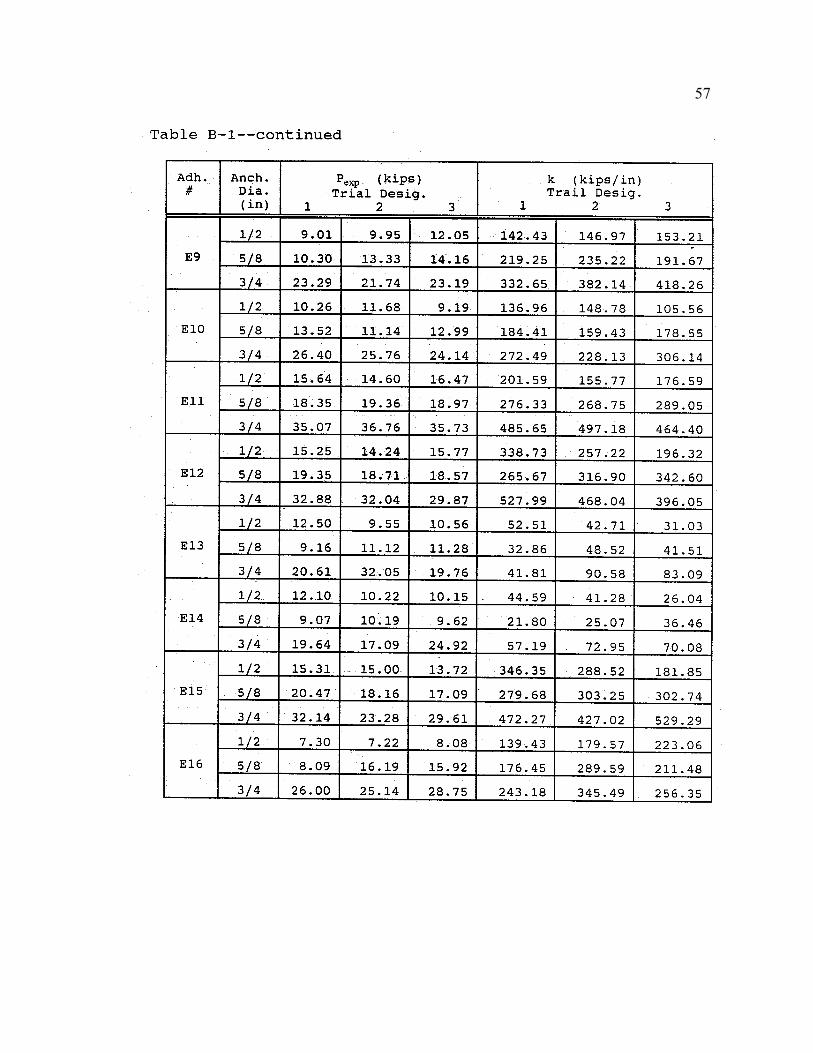
A total of 16 adhesives were tested. Each adhesive was subjected to nine
confined tests with fully-bonded anchors. These tests served as the baseline tests.
Three tests were performed for each anchor diameter. Anchor diameters of 1/2, 5/8,
and 3/4 in. were used for each adhesive.
32
Confined testing with partially bonded anchors and unconfined testing with both
fully and partially-bonded anchors were performed to compare with the baseline tests.
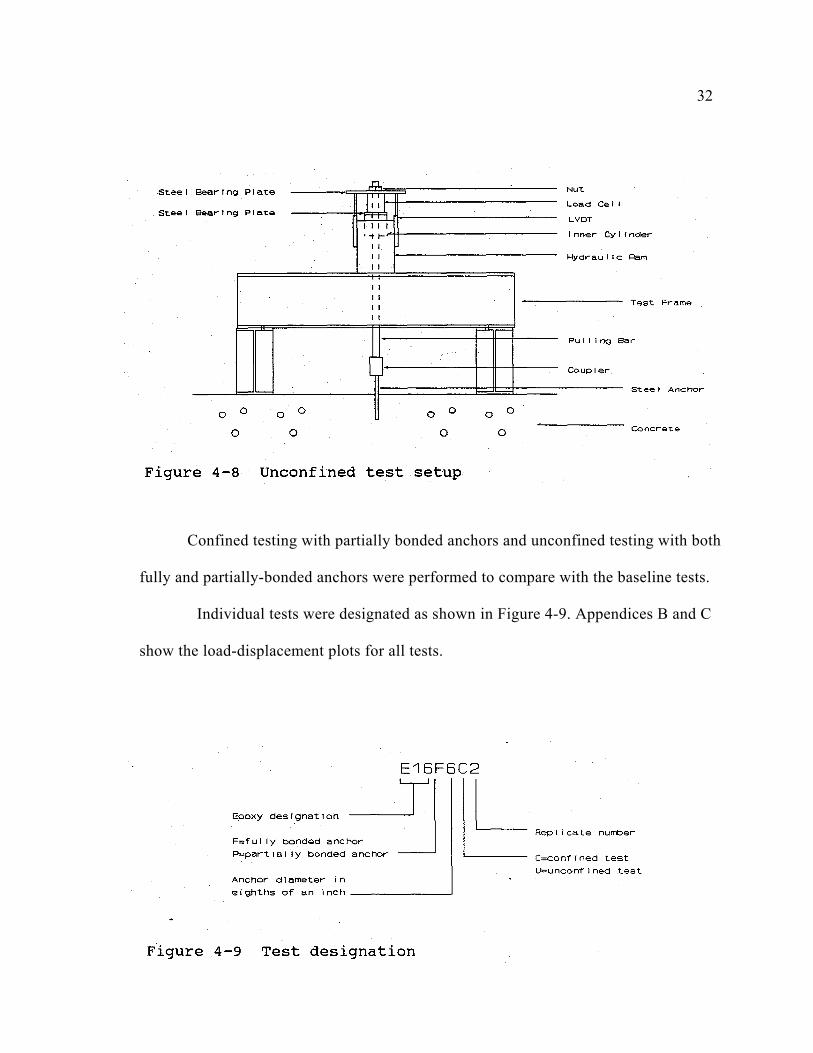
Individual tests were designated as shown in Figure 4-9. Appendices B and C
show the load-displacement plots for all tests.
CHAPTER 5
TEST RESULTS
5.1 General
In this chapter, the failure modes for the adhesive anchors are presented.
Comparisons are made between the failure characteristics of the baseline and the
non-baseline tests.
5.2 Failure Modes
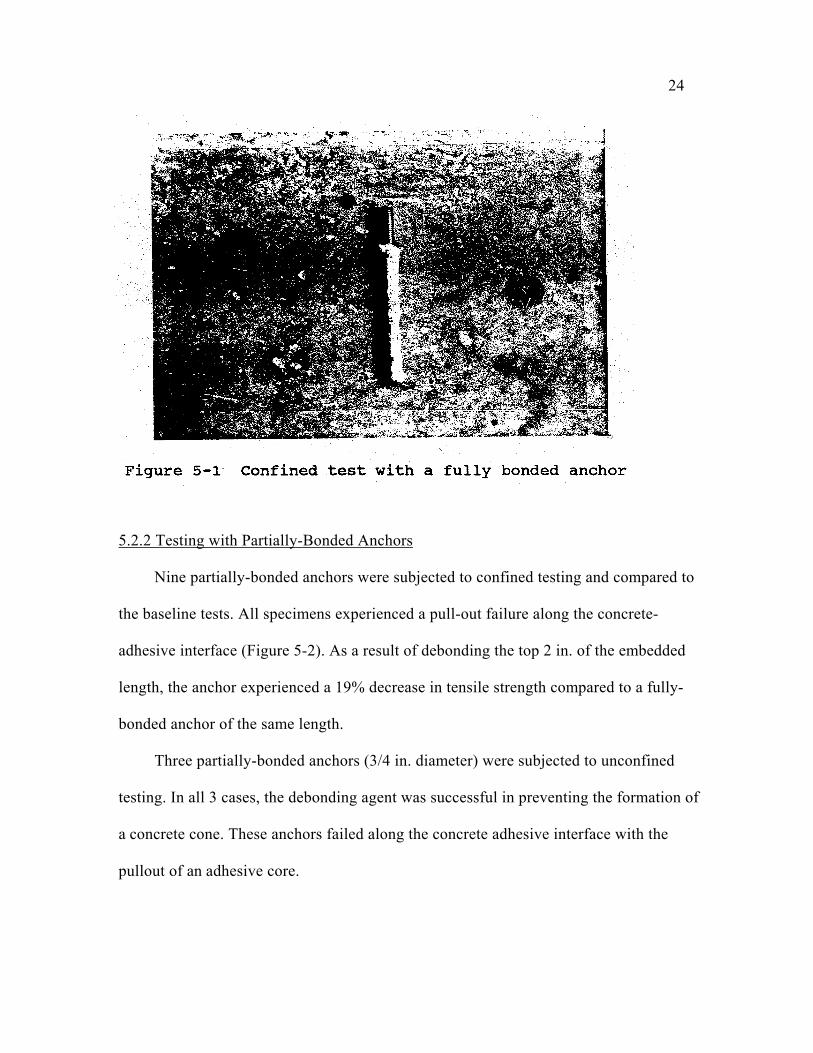
5.2.1 Confined Testing and Fully-Bonded Anchors
Fully-bonded adhesive anchors subject to confined testing usually experienced a
pull-out failure along the concrete adhesive interface. Characteristics of this type of
failure consist of an adhesive core without cone formation (Figure 51). Two tests out
of the 144 experienced fracture of the steel anchor. In both of these cases, the anchor
was 1/2in. in diameter and no displacement of the adhesive was noticeable at the
surface of the concrete. Both of these tests were both repeated.
23
24
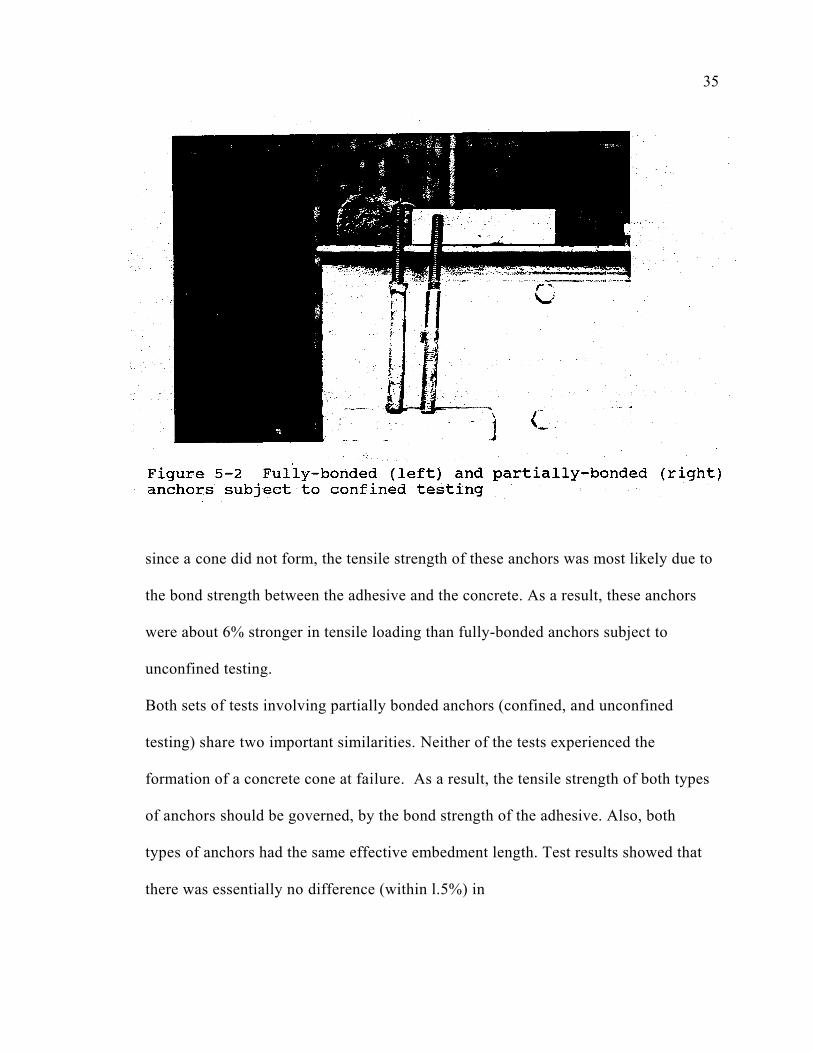
5.2.2 Testing with Partially-Bonded Anchors
Nine partially-bonded anchors were subjected to confined testing and compared to
the baseline tests. All specimens experienced a pull-out failure along the concrete-
adhesive interface (Figure 5-2). As a result of debonding the top 2 in. of the embedded
length, the anchor experienced a 19% decrease in tensile strength compared to a fully-
bonded anchor of the same length.
Three partially-bonded anchors (3/4 in. diameter) were subjected to unconfined
testing. In all 3 cases, the debonding agent was successful in preventing the formation of
a concrete cone. These anchors failed along the concrete adhesive interface with the
pullout of an adhesive core.
35
since a cone did not form, the tensile strength of these anchors was most likely due to
the bond strength between the adhesive and the concrete. As a result, these anchors
were about 6% stronger in tensile loading than fully-bonded anchors subject to
unconfined testing.
Both sets of tests involving partially bonded anchors (confined, and unconfined
testing) share two important similarities. Neither of the tests experienced the
formation of a concrete cone at failure. As a result, the tensile strength of both types
of anchors should be governed, by the bond strength of the adhesive. Also, both
types of anchors had the same effective embedment length. Test results showed that
there was essentially no difference (within l.5%) in
26
tensile strength between partially bonded anchors subject to confined and unconfined
testing.
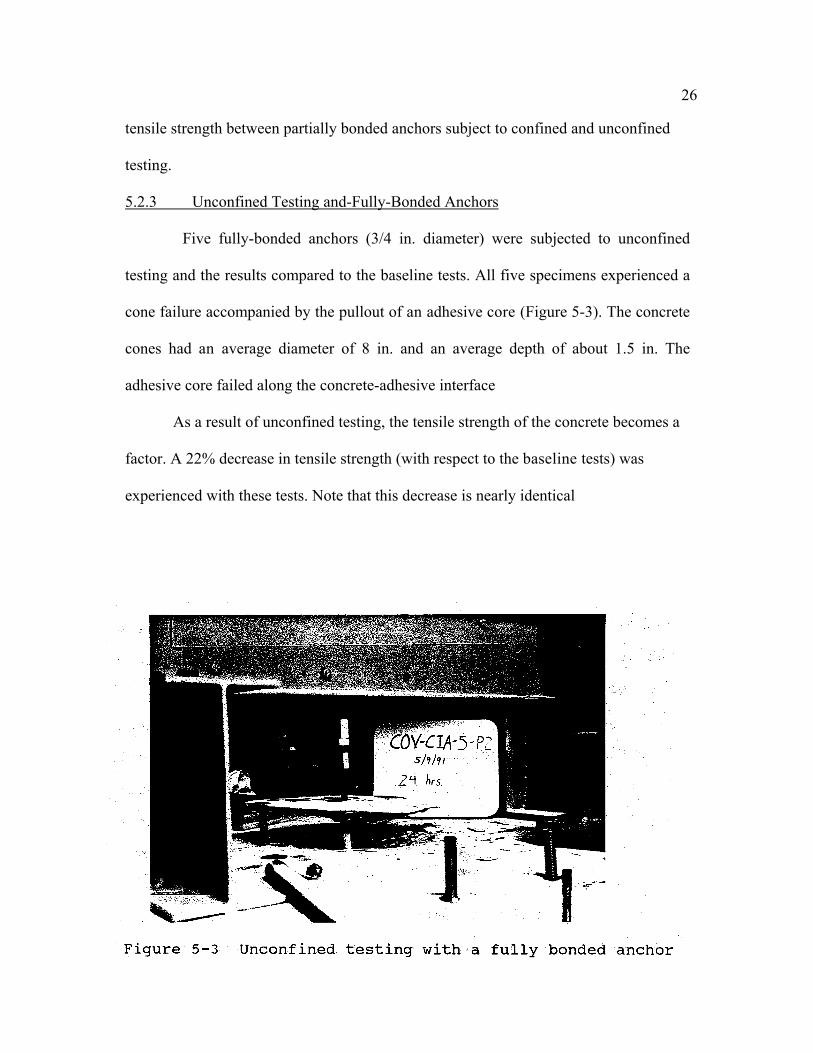
5.2.3 Unconfined Testing and-Fully-Bonded Anchors
Five fully-bonded anchors (3/4 in. diameter) were subjected to unconfined
testing and the results compared to the baseline tests. All five specimens experienced a
cone failure accompanied by the pullout of an adhesive core (Figure 5-3). The concrete
cones had an average diameter of 8 in. and an average depth of about 1.5 in. The
adhesive core failed along the concrete-adhesive interface
As a result of unconfined testing, the tensile strength of the concrete becomes a
factor. A 22% decrease in tensile strength (with respect to the baseline tests) was
experienced with these tests. Note that this decrease is nearly identical
37 to that obtained with a partially-bonded anchor of the same length.
This agrees with the Texas tests (Doerr et al., 1989) which showed that the
strength of a partially-bonded anchor (top 2 in. debonded) is essentially the same as a
fully-bonded anchor of the same embedment length.
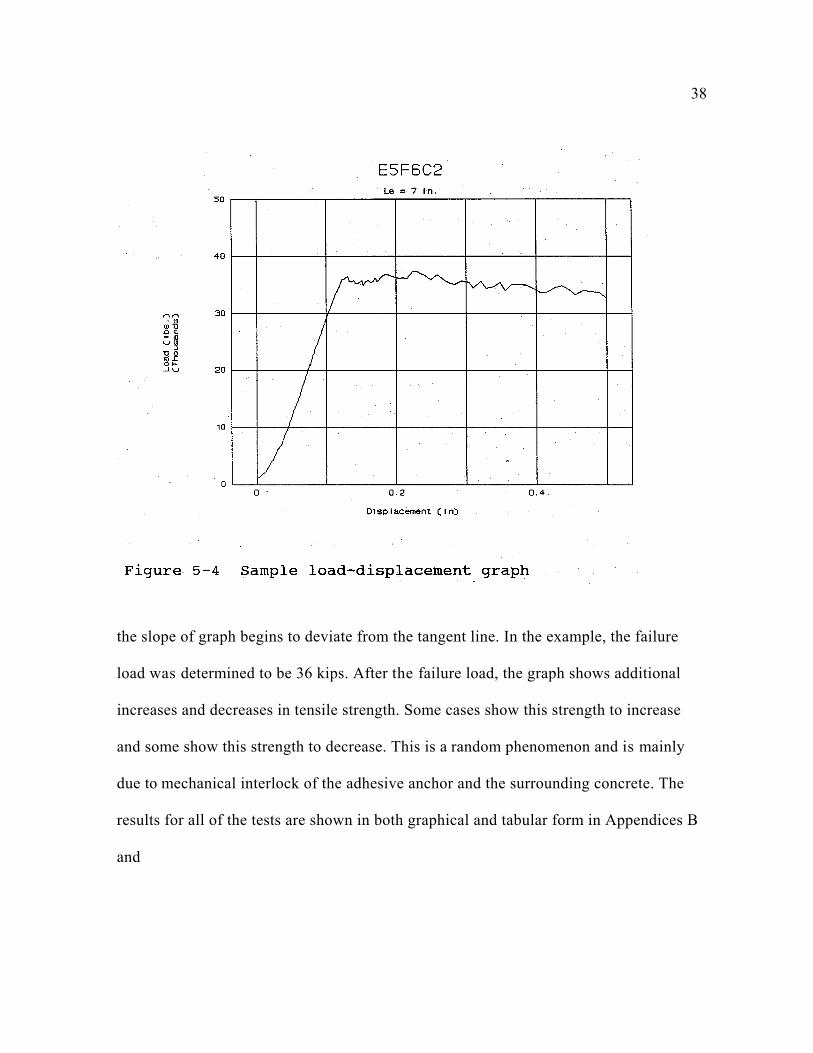
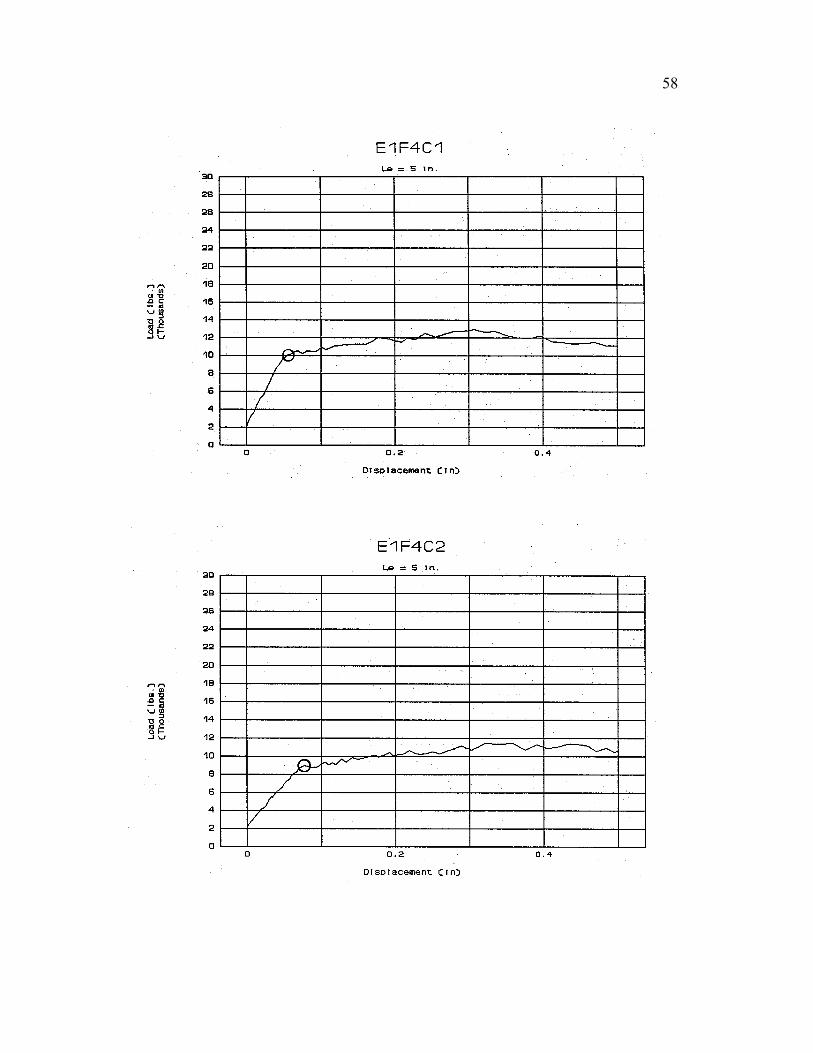
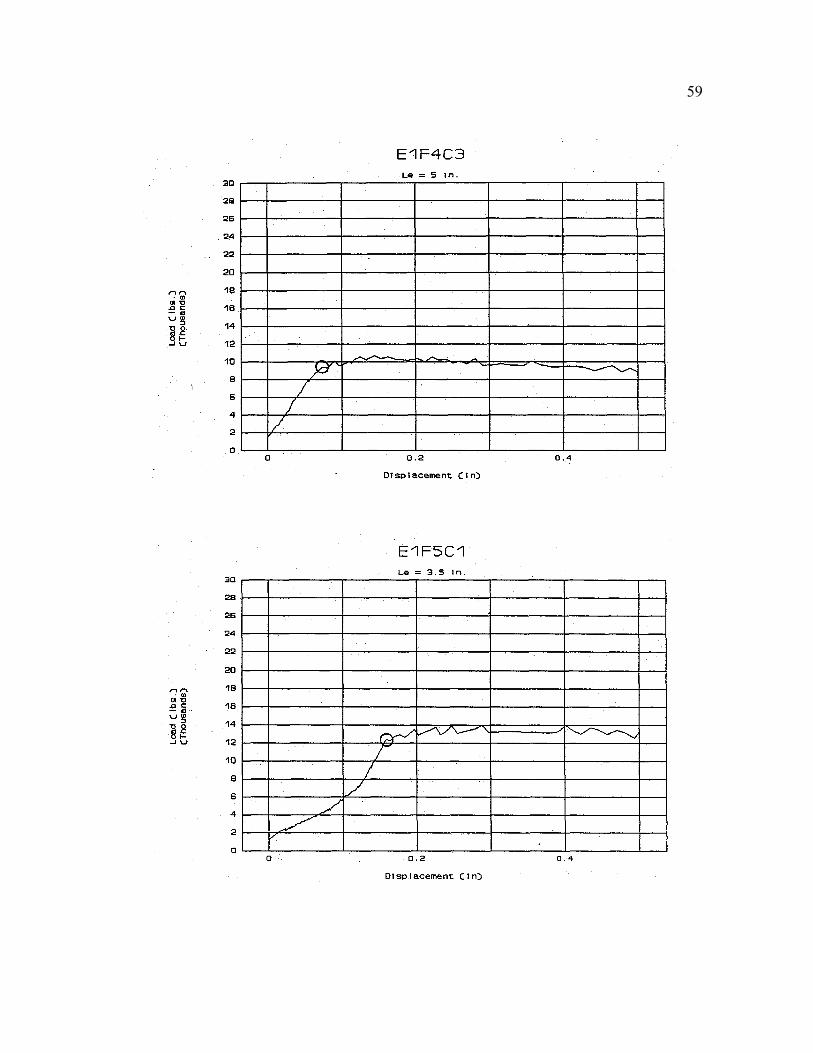
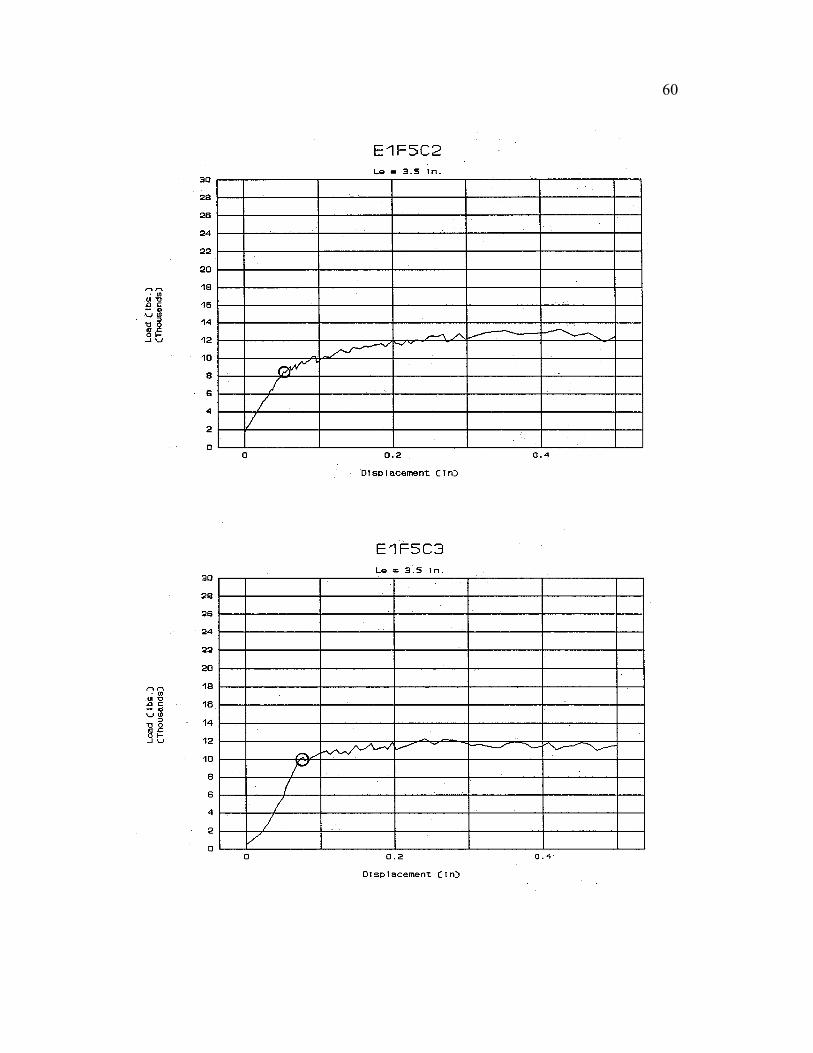
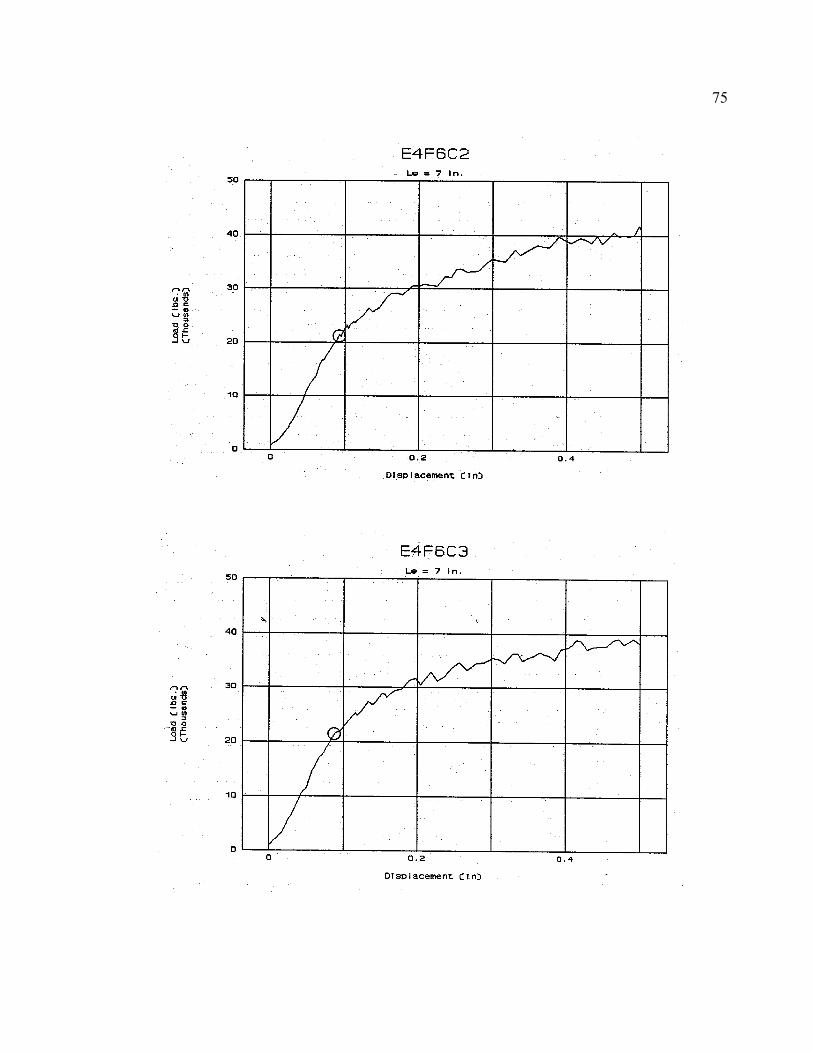
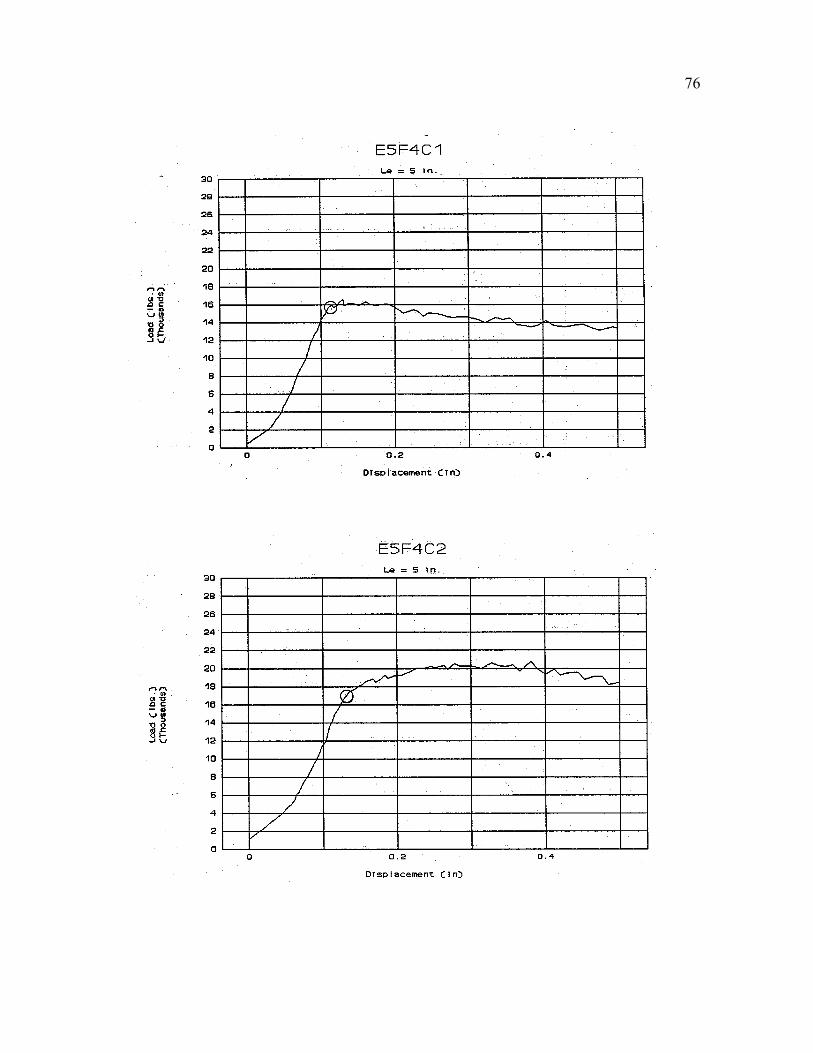
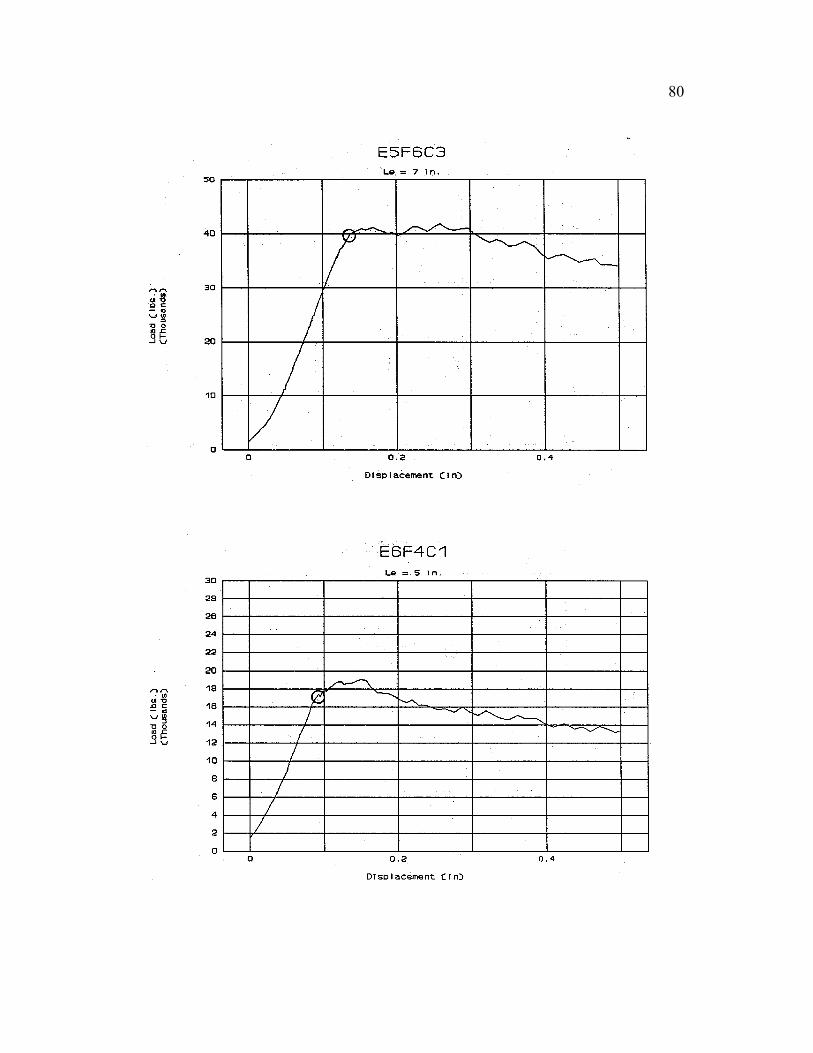
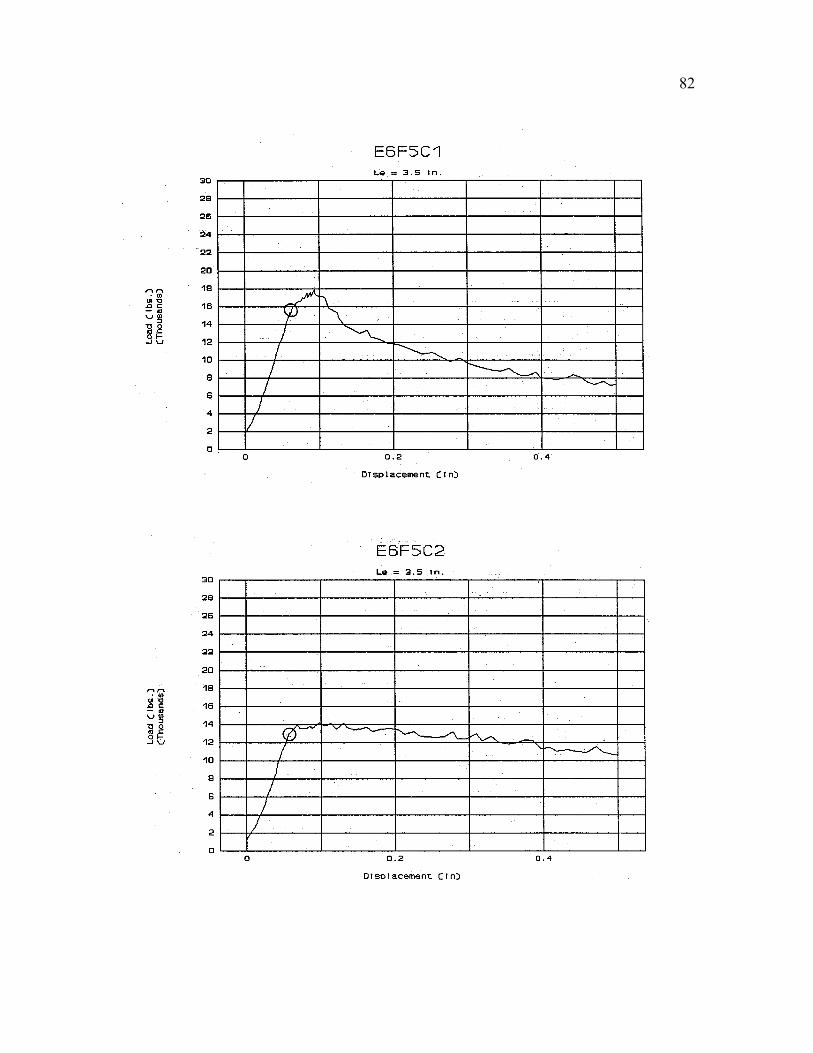
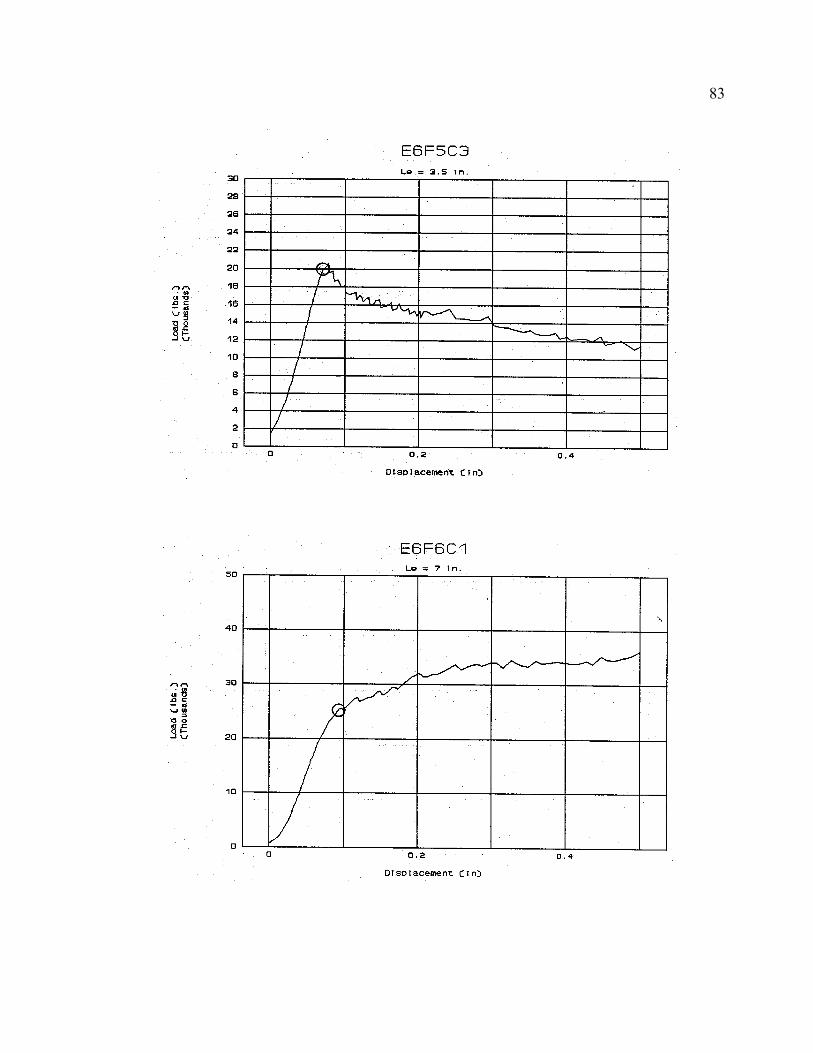
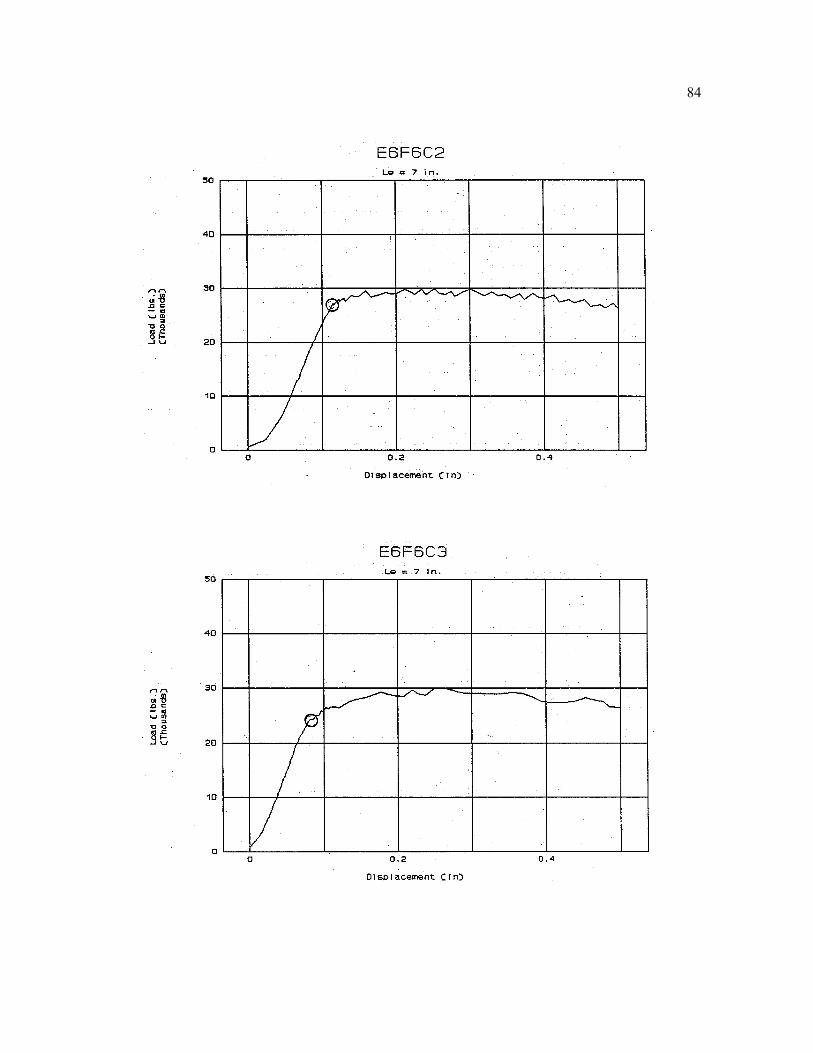
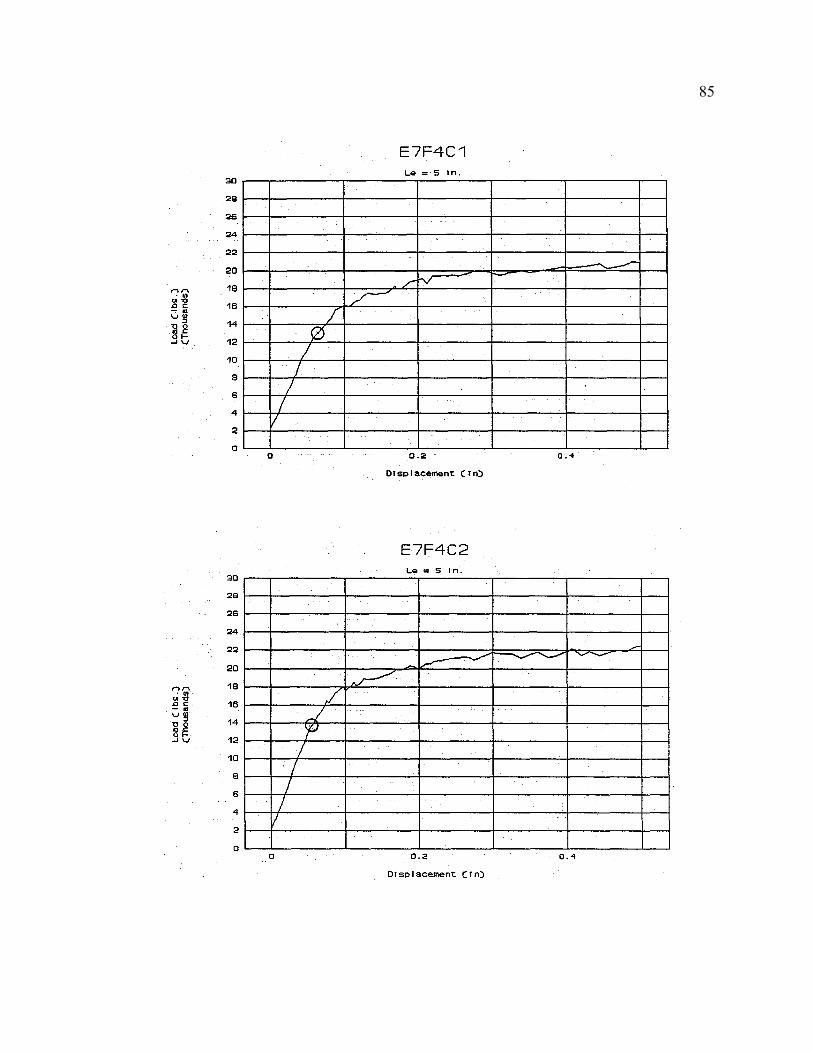
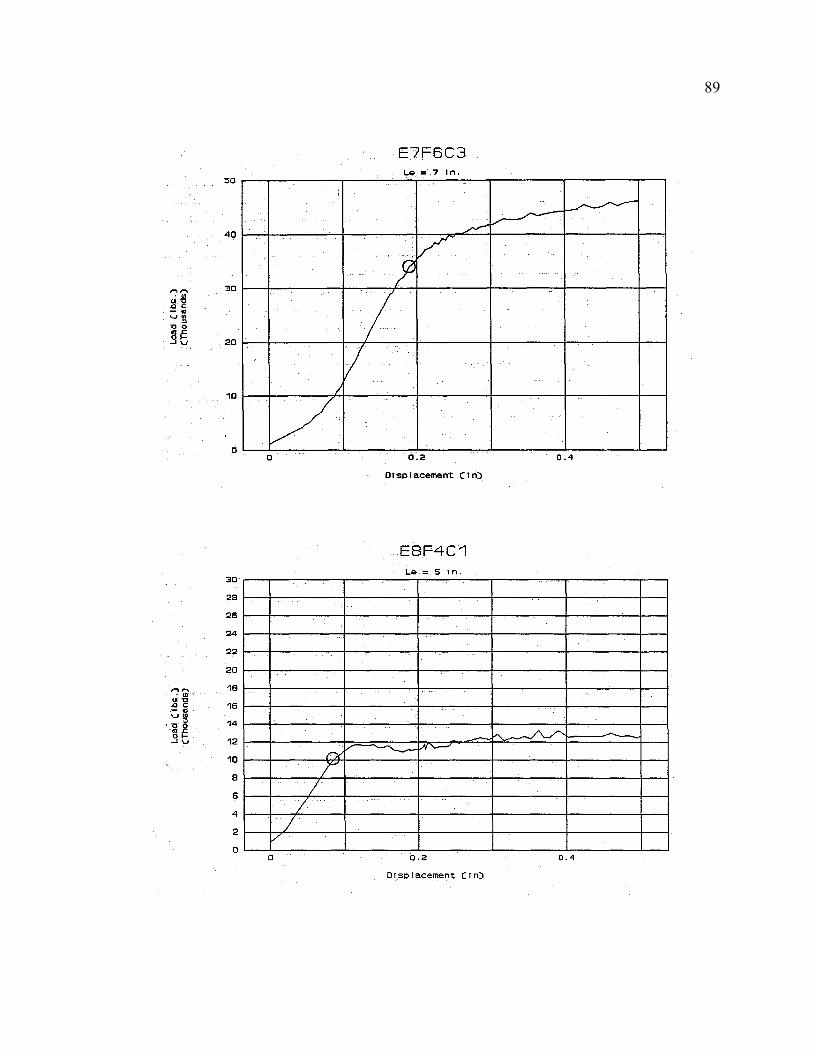
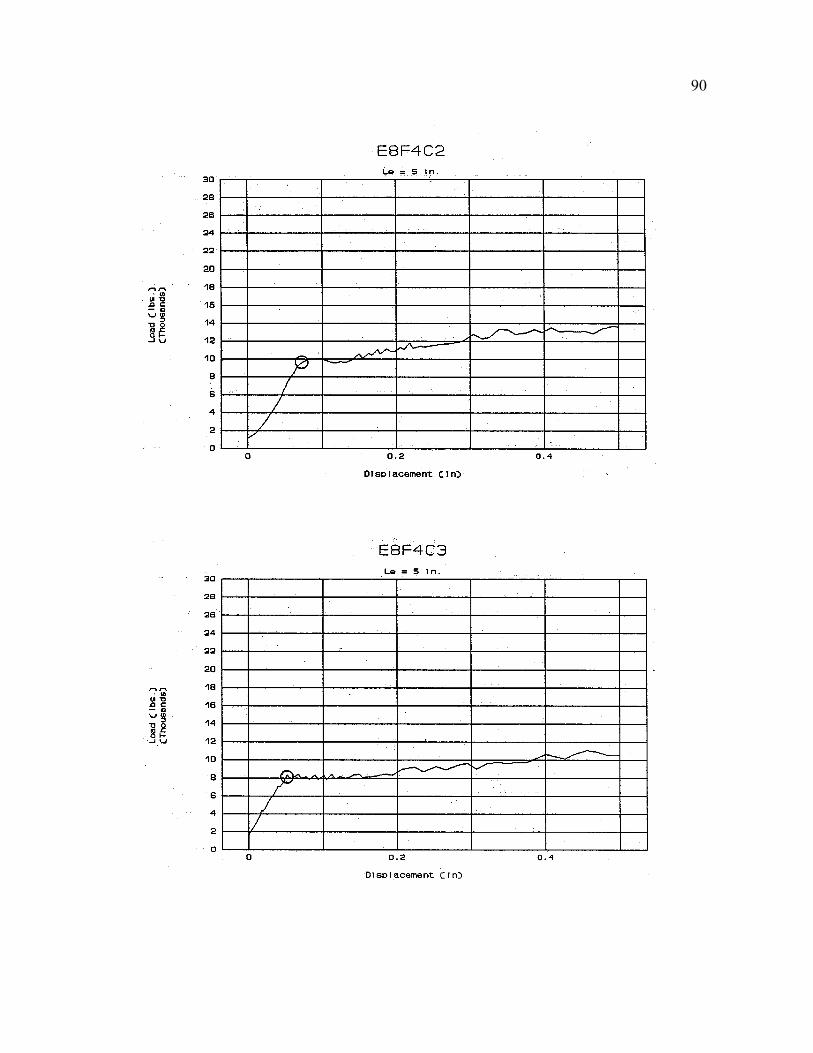
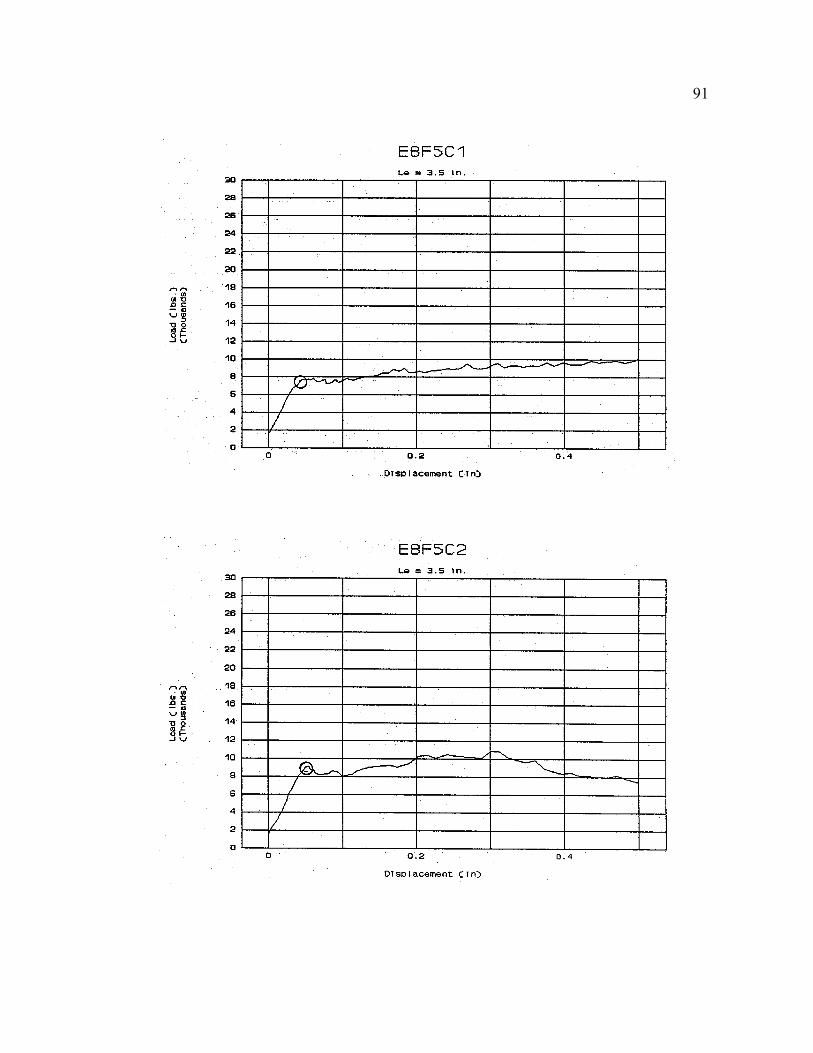
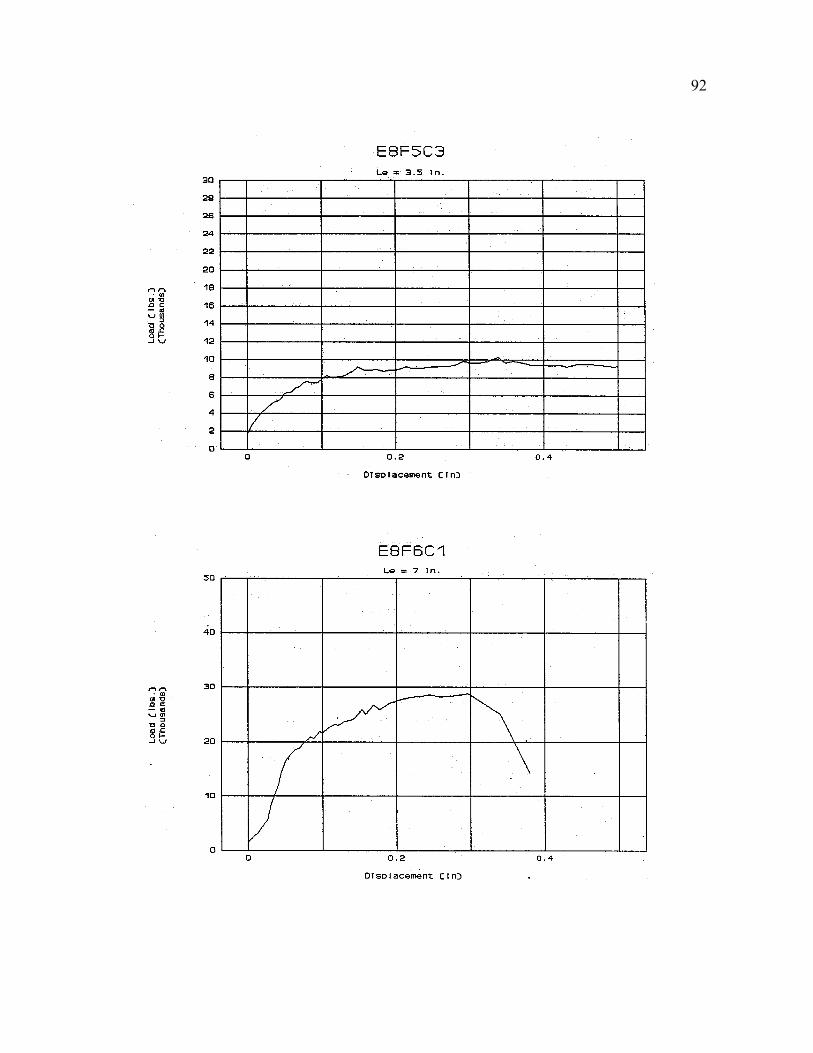
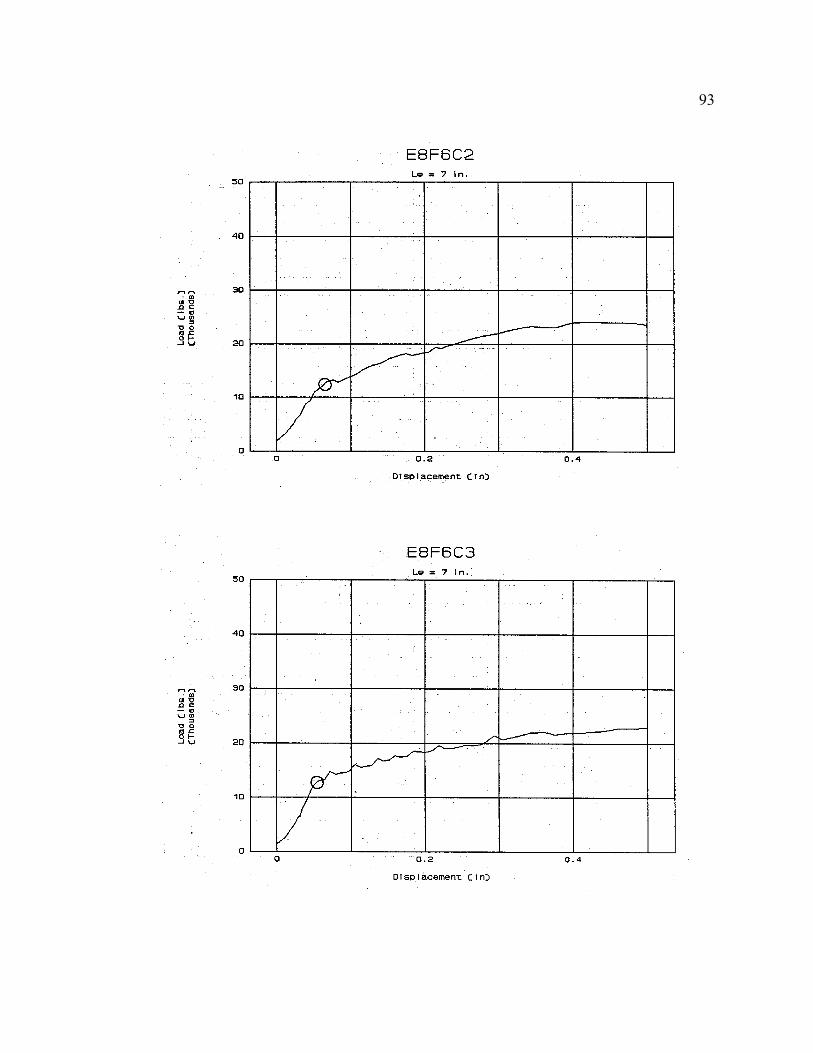
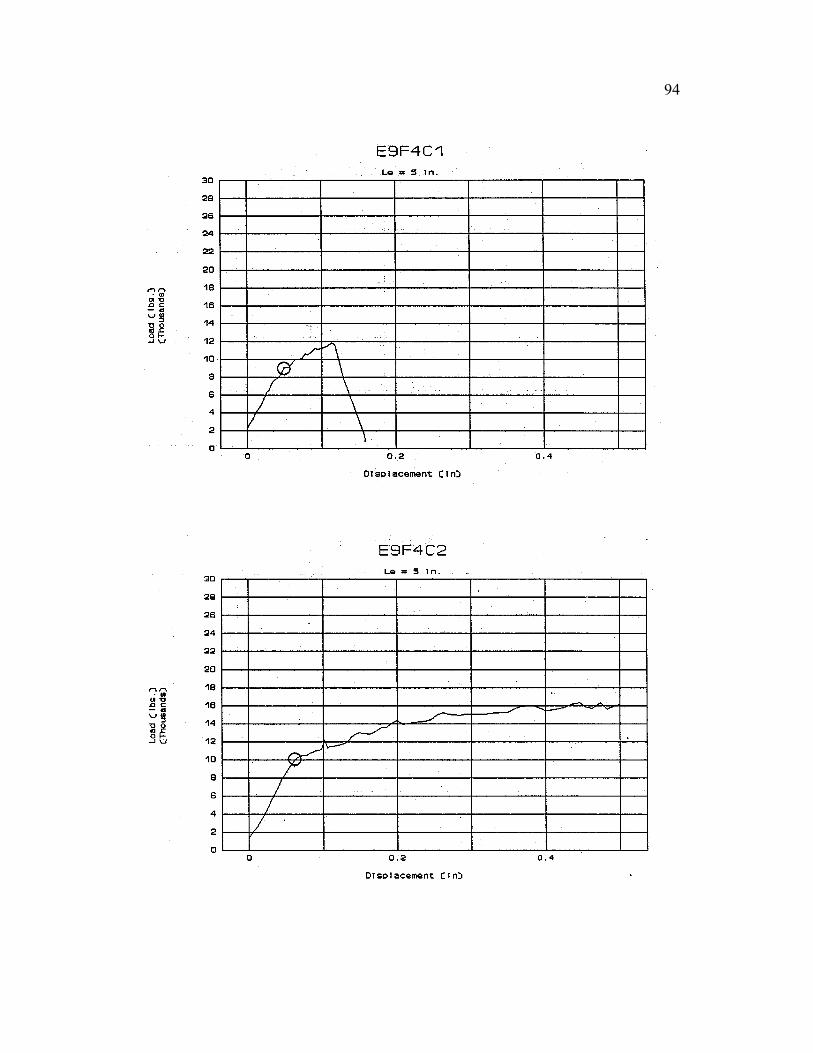
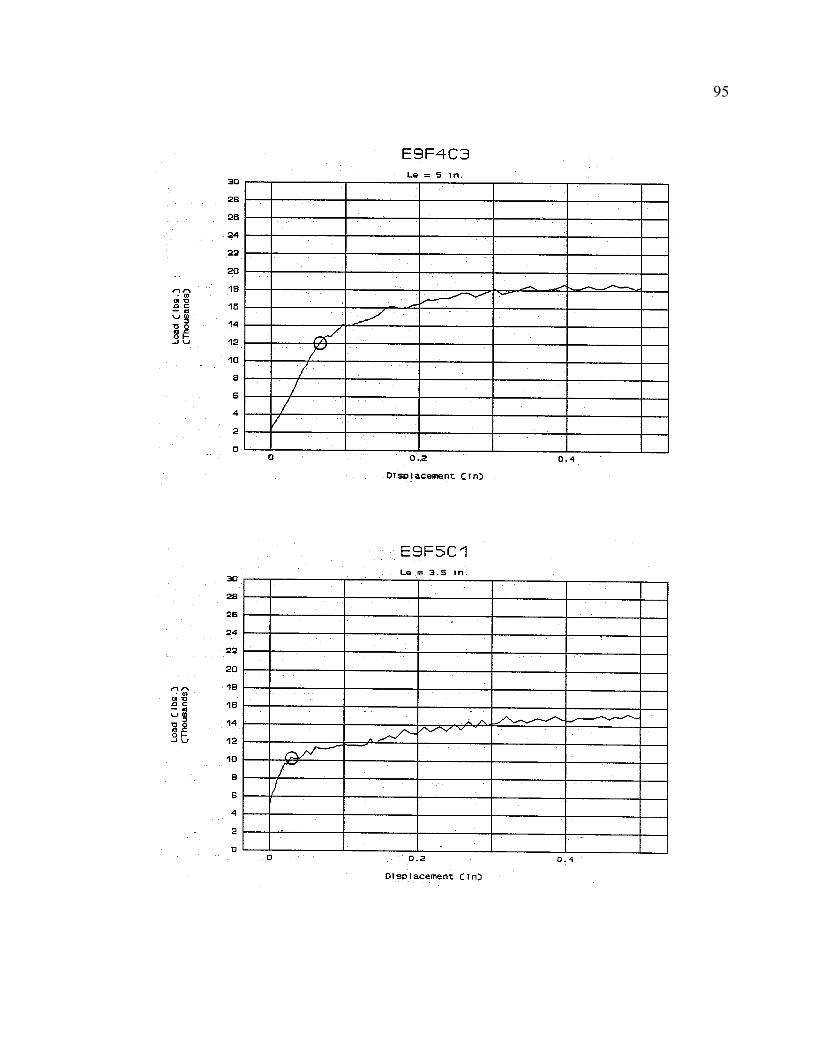
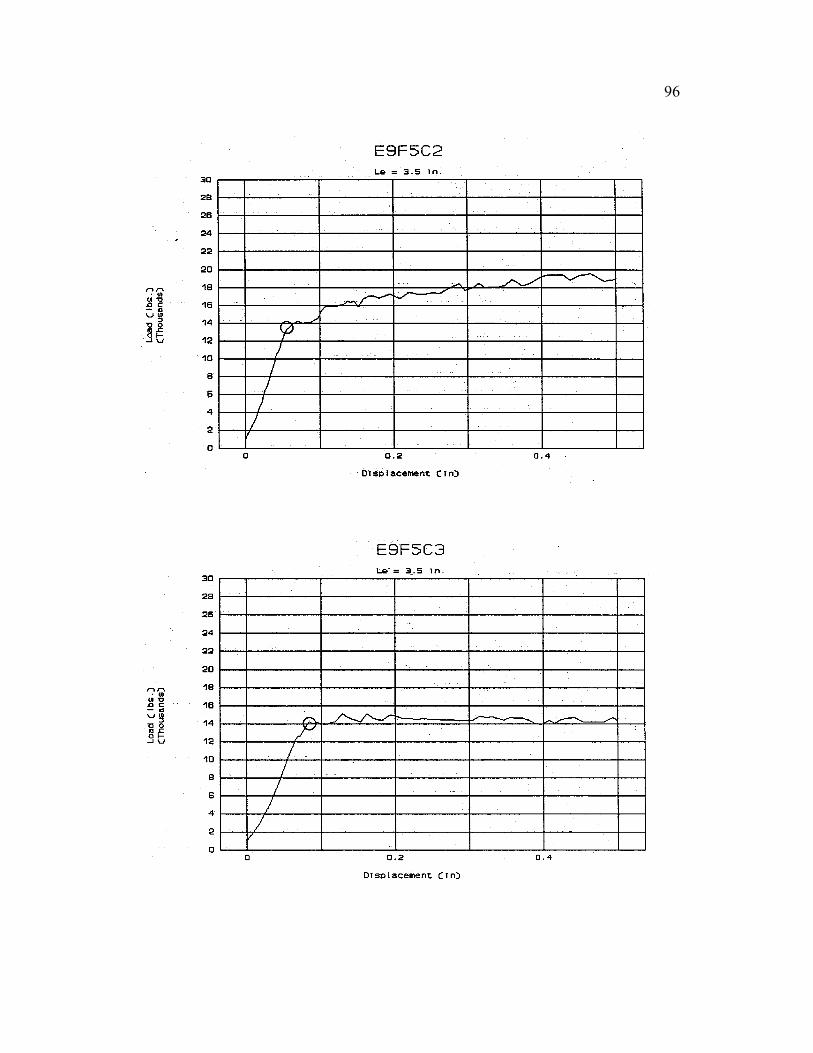
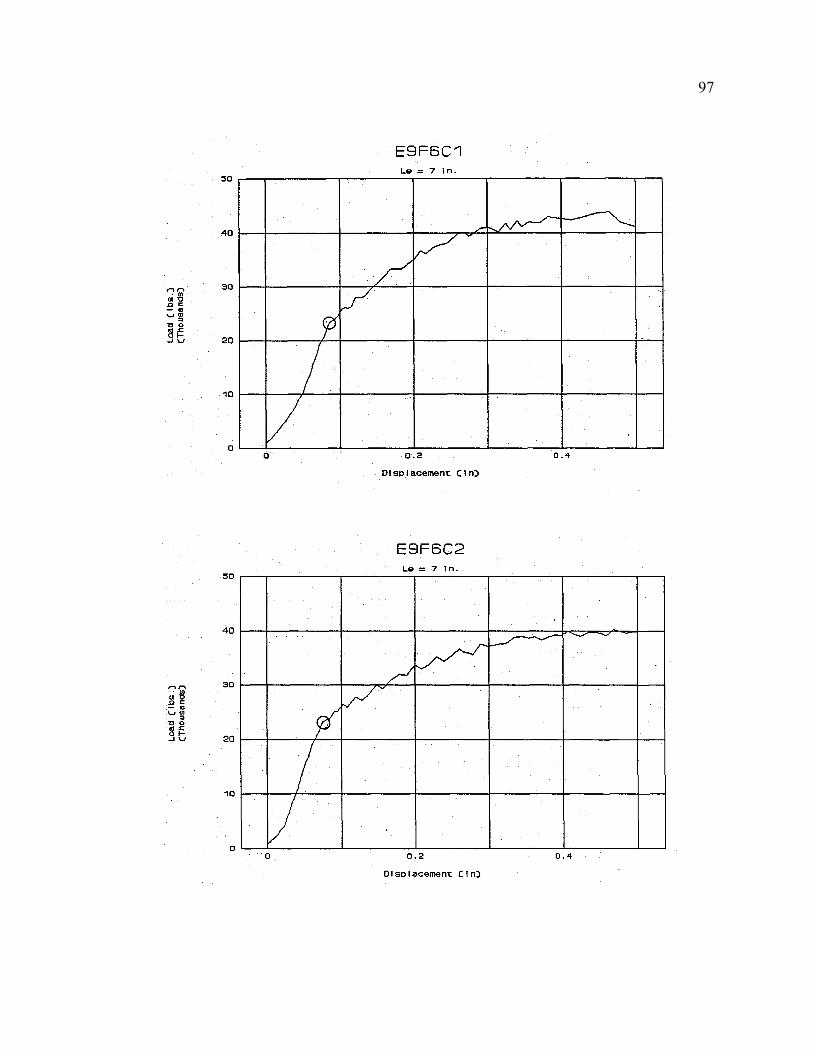
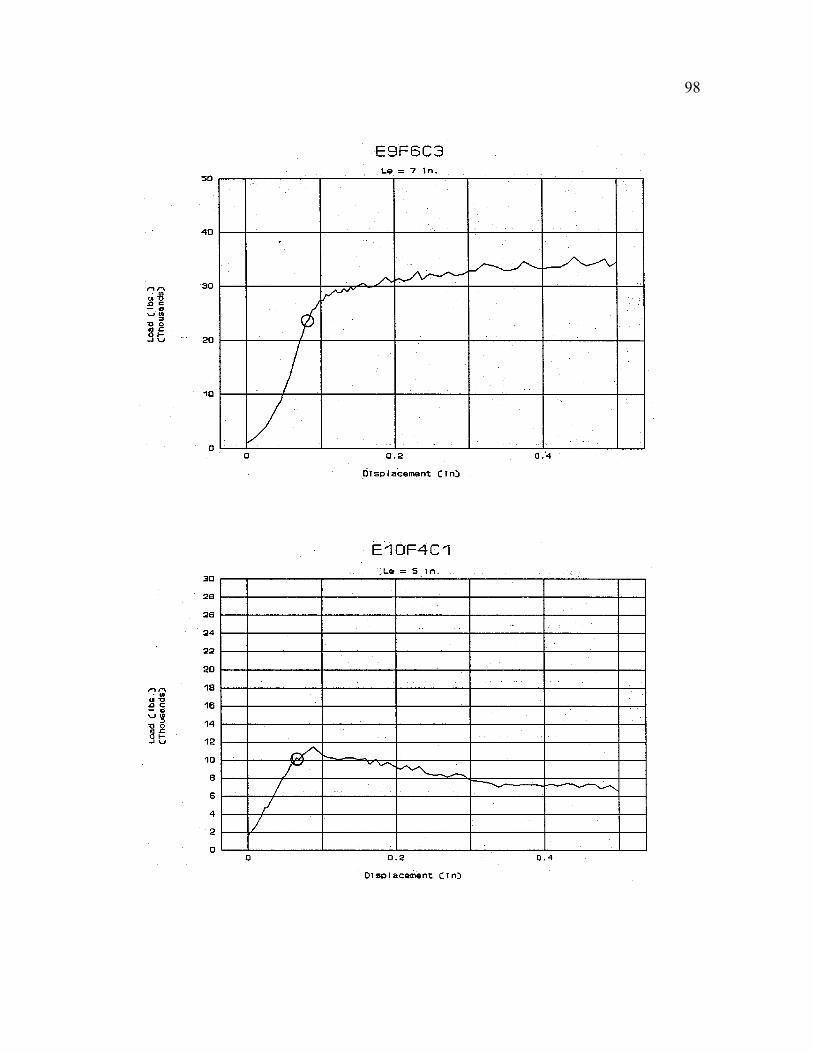
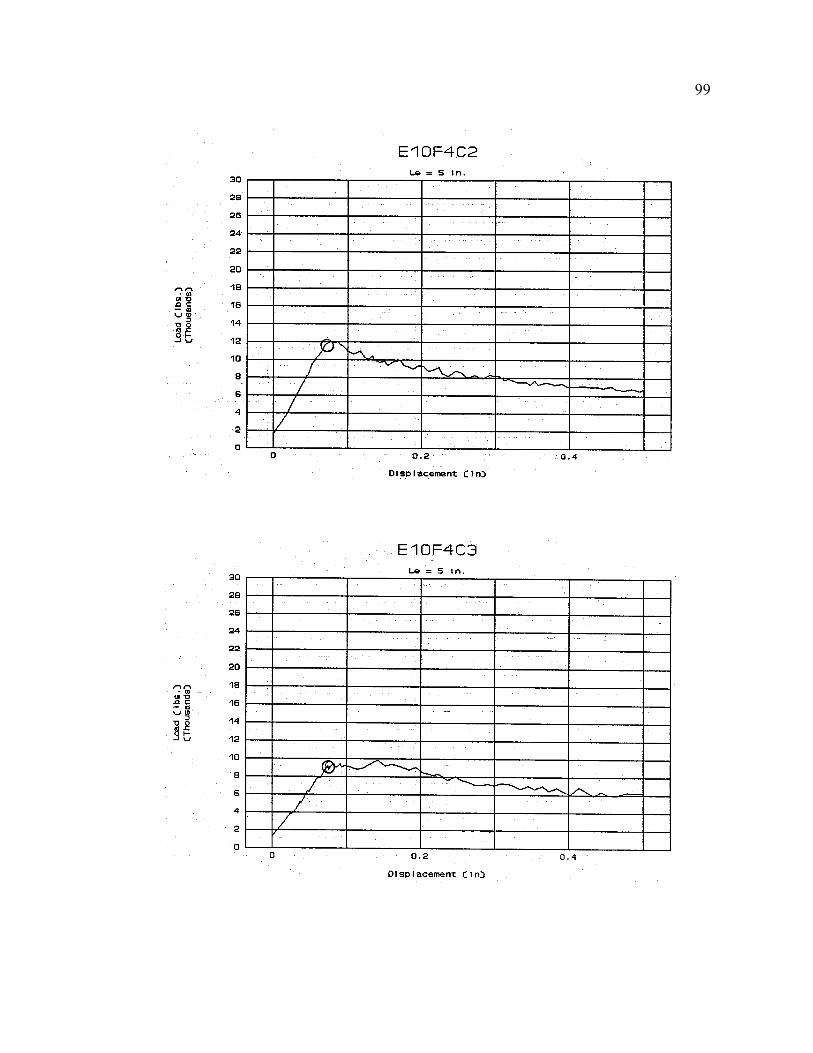
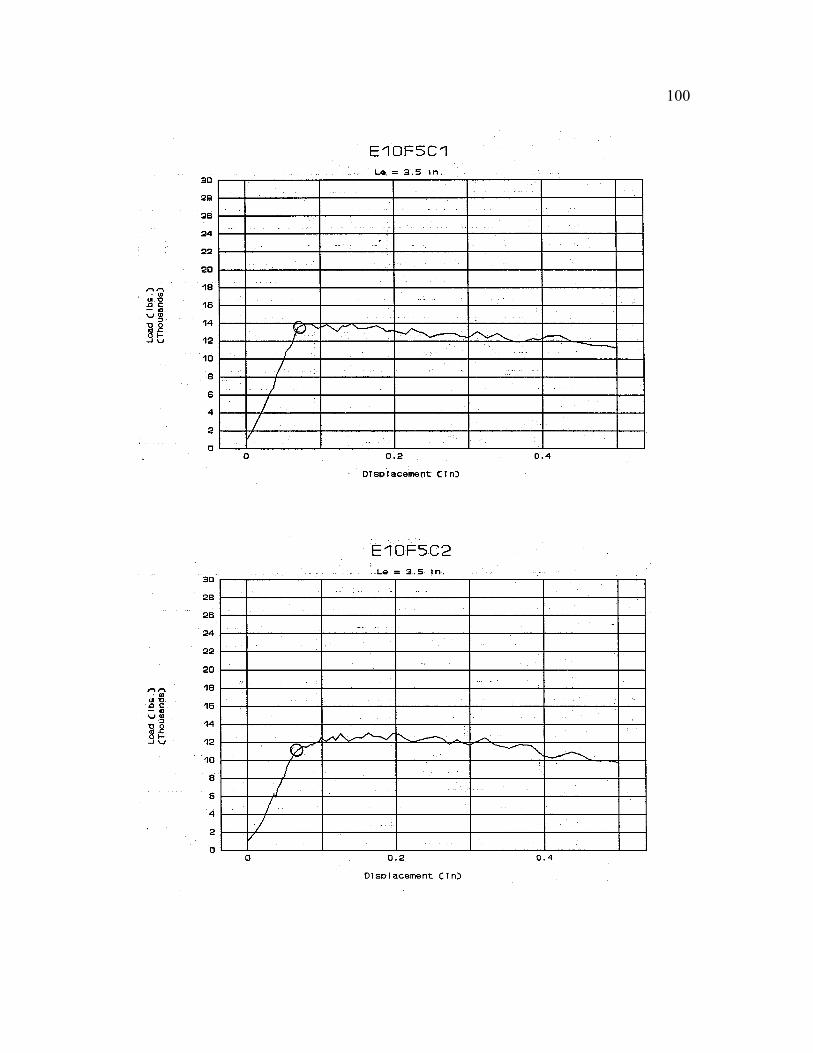
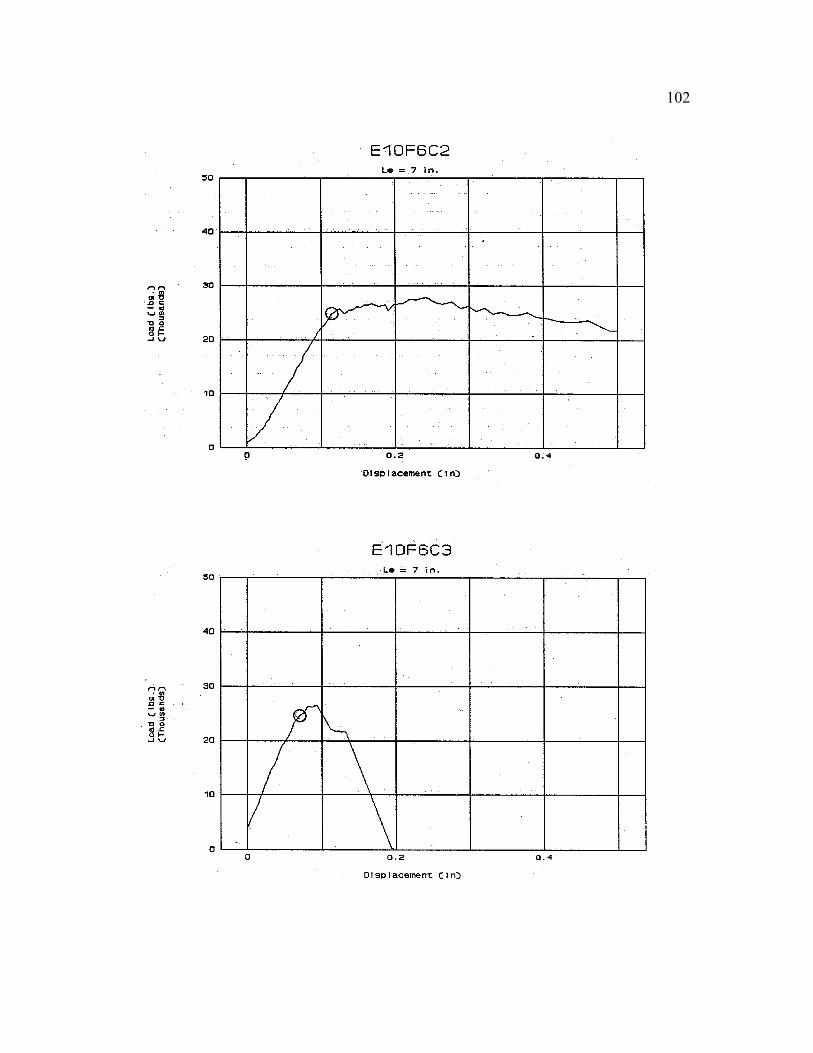
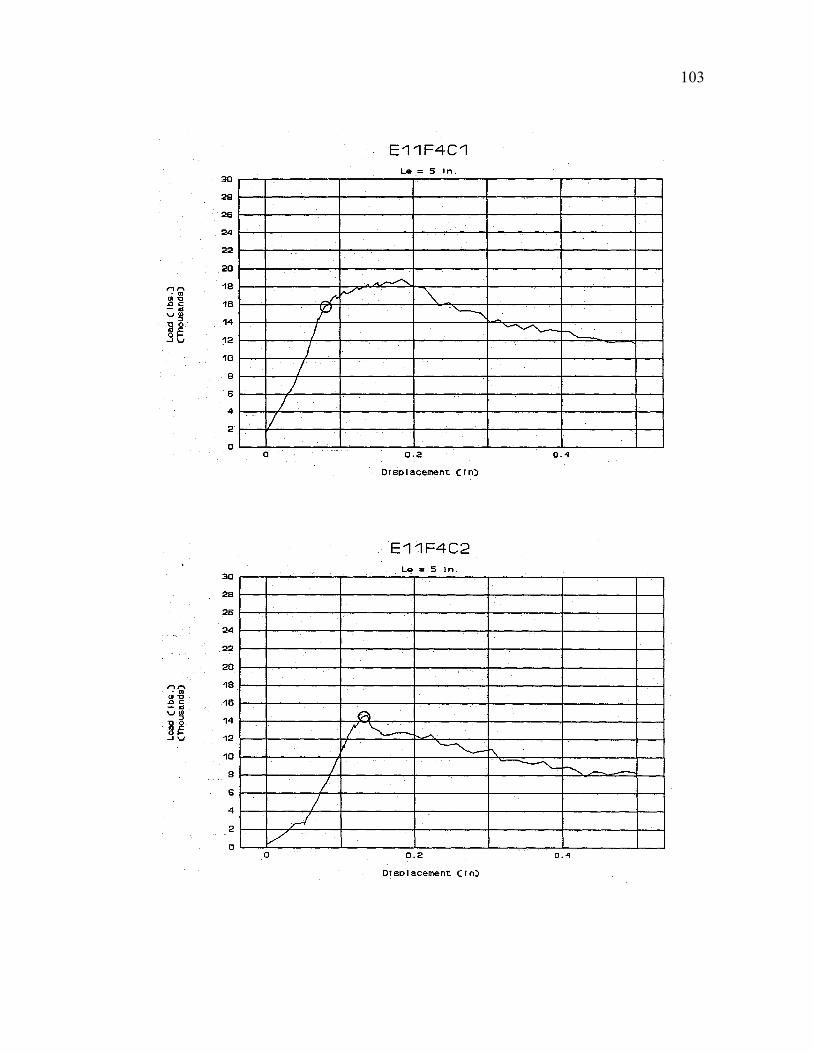
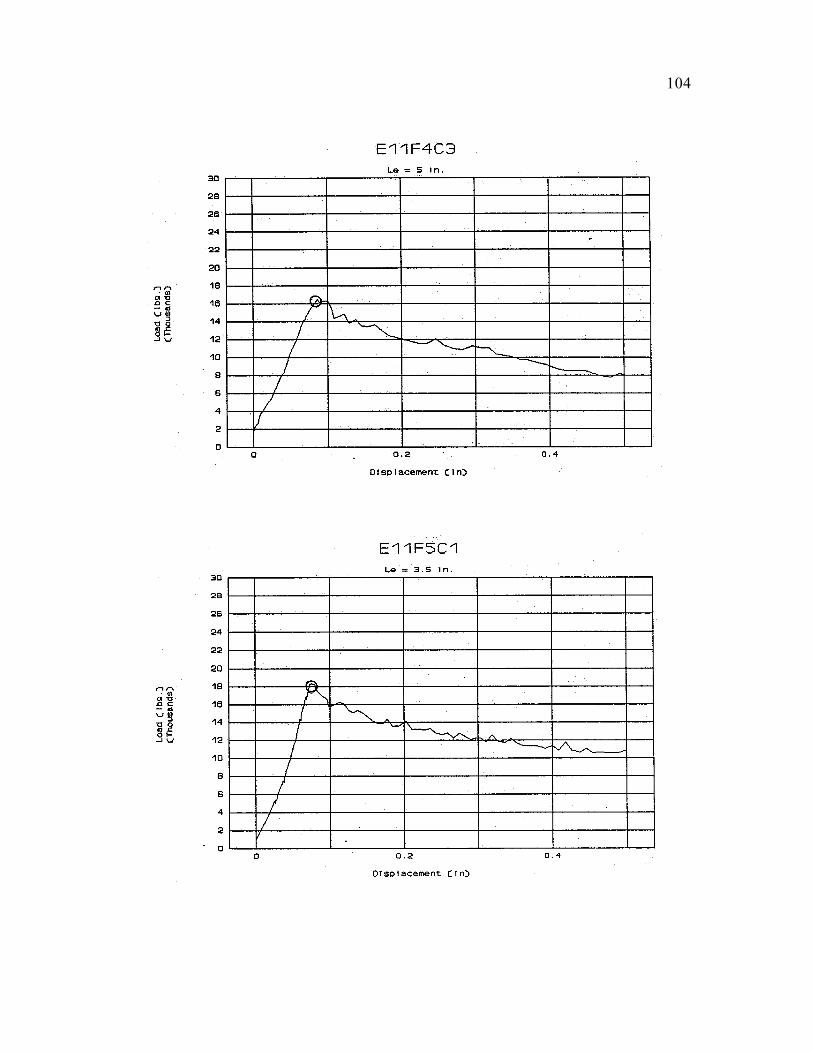
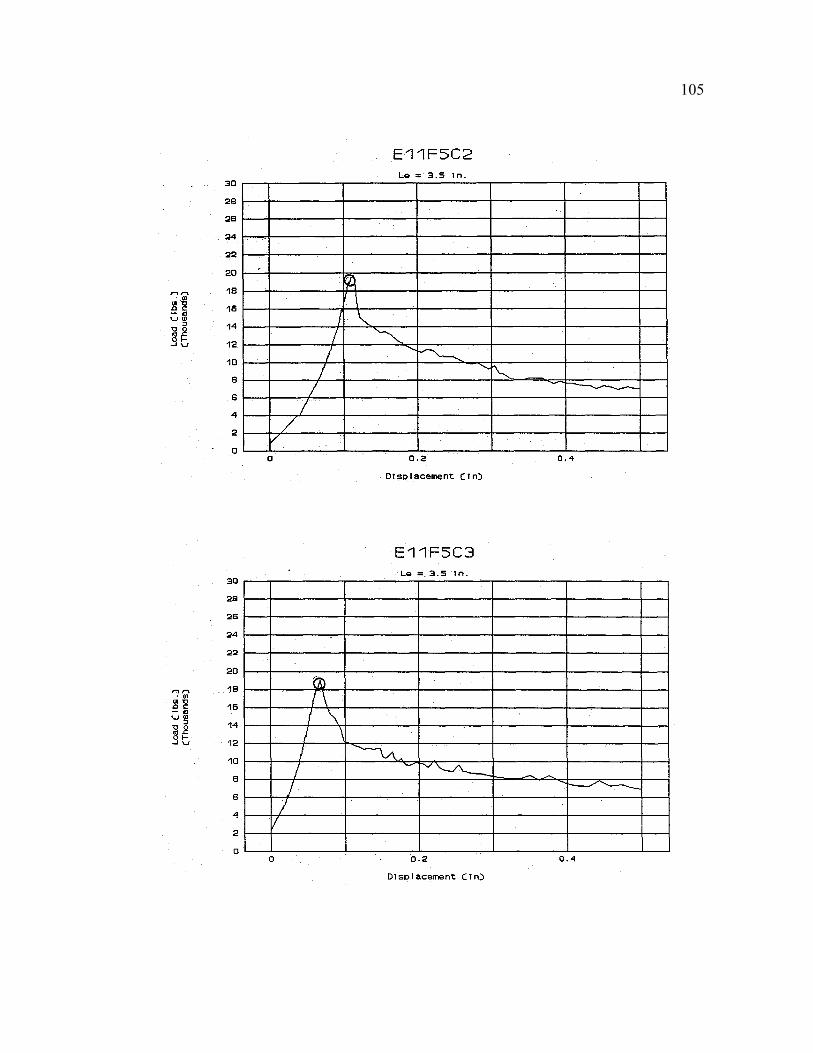
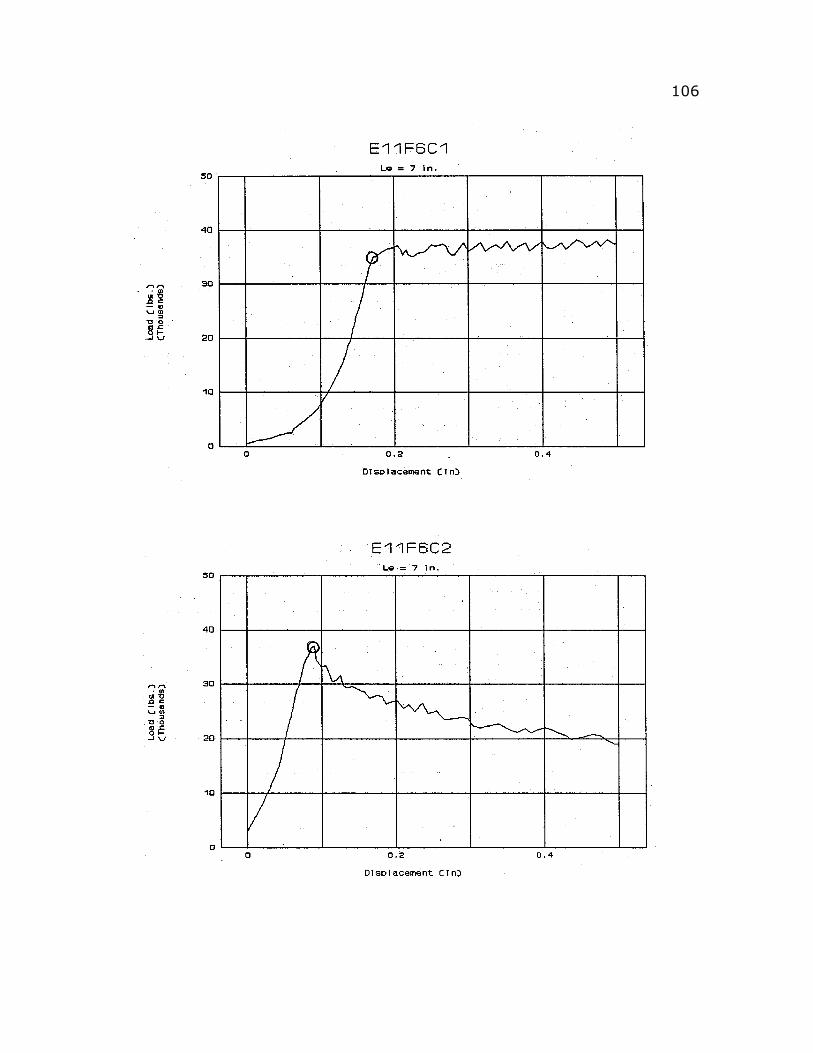
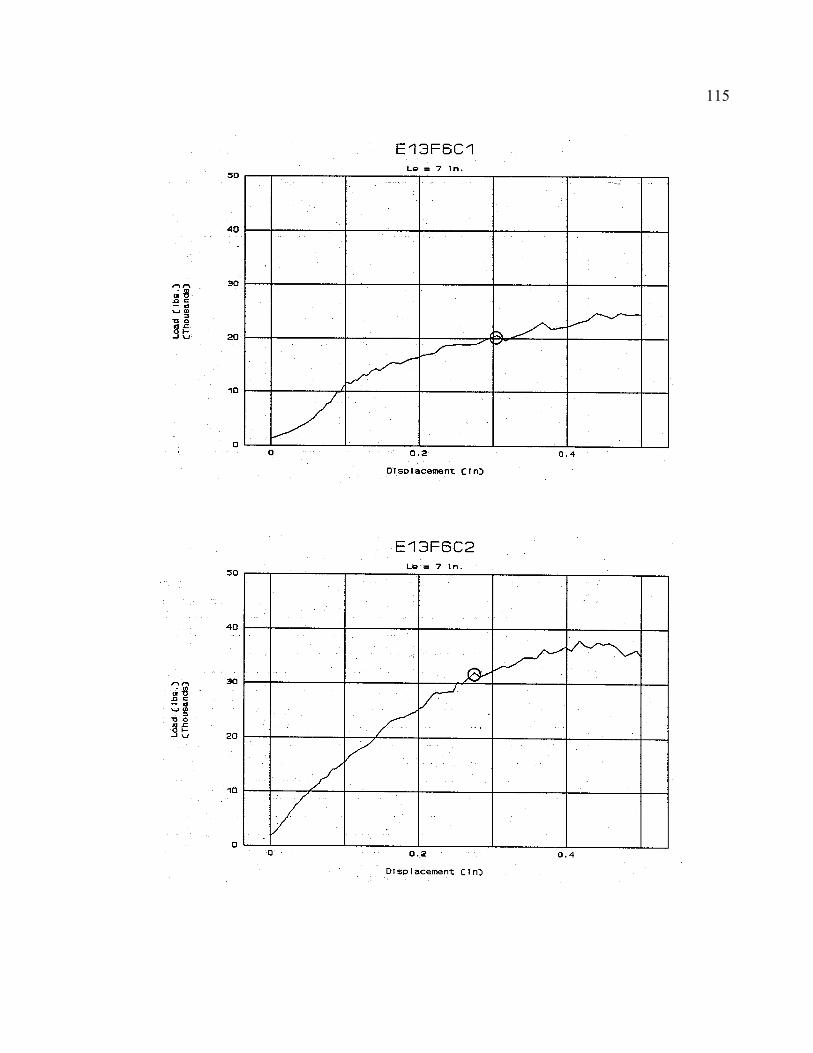
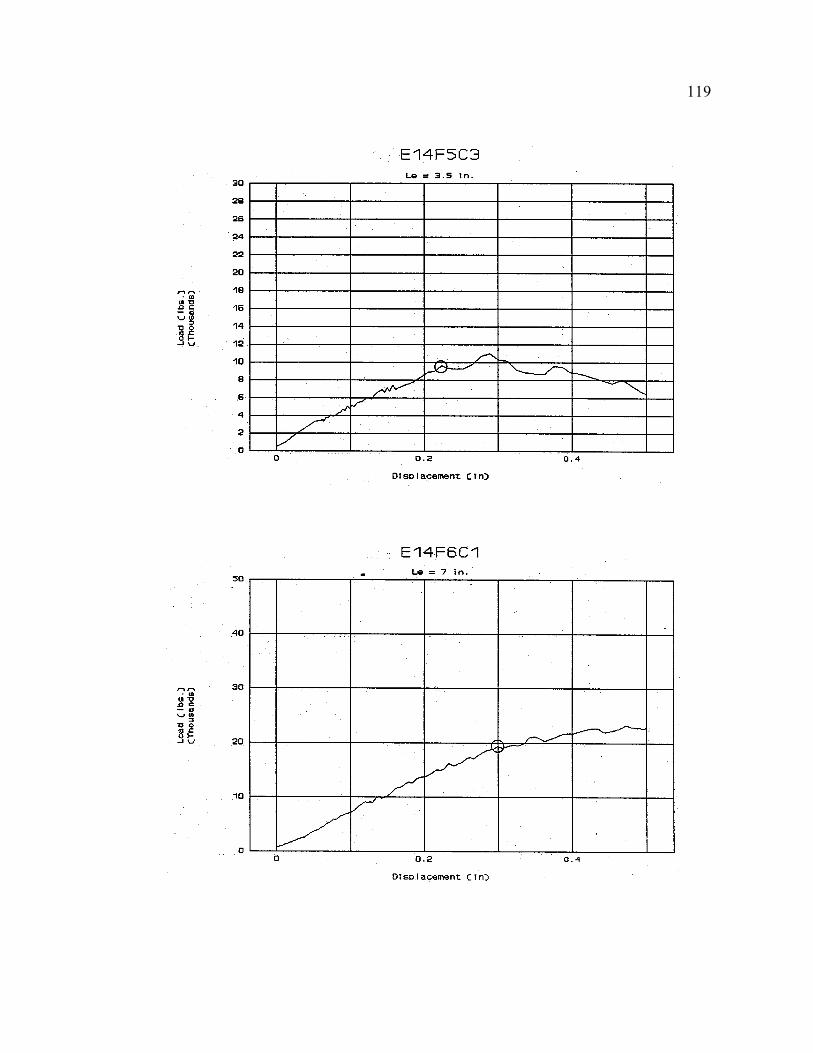
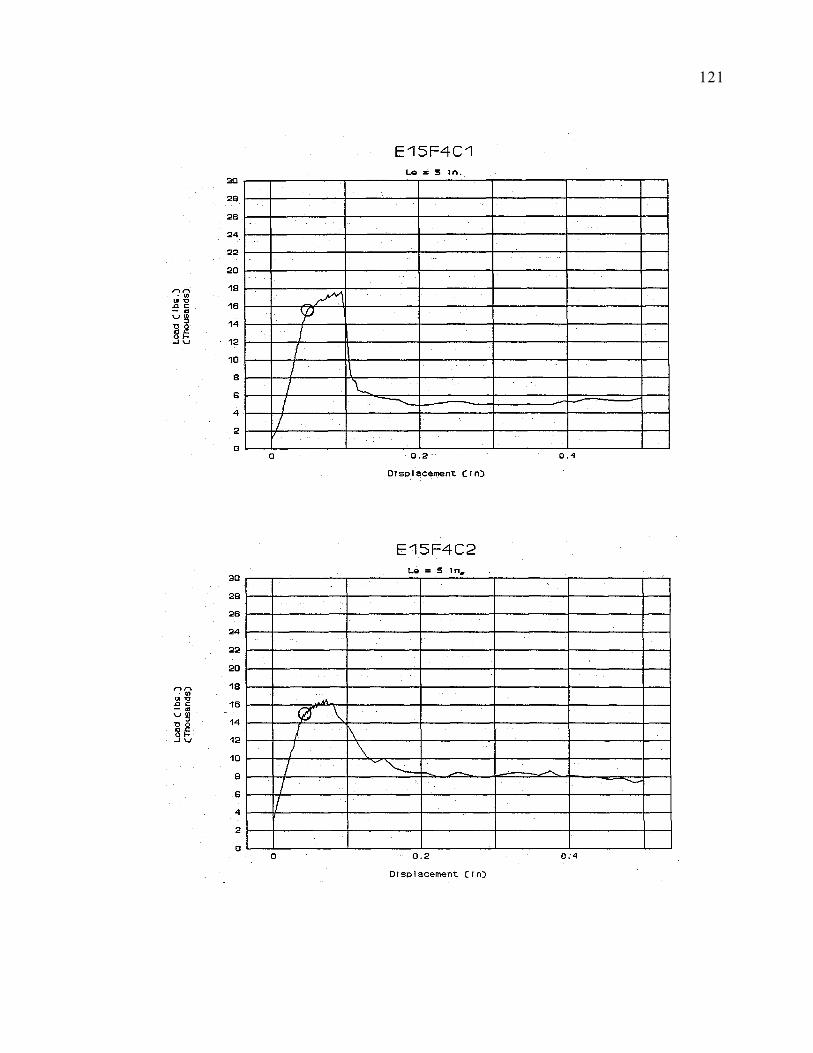
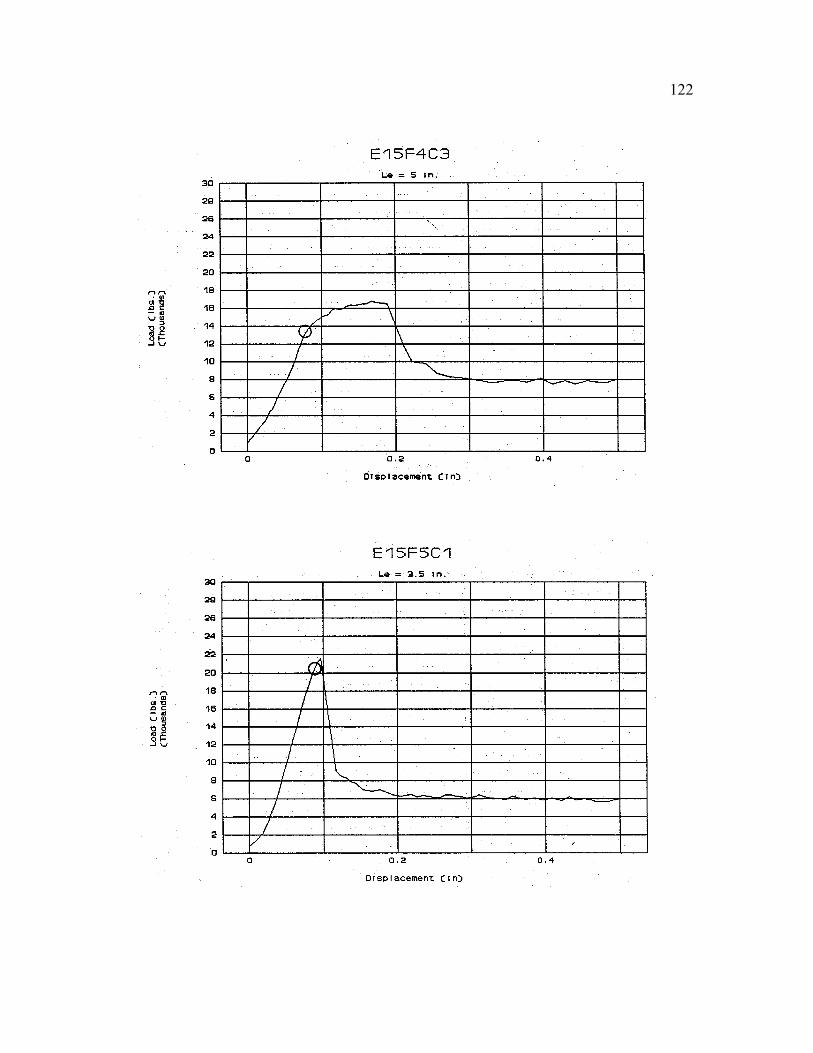
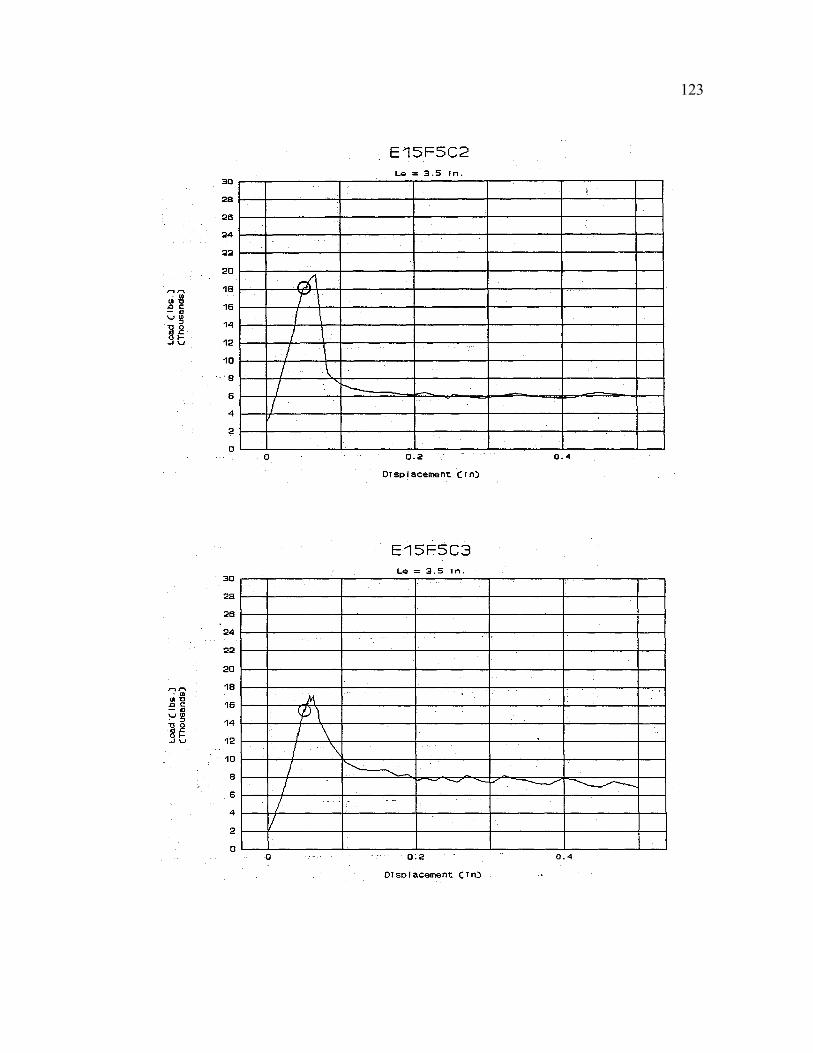
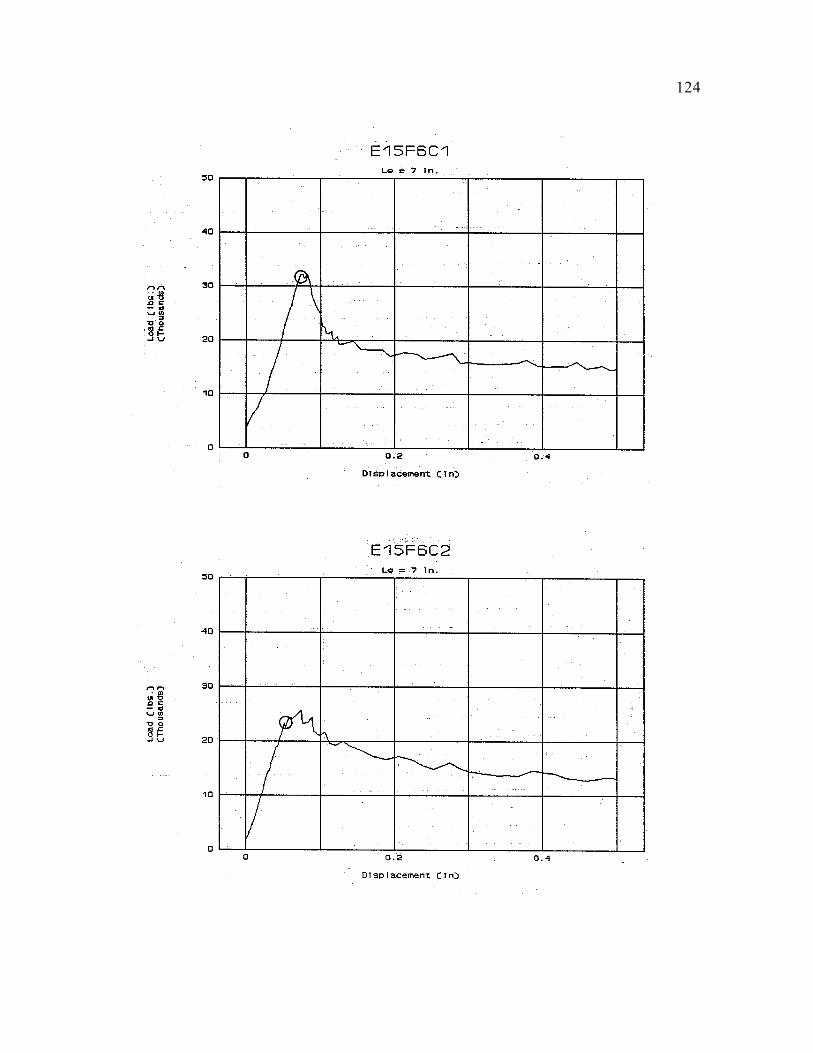
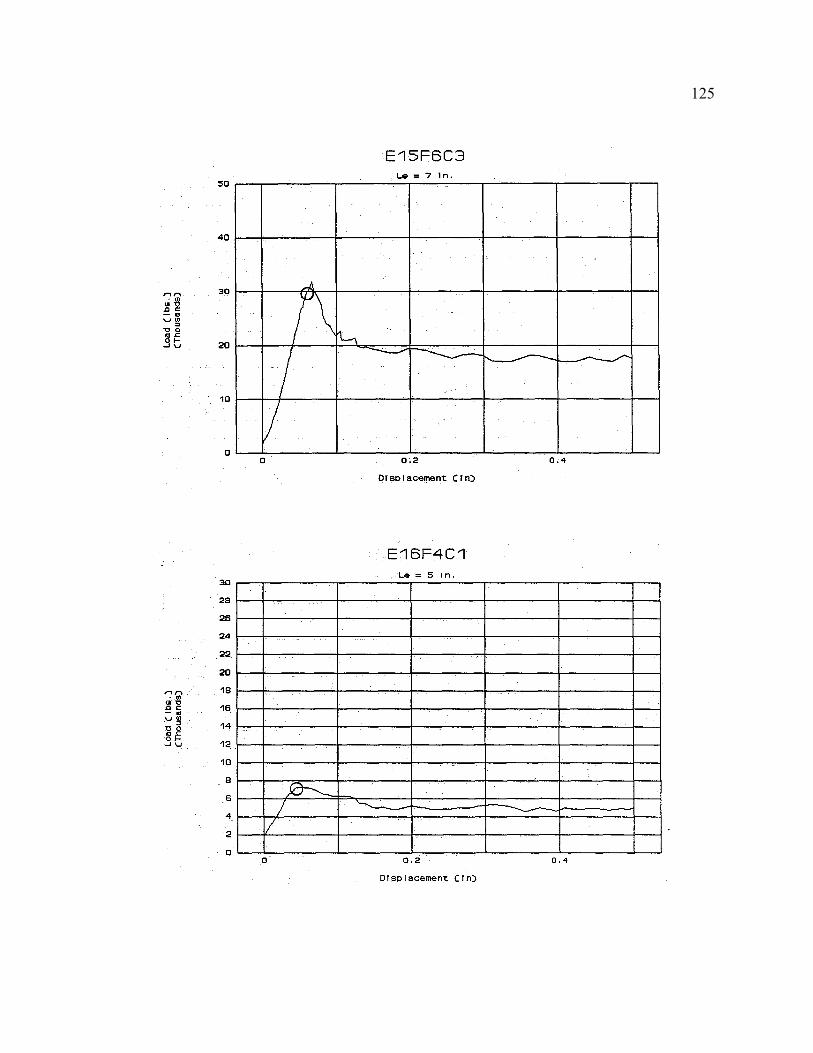
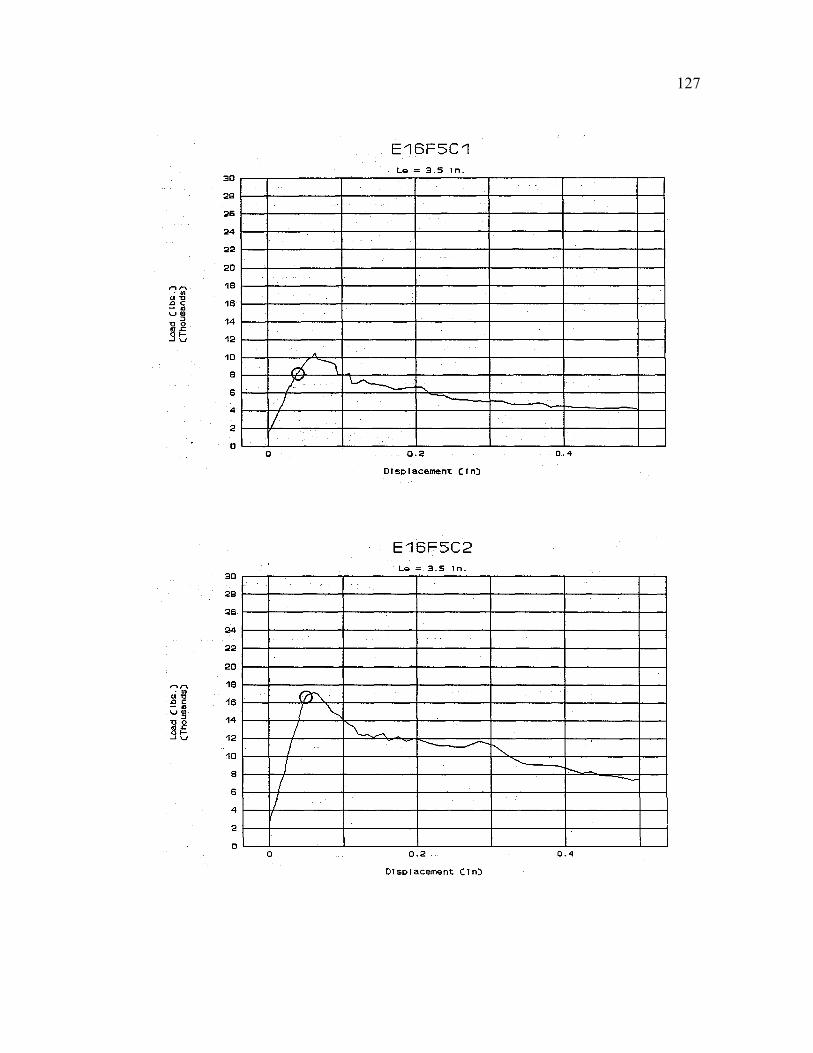
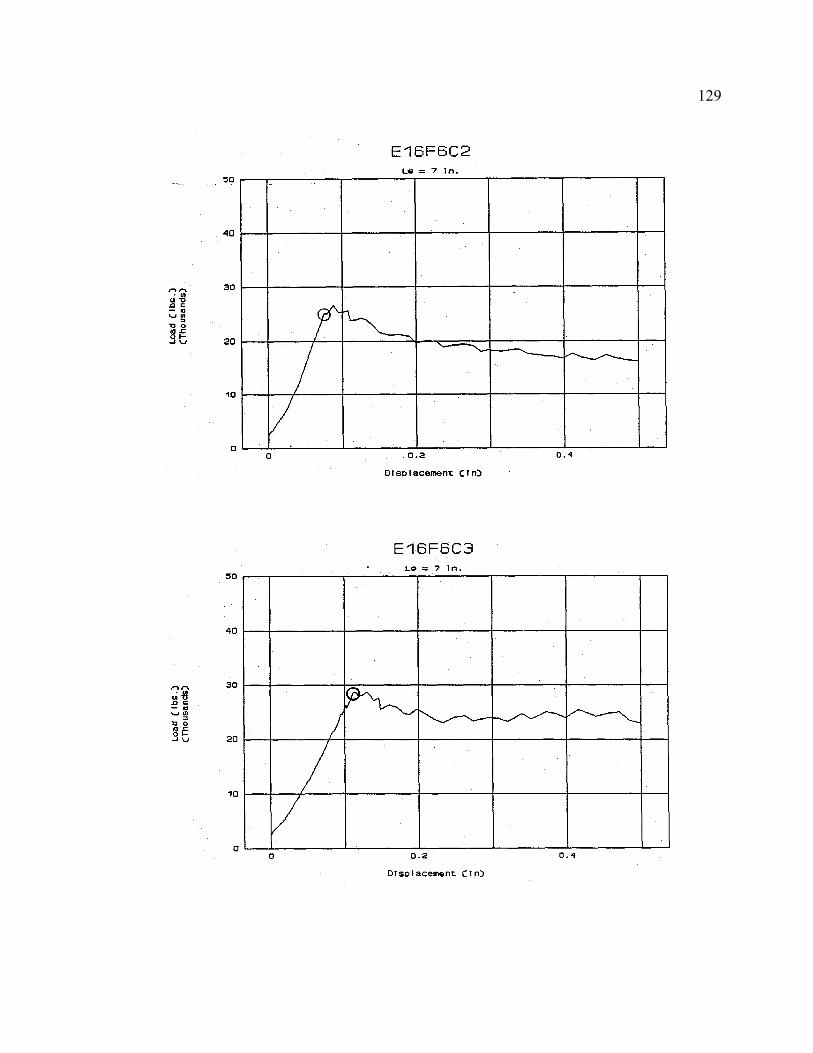
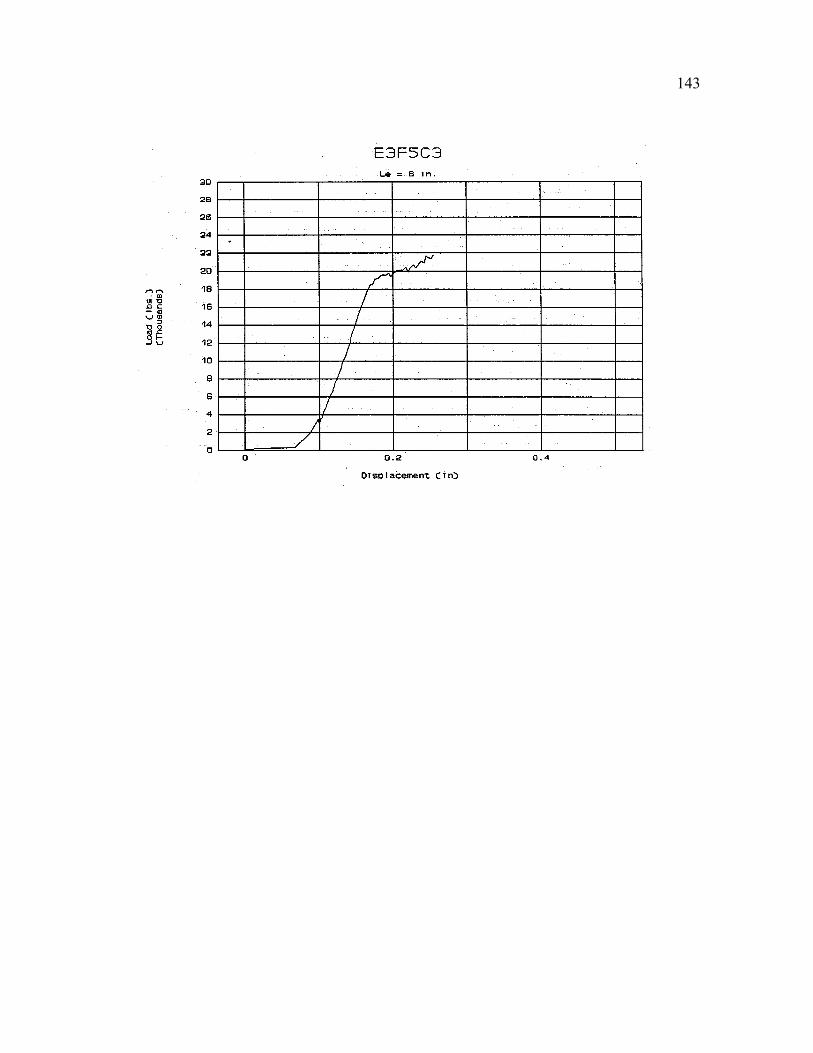
5.3 Description of Test Data
Data for each test performed was recorded in the form of a load-displacement
graph. An example is shown in Figure 5-4. It is important to note that the recorded
displacements consist of those due to the test system. The test system includes the
adhesive anchor-and the steel pulling rod that it is connected to. The slope of the
initial straight line portion of the graph (the region between the circled points on the
graph) represents the stiffness of the test system. It was calculated using the regression
analysis feature of the spreadsheet. In the example, the stiffness was determined to be
326 kip/in. The linear elastic range of the vinylester based adhesives was not as well
defined as with the other products.
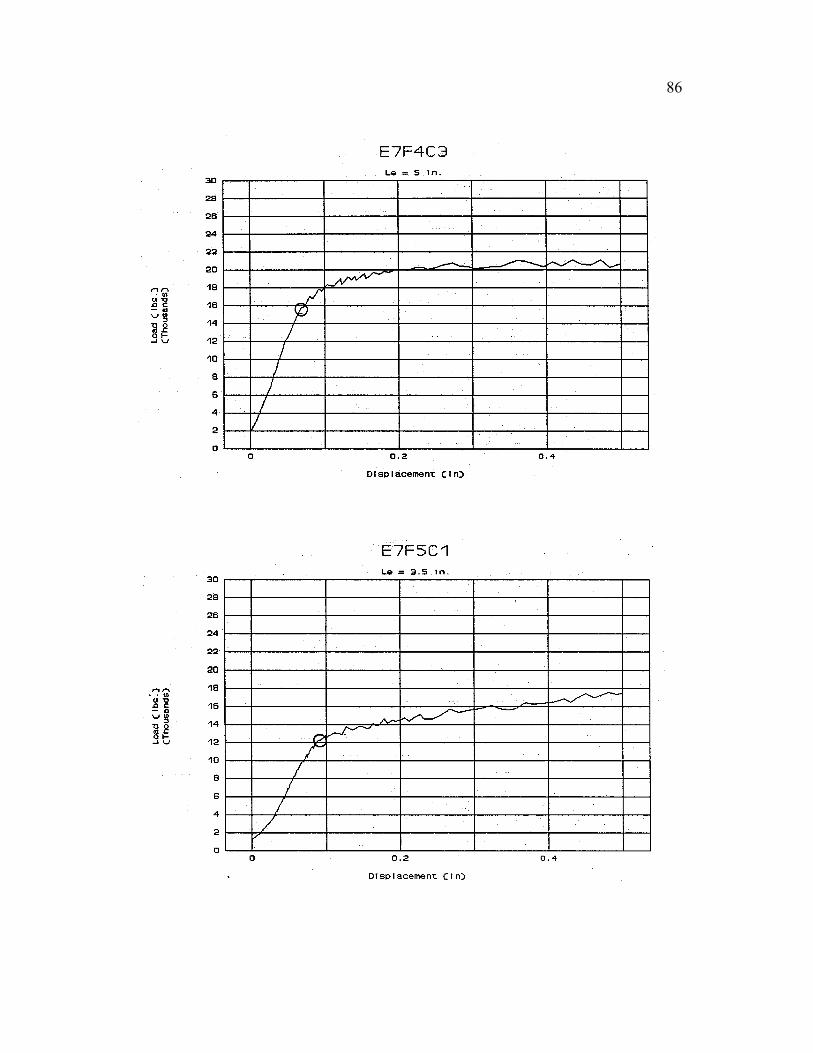
The failure load is at the point where the stiffness of the test system begins to
decrease (denoted by a circle at the top of the straight. line portion of the graph). It
can be found by manually extending the straight line portion of the graph for use as a
tangent line. The failure load is where
38
the slope of graph begins to deviate from the tangent line. In the example, the failure
load was determined to be 36 kips. After the failure load, the graph shows additional
increases and decreases in tensile strength. Some cases show this strength to increase
and some show this strength to decrease. This is a random phenomenon and is mainly
due to mechanical interlock of the adhesive anchor and the surrounding concrete. The
results for all of the tests are shown in both graphical and tabular form in Appendices B
and
CHAPTER 6
BEHAVIORAL MODELS FOR ADHESIVE ANCHORS
6.1 General
Several models have been suggested (Collins et al., 1989) to describe the
distribution of bond stress along adhesive anchors. Two such models are the elastic
model and the uniform bond stress model. The elastic model satisfies both the
compatibility of displacements at the anchor/adhesive interface and equilibrium. The
uniform bond stress model is an assumed distribution that only satisfies equilibrium.
6.2 E l a s t i c Model for Adhesive Anchors 6.2.1 Development of Model
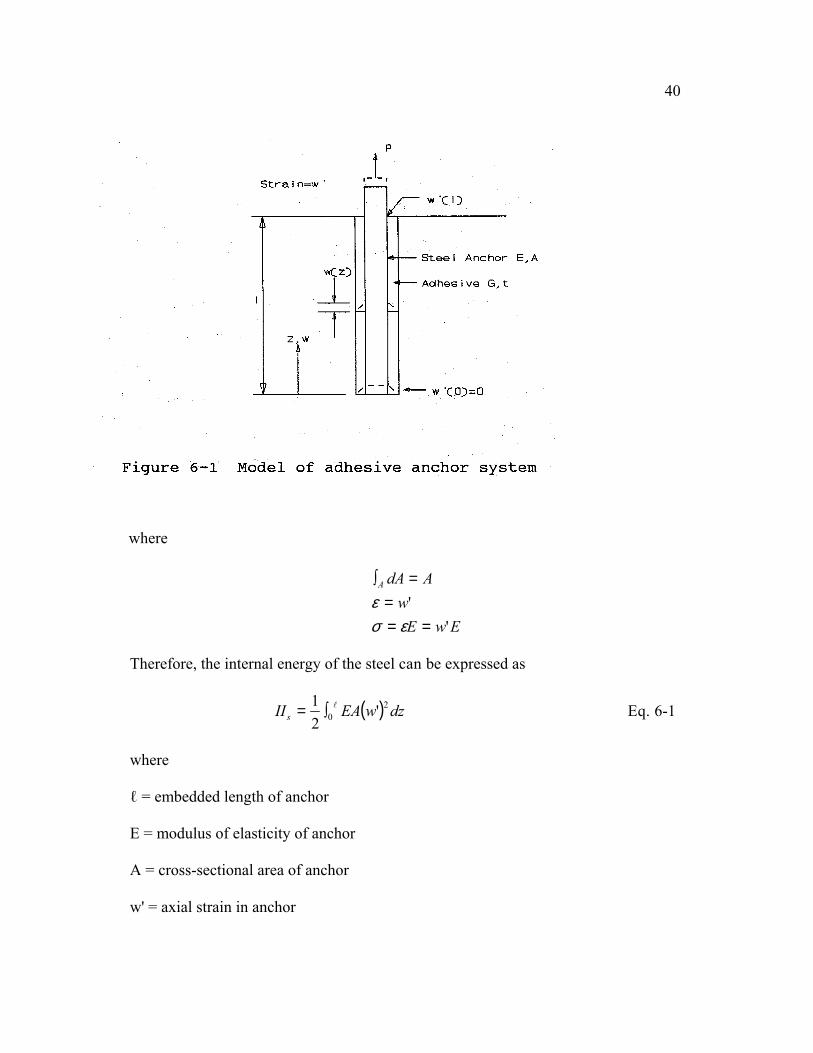
The derivation of the elastic solution is based on minimizing of the total energy
of the system shown in Figure 6-1. The net energy in the adhesive anchor system is
equal to the total internal energy (the strain energy due to both the steel and the
adhesive) less the external energy (work due to the applied loading).
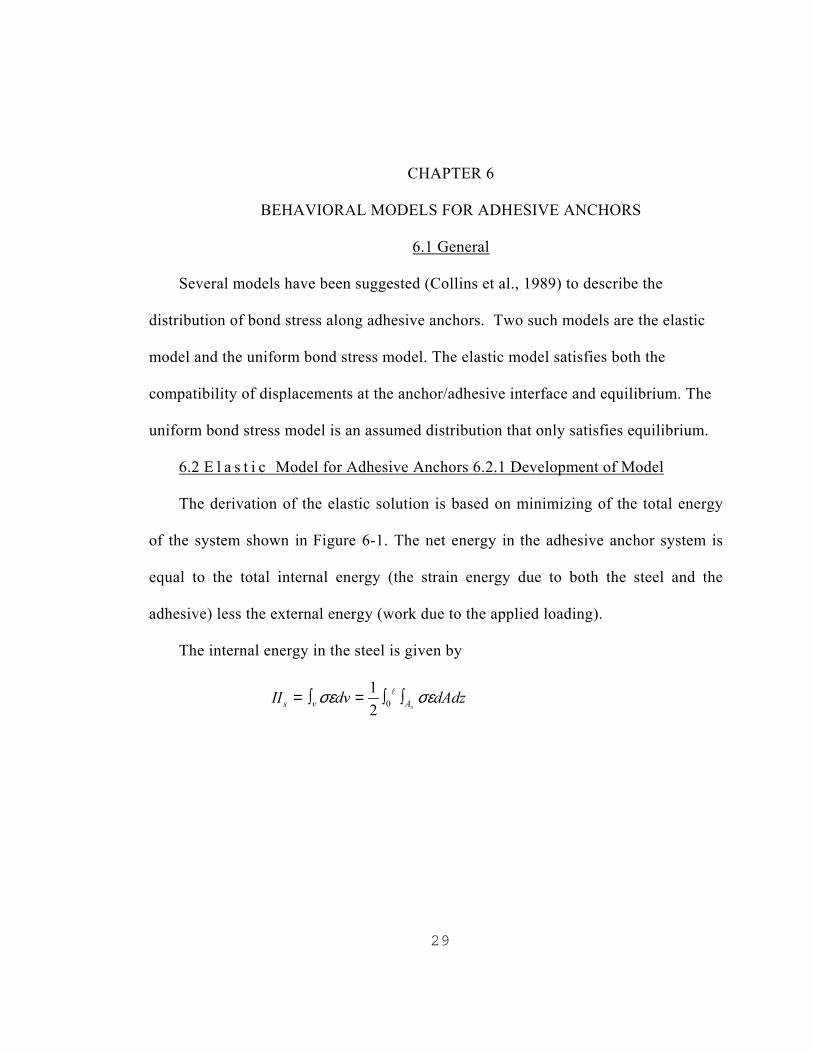
The internal energy in the steel is given by
dAdzdvIIsAvs σεσε ∫∫=∫= l
021
29
40
where
EwEw
AdAA
''
===
=∫
εσε
Therefore, the internal energy of the steel can be expressed as
( ) dzwEAIIs2
0 '21 l∫= Eq. 6-1
where
ℓ = embedded length of anchor
E = modulus of elasticity of anchor
A = cross-sectional area of anchor
w' = axial strain in anchor
41
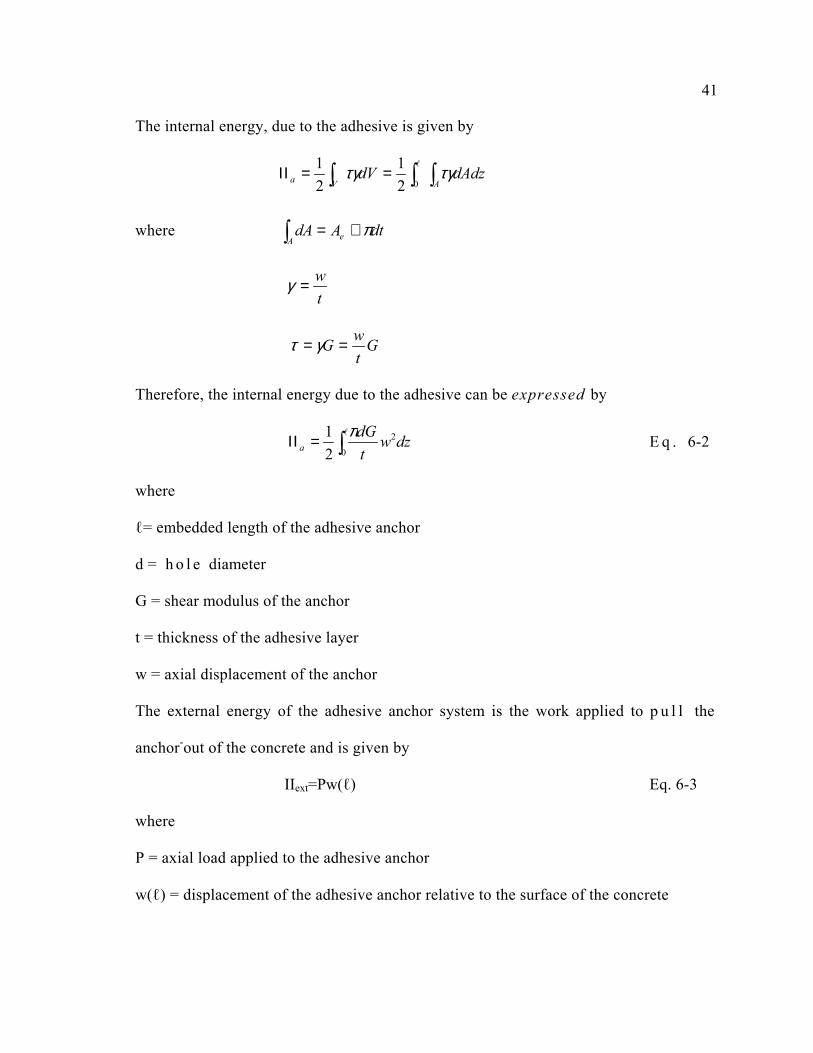
The internal energy, due to the adhesive is given by
∫∫∫ ==ΙΙAVa dAdzdV τγτγ
l
021
21
where ∫ ≅=A e dtAdA π
tw=γ
GtwG == γτ
Therefore, the internal energy due to the adhesive can be expressed by
∫=ΙΙl
0
2
21 dzw
tdG
aπ E q . 6-2
where
ℓ= embedded length of the adhesive anchor
d = h o l e diameter
G = shear modulus of the anchor
t = thickness of the adhesive layer
w = axial displacement of the anchor
The external energy of the adhesive anchor system is the work applied to p u l l the
anchor-out of the concrete and is given by
IIext=Pw(ℓ) Eq. 6-3
where
P = axial load applied to the adhesive anchor
w(ℓ) = displacement of the adhesive anchor relative to the surface of the concrete
42
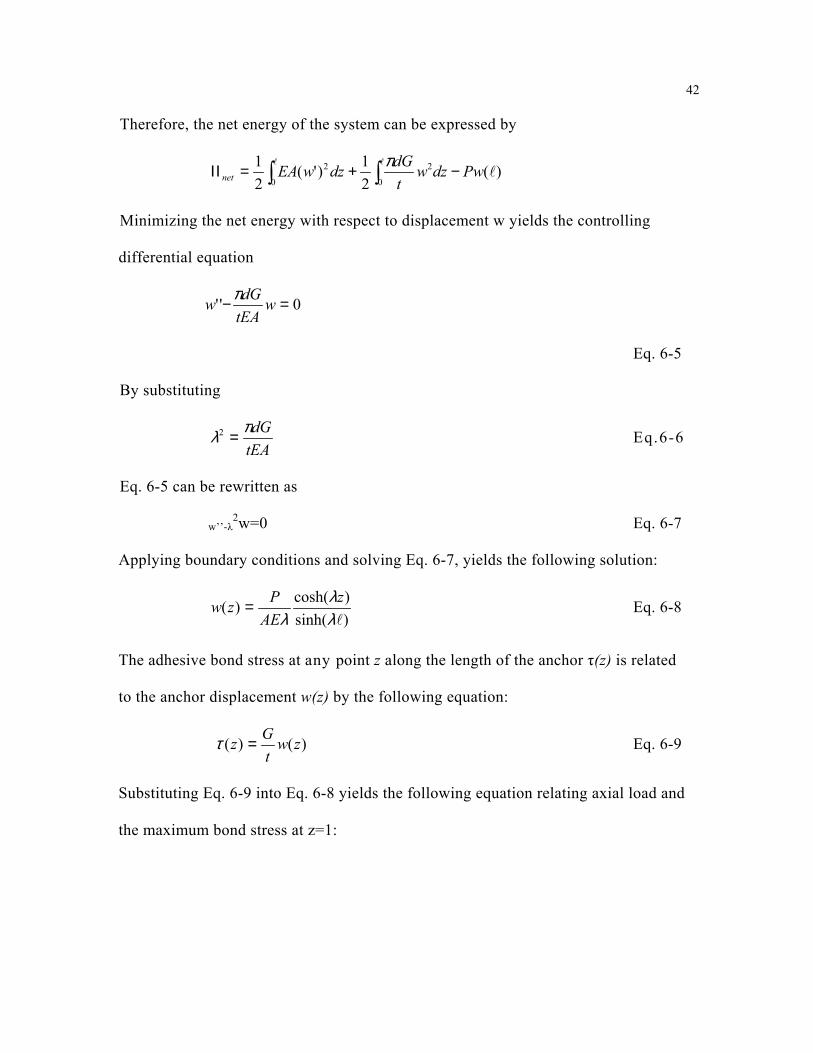
Therefore, the net energy of the system can be expressed by
∫ ∫ −+=ΙΙl l
l0 0
22 )(21)'(
21 Pwdzw
tdGdzwEAnet
π
Minimizing the net energy with respect to displacement w yields the controlling
differential equation
0'' =− wtEAdGw π
Eq. 6-5
By substituting
tEAdGπλ =2 Eq.6-6
Eq. 6-5 can be rewritten as
w’’-λ2w=0 Eq. 6-7
Applying boundary conditions and solving Eq. 6-7, yields the following solution:
)sinh()cosh()(lλ
λλ
zAE
Pzw = Eq. 6-8
The adhesive bond stress at any point z along the length of the anchor τ(z) is related
to the anchor displacement w(z) by the following equation:
)()( zwtGz =τ Eq. 6-9
Substituting Eq. 6-9 into Eq. 6-8 yields the following equation relating axial load and
the maximum bond stress at z=1:
43
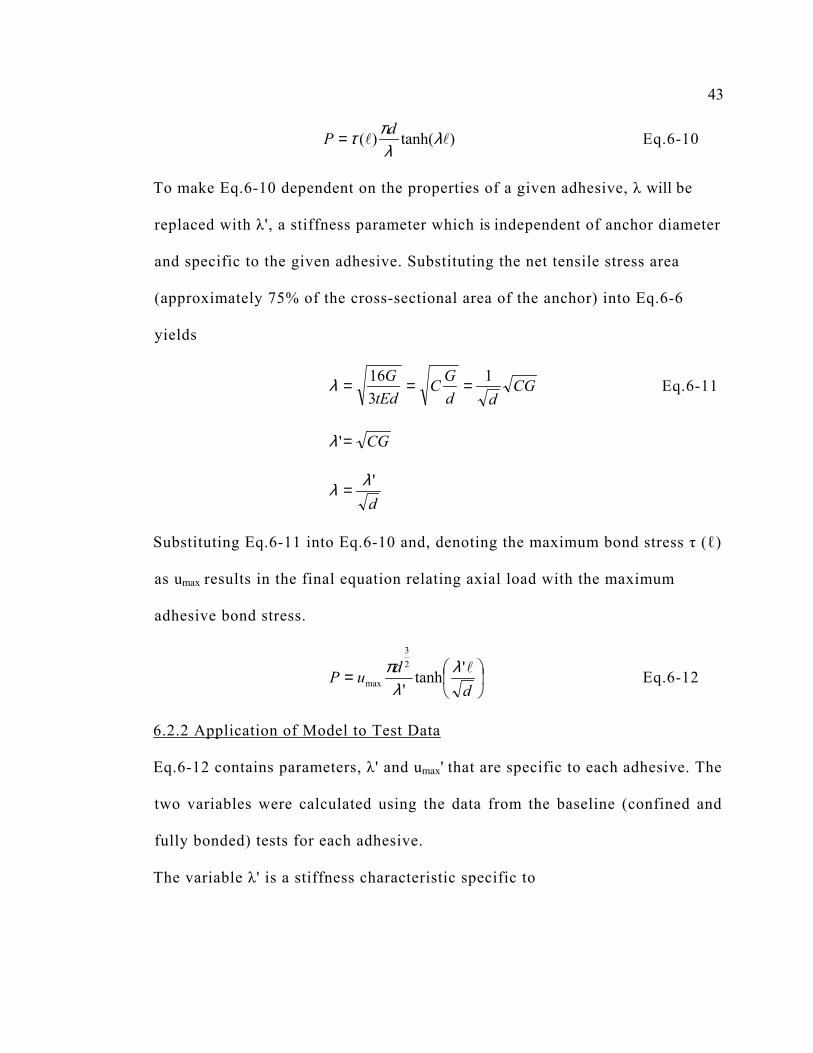
)tanh()( ll λλ
πτ dP = Eq.6-10
To make Eq.6-10 dependent on the properties of a given adhesive, λ will be
replaced with λ', a stiffness parameter which is independent of anchor diameter
and specific to the given adhesive. Substituting the net tensile stress area
(approximately 75% of the cross-sectional area of the anchor) into Eq.6-6
yields
CGdd
GCtEd
G 1316 ===λ Eq.6-11
CG='λ
d'λλ =
Substituting Eq.6-11 into Eq.6-10 and, denoting the maximum bond stress τ (ℓ)
as umax results in the final equation relating axial load with the maximum
adhesive bond stress.
=d
duP l'tanh'
23
maxλ
λπ Eq.6-12
6.2.2 Application of Model to Test Data
Eq.6-12 contains parameters, λ' and umax' that are specific to each adhesive. The
two variables were calculated using the data from the baseline (confined and
fully bonded) tests for each adhesive.
The variable λ' is a stiffness characteristic specific to
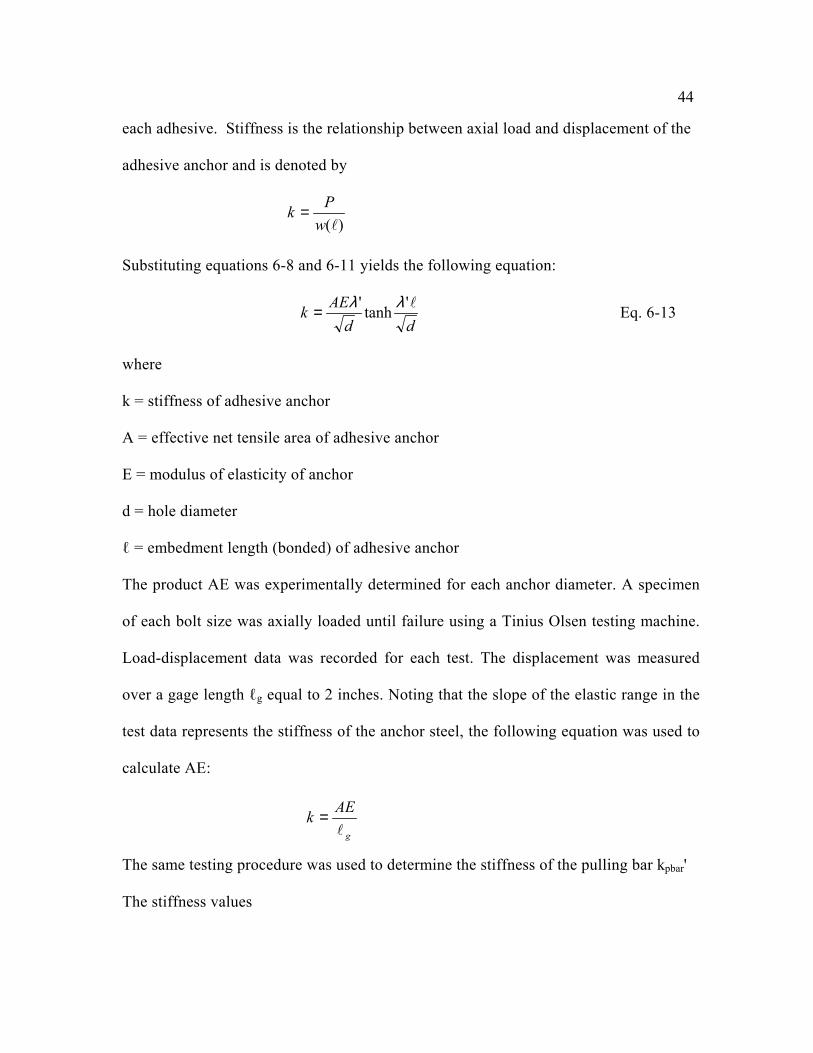
44
each adhesive. Stiffness is the relationship between axial load and displacement of the
adhesive anchor and is denoted by
)(lw
Pk =
Substituting equations 6-8 and 6-11 yields the following equation:
dd
AEk l'tanh' λλ= Eq. 6-13
where
k = stiffness of adhesive anchor
A = effective net tensile area of adhesive anchor
E = modulus of elasticity of anchor
d = hole diameter
ℓ = embedment length (bonded) of adhesive anchor
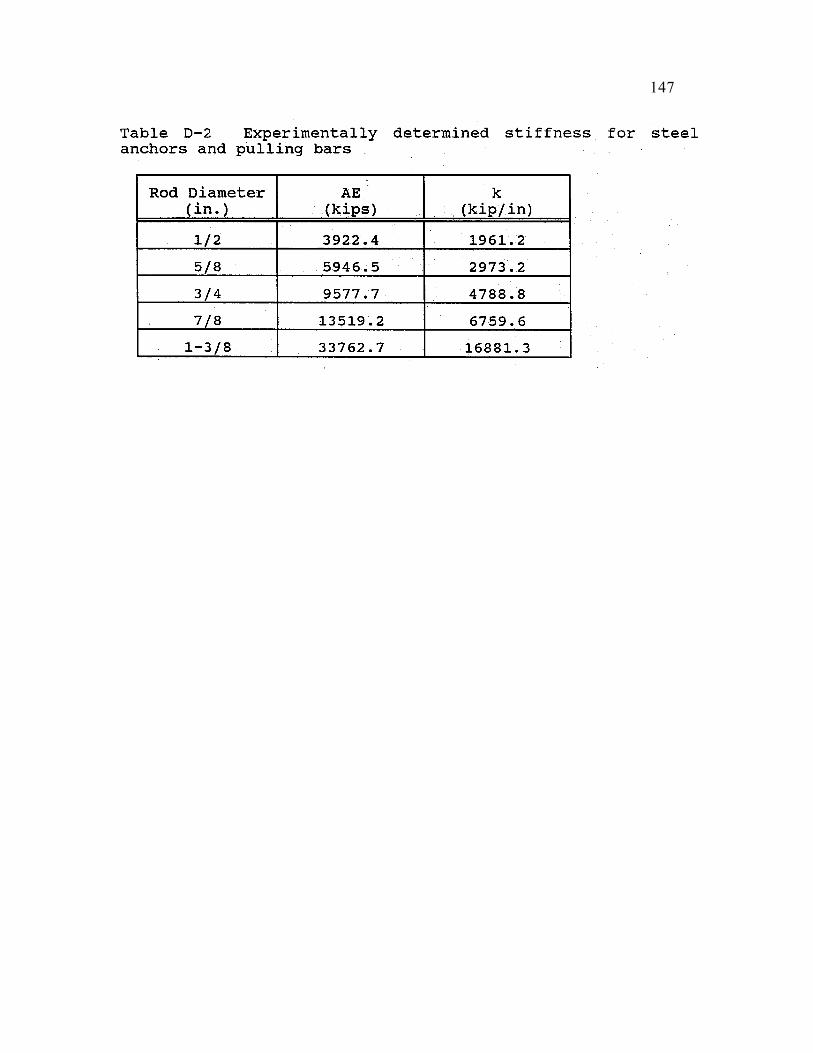
The product AE was experimentally determined for each anchor diameter. A specimen
of each bolt size was axially loaded until failure using a Tinius Olsen testing machine.
Load-displacement data was recorded for each test. The displacement was measured
over a gage length ℓg equal to 2 inches. Noting that the slope of the elastic range in the
test data represents the stiffness of the anchor steel, the following equation was used to
calculate AE:
g
AEkl
=
The same testing procedure was used to determine the stiffness of the pulling bar kpbar'
The stiffness values
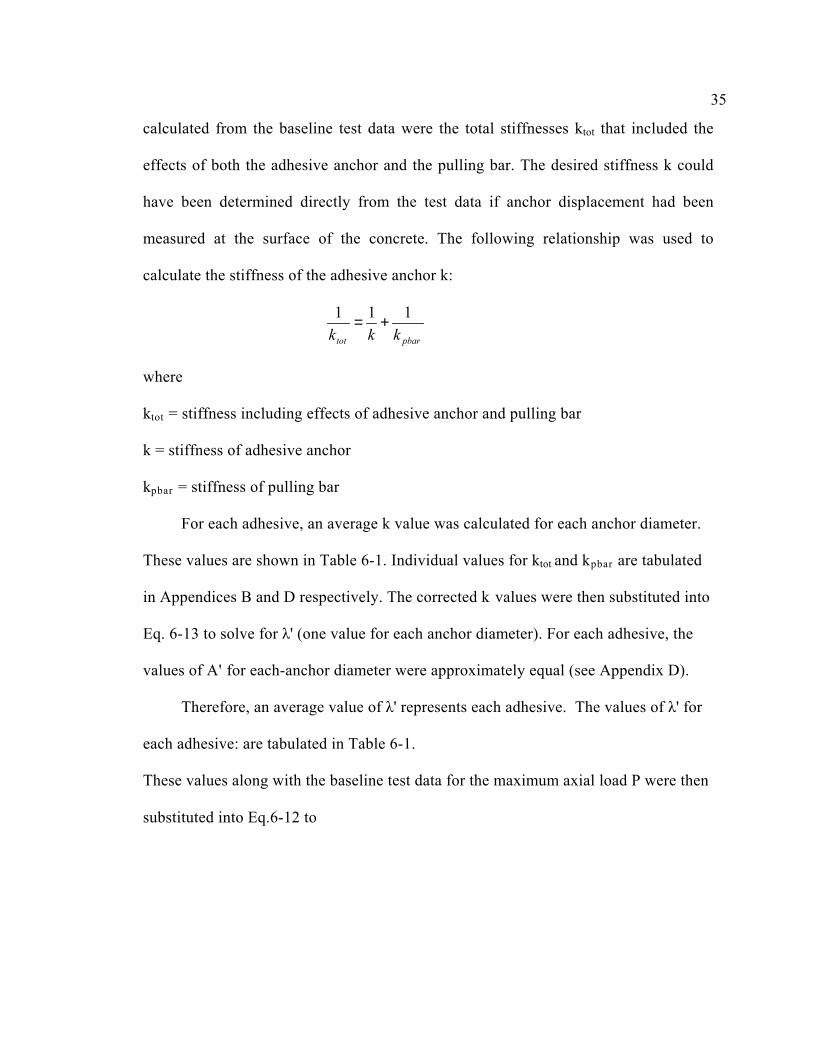
35
calculated from the baseline test data were the total stiffnesses ktot that included the
effects of both the adhesive anchor and the pulling bar. The desired stiffness k could
have been determined directly from the test data if anchor displacement had been
measured at the surface of the concrete. The following relationship was used to
calculate the stiffness of the adhesive anchor k:
pbartot kkk111 +=
where
ktot = stiffness including effects of adhesive anchor and pulling bar
k = stiffness of adhesive anchor
kpbar = stiffness of pulling bar
For each adhesive, an average k value was calculated for each anchor diameter.
These values are shown in Table 6-1. Individual values for ktot and kpbar are tabulated
in Appendices B and D respectively. The corrected k values were then substituted into
Eq. 6-13 to solve for λ' (one value for each anchor diameter). For each adhesive, the
values of A' for each-anchor diameter were approximately equal (see Appendix D).
Therefore, an average value of λ' represents each adhesive. The values of λ' for
each adhesive: are tabulated in Table 6-1.
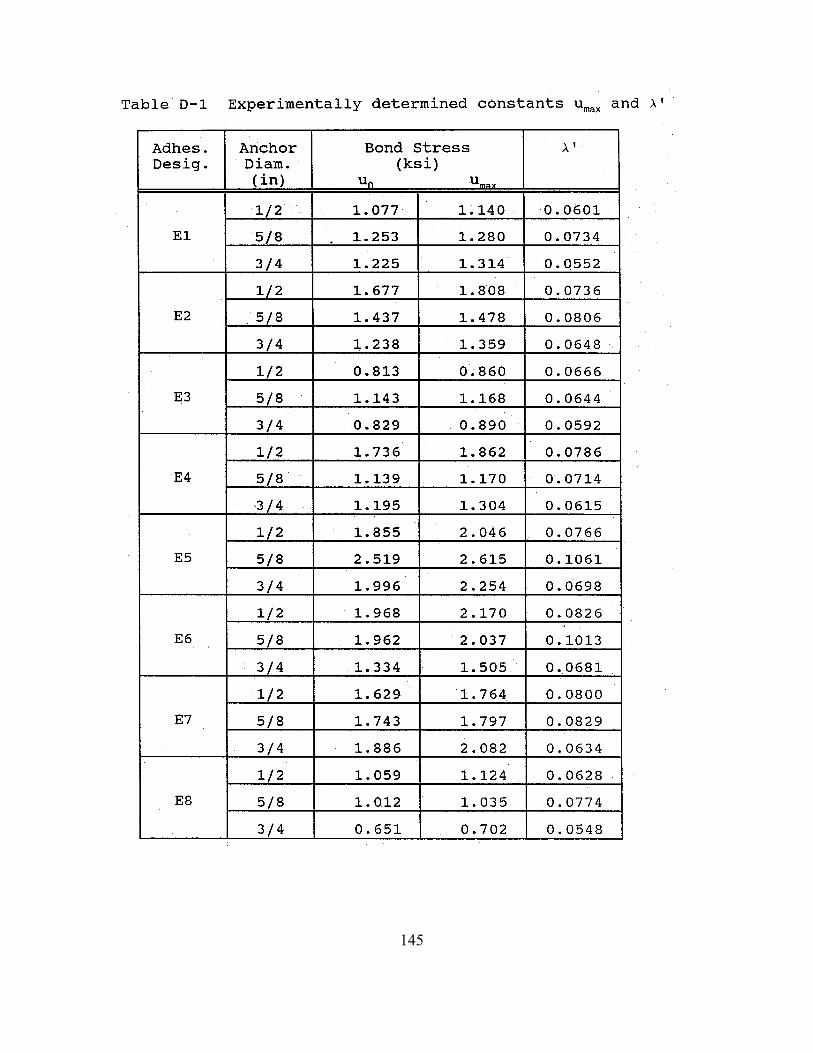
These values along with the baseline test data for the maximum axial load P were then
substituted into Eq.6-12 to
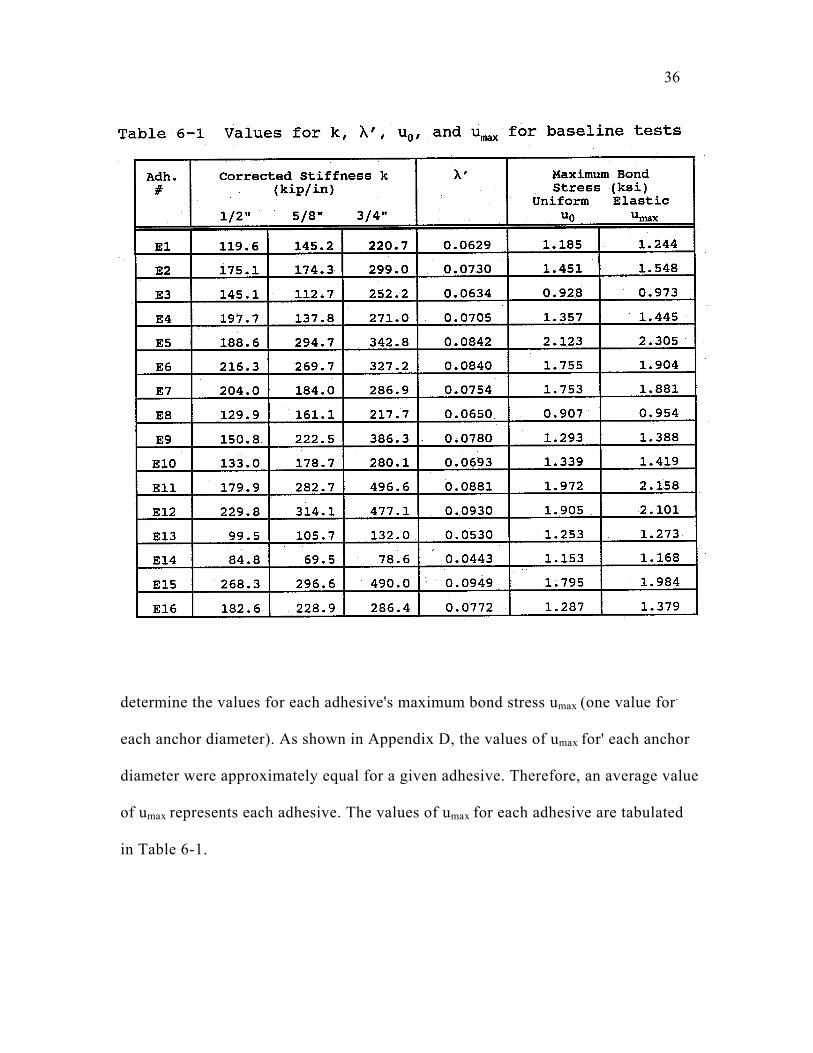
36
determine the values for each adhesive's maximum bond stress umax (one value for.
each anchor diameter). As shown in Appendix D, the values of umax for' each anchor
diameter were approximately equal for a given adhesive. Therefore, an average value
of umax represents each adhesive. The values of umax for each adhesive are tabulated
in Table 6-1.
37
6.3 Uniform Bond Stress Model
6.3.1 Development of Model
A uniform bond stress distribution relates a tensile load to the product of a bond stress
and a surface area. This relation is given by the following equation:
lduP oπ= Eq.6-14
where:
P = maximum axial load applied to adhesive anchor at failure
uo = maximum bond stress of adhesive based on the uniform distribution
d = hole diameter
ℓ = embedment length of adhesive anchor
Values: of uo were determined from the maximum load P obtained before anchor slip
(:see Table 6-1).
6:3.2 Application of Model to Test Data
In order to verify that the uniform bond stress model is acceptable, the elastic analysis
of Section 6.2 was used to compute the ratio of the bond stress at the bottom of the
adhesive anchor u (O) at failure to umax. By substituting Eqs.6-8 and 6-11 into Eq.6-9,
the following equation is obtained to calculate u(0):
38
=
dd
Poul'sinh
1')(23 λπ
λ Eq.6-15
Dividing Eq.6-15 by- Eq.6-12 yields the following relationship between u(0) and umax
=
dcash
uou
l'1)(
max λ Eq.6-16
where the variables are as defined in Section 6.2.
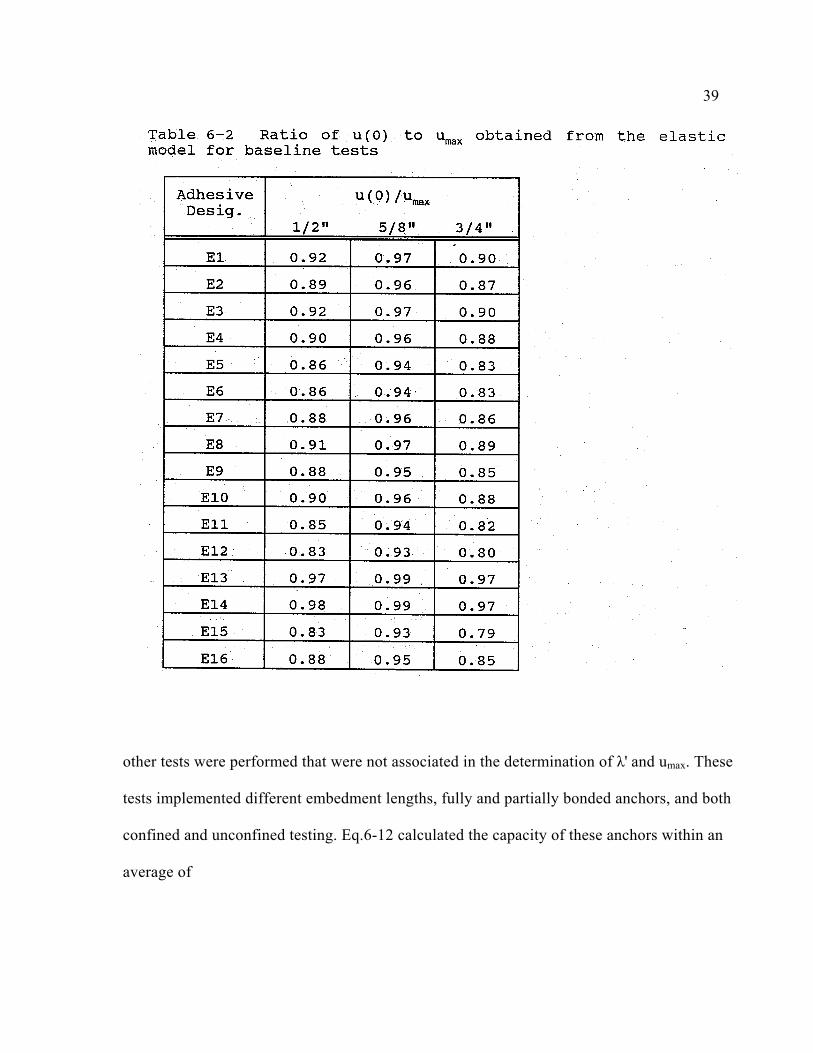
Calculating the- ratios of u(0) to umax revealed that the bond stresses of the
adhesive anchors approximate a uniform distribution. Values are shown in Table 6-2.
Substituting values for f, d, and A into Eq.6-16 reveals that u(0) /umax 0.80 for
ℓ/
≥
d ≤ 10. The bond stress distribution becomes closer to a pure uniform distribution
as d/l decreases.
6.4 Comparison of: Models: to Test Results
6.4.1 Elastic Model
Equation 6-12 was able to -calculate the anchor capacities of the baseline tests within
an average of 11.6% of the experimental values. A summary of results is presented in
Table 6-3. This accuracy should be no surprise since the values of λ' and umax are
based on the data from the baseline tests.
39
other tests were performed that were not associated in the determination of λ' and umax. These
tests implemented different embedment lengths, fully and partially bonded anchors, and both
confined and unconfined testing. Eq.6-12 calculated the capacity of these anchors within an
average of
40
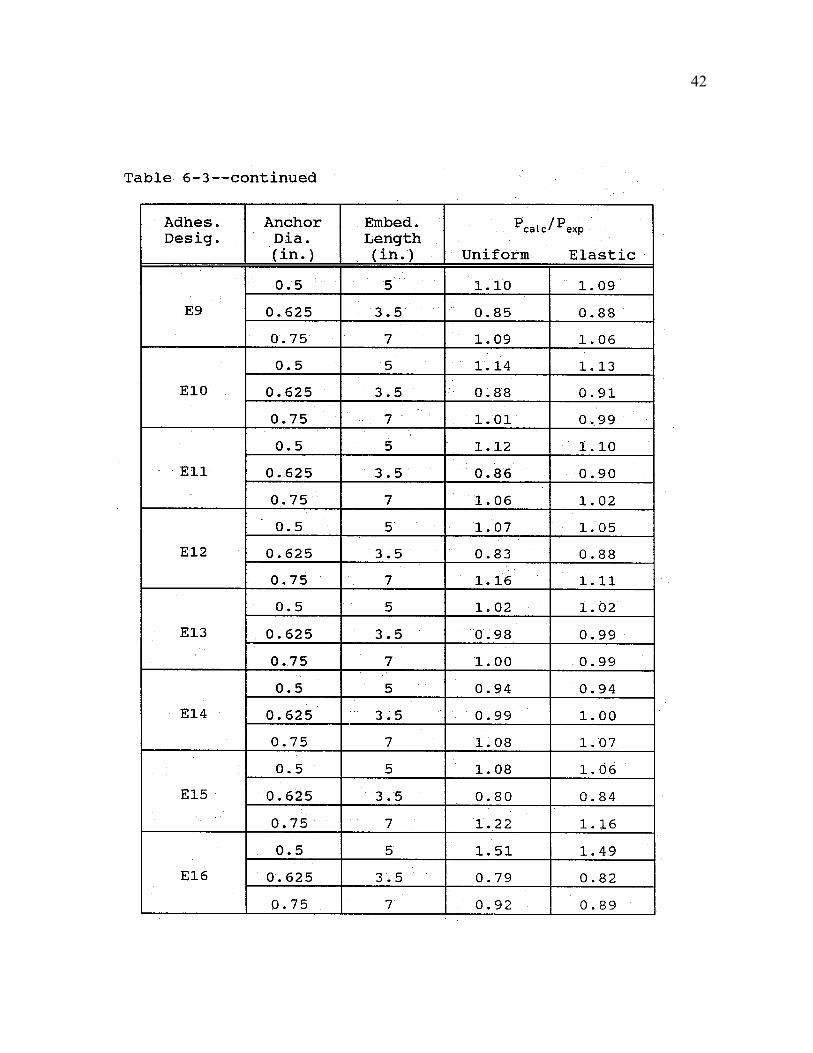
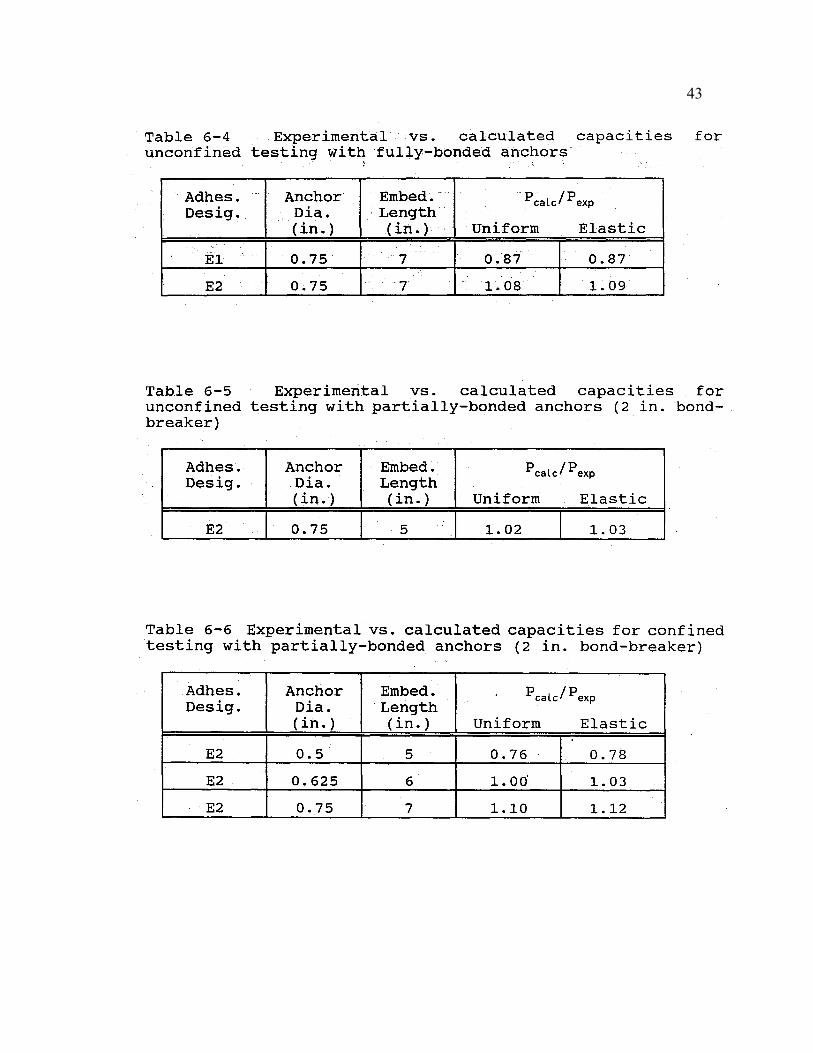
7.2% of the experimental values. The results of these tests are summarized in Tables
6-4, 6-5, 6-6, and 6-7.
It is apparent from these results that the elastic model can be used to predict the
tensile capacity of any adhesive anchor regardless of anchor diameter and
embedment length.
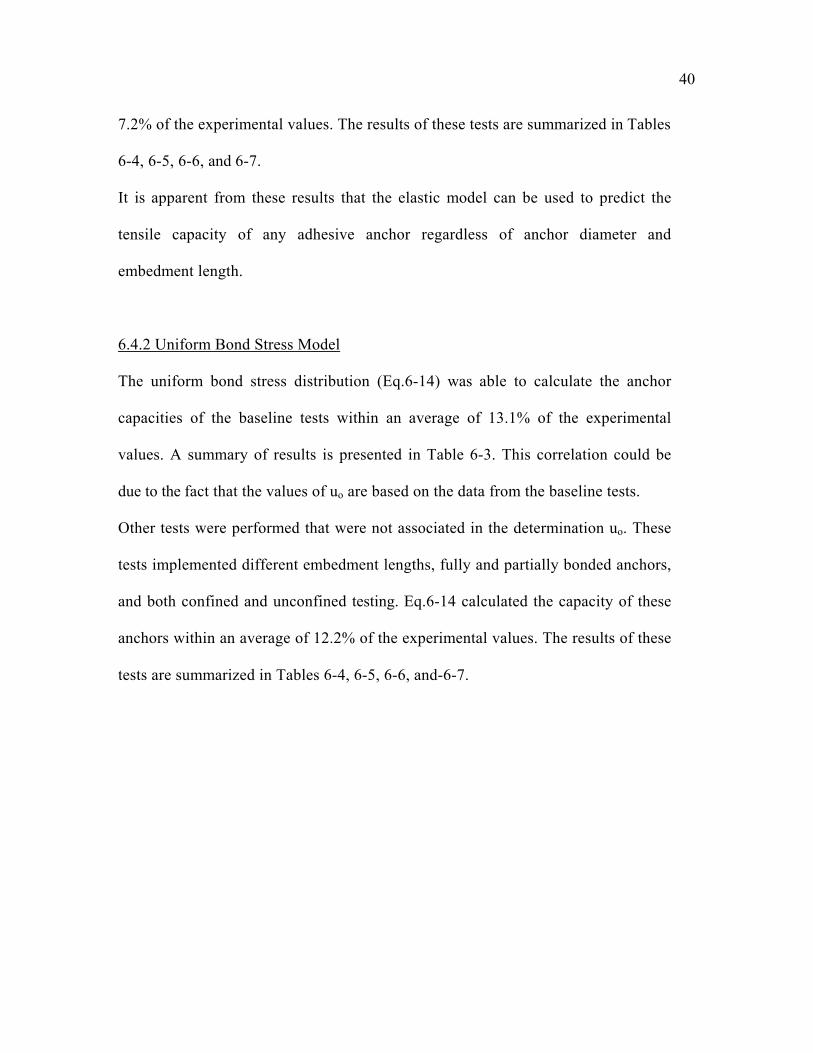
6.4.2 Uniform Bond Stress Model
The uniform bond stress distribution (Eq.6-14) was able to calculate the anchor
capacities of the baseline tests within an average of 13.1% of the experimental
values. A summary of results is presented in Table 6-3. This correlation could be
due to the fact that the values of uo are based on the data from the baseline tests.
Other tests were performed that were not associated in the determination uo. These
tests implemented different embedment lengths, fully and partially bonded anchors,
and both confined and unconfined testing. Eq.6-14 calculated the capacity of these
anchors within an average of 12.2% of the experimental values. The results of these
tests are summarized in Tables 6-4, 6-5, 6-6, and-6-7.

41
42
43
44
CHAPTER 7 DISCUSSION OF RESULTS
7.1 General
In actual situations, the adhesive anchors will not be fully confined. Therefore,
the results of the baseline tests need to be adjusted for unconfined loading in practical
applications.
7.2 Design Procedures
7.2.1 Effective Embedment Length
Fully-bonded adhesive anchors subject to unconfined loading were among the
tests, that were not included in the baseline tests. This situation represents that which
is most commonly experienced in practical use. The failure mode of these anchors
consisted of the formation of a concrete cone with an average depth of approximately
2 in. followed by the pullout of an adhesive core. This was the same result as
observed in the tests performed at the University of Texas (1989b).
As a result, an effective bond length ℓe equal to the total embedment length ℓ
minus 2 in. should be substituted into Eqs.6-12 and 6-14 for ℓ.
45
46
By making this substitution, both Eqs.6-12 (the elastic model) and 6-14 (the
uniform bond stress model) were able to predict the tensile capacity of the unconfined,
fully-bonded anchors within average of 11% of their experimental values.
7.2.2 Bond Stress Distribution
The elastic solution given by Eq.6-12 provided the best prediction of adhesive
anchor capacity. However, the uniform bond stress distribution (Eq.6-14) predicted
anchor capacities that were extremely close to those calculated with the elastic solution
As discussed in Chapter 6, an elastic analysis revealed that the bond: stress of the
adhesive anchor approximately followed a uniform distribution for ≤d/l 10.
Therefore, the uniform bond stress distribution given by Eq.6-14 is recommended for
design purposes (when applicable) due to its ease of use.
7.2.3 Capacity Reduction Factors
For design purposes, reduction factors should be used with Eqs.6-12 and 6-14 to
ensure that the calculated anchor capacity does not exceed the actual anchor capacity.
Data from 144 baseline tests was used to investigate Φ factors.
For Φ=0.80, 92% of the experimental capacities exceed their respective calculated
capacities for both the elastic and uniform solutions. When Φ=0.75, 98% of the
experimental capacities for the elastic model and 96% of those for the
47
uniform bond stress model exceed their respective calculated capacities. Fo r design,
Φ=0.80 is recommended. This is the same as that recommended by the results of the
tests performed at the University of Texas (Doerr et al., 1989).
7.3 Qualification of Products
A qualification specification based on static testing of fully-bonded confined
adhesive anchors can be used not only to determine wh i c h products should be
accepted or rejected but also to determine structural properties specific to each
adhesive. Therefore, the designer will be able to specify an adhesive product for
structural anchors based on either a lower-bound bond stress that all qualified
products must achieve or a higher bond stress that only certain products can achieve.
The qualification specification for structural adhesives requires that values for
u o , umax, and λ' be determined for each product. Based on the value of ua, the
adhesive will fall into one of four classes. The classes are arranged as follows: Class I
for uo 1700 psi (upper 25% of products tested, mean + 0.67 standard deviations),
Class II for u
≥
o ≥ 1450 psi ( upper 50% of products tested), Class III for uo 1200 psi
(upper 75% of products tested, mean - 0.67 standard deviations), and Class IV for u
≥
o
900 psi. An adhesive shall be rejected if u≥ o < 900 psi.

48
Use of a qualified product would guarantee a value of uo greater than or equal to 900 psi.
If a higher maximum bond stress is required, an adhesive with the appropriate
classification may be used to meet the design criteria. Higher bond strengths may be
specified if required.
A sample qualification specification is given in Appendix E. Note that this
specification does not include other factors that need to be incorporated. Such factors
include the effects of confinement, hole orientation, elevated temperatures, wet
installation, concrete strength, different aggregates, and long term loading.
CHAPTER 8
SUMMARY, CONCLUSIONS, AND RECOMMENDATIONS
8.1 Summary
The purpose of this project was to study the tensile behavior of adhesive bonded
anchors subjected to static loading. A total of 167 tests were performed involving
three rod diameters and 16 adhesives. Load-displacement data was collected for each
test.
A series of confined, fully-bonded baseline tests were used to determine the basic
behavior of the adhesive anchor system Failure of the confined, fully-bonded anchors
was characterized by the pullout of an adhesive core along the concrete-adhesive
interface.
Other tests were performed for comparison with the baseline tests. These
consisted of unconfined tests with both fully and partially-bonded anchors and
confined tests with partially-bonded anchors. All tests involving partially bonded
anchors experienced failures characterized by the pullout of an adhesive core along
the concrete-adhesive interface. The unconfined tests with fully-bonded anchors
experienced a shallow concrete cone failure coupled with the pullout of an adhesive
core along the concrete-adhesive interface.
49
50
The test results were used to evaluate two bond stress models for the adhesive
anchor system. One model was based on a bond stress distribution obtained from an
elastic analysis of the anchor system. The second model was based on a uniform bond
stress distribution.
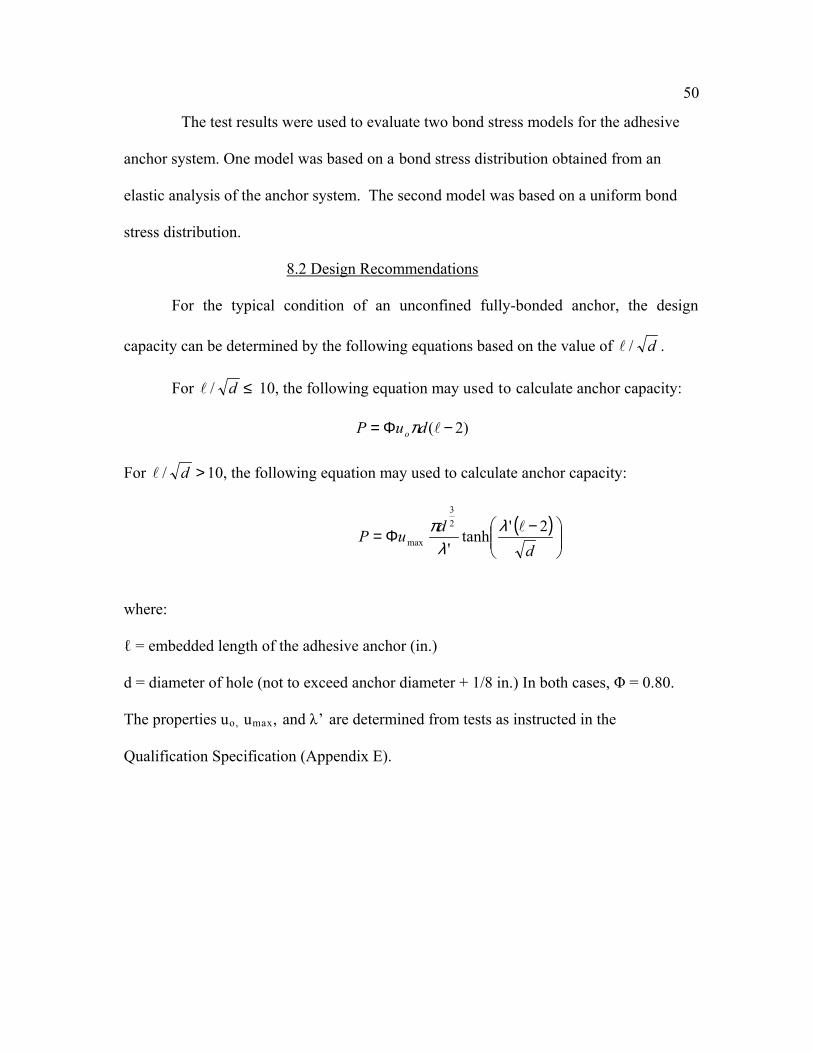
8.2 Design Recommendations
For the typical condition of an unconfined fully-bonded anchor, the design
capacity can be determined by the following equations based on the value of d/l .
For ≤d/l 10, the following equation may used to calculate anchor capacity:
)2( −Φ= lduP oπ
For >d/l 10, the following equation may used to calculate anchor capacity:
( )
−Φ=d
duP 2'tanh'
23
maxlλ
λπ
where:
ℓ = embedded length of the adhesive anchor (in.)
d = diameter of hole (not to exceed anchor diameter + 1/8 in.) In both cases, Φ = 0.80.
The properties uo, umax, and λ’ are determined from tests as instructed in the
Qualification Specification (Appendix E).
51
less than 3 in. should be avoided. Also, to prevent splitting, adhesive anchors should be
installed at least 3 in. from the edge of the concrete.
8.3 Conclusions
Based on the results reports herein, the' following conclusions have been drawn:
1) Tensile capacities predicted by the elastic solution (Eq.6-1,2) best fit the test
data, but the uniform bond stress distribution (Eq.6-14) also provides acceptable
results.
2) The elastic solution demonstrated that the actual adhesive bond -stress follows
an approximate uniform distribution for typical anchor diameters and
embedment lengths.
3) Anchor capacities fell short of those recorded from comparable tests performed
at the University of Texas (Doerr et al., 1989). Both sets of tests used concrete
of the same specified and actual compressive strengths. Therefore, other factors
relating to the concrete mix (such as the aggregate) may influence the behavior
of adhesive anchors in concrete. It should be noted that the Texas tests recorded
ultimate tensile loads as opposed to the failure-loads described in Chapter 5. In
many cases these are not the same:
4) Variations- in maximum bond stress exist among the various adhesive products.
52
5) A sample product qualification specification based on the results of this
study is contained in Appendix E. It is recommended that all products
tested during the course of this research project be accepted as qualified
products. The parameters uo, umax, and λ’ for each product are given in Table
6-1.
8.4 Recommendations for Further Research
The following research is recommended to be performed and compared to the
results of this project:
1) Investigate the effects of using a different concrete mix design with the same
compressive strength (i.e. use different types of aggregate).
2) Investigate the effects of using concrete mixes with higher and lower
compressive strengths- and different aggregates.
3) Test larger diameter anchors.
4) Investigate the effects of confining the adhesive anchors.
5) Investigate the effects of moisture in the drilled holes prior to anchor
installation.
6) Investigate the effects of different hole orientations (i.e. horizontally
installed anchors).
7) Investigate the effects of elevated temperatures.
8) Investigate the effects of long term loading.
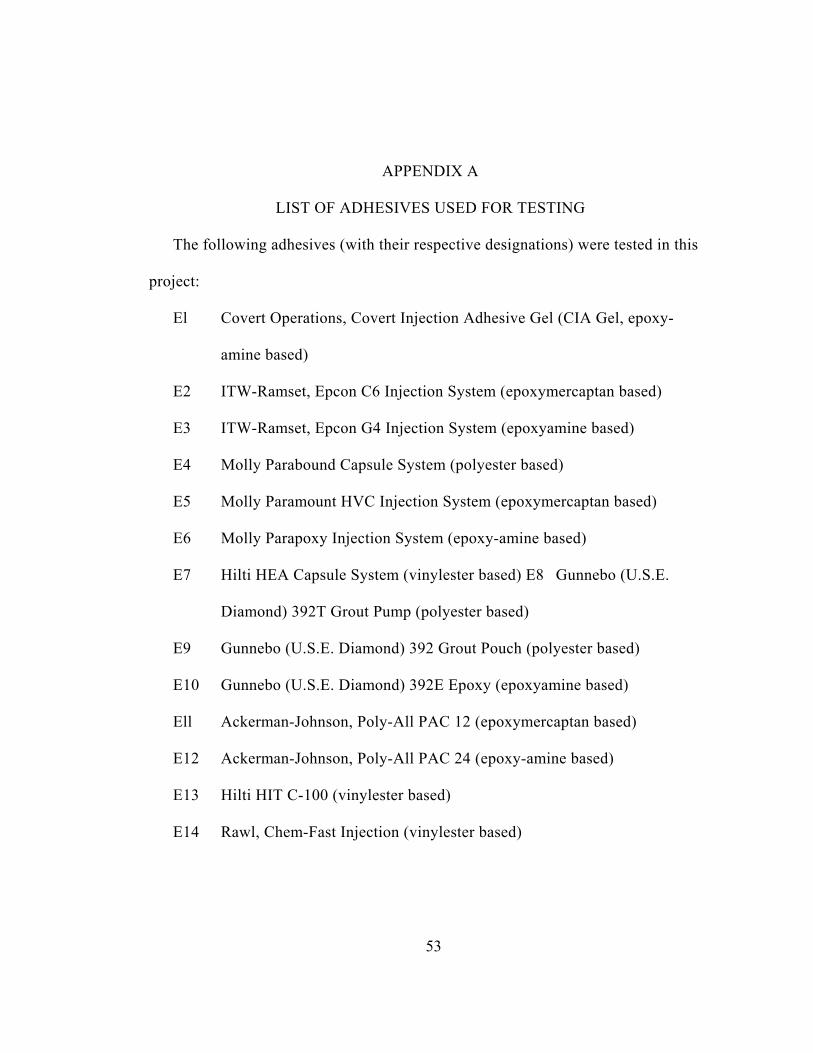
APPENDIX A
LIST OF ADHESIVES USED FOR TESTING
The following adhesives (with their respective designations) were tested in this
project:
El Covert Operations, Covert Injection Adhesive Gel (CIA Gel, epoxy-
amine based)
E2 ITW-Ramset, Epcon C6 Injection System (epoxymercaptan based)
E3 ITW-Ramset, Epcon G4 Injection System (epoxyamine based)
E4 Molly Parabound Capsule System (polyester based)
E5 Molly Paramount HVC Injection System (epoxymercaptan based)
E6 Molly Parapoxy Injection System (epoxy-amine based)
E7 Hilti HEA Capsule System (vinylester based) E8 Gunnebo (U.S.E.
Diamond) 392T Grout Pump (polyester based)
E9 Gunnebo (U.S.E. Diamond) 392 Grout Pouch (polyester based)
E10 Gunnebo (U.S.E. Diamond) 392E Epoxy (epoxyamine based)
Ell Ackerman-Johnson, Poly-All PAC 12 (epoxymercaptan based)
E12 Ackerman-Johnson, Poly-All PAC 24 (epoxy-amine based)
E13 Hilti HIT C-100 (vinylester based)
E14 Rawl, Chem-Fast Injection (vinylester based)
53
54
E15 Sika-Ravel, Foil-Fast Slow Set (epoxy-amine based)
E16 Sika-Ravel, Foil-Fast Fast Set (epoxy-amine based)
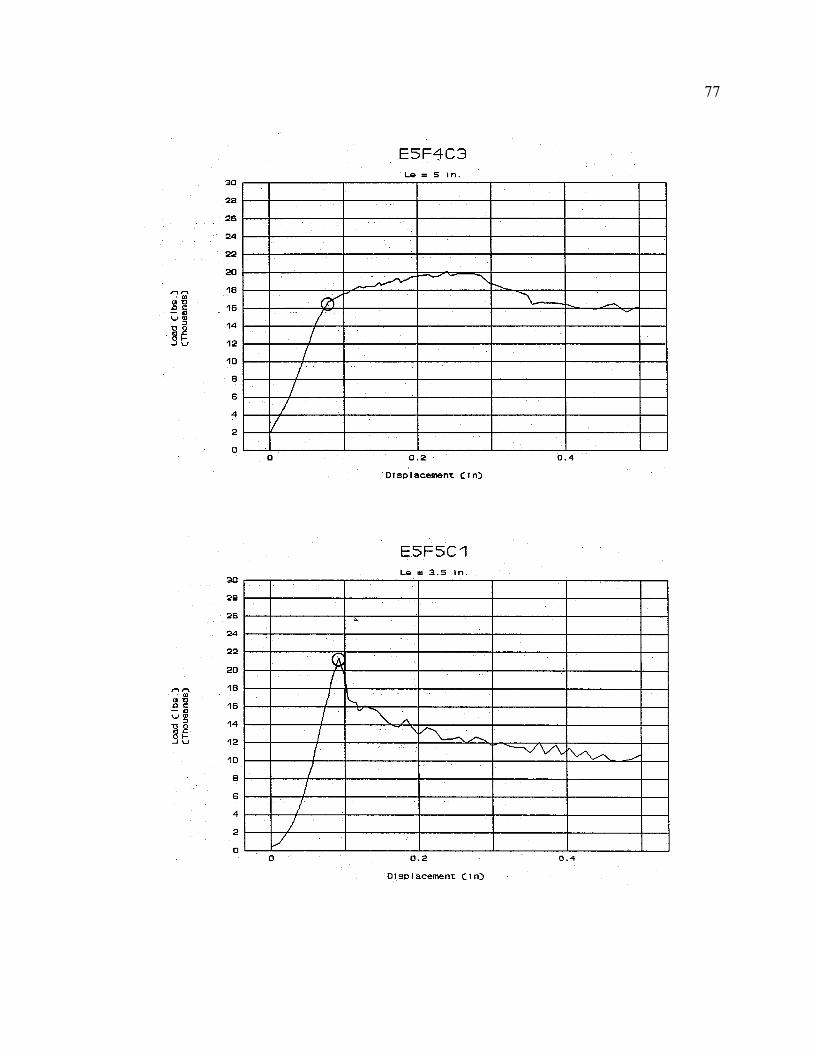
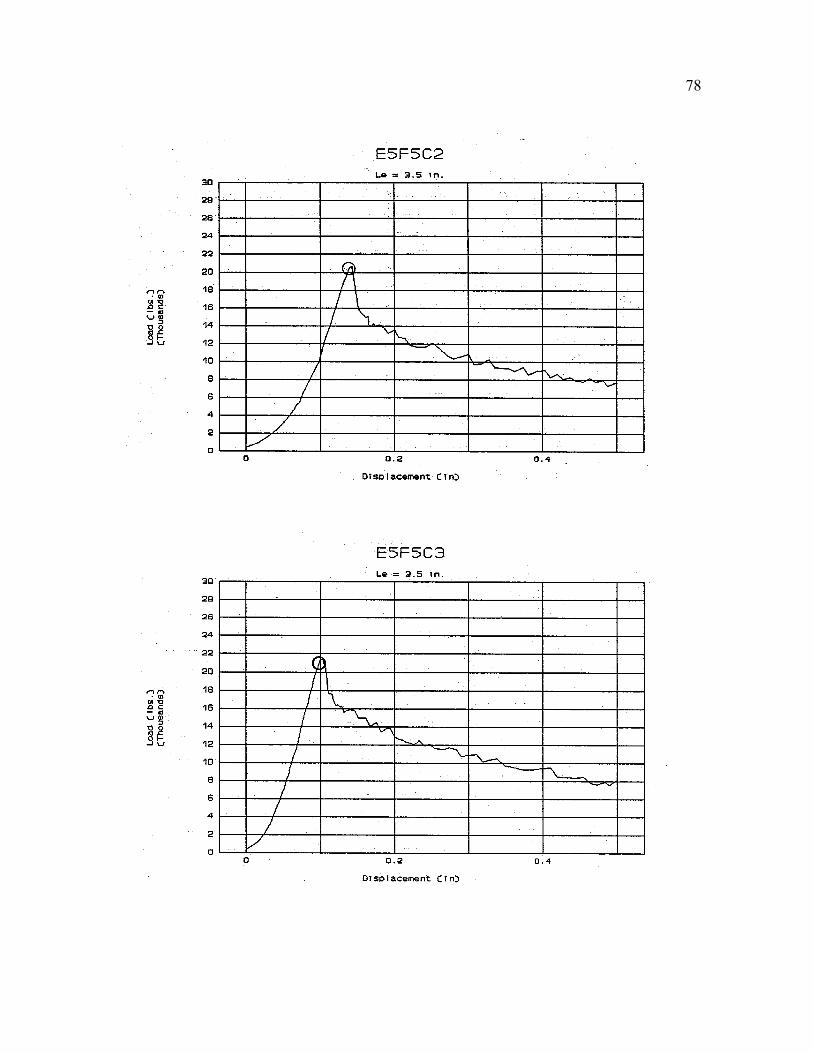
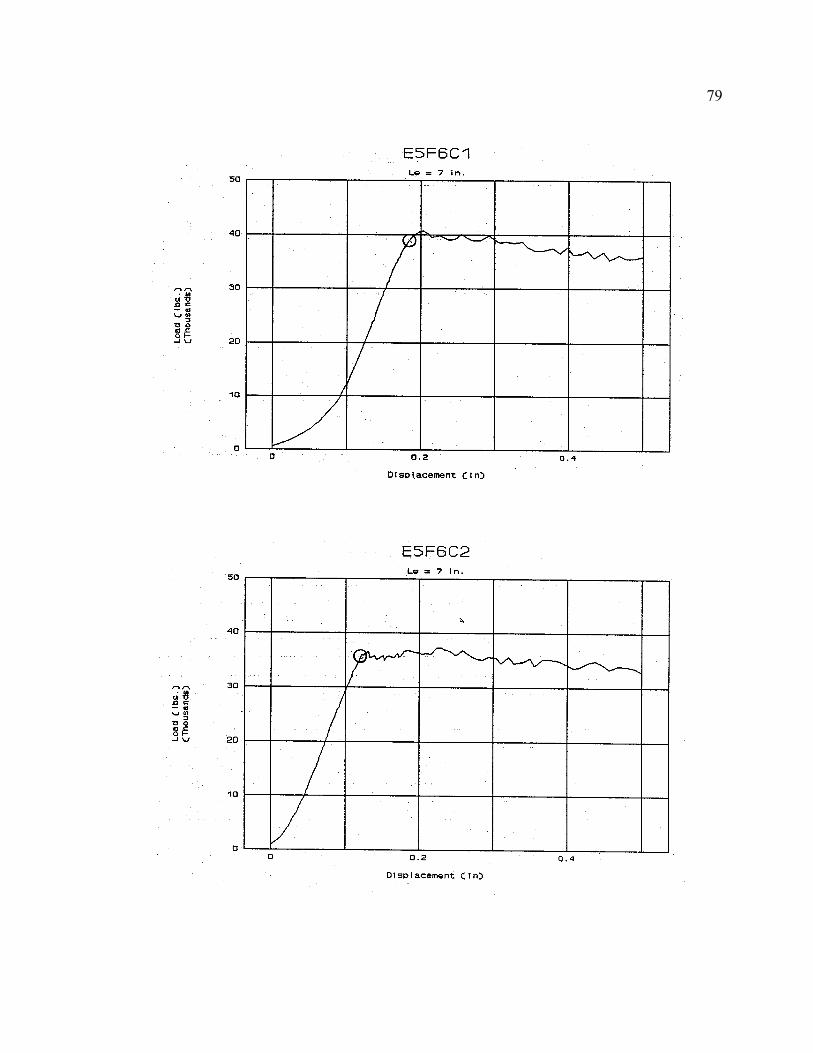
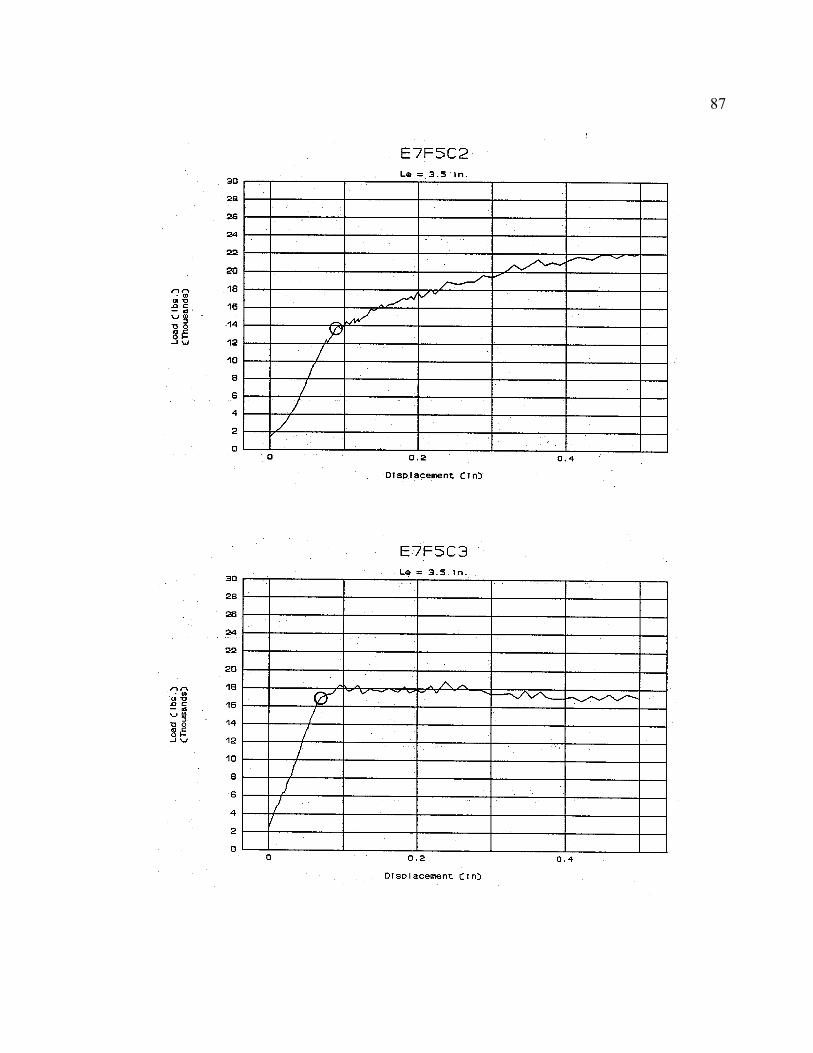
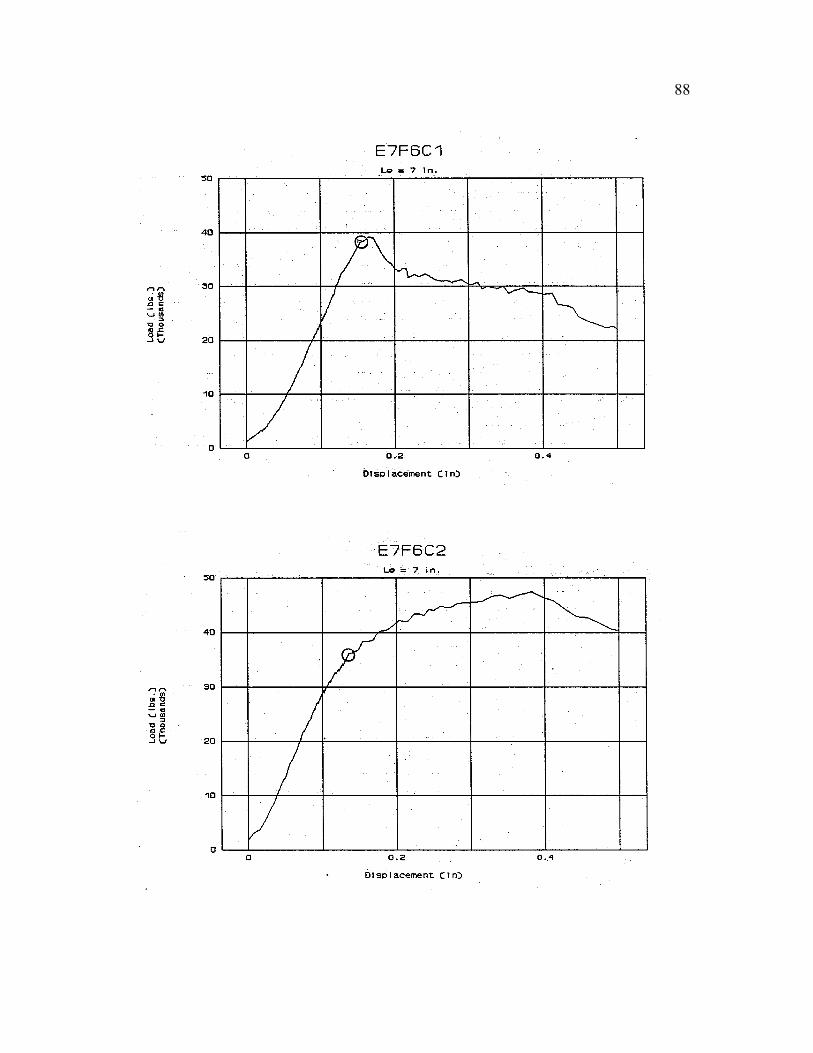
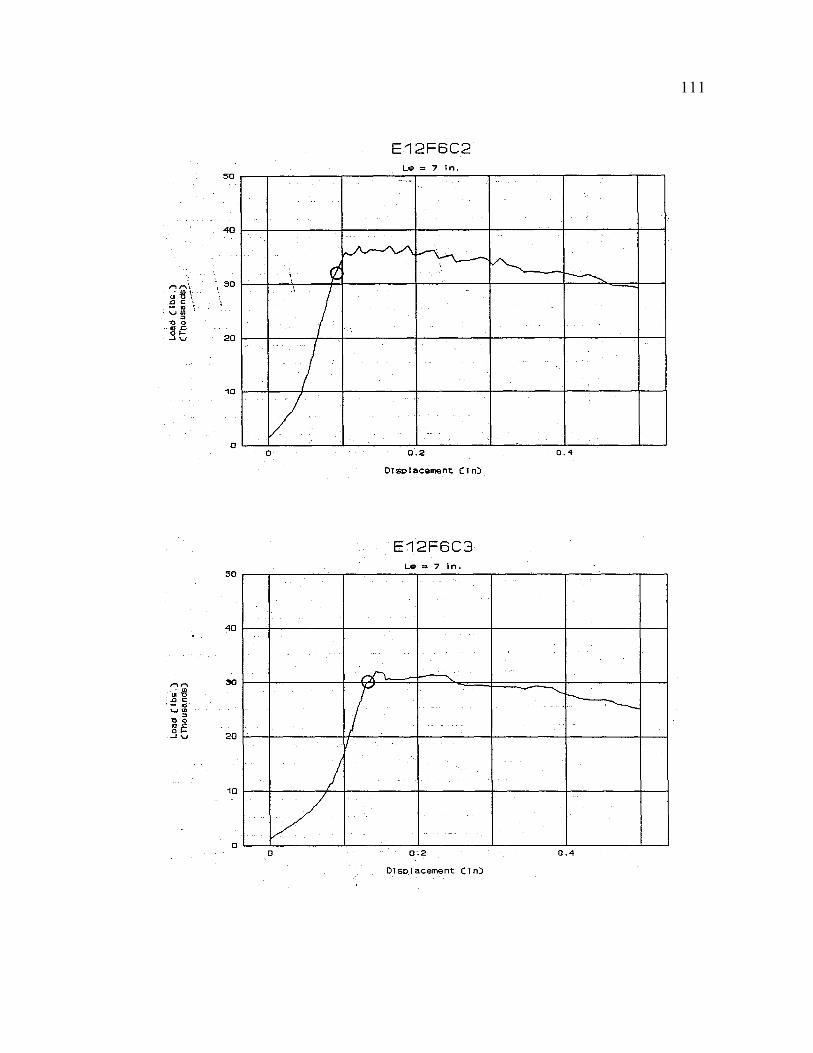
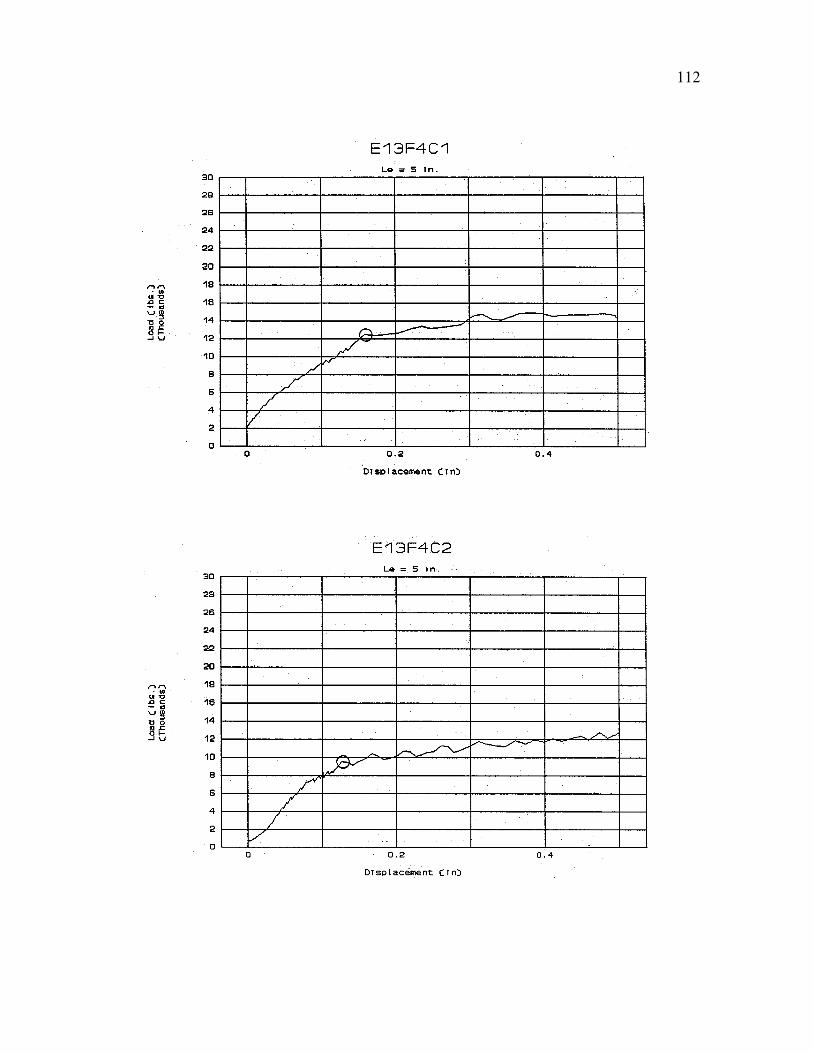
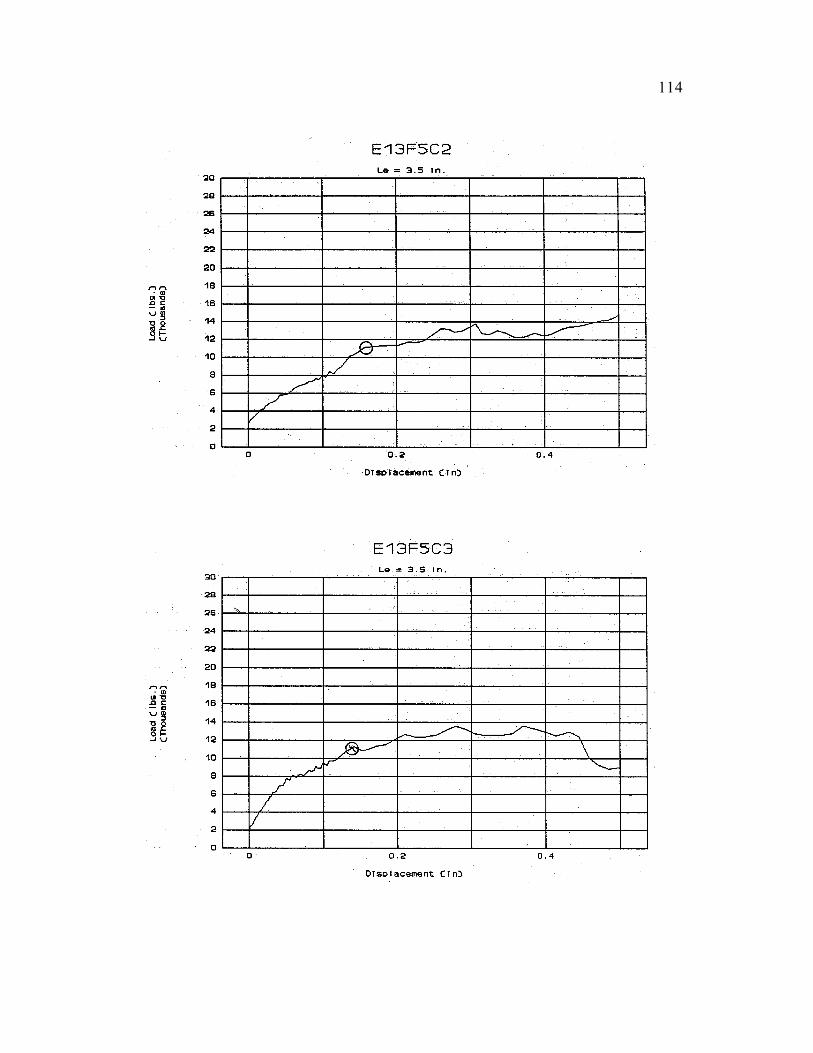
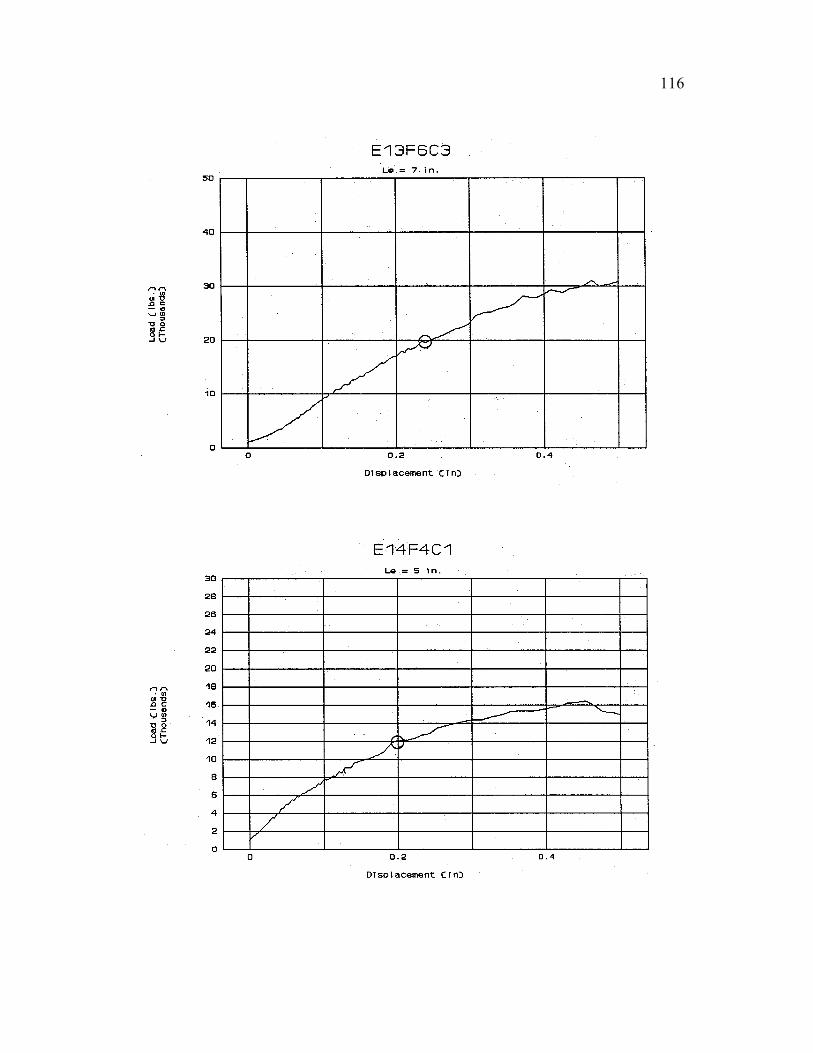
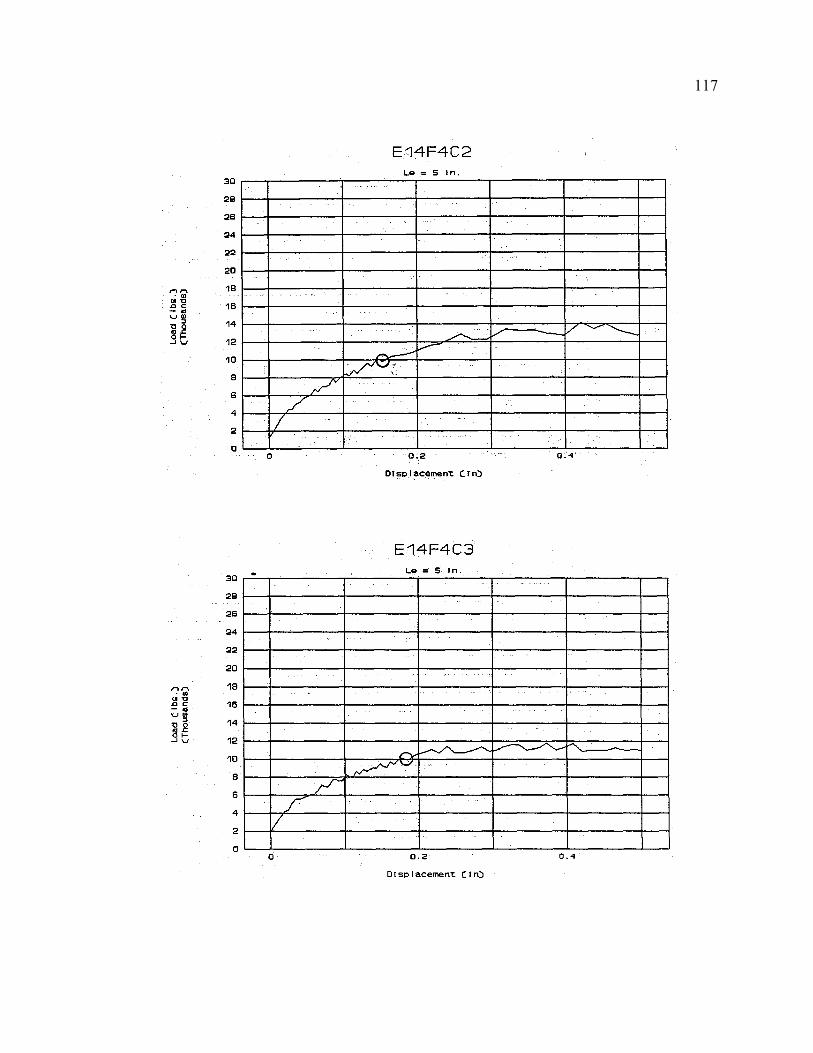
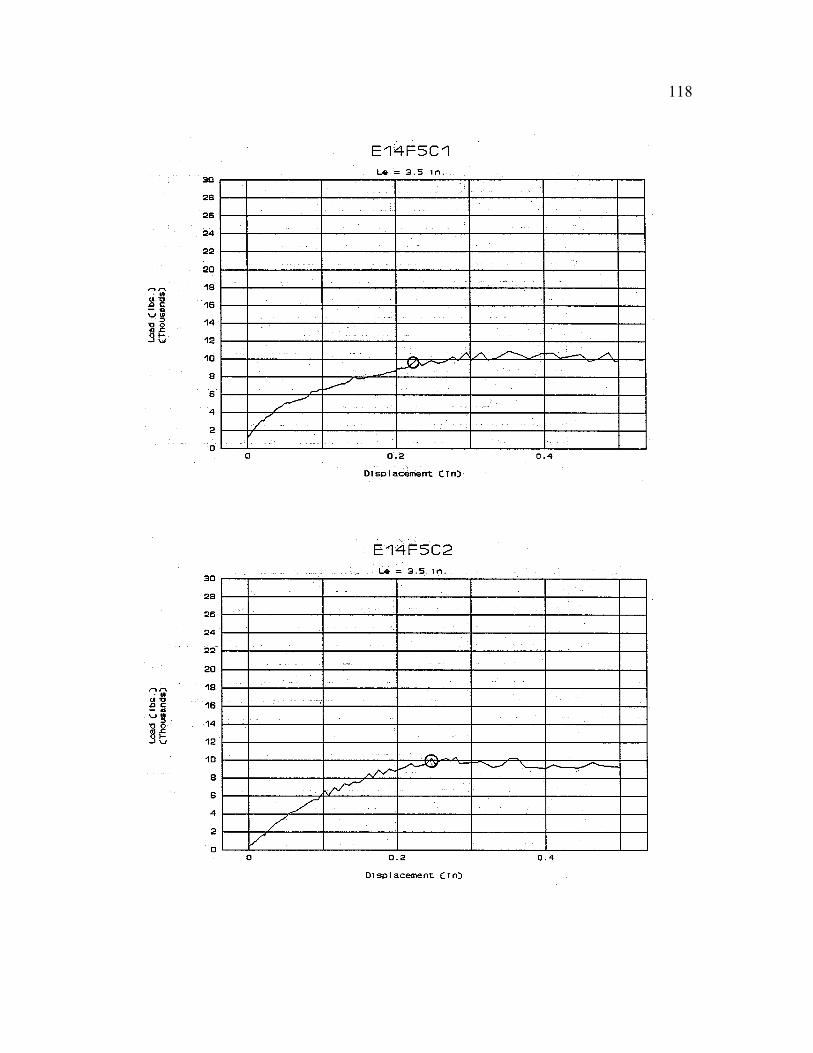
APPENDIX B
TABULATION AND-GRAPHS-FOR BASELINE TEST DATA
The baseline tests consist of fully-bonded anchors subjected to confined testing. The tests are
designated as described in Chapter 4.
55
56
57
58
59
60
75
76
77
78
79
80

81
82
83
84
85
86
87
88
89
90
91
92
93
94
95
96
97
98
99
100

101
102
103
104
105
106
111
112

113
114
115
116
117
118
119

120
121
122
123
124
125

126
127

128
129
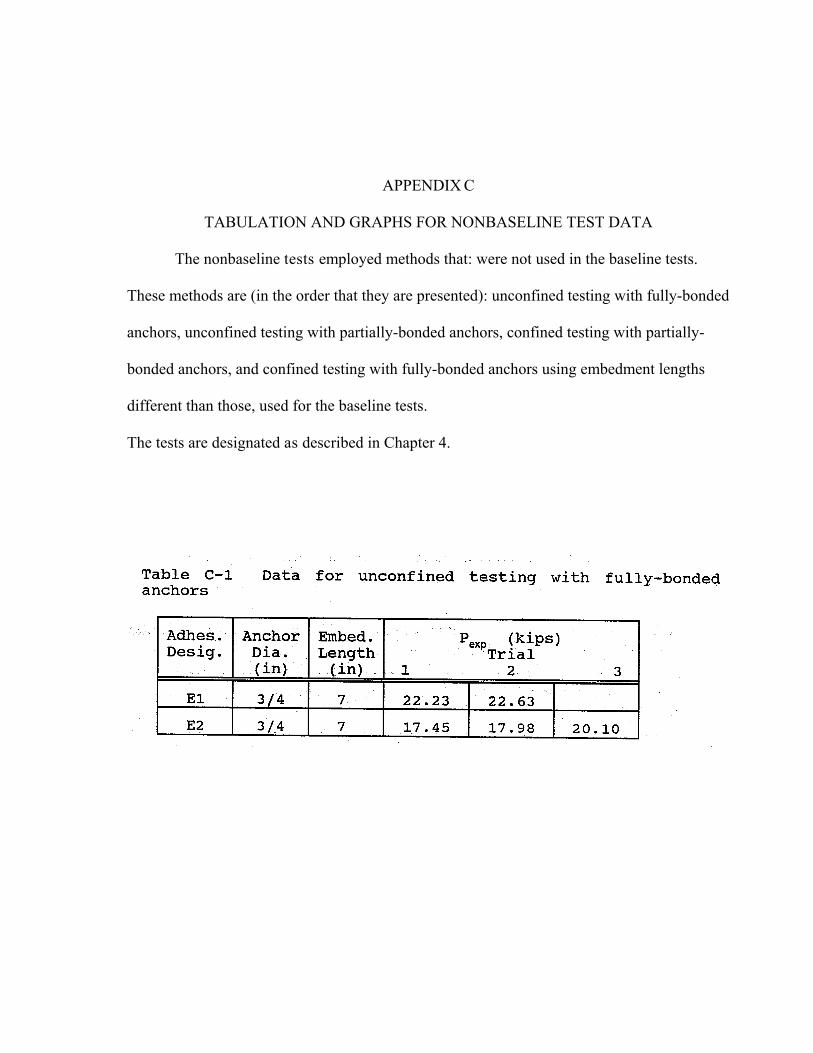
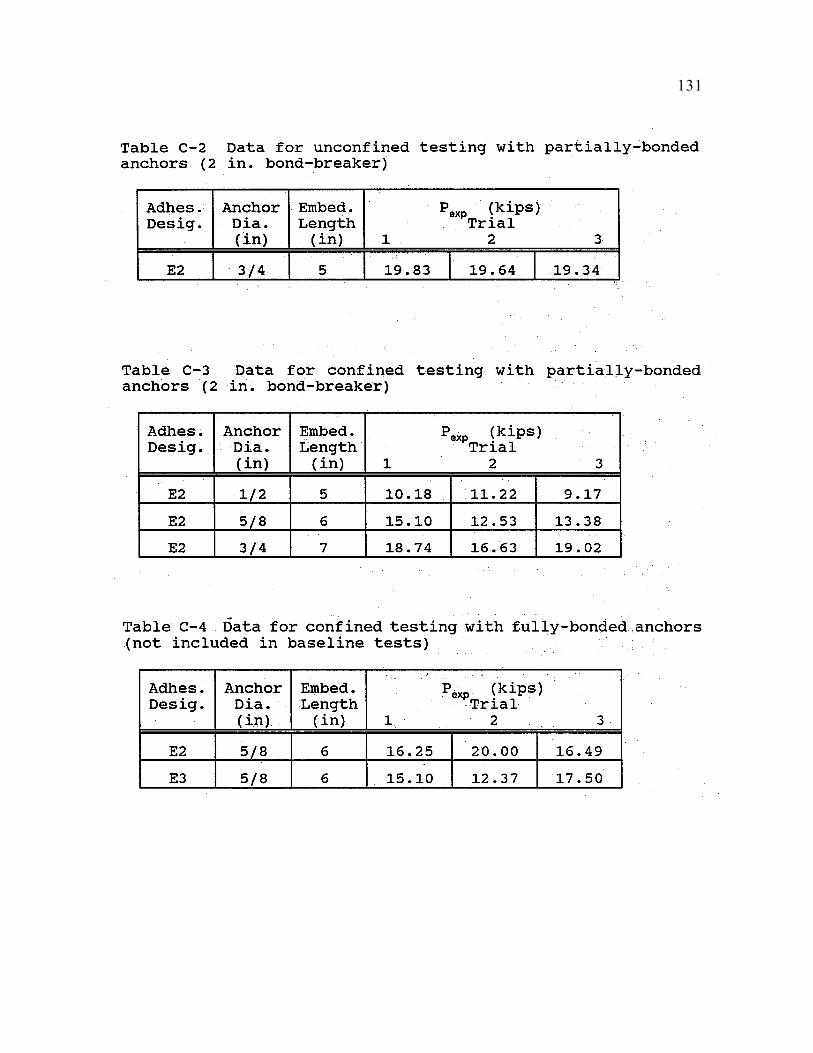
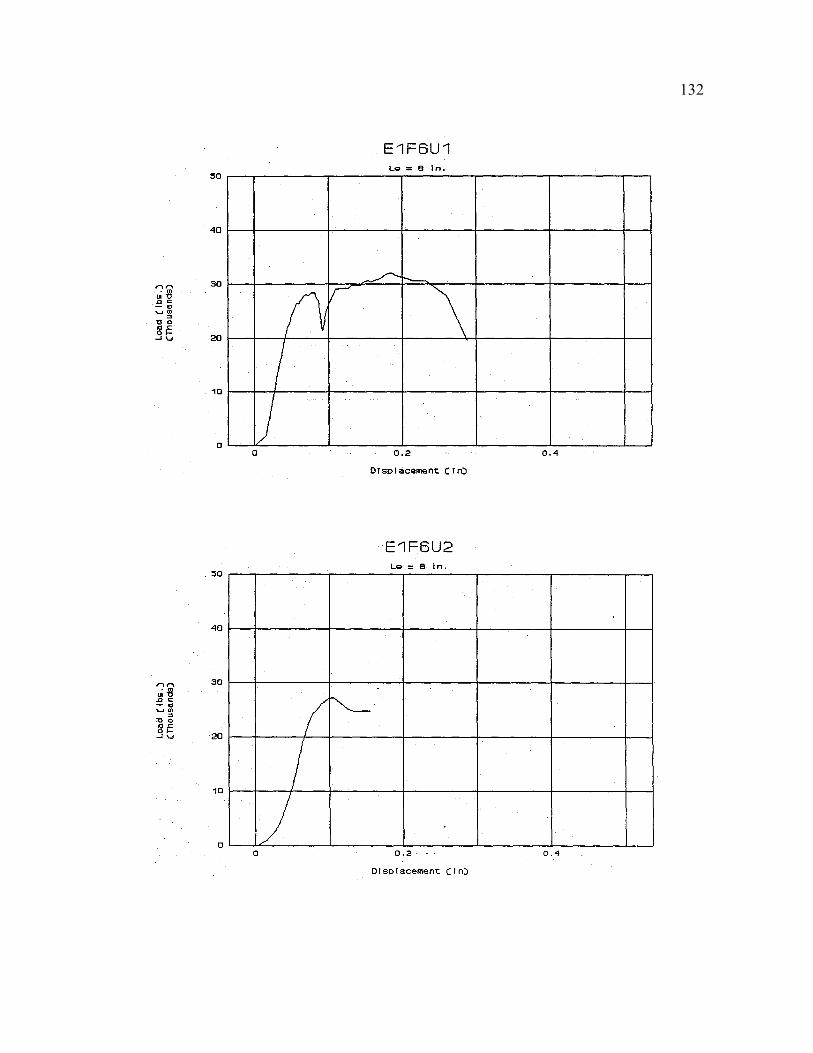
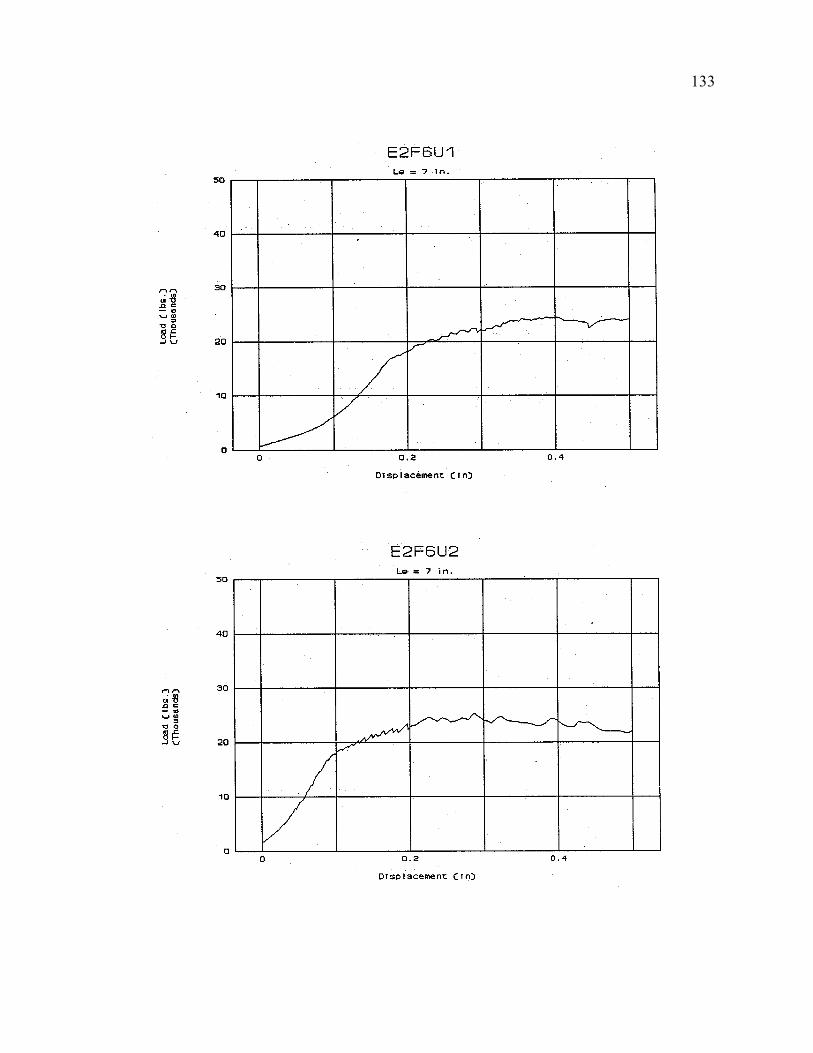
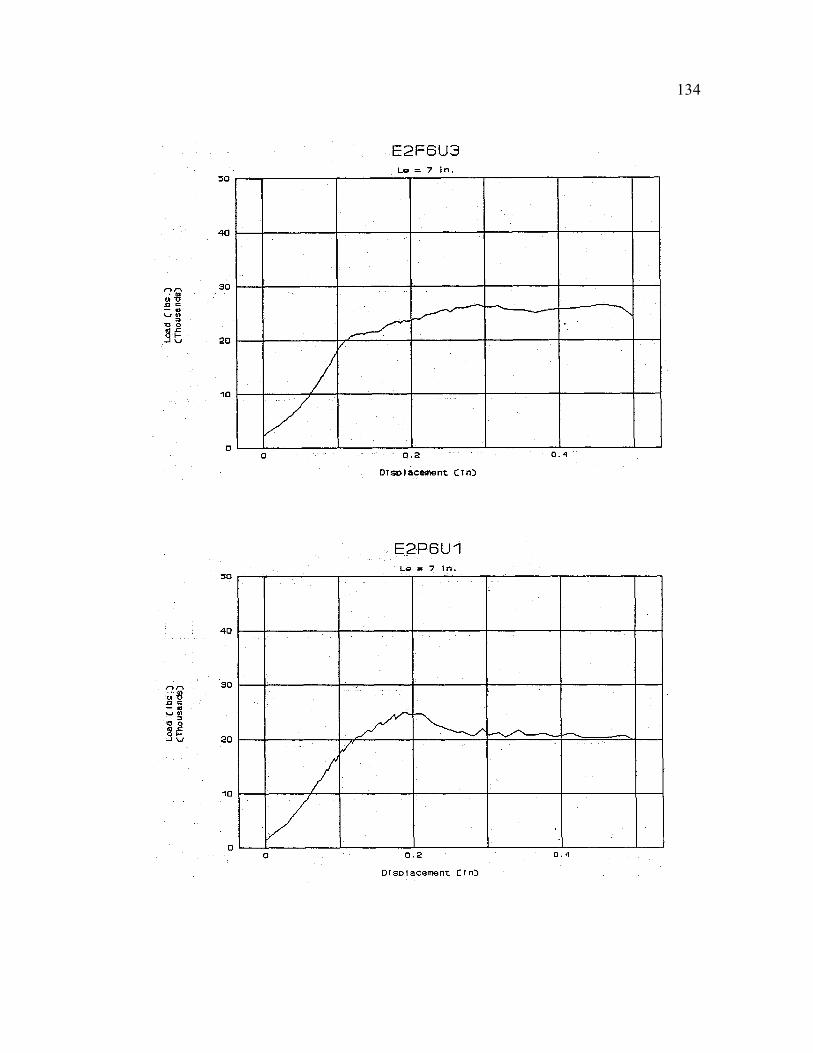
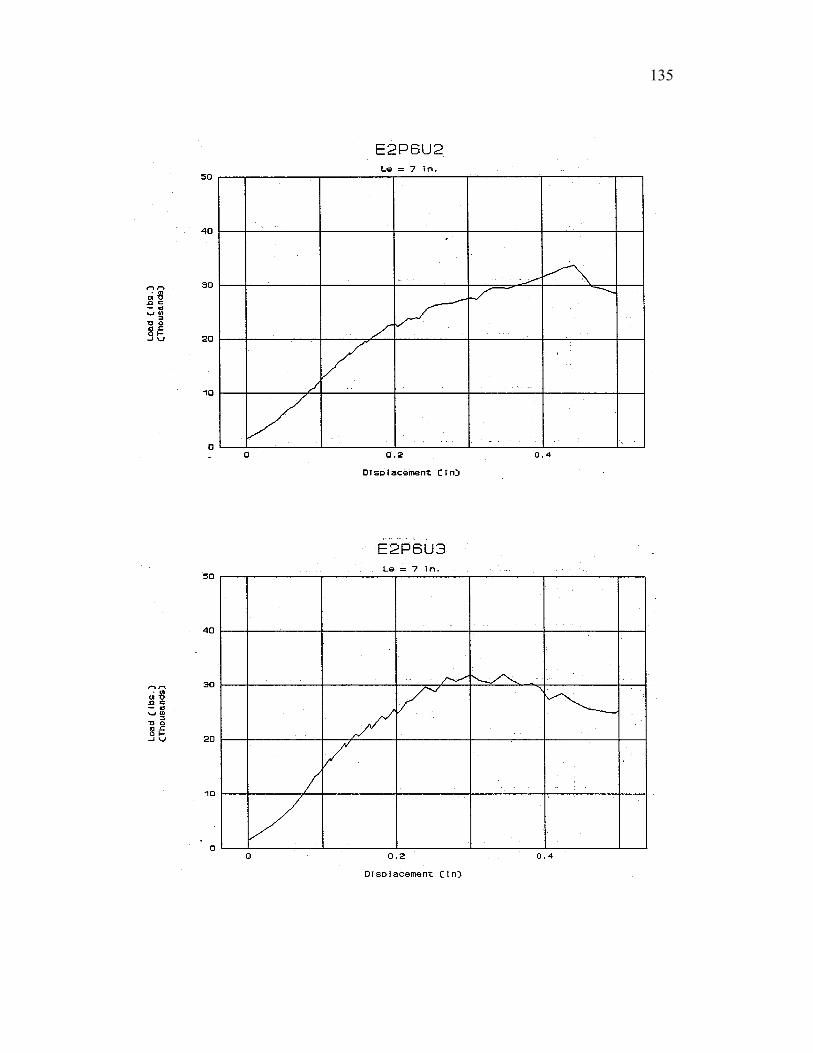
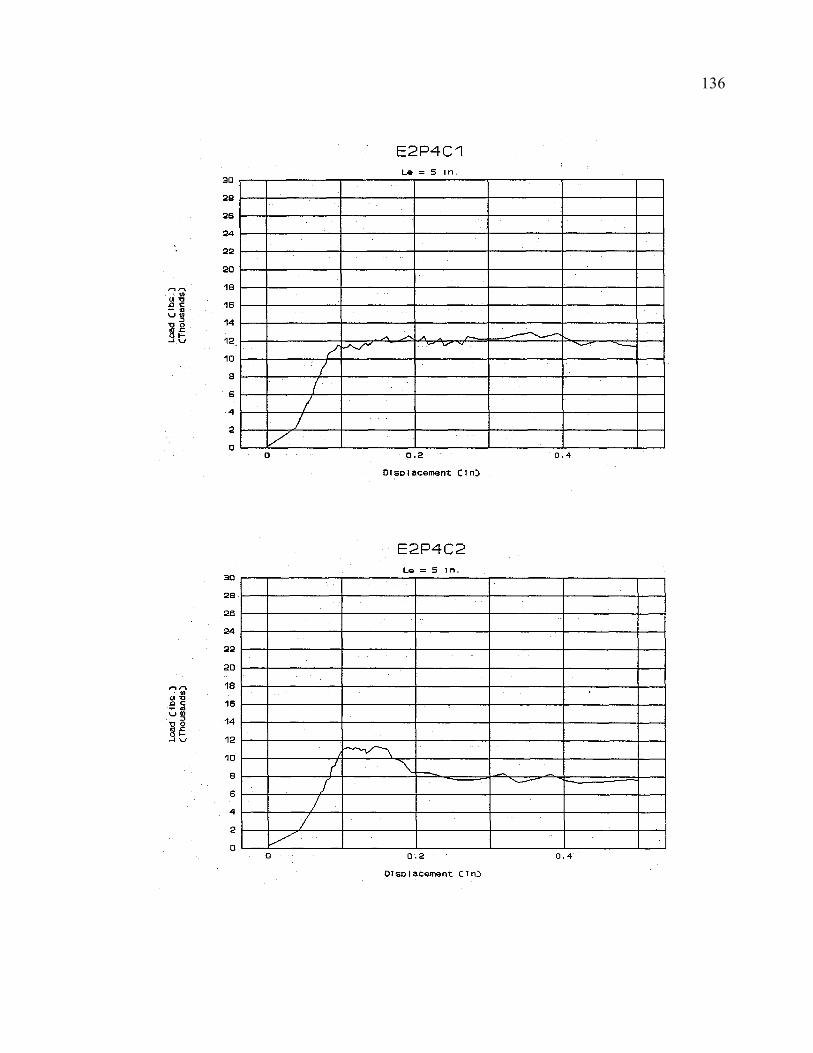
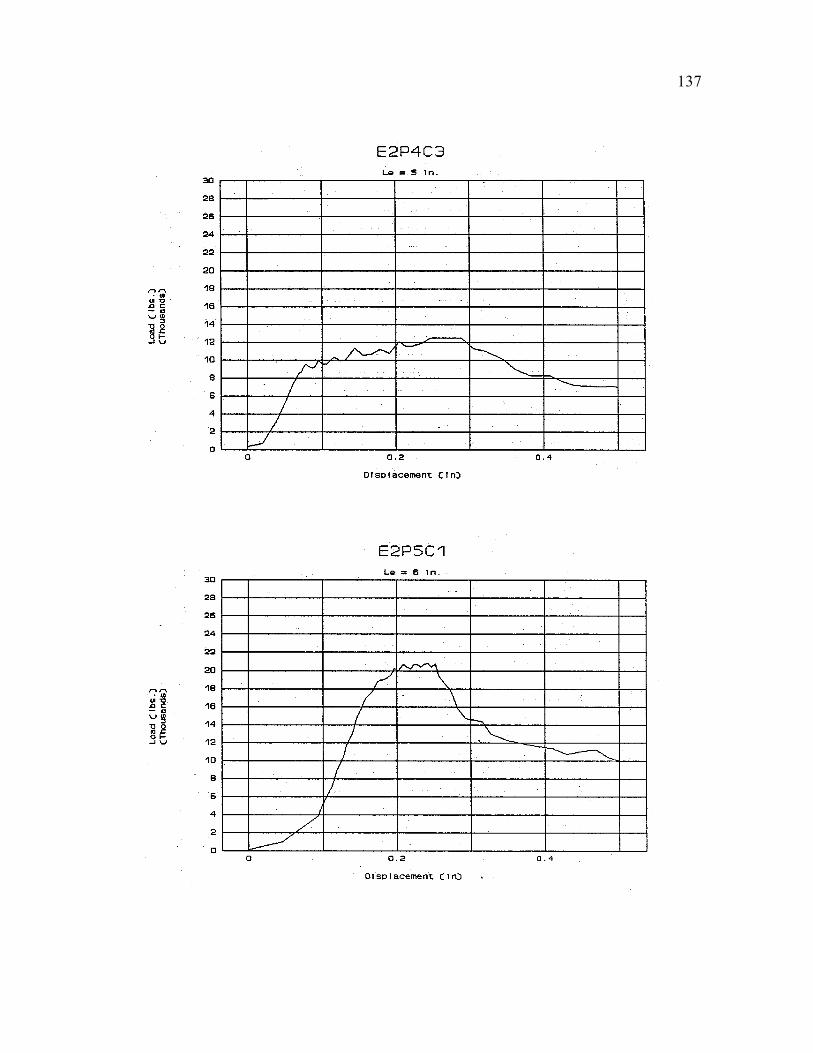
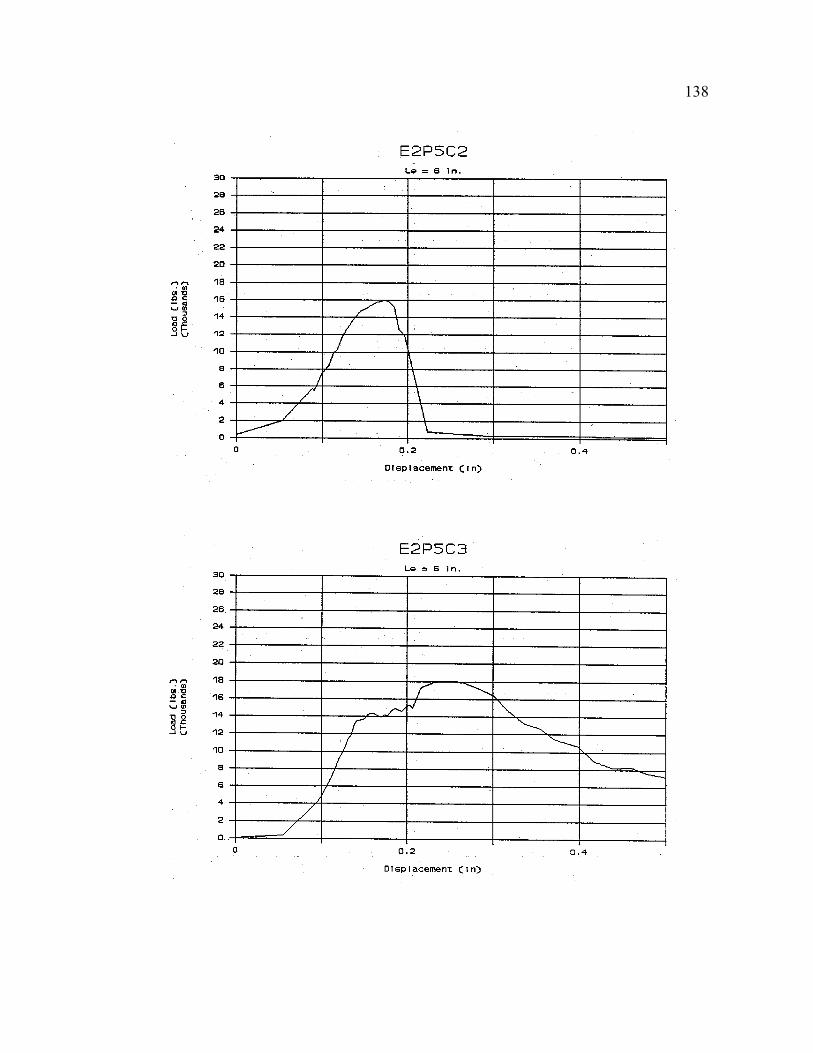
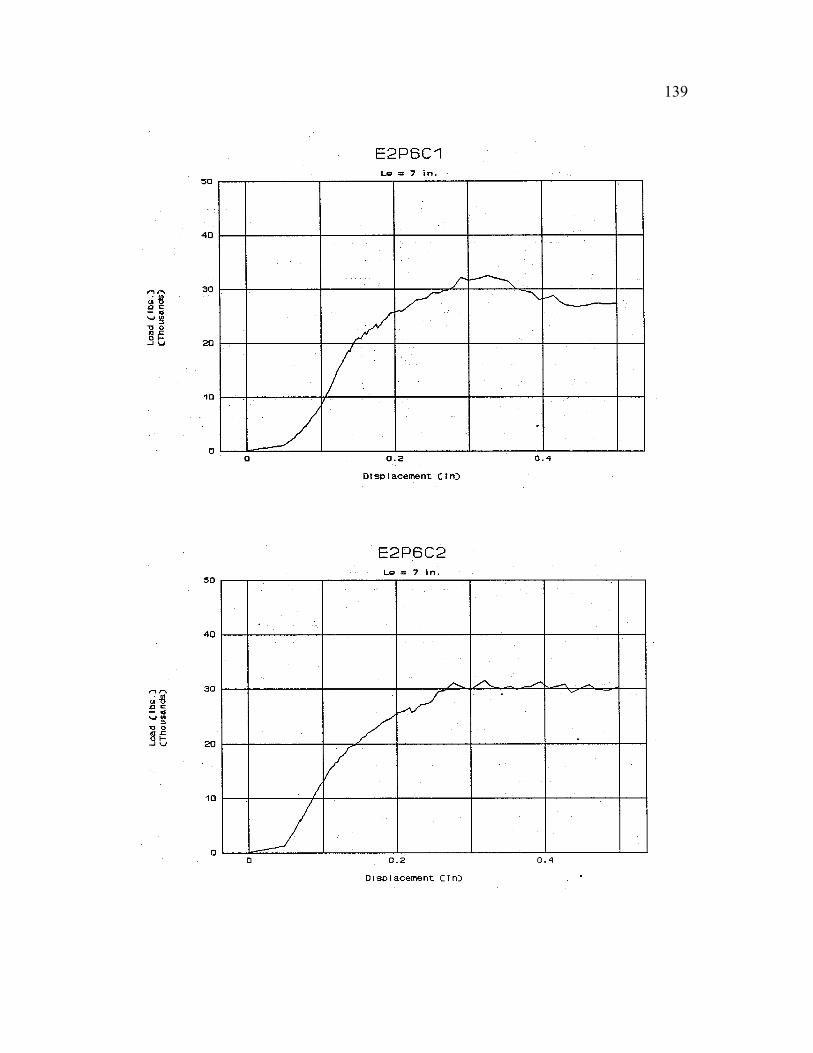
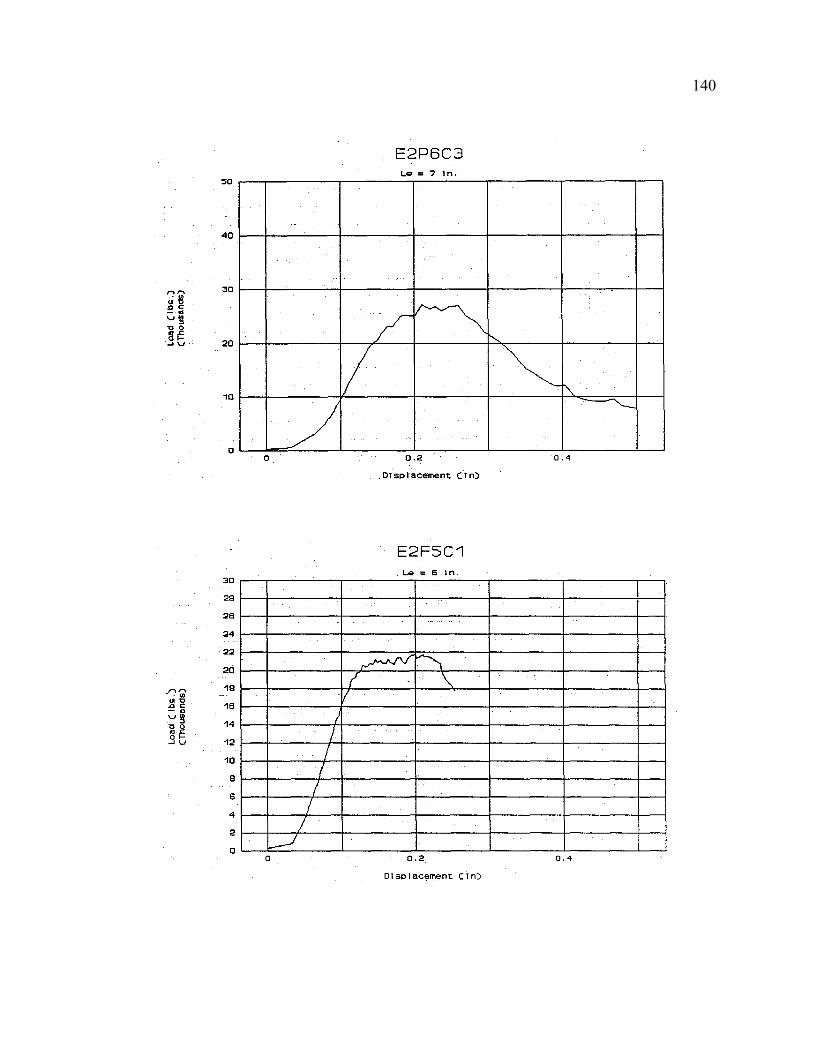
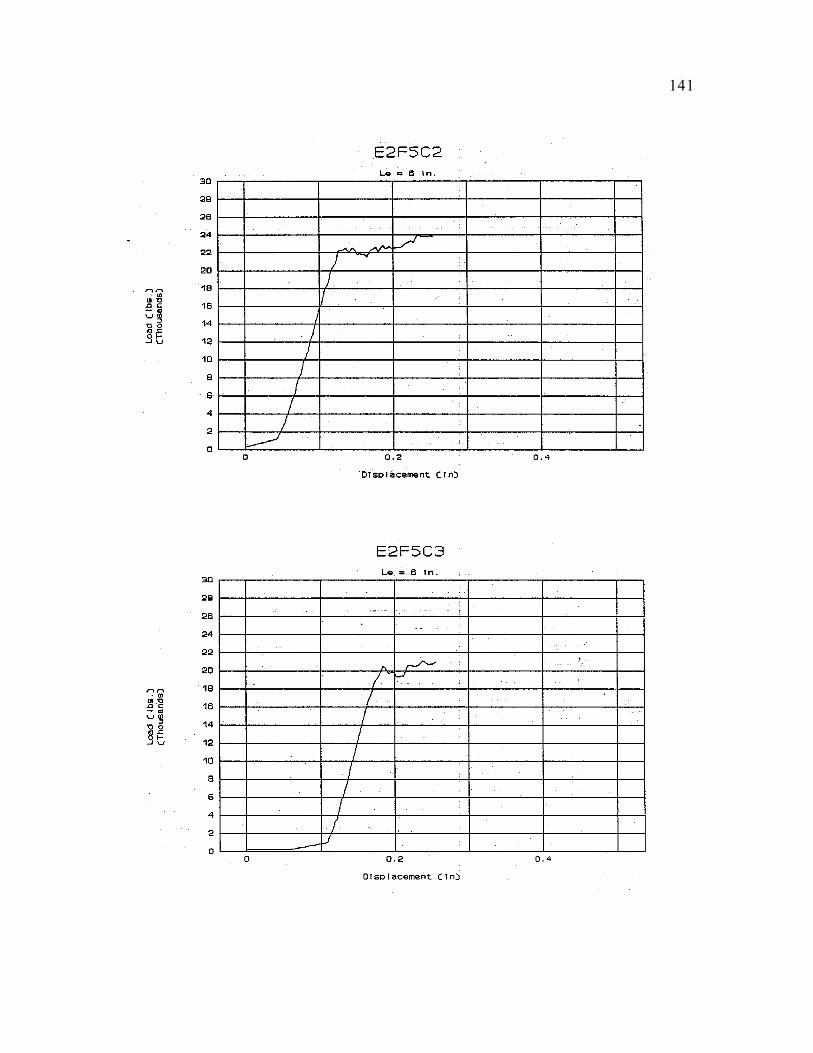
APPENDIX C
TABULATION AND GRAPHS FOR NONBASELINE TEST DATA
The nonbaseline tests employed methods that: were not used in the baseline tests.
These methods are (in the order that they are presented): unconfined testing with fully-bonded
anchors, unconfined testing with partially-bonded anchors, confined testing with partially-
bonded anchors, and confined testing with fully-bonded anchors using embedment lengths
different than those, used for the baseline tests.
The tests are designated as described in Chapter 4.
131
132
133
134
135
136
137
138
139
140
141

142
143

APPENDIX D
TABULATION OF EXPERIMENTALLY DETERMINED CONSTANTS
144
145
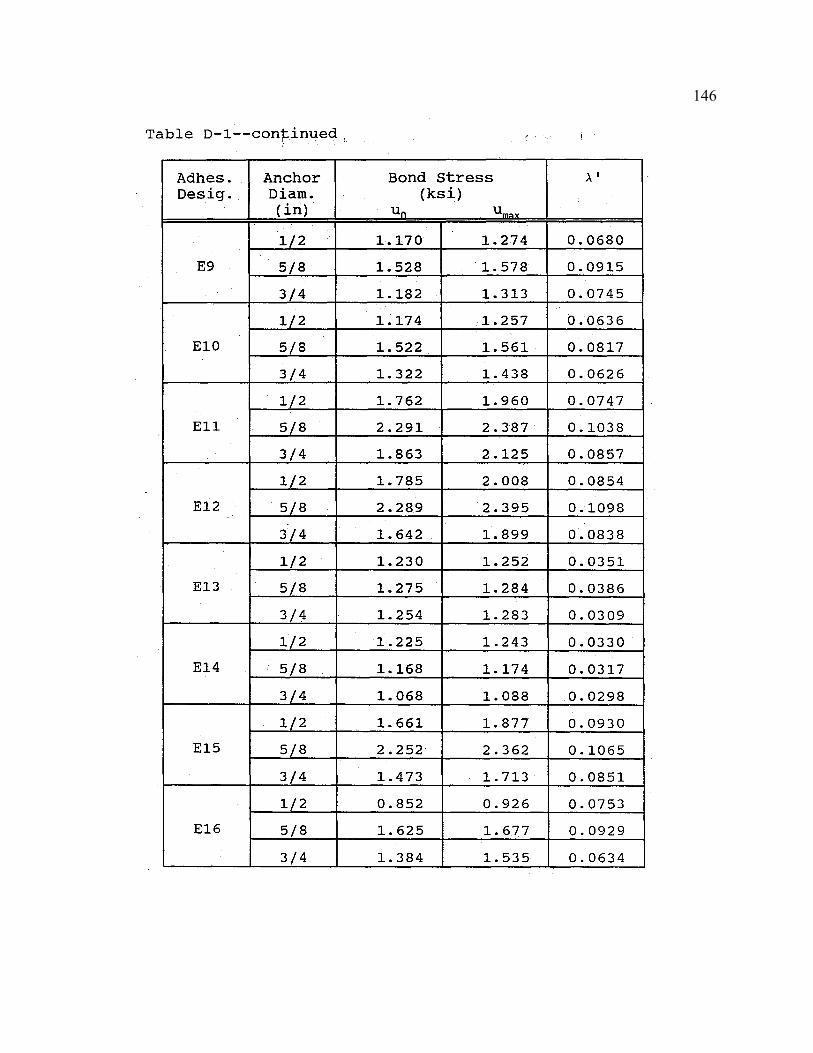
146
147
APPENDIX E
QUALIFICATION OF STRUCTURAL ADHESIVES
E.1 General
This specification describes the test procedure for the qualification of structural
adhesives. The values determined by this qualification procedure are strictly valid only
for adhesive anchors placed in dry, vertical holes drilled in FDOT Class II concrete,
cured for at least 24 hours before loading, and subjected to short term tensile loads.
Conditions not covered by this specification include horizontal or overhead hole
orientation, elevated temperatures, wet installation, variations in concrete strength,
variations in aggregate, variations in cure time, and long term loading. If any of these
conditions are present, additional testing may be required.
E.2 Mixing and Application
Structural adhesives for bonding steel anchors to hardened concrete shall be
mixed, applied and cured in accordance with the manufacturer's directions, or as might be
directed otherwise by the Engineer.
148
149
E.3 Performance Test Preparation
E.3.1 Concrete Test Specimens
The concrete test specimens shall be constructed of FDOT Class II concrete unless
directed otherwise by the Engineer. The concrete shall be cured for at least 28 days.
The dimensions of the concrete test specimens shall be sufficient so that drilling and
testing do not cause spalling of the concrete or splitting of the test specimen.
E.3.2 Anchor Steel
The steel used for adhesive anchors shall be ASTM A193-B7 rod. The steel shall be
cleaned in mineral spirits or other solvents to remove any oily residue. The anchor
diameters shall be 1/2", 5/8", and 3/4" with the embedment lengths of 5", 3.5", and 7"
respectively. Three tests shall be performed per anchor diameter for a total of 9 tests
per adhesive product.
E.3.3 Anchor Installation
Drill holes vertically in the hardened concrete test specimen with a rotary hammer
drill, unless directed otherwise by the Engineer. Hole diameters shall be 9/16" for the
1/2" anchor, 3/4" for the 5/8" anchor, and 7/8" for the 3/4" anchor. Holes shall be
cleaned out with compressed air until the dust leaving the hole is no longer
noticeable. A stiff
150 bottle brush connected to an electric drill shall then be used to loosen dust
along the sides of the hole. Holes shall again be cleaned out with compressed
air until residual dust is no longer visible.
The adhesive shall be allowed to cure for 24 hours plus or minus 2 hours
unless specified otherwise by the Engineer. Remove excess adhesive after
curing.
E.4 Performance Test Procedure
E.4.1 Data Acquisition
The adhesive anchor shall be pulled from the concrete using a center hole
hydraulic ram. During the test, the concrete around the anchor shall be
confined using a steel plate, mounted between the surface of the concrete and
the hydraulic ram. The plate shall have a hole with a diameter 1/2" greater
than that of the anchor. Load-displacement data shall be recorded (at least one
reading every 3 sec.) until a displacement of 1/2" or greater has been recorded.
The data shall be recorded in the form of a load-displacement graph.
Displacement shall be measured from the top of the anchor relative to the
surface of the concrete. The anchor shall be pulled from the concrete at a rate
such that the test duration is no less than 2 minutes.
151
E.4.2 Data Interpretation
The slope of the initial straight line portion of the load-displacement graph represents the
stiffness k of the adhesive anchor system. The failure load P is where the slope of the
graph begins to deviate from the straight line portion of the graph. Note that this value is
not necessarily the maximum load value obtained during the test.
E.5 Adhesive Properties
E.5.1 General
The values of uo, λ’, and umax shall be determined for each product as described
in the following sections.
E.5.2 Bond Stress uo
The following equation shall be used to calculate the bond stress u o :
ldPu
π=0
where P is the failure load, d is the hole diameter, and ℓ is the embedment length.
E.5.3 Stiffness Parameter λ'
A sample of anchor steel for each diameter (3 samples) shall be subject to tensile
testing. The steel shall be

152
axially loaded past yield. Load-displacement data shall be recorded in the form of a
load-displacement graph for each sample. The slope of the initial straight line portion
of the load-displacement graph represents the stiffness ks of the anchor steel. A value
for ks shall be recorded for each anchor size.
For each anchor size, the term AE shall be determined by the following
equation:
gskAE l=
where ℓg is the gage length of the specimen.
For each anchor size, the adhesive stiffness parameter λ' shall be determined
by the following equation:
=
ddAEk l'tanh' λλ
where k is the average stiffness of the adhesive for the specific anchor size, d is the
diameter of the hole for the specific anchor size, and ℓ is the anchor embedment
length for the specific anchor size.
An average of the three values of λ' (one for each anchor size) may be used to
calculate the bond stress umax of the adhesive.
153
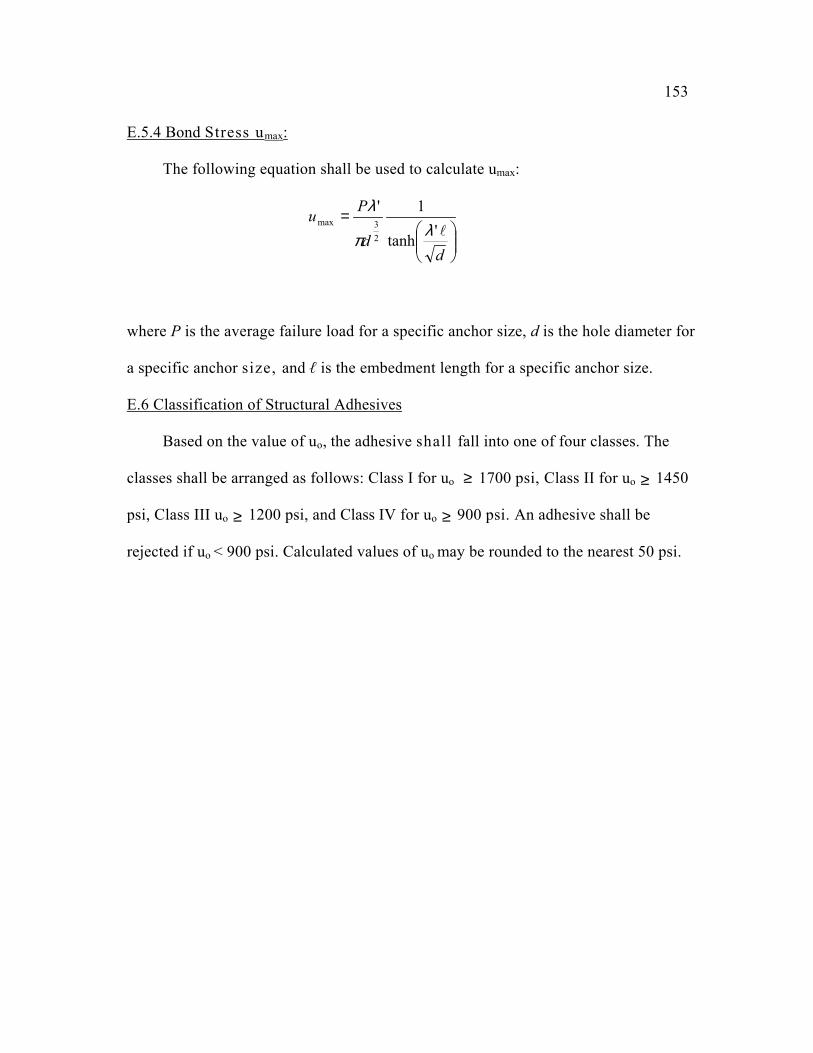
E.5.4 Bond Stress umax:
The following equation shall be used to calculate umax:
=
dd
Pl'tanh
1'
23max λπ
u λ
where P is the average failure load for a specific anchor size, d is the hole diameter for
a specific anchor size, and ℓ is the embedment length for a specific anchor size.
E.6 Classification of Structural Adhesives
Based on the value of uo, the adhesive shall fall into one of four classes. The
classes shall be arranged as follows: Class I for uo 1700 psi, Class II for u≥ o ≥ 1450
psi, Class III uo ≥ 1200 psi, and Class IV for uo ≥ 900 psi. An adhesive shall be
rejected if uo < 900 psi. Calculated values of uo may be rounded to the nearest 50 psi.

ACKNOWLEDGEMENTS
This successful completion of this project would not have been possible without the
contributions of materials, time, and technical expertise from the following
organizations:
Ackerman Johnson Fasteners
Covert Operations
Gunnebo (U.S.E. Diamond)
Hilti
ITW Ramset/Red Head
Molly
Sika-Bawl
154
REFERENCE LIST
American Society for Testing and Materials, "Standard Methods of Testing Bond
Performance of Adhesive-Bonded Anchors," Proposed ASTM Z1706z, American
Society for Testing and
Materials, Philadelphia, 1991.
American Society for Testing and Materials, "Standard Test Methods for Strength of
Anchors in Concrete and Masonry Elements," ASTM E488, 1984 Annual Book of
ASTM Standards,
American Society for Testing and Materials, Philadelphia, 1984.
Collins, D.M., R.A. Cook, R.E. Klingner, and D. Polyzois, "Load-Deflection Behavior of
Cast-In-Place and Retrofit Concrete Anchors Subjected to Static, Fatigue, and
Impact Tensile Loads," Research Report 1126-1, Center for Transportation
Research, University of Texas, Austin, Texas, February, 1989.
Daws, G., "Resin Anchors in Concrete," Civil Engineering (British), Part I, October 1978,
pp. 71-75,' Part II, December 1978, pp. 61-63.
Doerr, G.T., R.A. Cook, and R.E. Klingner, "Adhesive Anchors: Behavior and Spacing
Requirements," Research Report 11262, Center for Transportation Research,
University of Texas, Austin, Texas, March, 1989.
Florida Department of Transportation, "Qualified Products List," Florida Department of
Transportation Office of Value Engineering, Tallahassee, Florida, 1990.
Florida Department of Transportation, "Standard Specifications for Road and Bridge
Construction," Florida Department of Transportation, Tallahassee, Florida, 1986.
Klingner, R.E. and J.A. Mendonca, "Shear Capacity-of Short Anchor Bolts and Welded
Studs--A Literature Review," ACI Journal, Vol. 79, No. 5, Sept.-Oct. 1982.
155
156
Missouri Highway and Transportation Department, "Pull-Out Tests on Chemical Bonding
Agents," Test Method MHTD T492-90, Missouri Highway and Transportation Department,
Division. of Materials and Research, Jefferson City, Missouri, 1990.
Recommended