
DISCLAIMER
Disclaimer: The information and data contained in this document are for planning purposes only and should not be relied upon for final design of any project. Any information in this Transportation Concept Report (TCR) is subject to modification as conditions change and new information is obtained. Although planning information is dynamic and continually changing, the District 7 Division of Planning and Local Assistance makes every effort to ensure the accuracy and timeliness of the information contained in the TCR. The information in the TCR does not constitute a standard, specification, or regulation, nor is it intended to address design policies and procedures.
Mission – Provide a safe, sustainable, integrated and efficient transportation system to
enhance California’s economy and livability
California Department of Transportation

105 - TCR Table of Contents
About the Transportation Concept Report………………………………………………..1
Stakeholder Participation..……………………………………………….……………….1
Executive Summary and Concept Summary Table….…………………………………2-4 Corridor Overview: Route Segmentation and Segment……………………..………….5-6 Route Description and Route segments ………………………………………………….7 Route Designation and Characteristics……………………………………………….…..8 Community Characteristics and Land Use ………………………..……………….…….9 RSA of Cities Along Rte 105 ……….………………………………………………10-14 System Characteristics…………………………………………………………………..15 Ramp Meters Listing…………………………..……………………………………..16-17 Active Transportation .………………………………………………………………18-19 Transit Facility and Freight…………………………..………………………………20-23 Goods Movement Map and Environmental Consideration.……………………………..24 Corridor Performance….…………………………………………...……………………25 Key Corridor Issues……………………………………………………………….……..26 Corridor Concept…………………..……………………………………………...……. 27 Planned and Programmed Projects and Strategies……..……………………………….28 Conclusion ……………...……..……………………………………………………….. 29 Appendix and Resources…………….……………………………………………….30-34

1
ABOUT THE TRANSPORTATION CONCEPT REPORT
System Planning is the long-range transportation planning process for the California Department of Transportation (Caltrans). The System Planning process fulfills Caltrans’ statutory responsibility as owner/operator of the State Highway System (SHS) (Gov. Code §65086) by identifying deficiencies and proposing improvements to the SHS. The System Planning process is primarily composed of four parts: the District System Management Plan (DSMP), the Transportation Concept Report (TCR), the Corridor System Management Plan (CSMP), and the Transportation System Development Plan (TSDP). The district-wide DSMP is a strategic policy and planning document that focuses on maintaining, operating, managing, and developing the transportation system. The TCR is a planning document that identifies the existing and future route conditions as well as future needs for each route on the SHS. The CSMP is a complex, multi-jurisdictional planning document that identifies future needs within corridors experiencing or expected to experience high levels of congestion. The TSDP is a list of planned and partially programmed transportation projects used to recommend projects for funding. These System Planning products are also intended as resources for stakeholders, the public, and partner, regional and local agencies.
STAKEHOLDER PARTICIPATION Stakeholder participation was sought throughout the development of the I-105 TCR. Outreach involved internal and external stakeholders. Both internal and external stakeholders were asked to review the document for comments, edits, and for consistency with the intent of existing plans, policies, and procedures. The process of including and working closely with stakeholders adds value to the TCR, allows for outside input and ideas to be reflected in the document, increases credibility and helps strengthen public support and trust.
TCR Purpose California’s State Highway System needs long range planning documents to guide the logical development of transportation systems as required by law and as necessitated by public, stakeholders, and system users. The purpose of the TCR is to evaluate current and projected conditions along the route and communicate the vision for the development of each route in each Caltrans District during a 20-25 year planning horizon. The TCR is developed with the goals of increasing safety, improving mobility, providing excellent stewardship, and meeting community and environmental needs along the corridor through integrated management of the transportation network, including the highway, transit, pedestrian, bicycle, freight, operational improvements and travel demand management components of the corridor.

2
EXECUTIVE SUMMARY:
INTERSTATE 105 The main purpose of this TCR is to evaluate current and projected conditions along the route and suggest a configuration for I-105 that will meet projected demand. Historically the freeway system in Southern California is highly congested and this trend will continue into the future. Due to financial, environmental, right of way and political constraints, it is very difficult for Caltrans to continue to add more lanes to the system. Recognizing these constraints, the planned/programmed projects and strategies in the TCR are within a framework of programming and implementation constraints and regional policy. In addition to these planned/programmed projects and strategies, the TCR also suggest a configuration for I-105 that will meet future demand on this route. The suggested configuration is meant only to show the severity of future conditions and what it would take to attain those LOS. It is Caltrans’ goal to provide improved mobility whenever possible. The I-105 Transportation Concept Report (TCR) is divided into several major sections; three of the sections – the Corridor Performance, System Characteristics and Corridor Concept – are the core of the document. All of the remaining sections provide a context for analyzing the Route105 corridor and document the data resources.

3
CONCEPT SUMMARY TABLE CONCEPT – 2035 FACILITY (Source 2012 – 2025 RTP/SCS)
Peak Truck Peak Concept Concept
Dir. Hour Hour 2035 LOS D LOS F0
Segment ADT Split (both dir.)
(both dir.) Baseline RTP Attainment Attainment
131,300 58.0% 9,200
(7.7%) 440
(4.8%)
6 MF
8 -- 1 V/C LOS (Begin FWY to
I-405) 1.00 F0
232,000 58.0% 17,800
(7.7%) 570
(3.2%)
6 MF + 2 HOV
10 10 2 V/C LOS (I-405 to I-110) 1.32 F1
232,200 52.5% 17,100
(7.4%) 550
(3.2%)
6 MF + 2 HOV
10 -- 3 V/C LOS (I-110 to I-710) 1.15 F0
210,100 52.9% 14,900
(7.1%) 880
(5.9%)
6 MF + 2 HOV
10 -- 4 V/C LOS (I-710 to I-605) 1.01 F0
18,800 58.0% 1,300 (7.1%)
60 (4.7%)
4 MF
-- -- 5 V/C LOS (I-605 to
Studebaker Road) 0.64 C
Source: 2012-2035 RTP/SCS * The number of lanes in the LOS D Attainment column is for both directions. LOS D Attainment indicate how many lanes it
would require to achieve LOS D. It is meant show the severity of future conditions and what it would take to achieve LOS D. Caltrans is not suggesting that it is our plan to build the facility to achieve the LOS
D. * The number of lanes in the LOS F0 attainment column is for both directions. The data in the LOS FO attainment column is
only meant to show the severity of congestion on our system and what it would require to achieve that level of service. We recognize the difficulty in achieving the desired LOS given the financial, environmental, right of way and political constraints. However, it is Caltrans' goal to provide improved mobility when feasible.
* Sometimes the model output implies that there would be aux. lanes (each direction) and aux. lanes are given only half capacity. That is why there are instances where we have odd number of lanes for both direction.
* The 2035 Baseline includes all planned and programmed projects in the 2012-2035 RTP/SCS * For consistency with 2012-2035 RTP/SCS, year 2008 and 2035 were
used. * 2008 & 2035 data are derived from the 2012-2035 RTP/SCS model. Data in this report is meant to be used for comparison
purposes only and are not to be use for specific projects without further analysis.

4
Concept Rationale Route 105 is the major east-west commuter highway in southern part of Los Angeles County. It starts, on the west, at LAX (Los Angeles Airport) in El Segundo passing through Hawthorne, Paramount, and then terminating at Studebaker Road after I-605 in Norwalk. Interstate 105 (abbreviated I-105, and colloquially referred to as “The 105” (pronounced the one-oh-five)) is an interstate Highway in southern Los Angeles County, California that runs east west from near Los Angeles International Airport (LAX) to Norwalk. It is officially known as the Glenn Anderson Freeway for the Congressman who advocated its construction. I-105 has also been referred to as the Century Freeway.
This route is part of the California Freeway and Expressway System.
Traffic volume is forecasted to increase on I-105 by 2035 and will require additional lanes to achieve the acceptable concept level of service. Several capacity improvements are planned, programmed, and recommended for this corridor.
Proposed Projects and Strategies There are several capacity increasing and mainline improvements planned or programmed for I-105 throughout the corridor in the 2012-2035 Regional Transportation Plan/Sustainable Communities Strategy (RTP/SCS). The 2012-2035 RTP/SCS also includes a regional Express/HOT Lanes network. The Green Line (Los Angeles Metro) runs in the median of I-105 for a majority of the route from Redondo Beach to Norwalk

5
CORRIDOR OVERVIEW
ROUTE SEGMENTATION
SEGMENTS DESCRIPTION BEGIN PM END PM
1 Begin FWY to I-405 R 0.000 R 2.106 2 I - 405 to I - 110 R 2.106 R 7.386 3 I-110 to I – 710 R 7.386 R 13.471 4 I-710 to I – 605 R 13.471 R 17.823 5 I – 605 to Studebaker Road R 17.823 R 18.145
This TCR analyzes Route 105 conditions using the "segment" as the study unit. Segments are generally defined as "freeway interchange to freeway interchange,” "county line to freeway interchange” or “freeway interchanges to the ‘end of freeway". The map on the following page illustrates these segments.

6

7
ROUTE DESCRIPTION
Interstate 105 begins at Sepulveda Boulevard (State Route 1) on the southern edge of Los
Angeles International Airport (LAX), adjacent to the city of El Segundo. It proceeds generally
eastward from there on, crossing the Los Angeles and San Gabriel Rivers before terminating just
east of the San Gabriel River Freeway (Interstate 605) in western Norwalk.
The freeway stops short of intersecting with the Santa Ana Freeway (Interstate - 5), its parent
interstate. Instead, the primary lanes of I-105 terminate at an at-grade intersection with
Studebaker Road.
Much of the length of the Century Freeway runs parallel to Imperial Highway. The Green Line
(Los Angeles Metro) runs in the median of I-105 for the majority of the route from Redondo
Beach to Norwalk.
Interstate 105 was an integral part of Caltrans 1960s master plan for the Southern California
freeway system, but did not open until 1993. Many factors contributed to the delay. The growth
of environmental movement in the 1960s created resistance to new freeway construction. Fiscal
difficulties brought about by the 1971 Sylmar earthquake and the California Tax revolt of the
late 1970s further hampered Caltrans’ construction efforts.
I - 105 is an interstate going on the East and West direction. It is used for Interstate,
interregional and intraregional travel. Route 105 provides access to the gateways cities and the
City of Long Beach and its Port. It provides interurban access to the (LAX) Los Angeles
International Airport, Norwalk and the City of Long Beach. Route 105 is designed as a six-lane
facility plus an exclusive median transit way for rail and HOV. The route has about a 320-foot
right-of-way with wider widths at the interchanges and transit stations. The route functions as a
major collector-distributor route feeding the Los Angeles Central Business District (LACBD)
and Orange County trips. Route 105 is essentially a six to eight lane freeway except for Segment
5 with four lane freeway. There are several freeway-to-freeway interchanges along Route 105. It
functions as a major collector and distributor route feeding Routes 405, 110, 710, and 605.

8
ROUTE DESIGNATION AND CHARACTERISTICS
ROUTE DESIGNATION AND CHARACTERISTICS
Segment No
Strategic Highway Network
Scenic Highway
Interregional Road System Route
High Emphasis Route
Focus Route
Federal Functional Classification
Major Goods Movement Route
1 Yes No No No No Other Principal Arterial
Yes
2 Yes No No No No Interstate Yes
3 Yes No No No No Interstate Yes
4 Yes No No No No Interstate Yes
5 Yes No No No No Other Principal Arterial
Yes
Segment No
Truck Designation
Rural/Urban/ Urbanized
Metropolitan Planning
Organization
Regional Transportation
Planning Agency
Congestion Management
Agency
Local Agencies
1 STAA Urban SCAG METRO METRO METRO
2 STAA Urban SCAG METRO METRO METRO
3 STAA Urban SCAG METRO METRO METRO
4 STAA Urban SCAG METRO METRO METRO
5 STAA Urban SCAG METRO METRO METRO

9
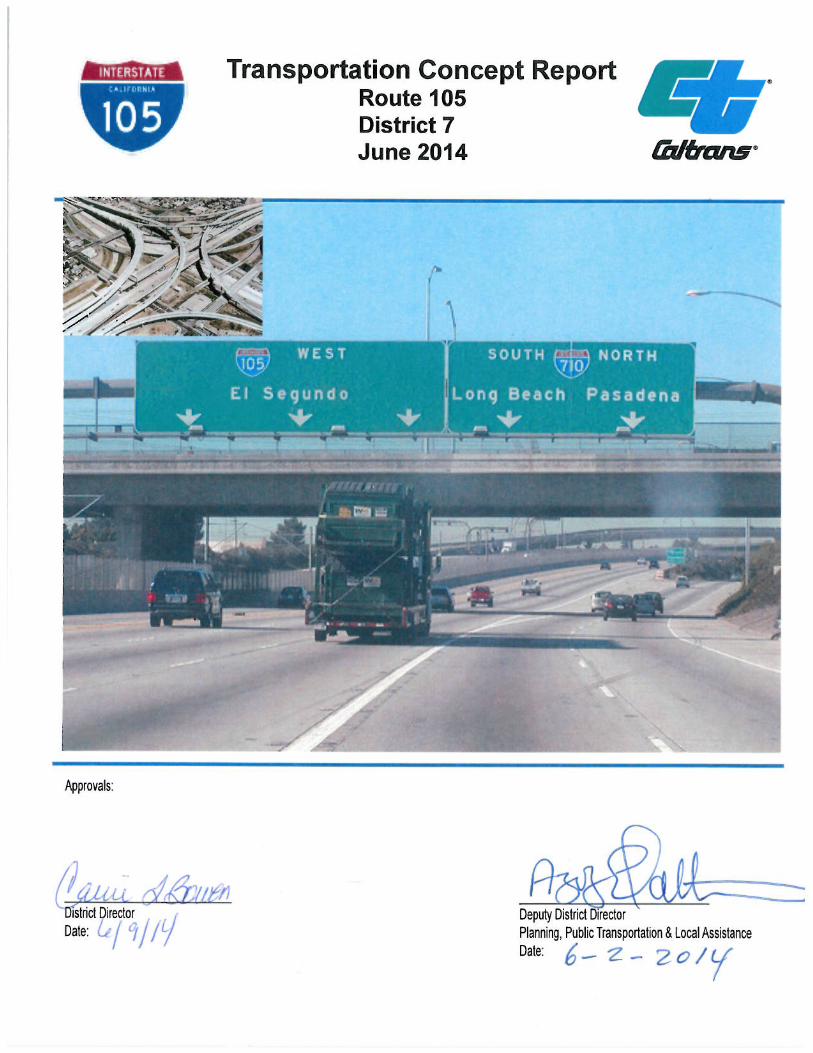
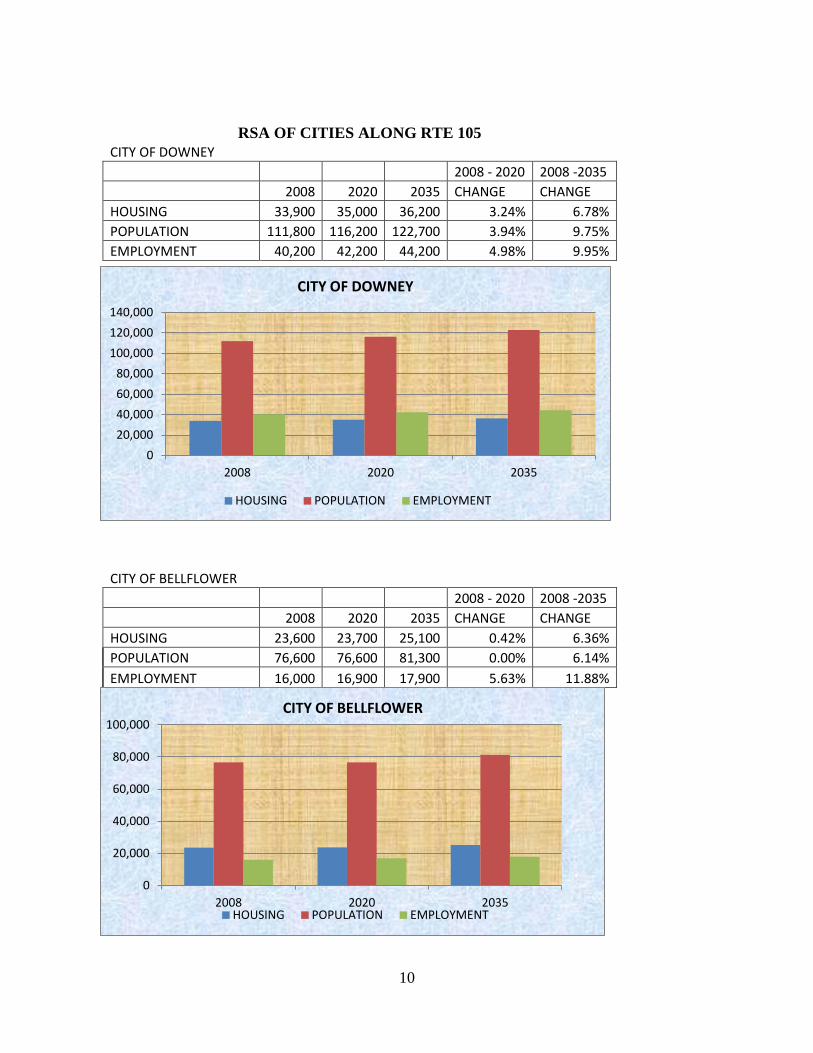
COMMUNITY CHARACTERISTICS The route extends through many cities. Route 105 is a major urban arterial providing parallel service to the north of State Route 91. It primarily serves as an inter-regional travel corridor for both commuters and freight transportation linking the Los Angeles International Airport (LAX) to the eastern part of Los Angeles County and San Bernardino and Riverside Counties. Route 105 is designed as a six-lane facility plus an exclusive median transit way for rail and HOV. The route has about 320-foot right-of-way with wider widths at the interchanges and transit stations. I-105 intersects four freeways: I-405, I-110, I-605 and I-710 and ten local streets. There are several arterial streets paralleling I-105 that provides alternative routes to commuters wishing to avoid peak hour congestion on the freeway. Currently, some of the streets fail to provide effective alternatives due to physical inadequacies, numerous traffic signals, access conflicts, and general congestion. Improvements will be required in order to provide efficient alternatives for commuters. State Route 91 (SR-91) and Imperial Highway are parallel to I-105 and it traverses an urbanized area through Inglewood, Hawthorne and Norwalk. LAND USE Interstate 105 traverses few of the Southern California Association of Government’s (SCAG) Regional Statistical Areas (RSA). The following graphs illustrate projected growth in these areas between 2008 and 2035, and are provided to give perspective to socio-economic conditions in the I-105 corridor. Included are data on housing, population and employment. The I -105 corridor is congested in certain areas, highly developed, and varies from residential to commercial. The many significant trip generators along this corridor include: City of El Segundo City of Gardena City of Hawthorne City of Inglewood City of Compton City of Lynwood City of Paramount City of South Gate City of Downey City of Bellflower Los Angeles International Airport The Inglewood Forum Costco Shopping Center. Significant growth in housing, population, and employment are generally projected throughout the I-105 corridor. Here are some projected social economic growth in the cities along Route I-105 corridor area per the SCAG 2012 – 2035 RTP/SCS GROWTH FORECAST.
10
RSA OF CITIES ALONG RTE 105
CITY OF DOWNEY 2008 - 2020 2008 -2035
2008 2020 2035 CHANGE CHANGE HOUSING 33,900 35,000 36,200 3.24% 6.78% POPULATION 111,800 116,200 122,700 3.94% 9.75% EMPLOYMENT 40,200 42,200 44,200 4.98% 9.95%
CITY OF BELLFLOWER
2008 - 2020 2008 -2035 2008 2020 2035 CHANGE CHANGE HOUSING 23,600 23,700 25,100 0.42% 6.36% POPULATION 76,600 76,600 81,300 0.00% 6.14% EMPLOYMENT 16,000 16,900 17,900 5.63% 11.88%
0
20,000
40,000
60,000
80,000
100,000
2008 2020 2035
CITY OF BELLFLOWER
HOUSING POPULATION EMPLOYMENT
0 20,000 40,000 60,000 80,000
100,000 120,000 140,000
2008 2020 2035
CITY OF DOWNEY
HOUSING POPULATION EMPLOYMENT

11
CITY OF COMPTON
2008 - 2020 2008 -2035 2008 2020 2035 CHANGE CHANGE HOUSING 22,900 23,100 23,100 0.87% 0.87% POPULATION 95,900 96,900 97,600 1.04% 1.77% EMPLOYMENT 30,600 31,200 32,200 1.96% 5.23%
CITY OF EL SEGUNDO
2008 - 2020 2008 -2035 2008 2020 2035 CHANGE CHANGE HOUSING 7,100 7,200 7,200 1.41% 1.41% POPULATION 16,700 16,900 17,000 1.20% 1.80% EMPLOYMENT 53,800 54,000 55,400 0.37% 2.97%
0
20,000
40,000
60,000
80,000
100,000
120,000
2008 2020 2035
CITY OF COMPTON
HOUSING POPULATION EMPLOYMENT
0
20,000
40,000
60,000
2008 2020 2035
CITY OF EL SEGUNDO
HOUSING POPULATION EMPLOYMENT
12
CITY OF GARDENA 2008 - 2020 2008 -2035
2008 2020 2035 CHANGE CHANGE HOUSING 20,500 21,000 23,200 2.44% 13.17% POPULATION 58,800 59,700 66,200 1.53% 12.59% EMPLOYMENT 30,500 28,900 30,700 -5.25% 0.66%
CITY OF HAWTHORNE
2008 - 2020 2008 -2035 2008 2020 2035 CHANGE CHANGE HOUSING 28,500 29,500 30,600 3.51% 7.37% POPULATION 84,300 89,600 96,300 6.29% 14.23% EMPLOYMENT 20,600 21,100 21,800 2.43% 5.83%
0 10,000 20,000 30,000 40,000 50,000 60,000 70,000
2008 2020 2035
CITY OF GARDENA
HOUSING POPULATION EMPLOYMENT
0
20,000
40,000
60,000
80,000
100,000
120,000
2008 2020 2035
CITY OF HAWTHORNE
HOUSING POPULATION EMPLOYMENT

13
CITY OF INGLEWOOD
2008 - 2020 2008 -2035 2008 2020 2035 CHANGE CHANGE HOUSING 36,400 37,900 38,800 4.12% 6.59% POPULATION 109,700 111,900 113,500 2.01% 3.46% EMPLOYMENT 33,400 35,000 36,700 4.79% 9.88%
CITY OF LYNWOOD
2008 - 2020 2008 -2035 2008 2020 2035 CHANGE CHANGE HOUSING 14,600 15,300 15,700 4.79% 7.53% POPULATION 69,300 72,300 74,300 4.33% 7.22% EMPLOYMENT 13,200 13,800 14,500 4.55% 9.85%
0
50,000
100,000
150,000
2008 2020 2035
CITY OF INGLEWOOD
HOUSING POPULATION EMPLOYMENT
0 10,000 20,000 30,000 40,000 50,000 60,000 70,000 80,000
2008 2020 2035
CITY OF LYNWOOD
HOUSING POPULATION EMPLOYMENT

14
CITY OF PARAMOUNT
2008 - 2020 2008 -2035 2008 2020 2035 CHANGE CHANGE HOUSING 13,900 14,100 14,400 1.44% 3.60% POPULATION 54,100 57,100 62,600 5.55% 15.71% EMPLOYMENT 18,300 18,500 19,100 1.09% 4.37%
CITY OF SOUTH GATE
2008 - 2020 2008 -2035 2008 2020 2035 CHANGE CHANGE HOUSING 23,400 24,800 26,100 5.98% 11.54% POPULATION 94,400 101,200 110,000 7.20% 16.53% EMPLOYMENT 19,700 20,000 20,600 1.52% 4.57%
0
10,000
20,000
30,000
40,000
50,000
60,000
70,000
2008 2020 2035
CITY OF PARAMOUNT
HOUSING POPULATION EMPLOYMENT
0
20,000
40,000
60,000
80,000
100,000
120,000
2008 2020 2035
CITY OF SOUTHGATE
HOUSING POPULATION EMPLOYMENT
15
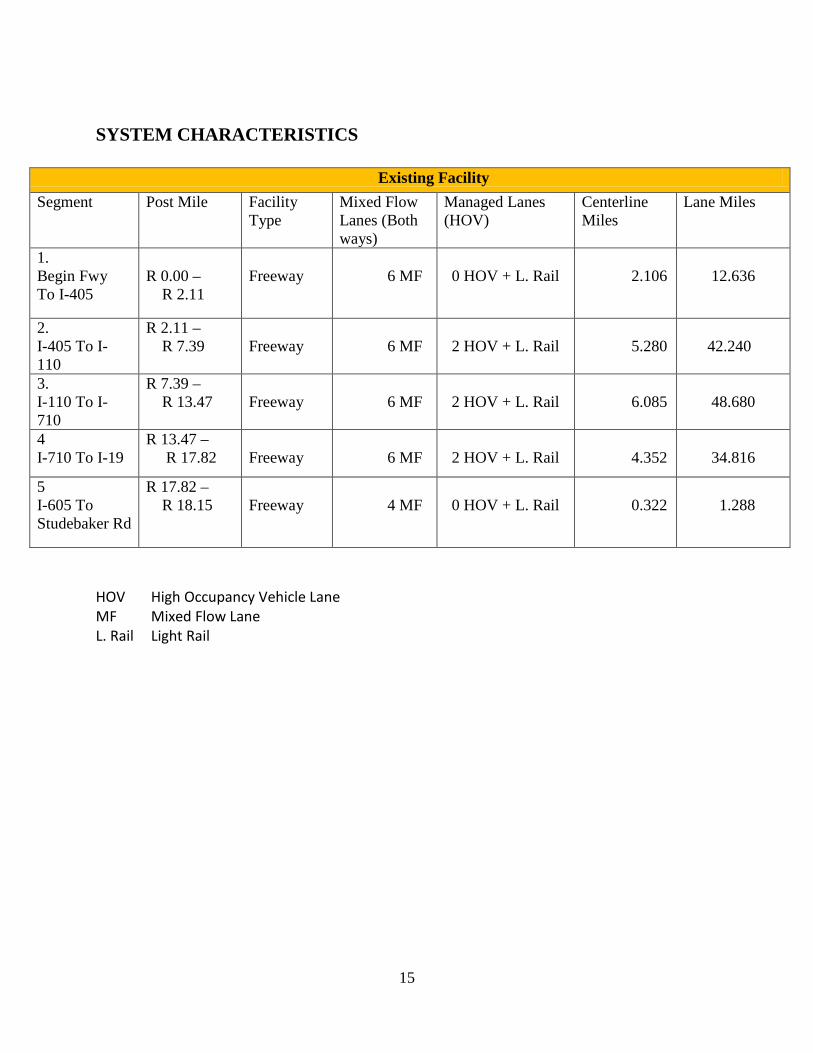
SYSTEM CHARACTERISTICS
Existing Facility Segment Post Mile Facility
Type Mixed Flow Lanes (Both ways)
Managed Lanes (HOV)
Centerline Miles
Lane Miles
1. Begin Fwy To I-405
R 0.00 – R 2.11
Freeway
6 MF
0 HOV + L. Rail
2.106
12.636
2. I-405 To I-110
R 2.11 – R 7.39
Freeway
6 MF
2 HOV + L. Rail
5.280
42.240
3. I-110 To I-710
R 7.39 – R 13.47
Freeway
6 MF
2 HOV + L. Rail
6.085
48.680
4 I-710 To I-19
R 13.47 – R 17.82
Freeway
6 MF
2 HOV + L. Rail
4.352
34.816
5 I-605 To Studebaker Rd
R 17.82 – R 18.15
Freeway
4 MF
0 HOV + L. Rail
0.322
1.288
HOV High Occupancy Vehicle Lane MF Mixed Flow Lane L. Rail Light Rail

16
RAMP METERS ON RTE 105
POSTMILE DIRECTION LOCATION COMMENTS SEGMENT 1 (R 0.00 – R2.106)
1.23 EB DOUGLAS ST. / NASH Operational 1.8 EB IMPERIAL / AVIATION Operational 2.11 EB NB-405 TO EB -105 Operational
SEGMENT 2 (R2.11 – R 7.39) 2.11 EB NB-405 TO EB -105 Operational 2.82 EB SB-405 TO EB -105 Operational 3.1 EB SB HAWTHORNE BLVD Operational
3.3 WB IMPERIAL / PRAIRIE AVE Operational
3.6 EB IMPERIAL / PRAIRE Operational 4.5 WB CRENSHAW BLVD. SB Operational 4.6 EB CRENSHAW SB / 120 ST Operational 4.8 WB CRENSHAW BLVD. NB Operational 4.9 EB CRENSHAW NB Operational 6.5 WB VERMONT AVE Operational 6.81 WB SB – 110 TO WB-105 Operational 7.2 EB HOOVER Operational 7.39 EB SB-110 TO EB -105 Operational
SEGMENT 3 (R 7.39 – R 13.47 )
7.39 EB SB-110 TO EB -105 Operational 7.56 EB NB-110 TO EB-105 Operational 8.8 WB CENTRAL AVE Operational 9 EB CENTRAL AVE Operational
9.7 EB WILMINGTON Operational 10.1 WB WILMINGTON AVE Operational 11.4 WB LONG BEACH BLVD SB Operational
11.6 WB LONG BEACH BLVD NB Operational
11.7 EB LONG BEACH SB Operational 11.9 EB LONG BEACH NB Operational 13.01 WB NB-710 TO WB-105 Operational 13.21 WB SB-710 TO WB-105 Operational 13.47 EB NB-710 TO EB-105 Operational

17
POSTMILE DIRECTION LOCATION COMMENTS
SEGMENT 4 (R 13.47 – R 17.82) 13.47 EB NB-710 TO EB-105 Operational 13.94 EB SB-710 TO EB -105 Operational
14.1 WB GARFIELD AV TO (RTE 710) Operational
14.2 WB GARFIELD( TO WB 105) Operational 14.8 EB PARAMOUNT Operational 15.6 EB LAKEWOOD SB Operational 15.6 WB LAKEWOOD Operational 15.9 EB LAKEWOOD NB Operational 16.5 WB BELLFLOWER Operational 16.8 EB BELLFLOWER Operational 17.82 WB HOXIE AVE Non Operational
SEGMENT 5 ( R 17.82 – R 18.15) 17.82 WB HOXIE AVE Non Operational 17.9 WB HOXIE AVE Non Operational
SOURCE: 2013 RMDP
18
ACTIVE TRANSPORTATION
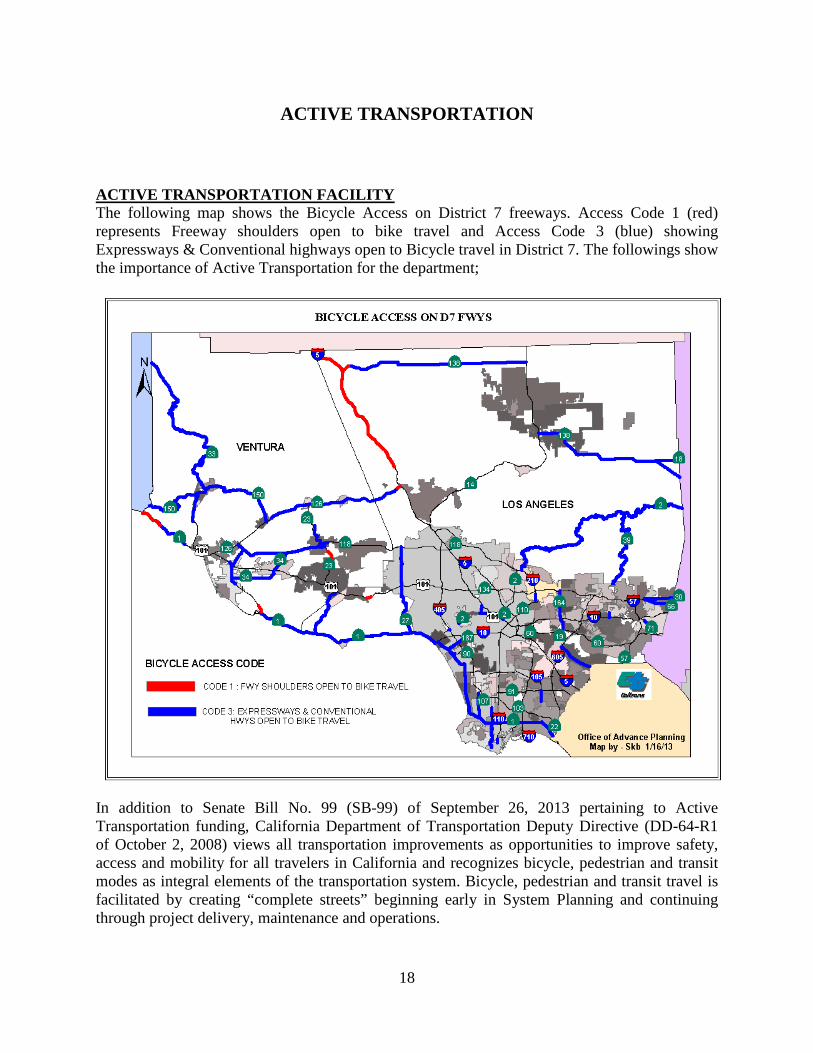
ACTIVE TRANSPORTATION FACILITY The following map shows the Bicycle Access on District 7 freeways. Access Code 1 (red) represents Freeway shoulders open to bike travel and Access Code 3 (blue) showing Expressways & Conventional highways open to Bicycle travel in District 7. The followings show the importance of Active Transportation for the department;
In addition to Senate Bill No. 99 (SB-99) of September 26, 2013 pertaining to Active Transportation funding, California Department of Transportation Deputy Directive (DD-64-R1 of October 2, 2008) views all transportation improvements as opportunities to improve safety, access and mobility for all travelers in California and recognizes bicycle, pedestrian and transit modes as integral elements of the transportation system. Bicycle, pedestrian and transit travel is facilitated by creating “complete streets” beginning early in System Planning and continuing through project delivery, maintenance and operations.

19
In addition, the Complete Streets Act of 2008 (AB. No. 1358 of September 30, 2008) requires cities and counties to incorporate the concept of Complete Streets into their General Plan Updates to ensure that transportation plans meet the needs of all users of our roadway system. Also, California Vehicle Code and Streets and Highway Code Section 888 states that the Department shall not construct a state highway as a freeway that will result in the severance or destruction of an existing major route for non-motorized transportation traffic and light motorcycles, unless it provides a reasonable, safe, and convenient alternate route or such a route exists. (Revised 10/4/2013. Page 7 of 11) SCAG’s 2012-2035 Regional Transportation Plan/Sustainable Communities Strategies (RTP/SCS) invests $6.7 billion towards increasing bikeways, bringing sidewalks into compliance with Americans with Disabilities Act, safety improvements and other Active Transportation Strategies.
Also, the United States Department of Transportation (US DOT) Policy Statement on bicycle and pedestrian accommodation (March 11, 2010) states that US DOT encourages transportation agencies to go beyond the minimum requirements, and proactively provide convenient, safe and context-sensitive facilities that foster increased use by bicyclists and pedestrians of all ages and abilities, and utilize universal design characteristics when appropriate.
Based on Caltrans context sensitive, smart mobility and complete streets policies and the Governor Office’s Climate Action and Sustainability Plan; “where the existing freeway or highway corridor has severed routes and has decreased connectivity between communities, employment hubs, schools, wild life corridors, every effort will be made to re-establish those lost connections on any project along the corridor.” Future improvements should be focused on addressing the listed issues in coordination and funding with local agencies such as, VCTC and SCAG. Developing creative solutions for new alternative bicycle routes and improving existing bicycle routes would be beneficial for all users.

20
TRANSIT INFORMATION - DISTRICT 7 Source: Office of Mass Transportation and Transit Operators
EXISTING SERVICE ON I - 105
Route From/To Operator Rt # Name/Description Service Type Service Span Notes
105 I-605-Aviation Metro Green Ln.
Norwalk- Redondo Beach Light Rail All Day
6-15 min. Frequency
105 I-605-I-110 Metro 460
Los Angeles- Disneyland Express All Day
20-30 min. Frequency
105 I-605-I-110 OCTA 701
Huntington Beach – Los Angeles Express
Weekday’s Peak
30 min. Frequency
105 I-105 –I-110 LADOT 438
Redondo Beach – Downtown LA Express All Day
8 -10 min Frequency
COMMENTS Metro Local 120 operates on Imperial Hwy. between Norwalk and Aviation/LAX Metro Station.
Metro Local 125 operates on Rosecrans Ave. between Norwalk and Sepulveda Blvd Gardena Bus Lines 5 operates on El Segundo Blvd., between Willow brook and Aviation/LAX Metro Station
FUTURE SERVICE
Metro Crenshaw/LAX Line will extend from the Metro Expo Line Crenshaw Station to the Metro Green Line in 2019.
Metro Green Line will go to Torrance after 2025 INTERMODAL TRANSIT CENTERS AND STATIONS LOCATED ON OR NEAR I - 105 CORRIDOR
Route Location City Operator Transit Service Service Type
Service Span Notes
105
Norwalk Metro Station Norwalk Metro Metro Green Line Light Rail 7 Days
Free Parking
Metro111,115,120,125 270,460. Local/Express 7 Days
311 577X
Limited Express
Weekdays Weekdays
Norwalk Transit 2,4,5 Local 7 Days
Long Beach Transit 172, 173 Local 7Days
105 Lakewood Blvd. Downey Metro Metro Green Line Light Rail 7 Days
Free Parking
Metro 117,265,266 Local 7 Days
Downey Link Southeast Community Weekdays
105 Long Beach Blvd. Lynwood Metro
Metro Blue, Green Lines Light Rail 7 Days
Free Parking

21
Metro 60,251 Local 7 Days Lynwood A Local 7 Days
105 Willow brook L A Metro Metro Blue, Green Lines Light Rail 7 Days
Free Parking
Metro 55,120,202, 205, 612 202
Local Local
7Days Weekday Late Night
Gardena Bus Lines 5 Local 7 Days
DASH Watts Community Monday-Saturday
Lynwood D Community 7 Days
Link Willow brook Shuttle A, B Community 7Days
Link King Medical Ctr Shuttle Community
Monday - Saturday
105 Avalon L.A Metro Metro Green Line Light Rail 7 Days
Free Parking
Metro 48,51,52,53, 352
Local Limited
7 Days Weekdays
DASH Watts Community
Monday-Saturday
Link Willow brook A Community
Monday-Saturday
Route Location City Operator Transit Service Service Type
Service Span Notes
105 Harbor Freeway L.A Metro Metro Green Line Light Rail 7 Days
Free Parking
Metro Silver Line Transit way 7 Days
Metro 45,81,120,450, 550,745
Local, Express, Rapid 7 Days
Gardena Bus Lines 1X Express 7 Days
LADOT 448 Express Weekdays Peak
OCTA 721 Express
Weekdays Peak
Torrance Transit 1,2,4 Local, Express 7 Days
105 Vermont/Athens L.A Metro Metro Green Line Light Rail 7 Days Free Parking
Metro 204,206, 209,754 Local, Rapid 7 Days
Gardena Bus Lines 2 /LA Dept of Public wks Local 7 Days
105 Crenshaw L.A Metro Metro Green Line Light Rail 7 Days
Free Parking
Metro 210,757 126 710
Local, Rapid Local Rapid
7 Days Weekdays Mon/Saturday
Torrance Transit 5,10 Local
Monday-Saturday
22
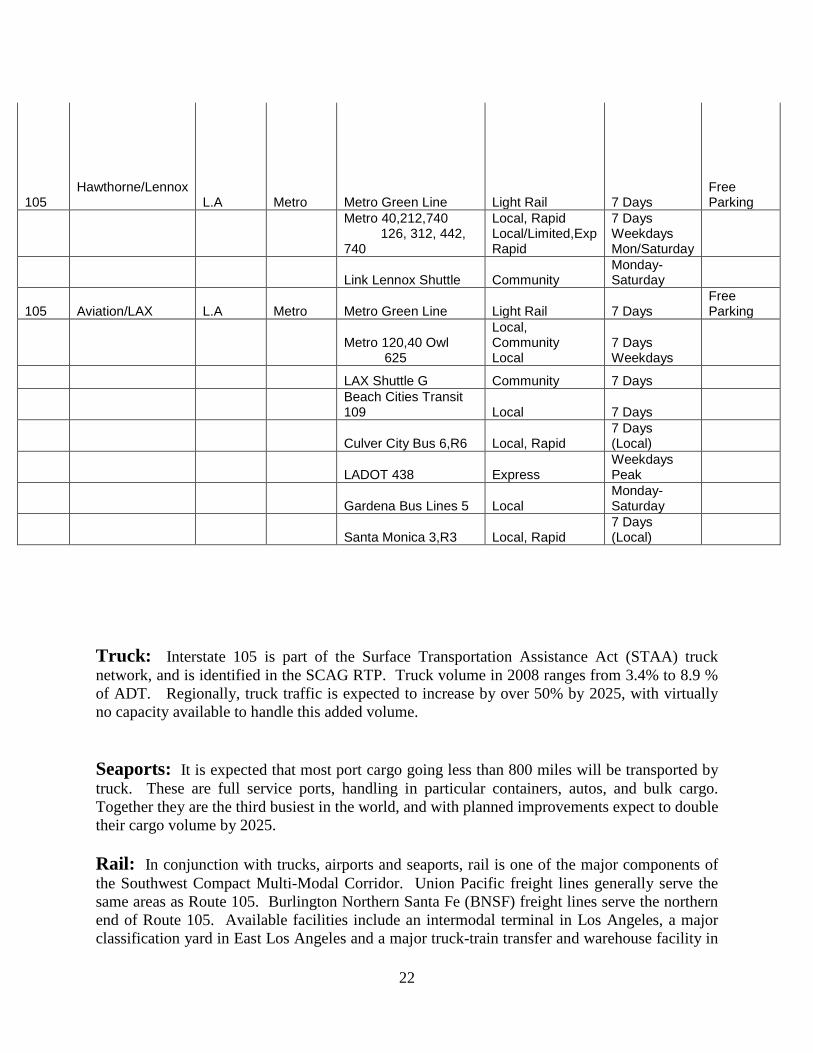
Truck: Interstate 105 is part of the Surface Transportation Assistance Act (STAA) truck network, and is identified in the SCAG RTP. Truck volume in 2008 ranges from 3.4% to 8.9 % of ADT. Regionally, truck traffic is expected to increase by over 50% by 2025, with virtually no capacity available to handle this added volume. Seaports: It is expected that most port cargo going less than 800 miles will be transported by truck. These are full service ports, handling in particular containers, autos, and bulk cargo. Together they are the third busiest in the world, and with planned improvements expect to double their cargo volume by 2025. Rail: In conjunction with trucks, airports and seaports, rail is one of the major components of the Southwest Compact Multi-Modal Corridor. Union Pacific freight lines generally serve the same areas as Route 105. Burlington Northern Santa Fe (BNSF) freight lines serve the northern end of Route 105. Available facilities include an intermodal terminal in Los Angeles, a major classification yard in East Los Angeles and a major truck-train transfer and warehouse facility in
105
Hawthorne/Lennox
L.A
Metro
Metro Green Line
Light Rail
7 Days
Free Parking
Metro 40,212,740 126, 312, 442, 740
Local, Rapid Local/Limited,Exp Rapid
7 Days Weekdays Mon/Saturday
Link Lennox Shuttle Community
Monday-Saturday
105 Aviation/LAX L.A Metro Metro Green Line Light Rail 7 Days
Free Parking
Metro 120,40 Owl 625
Local, Community Local
7 Days Weekdays
LAX Shuttle G Community 7 Days
Beach Cities Transit 109 Local 7 Days
Culver City Bus 6,R6 Local, Rapid
7 Days (Local)
LADOT 438 Express
Weekdays Peak
Gardena Bus Lines 5 Local
Monday-Saturday
Santa Monica 3,R3 Local, Rapid
7 Days (Local)

23
Los Angeles and the City of Commerce. Service improvements could include enhancement of and / or additional transfer facilities, additional tracks, and more grade separations. The Alameda Corridor includes an extensive list of these improvements and as such, will significantly enhance the movement of rail freight from Downtown Los Angeles to the San Bernardino County Line. Airports: Los Angeles International Airport (LAX) is near I-105. Overall, passenger travel by air is expected to double by 2020, and air cargo activity is expected to triple regionally, with LAX currently handling 79% of this cargo volume. I-105 connects the eastern portion of Los Angeles County, Riverside and San Bernardino Counties to LAX. Future expansion of LAX will have a tremendous impact on I-105. Military air base conversions are under development planning and additional ground access improvements and funding needs to be identified. FREIGHT – GOODS MOVEMENT The economic vitality and well being of the Los Angeles region depends upon the safe and timely transport of goods as well as people. Current level of congestion is detrimental to this vitality, and future projections indicate that this situation will get much worse. Total Goods Movement traffic is expected to grow by more than 80% in the next 25 years as international trade volume triple. Significant actions thus need to be taken to protect the economic well being of the region. These include improved rail service, including more grade separations; additional and improved intermodal transfer facilities; truck lanes on major truck routes; improved access to and enhanced cargo handling capabilities at seaports; and improved air cargo accessibility with separation from passenger activities at the airport.
Freight Facility Table Facility Type / Freight
Generator Location Mode Name
Los Angeles Transportation Center (LATC)
Los Angeles Train Union Pacific
East Los Angeles (ELA)
Los Angeles Trucks various
Goods Port Huemene Air cargo plane various

24
ENVIROMENTAL CONSIDERATION- California is known for traffic congestion and its impacts. Pollution of various types is typical in this region. Air quality, noise and water pollution are common. Below is the latest attainment/nonattainment status of RTE-105 Corridor which falls in the South Coast Air Basin.
POLLUTANTS STATE DESIGNATION Ozone (1hr) Nonattainment Ozone (8hr) Nonattainment CO (8hr) Attainment PM10 (24hr.) Nonattainment PM 2.5 (24hr.) Nonattainment NO2 (Annual) Nonattainment SO2(1hr) Attainment Lead Nonattainment

25
CORRIDOR PERFORMANCE
Segment AADT 2008 AADT 2035 LOS 2008 LOS 2035 VMT 2008 VMT 2035 1 130,000 131,300 F0 F0 273,800 267,500 2 229,700 232,000 F1 F1 1,212,800 1,224,900 3 229,900 232,200 F0 F0 1,398,900 1,412,900 4 208,000 210,100 F0 F0 905,200 914,300 5 18,600 18,800 C C 6,000 6,100
Truck Traffic Segment Total Average Annual Daily
Truck Traffic (AADT) 2008 Total Trucks (% of AADT) 2008
Heavy Duty Annual Daily Truck Traffic (AADT) 2008
Heavy Duty Trucks (% of AADTT) 2008
1 4,400 3.4% 1,030 23.5% 2 11,600 5.1% 2,650 22.9% 3 13,500 5.9% 4,700 34.9% 4 18,000 8.7% 9,540 53.0% 5 650 3.4% 150 23.5%

26
KEY CORRIDOR ISSUES
Route 105 extends as a multi-modal freeway. It carries a segment of Metro Rail in its median, providing rapid transit through South Los Angeles towards Los Angeles International Airport. Large train stations are in place at several interchanges thus allowing easy access to bus corridors along city streets. It is a major alternative Truck route close to the Ports of Los Angeles and Long Beach. Route 105 runs parallel to Route 91 linking LAX (Los Angeles International Airport) and other cities. It traverses an urbanized area, which includes several major cities in Los Angeles Counties: Downey, Bellflower, Compton, El Segundo, Gardena, Hawthorne, Inglewood, Lynwood, Paramount, South Gate and numerous shopping centers. The terrain is essentially flat. Route 105 also serves, major Parks, California State University Dominguez Hills, Cerritos College, Rio Hondo College, a major King Drew hospital complex and Compton shopping center. It functions as a major collector distributor route feeding; Routes 405, 110, 710, and 605. It was originally intended to meet Interstate 5 in Norwalk but due to the additional controversy, it did not. This route is a part of the Federal Surface Transportation Assistance Act (STAA) Route Network for oversized Trucks and the Subsystem of Highways for the Movement of Extralegal Permit Loads (SHELL). It feeds the LAX (Los Angeles International Airport).

27
CORRIDOR CONCEPT
CONCEPT RATIONALE The transportation concept describes the operating conditions and physical facilities required to provide those conditions that could exist on Route I05 after considering the conclusions, priorities and strategies discussed in the District System Management Plan (DSMP), the SCAG Regional Transportation Plan/Sustainable Communities Strategy (RTP/SCS), and other planning documents. The route concept represents what could reasonably be accomplished to facilitate the mobility of traffic desiring to use the route. It assumes that management improvement strategies and system operation improvements to maximize the efficiency on 105 Corridor will be implemented. The transportation concept is composed of a Level of Service (LOS) and facility component. The concept facility is the facility that could be developed to maintain or attain the concept LOS.

28
PLANNED AND PROGRAMMED PROJECTS AND STRATEGIES
Route #
County
Lead Agency
Description Project
Completion By
RTP ID
RTP 2012 PROJECTS LIST
105 Los Angeles
Los Angeles County MTA
Route 105 Study Report for interchange improvement Improvements at LAX Airport (E/P, PSE/E, ONLY).
2014 LAE1609
105
Los Angeles
Los Angeles County MTA
Route 710: Reconstruct I-710 Interchanges at I-5, at I-405, at SR 91, and at I-105. As part of the I-710 Corridor Program proposing 4 Truck lanes (port –rail yards), general lanes (port-SR-60)(STEA ID # 37)(SAFTEA-LU 3773)
2015
LAOB952
105
Los Angeles
I-405 , I-110, I-105 and SR- 91 Ramp and Interchange Improvements (South Bay) 2014
1M1003
METRO 2009 LRTP
Route #
County
Lead Agency
DESCRIPTION Project
Completion By RTP ID
105
Los
Angeles
Metro
Add EB auxiliary lane from Yukon to Crenshaw. (PM 15.45 to R 18.14 )
105
Los Angeles
Metro
Add WB auxiliary lane from Crenshaw off -ramp to Crenshaw on-ramp. (PM 15.45 to R 18.14 )
105 Los
Angeles Metro
Add WB auxiliary lane from Crenshaw on -ramp to Crenshaw off –ramp. (PM 15.45 to R 18.14 )
29
CONCLUSION Traffic volume is forecasted to increase on Route 105 due to the growth in population, housing and employment along this route and throughout the region. Growth in the region will continue to create mobility challenges and put additional strain on our transportation system. Southern California is not only an important component of California’s economy but it is also vital to the United States and world’s economy as a whole. It is critical that mobility be maintained and improved in order to sustain the economic growth that is expected. Interstate 105 is only one component of the transportation infrastructure but it plays a critical role in providing mobility for the region. In order to improve mobility, additional capacity will be required beyond those planned and programmed in the 2012-2035 RTP/SCS to maintain an acceptable level of service through 2035. District 7 Office employs a variety of strategies to address current congestion challenges including:
• High Occupancy Vehicle Lane (HOV) • Ramp Metering • Congestion Pricing (Toll Lanes) • Changeable Message Signs (CMS)
Several regional freeway capacity expansion projects are in the planning process, under development or under construction which will assist in decreasing congestion. Constructing an HOV or Managed Lane system continues to be a priority. In addition to the projects on our system, Caltrans supports programs such as Transit Oriented Development (TOD). TOD is a moderate to higher density development, located within easy walk of major transit stop. Generally with a mix of residential, employment and shopping opportunities designed for pedestrians. Research have shown that these types of development increase the number of trips made by transit, walking and cycling thus reducing the number of car trips and reducing tailpipe emissions. SCAG’s 2012-2035 Regional Transportation Plan/Sustainable Communities Strategy (RTP/SCS identifies High Quality Transit Areas (HQTAs) meeting definitions established in SB 375. These areas are intended to direct and prioritize future growth, and further, establish eligibility for certain types of projects to access CEQA streamlining. However, that residential and other types development along freeways can be associated with increased health risk due to emissions expose. Future projects should refer to available information resources, including but not limited to SCAG’s 2012-2035 RTP/SCS Environmental Justice Appendix and Program Environmental Impact Report.

30
Appendix GLOSSARY OF TERMS AND ACRONYMS
Acronyms AADT- Annual Average Daily Traffic ADT- Average Daily Traffic CALTRANS - California Department of Transportation CMA - Congestion Management Agencies CSS - Context Sensitive Solutions FHWA - Federal Highway Administration GHG - Green House Gas HCP - Habitat Conservation Plan HCS - Highway Capacity Software ITS - Intelligent Transportation System LOS - Level of Service MPO - Metropolitan Planning Organizations NOA - Naturally Occurring Asbestos NCCP - Natural Community Conservation Plan PID - Project Initiation Document PSR - Project Study Report RTP - Regional Transportation Plan RTIP - Regional Transportation Improvement Program RTPA - Regional Transportation Planning Agencies SCS - Sustainable Community Strategies SHOPP - State Highway Operation Protection Program STIP - State Transportation Improvement Program TDM - Transportation Demand Management TMS - Transportation Management System TSN - Transportation System Network VMT - Vehicle Miles Traveled Definitions AADT – Annual Average Daily Traffic is the total volume for the year divided by 365 days. The traffic count year is from October 1st through September 30th. Traffic Counting is generally performed by electronic counting instruments moved from location throughout the State in a program of continuous traffic count sampling. The resulting counts are adjusted to an estimate of annual average daily traffic by compensating for seasonal influence, weekly variation and other variables which may be present. Annual ADT is necessary for presenting a statewide picture of traffic flow, evaluating traffic trends, computing accident rates, planning and designing highways and other purposes. Base year – The year that the most current data is available to the Districts Bikeway Class I (Bike Path) – Provides a completely separated right of way for the exclusive use of bicycles and pedestrians with cross flow by motorists minimized.

31
Bikeway Class II (Bike Lane) – Provides a striped lane for one-way bike travel on a street or highway. Bikeway Class III (Bike Route) – Provides for shared use with pedestrian or motor vehicle traffic. Capacity – The maximum sustainable hourly flow rate at which persons or vehicles reasonably can be expected to traverse a point or a uniform section of a lane or roadway during a given time period under prevailing roadway, environmental, traffic, and control conditions. Concept LOS – The minimum acceptable LOS over the next 20-25 years Corridor – A broad geographical band that follows a general directional flow connecting major sources of trips that may contain a number of streets, highways, bicycle, pedestrian, and transit route alignments. Off system facilities are included as informational purposes and not analyzed in the TCR. Facility Concept – Describes the facility and strategies that may be needed within 20-25 years. This can include capacity increasing, State Highway, bicycle facility, pedestrian facility, transit facility, non-capacity increasing operational improvements, new managed lanes, conversion of existing managed lanes to another managed lane type or characteristic, TMS field elements, transportation demand management and incident management. Facility Type – The facility type describes the state highway facility type. The facility could be freeway, expressway, conventional, or one-way city street. Freight Generator – Any facility, business, manufacturing plant, distribution center, industrial development, or other location (convergence of commodity and transportation system) that produces significant commodity flow, measured in tonnage, weight, carload, or truck volume. Headway – The time between two successive vehicles as they pass a point on the roadway, measured from the same common feature of both vehicles. Horizon Year – The year that the future (20-25 years) data is based on. ITS – Intelligent Transportation System improves transportation safety and mobility and enhances productivity through the integration of advanced communications technologies into the transportation infrastructure and in vehicles. Intelligent transportation systems encompass a broad range of wireless and wire line communications-based information and electronics technologies to collect information, process it, and take appropriate actions. LOS – Level of Service is a qualitative measure describing operational conditions within a traffic stream and their perception by motorists. A LOS definition generally describes these conditions in terms of speed, travel time, freedom to maneuver, traffic interruption, comfort, and convenience. Six levels of LOS can generally be categorized as follows:
LOS A describes free flowing conditions. The operation of vehicles is virtually unaffected by the presence of other vehicles, and operations are constrained only by the geometric features of the highway.

32
LOS B is also indicative of free-flow conditions. Average travel speeds are the same as in LOS A, but drivers have slightly less freedom to maneuver.
LOS C represents a range in which the influence of traffic density on operations becomes marked. The ability to maneuver with the traffic stream is now clearly affected by the presence of other vehicles.
LOS D demonstrates a range in which the ability to maneuver is severely restricted because of the traffic congestion. Travel speed begins to be reduced as traffic volume increases.
LOS E reflects operations at or near capacity and is quite unstable. Because the limits of the level of service are approached, service disruptions cannot be damped or readily dissipated.
LOS F a stop and go, low speed conditions with little or poor maneuverability. Speed and traffic flow may drop to zero and considerable delays occur. For intersections, LOS F describes operations with delay in excess of 60 seconds per vehicle. This level, considered by most drivers unacceptable often occurs with oversaturation, that is, when arrival flow rates exceed the capacity of the intersection. Multimodal – The availability of transportation options using different modes within a system or corridor, such as automobile, subway, bus, rail, or air. Peak Hour – The hour of the day in which the maximum volume occurs across a point on the highway. Peak Hour Volume – The hourly volume during the highest hour traffic volume of the day traversing a point on a highway segment. It is generally between 6 percent and 10 percent of the ADT. The lower values are generally found on roadways with low volumes.
Planned Project – A planned improvement or action is a project in a financially constrained section of a long-term plan, such as an approved Regional or Metropolitan Transportation Plan (RTP or MTP), Capital Improvement Plan, or measure.

33
Post Mile – A post mile is an identified point on the State Highway System. The milepost values increase from the beginning of a route within a count to the next county line. The milepost values start over again at each county line. Milepost values usually increase from south to north or west to east depending upon the general direction the route follows within the state. The milepost at a given location will remain the same year after year. When a section of road is relocated, new milepost (usually noted by an alphabetical prefix such as "R" or "M") are established for it. If relocation results in a change in length, "milepost equations" are introduced at the end of each relocated portion so that mileposts on the reminder of the route within the county will remain unchanged. Programmed Project – A programmed improvement or action is a project in a near-term programming document identifying funding amounts by year, such as the State Transportation Improvement Program or the State Highway Operations and Protection Program. Route Designation –A route’s designation is adopted through legislation and identifies what system the route is associated with on the State Highway System. A designation denotes what design standards should apply during project development and design. Typical designations include but not limited to National Highway System (NHS), Interregional Route System (IRRS), and Scenic Highway System. Rural – Fewer than 5,000 in population designates a rural area. Limits are based upon population density as determined by the U.S. Census Bureau. Segment – A portion of a facility between two points. TDM – Transportation Demand Management programs designed to reduce or shift demand for transportation through various means, such as the use of public transportation, carpooling, telework, and alternative work hours. Transportation Demand Management strategies can be used to manage congestion during peak periods and mitigate environmental impacts. TMS – Transportation Management System is the business processes and associated tools, field elements and communications systems that help maximize the productivity of the transportation system. TMS includes, but is not limited to, advanced operational hardware, software, communications systems and infrastructure, for integrated Advanced Transportation Management Systems and Information Systems, and for Electronic Toll Collection System. Urban – 5,000 to 49,999 in population designates an urban area. Limits are based upon population density as determined by the U.S. Census Bureau. Urbanized – Over 50,000 in population designates an urbanized area. Limits are based upon population density as determined by the U.S. Census Bureau. VMT – Is the total number of miles traveled by motor vehicles on a road or highway segments.

34
RESOURCES Congestion Management Program for Los Angeles County, Los Angeles County Metropolitan Transportation Authority, October, 2010 District System Management Plan, California Department of Transportation, District 7, August 16, 1996 Long-Range Transportation Plan. Los Angeles County Metropolitan Transportation Authority, 2009 SAFETEA: LU (Re-Authorization of the Intermodal Surface Transportation Efficiency Act of 1991) (ISTEA) (P.L. 102-240), August 2005. 2012-2035 Regional Transportation Plan, (Adopted), Southern California Association of Governments, April 2012 Transportation Concept Report – SR-91 – April 2005 Ramp Meter Development Plan - December 2013 Air Quality Management Plan, South Coast Air Quality Management District, December, 2012 Interregional Transportation Strategic Plan – Dec. 2012 2008 Annual Average Daily Truck Traffic on the California State Highway System 2011 Traffic Volumes on California State Highways. Transportation Concept Report (Draft) 2005 for Interstate 105.
Recommended

![IMMUNOGLOBULINE E T CELL RECEPTOR T. Strachan e A.P. … · B cell antigen receptor tetramero [ IgH 2 + IgL 2 (Ig oppure Ig )] T cell receptor (TCR) eterodimero TCR /TCR TCR /TCR](https://img.pdfslide.us/doc/110x75/5c017b5c09d3f26f1e8cc6a0/immunoglobuline-e-t-cell-receptor-t-strachan-e-ap-b-cell-antigen-receptor.jpg)