DIGITAL INDUSTRY THE TRUE VALUE OF INDUSTRY 4.0

An overwhelming amount of words has been
written about digitalization, the Internet of Things
and Big Data. But most of it concerns the way
digital technology will transform products and
business models in the consumer space. This
business-to-consumer (B2C) perspective is of
little relevance to industrial firms and their senior
executives. The applications of digital technology
in “engineered products” industries will be quite
unlike those in the consumer space, but no
less transformative.
This Oliver Wyman report aims to give
industrial clients a perspective on the true
value of “Industry 4.0” in their industrial
businesses – in large part by providing concrete
examples of digital industry, both those that
are emerging and those that are likely to arise.
As we hope this report makes clear, digital
transformation promises gains comparable
to those created by the introduction of mass
production at the beginning of the 20th century.
PREFACE
Copyright © 2016 Oliver Wyman 1

The next generation of production technology is starting to be rolled out: Big Data
analytics, virtual environments, simulation software, broad connectivity, collaborative
robots, machine-to-machine communication and new manufacturing techniques
such as 3D printing. These technological innovations will surely create substantial
value for the companies supplying them, just as conveyor belts did during the second
industrial revolution.
But the true value of digital industry will come
from what this technology enables at original
equipment manufacturers (OEMs) and operators
of this equipment. By providing real-time
information about customer demand, production
capacity, operational performance and product
quality, among other things, it will allow “clock
speed”1 algorithm-based decision making that
will dramatically improve process efficiency in
everything from pricing to production planning
to supply-chain management to R&D. And it
will provide OEMs with the foundations for
entirely new value propositions to offer their
business-to-business (B2B) customers.
This pattern is not new. In the three prior
modern industrial revolutions, novel technology
triggered a fundamental change in the way
industrial companies operated (See Exhibit 1.),
and this is where the real value was created. For
example, the introduction of programmable logic
controllers (PLCs) and ERP systems in the third
industrial revolution of the 1970s boosted the
growth of technology suupliers. But the major
economic value has been created through the
resulting ability of OEMs and industrial goods
operators to introduce LEAN and re-engineer
their processes.
Understanding the value of the fourth
industrial revolution requires more than
identifying the technological step-changes.
It requires that we be able to predict the way
these technological changes will transform
value creation, processes and business models.
In this report, we restrict our attention to OEMs
in automotive, rail, aerospace and machinery,
the major categories of engineered products.
We explain with concrete examples how digital
technology can unlock value right along the
value chain.
We begin by estimating the potential value
creation from digital industry, broken out by its
most important sources. Then, in Section 3, we
examine the “internal levers” in greater detail,
providing examples of ways in which digital
technology is already being used to improve
decision making and process efficiency, and
INTRODUCTION
1 See Oliver Wyman’s 2015 report, A New Paradigm for Competition: Clock Speed. Digital technology can reduce decision-making from hours, days or weeks to seconds: hence “clock speed”.
SECTION ONE
Copyright © 2016 Oliver Wyman 2
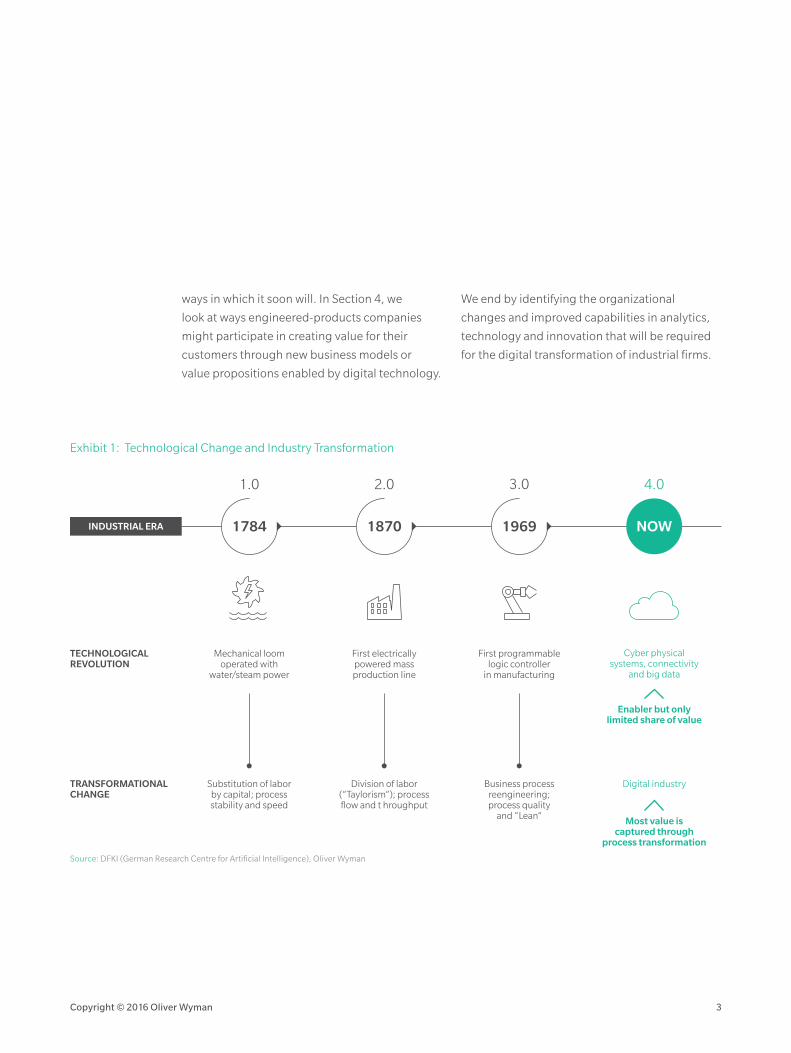
Mechanical loomoperated with
water/steam power
First electricallypowered massproduction line
Division of labor(“Taylorism”); processflow and t hroughput
Substitution of laborby capital; processstability and speed
First programmablelogic controller
in manufacturing
Business processreengineering;process quality
and “Lean”
Digital industry
Most value iscaptured through
process transformation
Cyber physicalsystems, connectivity
and big data
Enabler but onlylimited share of value
INDUSTRIAL ERA
TECHNOLOGICALREVOLUTION
TRANSFORMATIONALCHANGE
1784 1870
1.0 2.0
1969
3.0
NOW
4.0
ways in which it soon will. In Section 4, we
look at ways engineered-products companies
might participate in creating value for their
customers through new business models or
value propositions enabled by digital technology.
We end by identifying the organizational
changes and improved capabilities in analytics,
technology and innovation that will be required
for the digital transformation of industrial firms.
Exhibit 1: Technological Change and Industry Transformation
Source: DFKI (German Research Centre for Artificial Intelligence), Oliver Wyman
Copyright © 2016 Oliver Wyman 3

0%
25%
50%
75%
100%
Automotive Machinery/EngineeringAerospace
Other discrete manufacturingRail
Idea toproduction
Sales todelivery
Operationsand services
∑~US$1.4 TRILLION
Oliver Wyman estimates that by 2030 digital industry will increase annual margin
potential by more than US$1.4 trillion. (See Exhibit 2.) The largest absolute gains
will be in automotive, the largest sector, followed by machinery, aerospace and rail.
However, at 5 percent, we expect the relative percentage gains to be smallest in
the cost-mature automotive industry. Rail and aerospace are likely to see margins
improve by between 10 percent and 15 percent.
Contrary to the common view, we expect most
of the value of digital to be realized outside of
production. It will be realized in processes such
as R&D, product launch, pricing, planning,
dispatching and purchasing. (See Exhibit 3.) As
these “white collar” functions are increasingly
automated by algorithm-based decision making,
many jobs now done by humans will become
redundant. Speed, quality and consistency will
improve while costs decline.
The expected gains listed in Exhibit 3 will not
be evenly distributed across the various parts
THE VALUE OF DIGITAL INDUSTRY
* Value spaces estimated on the basis of industry-specific cost structures and applied to approximated global value creation in 2030 (GDP growth assumed).
Sources: Oliver Wyman analysis, OECD, World Bank, United Nations
Exhibit 2: Digital Industry Potential in 2030
Margin impact (distribution per industry)*
SECTION TWO
Copyright © 2016 Oliver Wyman 4

POTENTIAL PER INDUSTRY SECTORRELATIVE TO INDUSTRY REVENUES
VALUE SPACE POTENTIALUS$ BILLIONS
Demand forecasting and intelligent pricing
Flexible production ande�cient mass customization
Smart purchasingand outsourcing
Productlaunch
Research anddevelopment e�ciency
Smart maintenance andequipment performance
Plant network optimization
Production planning and dispatching automation
Next-generationinventory management
600
300
120
120
100
70
30
30
20
LOW HIGH
Idea toproduction
Sales todelivery
Operationsand services
of the life-cycle value chain, such as suppliers,
manufacturers and operators. Some will gain more
than others and some will even end up worse off.
Much of the benefit will ultimately accrue to final
customers. But firms can maintain outsized profits
so long as they keep ahead of the pack.
In the next section, we elaborate on the areas
where firms will be competing to make the most
of digital industry (listed in Exhibit 3). More will
be required of companies than simply improving
internal processes. Successful firms will also help
their clients to realize digital value, for example,
by providing services that increase the efficiency
of clients’ production and maintenance activities.
We describe such “external” sources of value
developments in Section 4.
Exhibit 3: Gains from Digital Industry
Source: Oliver Wyman
Copyright © 2016 Oliver Wyman 5

DEMAND FORECASTING AND INTELLIGENT PRICING
Important business decisions – from sales
planning to pricing to production planning – rely
on demand forecasts. These have traditionally
been derived primarily from estimates by sales
managers, whose judgments are based on
past sales volumes, market expectations and
gut feeling. These estimates are imperfect
and unresponsive to developments that are
unobservable to sales managers.
Some companies have begun to improve
on this approach by adding Big Data
techniques. Drawing on data from a wide range
of sources – such as dealers, sales agents and
product “configurators” – centralized analytic
algorithms predict future demand from various
customer segments and geographies. We
expect this approach to be extended, exploiting
additional sources of data, some of which will be
real-time information (or close to it). This data
will feed algorithms that make better decisions
about what products to make and when. And it
will be used to alter prices rapidly in response to
changes in demand and production capacity.
Real-time, algorithm-based demand
forecasting will feed into many related processes,
such as market research, sales planning,
production planning and scheduling. Where
these processes are local, as with sales planning,
data is collected locally and analyzed centrally to
provide guidance to local operations. Combined
with improved revenues from better pricing,
these savings make this the biggest source of
value from digital industry: US$600 billion by our
estimate. We expect efficiencies in production
planning and dispatching automation to add
another US$30 billion of value potential.
(See Case Study 1.)
FLEXIBLE PRODUCTION AND MASS CUSTOMIZATION
The automation of production over recent
decades has delivered great efficiency gains,
especially in large series production settings like
in the automotive industry. But it has probably
reached a limit. Indeed, product complexity may
even require some reduction in automation and
a larger role for more flexible, well-educated
and responsive humans. Digital technology will
improve production efficiency not by automating
it further but by providing data flows that
facilitate a seamless collaboration between the
humans and machines involved in the process.
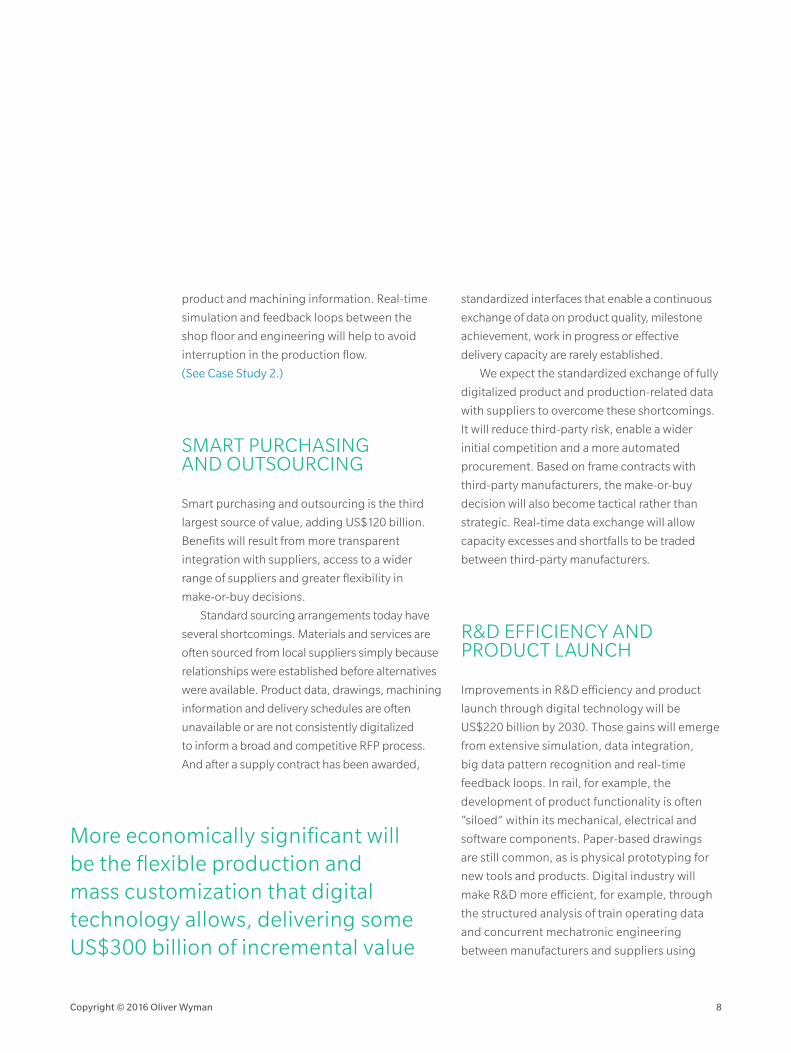
More economically significant will be the
flexible production and mass customization
that digital technology allows, delivering some
US$300 billion of incremental value. These gains
will come from the next level of data integration
along CAD, Product Lifecycle Management (PLM)
and Product Data Management (PDM) systems.
In machine engineering, for example, small
or individual lot sizes will be handled just like
regular series production, based on 3D models,
simulation, flexible systems and end-to-end data
flows. The integrated reworking of non-quality
parts within the regular production flow will be
enabled by M2M-communication and embedded
INTERNAL SOURCES OF VALUE FROM DIGITAL INDUSTRY
SECTION THREE
Copyright © 2016 Oliver Wyman 6

TO DATE
DIGITAL INDUSTRY
• Separate and manual orders
– OEM retail network (incl. fleets)
– Third party dealers
• Orders widely judgement-based
• No central validation/marketintelligence check of individual orders
• Many departments and interfaces involved
• Automated ordering of the “right” car for the “right” dealer
• Fully centralized decision making basedon internal and external data
• Less discounts (rev + ~3%), selling of more options(rev + ~3%), more e�cient storage (cost - ~0.5%)
• Better and integrated ordering, productionand supply chain planning
• Redundancy of manual planning and orderingsteps and therefore of functions
OrderingProduction planning
Procurement
External andinternal data
Automated order
Production
Delivery
DEALERSHIP
DEALERSHIP
BACK
Case Study 1: Demand Forecasting and Intelligent Pricing in the Automotive Industry
Seventy-five percent of global
automotive production now follows
a built-to-stock logic based on local
dealers’ judgment. The showcased
cars rarely match the preferences of
customers, who are reluctant to pay
for options they do not require. As
a consequence, built-to-stock cars
have extended turnover times, dealers
hesitate to order expensive options
and cars have to be sold at discounts.
Working capital, revenue and profit
margins are eroded.
Now automotive OEMs have
started systematically analyzing
a variety of data to understand
demand better. Dealer information,
online configurations by customers,
current and past take rates and
other customer interactions are used
to determine the configurations
built-to-stock cars should display.
Although this approach is far from
universal, average profit per vehicle
may already have improved by several
hundred dollars.
OEMs are likely to extend this
approach, incorporating third-party
research data, competitor information,
dealer customer-relationship
management (CRM) systems,
discussions in online forums and social
media. Automated analysis of this
(often) real-time data will allow them
to more accurately forecast which
cars will be demanded through which
dealers. Options will be better tailored
to consumers’ preferences, and cars
will be sold more quickly and with
fewer discounts.
In parallel, OEMs will generate
real-time insights into plant and
production utilization. Greater
allocation flexibility will allow “yield
management” that optimizes
utilization across plants. This data
about plant utilization can also provide
the “supply” data for a pricing model
that accounts for short-term variation
in demand and customers’ price-
sensitivity – estimated, for example,
on the basis of social media-sourced
data about customer’s background,
preferences and urgency.
Exhibit 4: Automated Demand Driven Ordering
Copyright © 2016 Oliver Wyman 7
product and machining information. Real-time
simulation and feedback loops between the
shop floor and engineering will help to avoid
interruption in the production flow.
(See Case Study 2.)
SMART PURCHASING AND OUTSOURCING
Smart purchasing and outsourcing is the third
largest source of value, adding US$120 billion.
Benefits will result from more transparent
integration with suppliers, access to a wider
range of suppliers and greater flexibility in
make-or-buy decisions.
Standard sourcing arrangements today have
several shortcomings. Materials and services are
often sourced from local suppliers simply because
relationships were established before alternatives
were available. Product data, drawings, machining
information and delivery schedules are often
unavailable or are not consistently digitalized
to inform a broad and competitive RFP process.
And after a supply contract has been awarded,
standardized interfaces that enable a continuous
exchange of data on product quality, milestone
achievement, work in progress or effective
delivery capacity are rarely established.
We expect the standardized exchange of fully
digitalized product and production-related data
with suppliers to overcome these shortcomings.
It will reduce third-party risk, enable a wider
initial competition and a more automated
procurement. Based on frame contracts with
third-party manufacturers, the make-or-buy
decision will also become tactical rather than
strategic. Real-time data exchange will allow
capacity excesses and shortfalls to be traded
between third-party manufacturers.
R&D EFFICIENCY AND PRODUCT LAUNCH
Improvements in R&D efficiency and product
launch through digital technology will be
US$220 billion by 2030. Those gains will emerge
from extensive simulation, data integration,
big data pattern recognition and real-time
feedback loops. In rail, for example, the
development of product functionality is often
“siloed” within its mechanical, electrical and
software components. Paper-based drawings
are still common, as is physical prototyping for
new tools and products. Digital industry will
make R&D more efficient, for example, through
the structured analysis of train operating data
and concurrent mechatronic engineering
between manufacturers and suppliers using
More economically significant will be the flexible production and mass customization that digital technology allows, delivering some US$300 billion of incremental value
Copyright © 2016 Oliver Wyman 8

BACK
Case Study 2: Flexible Production and Mass Customization in Machinery
A step change in mass customization
and production efficiency can be
observed in kitchen and furniture
manufacturing. Production has
traditionally been organized around
standardized modules with customer
specific elements added by hand. The
process takes several weeks, is made
expensive by the labor-intensity, and
quality is notoriously poor, often failing
to be right-first-time or delivered
when promised. Digital industry solves
these problems with a fully automated
“lot size one” manufacturing process
that uses a digital data model and
integrated IT backend, a digital
customer front (with 3D simulation)
and integrated quality inspection
and rework. The process time is cut
from weeks to days, quality is greatly
improved, the customer is provided
with vast array of choices and cost is
reduced significantly.
Case Study 3: Reduction of Launch Cost at Automotive OEMs through Integrated Quality Management
400 new cars are now launched each
year, and the number is climbing.
Yet the launch process remains
largely an unautomated matter of
craftsmanship. Complex products
must be produced while facing the
challenge of integrating hundreds of
suppliers, new parts, new processes
and new production methods within
a short timeframe. Many last-minute
changes and ad hoc decisions to fix
quality issues, reorganize resources
and de-bottleneck processes entail
continuous firefighting. On average,
each new premium car requires up
to 20 hours of extra work related to
quality, qualification and unplanned
fixes. Digital industry could reduce
these inefficiencies, saving up to
US$100 million per new car launch.
Digital industry can bridge the
engineering-production interface
with direct “online feedback loops,”
preventing late changes and allowing
for more planning certainty and
less waste. For example, quality
management and metrology can
be integrated with the production
process, fixing problems shortly
after (or even before) they occur.
This eliminates the need to take
samples and limits delays between
identifying and solving problems. A
closer integration of engineering and
production systems based on real-
time data also speeds communication
cycles in case of late changes.
Showcasing the consequences of
intended engineering modifications
allows for better informed decision-
making and more stable milestones
(less “green light creep”).
Case Study 4: Performance Improvement through Digital Mock-ups in Plant Engineering
Malfunctioning software used to be a
major cause of delays, on-site reworks
and cost overruns at plant engineering
companies. Software commissioning
engineers had to be sent to the site to
install, test and de-bug the software
until the line was performing as
expected. Today, a digital 3D mock-up
of the plant or the line is developed
upfront, including all internally and
externally supplied modules. Software
is then tested on the digital model,
and commissioning is also simulated.
Effective on-site commissioning can
be completed faster, more reliably
and at lower cost. Expensive software
experts control commissioning
remotely, while less qualified staff are
deployed on site. The digital model of
the commissioned plant also provides
a basis for optimizing operations and
maintenance through its lifecycle.
Copyright © 2016 Oliver Wyman 9

digital models. Less physical prototyping will be
needed, replaced by digital modeling and virtual
testing environments. (See Case Study 3.)
IMPROVED PRODUCTION PERFORMANCE AND SMART MAINTENANCE
We expect improved production performance
and smart maintenance to be worth about
US$70 billion. Production equipment and
process performance can be optimized by fully
digitalizing the offering and simulating production
processes in real-time. When potential issues
can be identified before they occur, uptime and
output will increase, and scrap rates and reworks
will be minimized. Real-time monitoring and
improved analytics will allow machine operators to
maintain equipment according to condition, avoid
replacing parts too early or too late and manage
stock levels according to actual needs. (See Case
Studies 4 and 5.)
PLANT NETWORK OPTIMIZATION
Individual plants typically have their own
monitoring and control systems, and have different
systems for each subsection or assembly line.
Digital technology can now provide cross-sectional
and cross-plant integration of control systems
using the real-time exchange of performance
data. Decisions will be made from a cross-
functional value chain perspective, optimizing
the production network rather than individual
machines, lines, functions or plants. This will
include a more dynamic balancing of capacity and
utilization in production networks. The efficiency
gains from these developments will reduce costs
by about US$30 billion a year. (See Case Study 6.)
NEXT-GENERATION INVENTORY AND QUALITY MANAGEMENT
Today, inventory and warehousing are often
managed with incomplete data about the level
and the timing of stocks along the supply chain.
This means that to provide a buffer against
unexpected shortages, stocks need to be kept
at higher levels. In a digital world, firms will
have real-time data about their inventory, more
automated warehousing and better forecasting
of bottlenecks. This will allow them to plan
adjustments or place orders in a timely fashion.
Costly short-term production rescheduling – for
example, due to missing parts – will be minimized.
Stock management will also be improved by
greater transparency regarding the hardware
and software that have been built into products.
Deviations between the “to be” bill of material
(BoM) and the hardware and software that have
actually been built into a product will be fully
transparent (as they are today for safety-critical
parts), allowing quality issues to be quickly
traced and fixed. (See Case Study 7.)
Copyright © 2016 Oliver Wyman 10

BACK
Case Study 5: Smart Maintenance through 3D Spare Parts Printing in Aerospace
Aircraft spare parts are prime
candidates for 3D printing. Demand
is hard to predict because the
number of aircraft parts is enormous
and spares are rarely needed. Yet
when they are, they must be quickly
available. This explains why 3.5 million
spare parts are today on stock at
locations around the world, and why
several sites also have tooling and
manufacturing capacities.
Because 3D printing can deliver
parts “on demand” with very short
lead times, it obviates the need to
keep a stock of spare parts that are
rarely needed, and expensive tooling
equipment and labor can be replaced.
Aircraft OEMs and component
suppliers launched 3D printing for
simple aircraft spare parts some years
ago and are now expanding the range
of parts covered, including even some
complex engine components. New
technologies, such as direct metal
laser melting (DMLM), mean engine
manufacturers have begun using 3D
printing to mass produce parts, such
as fuel nozzles.
Case Study 6: Plant Network Optimization
At a manufacturer of complex engine
parts, the collection and flow of
information about production and
quality related data displayed the
typical deficiencies: large delays
between the occurrence of production
issues and their identification by
end-of-line testing. And the potential
for a granular optimization of
equipment uptime (OEE) was limited
by fragmented data collection from
work stations.
To address these problems, the
firm added cyber-physical systems
that feed real-time data into an
advanced analytical model that
creates a digital representation of
the complex causal relationships
within the manufacturing process.
Using this model, early trigger
points for quality and performance
deviations can now be detected
and controlled in near-time. The
digital model also allowed OEE to be
improved across the plant network
of multiple manufacturing lines with
only small changes to equipment
and processes. The new model and
associated analytical capabilities
have become essential elements
in the continuous improvement
of manufacturing processes and
product design, creating a data-driven
interlock between the PLM/PDM,
Quality Management System (QMS)
and Manufacturing Execution System
(MES) domain.
Case Study 7: Improved Quality Based on Machine-learning Algorithms
In components manufacturing today,
quality inspection reveals much
deviation from specified standards
and, because it is done by humans,
is slow and expensive. Different
suppliers of similar parts often
supply quality data that cannot be
compared. Delays between quality
inspections by the supplier and the
provision of the information they
produce disrupts component buyers’
production planning.
Digitalization allows quality
inspection to be based on machine-
learning algorithms that can identify
early indicators of error, allowing them
to predict rather than simply observe
deviations from quality specifications.
Standardized quality inspections
across multiple suppliers of similar
products allow the rapid optimization
of production planning based on
indicators early in the supply chain.
Quality data can be integrated in the
PDM system, trends being analyzed
and engineering changes prompted.
Human mistakes are eliminated;
dependency on quality inspectors
is reduced; tractability is enhanced;
and a digital parts footprint becomes
available along the entire value chain.
Copyright © 2016 Oliver Wyman 11

EXAMPLE
Optimal allocationand routing
Rail carschedules
Contracts/Leasingconditions
Spare partsuppliers
Rail carin operation
Identified upcomingmaintenance need
Repair shops
EXAMPLE
PLA
TFO
RM
-AS-
A-B
USI
NES
S
Application
Reporting and analytical services
Data management services
Data integration services
Data sources/sensors
Dat
a se
cuti
ryEXAMPLE
Vehicleuptime
contract
Mine operator
Mining vehiclemanufacturer
EXAMPLE
Real-timeaircraft parameter
data collection
Engine
Partrecertification
MROoptimization
Flight scheduleoptimization
Wings Airframe
EXAMPLE
END-TO-END INTEGRATEDPROCESS WITHOUT HUMAN INTERFACING
Customer
Digitalizedproduct
Fully flexibleproduction
Distributionplanning
Productconfigurator
Delivery
EXAMPLE
PRODUCTION PROCESS
Real-timeproduction
data collection
“Lab-like”testing models
Controls onraw material,consumables
Step 3Step 2Step 1
The applications of digital technology discussed above improve the efficiency of manufacturers’ internal
processes. But these are only part of the opportunity. OEMs can also boost growth by helping their
B2B customers to reduce their costs (especially in production and maintenance) and improve their
own customer offerings and value creation. The race to capture such opportunities has already started.
In this section we describe some of these emerging digital OEM business models.
RAIL: ASSET LIFECYCLE OPTIMIZATION
A railcar and locomotive OEM is now offering a cloud-
based software suite that improves asset management
and operating efficiency for rail operators. It has four
main components:
• A predictive maintenance tool based on sensors, data analytics and OEM domain knowledge that automates decisions on maintenance timing, integrating it into operations schedules and selecting repair shops and spare part suppliers
• Real-time information about train locations and speeds that optimizes network usage, especially in narrow corridors and yards
• Tools that help logistics providers automate operations, manage inventory and control transportation costs
• Optimized energy consumption based on a train’s features and the route traveled, for example, by using automatic throttle control
Customers benefit from reduced maintenance and
energy costs as well as reduced track usage. By increasing
the utilization of assets, rail operators can reduce their
capital expenditure over the long run. The OEM receives an
additional monthly revenue stream from selling the lifecycle
optimization software. And it can increase downstream
profits from service and spare parts by gaining increased
customer lock-in.
NEW BUSINESS OPPORTUNITIES FROM DIGITAL SOLUTIONS
SECTION FOUR
Copyright © 2016 Oliver Wyman 12

EXAMPLE
Optimal allocationand routing
Rail carschedules
Contracts/Leasingconditions
Spare partsuppliers
Rail carin operation
Identified upcomingmaintenance need
Repair shops
EXAMPLE
PLA
TFO
RM
-AS-
A-B
USI
NES
S
Application
Reporting and analytical services
Data management services
Data integration services
Data sources/sensors
Dat
a se
cuti
ry
EXAMPLE
Vehicleuptime
contract
Mine operator
Mining vehiclemanufacturer
EXAMPLE
Real-timeaircraft parameter
data collection
Engine
Partrecertification
MROoptimization
Flight scheduleoptimization
Wings Airframe
EXAMPLE
END-TO-END INTEGRATEDPROCESS WITHOUT HUMAN INTERFACING
Customer
Digitalizedproduct
Fully flexibleproduction
Distributionplanning
Productconfigurator
Delivery
EXAMPLE
PRODUCTION PROCESS
Real-timeproduction
data collection
“Lab-like”testing models
Controls onraw material,consumables
Step 3Step 2Step 1
EXAMPLE
Optimal allocationand routing
Rail carschedules
Contracts/Leasingconditions
Spare partsuppliers
Rail carin operation
Identified upcomingmaintenance need
Repair shops
EXAMPLE
PLA
TFO
RM
-AS-
A-B
USI
NES
S
Application
Reporting and analytical services
Data management services
Data integration services
Data sources/sensors
Dat
a se
cuti
ry
EXAMPLE
Vehicleuptime
contract
Mine operator
Mining vehiclemanufacturer
EXAMPLE
Real-timeaircraft parameter
data collection
Engine
Partrecertification
MROoptimization
Flight scheduleoptimization
Wings Airframe
EXAMPLE
END-TO-END INTEGRATEDPROCESS WITHOUT HUMAN INTERFACING
Customer
Digitalizedproduct
Fully flexibleproduction
Distributionplanning
Productconfigurator
Delivery
EXAMPLE
PRODUCTION PROCESS
Real-timeproduction
data collection
“Lab-like”testing models
Controls onraw material,consumables
Step 3Step 2Step 1
PAPER INDUSTRY: PRODUCTION OPTIMIZATION
An OEM of paper manufacturing machinery offers software
that optimizes input consumption and increases yield in
paper production. The solution collects and analyses data,
makes real-time estimates of optimization potentials and
automatically adjusts process parameters. The quantity of
input materials, machine setup and operational dispatching
can be changed to improve the production process based
on findings from the test model.
Customers save on input materials and from reduced
scrap, amounting to 3 percent to 5 percent of total
production costs. And the increased uptime of machines
leads to a higher yield. The OEM charges a monthly fixed
fee for installation and can receive success-based revenue
streams if the customer achieves agreed-upon levels of
savings on production costs. Additionally, the OEM can
build a production consulting business using insights from
the data and algorithms.
CUSTOM FURNITURE PRODUCTION: “DIGITAL PROCESS IN A BOX”
A machinery OEM now offers an end-to-end value
proposition to its midsize customized furniture providers,
including fully automated manufacturing, MES, ERP, digital
modelling of products and a customer front-end. The digital
model allows for mass customization and significantly
reduces the cost of setting up new product lines.
The new process creates a step change in the choice and
process efficiency that kitchen and furniture manufacturers
can provide for customers. The OEM receives a price
premium for its differentiated offering and increased
customer lock-in, which translates into greater profit from
downstream servicing and software upgrades.
Copyright © 2016 Oliver Wyman 13

EXAMPLE
Optimal allocationand routing
Rail carschedules
Contracts/Leasingconditions
Spare partsuppliers
Rail carin operation
Identified upcomingmaintenance need
Repair shops
EXAMPLE
PLA
TFO
RM
-AS-
A-B
USI
NES
S
Application
Reporting and analytical services
Data management services
Data integration services
Data sources/sensors
Dat
a se
cuti
ry
EXAMPLE
Vehicleuptime
contract
Mine operator
Mining vehiclemanufacturer
EXAMPLE
Real-timeaircraft parameter
data collection
Engine
Partrecertification
MROoptimization
Flight scheduleoptimization
Wings Airframe
EXAMPLE
END-TO-END INTEGRATEDPROCESS WITHOUT HUMAN INTERFACING
Customer
Digitalizedproduct
Fully flexibleproduction
Distributionplanning
Productconfigurator
Delivery
EXAMPLE
PRODUCTION PROCESS
Real-timeproduction
data collection
“Lab-like”testing models
Controls onraw material,consumables
Step 3Step 2Step 1
EXAMPLE
Optimal allocationand routing
Rail carschedules
Contracts/Leasingconditions
Spare partsuppliers
Rail carin operation
Identified upcomingmaintenance need
Repair shops
EXAMPLE
PLA
TFO
RM
-AS-
A-B
USI
NES
S
Application
Reporting and analytical services
Data management services
Data integration services
Data sources/sensors
Dat
a se
cuti
ry
EXAMPLE
Vehicleuptime
contract
Mine operator
Mining vehiclemanufacturer
EXAMPLE
Real-timeaircraft parameter
data collection
Engine
Partrecertification
MROoptimization
Flight scheduleoptimization
Wings Airframe
EXAMPLE
END-TO-END INTEGRATEDPROCESS WITHOUT HUMAN INTERFACING
Customer
Digitalizedproduct
Fully flexibleproduction
Distributionplanning
Productconfigurator
Delivery
EXAMPLE
PRODUCTION PROCESS
Real-timeproduction
data collection
“Lab-like”testing models
Controls onraw material,consumables
Step 3Step 2Step 1
AEROSPACE: DATA-DRIVEN MRO
Aircraft component suppliers and OEMs can create new
sources of recurring revenue by offering innovative data-
driven maintenance, repair and overhaul (MRO) solutions
to airline customers. Today, a large aircraft generates over
500 gigabytes of data from 600,000 parameters per flight.
Advances in MRO will come from better analysis of this
data for predictive maintenance activities. Aircraft health
parameters can be tracked in real-time during operation
and efficient MRO plans formed before critical operating
thresholds are achieved.
Such data-driven solutions cut MRO costs by reducing
aircraft turnaround (grounding) times. The average cost of
maintenance is now more than US$1,200 per flight hour for
a commercial aircraft. Even a 1 percent improvement in the
efficiency of engine maintenance alone would save airlines
US$250 million. Improved maintenance will also increase
the resale value of airplanes and their parts. The component
manufacturer increases its long-term service contract
penetration significantly, increasing profit streams from
downstream services and original spare parts.
DIGITALLY-ENABLED PERFORMANCE GUARANTEES
The customers of OEMs often seek not the machinery
supplied to them but what the machinery does. For
example, an open-cast mining company wants to shift
material from pits to rail trucks. They now buy the vehicles
that do this from OEMs. But they could instead buy a
promise of the desired outcome: that is, the movement of
mined material. By using real-time condition monitoring
and superior data analytics, the OEM can learn about the
risk profile and manage and maintain the vehicles more
efficiently than the customer, allowing both parties to profit
from the guarantee. Similar substitutions of guarantees of
performance for equipment could occur in many industries.
Customers would benefit from increased uptime and
from transferring asset productivity risks to the OEM,
shifting the assets off their balance sheets. Early moving
OEMs can gain market share by offering something their
competitors do not. And if the guarantees are properly
priced and the technology properly used, OEMs will
capture a portion of the value of the efficiency gains.
Copyright © 2016 Oliver Wyman 14

EXAMPLE
Optimal allocationand routing
Rail carschedules
Contracts/Leasingconditions
Spare partsuppliers
Rail carin operation
Identified upcomingmaintenance need
Repair shops
EXAMPLE
PLA
TFO
RM
-AS-
A-B
USI
NES
S
Application
Reporting and analytical services
Data management services
Data integration services
Data sources/sensors
Dat
a se
cuti
ry
EXAMPLE
Vehicleuptime
contract
Mine operator
Mining vehiclemanufacturer
EXAMPLE
Real-timeaircraft parameter
data collection
Engine
Partrecertification
MROoptimization
Flight scheduleoptimization
Wings Airframe
EXAMPLE
END-TO-END INTEGRATEDPROCESS WITHOUT HUMAN INTERFACING
Customer
Digitalizedproduct
Fully flexibleproduction
Distributionplanning
Productconfigurator
Delivery
EXAMPLE
PRODUCTION PROCESS
Real-timeproduction
data collection
“Lab-like”testing models
Controls onraw material,consumables
Step 3Step 2Step 1
DIGITAL PLATFORM AS A PROPOSITION
Some companies are trying to leverage the digital
platforms developed for their internal purposes by
offering them to third-party users. Such platforms
typically comprise hardware (for example, sensors,
gateways), software (for example, data management,
security, algorithms) and data storage (for example,
cloud solutions).
Infrastructure alone typically creates no direct customer
value. However, it can be a key enabler for valuable
applications running on it. For the OEM, value is captured
not only from add-on fees for the platform-as-a-business in
current customer markets but also from selling the scaled
platform into new markets. It is not yet clear, however, that
such platform offerings have a strategic control point in the
evolving competitive landscape (which includes traditional
IT providers) nor which revenue model will be accepted
by customers.
In summary, the investments OEMs make in digital
technology to improve their own performance can also
provide the foundation for new business models or
customer propositions, thereby increasing the yield on
those initial investments. Being a “heavy user” of digital
technology helps build credibility as a provider of digital
solutions to customers.
Copyright © 2016 Oliver Wyman 15
Incumbent industrial firms and established software players in enterprise resource
planning, product lifecycle management and automation are likely to be among the
winners as digital industry develops. Industrial applications appear too small and
fragmented to be a priority for the mass-market consumer-focused online giants. Just
as Microsoft did not win in “open automation” in the 2000s, Amazon and Google are
unlikely to conquer in the industries environment over the midterm.
Nevertheless, the distribution of market shares
between industrial firms, automation players and
software suppliers is likely to change. A variety
of strategic moves can now be observed along
the “value creation chain” and the “technology
stack”. For example, hardware players are
trying to use software to make their products
smarter; PLM/PDM players are trying to extend
their reach into ERP and MES; automation
control players are trying to capture plant
analytics. To favourably position itself in this
multi-dimensional play, an industrial company
must identify and capture strategic control
points, deciding what technology it needs to
own, what it can outsource and when it should
enter partnerships.
At the same time, startup specialists
are beginning to emerge, offering complex
optimization algorithms, analytics and apps
that increase process and data transparency
for industrial customers. Successful specialist
players, however, are likely to be bought out by
the giants, given their lack of critical mass and
limited access to the financing needed for R&D.
Intense competition could arise within the
“tier structure” of an industry segment, as OEMs
(for example, of vehicles) and tier-1 suppliers
of components (such as gear boxes) both
try to offer digital solutions (such as efficient
driving) to end customers (such as transport
operators). This new source of competition
arises from digital business models of the kind
discussed in Section 4. But these models will
take off only if answers can be found to difficult
questions regarding the use and ownership of
customer data.
In B2C, the issue is mainly one of privacy.
In B2B, by contrast, the issue is competition.
For example, an equipment supplier who gains
access to its customer’s operational and sales
data may be able to capture a greater share of
the total supplier surplus generated along the
end-to-end production chain. And if the OEM’s
business model accidentally makes one of its
suppliers’ data available to competitors, the
OEM may find itself legally liable for any losses
incurred by that supplier.
Uncertainty about the ownership of data, and
who has access to it, thus creates an obstacle to
the development of new digital business models.
The customer will be reluctant to take the risk of
providing the required data, especially before
the superior value of the model is proven. Yet
the value of the model cannot be demonstrated
in practice until customers become willing to
provide the data.
A NEW COMPETITIVE LANDSCAPE
SECTION FIVE
Copyright © 2016 Oliver Wyman 16

This is a familiar problem for new business
models. A lack of precedent causes commercial
and legal uncertainty. We expect the problem to
diminish as the law surrounding data ownership
advances with the burgeoning digital economy.
In the short term, however, firms will need to
find particular solutions to the particular risks
presented by particular business models. Such
solutions may be provided by a “neutral”
intermediary with no other stake in the value
chain, by a non-compete or exclusivity contract
or by a product development partnership. Where
the potential gains and the risks are sufficiently
large, we may even see some vertical
integration – the classic solution to the problem
of excessive transaction costs.
Exhibit 5: Connected Industry Competitive Dynamics
Example: Machinery
CURRENT SOFTWARE LAYERS STRATEGIC MOVES
Collaborative
Partnering with enterprise levelsoftware providers
Enterprise Resource Planning (ERP)
Product-Lifecycle-Management (PLM)/Product Data Management (PDM)
Manufacturing Execution System (MES)
Defensive
Machine producers pushing backon industrial automation playersinitiatives to establish ownsoftware as standard
Aggressive
Players pushing into analytics layerwith respective value proposition
Software onenterprise level
Software formachine controls/
applications
Software/drivers forsensors, controls
Software on plant level
Data analysesSupervisory Control AndData Acquisition (SCADA)
Programmable Logic Controller (PLC)/Computer Numerical Control (CNC)
Machine Drives, Sensors
Player 1
Player 2
Player 3
Player 4
Note: Position of arrow indicates possible move of integration for player in the market
Source: JP Morgan, CS equity research, CIM data, company homepage, expert interviews, Oliver Wyman
Copyright © 2016 Oliver Wyman 17
Industrial companies seeking to exploit their digital potential will not succeed by simply
launching apps. They will need to transform many dimensions of their business and
operating models and build a broad set of new capabilities. Even if this process unfolds
over many years, with hindsight the corporate transformation will look revolutionary.
Companies should not underestimate the
urgency of getting this process started
because “it’s going to take a dozen years,
anyway.” Customers’ expectations regarding
digitization will rise at an increasing pace, and
startups or fast-moving incumbents will grab
the opportunities. In other words, “laggards
will be losers.”2
But getting the process moving is difficult.
When asked the greatest obstacle to realizing
their digital potential, a group of CEOs from
leading mechanical engineering firms surveyed
by Oliver Wyman did not name the familiar
topics, such as a lack of technical standards or
data security, as the main obstacles to realizing
their company’s digital potential. (See Exhibit 6.)
Rather, they pointed to a “lack of creativity to think
beyond today’s business and operating models”
and to a “lack of competencies and capabilities”.
Becoming the kind of firm that can thrive
in digital industry is a significant challenge. It
will require incumbent industrials to develop
skills in data analysis, to upgrade technology,
to become more innovative and to make
organizational changes that promote these
advances. (See Exhibit 7.)
DATA ANALYSIS
Industrial companies, especially those in the
B2B space, have traditionally made little use
of advanced data analytics to drive business
decisions, relying instead on experience and
judgement (sometimes informed by basic
quantitative analysis). The required skills
are thus scarce in these firms. To become
digital industries, they will need staff who
can understand the content and value of
existing data pools, handle large amounts of
data (which often need to be extracted from
the legacy systems), apply sophisticated
analytical techniques and make full use of
off-the-shelf analytics software. This will require
DIGITAL TRANSFORMATION
SECTION SIX
2 See our 2015 Report, Incumbents in a Digital World: Laggards Will Be Losers.
Customers’ expectations regarding digitization will rise at an increasing pace, and startups or fast-moving incumbents will grab the opportunities.
Copyright © 2016 Oliver Wyman 18

Lack of creativity to develop innovative business models
100
86Lack of internal software competencies
84Insu�cient big data and analytics capabilities
80Legal risks regarding data ownership
75Missing standards (IT, interfaces)
66Low a�nity to data driven processes
64
Insu�cient businesspartners’ cooperativeness
59Data security risks
57Insu�cient infrastructure readiness
36
9
Lack oftop management a�nity
Other
Exhibit 6: Obstacles to Becoming a Digital Industry
As judged by CEOs, largest = 100
Source: Oliver Wyman survey of leading German manufacturing companies
companies to recruit new types of employees and, at
least initially, to enter partnerships with specialized
firms, startups or institutes. Over time, the
proportion of staff with the relevant skills will need to
grow significantly.
Besides acquiring staff who can produce
analytic insights, management must develop the
confidence to trust these insights and transparently
act on them. Indeed, the transformation process
needs to be driven by the business or commercial
side of the firm, working with the analytics
people to identify and prioritize the processes or
decisions that will deliver the greatest upside from
data-driven optimization, and following through
with implementation.
TECHNOLOGY
Creating digital solutions requires an IT development
process that differs in structure and pace from
the now standard approach in industrial firms.
Digital solutions require an agile and high-speed
development process in which an initial solution is
generated early on and then goes through numerous
test-learn-rebuild cycles. Such a process is more likely
to be run successfully by digital natives with a work
style and spirit more akin to that of a startup. At least
initially, the development of digital technology is likely
to require organizational separation to thrive, giving
rise to a “two-speed system” within the company.
Creating digital solutions requires novel decisions
on the technology stack used to build the middleware
and application layers on legacy IT systems. What
was once a secondary asset may become primary, or
Copyright © 2016 Oliver Wyman 19

CLARITYOF VISION
ON TRACKTODAY
FUTURE STATEREADYBEHIND
DIGITIZE WHATYOU HAVE
DECOUPLEOLD AND NEWTECHNOLOGY
PUT ANALYTICSON THE FRONTLINES
FREE THEDIGITAL TEAM
INNOVATEWITHOUTBORDERS
ENABLENEW DIGITALBUSINESSES
1/
2/
3/
4/
5/
6/
• Do you know which disruption patterns apply to you?
• Do you have a roadmap?
• Is the organization bought in?
• Do your processes start from data?
• Are your processes simple, immediate, and end-to-end?
• Is manual intervention an exception?
• Do you explicitly invest in mid-tier?
• Are >60% of your eligible projects executed agile style?
• Have you separated “legacy” and “new” IT teams?
• Do you have a set of focused analytics e�orts in place?
• Are you ready for the paradigm shift of analytics?
• Are you implementing flexible, distributed data infrastructure?
• Do you have a separate digital unit?
• Are you able to attract digital talent?
• Has agile execution conquered legacy mindsets?
• Have you clearly defined your innovation agenda?
• Do you have a network of strategic innovation partners?
• Have you focused and funded innovation through labs?
• Is a digital business competing with your current one?
• Are >40% of your sales through digital channels?
• Have you migrated along profit pools through digital?
Fast follower strategy –wait and see approach
Disruption anticipatedaction plan and
measures in place
Focus on automationand lean reengineering
Processes upside down;once and done;
instant activation
Core system complexityconsumes >30% of projectbudget and time-to-market
Effective mid-tier;agile a common practice
Fragmented,incomplete data;simple analytics a project
Behavioral and predictiveanalytics;
> 100 scientists
Digital in legacy ITand business; waterfall
Digital distinct;high talent inflow; agile
No clear agenda;internally focused;underfunded
Innovation agenda,ecosystem andfunding as BAU
Digital as extensionof existing business
Digital as active challengerto the legacy business
Exhibit 7: Digital Readiness
Source: Oliver Wyman Report, Incumbents in a Digital World: Laggards Will Be Losers
Copyright © 2016 Oliver Wyman 20
vice versa. Such shifts will require industrial firms to
think harder than usual about the trade-offs between
open or proprietary solutions and about make-or-
buy decisions, including for the operating phase of
the solution.
INNOVATION
The innovation culture of industrial firms typically
reflects the perfectionist and risk-averse attitude
associated with good engineering. To be successful
in a digital world, industrial companies will need
to “loosen up.” Pace is more important than
perfection. An 80 percent solution is acceptable
as a starting point, and failure is no catastrophe.
Indeed, frequent – and, ideally, early and therefore
cheap – failure is a key characteristic of a productive
digital innovation process. Recruiting staff with not
only the right skills but the right attitudes will help.
The greatest cultural obstacle to digital innovation
can be a reluctance to undermine currently profitable
business models. Even though loyalty effects will
most typically enhance spare parts sales in the long
run, introducing condition-based maintenance for
customers may reduce spare part sales in the short
run. The reason can be found directly in the parts:
They will now be replaced only when necessary, rather
than according to a regular maintenance cycle. Such
reluctance will be costly. If incumbent companies
are reluctant to disrupt themselves, others will do
the job for them. And the loss will usually exceed the
particular revenues concerned. Once a third party is
inserted between the OEM and its customer, the OEM
will lose opportunities to expand its share of wallet – in
the maintenance case, for example, the opportunity
to sell higher value optimization services through
this channel.
ORGANIZATION
As noted, going digital will require new kinds of staff
and new ways of working within incumbent industrial
firms. Because the overall culture of a large firm
cannot be changed quickly, digital developments will
initially need a “parallel organization,” creating a two-
speed development process and, more generally,
a two-speed workforce. The “second” organization
is also needed to attract digital talent who would
otherwise prefer to found or work for a startup.
New organizational roles will also be needed.
These include “content authorities” – experienced
managers who can quickly make judgement calls
about the feasibility of new ideas – and “tweeners”:
people who understand both the digital and the
business side and who can act as mediators between
these initially separate worlds.
Overall, we advocate a decentralized model in
which digital “speed boats” get traction with a high
degree of delegated decision authority. Consensus-
oriented decision making in layered committee
structures will not do the job. Indeed, digital
technology means that the corporate and
analytical centres can become virtual, with staff
geographically dispersed. This will help to tap in
to global talent pools and attract the kind of staff
needed to make the digital transformation. Once
the digital world has gained critical mass, it can be
integrated with the legacy business – or absorb it.
Copyright © 2016 Oliver Wyman 21

Digital technology will change industry
profoundly, making it far more efficient
and creating new business models. Unlike
the previous industrial revolutions, this
transformation will not replace human muscle
with powerful machines; it will provide human
decision making with support from intelligent
machines. Digital firms will be quite unlike the
typical firms of today: employing different kinds
of people who perform different tasks within
different organizational structures.
Industrial firms are often large and slow to
change. They must overcome this natural inertia.
The first step is to articulate a digital vision. (See
Exhibit 8.) This has two broad elements. First,
industrial firms must decide on their digital
intent: the kinds of efficiency improvements
and growth they can achieve through the use
of digital technology, as discussed in Sections 3
and 4. Then they need to identify the additional
capabilities that will be required to achieve this
digital intent, as discussed in Section 6. From
here, they will need to develop action plans for
transformation. Although the transformation
will take many years, it cannot be delayed. As we
have argued elsewhere, laggards will be losers.3
SUMMARY
Exhibit 8: Building the Digital Vision and Action Plan
DIGITAL INTENT
DIGITAL CAPABILITIES
GROWTH
INNOVATION
ORGANIZATION
EFFICIENCY
TECHNOLOGY
DATA & ANALYTICS
VISIONDigital evolution
of the industry
SECTION SEVEN
3 See our 2015 Report, Incumbents in a Digital World: Laggards Will Be Losers.
Source: Oliver Wyman Report, Incumbents in a Digital World: Laggards Will Be Losers
Copyright © 2016 Oliver Wyman 22
RECENT PUBLICATIONS FROM OLIVER WYMAN
For these publications and other inquiries, please email [email protected]
or visit www.oliverwyman.com.
LAGGARDS WILL BE LOSERS
INCUMBENTS IN THE
DIGITAL WORLD
INCUMBENTS IN THE DIGITAL WORLD
How incumbent organizations can
ultimately win in a marketplace
transformed by digital disruptors.PERSPECTIVES ON MANUFACTURING INDUSTRIES 2016/1
PERSPECTIVES ON MANUFACTURING INDUSTRIES
A collection of viewpoints on industrial
companies’ challenges and trends,
as well as their opportunities and
potential courses of action.
VOLUME 2
FROM OLIVER WYMANTEN IDEAS
TEN IDEAS FROM OLIVER WYMAN, VOL. 2
In this collection of articles, we
showcase ten ideas from across our
firm for how business leaders can
improve and grow their businesses.
TH
E O
LIVE
R W
YM
AN
RIS
K JO
UR
NA
L VO
LUM
E 5
| 20
15
VOLUME 5
THE OLIVER WYMAN
PERSPECTIVES ON THE RISKS THAT WILL DETERMINE YOUR COMPANY’S FUTURE
RISK JOURNAL
THE OLIVER WYMAN RISK JOURNAL, VOL. 5
A collection of perspectives on the
complex risks that are determining
many companies’ futures.
AUTOMOTIVEMANAGERTRENDS, OPPORTUNITIES, AND SOLUTIONS ALONG THE ENTIRE VALUE CHAINCOVER STORY: THE TRUE VALUE OF AUTONOMOUS DRIVING
2015
THE OLIVER WYMAN AUTOMOTIVE MANAGER
A magazine for automotive industry
leaders that provides insights into
trends, prospects, and solutions for
manufacturers, suppliers, and dealers.
FALL 2014
TRANSPORT & LOGISTICS
TRANSFORMATION | Disruptive Logistics, Aviation Biofuels MARKETING | Mobility 2020, Customer Innovation FINANCE | HSR Funding, 3PL Profitability OPERATIONS | Manager Excellence, MRO Survey And more…
THE OLIVER WYMAN TRANSPORT & LOGISTICS JOURNAL
A publication that discusses issues
facing global transportation and
logistics industries.
THE OLIVER WYMAN
ENERGY JOURNAL
VOLUME 2
THE OLIVER WYMAN ENERGY JOURNAL, VOL. 2
This issue of the Oliver Wyman Energy
Journal reflects the latest thinking across
Oliver Wyman’s Energy practice on the
resulting new risks and opportunities
that will impact not just the energy
sector, but also every company and
person that depends on it.
M O D U L A R F I N A N C I A L S E R V I C E S T H E N E W S H A P E O F T H E I N D U S T R Y
MODULAR FINANCIAL SERVICES
The new shape of the industry.
Copyright © 2016 Oliver Wyman 23

Copyright © 2016 Oliver Wyman. All rights reserved.
www.oliverwyman.com
ABOUT OLIVER WYMAN
Oliver Wyman is a global leader in management consulting. With offices in 50+ cities across 26 countries, Oliver Wyman combines deep industry knowledge with specialized expertise in strategy, operations, risk management, and organization transformation. The firm’s 3,700 professionals help clients optimize their business, improve their operations and risk profile, and accelerate their organizational performance to seize the most attractive opportunities. Oliver Wyman is a wholly owned subsidiary of Marsh & McLennan Companies [NYSE: MMC]. For more information, visit www.oliverwyman.com. Follow Oliver Wyman on Twitter @OliverWyman.
AUTHORS
THOMAS KAUTZSCH
Global Practice Leader, Automotive & Manufacturing Industries
+49 89 939 49 460
WOLFGANG KRENZ
Partner, Automotive & Manufacturing Industries Practice
+49 89 939 49 403
TOBIAS SITTE
Partner, Automotive & Manufacturing Industries Practice
+49 89 939 49 541
Recommended