
Differences in the beta for fixed vs mobile
telecommunications operators
For the Office of Communications (OFCOM)
February 2017

Project Team
Dr. Richard Hern
Marija Spasovska
Jinzi Guo
NERA Economic Consulting
Marble Arch House, 66 Seymour Street
London W1H 5BT
United Kingdom
Tel: 44 20 7659 8500 Fax: 44 20 7659 8501
www.nera.com
Contents
Contents
1. Introduction 1
2. Differences in Risk between Fixed and Mobile Telecoms Operators 2
2.1. The Relative Riskiness of Fixed and Mobile Telecom Services 3
2.2. Qualitative Evidence of the Relative Difference in Income Elasticity of Demand 5
2.3. Evidence on Operating Leverage 9
2.4. Conclusions 11
3. Cross-sectional Analysis: Evidence of Differences in Asset Betas between Fixed and Mobile Network Operators 12
3.1. Sample selection 12
3.2. Visual inspection and Cross-sectional Regression 13
3.3. Assessment of Outliers in Cross-sectional Regression 16
3.4. Controlling for Other Potential Drivers of Cross-sectional Asset Betas 17
3.5. Conclusions 19
4. Time-series Analysis: Evidence of Changes in Asset Betas in Light of Changes in Mobile Activity Exposure 20
4.1. Sample selection 20
4.2. Discussion of Time Series Observations 22
4.3. Conclusions 26
5. Conclusions 28
Appendix A. Assessment of Operating Leverage for Telecom network operators 29
Introduction
NERA Economic Consulting 1
1. Introduction
This work is undertaken in the context of the Office of Communications’ (Ofcom) upcoming
Consultation for the Wholesale Local Access (WLA) Market Review for the period 2017-
2020.
Ofcom is required to undertake reviews of various communications markets every three years
under the Communications Act 2003, which implements the EU regulatory framework for
electronic communications. The process is designed to assess the existence of competitive
pressures in the various market segments. If Ofcom finds evidence that competitive
constraints are insufficient, it has the power to impose remedies such as ex ante regulation in
the form of price controls. The asset beta is a measure of systematic risk and informs
Ofcom’s estimate of BT’s weighted average cost of capital (WACC), which is a part of
Ofcom’s consideration of the level of any price control imposed.
In its most recent Leased Lines Charge Control (LLCC) statement forming part of Ofcom’s
Business Connectivity Market Review for 2016 – 2019 (2016 BCMR), Ofcom was of the
view that BT’s systematic risk can be differentiated across the following three categories:
“Openreach copper access”, “Other UK Telecoms”, and “Rest of BT”.1 The “Openreach
copper access” category covered BT’s copper network business, the “Other UK Telecoms”
category covered BT’s leased lines, fixed voice, broadband and bundled services (e.g. TV),
and the “Rest of BT” covered BT’s ICT business. However, since the publication of the
LLCC, BT has completed its acquisition of EE, and thus added mobile services to its business
portfolio.
In this context, Ofcom commissioned NERA Economic Consulting (NERA) to assess the
latest evidence on differences in systematic risk between fixed and mobile telecom operators,
and specifically, to assess whether there is evidence (or otherwise) that the asset beta
associated with BT’s newly acquired mobile operator (EE) is similar to that of its ‘other UK
telecoms’ operations, as defined above.
This report is structured as follows:
Section 2 discusses the latest qualitative evidence on differences in risk between fixed
and mobile operators in the UK, focusing on the income elasticity of demand of the two
products;
Section 3 sets out our empirical assessment of the difference in asset betas of fixed and
mobile operators, based on cross-sectional evidence of European telecoms operators;
Section 4 sets out our analysis of changes in observed betas over time for a selected group
of telecom companies that have experienced significant changes in exposure to mobile
activities; and
Section 5 sets out our concluding remarks.
1 Ofcom (April 2016), Business Connectivity Market Review – Volume I, p.597
http://stakeholders.ofcom.org.uk/binaries/consultations/bcmr-2015/statement/bcmr-final-statement-volume-one.pdf
Differences in Risk between Fixed and Mobile Telecoms Operators
NERA Economic Consulting 2
2. Differences in Risk between Fixed and Mobile Telecoms Operators
The Capital Asset Pricing Model (CAPM) is the traditional framework used by most
regulators worldwide for estimating the cost of capital. A key tenet of the CAPM is that
investors diversify their stock holdings by combining risky securities into a portfolio, the
effect of which is to eliminate specific (or non-systematic risks) risks. Complete
diversification of risk is not possible, however, since all securities move together to a certain
extent, a result of the influence of economy wide factors such as interest rates, inflation, and
macroeconomic demand. The risks that cannot be eliminated through diversification are
described as “systematic” or “market” risks. These are measured by the extent to which a
stock’s return co-moves with the aggregate market return.2
The finance literature distinguishes between the following three factors that affect the level of
systematic risk of an asset – as quantified by a company’s equity beta:3
1. The income elasticity of the product: The cyclicality of revenue (and by extension
profits) of a business is largely driven by the responsiveness of demand to general
changes in income, i.e. the income elasticity of the product. All else being equal, the
more discretionary the product or service provided, the higher its responsiveness to
changes in income, and therefore the higher its equity beta; and vice versa.
2. Operating leverage: The proportion of fixed vs variable costs employed in the
business is the second risk driver determining equity beta. All else being equal, the
greater the proportion of fixed costs, the higher the equity beta of the company. This
is because the greater the proportion of fixed costs, the greater the volatility (and
therefore risk) of profits compared to a firm with lower operating leverage; and
3. Financial leverage: The greater the financial leverage of the business, the higher the
equity beta. This is because higher gearing implies higher volatility (and therefore
risk) of earnings after interest (operating profit) to shareholders, given the higher
claims for interest on debt which has priority in the capital structure hierarchy of the
firm. The cost of equity increases to remunerate equity investors for the higher risk
they bear from the increasing use of debt financing via the higher levered equity beta.4
In this section and throughout this report we focus on issues 1 and 2, which concern
differences in income elasticity of demand and operating leverage between fixed and mobile
services. We do not analyse issue 3 on financial leverage, since this issue is under the control
of the management of a company. This section is structured as follows:
2 Beta is defined according to the following equation: 𝐸𝑞𝑢𝑖𝑡𝑦 𝛽 = 𝜌𝑠𝑡𝑜𝑐𝑘, 𝑚𝑎𝑟𝑘𝑒𝑡 × 𝜎𝑠𝑡𝑜𝑐𝑘
𝜎𝑚𝑎𝑟𝑘𝑒𝑡 , where ρstock, market is the
correlation coefficient of the stock and the market return; and σstock and σmarket are the respective standard deviations of
the stock and the market return respectively.
3 For example, see Prof. Aswath Damodaran’s discussion of beta determinants:
http://people.stern.nyu.edu/adamodar/pdfiles/eqnotes/discrate2.pdf
4 The impact of higher financial leverage on equity costs was first set out by Modigliani and Miller (1958). See
Modigliani, F.; Miller, M. (1958), "The Cost of Capital, Corporation Finance and the Theory of Investment".
Differences in Risk between Fixed and Mobile Telecoms Operators
NERA Economic Consulting 3
In section 2.1, we briefly assess the relevant literature on the relative riskiness between
mobile vs. fixed products;
In section 2.2 , we assess the qualitative evidence of differences in the income elasticity
of demand for fixed vs. mobile telecoms services; and
In section 2.3 we assess the evidence on difference in operating leverage for fixed vs.
mobile telecoms.
2.1. The Relative Riskiness of Fixed and Mobile Telecom Services
2.1.1. Overview of the existing literature on convergence between fixed and mobile services
The mass penetration of mobile products and services based on all relevant metrics including
by number of subscriptions, revenues and traffic, suggests that mobile is no longer regarded
as an “optional extra” or a “luxury good”, which may have been its status when it was first
introduced.
The accompanying erosion of mobile price premia relative to fixed line services, a
convenience factor associated with the portability / personalization of mobile products, and
technological advances in mobile network speed and quality have all led to seemingly lower
differentiation between fixed and mobile networks, and a body of literature that discusses the
relationship between the fixed and mobile network products and services. Recent studies
have analysed whether fixed vs. mobile services should be considered substitutes, or whether
they are in fact complementary or otherwise more converged.
Some of the literature on “Fixed-Mobile Substitution (FMS)” proposes that mobile and fixed
voice calls are increasingly seen as substitutable (although this may be less so in the case of
broadband or subscription levels).5, 6
This view suggests that there is a degree of similarity
and interchangeability between fixed and mobile services, which would imply convergence
of the income elasticity of demand for the products (at least for call usage).
The literature on “Fixed-Mobile Convergence (FMC)” also proposes an alternative view
whereby fixed and mobile network services are viewed as complementary products, to be
offered together (in bundles) on integrated and enhanced fixed and/or mobile networks. The
Body of European Regulators for Electronic Communications (BEREC)7 for example,
defined convergence as “the technological improvements by which a number of networks
arise with enhanced capabilities to provide multiple services”, but at the network level, it
defined convergence as “being able to offer a customer mobile and fixed (or fixed-like)
5 For a review of the literature on fixed vs mobile substitution, see e.g. Barth and Heimeshoff (2012), How large is the
Magnitude of Fixed – Mobile Call substitution? Empirical Evidence from 16 European Countries, accessed here:
http://www.dice.hhu.de/fileadmin/redaktion/Fakultaeten/Wirtschaftswissenschaftliche_Fakultaet/DICE/Discussion_Pap
er/049_Barth_Heimeshoff.pdf; and Bae, Choi and Hahn (2014), Fixed and mobile broadband: Are they substitutes or
complements? Accessed here: ftp://ftp.repec.org/opt/ReDIF/RePEc/yon/wpaper/2014rwp-68.pdf.
6 We review subscription trends in Figure 2.2 below, which shows that fixed line subscriptions have remained flat, while
mobile subscriptions have been increasing but at a diminishing rate.
7 http://berec.europa.eu/doc/berec/bor/bor11_54_FMS.pdf
Differences in Risk between Fixed and Mobile Telecoms Operators
NERA Economic Consulting 4
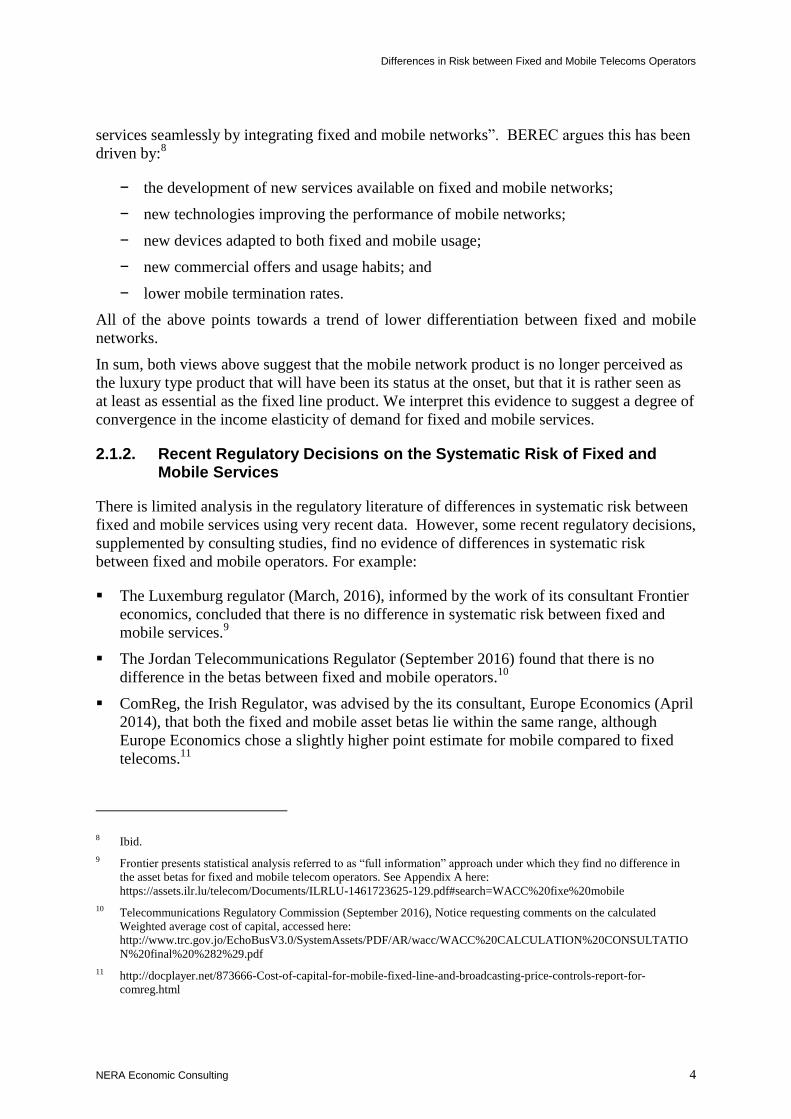
services seamlessly by integrating fixed and mobile networks”. BEREC argues this has been
driven by:8
− the development of new services available on fixed and mobile networks;
− new technologies improving the performance of mobile networks;
− new devices adapted to both fixed and mobile usage;
− new commercial offers and usage habits; and
− lower mobile termination rates.
All of the above points towards a trend of lower differentiation between fixed and mobile
networks.
In sum, both views above suggest that the mobile network product is no longer perceived as
the luxury type product that will have been its status at the onset, but that it is rather seen as
at least as essential as the fixed line product. We interpret this evidence to suggest a degree of
convergence in the income elasticity of demand for fixed and mobile services.
2.1.2. Recent Regulatory Decisions on the Systematic Risk of Fixed and Mobile Services
There is limited analysis in the regulatory literature of differences in systematic risk between
fixed and mobile services using very recent data. However, some recent regulatory decisions,
supplemented by consulting studies, find no evidence of differences in systematic risk
between fixed and mobile operators. For example:
The Luxemburg regulator (March, 2016), informed by the work of its consultant Frontier
economics, concluded that there is no difference in systematic risk between fixed and
mobile services.9
The Jordan Telecommunications Regulator (September 2016) found that there is no
difference in the betas between fixed and mobile operators.10
ComReg, the Irish Regulator, was advised by the its consultant, Europe Economics (April
2014), that both the fixed and mobile asset betas lie within the same range, although
Europe Economics chose a slightly higher point estimate for mobile compared to fixed
telecoms.11
8 Ibid.
9 Frontier presents statistical analysis referred to as “full information” approach under which they find no difference in
the asset betas for fixed and mobile telecom operators. See Appendix A here:
https://assets.ilr.lu/telecom/Documents/ILRLU-1461723625-129.pdf#search=WACC%20fixe%20mobile
10 Telecommunications Regulatory Commission (September 2016), Notice requesting comments on the calculated
Weighted average cost of capital, accessed here:
http://www.trc.gov.jo/EchoBusV3.0/SystemAssets/PDF/AR/wacc/WACC%20CALCULATION%20CONSULTATIO
N%20final%20%282%29.pdf
11 http://docplayer.net/873666-Cost-of-capital-for-mobile-fixed-line-and-broadcasting-price-controls-report-for-
comreg.html
Differences in Risk between Fixed and Mobile Telecoms Operators
NERA Economic Consulting 5
Moreover, the Body of European Regulators for Electronic Telecommunications (BEREC) in
recent years has been publishing “regulatory accounting in practice” reports which have
included averages of the asset betas used by European National Regulating Authorities
(NRAs). For example, in its 2013 Report12
, BEREC found that the average fixed telecoms
asset beta (market 4) was 0.57, whereas the average asset beta for mobile telecoms beta
(market 7) was 0.70. In its 2016 report13
, the average for fixed telecoms had remained at a
similar level, at 0.56, while the mobile telecoms asset beta average was substantively lower,
at 0.62. These averages imply that the gap between the asset betas of fixed and mobile
telecoms used in recent regulatory decisions has reduced.14
The evidence above suggests that the recent trend in regulatory precedent is to accept that the
market evidence supports a convergence in systematic risk between fixed and mobile network
operators.
2.2. Qualitative Evidence of the Relative Difference in Income Elasticity of Demand
In this section we assess the following qualitative factors which could suggest a reduced
income elasticity of demand, and reduced demand risk by implication, for mobile products,
possibly to a level similar to that of fixed line products:
Average price of mobile relative to fixed voice services;
Consumption of mobile vs. fixed telecoms services during market downturn;
The share of pre-pay vs. post-pay mobile contracts; and
The duration of post-pay mobile contracts.
2.2.1. Mobile service price has declined to similar (even lower) levels as fixed
As discussed above, the finance literature recognises that companies that produce more
discretionary (non-essential) goods or services will have higher elasticity of demand, and
therefore higher systematic risk than companies producing essential goods or services.
As we discussed above, mobile services may have been considered a luxury product when
they were first introduced to the market. As a developing technology with low penetration
rates, mobile services were also associated with price premia relative to fixed-line services.
However, the qualitative evidence on fixed and mobile charges suggests that this is no longer
the case.
12 See BEREC (September 2013), Regulatory Accounting in Practice 2013. Accessed here:
http://berec.europa.eu/eng/document_register/subject_matter/berec/reports/1451-draft-berec-report-on-the-regulatory-
accounting-in-practice-2013
13 See BEREC (October 2016), Regulatory Accounting in Practice 2016. Accessed here:
http://berec.europa.eu/eng/document_register/subject_matter/berec/reports/6479-berec-report-regulatory-accounting-in-
practice-2016
14 We note however that BEREC does not report individual decisions, and it is unclear over what period the decisions
included in these averages were made.
Differences in Risk between Fixed and Mobile Telecoms Operators
NERA Economic Consulting 6
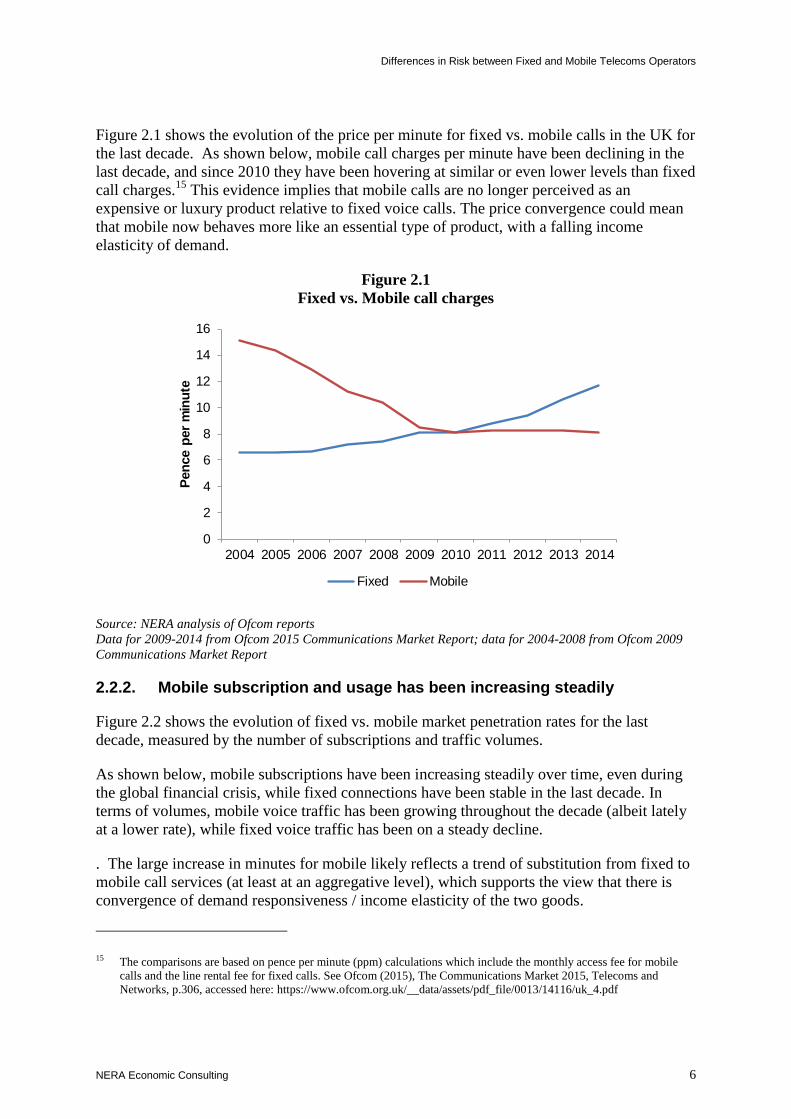
Figure 2.1 shows the evolution of the price per minute for fixed vs. mobile calls in the UK for
the last decade. As shown below, mobile call charges per minute have been declining in the
last decade, and since 2010 they have been hovering at similar or even lower levels than fixed
call charges.15
This evidence implies that mobile calls are no longer perceived as an
expensive or luxury product relative to fixed voice calls. The price convergence could mean
that mobile now behaves more like an essential type of product, with a falling income
elasticity of demand.
Figure 2.1
Fixed vs. Mobile call charges
Source: NERA analysis of Ofcom reports
Data for 2009-2014 from Ofcom 2015 Communications Market Report; data for 2004-2008 from Ofcom 2009
Communications Market Report
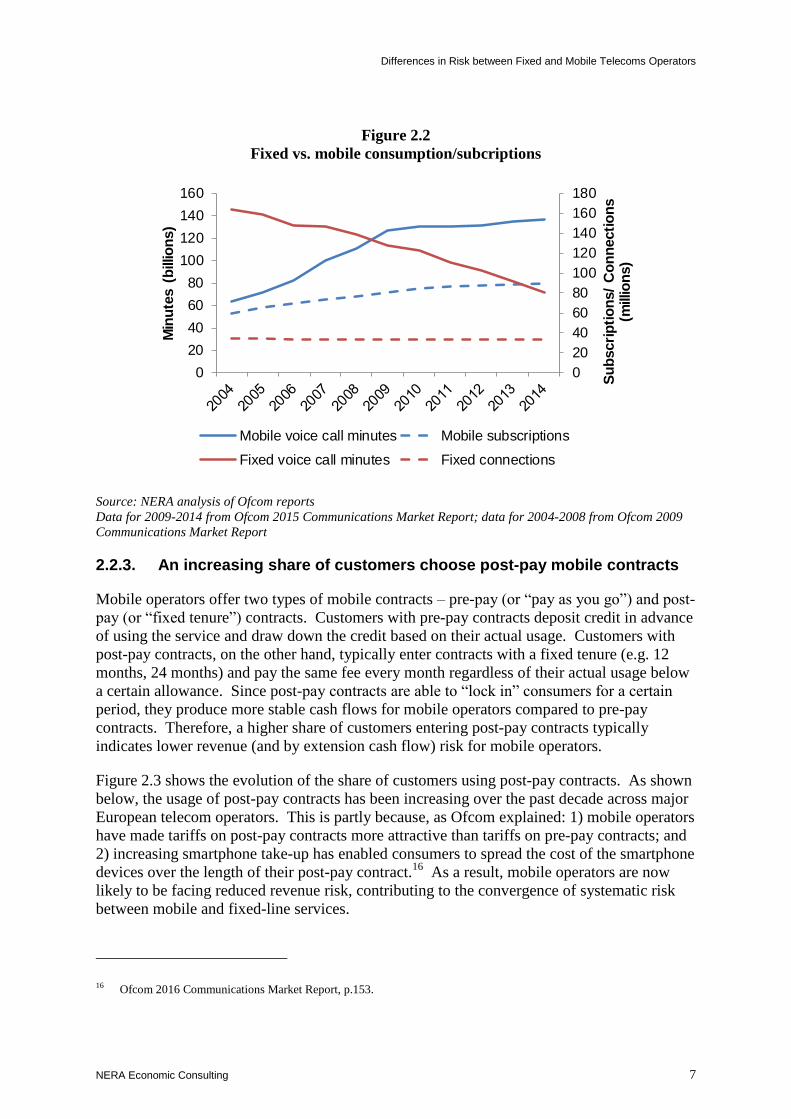
2.2.2. Mobile subscription and usage has been increasing steadily
Figure 2.2 shows the evolution of fixed vs. mobile market penetration rates for the last
decade, measured by the number of subscriptions and traffic volumes.
As shown below, mobile subscriptions have been increasing steadily over time, even during
the global financial crisis, while fixed connections have been stable in the last decade. In
terms of volumes, mobile voice traffic has been growing throughout the decade (albeit lately
at a lower rate), while fixed voice traffic has been on a steady decline.
. The large increase in minutes for mobile likely reflects a trend of substitution from fixed to
mobile call services (at least at an aggregative level), which supports the view that there is
convergence of demand responsiveness / income elasticity of the two goods.
15 The comparisons are based on pence per minute (ppm) calculations which include the monthly access fee for mobile
calls and the line rental fee for fixed calls. See Ofcom (2015), The Communications Market 2015, Telecoms and
Networks, p.306, accessed here: https://www.ofcom.org.uk/__data/assets/pdf_file/0013/14116/uk_4.pdf
0
2
4
6
8
10
12
14
16
2004 2005 2006 2007 2008 2009 2010 2011 2012 2013 2014
Pen
ce p
er
min
ute
Fixed Mobile
Differences in Risk between Fixed and Mobile Telecoms Operators
NERA Economic Consulting 7
Figure 2.2
Fixed vs. mobile consumption/subcriptions
Source: NERA analysis of Ofcom reports
Data for 2009-2014 from Ofcom 2015 Communications Market Report; data for 2004-2008 from Ofcom 2009
Communications Market Report
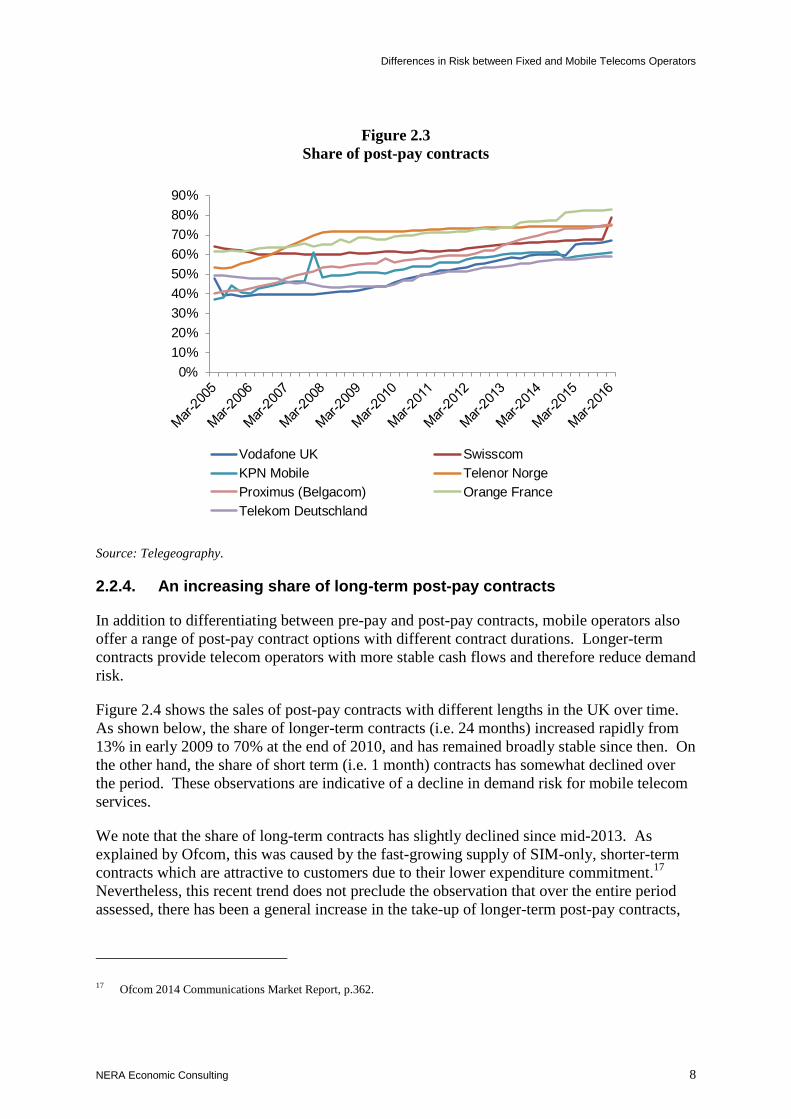
2.2.3. An increasing share of customers choose post-pay mobile contracts
Mobile operators offer two types of mobile contracts – pre-pay (or “pay as you go”) and post-
pay (or “fixed tenure”) contracts. Customers with pre-pay contracts deposit credit in advance
of using the service and draw down the credit based on their actual usage. Customers with
post-pay contracts, on the other hand, typically enter contracts with a fixed tenure (e.g. 12
months, 24 months) and pay the same fee every month regardless of their actual usage below
a certain allowance. Since post-pay contracts are able to “lock in” consumers for a certain
period, they produce more stable cash flows for mobile operators compared to pre-pay
contracts. Therefore, a higher share of customers entering post-pay contracts typically
indicates lower revenue (and by extension cash flow) risk for mobile operators.
Figure 2.3 shows the evolution of the share of customers using post-pay contracts. As shown
below, the usage of post-pay contracts has been increasing over the past decade across major
European telecom operators. This is partly because, as Ofcom explained: 1) mobile operators
have made tariffs on post-pay contracts more attractive than tariffs on pre-pay contracts; and
2) increasing smartphone take-up has enabled consumers to spread the cost of the smartphone
devices over the length of their post-pay contract.16
As a result, mobile operators are now
likely to be facing reduced revenue risk, contributing to the convergence of systematic risk
between mobile and fixed-line services.
16 Ofcom 2016 Communications Market Report, p.153.
0
20
40
60
80
100
120
140
160
180
0
20
40
60
80
100
120
140
160
Su
bscri
pti
on
s/
Co
nn
ecti
on
s
(millio
ns)
Min
ute
s (
billio
ns)
Mobile voice call minutes Mobile subscriptions
Fixed voice call minutes Fixed connections
Differences in Risk between Fixed and Mobile Telecoms Operators
NERA Economic Consulting 8
Figure 2.3
Share of post-pay contracts
Source: Telegeography.
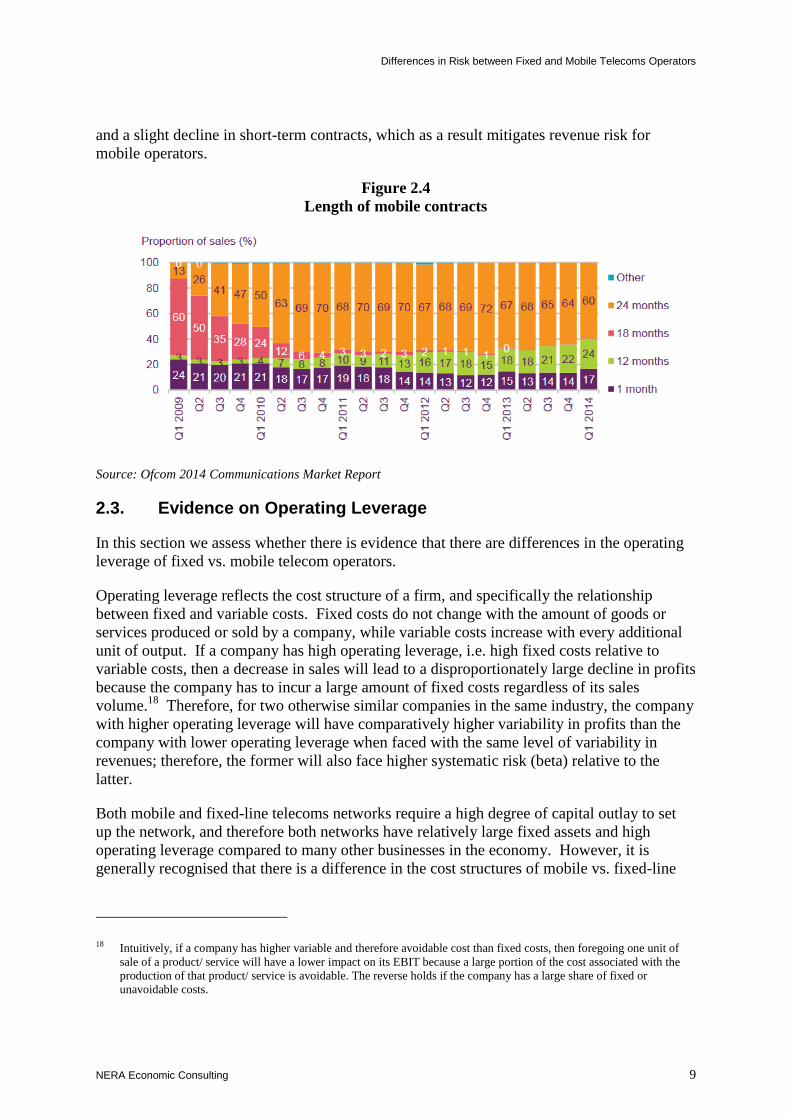
2.2.4. An increasing share of long-term post-pay contracts
In addition to differentiating between pre-pay and post-pay contracts, mobile operators also
offer a range of post-pay contract options with different contract durations. Longer-term
contracts provide telecom operators with more stable cash flows and therefore reduce demand
risk.
Figure 2.4 shows the sales of post-pay contracts with different lengths in the UK over time.
As shown below, the share of longer-term contracts (i.e. 24 months) increased rapidly from
13% in early 2009 to 70% at the end of 2010, and has remained broadly stable since then. On
the other hand, the share of short term (i.e. 1 month) contracts has somewhat declined over
the period. These observations are indicative of a decline in demand risk for mobile telecom
services.
We note that the share of long-term contracts has slightly declined since mid-2013. As
explained by Ofcom, this was caused by the fast-growing supply of SIM-only, shorter-term
contracts which are attractive to customers due to their lower expenditure commitment.17
Nevertheless, this recent trend does not preclude the observation that over the entire period
assessed, there has been a general increase in the take-up of longer-term post-pay contracts,
17 Ofcom 2014 Communications Market Report, p.362.
0%
10%
20%
30%
40%
50%
60%
70%
80%
90%
Vodafone UK Swisscom
KPN Mobile Telenor Norge
Proximus (Belgacom) Orange France
Telekom Deutschland
Differences in Risk between Fixed and Mobile Telecoms Operators
NERA Economic Consulting 9
and a slight decline in short-term contracts, which as a result mitigates revenue risk for
mobile operators.
Figure 2.4
Length of mobile contracts
Source: Ofcom 2014 Communications Market Report
2.3. Evidence on Operating Leverage
In this section we assess whether there is evidence that there are differences in the operating
leverage of fixed vs. mobile telecom operators.
Operating leverage reflects the cost structure of a firm, and specifically the relationship
between fixed and variable costs. Fixed costs do not change with the amount of goods or
services produced or sold by a company, while variable costs increase with every additional
unit of output. If a company has high operating leverage, i.e. high fixed costs relative to
variable costs, then a decrease in sales will lead to a disproportionately large decline in profits
because the company has to incur a large amount of fixed costs regardless of its sales
volume.18
Therefore, for two otherwise similar companies in the same industry, the company
with higher operating leverage will have comparatively higher variability in profits than the
company with lower operating leverage when faced with the same level of variability in
revenues; therefore, the former will also face higher systematic risk (beta) relative to the
latter.
Both mobile and fixed-line telecoms networks require a high degree of capital outlay to set
up the network, and therefore both networks have relatively large fixed assets and high
operating leverage compared to many other businesses in the economy. However, it is
generally recognised that there is a difference in the cost structures of mobile vs. fixed-line
18 Intuitively, if a company has higher variable and therefore avoidable cost than fixed costs, then foregoing one unit of
sale of a product/ service will have a lower impact on its EBIT because a large portion of the cost associated with the
production of that product/ service is avoidable. The reverse holds if the company has a large share of fixed or
unavoidable costs.
Differences in Risk between Fixed and Mobile Telecoms Operators
NERA Economic Consulting 10
networks, and studies find that fixed-line operators typically have a higher operating leverage
than mobile operators.19
The biggest difference between the cost structures of fixed and mobile networks is the
treatment of the access network.20
Fixed-line operators incur lump-sum upfront costs in
building ducts and laying cable, but once completed, the network does not require further
significant investments with increases in traffic. In contrast, mobile operators make initial
investments on building base stations and purchasing spectrum, the costs of which are
relatively lower; however, mobile operators then have to make ongoing investments to
upgrade their network to increase capacity as the traffic for voice, and particularly data,
increases. This would imply that mobile operators incur a comparatively larger proportion of
variable costs, and therefore have a lower operating leverage than fixed-line operators.
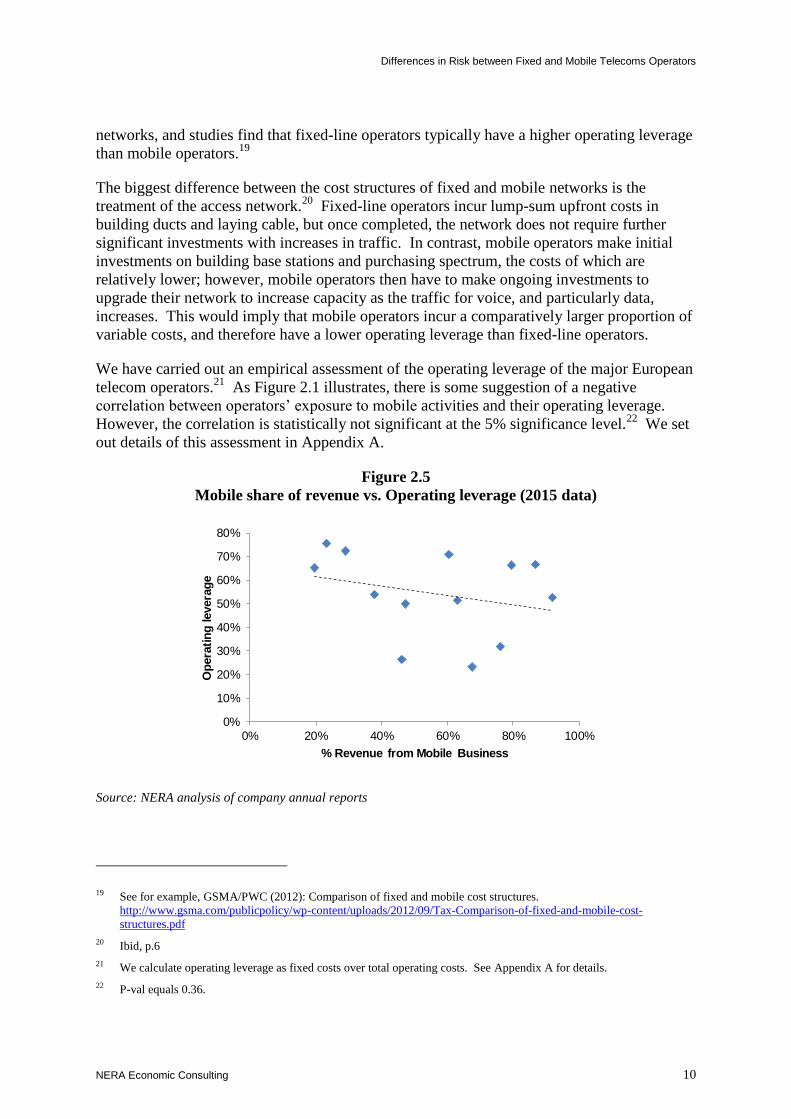
We have carried out an empirical assessment of the operating leverage of the major European
telecom operators.21
As Figure 2.1 illustrates, there is some suggestion of a negative
correlation between operators’ exposure to mobile activities and their operating leverage.
However, the correlation is statistically not significant at the 5% significance level.22
We set
out details of this assessment in Appendix A.
Figure 2.5
Mobile share of revenue vs. Operating leverage (2015 data)
Source: NERA analysis of company annual reports
19 See for example, GSMA/PWC (2012): Comparison of fixed and mobile cost structures.
http://www.gsma.com/publicpolicy/wp-content/uploads/2012/09/Tax-Comparison-of-fixed-and-mobile-cost-
structures.pdf
20 Ibid, p.6
21 We calculate operating leverage as fixed costs over total operating costs. See Appendix A for details.
22 P-val equals 0.36.
0%
10%
20%
30%
40%
50%
60%
70%
80%
0% 20% 40% 60% 80% 100%
Op
era
tin
g levera
ge
% Revenue from Mobile Business
Differences in Risk between Fixed and Mobile Telecoms Operators
NERA Economic Consulting 11
In conclusion, we consider that while there is some suggestion from the empirical data that
mobile operators have lower operating leverage than fixed operators, which would all else
equal, lead to a lower systematic risk for mobile operators, this finding is not statistically
significant.
2.4. Conclusions
In this section we discussed how the mass penetration of mobile services, coupled with
falling prices and technological advances in speed and quality of service, has led to a
changing landscape in the telecoms market, where fixed and mobile services may
increasingly experience similar demand characteristics – in particular, mobile appears to be
much less perceived as a premium product and is increasingly “essential” to many consumers.
We assessed the following indicators which could suggest a reduced income elasticity of
demand, and reduced demand risk by implication, for mobile products, possibly to a level
similar to that of fixed line products, including:
Mobile subscription and call prices have declined below the level of fixed voice services;
Mobile usage/subscription has been increasing steadily over the last decade even during
the global financial crisis;
An increasing share of customers use post-pay contracts where monthly payment is fixed
regardless of the macro conditions; and
An increasing share of customers chose longer-term mobile contracts, which again
reduces the income elasticity of demand for this product.
The analysis above suggests that there is evidence of convergence in income elasticity of
demand between fixed and mobile services, in particular for subscription.
On the other hand, we also found some evidence that mobile operators have lower operating
leverage than fixed operators, which would all else being equal, lead to a lower systematic
risk for mobile operators, although this finding is not statistically significant.
In the following sections, we empirically test whether there is evidence of convergence in
risk between fixed and mobile operators, as indicated by their asset betas.
Cross-sectional Analysis: Evidence of Differences in Asset Betas between Fixed and Mobile Network Operators
NERA Economic Consulting 12
3. Cross-sectional Analysis: Evidence of Differences in Asset Betas between Fixed and Mobile Network Operators
This section sets out our empirical assessment of the differences in asset betas between fixed
and mobile telecoms operators.
Direct evidence on the true asset betas of “pure-play” fixed and mobile network activities is
limited. Given the trend of market consolidation in the telecommunications sector, very few
(listed) telecoms operators engage in offering solely fixed or mobile services. In fact, most
telecoms groups are integrated, with a mixed portfolio of fixed and mobile services, and with
varying exposure to each.
Given the above, the analysis below focuses on assessing whether the cross-country variation
in asset betas of telecoms operators could be explained by their respective differences in
exposure to mobile demand risk.
3.1. Sample selection
For this analysis, we consider a sample of Western European telecoms network companies
which operate in similar geographies and under similar regulatory rules as in the UK. We use
the following, two-step filtering procedure to select relevant comparators and to ensure
robustness of the sample of data:
1) Initial Bloomberg screening: In this first step, we use the Bloomberg Equity Screening
function to create a longlist of 26 European telecom companies with the following
characteristics:
− Domiciled in Western Europe;
− Classified under the industry category of “Telecommunications”;23
and
− Revenue of latest calendar year is above 500 million Euros.24
2) Screening based on company profiles: In a second step, we review company information
in more detail and exclude 13 companies with the characteristics below, applied to ensure
relevance and robustness of the sample data:
− Companies that are listed on the US stock exchange;
− Companies with less than one year of trading history;
− Companies that operate as an MVNO;25
and
23 We consider three major industry classifications standards (BICS, GICS, ICB), and select companies which are
classified as “Telecommunications” under all standards.
24 We exclude smaller companies because, as evidenced by Ibbotson, Kaplan and Peterson (1997) they tend to suffer from
asynchronous trading, often resulting in their betas being too low. See Ibbotson, R.G., Kaplan, P.D. and Peterson, J.D.
(1997). Estimates of Small Stock Betas are Much Too Low, page 3.
Cross-sectional Analysis: Evidence of Differences in Asset Betas between Fixed and Mobile Network Operators
NERA Economic Consulting 13
− Companies for which information on the share of revenue coming from mobile
activities is not available or not reliable.
The filtering procedure above results in a sample of 13 European telecoms operators which
we use as comparators in our analysis below. The comparators are: Telenor, TeliaSonera,
Vodafone, Telefonica, Orange, Tele2, TDC, Telecom Italia, Swisscom, Telefonica
Deutschland, Elisa, Proximus (formerly Belgacom), and Orange Belgium (formerly
Mobistar).
3.2. Visual inspection and Cross-sectional Regression
As a first step in assessing whether exposure to mobile activities contributes to the cross-
sectional difference in asset betas across EU telecoms, we visually inspect the data on a
scatter plot, to examine whether there are observable systematic patterns in the data. In a
second step, we use statistical techniques to test whether any such relationship is statistically
significant.
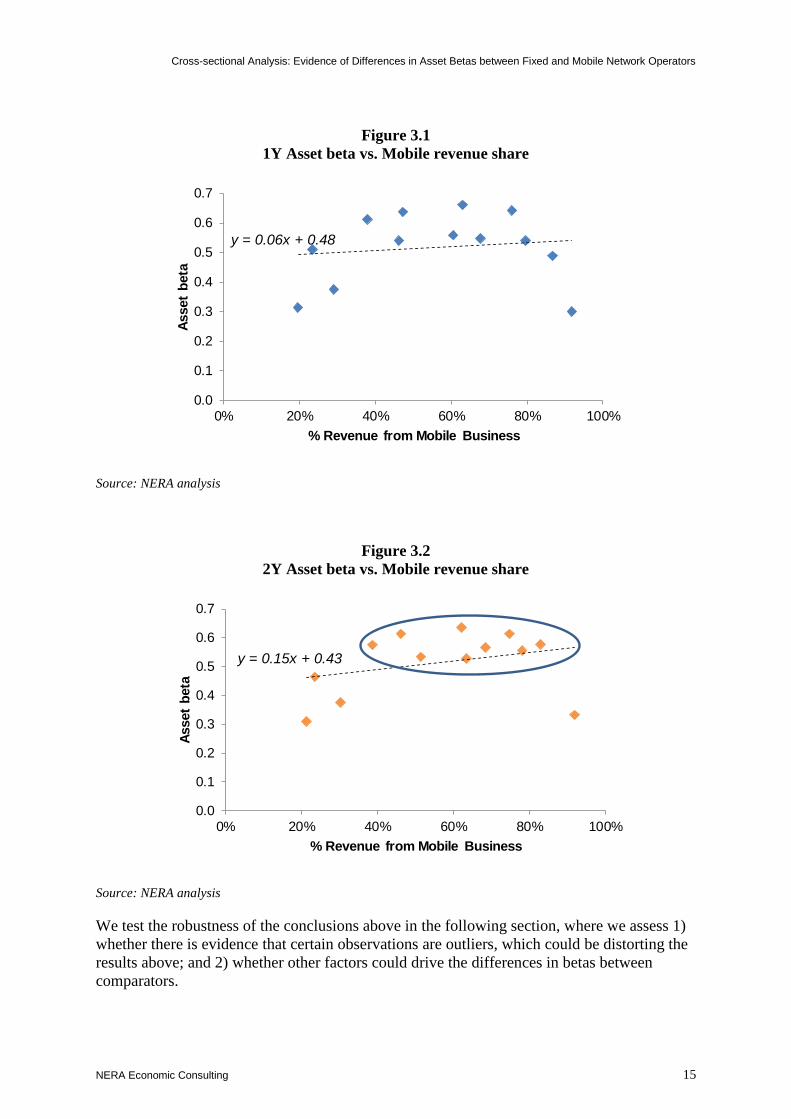
Figure 3.1 and Figure 3.2 show the scatter plots of the companies’ latest 1-year and 2-year
asset betas plotted against their respective revenue shares coming from mobile activities.26
If
mobile telecoms products and services were associated with greater cyclicality and
systematic risk than fixed telecoms products and services, then we would expect companies
with greater shares of revenues coming from mobile activities to also have higher asset betas,
and vice versa (i.e. a positive correlation), all else being equal.27
As shown below, the scatter plot of the 1-year asset betas against the respective mobile shares
displays no obvious pattern.
However, the scatter plot of the 2-year betas against the respective mobile shares seems to
suggest a positive correlation between the two variables, at a first glance. Upon closer
inspection however, we note that the majority of the asset betas are clustered around the
range 0.5-0.6 (circled in blue in Figure 3.2), even though the companies in this cluster have a
wide range of mobile shares of revenues (c. 30 to 80%).28
Thus, the seemingly positive
25 A mobile virtual network operator (MVNO) is a mobile communications service provider that does not own the
network infrastructure over which it operates. On these grounds we excluded e.g. Freenet, a company that provides
mobile telecom services using other operators’ network. We consider that Freenet’s risk profile is different from that of
conventional telecom operators because it does not own the network assets, a key feature of the telecom industry.
26 We have used daily data to estimate equity betas with a cut-off date of December 2015, for consistency with the mobile
revenue data which is available annually from the companies’ Annual Reports. We estimate betas against a regional,
FTSE All Europe Index, and use the Miller formula (βequity = βasset * (1 + D/E) to derive asset betas from equity betas,
assuming a debt beta of 0. 1Y asset betas estimated using December 2015 as a cut off are plotted against the latest
(2015) annual data on shares of revenues from mobile activities, whereas the 2Y asset betas are plotted against the
average share of revenues from mobile activities taken over the relevant 2Y period used to calculate the beta.
27 Note this initial assessment assumes that the entire variation in asset betas could be explained by the companies’
exposure to mobile services. We consider additional possible control variables in section 3.4 below.
28 For the purposes of this analysis, we calculate betas for all European telecoms operators against the FTSE All Europe
Index, thereby assuming that the marginal investor in these assets is diversified across Europe. We note that when
estimating asset betas for mobile operators in the UK, it may be more appropriate to use a local index (e.g. FTSE All
Share) which will have implications for the level of the beta estimate. For a discussion of how the choice of a market
Cross-sectional Analysis: Evidence of Differences in Asset Betas between Fixed and Mobile Network Operators
NERA Economic Consulting 14
correlation in the data appears to be driven by a few observations at the bottom left corner of
the chart.29
However, given that there are a number of companies outside of the main cluster
and scattered on both sides of the main cluster (i.e. with asset betas below 0.5 but
accompanied by both very high or very low mobile shares), we consider that the visual
inspection of the data is inconclusive and we revert to statistical tests of the relationship.
To statistically test whether the cross-sectional variation in asset betas of telecoms operators
can be explained by the differences in their exposure to mobile services, we fit Ordinary
Least Squares (OLS) regressions for both the 1-year and 2-year data samples. Both
regressions have positive slope coefficients, indicating that greater exposure to mobile
demand risk is associated with higher asset betas in this sample:
Asset beta1Y = 0.06 x Mobile share of revenue1Y + 0.48 Equation 1
Asset beta2Y = 0.15 x Mobile share of revenue2Y + 0.43 Equation 2
However, the slope coefficients are not statistically significant in either regression.30
This
means that based on this sample of data, we cannot reject the null hypothesis that mobile
shares do not systematically affect the asset betas of telecoms companies, and conclude that
there is not enough evidence to support the view that greater exposure to mobile demand risk
increases a company's asset beta. 31
We also note that the R-squared statistics of these
regressions are low, which indicates that the exposure to mobile activities alone explains only
a small portion of the cross-sectional variation in asset betas in the sample.32
index affects the beta, see NERA (2016), Update of the Equity Beta and Asset Beta for BT Group and Comparators,
section 3.4.
29 We test for evidence that these observations are outliers in section 3.3.
30 For the 1Y regression, p-val = 0.68; for the 2Y regression, p-val = 0.29.
31 Formally, the null hypothesis in this regression is that the coefficient on the mobile share of revenues is 0.
32 For the 1Y regression, R-squared = 0.02; for the 2Y regression, R-squared = 0.1.
Cross-sectional Analysis: Evidence of Differences in Asset Betas between Fixed and Mobile Network Operators
NERA Economic Consulting 15
Figure 3.1
1Y Asset beta vs. Mobile revenue share
Source: NERA analysis
Figure 3.2
2Y Asset beta vs. Mobile revenue share
Source: NERA analysis
We test the robustness of the conclusions above in the following section, where we assess 1)
whether there is evidence that certain observations are outliers, which could be distorting the
results above; and 2) whether other factors could drive the differences in betas between
comparators.
0.0
0.1
0.2
0.3
0.4
0.5
0.6
0.7
0% 20% 40% 60% 80% 100%
Asset
beta
% Revenue from Mobile Business
y = 0.06x + 0.48
0.0
0.1
0.2
0.3
0.4
0.5
0.6
0.7
0% 20% 40% 60% 80% 100%
Asset
beta
% Revenue from Mobile Business
y = 0.15x + 0.43
Cross-sectional Analysis: Evidence of Differences in Asset Betas between Fixed and Mobile Network Operators
NERA Economic Consulting 16
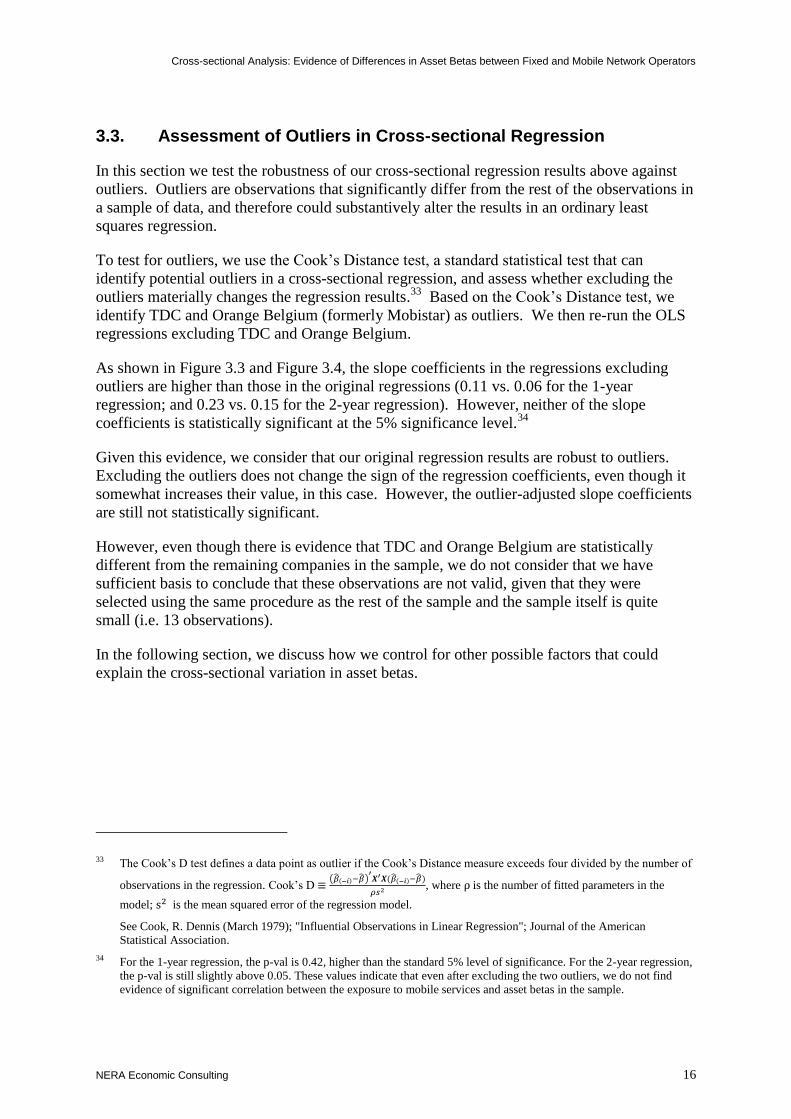
3.3. Assessment of Outliers in Cross-sectional Regression
In this section we test the robustness of our cross-sectional regression results above against
outliers. Outliers are observations that significantly differ from the rest of the observations in
a sample of data, and therefore could substantively alter the results in an ordinary least
squares regression.
To test for outliers, we use the Cook’s Distance test, a standard statistical test that can
identify potential outliers in a cross-sectional regression, and assess whether excluding the
outliers materially changes the regression results.33
Based on the Cook’s Distance test, we
identify TDC and Orange Belgium (formerly Mobistar) as outliers. We then re-run the OLS
regressions excluding TDC and Orange Belgium.
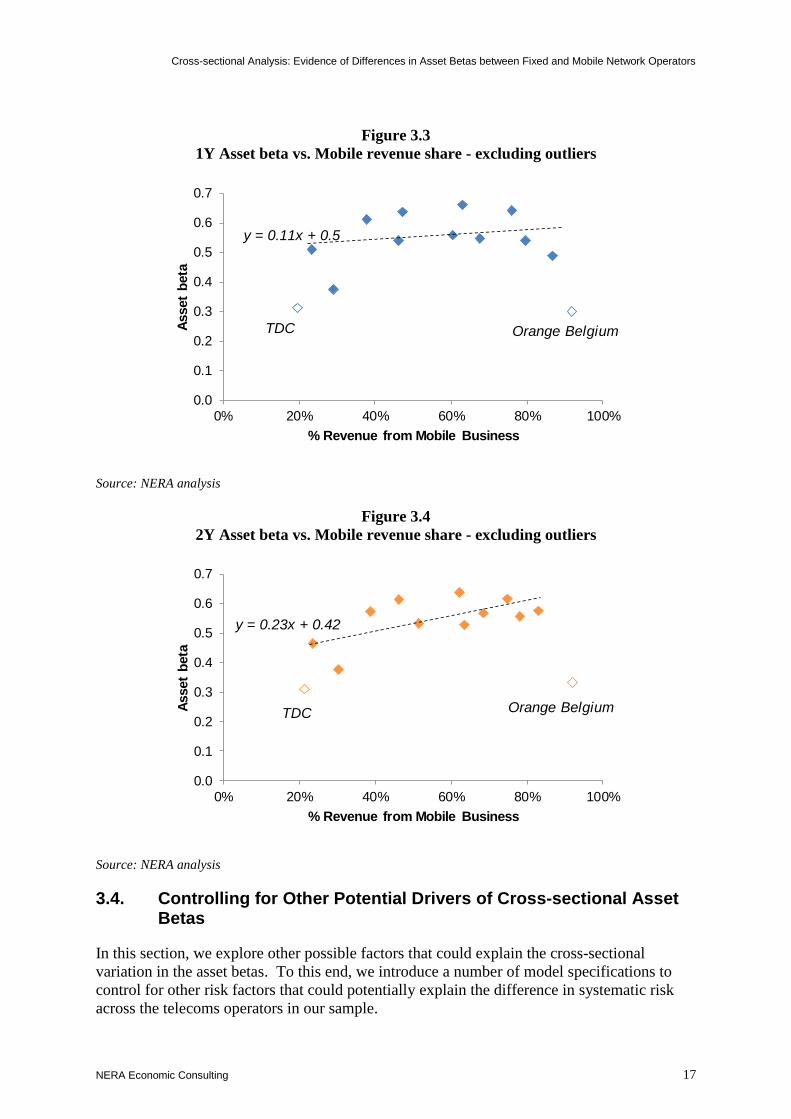
As shown in Figure 3.3 and Figure 3.4, the slope coefficients in the regressions excluding
outliers are higher than those in the original regressions (0.11 vs. 0.06 for the 1-year
regression; and 0.23 vs. 0.15 for the 2-year regression). However, neither of the slope
coefficients is statistically significant at the 5% significance level.34
Given this evidence, we consider that our original regression results are robust to outliers.
Excluding the outliers does not change the sign of the regression coefficients, even though it
somewhat increases their value, in this case. However, the outlier-adjusted slope coefficients
are still not statistically significant.
However, even though there is evidence that TDC and Orange Belgium are statistically
different from the remaining companies in the sample, we do not consider that we have
sufficient basis to conclude that these observations are not valid, given that they were
selected using the same procedure as the rest of the sample and the sample itself is quite
small (i.e. 13 observations).
In the following section, we discuss how we control for other possible factors that could
explain the cross-sectional variation in asset betas.
33 The Cook’s D test defines a data point as outlier if the Cook’s Distance measure exceeds four divided by the number of
observations in the regression. Cook’s D ≡(�̂�(−𝑖)−�̂�)
′𝑿′𝑿(�̂�(−𝑖)−�̂�)
𝜌𝑠2 , where ρ is the number of fitted parameters in the
model; s2 is the mean squared error of the regression model.
See Cook, R. Dennis (March 1979); "Influential Observations in Linear Regression"; Journal of the American
Statistical Association.
34 For the 1-year regression, the p-val is 0.42, higher than the standard 5% level of significance. For the 2-year regression,
the p-val is still slightly above 0.05. These values indicate that even after excluding the two outliers, we do not find
evidence of significant correlation between the exposure to mobile services and asset betas in the sample.
Cross-sectional Analysis: Evidence of Differences in Asset Betas between Fixed and Mobile Network Operators
NERA Economic Consulting 17
Figure 3.3
1Y Asset beta vs. Mobile revenue share - excluding outliers
Source: NERA analysis
Figure 3.4
2Y Asset beta vs. Mobile revenue share - excluding outliers
Source: NERA analysis
3.4. Controlling for Other Potential Drivers of Cross-sectional Asset Betas
In this section, we explore other possible factors that could explain the cross-sectional
variation in the asset betas. To this end, we introduce a number of model specifications to
control for other risk factors that could potentially explain the difference in systematic risk
across the telecoms operators in our sample.
0.0
0.1
0.2
0.3
0.4
0.5
0.6
0.7
0% 20% 40% 60% 80% 100%
Asset
beta
% Revenue from Mobile Business
y = 0.11x + 0.5
TDC Orange Belgium
0.0
0.1
0.2
0.3
0.4
0.5
0.6
0.7
0% 20% 40% 60% 80% 100%
Asset
beta
% Revenue from Mobile Business
y = 0.23x + 0.42
TDC Orange Belgium
Cross-sectional Analysis: Evidence of Differences in Asset Betas between Fixed and Mobile Network Operators
NERA Economic Consulting 18
A. Regress Asset beta on Mobile revenue share and Company size
In this model, we control for the potential impact of company size on the asset beta. The
rationale for controlling for company size is linked to evidence in the finance literature that
small companies could experience downward bias in the betas if they are thinly traded
(experience liquidity concerns) which leads to nonsynchronous prices, a situation in which
the firm’s share price does not react at the same time as the overall market upon release of
new information.35
Although the companies in our sample are major European telecom
operators for which liquidity is unlikely to be a significant issue, we nevertheless introduce
this model specification to control for any potential impact, if such is found to exist.
We control for company size by introducing the additional explanatory variable of market
capitalisation.36
Therefore, the model specification becomes:
Asset beta =
0.40 + 0.14 x Mobile Share of Revenue + 0.001 x Market Cap Equation 3
As shown in Equation 3 above, the regression coefficient on mobile share is still positive and
not statistically significant37
at the standard 5% significance level, even when company size is
controlled for. Separately, the regression coefficient on company size is positive, indicating
that all else being equal, smaller telecom companies would have lower betas, as predicted by
financial theory; however, the coefficient is not statistically significant at the standard 5%
significance level.38
B. Asset beta against mobile revenue share and country credit rating
In this model we control for the potential impact of country risk on beta.
The financial literature generally accepts that country risk, broadly defined as the additional
(and unique) economic, political and legal risk associated with investing in individual
countries, in practice cannot be fully diversified, given the extent of home bias that remains
in investor portfolios.39, 40
However, the literature does not offer consensus on how country
risk ought to be priced into the CAPM framework. Some authors propose adjustments to the
“Risk-Free Rate” or to the “Equity Risk Premium”.41
Others have considered extended beta
35 See for example, Ibbotson, R.G., Kaplan, P.D. and Peterson, J.D., 1997. Estimates of Small Stock Betas Are Much Too
Low. The journal of portfolio management, 23(4), pp.104-111.
36 Data on market capitalization downloaded from Bloomberg.
37 p-val = 0.31.
38 p-val = 0.38.
39 For a comprehensive overview of the definition and delineation of what is encompassed under country risk, see Glova
(2014), accessed at: http://ac.els-cdn.com/S2212567114004535/1-s2.0-S2212567114004535-main.pdf?_tid=54e137aa-
7779-11e6-b677-00000aab0f02&acdnat=1473527548_7a3e52ab4f4d7b205a61c6444f7eaaef
40 See Damodaran (2016) Equity Risk Premiums (ERP): Determinants, Estimation and Implications – The 2016 Edition,
p55.
41 See for example Damodaran (2016).
Cross-sectional Analysis: Evidence of Differences in Asset Betas between Fixed and Mobile Network Operators
NERA Economic Consulting 19
market models built on the CAPM framework, which estimate time-varying betas based on a
number of country-specific economic and financial variables. Various authors have used the
framework to show the relationship between country-specific risk factors and systematic
risk.42
To control for country risk we introduce an additional variable of sovereign credit rating, as
per the following equation:
Asset beta =
0.46 + 0.14 x Mobile Share of Revenue - 0.01 x Credit Rating43
Equation 4
As shown in Equation 4, the regression coefficient on the mobile share variable is still
positive, and is not statistically significant at the standard 5% significance level, even when
country risk is controlled for.44
Separately, the regression coefficient on country rating is
negative, implying that all else being equal, companies with lower credit ratings tend to have
lower betas. The result is counterintuitive, but has been previously observed in other studies,
e.g. in Harvey (2004), who argued that the observation is largely due to the fact that a number
of companies in emerging markets have low betas with respect to a more diversified market
index, e.g. when regressed against the world market portfolio.45
In any case, this coefficient
on credit rating is not statistically significant at the standard 5% significance level.46
3.5. Conclusions
In this section, we fit a number of cross-sectional regression models that aim to explain the
cross-sectional variation in observed asset betas in our sample of 13 EU telecoms companies,
based on the companies’ exposure to mobile activities, as well as other factors including size
and country risk. All of the models tested above indicate that there is no evidence of a
statistically significant relationship between asset betas and exposure to mobile activity.
42 For an overview, see Glova (2014), full ref in fn 41.
43 Credit rating was mapped to numerical values, where the highest credit rating of Aaa was associated with a numerical
value of 1, and every subsequent 1-notch decrease in the credit rating corresponded to an increase of 1 in the numerical
value assigned to that credit rating.
44 P-val = 0.35.
45 See Harvey, C.R., 2004. Country risk components, the cost of capital, and returns in emerging markets. Available at
SSRN 620710.
46 P-val = 0.46.
Time-series Analysis: Evidence of Changes in Asset Betas in Light of Changes in Mobile Activity Exposure
NERA Economic Consulting 20
4. Time-series Analysis: Evidence of Changes in Asset Betas in Light of Changes in Mobile Activity Exposure
In this section, we examine the time series data for the telecoms operators for which a
sufficiently long history of data is available, to explore whether there is evidence that changes
in the share of revenue coming from mobile activity were associated with accompanying
changes in the companies’ respective asset betas.
4.1. Sample selection
As a first step, we identify companies whose mobile revenue shares changed significantly at
some point over the last ten year period. In this context, we define that a significant change in
mobile exposure has occurred if (1) the company has experienced a change in their mobile
revenue share equal to or greater than 10%, between any adjacent years within the period
2005-2015, and (2) this change was not associated with a change in the company’s
accounting procedure.
We identified four companies on that basis (see Table 4.1), most of which experienced such
large changes in mobile activity exposure due to mergers, acquisitions and / or asset
disposals:
Table 4.1
Material Changes in Comparators’ Mobile Revenue Share
Company Year Change in mobile share
Telenor 2006 +10%
Tele2 2007 +20%
Telefonica 2006 +13%
Vodafone 2008, 2013 -10%
Source: NERA analysis of Bloomberg and company annual reports
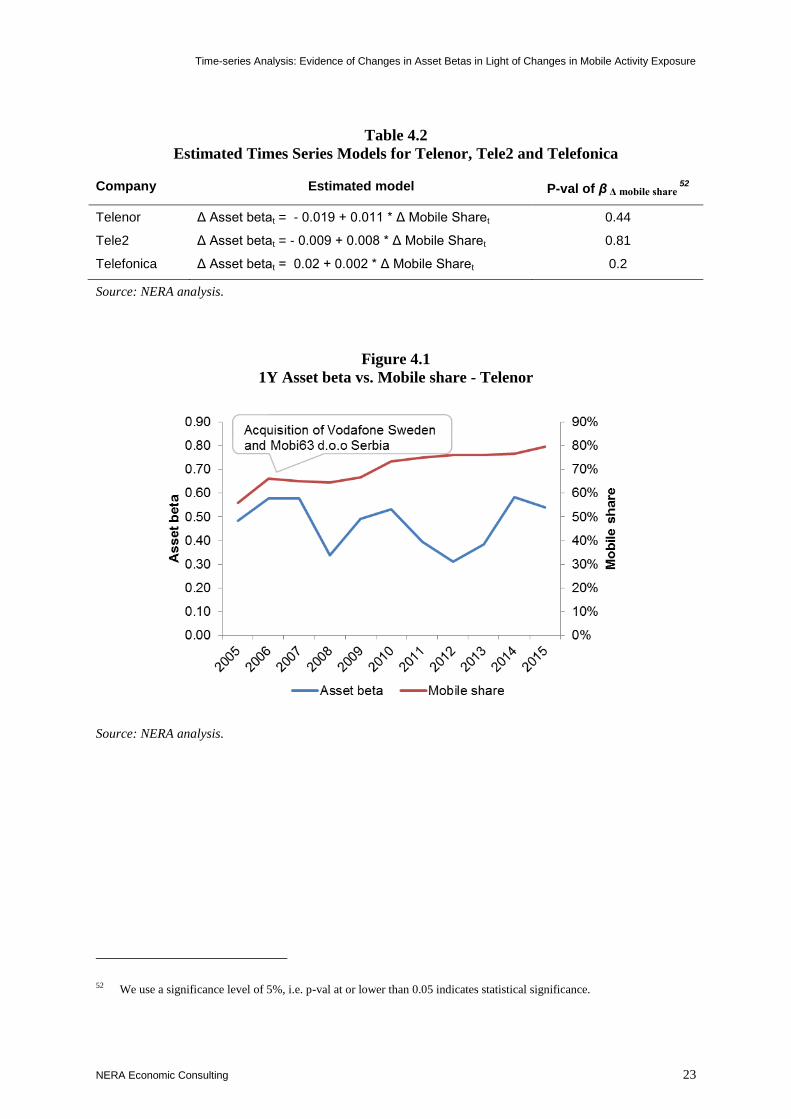
Telenor’s mobile revenue share increased in 2006 due to the acquisition of Vodafone
Sweden and Mobi63 d.o.o Serbia;47
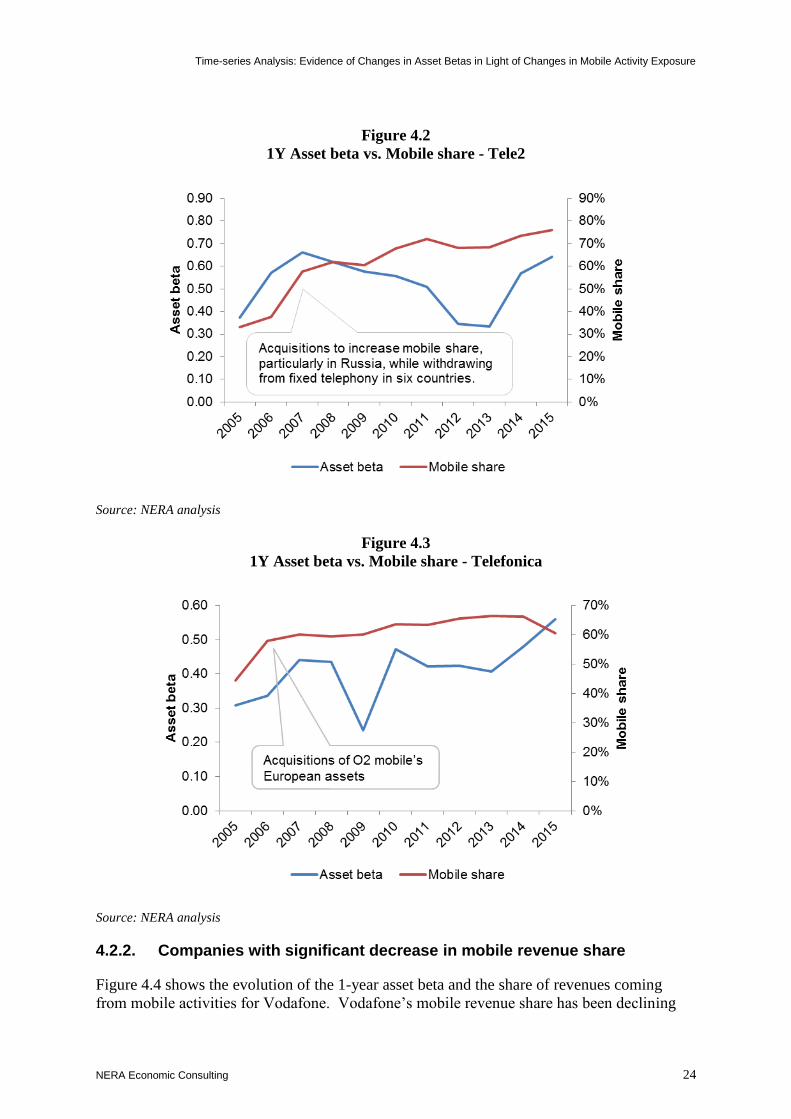
Tele2’s mobile revenue share increased in 2007 due to its acquisitions of mobile
businesses particularly in Russia, accompanied by divestments of fixed-line assets;48
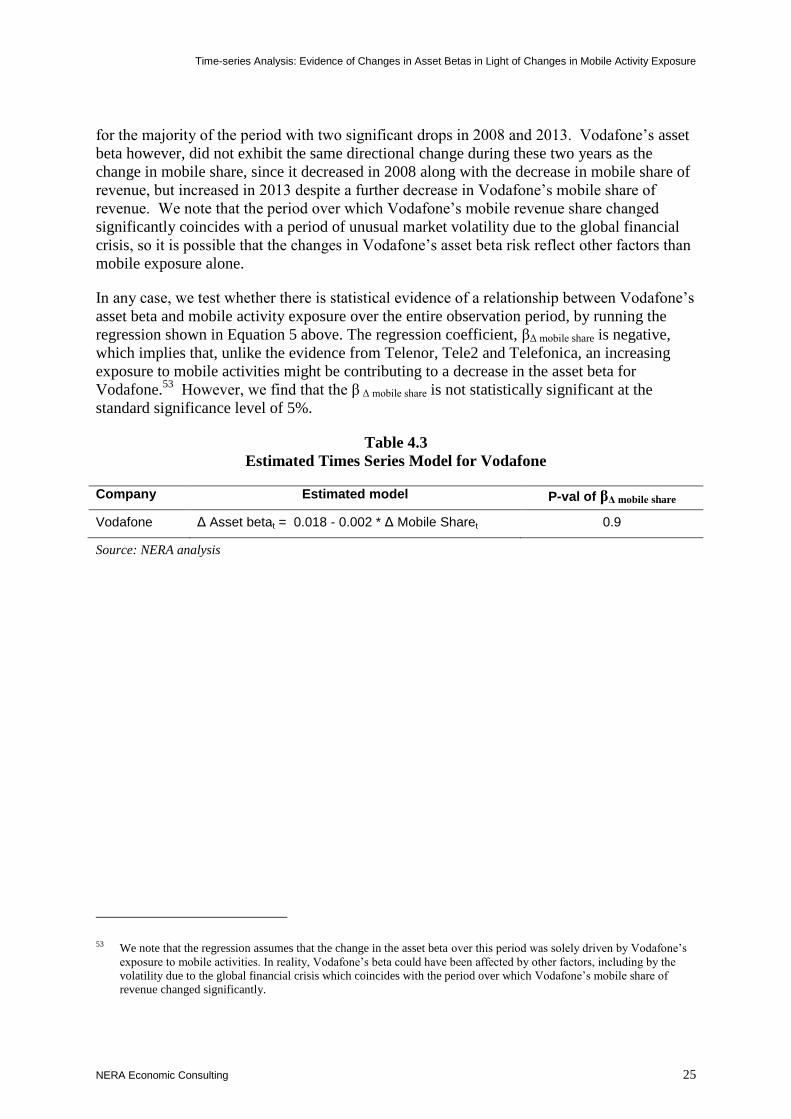
Telefonica’s mobile revenue share increased in 2006 due to the acquisition of O2
Mobile’s European assets;49
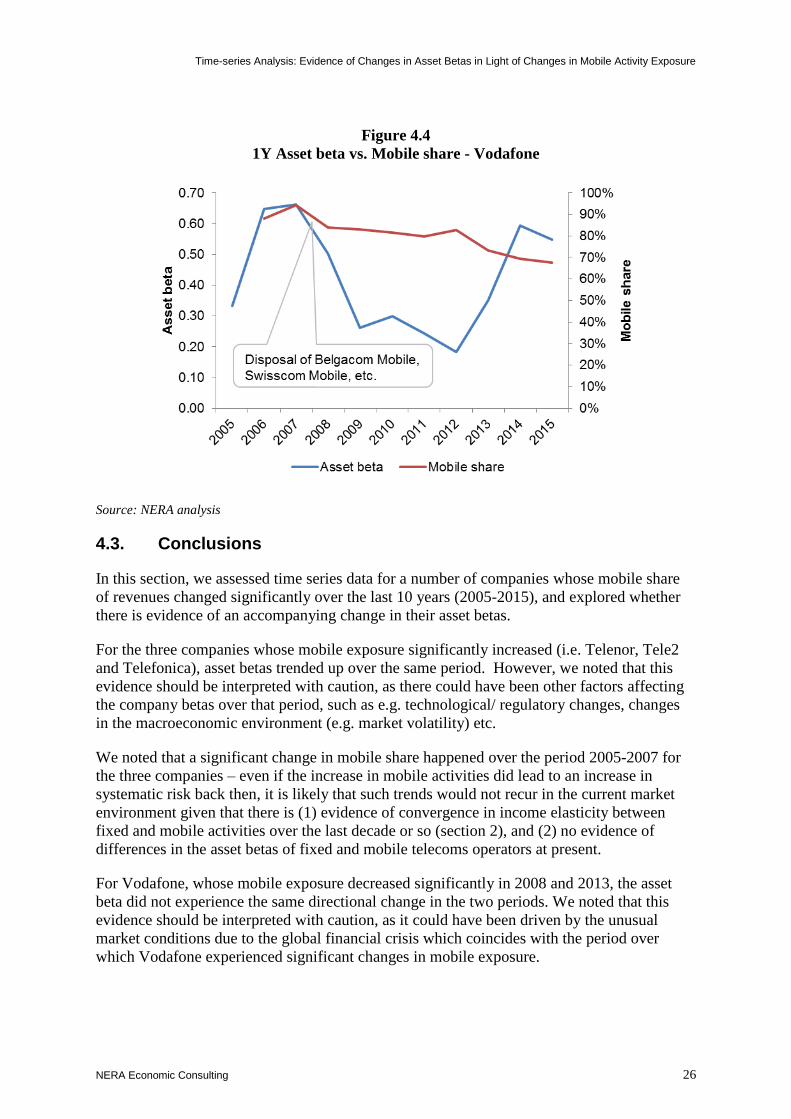
Vodafone’s mobile revenue share decreased significantly in 2008 and 2013 due to the
disposal of its mobile interest in Belgacom Mobile and Swisscom Mobile, in 2008; and
47 See Telenor 2006 Annual report, p.21.
48 See Tele2 2007 Annual report, p.41.
49 See Telefonica 2006 Annual report, p.31.
Time-series Analysis: Evidence of Changes in Asset Betas in Light of Changes in Mobile Activity Exposure
NERA Economic Consulting 21
the expansion into fixed-line business services, including the acquisition of Ghana
Telecoms in 2008 and Verizon Wireless and Kabel Deutschland in 2013.50
In the following sections, we assess the evolution of the 1-year asset beta for the four
companies above and explore whether there is evidence that the changes in their mobile
activity exposure throughout the period were accompanied by significant changes in their
asset betas over the period. We choose 1-year estimates of the beta for consistency with the
annual reports data on revenue breakdown and note that a 1-year period should be
sufficiently long to ensure that the change in revenue share will be reflected in the asset beta
estimates.
50 See Vodafone 2009 Annual report, p.112; Vodafone 2014 Annual report, p. 159.
Time-series Analysis: Evidence of Changes in Asset Betas in Light of Changes in Mobile Activity Exposure
NERA Economic Consulting 22
4.2. Discussion of Time Series Observations
4.2.1. Companies with significant increase in mobile revenue share
Figure 4.1- Figure 4.3 show the evolution of the 1-year asset betas and mobile revenue shares
for Telenor, Tele2 and Telefonica respectively.
As identified in Table 4.1 above, the mobile revenue shares for the three companies increased
between 2005 and 2007, a period over which the asset betas of these companies also
increased. This could be construed as evidence that the increased exposure of these
companies to mobile activities led to a higher perceived systematic risk in the early part of
the period.
However, the evidence above should be interpreted with caution, as it hinges on the
assumption that the exposure to mobile activities is the primary or sole factor that affected the
company’s systematic risk at the time. In reality, there could be other factors that may have
led to a change in the asset beta of these telecoms companies over the period, including e.g.
changes in the regulatory regime or the general macroeconomic environment in which the
assets operate.
In any case, even if the change in mobile exposure could be interpreted as contributing to a
perceived increase in systematic risk for these companies, it is unlikely that a rebalancing
towards mobile products and services and away from fixed line services would lead to
increased perceived systematic risk by investors today, given that there is (1) evidence of the
likely convergence in income elasticity between fixed and mobile activities over the last
decade or so as discussed in section 2 above, and (2) no evidence of differences in the asset
betas of fixed and mobile telecoms at present, based on the latest (2015) cross-sectional
analysis, as discussed in section 3 above.
We have nevertheless statistically tested whether a greater exposure to mobile activities could
explain the evolution of the asset betas of each company. Specifically, for each company, we
fitted the model in Equation 5, where we regress the change in the asset beta of each
company on the change in the company’s mobile share of revenue, using data over the period
2005-2015.51
The regression coefficient, βΔ mobile share, indicates the size and the direction of
the change in the asset beta when the mobile share of revenue increases by one per cent. As
shown in Table 4.2, although βΔ mobile share is positive for all three companies, none of the
slope coefficients are statistically significant at the standard 5% significance level. Therefore,
based on this sample, we find no evidence that the increase in exposure to mobile business
had systematically contributed to the change in asset beta over time, for any of the companies
in our sample.
Δasset betat = α + βΔ mobile share * ΔMobile Sharet Equation 5
51 We note that this regression assumes that a company’s exposure to mobile activities is the sole factor that affects its
systematic risk. As we discuss in section 4.2.1 above, there could be other factors affecting systematic risk of the
telecoms sector including, e.g. changes in the regulatory regime, change in the general macroeconomic environment etc.,
which this regression assumes have remained broadly stable over the period.
Time-series Analysis: Evidence of Changes in Asset Betas in Light of Changes in Mobile Activity Exposure
NERA Economic Consulting 23
Table 4.2
Estimated Times Series Models for Telenor, Tele2 and Telefonica
Company Estimated model P-val of β Δ mobile share 52
Telenor Δ Asset betat = - 0.019 + 0.011 * Δ Mobile Sharet 0.44
Tele2 Δ Asset betat = - 0.009 + 0.008 * Δ Mobile Sharet 0.81
Telefonica Δ Asset betat = 0.02 + 0.002 * Δ Mobile Sharet 0.2
Source: NERA analysis.
Figure 4.1
1Y Asset beta vs. Mobile share - Telenor
Source: NERA analysis.
52 We use a significance level of 5%, i.e. p-val at or lower than 0.05 indicates statistical significance.
Time-series Analysis: Evidence of Changes in Asset Betas in Light of Changes in Mobile Activity Exposure
NERA Economic Consulting 24
Figure 4.2
1Y Asset beta vs. Mobile share - Tele2
Source: NERA analysis
Figure 4.3
1Y Asset beta vs. Mobile share - Telefonica
Source: NERA analysis
4.2.2. Companies with significant decrease in mobile revenue share
Figure 4.4 shows the evolution of the 1-year asset beta and the share of revenues coming
from mobile activities for Vodafone. Vodafone’s mobile revenue share has been declining
Time-series Analysis: Evidence of Changes in Asset Betas in Light of Changes in Mobile Activity Exposure
NERA Economic Consulting 25
for the majority of the period with two significant drops in 2008 and 2013. Vodafone’s asset
beta however, did not exhibit the same directional change during these two years as the
change in mobile share, since it decreased in 2008 along with the decrease in mobile share of
revenue, but increased in 2013 despite a further decrease in Vodafone’s mobile share of
revenue. We note that the period over which Vodafone’s mobile revenue share changed
significantly coincides with a period of unusual market volatility due to the global financial
crisis, so it is possible that the changes in Vodafone’s asset beta risk reflect other factors than
mobile exposure alone.
In any case, we test whether there is statistical evidence of a relationship between Vodafone’s
asset beta and mobile activity exposure over the entire observation period, by running the
regression shown in Equation 5 above. The regression coefficient, βΔ mobile share is negative,
which implies that, unlike the evidence from Telenor, Tele2 and Telefonica, an increasing
exposure to mobile activities might be contributing to a decrease in the asset beta for
Vodafone.53
However, we find that the β Δ mobile share is not statistically significant at the
standard significance level of 5%.
Table 4.3
Estimated Times Series Model for Vodafone
Company Estimated model P-val of βΔ mobile share
Vodafone Δ Asset betat = 0.018 - 0.002 * Δ Mobile Sharet 0.9
Source: NERA analysis
53 We note that the regression assumes that the change in the asset beta over this period was solely driven by Vodafone’s
exposure to mobile activities. In reality, Vodafone’s beta could have been affected by other factors, including by the
volatility due to the global financial crisis which coincides with the period over which Vodafone’s mobile share of
revenue changed significantly.
Time-series Analysis: Evidence of Changes in Asset Betas in Light of Changes in Mobile Activity Exposure
NERA Economic Consulting 26
Figure 4.4
1Y Asset beta vs. Mobile share - Vodafone
Source: NERA analysis
4.3. Conclusions
In this section, we assessed time series data for a number of companies whose mobile share
of revenues changed significantly over the last 10 years (2005-2015), and explored whether
there is evidence of an accompanying change in their asset betas.
For the three companies whose mobile exposure significantly increased (i.e. Telenor, Tele2
and Telefonica), asset betas trended up over the same period. However, we noted that this
evidence should be interpreted with caution, as there could have been other factors affecting
the company betas over that period, such as e.g. technological/ regulatory changes, changes
in the macroeconomic environment (e.g. market volatility) etc.
We noted that a significant change in mobile share happened over the period 2005-2007 for
the three companies – even if the increase in mobile activities did lead to an increase in
systematic risk back then, it is likely that such trends would not recur in the current market
environment given that there is (1) evidence of convergence in income elasticity between
fixed and mobile activities over the last decade or so (section 2), and (2) no evidence of
differences in the asset betas of fixed and mobile telecoms operators at present.
For Vodafone, whose mobile exposure decreased significantly in 2008 and 2013, the asset
beta did not experience the same directional change in the two periods. We noted that this
evidence should be interpreted with caution, as it could have been driven by the unusual
market conditions due to the global financial crisis which coincides with the period over
which Vodafone experienced significant changes in mobile exposure.

Time-series Analysis: Evidence of Changes in Asset Betas in Light of Changes in Mobile Activity Exposure
NERA Economic Consulting 27
We also found that the relationship between the changes in asset betas and the changes in
mobile revenue shares were not statistically significant for any of the companies assessed in
this section.
In light of the above, we do not consider that there is sufficient evidence from the time series
data to conclude that greater exposure to mobile products and services supports a higher asset
beta.
Conclusions
NERA Economic Consulting 28
5. Conclusions
This report investigates the latest evidence on differences in systematic risk between fixed
and mobile telecoms operators.
The work was undertaken in the context of Ofcom’s upcoming WLA consultation. Following
BT’s acquisition of EE, the mobile operator, Ofcom will need to decide which of the
disaggregation categories of systematic risk – “Openreach copper”, “Other UK Telecoms”,
and “Rest of BT” – should include the newly added mobile activity.
To understand the differences in systematic risk between fixed and mobile operators, we
assessed the following qualitative and quantitative indicators:
A key determinant of systematic risk of a company is the income elasticity of demand of
its product. In section 2, we showed that a number of qualitative indicators suggest
convergence in income elasticity of demand for fixed and mobile services over the last
decade. These included: a decline in the price of mobile services; an increase in mobile
subscription and usage even during the global financial crisis; an increase in the share of
customers who chose post-pay (fixed price) mobile contracts; and an increase in the share
of customers who generally choose contracts with longer duration.
In Section 3, we empirically assessed the difference in asset betas of fixed and mobile
operators, and showed that the cross-sectional variation of betas in 2015 of a sample of 13
European telecoms operators cannot be explained by the companies’ exposure to mobile
activities. This is the case even when we control for size and country risk proxied by
credit rating.
Finally, in Section 4 we also found that there was no evidence of a statistically significant
relationship between the changes in asset betas and the changes in mobile revenue shares
for a sample of telecoms operators that experienced significant changes in their mobile
revenue shares, notwithstanding all the caveats with the analysis.
In summary, at present, we do not find evidence of differences in the systematic risk between
fixed and mobile telecoms operators. On this basis, we consider that the asset beta associated
with BT’s mobile operations is likely to be similar to that of its ‘other UK telecoms’
operations.
Assessment of Operating Leverage for Telecom network operators
NERA Economic Consulting 29
Appendix A. Assessment of Operating Leverage for Telecom network operators
In this appendix we set out the details of the assessment of the operating leverage for telecom
network operators. We have used the same sample of European telecoms as selected in
section 3.
Operating leverage is typically defined as fixed costs over variable costs. However as
acknowledged by many practitioners, it is difficult to find direct evidence on companies’
fixed and variable costs as they are usually aggregated in income statements.54
For our
analysis, we have estimated the operating leverage based on Equation 6 below, which is a
standard measure for operating leverage based on accounting costs55
:
Operating leverage = Fixed costs
Total Operating Costs Equation 6
Where:
- Fixed costs is defined as the Total Operating Costs on the company's Income
Statement, less Direct Costs (“Cost of Goods Sold” + “other direct costs”), which we
consider as proxies for variable costs.
- Operating costs is defined as the difference between revenue and operating income
(i.e. EBIT) from companies’ income statement.
Alternative measures for operating leverage include, for example, fixed assets over total
assets, depreciation over total assets, etc.56
54 For example, see Damodaran, Estimating Risk Parameters
http://people.stern.nyu.edu/adamodar/pdfiles/papers/beta.pdf
55 See for example, Lord, R.A., 1995. Interpreting and measuring operating leverage. Issues in Accounting Education,
10(2), p.317.
56 See for example, O'Brien, T.J. and Vanderheiden, P.A., 1987. Empirical measurement of operating leverage for
growing firms. Financial Management, pp.45-53.

NERA UK Limited, registered in England and Wales, No 3974527 Registered Office: Marble Arch House, 66 Seymour Street, London W1H 5BT
NERA Economic Consulting
Marble Arch House, 66 Seymour Street
London W1H 5BT
United Kingdom
Tel: 44 20 7659 8500 Fax: 44 20 7659 8501
www.nera.com
Recommended