134
Papers from the Lancaster University Postgraduate Conference in Linguistics & Language Teaching 2010
Differences in Perceived Fluency and Utterance
Fluency across Speech Elicitation Tasks: A Pilot
Study
Yvonne Préfontaine
Lancaster University, Lancaster
Abstract
This pilot study focuses on whether analysis of perceived fluency and
utterance fluency inform and provide support for the workability of three
speech elicitation tasks designed to assess second language fluency. Nine
intermediate-level French students aged 26 to 68 were asked to respond to
three different speaking tasks. Temporal variables of utterance fluency
were extracted using PRAAT speech analysis software and examined
against holistic ratings of perceived fluency. Utterance fluency was
operationalized as speech rate, phonation-time ratio and mean length of
runs. Linguistic analysis featured quantitative and qualitative comparisons
of ordinal and interval data. The results of this small-scale pilot study
indicate that task difficulty impacts speech perception in terms of intra-
rater reliability, and speech production with regard to pausing, speaking
duration, and number of syllables produced. The findings also provide
preliminary evidence indicating a link between PRAAT temporal fluency
measurements and rater interpretation of holistic descriptors. Extracting
temporal variables automatically and comparing them to holistic ratings
across tasks elucidates the intricacy of the dynamics between perceived
fluency and utterance fluency. For fluency assessment, it also underscores
the importance of exploring perceived fluency and utterance fluency
together rather than in isolation.
135
Papers from the Lancaster University Postgraduate Conference in Linguistics & Language Teaching 2010
1. Introduction
Designing meaningful speech elicitation tasks that engage, elicit and enable second language
(L2) learners to access and retrieve all the language in their repertoire is challenging. If the
focus of using tasks is to inform L2 speech performance for fluency assessment purposes,
then issues of task design must play a prominent role in the language test development
process.
This paper begins with justifications for more research in task design for fluency assessment
and reviews some of the existing research in L2 fluency. It is then followed by the
methodology of a pilot research study and the conceptualization of tasks designed to trigger
L2 speech production. The data analyses and results are presented with the two methods of
investigation, namely holistic rating scores on the basis of established fluency criteria and
measuring temporal variables of fluency using the PRAAT (Boersma & Weenink, 2010)
speech analysis software program. Finally, the contributions of the present research within
the context of the pilot study are discussed.
Over the last two decades, empirical research has focused on pedagogical speech elicitation
tasks as a major strand in second language acquisition research (e.g. Bygate & Samuda, 2005;
Bygate, Skehan, & Swain, 2001; Ellis, 2001; Skehan & Foster, 1997). Research on the impact
of speech tasks on L2 language use, processing and development has led to issues of task
design.
Spoken task types can leave learners at a disadvantage because their L2 speech production
skills are not always primed to face these assessment items in real-life or testing situations.
With the growing use of spoken task types in classroom assessments and high-stakes
language tests, research is needed into the design of pedagogical tasks that enhance rather
than hinder, L2 fluency.
Research to date on L2 fluency has been plagued by a lack of precision. It is often used to
convey global oral proficiency to refer to a speaker who has a high command of the L2
(Kormos, 2006; Lennon, 1990; Riggenbach, 1991; Schmidt, 1992). Lennon (2000)
distinguishes between two senses of fluency: a broad sense, referring to all-round oral
proficiency, and a narrow sense, referring to the speed and smoothness of delivery. Although
fluency in the broad sense is probably the most generic way to refer to overall L2
competency, the term is problematic because it is nonetheless vague (Fulcher, 2003). The
lack of precision associated with defining fluency is therefore inherently reflected in the
difficulty of assessing it. Despite the absence of widespread agreement in the research
literature about the exact definition of fluency (see Segalowitz, 2010 for a comprehensive
136
Papers from the Lancaster University Postgraduate Conference in Linguistics & Language Teaching 2010
review), fluency assessment based on spoken task types remains a primary defining criterion
in many L2 language tests.
In light of the issues raised, the pilot study explained in the remainder of this paper explores
the effect of three elicitation tasks on L2 speech production and perception. The current
research was multi-pronged and attempted to determine:
1. The differences in perceived fluency and utterance fluency across speech elicitation
task types.
2. The workability of the speech elicitation tasks designed to assess L2 fluency.
3. The feasibility of using a PRAAT software script (De Jong & Wempe, 2009) to
automatically measure temporal variables of utterance fluency for practical language
assessment purposes.
4. For these purposes, the pilot study aimed to address this main research question:
5. How do perceived fluency and utterance fluency differ on the three speech elicitation
tasks designed to assess L2 fluency?
2 Definitions
While there are a range of meanings for pedagogical task, in this paper, it is defined as “a
holistic activity which engages language use in order to achieve some non-linguistic outcome
while meeting a linguistic challenge, with the overall aim of promoting language learning,
through process or product or both” (Samuda & Bygate, 2008, p. 69). Fluency, in terms of L2
skill performance, refers to “the rapid, smooth, accurate, lucid, and efficient translation of
thought or communicative intention under the temporal constraints of on-line
processing”(Lennon, 1990; 2000, p. 26) . The notion of utterance fluency refers to the
temporal values of speech or the “oral features of utterances that reflect the operation of
underlying cognitive processes” (Segalowitz, 2010, p. 48). Finally, the concept of perceived
fluency refers to the “inferences listeners make about a speaker’s cognitive fluency based on
their perception of utterance fluency” (Segalowitz, 2010, p. 48).
137
Papers from the Lancaster University Postgraduate Conference in Linguistics & Language Teaching 2010
3 Literature Review
Fluency has been identified as an important skill to assess in second language testing. Closely
tied to fluency assessment, however, is the issue of task design and the development of
speech tasks that sufficiently trigger L2 speaking performance. Several empirical studies
have investigated L2 speech perception and production using varying elicitation tasks and
scopes of measurement (De Jong, Steinel, Florijn, Schoonen, & Hulstijn, 2007; Derwing,
Munro, Thomson, & Rossiter, 2009; Derwing, Rossiter, Munro, & Thomson, 2004; Kormos &
Dénes, 2004; Rossiter, 2009; Skehan & Foster, 1997). In common with all these studies are
methods of rating speech samples against holistic rating scales for perceived fluency,
measuring temporal variables for utterance fluency and investigating correlations. However,
they employed a mixture of task types, planning time conditions, measurement methods and
temporal variables to investigate L2 fluency. Because fluency is multi-dimensional, the
findings of the studies mentioned above are not systematically comparable due to a lack of
consistency in applying a common set of objective fluency variables and operationalization
methods (Kormos, 2006; Segalowitz, 2010).
Albeit with differences in operationalization, empirical research findings have revealed
particular aspects of how tasks and conditions impact L2 speech performance. In general,
speech rate is identified as one of the most salient temporal variables of L2 fluency (Derwing,
et al., 2004; Freed, 1995; Kormos & Dénes, 2004; Lennon, 1990; O'Brien, Segalowitz, Freed, &
Collentine, 2007; Riggenbach, 1991; Rossiter, 2009; Towell, Hawkins, & Bazergui, 1996).
Kormos and Dénes (2004) explored variables which predict perceptions of fluency. They
investigated the distinguishing fluency features of 16 Hungarian English language learners at
two proficiency levels using a narrative task allowing for two minutes of planning time. The
speech samples were rated for fluency using a scale that ranged from 1 to 5. Speech rate,
mean length of runs, phonation time ratio and the number of stressed words produced per
minute (pace) were reported as the best predictors of fluency. While Lennon (1990) and
Foster and Skehan (1999) found filled pauses and unfilled pauses correlated with fluency,
these speech phenomenon did not impact perceptions of fluency.
However, as Chambers (1997, p. 540) points out “becoming fluent therefore is not about
speaking faster (articulation rate), but about pausing less often and pausing at the
appropriate junctures in an utterance.” Given the debate in the research literature about the
side effects of pause phenomenon on perceived fluency (e.g., Kormos & Dénes, 2004;
Riggenbach, 1991; Towell, et al., 1996), this conclusion seems particularly relevant for
speech processing in the L1 and L2 alike. Recently, this same conclusion has been echoed
further by Ginther, Dimova and Yang (2010, p. 393) , “the contribution of silent pausing
138
Papers from the Lancaster University Postgraduate Conference in Linguistics & Language Teaching 2010
deserves careful attention”. The examination of how pause phenomena vary at different
fluency levels is worthy of further empirical research.
Along these same lines but using more contemporary methods, De Jong et al. (2007) reported
an experiment which aimed to investigate the impact of task complexity on L1 and L2 Dutch
speaking performance. In this study, 267 participants responded to four simple and four
complex role-play monologue tasks with a 30-second planning time per task. Fluency
judgements were evaluated using a six-part scale. Fluency was measured with PRAAT solely
in regard to phonation time ratio and syllables per second. For L1 speakers fluency increased
when tasks were complex as reported by phonation-time ratio measurements. For L2
speakers however, results showed that fluency decreased on complex tasks as reported by
syllables per second. This finding is particularly salient for future research in L2 cognition
and how attention capacity - albeit limited in L2 processing - is selected and distributed in
speech production.
More recently, Rossiter (2009) examined perceptions of speaking fluency of 24 adult ESL
students using a picture description task in a pretest and posttest format with one minute of
planning time. The speech samples were rated for fluency using a Likert scale. Temporal
measurements such as speech rate, unfilled pauses and mean length of run were made using
SoundEdit 16. Fluency judgments correlated with the temporal measures of total pause per
second and pruned syllables per second. Pausing, self-repetition, speech rate, and fillers were
reported as negative features for perceived fluency. This study raises important pedagogical
issues concerning the need to provide the sufficient oral practice critical to L2 skill
development. While classroom practice often promotes a communicative approach, fluency
building activities are often missing from instruction (Gatbonton & Segalowitz, 2005;
Rossiter, Derwing, Manimtim, & Thomson, 2010).
Although these studies had different research aims, they all empirically investigated L2
fluency by employing monologue narrative elicitation tasks under time constraints, judged
fluency according to rating scales, and measured temporal values of fluency. Until a well-
defined holistic rubric and operationalization criteria to reliably measure L2 fluency are
standardized, research will continue to vary and impact fluency performance assessment.
In response to the lack of consistency, this pilot study follows the work of Kormos and Dénes
(2004) by employing monologue task types to elicit speech as well as speech rate, mean
length of utterance and phonation time ratio as fluency predictors. This research also follows
the work of De Jong et al. (2007) in that it will automatically measure temporal variables of
fluency using PRAAT software. Finally, in response to the Rossiter et al. (2010) study,
pedagogical implications of the pilot research will be discussed.
139
Papers from the Lancaster University Postgraduate Conference in Linguistics & Language Teaching 2010
4 Methods
4.1 Participants
The pilot study investigated a small population of students (n = 9) enrolled in an
intermediate French class at an Alliance Française in Denver, Colorado. With the exception of
one L1 Spanish speaker (a thirty year resident of the USA) and one British English speaker,
the participants were all speakers of American English. Three of the participants were retired
and six were professionals. In exchange for their contributions, a 90-minute private lesson
focusing on an area of difficulty was offered.
One rater took part in the pilot study: a PhD student with 12 years of ESL and French
teaching experience and normal hearing. She rated the nine speech performances using an
adapted version of the CEF (Common European Framework) fluency scale. The scale
descriptors ranged from zero to six, with zero indicating no fluency and six indicating a high
level of fluency. The rater has been involved in several language test development and
fluency rating projects for large-scale testing organizations.
4.2 Sampling
The students represented in the sample were chosen for their intermediate CEFR (Common
European Framework of Reference) B1/B2 French proficiency as reported by the Alliance
Française placement test. Given the geographic location and the small number of students at
the B1/B2 level, it was not possible to have random assignment of students. This restricted
the researcher in her sampling procedure.
4.3 General Procedures
Participants were asked to respond to three different narrative speech elicitation tasks
including a picture description, a story retell and an opinion question. These tasks were
administered at the Alliance Française according to a standard set of procedures. A 3-minute
allotment for planning preceded each speech task but participants typically started to speak
after approximately 30 seconds. All speech samples were recorded using GarageBand. In
order to ensure precise audio files for analysis, the speech samples were edited to remove
unrelated speech and pauses at the beginning and end of each recording. The speech samples
were also transcribed manually by hand. Syllables were extracted automatically using the
PRAAT script from De Jong and Wempe (2009) and pauses were processed using the
TextGrid (to silences) function.
140
Papers from the Lancaster University Postgraduate Conference in Linguistics & Language Teaching 2010
4.4 Speaking Task Design and Development
This section provides an overview of the design procedures involved in conceptualizing and
organizing the speaking tasks used in the pilot study.
To begin, a test specification document was created to describe the L2 speaking component
of the pilot study and guide the overall task design and development process. In particular,
the criteria specified details on the assessment purpose, audience, domain, proficiency level,
method, assessment criteria, score use and speaking construct. Following Bygate (2005), this
stage focused on the proper conceptualization and comprehension of task goals to avoid
random trial and error.
Stage 2 involved reviewing the literature on task models (Robinson, 2001; Skehan & Foster,
2001), task types and the different methods to assess L2 speaking. Rather than commenting
on the pros and cons of each, this section highlights the overall L2 speech-enhancing
properties of the tasks designed for this pilot study. Being cognizant that L2 fluency varies
according to task type and planning time, the tasks were conceptualized to emphasize
fluency, or general facility and latency, in spoken French by responding to tasks about
everyday life. The tasks aimed to elicit ability to formulate and produce intelligible utterances
at a conversational pace. Following Skehan’s (1998) model, the task design implemented the
dimensions of perspective, immediacy and planning time.
To measure L2 fluency, the overall design sought to cover several task types in order to
encourage a range of skills and a more complete representation of learner abilities (Luoma,
2004). As the pilot project was only concerned with L2 speaking skills, the tasks did not
involve evaluating any listening or interactional aspects. Based on the literature consulted,
narrative monologues including a picture description, a story retell and an open question
were chosen as tasks. The picture description task depicted people working in an internet
café, the story retell task described a horseback riding accident, and the open question
pertained to organic farming and government intervention. Table 1 below summarizes the
main features of the three speech tasks.
The task content was designed to be interesting and purposeful, but also simple and intuitive.
Special care was taken to design task content targeting themes common to the geographic
area to provide a Colorado flavour. The tasks did not require any particular world
knowledge, special insight, or memory capability and were in the realm of familiarity of
typical adult life. Building on Levelt’s (1989) model of speech production, the tasks were
conceptualized as activities to support L2 skill performance in that they were goal oriented,
attempting to support a link from intention to articulation.
141
Papers from the Lancaster University Postgraduate Conference in Linguistics & Language Teaching 2010
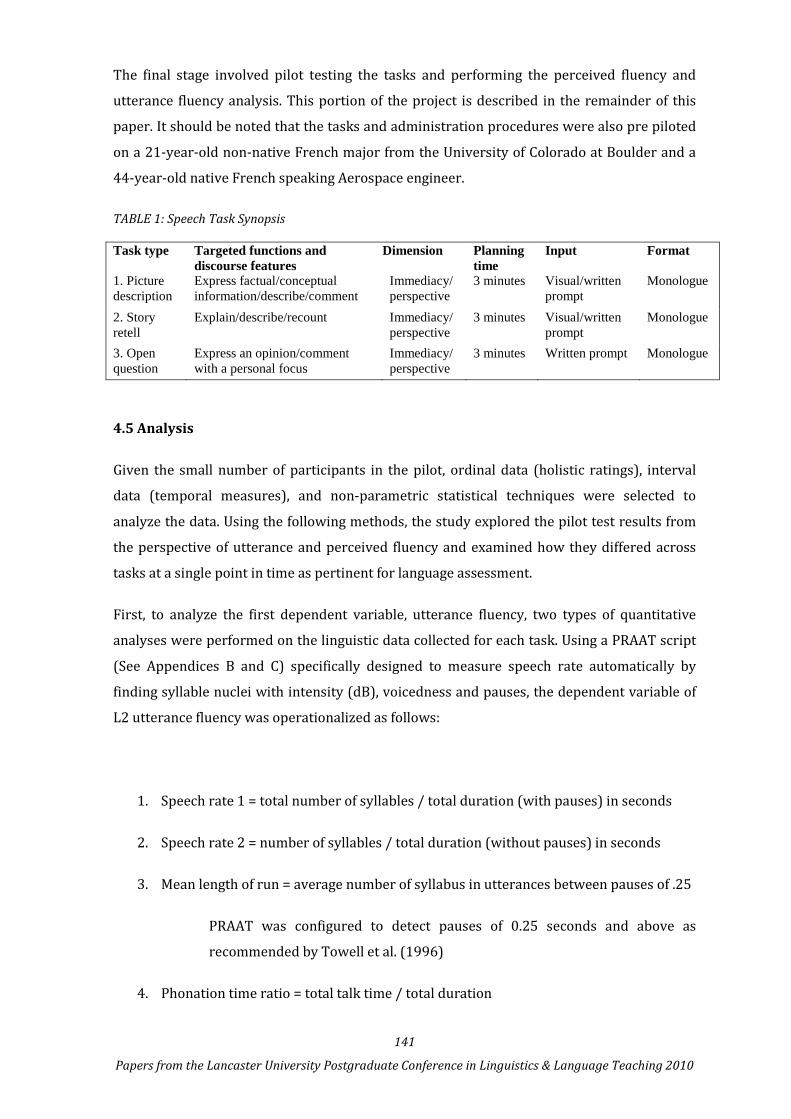
The final stage involved pilot testing the tasks and performing the perceived fluency and
utterance fluency analysis. This portion of the project is described in the remainder of this
paper. It should be noted that the tasks and administration procedures were also pre piloted
on a 21-year-old non-native French major from the University of Colorado at Boulder and a
44-year-old native French speaking Aerospace engineer.
TABLE 1: Speech Task Synopsis
Task type Targeted functions and discourse features
Dimension Planning time
Input Format
1. Picture description
Express factual/conceptual information/describe/comment
Immediacy/perspective
3 minutes Visual/written prompt
Monologue
2. Story retell
Explain/describe/recount Immediacy/perspective
3 minutes Visual/written prompt
Monologue
3. Open question
Express an opinion/comment with a personal focus
Immediacy/perspective
3 minutes Written prompt Monologue
4.5 Analysis
Given the small number of participants in the pilot, ordinal data (holistic ratings), interval
data (temporal measures), and non-parametric statistical techniques were selected to
analyze the data. Using the following methods, the study explored the pilot test results from
the perspective of utterance and perceived fluency and examined how they differed across
tasks at a single point in time as pertinent for language assessment.
First, to analyze the first dependent variable, utterance fluency, two types of quantitative
analyses were performed on the linguistic data collected for each task. Using a PRAAT script
(See Appendices B and C) specifically designed to measure speech rate automatically by
finding syllable nuclei with intensity (dB), voicedness and pauses, the dependent variable of
L2 utterance fluency was operationalized as follows:
1. Speech rate 1 = total number of syllables / total duration (with pauses) in seconds
2. Speech rate 2 = number of syllables / total duration (without pauses) in seconds
3. Mean length of run = average number of syllabus in utterances between pauses of .25
PRAAT was configured to detect pauses of 0.25 seconds and above as
recommended by Towell et al. (1996)
4. Phonation time ratio = total talk time / total duration
142
Papers from the Lancaster University Postgraduate Conference in Linguistics & Language Teaching 2010
“Calculated as the percentage of the time spent speaking as percentage of the
time taken to produce the speech sample” as recommended by Towell et al.
(1996, p. 91)
Second, the temporal values and holistic ratings were entered as variables in SPSS. Next, the
descriptive statistics and the Friedman test were calculated to measure the same subjects
under the three different task conditions. Finally, the Wilcoxon Signed Rank test was
computed to find out where the differences lie.
To analyze the second dependent variable, perceived fluency, I rated the three tasks at the
onset of the 12-week French class using an adapted version of the CEFR. At week 6, these
same three tasks were rerated again, blind (not having looked at the original ratings). Next,
the intra-rater reliability figures for each task were calculated. Finally, using the quantitative
analysis extracted from PRAAT, I link temporal variable measurements to rating scores and
discuss intra-rater reliability and rater interpretation of holistic descriptors from a perceived
fluency perspective.
5. Results
The research examined how L2 utterance fluency and perceived fluency differ on three
speech tasks. Given the small data set (N=9), it was difficult to perform meaningful statistical
analysis. Nonetheless, the following conclusions were inferred from the data.
To facilitate comprehension and provide context to the summary below, Task 1 refers to the
picture description task, Task 2 to the horseback riding story retell task, and Task 3 to the
open question about organic farming task.
5.1 Main analyses for utterance fluency
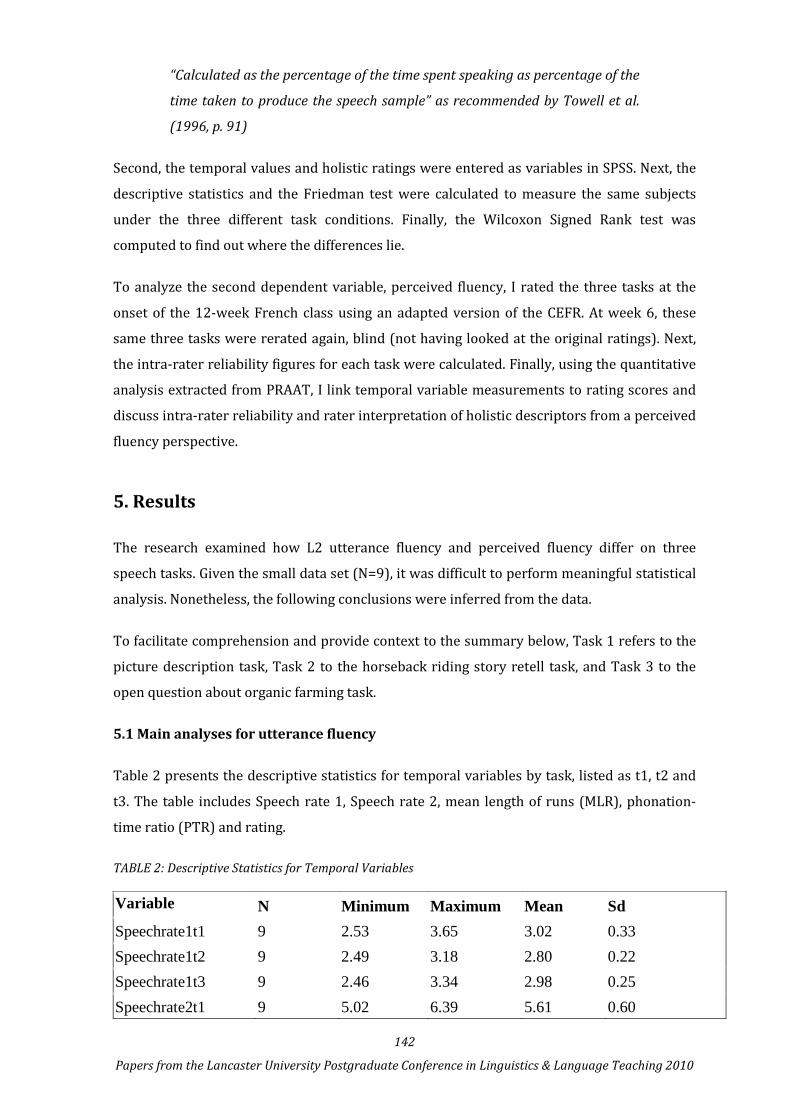
Table 2 presents the descriptive statistics for temporal variables by task, listed as t1, t2 and
t3. The table includes Speech rate 1, Speech rate 2, mean length of runs (MLR), phonation-
time ratio (PTR) and rating.
TABLE 2: Descriptive Statistics for Temporal Variables
Variable N Minimum Maximum Mean Sd Speechrate1t1 9 2.53 3.65 3.02 0.33 Speechrate1t2 9 2.49 3.18 2.80 0.22 Speechrate1t3 9 2.46 3.34 2.98 0.25 Speechrate2t1 9 5.02 6.39 5.61 0.60
143
Papers from the Lancaster University Postgraduate Conference in Linguistics & Language Teaching 2010
Speechrate2t2 9 4.52 6.92 6.09 0.72 Speechrate2t3 9 4.69 7.11 5.67 0.73 PTRt1 9 0.43 0.69 0.54 0.08 PTRt2 9 0.38 0.56 0.47 0.06 PTRt3 9 0.41 0.62 0.53 0.07 MLRt1 9 4.41 8.32 5.46 1.24 MLRt2 9 3.71 7.35 5.09 1.03 MLRt3 9 4.45 6.45 5.51 0.77 Ratingt1 9 3.00 4.00 3.44 0.53 Ratingt2 9 3.00 4.00 3.56 0.53 Ratingt3 9 3.00 4.00 3.33 0.50
5.2 Speech rate observations
Examination of the mean for Speech rate 1 reveals a difference in syllables produced per
minute across tasks. The most substantial difference is associated with a comparison of mean
measures between Task 1 and Task 2, a variation of 13.2 syllables per minute. Further
analyses computed by the Wilcoxon test confirm the two sets of Speech rate 1 measures are
significantly different (p<0.021). Speech rate 2 represents greater variation between Tasks 1
and 2, a difference of 28.8 syllables per minute. However, this larger difference is expected as
Speech rate 2 is measured without pauses. Because Speech rate 1 is higher for Task 1 than
Task 2, and Speech rate 2 is lower for Task 1 than Task 2, this indicates that pausing is
greater in Task 2. This greater pausing is also revealed by the large difference between
Speech rate 1 and Speech rate 2 for Task 2.
5.3 Phonation-time ratio or (PTR) observations
The Wilcoxon test also reports a significant difference (p<0.038) in phonation-time ratio
between Tasks 1 and 2. The values associated with PTR for Task 1 are 54% compared to 47%
for Task 2, indicating a difference of 7%. The PTR of Task 1 (54%) and Task 3 (53%) are
similar, possibly suggesting congruent features and difficulty.
5.4 Mean length of runs (or MLR) observations
The mean for MLR is similar for Task 1 and Task 3. This is also observed with speech rates
and PTR. However, the standard deviation of the MLR in Task 1 is much greater than in Task
3. This is due to the maximum MLR value measurement of 8.32 for participant 2, increasing
not only the standard deviation, but also the mean. The speech pattern of participant 2 is
144
Papers from the Lancaster University Postgraduate Conference in Linguistics & Language Teaching 2010
characterized by free flowing utterances followed by long pauses before starting again. If this
result were to be removed from the set, the mean and standard deviation would be lower and
therefore more similar to the two other tasks.
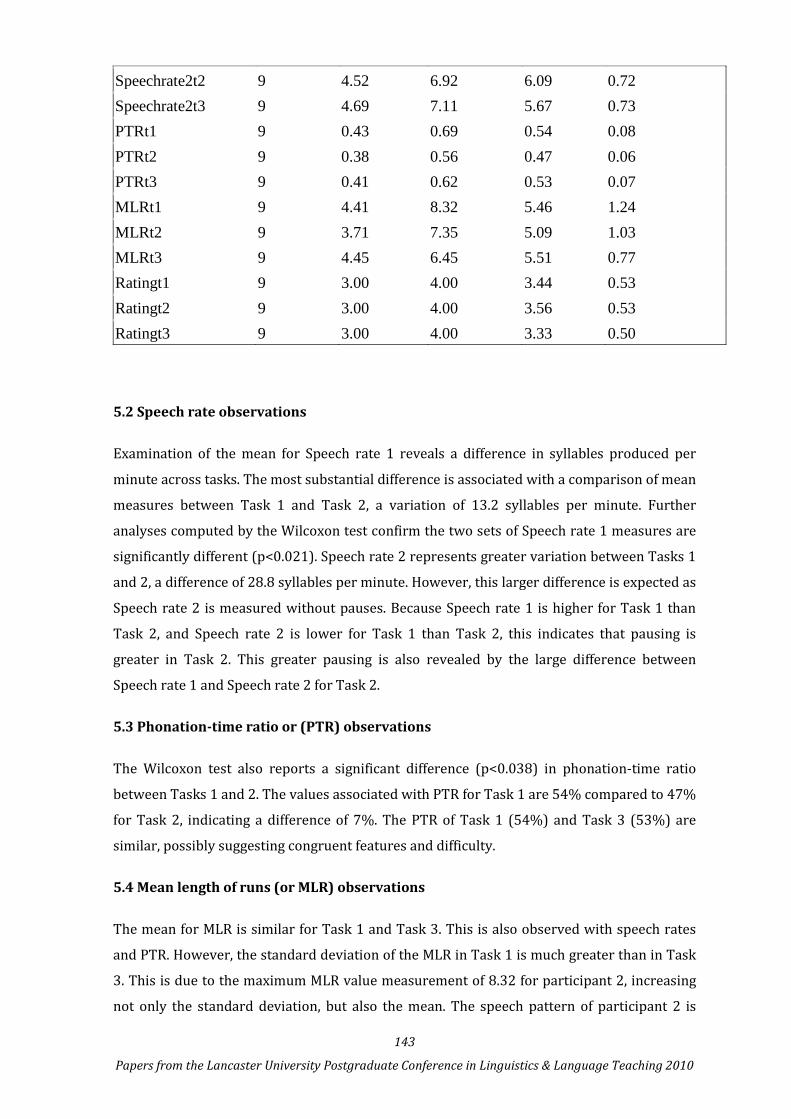
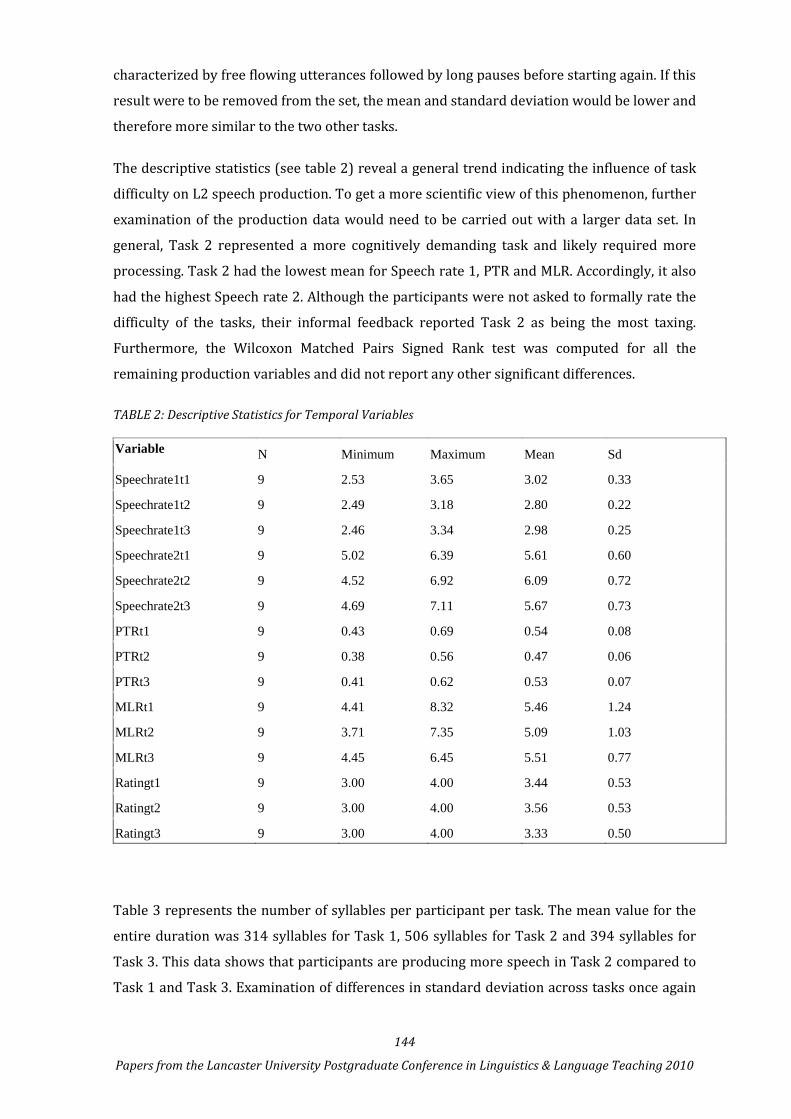
The descriptive statistics (see table 2) reveal a general trend indicating the influence of task
difficulty on L2 speech production. To get a more scientific view of this phenomenon, further
examination of the production data would need to be carried out with a larger data set. In
general, Task 2 represented a more cognitively demanding task and likely required more
processing. Task 2 had the lowest mean for Speech rate 1, PTR and MLR. Accordingly, it also
had the highest Speech rate 2. Although the participants were not asked to formally rate the
difficulty of the tasks, their informal feedback reported Task 2 as being the most taxing.
Furthermore, the Wilcoxon Matched Pairs Signed Rank test was computed for all the
remaining production variables and did not report any other significant differences.
TABLE 2: Descriptive Statistics for Temporal Variables
Variable N Minimum Maximum Mean Sd
Speechrate1t1 9 2.53 3.65 3.02 0.33
Speechrate1t2 9 2.49 3.18 2.80 0.22
Speechrate1t3 9 2.46 3.34 2.98 0.25
Speechrate2t1 9 5.02 6.39 5.61 0.60
Speechrate2t2 9 4.52 6.92 6.09 0.72
Speechrate2t3 9 4.69 7.11 5.67 0.73
PTRt1 9 0.43 0.69 0.54 0.08
PTRt2 9 0.38 0.56 0.47 0.06
PTRt3 9 0.41 0.62 0.53 0.07
MLRt1 9 4.41 8.32 5.46 1.24
MLRt2 9 3.71 7.35 5.09 1.03
MLRt3 9 4.45 6.45 5.51 0.77
Ratingt1 9 3.00 4.00 3.44 0.53
Ratingt2 9 3.00 4.00 3.56 0.53
Ratingt3 9 3.00 4.00 3.33 0.50
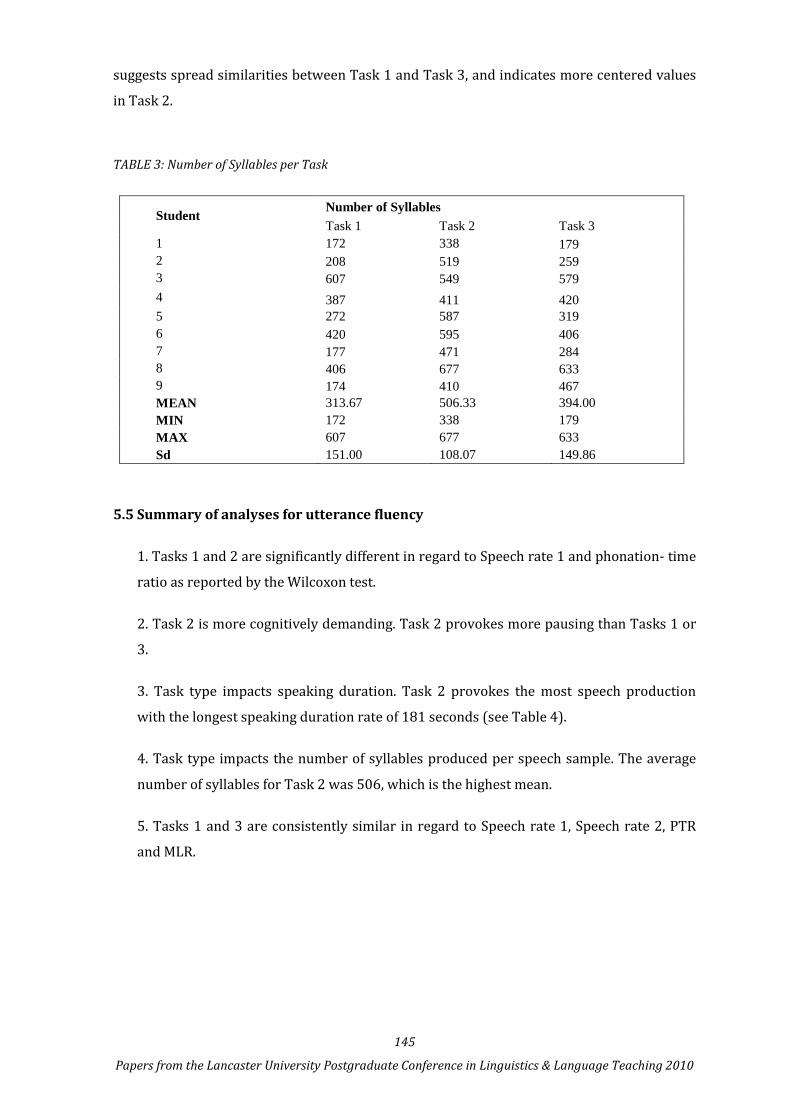
Table 3 represents the number of syllables per participant per task. The mean value for the
entire duration was 314 syllables for Task 1, 506 syllables for Task 2 and 394 syllables for
Task 3. This data shows that participants are producing more speech in Task 2 compared to
Task 1 and Task 3. Examination of differences in standard deviation across tasks once again
145
Papers from the Lancaster University Postgraduate Conference in Linguistics & Language Teaching 2010
suggests spread similarities between Task 1 and Task 3, and indicates more centered values
in Task 2.
TABLE 3: Number of Syllables per Task
5.5 Summary of analyses for utterance fluency
1. Tasks 1 and 2 are significantly different in regard to Speech rate 1 and phonation- time
ratio as reported by the Wilcoxon test.
2. Task 2 is more cognitively demanding. Task 2 provokes more pausing than Tasks 1 or
3.
3. Task type impacts speaking duration. Task 2 provokes the most speech production
with the longest speaking duration rate of 181 seconds (see Table 4).
4. Task type impacts the number of syllables produced per speech sample. The average
number of syllables for Task 2 was 506, which is the highest mean.
5. Tasks 1 and 3 are consistently similar in regard to Speech rate 1, Speech rate 2, PTR
and MLR.
Student Number of Syllables Task 1 Task 2 Task 3
1 172 338 179 2 208 519 259 3 607 549 579 4 387 411 420 5 272 587 319 6 420 595 406 7 177 471 284 8 406 677 633 9 174 410 467 MEAN 313.67 506.33 394.00 MIN 172 338 179 MAX 607 677 633 Sd 151.00 108.07 149.86
146
Papers from the Lancaster University Postgraduate Conference in Linguistics & Language Teaching 2010
5.6 Main analyses for perceived fluency
Speaking performances by all nine participants were rated against the CEFR fluency criteria.
Using the rank order correlation formula, I calculated my first and second set of marks.
5.7 Intra-rater reliability observations
The intra-rater reliability figures are 85% for Task 1, 74% for Task 2, and 100% for Task 3,
which indicate acceptable internal consistency. There was a difference in performance rating
opinion between the two sets of speech samples when re-marked blind at 6 weeks.
Interestingly the lowest intra-rater reliability figure of 74% was for Task 2, the most
cognitively demanding task. This observation signals that task difficulty and rating difficulty
may be related. Task difficulty may exert more stress on the rater resulting in more overall
difficulty rating the fluency of the speech sample.
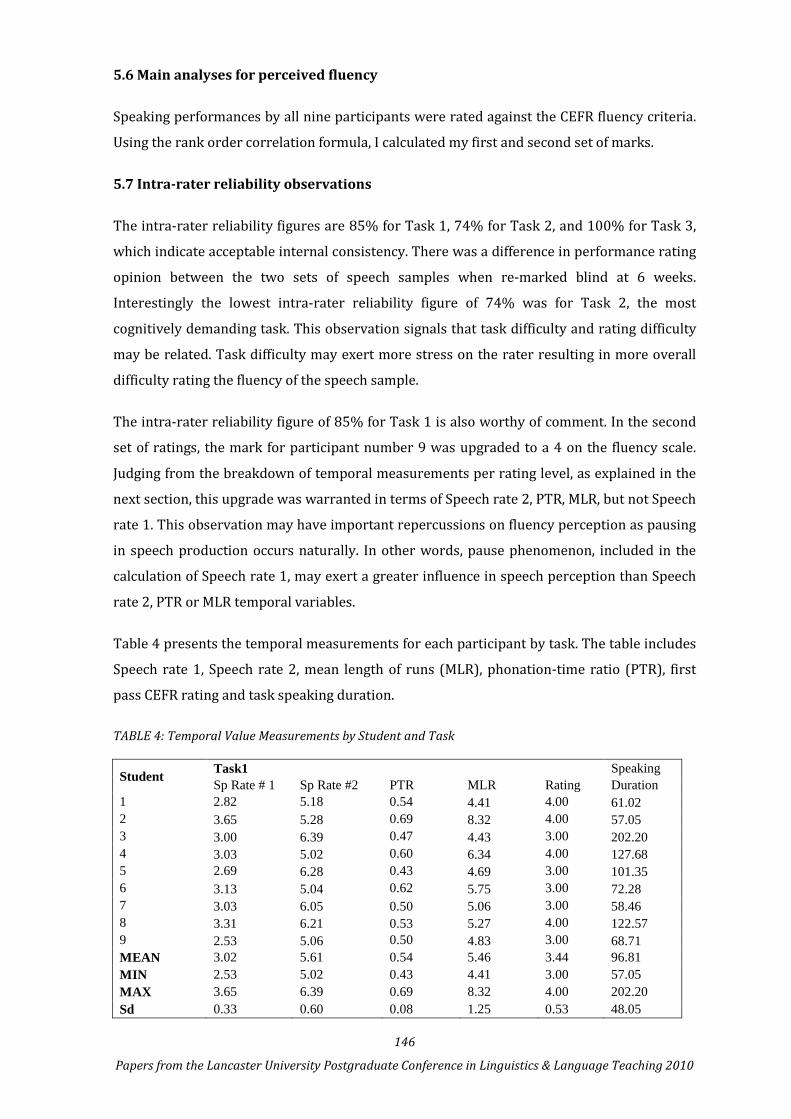
The intra-rater reliability figure of 85% for Task 1 is also worthy of comment. In the second
set of ratings, the mark for participant number 9 was upgraded to a 4 on the fluency scale.
Judging from the breakdown of temporal measurements per rating level, as explained in the
next section, this upgrade was warranted in terms of Speech rate 2, PTR, MLR, but not Speech
rate 1. This observation may have important repercussions on fluency perception as pausing
in speech production occurs naturally. In other words, pause phenomenon, included in the
calculation of Speech rate 1, may exert a greater influence in speech perception than Speech
rate 2, PTR or MLR temporal variables.
Table 4 presents the temporal measurements for each participant by task. The table includes
Speech rate 1, Speech rate 2, mean length of runs (MLR), phonation-time ratio (PTR), first
pass CEFR rating and task speaking duration.
TABLE 4: Temporal Value Measurements by Student and Task
Student Task1 Speaking Sp Rate # 1 Sp Rate #2 PTR MLR Rating Duration
1 2.82 5.18 0.54 4.41 4.00 61.02 2 3.65 5.28 0.69 8.32 4.00 57.05 3 3.00 6.39 0.47 4.43 3.00 202.20 4 3.03 5.02 0.60 6.34 4.00 127.68 5 2.69 6.28 0.43 4.69 3.00 101.35 6 3.13 5.04 0.62 5.75 3.00 72.28 7 3.03 6.05 0.50 5.06 3.00 58.46 8 3.31 6.21 0.53 5.27 4.00 122.57 9 2.53 5.06 0.50 4.83 3.00 68.71 MEAN 3.02 5.61 0.54 5.46 3.44 96.81 MIN 2.53 5.02 0.43 4.41 3.00 57.05 MAX 3.65 6.39 0.69 8.32 4.00 202.20 Sd 0.33 0.60 0.08 1.25 0.53 48.05
147
Papers from the Lancaster University Postgraduate Conference in Linguistics & Language Teaching 2010
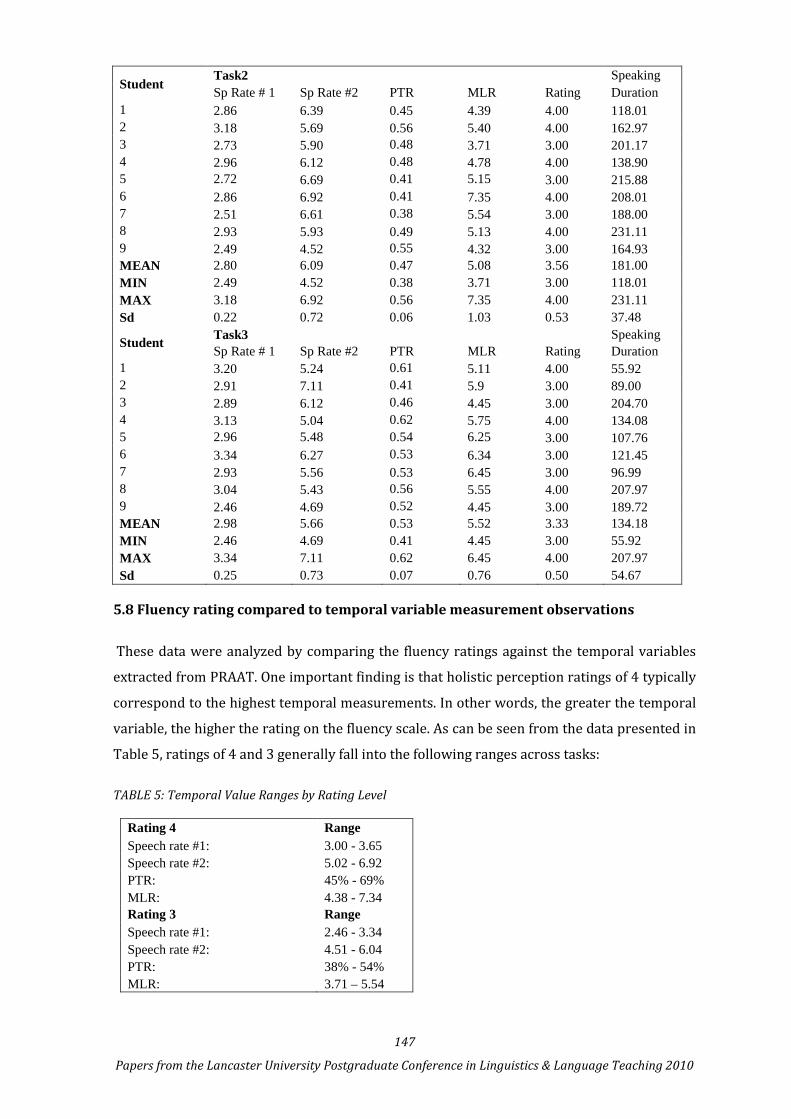
Student Task2 Speaking Sp Rate # 1 Sp Rate #2 PTR MLR Rating Duration
1 2.86 6.39 0.45 4.39 4.00 118.01 2 3.18 5.69 0.56 5.40 4.00 162.97 3 2.73 5.90 0.48 3.71 3.00 201.17 4 2.96 6.12 0.48 4.78 4.00 138.90 5 2.72 6.69 0.41 5.15 3.00 215.88 6 2.86 6.92 0.41 7.35 4.00 208.01 7 2.51 6.61 0.38 5.54 3.00 188.00 8 2.93 5.93 0.49 5.13 4.00 231.11 9 2.49 4.52 0.55 4.32 3.00 164.93 MEAN 2.80 6.09 0.47 5.08 3.56 181.00 MIN 2.49 4.52 0.38 3.71 3.00 118.01 MAX 3.18 6.92 0.56 7.35 4.00 231.11 Sd 0.22 0.72 0.06 1.03 0.53 37.48
Student Task3 Speaking Sp Rate # 1 Sp Rate #2 PTR MLR Rating Duration
1 3.20 5.24 0.61 5.11 4.00 55.92 2 2.91 7.11 0.41 5.9 3.00 89.00 3 2.89 6.12 0.46 4.45 3.00 204.70 4 3.13 5.04 0.62 5.75 4.00 134.08 5 2.96 5.48 0.54 6.25 3.00 107.76 6 3.34 6.27 0.53 6.34 3.00 121.45 7 2.93 5.56 0.53 6.45 3.00 96.99 8 3.04 5.43 0.56 5.55 4.00 207.97 9 2.46 4.69 0.52 4.45 3.00 189.72 MEAN 2.98 5.66 0.53 5.52 3.33 134.18 MIN 2.46 4.69 0.41 4.45 3.00 55.92 MAX 3.34 7.11 0.62 6.45 4.00 207.97 Sd 0.25 0.73 0.07 0.76 0.50 54.67
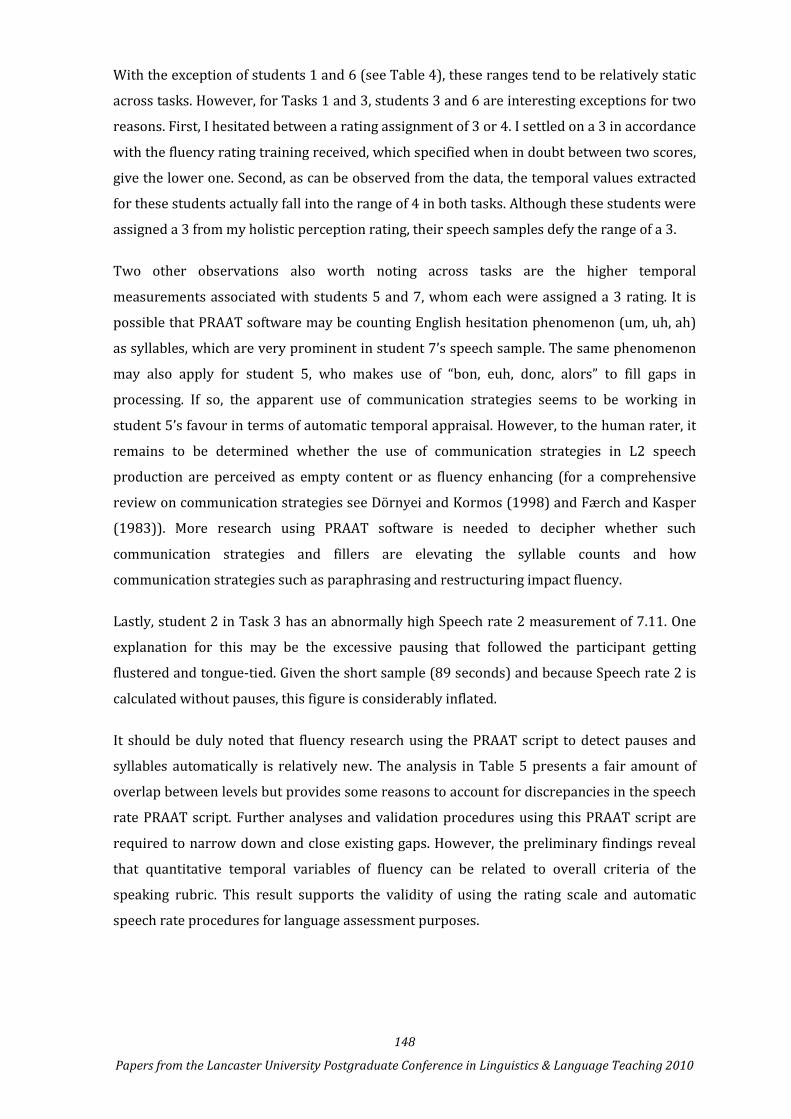
5.8 Fluency rating compared to temporal variable measurement observations
These data were analyzed by comparing the fluency ratings against the temporal variables
extracted from PRAAT. One important finding is that holistic perception ratings of 4 typically
correspond to the highest temporal measurements. In other words, the greater the temporal
variable, the higher the rating on the fluency scale. As can be seen from the data presented in
Table 5, ratings of 4 and 3 generally fall into the following ranges across tasks:
TABLE 5: Temporal Value Ranges by Rating Level
Rating 4 Range Speech rate #1: 3.00 - 3.65 Speech rate #2: 5.02 - 6.92 PTR: 45% - 69% MLR: 4.38 - 7.34 Rating 3 Range Speech rate #1: 2.46 - 3.34 Speech rate #2: 4.51 - 6.04 PTR: 38% - 54% MLR: 3.71 – 5.54
148
Papers from the Lancaster University Postgraduate Conference in Linguistics & Language Teaching 2010
With the exception of students 1 and 6 (see Table 4), these ranges tend to be relatively static
across tasks. However, for Tasks 1 and 3, students 3 and 6 are interesting exceptions for two
reasons. First, I hesitated between a rating assignment of 3 or 4. I settled on a 3 in accordance
with the fluency rating training received, which specified when in doubt between two scores,
give the lower one. Second, as can be observed from the data, the temporal values extracted
for these students actually fall into the range of 4 in both tasks. Although these students were
assigned a 3 from my holistic perception rating, their speech samples defy the range of a 3.
Two other observations also worth noting across tasks are the higher temporal
measurements associated with students 5 and 7, whom each were assigned a 3 rating. It is
possible that PRAAT software may be counting English hesitation phenomenon (um, uh, ah)
as syllables, which are very prominent in student 7’s speech sample. The same phenomenon
may also apply for student 5, who makes use of “bon, euh, donc, alors” to fill gaps in
processing. If so, the apparent use of communication strategies seems to be working in
student 5’s favour in terms of automatic temporal appraisal. However, to the human rater, it
remains to be determined whether the use of communication strategies in L2 speech
production are perceived as empty content or as fluency enhancing (for a comprehensive
review on communication strategies see Dörnyei and Kormos (1998) and Færch and Kasper
(1983)). More research using PRAAT software is needed to decipher whether such
communication strategies and fillers are elevating the syllable counts and how
communication strategies such as paraphrasing and restructuring impact fluency.
Lastly, student 2 in Task 3 has an abnormally high Speech rate 2 measurement of 7.11. One
explanation for this may be the excessive pausing that followed the participant getting
flustered and tongue-tied. Given the short sample (89 seconds) and because Speech rate 2 is
calculated without pauses, this figure is considerably inflated.
It should be duly noted that fluency research using the PRAAT script to detect pauses and
syllables automatically is relatively new. The analysis in Table 5 presents a fair amount of
overlap between levels but provides some reasons to account for discrepancies in the speech
rate PRAAT script. Further analyses and validation procedures using this PRAAT script are
required to narrow down and close existing gaps. However, the preliminary findings reveal
that quantitative temporal variables of fluency can be related to overall criteria of the
speaking rubric. This result supports the validity of using the rating scale and automatic
speech rate procedures for language assessment purposes.
149
Papers from the Lancaster University Postgraduate Conference in Linguistics & Language Teaching 2010
5.9 Summary of analyses for perceived fluency
Task difficulty and perceived fluency rating difficulty are related. Task difficulty affects rating
difficulty. The lowest intra-reliability figure (74%) is associated with Task 2, the most
difficult task.
Task difficulty and perceived ratings are related. Task difficulty affects speech perception.
Tasks 1 and 3 are less cognitively demanding and have a higher amount of level 3 ratings.
Task 2 is the most cognitively demanding and has the greatest amount of level 4 ratings.
Ranges of quantitative measurements as determined by PRAAT correspond to holistic
perception rating levels across score levels and tasks. This finding highlights an underlying
consistency between temporal measurement and perceived abilities.
The intra-rater reliability variation is 86% across tasks.
6. Conclusion
The present pilot study aimed to determine the extent to which analysis of perceived fluency
and utterance fluency inform and provide support for the workability of three speech
elicitation tasks designed to assess L2 fluency. The results reveal how task design and
difficulty impact perceived fluency and utterance fluency differently, and thus influence
overall speech production and perception. I argue that Task 2 and either Tasks 1 or 3 show
distinguishing measurable features and are therefore workable for L2 fluency assessment. In
sum, while all tasks trigger speech performance, the data reveals that Task 2 is the most
difficult and prompts more speech output than Tasks 1 and 3. This observation may lend
support to Robinson’s (2001) cognitive processing model, which stipulates that cognitively
demanding tasks provoke more speech production “by making additional functional
demands and therefore increases lexical variety and grammatical accuracy” (p.39). This pilot
study also provides some preliminary evidence indicating a link between temporal fluency
measurements and intra-rater reliability, and rater interpretation of the fluency scale
descriptors.
As explained in the literature review, fluency is a multi-dimensional construct. Clearly, the
full extent of task variation cannot be validated at this stage given the small data set. Nor,
when that data set is attained, will task variation be reduced to any one factor or dimension
of fluency. However, I have attempted to make a case for depth and rigor in designing task
types for language assessment. For data collection purposes, it is therefore essential to
150
Papers from the Lancaster University Postgraduate Conference in Linguistics & Language Teaching 2010
rigorously pilot test tasks to determine their fluency provoking properties before they are
included on a test.
The pilot study has a number of limitations that should be acknowledged. Factors
contributing to task difficulty, such as speaking anxiety and motivation are also related to the
quality of performance. The research did not control for individual differences in processing.
The research was solely focused on perceived fluency and utterance fluency. It did not
account for the relatively unexplored construct of cognitive fluency, which is a speaker’s
ability to mobilize and efficiently coordinate mechanisms to produce speech. Lastly, the link
between the findings and task models is missing.
There is a need for valid, precise, and reliable speech rate measurement procedures.
Although the idea behind this pilot study is not orginal, it represents one of the first attempts
to use automatic speech rate procedures to validate tasks designed for practical language
assessment. Like any new software, new users should expect to devote a fair amount of time
to learning PRAAT. The quantitative analyses of temporal variables presented in this paper
were extracted based on version 1 of the automatic speech rate script by De Jong and Wempe
(2009). Version 2, released in September 2010, greatly simplifies the procedures and
calculations. Future L2 fluency research would benefit from further experimentation with the
PRAAT speech analysis program. Learning to use this technology will provide new insights
and opportunities for research in utterance fluency. However, in order to make future studies
systematically comparable, settings in the PRAAT script will need to be standardized for
optimal results.
Given the vague nature of fluency, the implications for pedagogical and language testing
research are enormous. In many cases, the language learning environment does not always
allow learners to capitalize on acquired vocabulary and grammatical structures by providing
the sufficient oral practice critical to L2 skill development. The teaching of natural oral
communication skills is paramount if learners are to be successful in achieving language
goals and cope with real-life speaking needs of the spoken components of exams such as the
TOEFL or the PTE. When the stakes are high, test scores have the power to grant access to an
entirely new life. Since the use of these tests are not likely to diminish in the near future,
research needs to look at ways to enhance, not hinder, L2 fluency performance on tests of
spoken language.
151
Papers from the Lancaster University Postgraduate Conference in Linguistics & Language Teaching 2010
7 References
Boersma, P., & Weenink, D. (2010). Praat: Doing Phonetics by Computer [Computer program]
5.1.43. Retrieved Retrieved 4 August 2010 from http://www.praat.org/
Bygate, M. (2005). Oral second language abilities as expertise. In K. Johnson (Ed.), Expertise in
second language learning and teaching (pp. 104-127). London: Palgrave.
Bygate, M., & Samuda, V. (2005). Integrative planning through the use of task repetition. In R.
Ellis (Ed.), Planning and task performance in a second language (pp. 37-72).
Amsterdam: John Benjamins.
Bygate, M., Skehan, P., & Swain, M. (2001). Researching pedagogic tasks: Second language
learning, teaching, and testing. Harlow, England: Longman.
Chambers, F. (1997). What do we mean by fluency? System, 25, 535-544.
De Jong, N. H., Steinel, M. P., Florijn, A. F., Schoonen, R., & Hulstijn, J. H. (2007). The effect of
task complexity on fluency and functional adequacy of speaking performance. In S.
Van Daele, A. Housen, M. Pierrard, F. Kuiken & I. Vedder (Eds.), Complexity, accuracy
and fluency in second language use, learning and teaching (pp. 53-63). Brussels:
Koninklijke Vlaamse Academie van België voor Wetenschappen en Kunsten.
De Jong, N. H., & Wempe, T. (2009). Praat script to detect syllable nuclei and measure speech
rate automatically. Behavior Research Methods, 41, 385-390.
Derwing, T., Munro, M., Thomson, R., & Rossiter, M. (2009). The relationship between L1
fluency and L2 fluency development. Studies in Second Language Acquisition, 31, 533-
557.
Derwing, T., Rossiter, M., Munro, M., & Thomson, R. (2004). Second language fluency:
Judgments on different tasks. Language Learning, 54, 655-679.
Dörnyei, Z., & Kormos, J. (1998). Problem-solving mechanisms in L2 communication: A
psycholinguistic perspective. Studies in Second Language Acquisition, 20, 349-385.
Ellis, R. (2001). Non-reciprocal tasks, comprehension and second language acquisition. In M.
Bygate, P. Skehan & M. Swain (Eds.), Researching pedagogic tasks: Second language
learning, teaching, and testing (pp. 49-74). Harlow, England: Longman.
Foster, P., & Skehan, P. (1999). The influence of source of planning and focus of planning on
task-based performance. Language Teaching Research, 3, 215-247.
Freed, B. (1995). What makes us think that students who study abroad become fluent? In B.
Freed (Ed.), Second language acquisition in a study abroad context (pp. 123-148).
Amsterdam: John Benjamins.
Fulcher, G. (2003). Testing second language speaking. London: Longman/Pearson Education.
152
Papers from the Lancaster University Postgraduate Conference in Linguistics & Language Teaching 2010
Færch, C., & Kasper, G. (1983). On identifying communication strategies in interlanguage
production. In C. Færch & G. Kasper (Eds.), Strategies in interlanguage communication
(pp. 210-238). Harlow, England: Longman.
Gatbonton, E., & Segalowitz, N. (2005). Rethinking communicative language teaching: A focus
on access to fluency. Canadian Modern Language Review/La Revue canadienne des
langues vivantes, 61, 325-353.
Ginther, A., Dimova, S., & Yang, R. (2010). Conceptual and empirical relationships between
temporal measures of fluency and oral English proficiency with implications for
automated scoring. Language Testing, 27, 379-399.
Kormos, J. (2006). Speech production and second language acquisition. Mahwah, N.J.:
Lawrence Erlbaum Associates.
Kormos, J., & Dénes, M. (2004). Exploring measures and perceptions of fluency in the speech
of second language learners. System, 32, 145-164.
Lennon, P. (1990). Investigating fluency in EFL: A quantitative approach. Language Learning,
40, 387-417.
Lennon, P. (2000). The lexical element in spoken second language fluency. In H. Riggenbach
(Ed.), Perspectives on fluency (pp. 25-42). Ann Arbor, MI: University of Michigan Press.
Levelt, W. J. M. (1989). Speaking: From intention to articulation. Cambridge, MA: MIT Press.
Luoma, S. (2004). Assessing speaking. Cambridge, MA: Cambridge University Press.
O'Brien, I., Segalowitz, N., Freed, B., & Collentine, J. (2007). Phonological memory predicts
second language oral fluency gains in adults. Studies in Second Language Acquisition,
29, 557-581.
Riggenbach, H. (1991). Toward an understanding of fluency: A microanalysis of nonnative
speaker conversations. Discourse Processes, 14, 423-441.
Robinson, P. (2001). Task complexity, task difficulty, and task production: Exploring
interactions in a componential framework. Applied Linguistics, 22, 27-57.
Rossiter, M. J. (2009). Perceptions of L2 fluency by native and non-native speakers of English.
Canadian Modern Language Review/La Revue canadienne des langues vivantes, 65,
395-412.
Rossiter, M. J., Derwing, T. M., Manimtim, L. G., & Thomson, R. I. (2010). Oral fluency: The
neglected component in the communicative language classroom. Canadian Modern
Language Review/La Revue canadienne des langues vivantes, 66, 583-606.
Samuda, V., & Bygate, M. (2008). Tasks in second language learning. Basingstoke: Palgrave.
Schmidt, R. (1992). Psychological mechanisms underlying second language fluency. Studies in
Second Language Acquisition, 14, 357-385.
Segalowitz, N. (2010). Cognitive bases of second language fluency. New York: Routledge.
153
Papers from the Lancaster University Postgraduate Conference in Linguistics & Language Teaching 2010
Skehan, P. (1998). A cognitive approach to language learning. Oxford: Oxford University
Press.
Skehan, P., & Foster, P. (1997). Task type and task processing conditions as influences on
foreign language performance. Language Teaching Research, 1, 185-211.
Skehan, P., & Foster, P. (2001). Cognition and tasks. In P. Robinson (Ed.), Cognition and second
language instruction (pp. 183-205). Cambridge: Cambridge University Press.
Towell, R., Hawkins, R., & Bazergui, N. (1996). The development of fluency in advanced
learners of French. Applied Linguistics, 17, 84-119.
154
Papers from the Lancaster University Postgraduate Conference in Linguistics & Language Teaching 2010
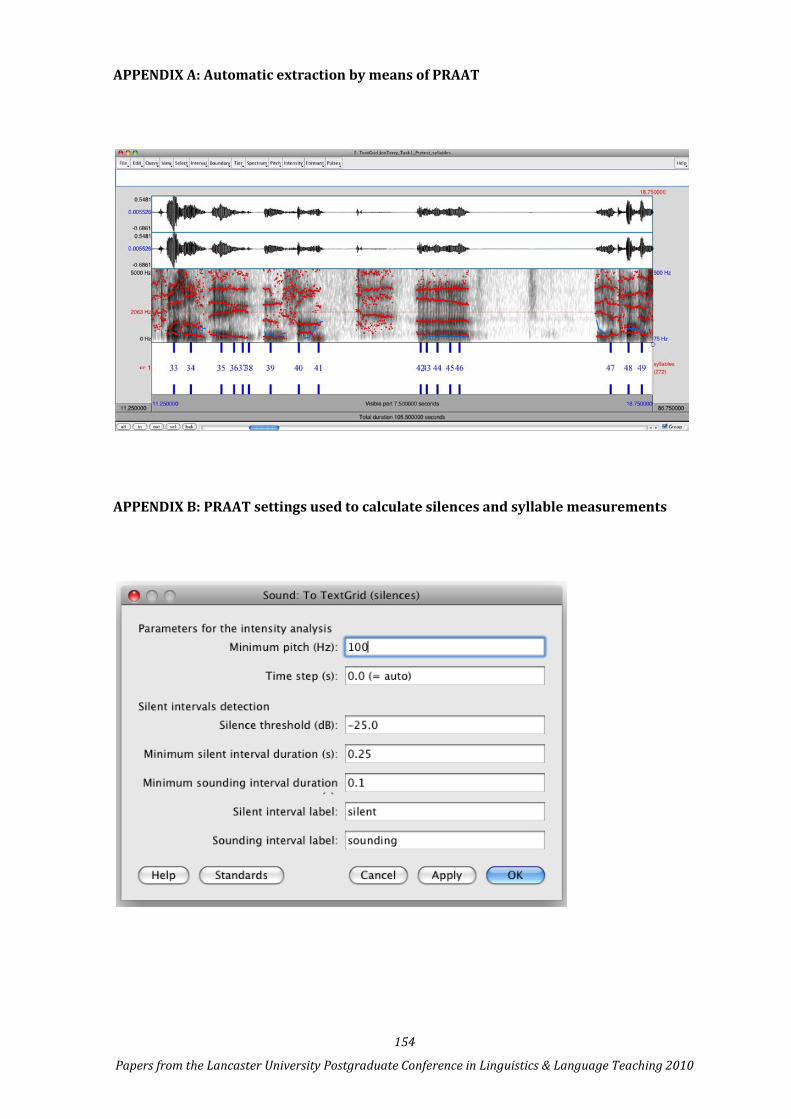
APPENDIX A: Automatic extraction by means of PRAAT
APPENDIX B: PRAAT settings used to calculate silences and syllable measurements
Recommended