Did the Toba Volcanic Eruption of ~74k BP Produce Widespread Glaciation?
Alan Robock1, Caspar M. Ammann2, Luke Oman3, Drew Shindell4, Samuel Levis2, and Georgiy Stenchikov1
1Department of Environmental Sciences, Rutgers University, New Brunswick, New Jersey
2National Center for Atmospheric Research, Boulder, Colorado 3Department of Earth and Planetary Sciences, Johns Hopkins University, Baltimore, Maryland
4NASA Goddard Institute for Space Studies, New York City
Submitted to Journal of Geophysical Research
December, 2008
Revised March, 2009 Corresponding Author: Alan Robock Department of Environmental Sciences Rutgers University 14 College Farm Road New Brunswick, NJ 08901 Phone: 732-932-9800, x6222 Fax: 732-932-8644 E-mail: [email protected]

- 1 -
Abstract 1
It has been suggested that the Toba volcanic eruption, approximately 74 ka BP, was 2
responsible for the extended cooling period and ice sheet advance immediately following it, but 3
previous climate model simulations, using 100 times the amount of aerosols produced by the 4
1991 Mt. Pinatubo eruption, have been unable to produce such a prolonged climate response. 5
Here we conduct six additional climate model simulations with two different climate models, the 6
National Center for Atmospheric Research Community Climate System Model 3.0 (CCSM3.0) 7
and National Aeronautics and Space Administration Goddard Institute for Space Studies 8
ModelE, in two different versions, to investigate additional mechanisms that may have enhanced 9
and extended the forcing and response from such a large supervolcanic eruption. With CCSM3.0 10
we include a dynamic vegetation model to explicitly calculate the feedback of vegetation death 11
on surface fluxes in response to the large initial reduction in transmitted light, precipitation, and 12
temperature. With ModelE we explicitly calculate the effects of an eruption on stratospheric 13
water vapor and model stratospheric chemistry feedbacks that might delay the conversion of SO2 14
into sulfate aerosols and prolong the lifetime and radiative forcing of the stratospheric aerosol 15
cloud. To span the uncertainty in the amount of stratospheric injection of SO2, with CCSM3.0 16
we used 100 times the Pinatubo injection, and with ModelE we used 33, 100, 300, and 900 times 17
the Pinatubo injection without interactive chemistry, and 300 times Pinatubo with interactive 18
chemistry. Starting from a roughly present day seasonal cycle of insolation, CO2 concentration, 19
and vegetation, or with 6k BP conditions for CCSM3.0, none of the runs initiates glaciation. The 20
CCSM3.0 run produced a maximum global cooling of 10 K and ModelE runs produced 8-17 K 21
of cooling within the first years of the simulation, depending on the injection, but in all cases, the 22
climate recovers over a few decades. Nevertheless, the “volcanic winter” following a 23

- 2 -
supervolcano eruption of the size of Toba today would have devastating consequences for 24
humanity and global ecosystems. These simulations support the theory that the Toba eruption 25
indeed may have contributed to a genetic bottleneck. 26
27

- 3 -
1. Introduction 28
The eruption of the Toba volcano (2.5°N, 99°E) on the island of Sumatra in Indonesia 29
(Figure 1) was the largest explosive event of at least the past 100,000 years [Zielinski, 1996; 30
Oppenheimer, 2002; Self and Blake, 2008]. The erupted volume in dense rock equivalent 31
material (~2800 km3) was about three orders of magnitude larger than for the 1980 eruption of 32
Mount St. Helens. Zielinski et al. [1996] estimate that the eruption was 71,000 years ago ± 5000 33
years, based on ice-core dating. Oppenheimer [2002] reviewed nine different estimates over a 34
wide range, and concluded that the eruption was 74,000 ± 2000 years ago. For the purposes of 35
this paper, the exact date does not matter, and we assume that Zielinski is looking at the Toba 36
signal. 37
Zielinski et al. [1996] showed ice core evidence for a 1000-year cool period with low 38
δ18O and increased dust deposition immediately following the eruption. In the South China Sea, 39
in the immediate vicinity of the eruption, Huang et al. [2001] found corroborating evidence for a 40
tropical cooling that lasted for 1000 years following the eruption. However, Schultz et al. [2002] 41
analyzed Indian Ocean sediments just before and just after the Toba deposits and find no 42
evidence for large climate change in the Indian monsoon system on the 100-1000 yr time scale. 43
Oppenheimer [2002] claimed that the cooling was only about 1 K, but based his analysis on 44
simplistic T-forcing relationships. We know of no observational evidence for climate change on 45
the annual to decadal time scale, so there certainly could have been a very large, short-lived 46
response to the eruption. 47
Rampino and Self [1992, 1993] and Zielinski et al. [1996] suggested that the 1000-year 48
cool period (stadial) following the eruption could have been caused by the eruption. For this to 49
have happened, the forcing from the volcanic aerosols would have had to last for a long time, 50
- 4 -
feedbacks must have amplified or lengthened the stratospheric forcing, or the climate system 51
would have had to have been at a tipping point, and a “little” nudge from a short-term, but large, 52
reduction in shortwave forcing would have been enough to push it into the stadial. An 53
intermediate-complexity climate model simulation by Li and Berger [1997], however, did not 54
produce an ice age following a Toba-like perturbation. In the only general circulation model 55
(GCM) simulation of the response to Toba so far, Jones et al. [2005] calculated the climate 56
response to a stratospheric loading 100 times that of the 1991 Mount Pinatubo, but with the same 57
timing as that of the Pinatubo eruption. They found a very large climate system response, with a 58
maximum global-average cooling of 10 K. But the climate system started to warm back up in a 59
few years, and the cooling was only about 2 K after a decade with no indication of the initiation 60
of an ice age. Here we examine three additional factors that may have served to produce 61
conditions favorable for sustained glacial conditions, with three different GCM experiments. 62
(Harris [2008] reported preliminary results for Toba experiments with the same GCM as Jones 63
et al. [2005], but with a slab ocean. The results were similar.) 64
Typically, for smaller eruptions, the e-folding time for stratospheric residence of volcanic 65
sulfate aerosols is about one year [Robock, 2000]. Rampino and Self [1992] suggested that the 66
normal amount of water vapor in the stratosphere might limit the formation of sulfate aerosols 67
after extreme injections, and although they understood that Toba would have injected a large 68
quantity of water into the stratosphere, they assume that only 10% of the SO2 injected by Toba 69
would convert to particles. Bekki et al. [1996] used a simple model of this phenomenon to 70
suggest that the forcing from Toba might have lasted for a decade. However, the volcanic sulfate 71
deposition from the Toba eruption found by Zielinski et al. [1996] in the Greenland ice cap only 72

- 5 -
lasted about six years. To help answer this question we examine the water vapor response in the 73
stratosphere. 74
Another feedback avenue is that the cold and dark conditions after the Toba eruption 75
might have killed much of the vegetation on the planet, which in most parts of the world would 76
have produced a higher surface albedo, which could have then led to further cooling. We 77
examine this hypothesis with a GCM containing a coupled dynamic vegetation model that 78
includes this feedback. 79
It is the SO2 injections into the stratosphere from volcanic eruptions that causes climate 80
change, as the resulting sulfate aerosol particles remain for a few years, blocking out solar 81
radiation and cooling the surface [Robock, 2000]. Jones et al. [2005] assumed that the SO2 82
emission from Toba was 100 times that of Pinatubo, but other estimates put it closer to 300 times 83
Pinatubo [Bekki et al., 1996; Oppenheimer, 2002]. Would such a larger volcanic forcing have 84
been more likely to produce an ice age? To answer this question, we ran a GCM with a range of 85
forcings: 33, 100, 300, and 900 times the Pinatubo forcing. 86
The Toba eruption certainly must have had significant impacts on stratospheric 87
chemistry, which may have affected ozone and other gases, with a chemical feedback to prolong 88
or enhance the forcing. To test this hypothesis, we also conducted an experiment with a model 89
that includes these chemistry feedbacks, using the most likely scenario, 300 times Pinatubo. 90
All but one of our experiments were conducted from initial conditions representing 91
current Milankovitch orbital configuration, current vegetation, and current greenhouse gas 92
concentrations. Rampino and Self [1992, 1993] showed that the long-term trend of insolation at 93
65°N in July was declining during the period of the Toba eruption, indicating that solar forcing 94
- 6 -
was pushing the Earth toward glacial conditions. CO2 concentration was about 230 ppm, only 95
60% of current concentrations. 96
An additional mechanism, not considered here, is the increase in surface albedo that 97
would be caused by the ash blanket from a supereruption that would cover the land near the 98
eruption. Jones et al. [2007] used a GCM to show that while an ash blanket deposited over 99
North America from a Yellowstone eruption would have large local effects, it would only have a 100
0.1 K global average cooling. Their experimental design, which ignored the potential 101
moderating effect of a stratospheric aerosol cloud or vegetation growth on the ash, results in an 102
upper bound on the ash effect. For Toba, much of the ash fell in the Indian Ocean, so we expect 103
this effect to have also been small for Toba. 104
Clearly, a volcanic eruption is not required to produce a glaciation, so it is obvious that if 105
the climate system was poised to cool dramatically anyway, a slight nudge could have sped it 106
along. With lower CO2 concentrations, different solar activity, or even different vegetation 107
patterns producing a different planetary albedo [Sagan et al., 1979], the sensitivity of the climate 108
system to massive radiative forcing might have been higher and maybe more prone to switch. 109
Such experiments remain to be done, so we interpret the experiments presented here as 110
answering the question of whether a Toba-like eruption could produce an ice age today, and the 111
answer is “no.” 112
2. Climate models and experiments 113
We conducted six GCM experiments, using the National Aeronautics and Space 114
Administration Goddard Institute for Space Studies ModelE, in two different configurations, and 115
the National Center for Atmospheric Research Community Climate System Model 3.0 116

- 7 -
(CCSM3.0). We describe each of the models and the experiments here, and the results in the 117
next section. 118
We used CCSM3.0 [Collins et al., 2006; Kiehl et al., 2006] at T31 resolution with 119
atmospheric and land surface resolution of 2.8° by 2.8° for physics calculations, with the 120
standard 26 levels in the vertical topping out at about 36 km. The ocean as well as the 121
dynamic/thermodynamic sea ice model were run at a resolution of roughly 1° with 40 levels in 122
the vertical in the ocean. The land component, the Community Land Model (CLM) 3.0 123
[Dickinson et al., 2006], was coupled to a dynamic vegetation model to produce the Community 124
Land Model-Dynamic Global Vegetation Model (CLM-DGVM) [Levis et al., 2004], to evaluate 125
whether the vegetation response to the large forcing acts as a feedback. The simulated 126
vegetation represents a potential vegetation that is consistent with the climate. The CLM-127
DGVM grows plants and simulates vegetation cover and leaf area index to enable two-way 128
coupling between the atmosphere and vegetation. Plant community composition and ecosystem 129
structure are updated annually in response to the establishment of new plants, resource 130
competition, growth, mortality, and fire, and therefore respond to the integrated conditions 131
experienced during a year. Leaf phenology (the seasonal emergence and senescence of leaves) 132
updates leaf area index daily in response to air temperature or soil water. The CCSM3.0 133
simulation was forced with the Pinatubo SO2 history, but scaled up by a factor of 100, the same 134
as Jones et al. [2005], by prescribing the aerosol amounts. We started the model with a balanced 135
climate with forcing from 6000 years BP, but with current CO2 for the vegetation. (This 136
mismatch was not intentional, but should make no difference in the results, as the Toba forcing is 137
so large. In this run, the Northern Hemisphere summer solar forcing was a little higher than 138
present and CO2 was lower.) 139
- 8 -
To investigate the effect of the size of the volcanic forcing on the broader climate system, 140
we ran the stratospheric version of the ModelE climate model with 4° latitude by 5° longitude 141
horizontal resolution and 23 levels in the vertical up to 80 km [Schmidt et al., 2006]. It was fully 142
coupled to a 4° latitude by 5° longitude dynamic ocean with 13 levels in the vertical [Russell et 143
al., 1995]. It is important to use a full dynamic ocean in these simulations, as was done by Jones 144
et al. [2005] and in all our simulations, to obtain the most realistic climate response to such a 145
large forcing. This model is connected to an aerosol module [Koch et al., 2006] that accounts for 146
SO2 conversion to sulfate aerosols, though with fixed oxidant amounts, and transport and 147
removal of the aerosols. The radiative forcing from the aerosols is fully interactive with the 148
atmospheric circulation. This climate model has been tested extensively in global warming 149
experiments [Hansen et al., 2005; Schmidt et al., 2006] and to examine the effects of volcanic 150
eruptions on climate [Shindell et al., 2004; Oman et al., 2005, 2006a, 2006b], nuclear winter 151
[Robock et al., 2007a, 2007b], and geoengineering [Robock et al., 2008]. The 1991 Pinatubo 152
eruption put 20 Tg of SO2 into the stratosphere, and we forced the model with a range of 153
injection amounts, 33, 100, 300, and 900 times the Pinatubo amount, ran the model each time for 154
10 years, and compared the results to a long control run with no volcanic forcing. 155
For the 300 times Pinatubo run, we input 6 Gt of SO2, based on Bekki et al. [1996], over a 156
7 day period. These were put into the model in the grid box containing 2°N, 100°E evenly over 157
the altitude range 24-32 km. All the ModelE experiments were forced with the same time and 158
space distributions of SO2, but with different amounts. It is possible that the Toba injection was 159
higher, but the higher the injection the lower the atmospheric density and the faster the fall speed 160
of the particles, so, as long as the injection is into the lower stratosphere, the exact altitude range 161
would only have a small impact on the cloud lifetime. 162
- 9 -
A second experiment was conducted with ModelE to investigate the effects of 163
stratospheric chemistry. We used the same ModelE atmospheric configuration, but stratospheric 164
interactive atmospheric chemistry was included [Shindell et al., 2006] to see if this would 165
substantially modify the results. The atmospheric chemistry model extends from the surface to 166
the mesosphere, and is fully coupled to the aerosol model, so that oxidant changes affect sulfate 167
and sulfate affects heterogeneous chemistry. The use of prognostic hydroxyl radical (OH), rather 168
than fixed concentrations, allows it to be depleted, slowing the conversion of SO2 to sulfate 169
aerosol. Changes in stratospheric ozone will cause a radiative forcing directly, and will also alter 170
the radiative flux reaching the troposphere with potential impacts on the lifetime of many gases 171
there including methane, another potent greenhouse gas. This run used a different ocean GCM, 172
the HYCOM model [Sun and Bleck, 2006]. The model was forced with 300 times the Pinatubo 173
emission and, as above, the volcanic eruption is simulated by injecting sulfur dioxide into the 174
model. 175
3. Results 176
The dynamic vegetation model results with the NCAR climate model are shown in Fig. 2. 177
Using the scaled-up Pinatubo mass, the volcanic forcing lasted for less than four years, and the 178
climate response was almost identical with Jones et al. [2005], with a maximum global-average 179
cooling of 10 K and a cooling of about 2 K after a decade, followed by a relatively quick 180
recovery with no indication of the initiation of large ice sheets. Global average precipitation 181
declined by about 45% for several years and then recovered like the temperature. This appears 182
to be a robust result, as it came from a completely different climate model, but with the same 183
forcing. The coupled vegetation feedback appears to have had little large-scale effect, although 184
we cannot rule out some influence (we have not performed a simulation with fixed vegetation). 185
- 10 -
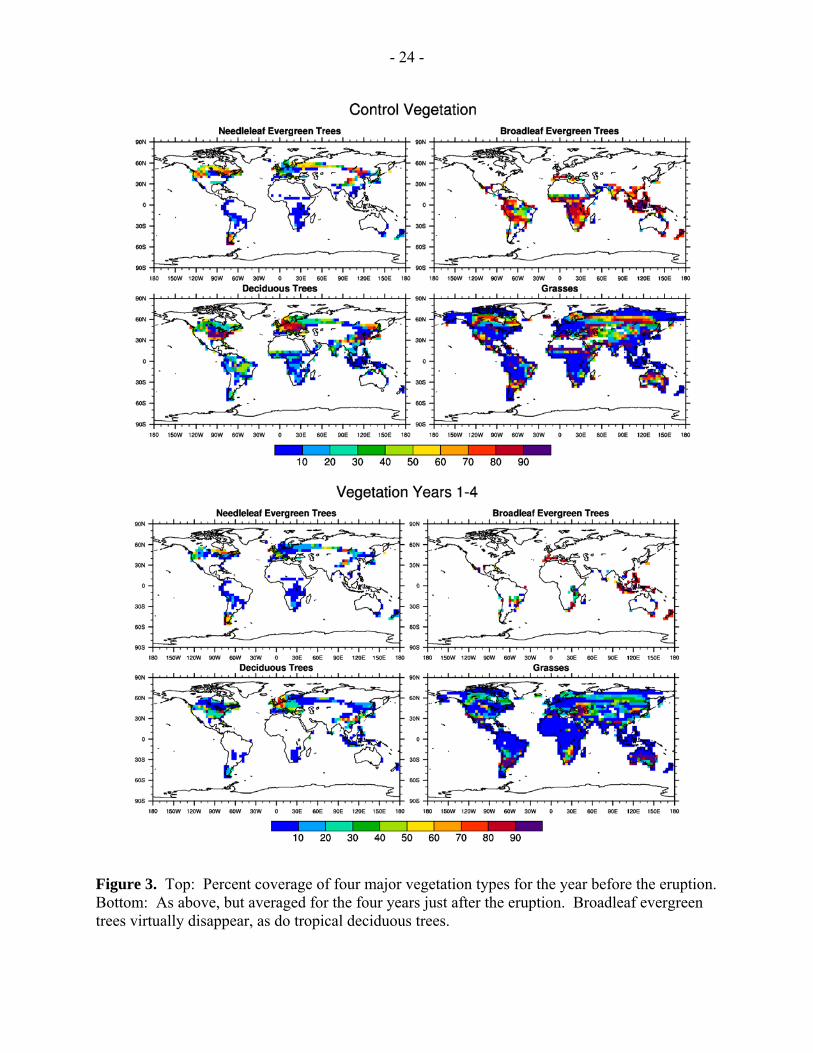
The vegetation distribution did change dramatically as a result of the reduction of sunlight and 186
the following cooling and precipitation reduction induced by the large aerosol cloud (Fig. 3). 187
Broadleaf evergreen trees virtually disappear, as do tropical deciduous trees, with midlatitude 188
deciduous trees also reduced. These trees gradually reappear with warming in the following 189
decades. However, the effect of this vegetation change on climate seems minimal. In retrospect, 190
this result is not that surprising. Amazon deforestation experiments have shown that while 191
removing trees and replacing them with grasses does increase the surface albedo, which would 192
cool the surface, it also increases the Bowen ratio, which would warm the surface, as more 193
radiation goes into heating the surface than into evapotranspiration [e.g., Zhang et al., 1996]. 194
The response we found here is similar. 195
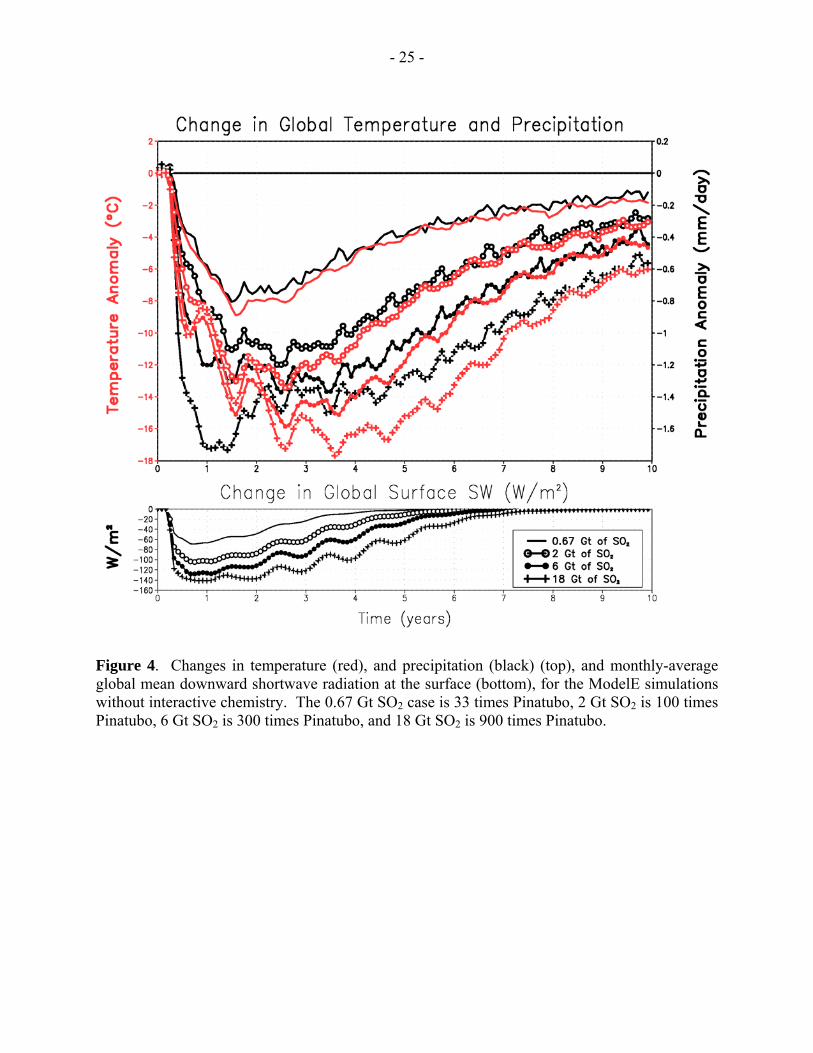
When we forced ModelE with 33, 100, 300, and 900 times the Pinatubo SO2, we got a 196
radiative forcing that lasted for 4-7 years (Figs. 4, 5). We consider 300 times Pinatubo (6 Gt 197
SO2) the most likely amount, and so analyze that case in more detail. With the SO2 injected into 198
the equatorial stratosphere, the resulting sulfate aerosols are transported poleward and then 199
gradually removed from the system, but produce a huge optical depth (Fig. 5) and global average 200
change in downward shortwave radiation stronger than -100 W m-2 for a couple years (Fig. 4). 201
The atmospheric residence time of these aerosols, as calculated by our model, agrees very well 202
with the length of time of the deposition observed in ice cores [Zielinski et al., 1996]. Global 203
cooling for the four runs ranges from 8 to 17 K, with the larger forcing also producing a slightly 204
longer cooling. But the response is quite non-linear. After virtually all the sunlight is reflected, 205
additional aerosols have a small effect. For the 300 times Pinatubo case, the maximum cooling 206
is 15 K for three years after the eruption and then reduces to 5 K after a decade. No matter what 207
the amount of SO2, there is no evidence for ice age initiation. Although snow persists for several 208

- 11 -
summers in the midlatitudes of the Northern Hemisphere, it melts as the aerosols leave the 209
atmosphere and full insolation returns. Figure 4 also shows that global average precipitation is 210
reduced by 30-60% for several years, and this, along with the dark conditions, would also have a 211
strong impact on vegetation. 212
Because of the large stratospheric heating from the volcanic aerosols, mainly from 213
absorption of upwelling longwave radiation from the troposphere, the tropical tropopause cold 214
trap is warmed substantially, resulting in huge increases in stratospheric water vapor (Fig. 6). 215
Thus the idea of Rampino and Self [1992] and Bekki et al. [1996] that the volcanic SO2 would 216
linger, having used up all the stratospheric water vapor initially, is not supported by this 217
experiment that actually models the phenomenon with a climate model that can simulate the 218
processes. 219
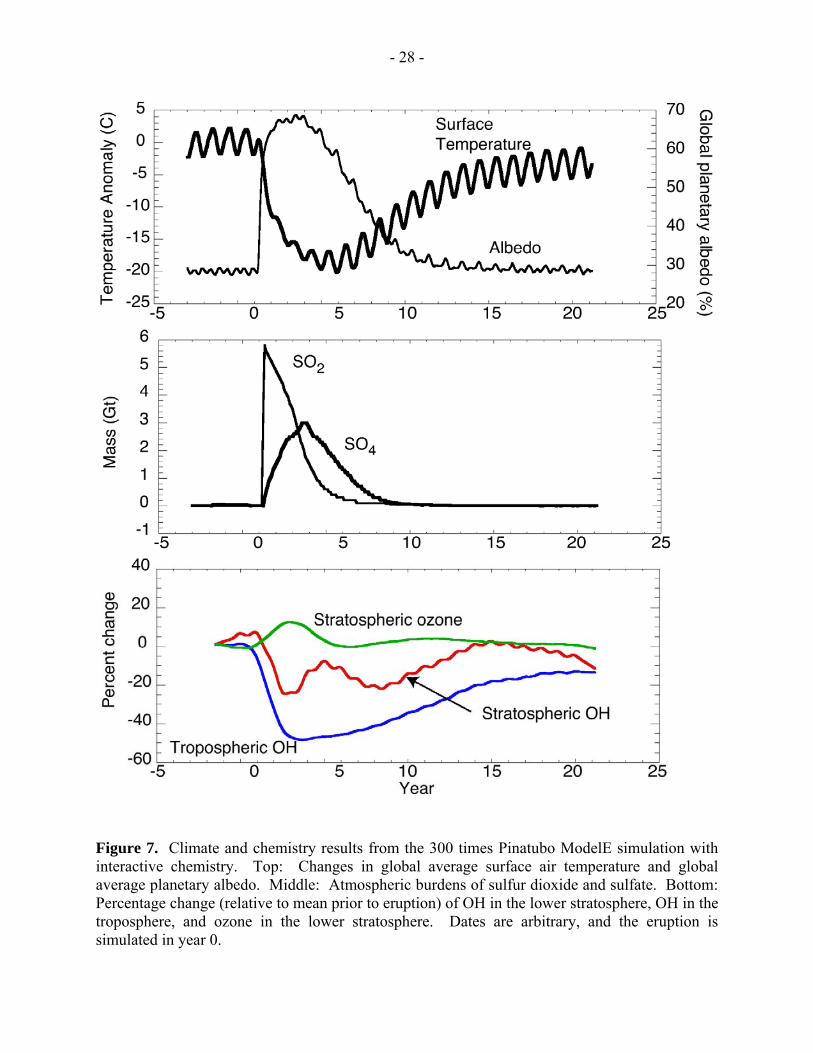
When we simulate 300 times the Pinatubo SO2 with a model with full atmospheric 220
chemistry, we find a larger and more long-lasting response than without the interactive 221
chemistry, but still no evidence of ice age initiation (Fig. 7). The maximum cooling is about 18 222
K. The details of the conversion from SO2 to sulfate show that inclusion of interactive chemistry 223
causes the peak sulfate loading to occur about two years later then in the fixed OH simulation. 224
The peak sulfate loading is less than the fixed OH simulation but its distribution in time is much 225
broader (i.e., longer lasting) causing a slightly larger and longer lasting cooling. For example, 226
cooling greater than 10 K persists for about 6 years in the fixed OH simulation (Figure 4) but 227
lasts for ~11 years in the interactive chemistry experiment. Stratospheric ozone increases 228
modestly following the eruption, as the reduction in reactive hydrogen oxides that can 229
catalytically destroy ozone more than offsets additional losses following reactions on sulfate 230
aerosol surfaces. Hence stratospheric ozone changes contribute a relative small positive forcing 231

- 12 -
rather than amplifying the volcanic cooling. Tropospheric OH is reduced as the solar flux 232
reaching the troposphere is dramatically decreased by the volcanic aerosol layer. This causes a 233
substantial change to the oxidation rate of many species in the troposphere, including methane. 234
However, the reduced oxidation capacity does not last long enough to lead to large changes in 235
tropospheric methane, though it does increase modestly, providing an additional warming 236
chemical response. 237
4. Discussion and conclusions 238
We have not been able to show that a Toba-like eruption could produce a glacial advance, 239
given the current distribution of solar radiation and current CO2 or similar radiation and lower 240
CO2. But a Toba-like eruption could certainly produce a decade-long volcanic winter, with 241
serious effects on plant and animal life. 242
Joshi and Shine [2003] describe how volcanic eruptions warm the tropical tropopause, 243
resulting in additional water vapor injected into the lower stratosphere. For eruptions the size of 244
the 1991 Pinatubo eruption, they suggest that the additional water vapor produces a positive 245
radiative forcing of about 0.1 W m-2, slightly counteracting the cooling from the eruption. This 246
feedback is incorporated in the simulations here, and in spite of the additional water vapor, a 247
very large eruption would still produce very large cooling. In addition, we have shown that, with 248
a model including chemistry, the stratospheric forcing and response is prolonged for a couple 249
years for a 300 times Pinatubo injection, but water vapor is not a limiting factor. 250
Ambrose [1998] and Rampino and Ambrose [2000] suggested that the human race 251
narrowly passed through a population bottleneck at some time around this eruption, possibly 252
enhanced by the 1000-year cold period following the Toba eruption. While our results show that 253
indeed the eruption could have produced great stress on humans and their environment, it would 254
- 13 -
have been quite concentrated in the few very dark, cold, and dry years immediately following the 255
eruption. We find no evidence that the 1000-year cold period seen in Greenland ice core records 256
was directly generated by the Toba eruption, although the temporal inference shown by Zielinski 257
et al. [1996] is certainly quite intuitive. Gradual global cooling of a few degrees would have 258
provided enough time for population migrations, but the effects of a sudden winter would not. In 259
the past our species survived many glacial advances and retreats, but it is probable that the 260
sudden dark, cold, and dry conditions that followed the supereruption of Toba about 74,000 261
years ago could have largely destroyed the food supplies of humans and therefore caused a 262
significant reduction in population sizes. Obviously, some human populations survived the 263
climate changes, and Petraglia et al. [2007] found evidence in one location in India for human 264
presence both before and after the Toba eruption. Louys [2007] actually found extinctions of 265
several species at four different southeast Asia locations following the Toba eruption, but most 266
species reappeared at those locations following the eruption. 267
Gathorne-Hardy and Harcourt-Smith [2003] found no evidence for a human bottleneck, 268
but absence of evidence is not evidence of absence. Furthermore, they used estimates of climate 269
change after the eruption smaller than found by us and Jones et al. [2005]. Ambrose [2003] 270
convincingly refuted the arguments of Gathorne-Hardy and Harcourt-Smith [2003], and showed 271
that a large “volcanic winter,” followed by a 1000-year period of cool temperatures, could have 272
produced the bottleneck. In fact the results of Jones et al. [2005] and the results presented here 273
show that the volcanic winter would have been colder and longer-lasting than Ambrose assumed, 274
which strengthens his argument. 275
276
277
- 14 -
Acknowledgments. We thank two anonymous reviewers and Stephen Self for valuable 278
suggestions, and Greg Faluvegi for scientific programming support at GISS. This work is 279
supported by NASA grant NNG05GB06G and NSF grants ATM-0313592, ATM-0351280, and 280
ATM-0730452. Model development and computer time at GISS are supported by NASA 281
climate modeling and atmospheric chemistry modeling grants. The National Center for 282
Atmospheric Research is supported by the National Science Foundation. 283
284

- 15 -
References 285
Ambrose, S. H. (1998), Late Pleistocene human population bottlenecks, volcanic winter, and 286
differentiation of modern humans, J. Human Evolution, 34, 623-651. 287
Ambrose, S. H. (2003), Did the super-eruption of Toba cause a human population bottleneck? 288
Reply to Gathorne-Hardy and Harcourt-Smith, J. Human Evolution, 45, 231-237. 289
Bekki, S., J. A. Pyle, W. Zhong, R. Toumi, J. D. Haigh, and D. M. Pyle (1996), The role of 290
microphysical and chemical processes in prolonging the climate forcing of the Toba eruption, 291
Geophys. Res. Lett., 23, 2669-2672. 292
Collins, W. D., et al. (2006), The Community Climate System Model version 3 (CCSM3), J. 293
Climate, 19, 2122-2143. 294
Dickinson, R. E., K. W. Oleson, G. B. Bonan, F. Hoffman, P. Thorton, M. Vertenstein, Z.-L. 295
Yang, and X. Zeng (2006), The Community Land Model and its climate statistics as a 296
component of the Community Climate System Model, J. Climate, 19, 2302-2324. 297
Gathorne-Hardy F. J., and W. E. H. Harcourt-Smith (2003), The super-eruption of Toba, did it 298
cause a human bottleneck?, J. Human Evolution, 45, 227-230. 299
Hansen, J., et al. (2005), Efficacy of climate forcings, J. Geophys. Res., 110, D18104, doi: 300
10.1029/2005JD005776. 301
Harris, B. (2008), The potential impact of super-volcanic eruptions on the Earth’s atmosphere, 302
Weather, 63(8), 221-225, doi:10.1002/wea.263. 303
Huang, C.-Y., M. Zhao, C.-C. Wang, and G. Wei (2001), Cooling of the South China Sea by the 304
Toba eruption and correlation with other climate proxies ~71,000 years ago, Geophys. Res. 305
Lett., 28, 3915-3918. 306
- 16 -
Jones, G. S., J. Gregory, P. Stott, S. Tett, and R. Thorp (2005), An AOGCM simulation of the 307
climate response to a volcanic super-eruption. Clim. Dyn., 25, 725-738. 308
Jones, M, T., Sparks, R. S. J., and P. J. Valdes (2007), The climatic impact of supervolcanic ash 309
blankets, Clim. Dyn., 29, 553-564, doi:10.1007/s00382-007-0248-7. 310
Joshi, M. M., and K. P. Shine (2003), A GCM study of volcanic eruptions as a cause of increased 311
stratospheric water vapor, J. Climate, 16, 3525-3534. 312
Kiehl, J. T., C. A. Shields, J. J. Hack, and W. D. Collins, (2006), The climate sensitivity of the 313
Community Climate System Model Version 3 (CCSM3), J. Climate, 19, 2584-2596. 314
Koch, D., G. A. Schmidt, and C. V. Field (2006), Sulfur, sea salt, and radionuclide aerosols in 315
GISS ModelE, J. Geophys. Res., 111, D06206, doi:10.1029/2004JD005550. 316
Levis S., G. B. Bonan, M. Vertenstein, and K. W. Oleson (2004), The Community Land Model’s 317
dynamic global vegetation model (CLM-DGVM): Technical description and user’s guide. 318
NCAR Tech. Note TN-459+IA, National Center for Atmospheric Research, Boulder, 319
Colorado, 50 pp. 320
Li, X. S., and A. Berger (1997), Simulating climatic impact of the Toba eruption with the LLN 321
2-D climate model, Sci. Report 1997/14, Institut d’Astronomie et de Géophysique G. 322
Lemaitre, Université catholique de Louvain, Louvain-la-Neuve, Belgium. 323
Louys, J. (2007), Limited effect of the Quaternary’s largest super-eruption (Toba) on land 324
mammals from Southeast Asia, Quaternary Sci. Rev., 26, 3108-3117. 325
Oman, L., A. Robock, G. Stenchikov, G. A. Schmidt, and R. Ruedy (2005), Climatic response to 326
high latitude volcanic eruptions, J. Geophys. Res., 110, D13103, doi:10.1029/2004JD005487. 327

- 17 -
Oman, L., A. Robock, G. L. Stenchikov, and T. Thordarson (2006a), High-latitude eruptions cast 328
shadow over the African monsoon and the flow of the Nile, Geophys. Res. Lett., 33, L18711, 329
doi:10.1029/2006GL027665. 330
Oman, L., A. Robock, G. Stenchikov, T. Thordarson, D. Koch, D. Shindell and C. Gao (2006b), 331
Modeling the distribution of the volcanic aerosol cloud from the 1783-1784 Laki eruption, J. 332
Geophys. Res., 111, D12209, doi:10.1029/2005JD006899. 333
Oppenheimer, C. (2002), Limited global change due to the largest known Quaternary eruption, 334
Toba ≈74 kyr BP? Quaternary Sci. Rev., 21, 1593-1609. 335
Petraglia, M., et al. (2007), Middle Paleolithic assemblages from the Indian subcontinent before 336
and after the Toba super-eruption, Science, 317, 114-116, doi:10.1126/science.1141564. 337
Rampino, M. R., and S. H. Ambrose (2000), Volcanic winter in the Garden of Eden: The Toba 338
super-eruption and the Late Pleistocene human population crash, in Volcanic Hazards and 339
Disasters in Human Antiquity, F. W. McCoy and G. Heiken, Eds., Geological Society of 340
America Special Paper 345, pp. 71-82. 341
Rampino, M. R., and S. Self (1992), Volcanic winter and accelerated glaciation following the 342
Toba super-eruption, Nature, 359, 50-52. 343
Rampino, M. R., and S. Self (1993), Climate-volcanism feedback and the Toba eruption of 344
74,000 years ago, Quat. Res., 40, 269-280. 345
Robock, A. (2000), Volcanic eruptions and climate, Rev. Geophys., 38, 191-219. 346
Robock, A., L. Oman, G. L. Stenchikov, O. B. Toon, C. Bardeen, and R. P. Turco (2007a), 347
Climatic consequences of regional nuclear conflicts, Atm. Chem. Phys., 7, 2003-2012. 348

- 18 -
Robock, A., L. Oman, and G. L. Stenchikov (2007b), Nuclear winter revisited with a modern 349
climate model and current nuclear arsenals: Still catastrophic consequences, J. Geophys. 350
Res., 112, D13107, doi:10.1029/2006JD008235. 351
Robock, A., L. Oman, and G. Stenchikov (2008), Regional climate responses to geoengineering 352
with tropical and Arctic SO2 injections, J. Geophys. Res., 113, D16101, doi:10.1029/ 353
2008JD010050. 354
Russell, G. L., J. R. Miller, and D. Rind (1995), A coupled atmosphere-ocean model for transient 355
climate change, Atmos.-Ocean, 33, 683-730. 356
Sagan, C., O. B. Toon, and J. B. Pollack, (1979), Anthropogenic albedo changes and the Earth’s 357
climate, Science, 206, 1363-1368, doi:10.1126/science.206.4425.1363. 358
Schmidt, G. A., et al. (2006), Present day atmospheric simulations using GISS ModelE: 359
Comparison to in-situ, satellite and reanalysis data, J. Climate, 19, 153-192. 360
Schulz H., K.-C. Emeis, H. Erlenkeuser, U. von Rad, and C. Rolf (2002), The Toba volcanic 361
event and interstadial/stadial climates at the marine isotopic stage 5 to 4 transition in the 362
Northern Indian Ocean, Quat. Res., 57, 22-31. 363
Self, S., and S. Blake (2008), Consequences of explosive supereruptions, Elements, 4, 41-46, 364
doi:10.2113/gselements.4.1.41. 365
Shindell, D. T., G. Faluvegi, N. Unger, E. Aguilar, G. A. Schmidt, D. Koch, S. E. Bauer, and R. 366
L. Miller (2006), Simulations of preindustrial, present-day, and 2100 conditions in the NASA 367
GISS composition and climate model G-PUCCINI, Atmos. Chem. Phys., 6, 4427-4459. 368
Shindell, D. T., G. A. Schmidt, M. E. Mann, and G. Faluvegi (2004), Dynamic winter climate 369
response to large tropical volcanic eruptions since 1600, J. Geophys. Res., 109, D05104, 370
doi:10.1029/2003JD004151. 371

- 19 -
Sun, S., and R. Bleck (2006), Multi-century simulations with the coupled GISS-HYCOM climate 372
model: Control experiments, Clim. Dyn., 26, 407-428. 373
Zhang, H., A. Henderson-Sellers, and K. McGuffie (1996), Impacts of tropical deforestation. 374
Part I: Process analysis of local climatic change, J. Climate, 9, 1497-1517. 375
Zielinski, G. A., P. A. Mayewski, L. D. Meeker, S. Whitlow, M. S. Twickler, and K. Taylor 376
(1996), Potential atmospheric impact of the Toba mega-eruption ~71,000 years ago, 377
Geophys. Res. Lett., 23, 837-840. 378
379

- 20 -
Figure Captions 380
Figure 1. The 1000 rupiah banknote from Indonesia showing Danau Toba (Lake Toba), the 381
lake-filled caldera left from the largest eruption of the past 100,000 years. (Some sophisticated 382
countries have volcanoes right on the money.) Also shown is a Google Earth image of the 383
caldera on the island of Sumatra. The lake is about 86 km long and 30 km wide, and has a large 384
island inside, the resurgent block of the caldera. 385
386
Figure 2. Monthly-average global-mean temperature (red), and precipitation (blue) anomalies 387
(top), and downward shortwave radiation anomalies at the surface (bottom), for the NCAR 388
CLM3.0 climate model forced with 100 times the amount of aerosol as the 1991 Mt. Pinatubo 389
eruption in the Philippines put into the stratosphere. 390
391
Figure 3. Top: Percent coverage of four major vegetation types for the year before the eruption. 392
Bottom: As above, but averaged for the four years just after the eruption. Broadleaf evergreen 393
trees virtually disappear, as do tropical deciduous trees. 394
395
Figure 4. Changes in temperature (red), and precipitation (black) (top), and monthly-average 396
global mean downward shortwave radiation at the surface (bottom), for the ModelE simulations 397
without interactive chemistry. The 0.67 Gt SO2 case is 33 times Pinatubo, 2 Gt SO2 is 100 times 398
Pinatubo, 6 Gt SO2 is 300 times Pinatubo, and 18 Gt SO2 is 900 times Pinatubo. 399
400
Figure 5. Latitudinal and seasonal distribution of optical depth in the mid-visible for the 300 401
times Pinatubo forcing used for the ModelE simulation without interactive chemistry. 402
- 21 -
403
Figure 6. Changes in monthly-average global mean specific humidity for the ModelE 300 times 404
Pinatubo simulation without interactive chemistry, showing large reductions of water vapor in 405
the cold troposphere, but huge increases in the stratosphere, as the tropical tropopause cold trap 406
is warmed by the volcanic aerosols in the lower stratosphere. 407
408
Figure 7. Climate and chemistry results from the 300 times Pinatubo ModelE simulation with 409
interactive chemistry. Top: Changes in global average surface air temperature and global 410
average planetary albedo. Middle: Atmospheric burdens of sulfur dioxide and sulfate. Bottom: 411
Percentage change (relative to mean prior to eruption) of OH in the lower stratosphere, OH in the 412
troposphere, and ozone in the lower stratosphere. Dates are arbitrary, and the eruption is 413
simulated in year 0. 414
415

- 22 -
416
417 418 Figure 1. The 1000 rupiah banknote from Indonesia showing Danau Toba (Lake Toba), the 419 lake-filled caldera left from the largest eruption of the past 100,000 years. (Some sophisticated 420 countries have volcanoes right on the money.) Also shown is a Google Earth image of the 421 caldera on the island of Sumatra. The lake is about 86 km long and 30 km wide, and has a large 422 island inside, the resurgent block of the caldera. 423
424

- 23 -
425
426 427 Figure 2. Monthly-average global-mean temperature (red), and precipitation (blue) anomalies 428 (top), and downward shortwave radiation anomalies at the surface (bottom), for the NCAR 429 CLM3.0 climate model forced with 100 times the amount of aerosol as the 1991 Mt. Pinatubo 430 eruption in the Philippines put into the stratosphere. 431 432
- 24 -
Figure 3. Top: Percent coverage of four major vegetation types for the year before the eruption. Bottom: As above, but averaged for the four years just after the eruption. Broadleaf evergreen trees virtually disappear, as do tropical deciduous trees.
- 25 -
Figure 4. Changes in temperature (red), and precipitation (black) (top), and monthly-average global mean downward shortwave radiation at the surface (bottom), for the ModelE simulations without interactive chemistry. The 0.67 Gt SO2 case is 33 times Pinatubo, 2 Gt SO2 is 100 times Pinatubo, 6 Gt SO2 is 300 times Pinatubo, and 18 Gt SO2 is 900 times Pinatubo.

- 26 -
Figure 5. Latitudinal and seasonal distribution of optical depth in the mid-visible for the 300 times Pinatubo forcing used for the ModelE simulation without interactive chemistry.

- 27 -
Figure 6. Changes in monthly-average global mean specific humidity for the ModelE 300 times Pinatubo simulation without interactive chemistry, showing large reductions of water vapor in the cold troposphere, but huge increases in the stratosphere, as the tropical tropopause cold trap is warmed by the volcanic aerosols in the lower stratosphere.
- 28 -
Figure 7. Climate and chemistry results from the 300 times Pinatubo ModelE simulation with interactive chemistry. Top: Changes in global average surface air temperature and global average planetary albedo. Middle: Atmospheric burdens of sulfur dioxide and sulfate. Bottom: Percentage change (relative to mean prior to eruption) of OH in the lower stratosphere, OH in the troposphere, and ozone in the lower stratosphere. Dates are arbitrary, and the eruption is simulated in year 0.
Recommended