DISCUSSION PAPER SERIES
IZA DP No. 11890
Damian ClarkeHanna Mühlrad
Abortion Laws and Women’s Health
OCTOBER 2018

Any opinions expressed in this paper are those of the author(s) and not those of IZA. Research published in this series may include views on policy, but IZA takes no institutional policy positions. The IZA research network is committed to the IZA Guiding Principles of Research Integrity.The IZA Institute of Labor Economics is an independent economic research institute that conducts research in labor economics and offers evidence-based policy advice on labor market issues. Supported by the Deutsche Post Foundation, IZA runs the world’s largest network of economists, whose research aims to provide answers to the global labor market challenges of our time. Our key objective is to build bridges between academic research, policymakers and society.IZA Discussion Papers often represent preliminary work and are circulated to encourage discussion. Citation of such a paper should account for its provisional character. A revised version may be available directly from the author.
Schaumburg-Lippe-Straße 5–953113 Bonn, Germany
Phone: +49-228-3894-0Email: [email protected] www.iza.org
IZA – Institute of Labor Economics
DISCUSSION PAPER SERIES
IZA DP No. 11890
Abortion Laws and Women’s Health
OCTOBER 2018
Damian ClarkeUniversidad de Santiago de Chile and IZA
Hanna MühlradLund University

ABSTRACT
IZA DP No. 11890 OCTOBER 2018
Abortion Laws and Women’s Health*
We examine the impact of progressive and regressive abortion legislation on women’s
health and survival in Mexico. Following a 2007 reform in the Federal District of Mexico
which decriminalised and subsidised early-term elective abortion, multiple other Mexican
states increased sanctions on illegal abortion. We observe that the original progressive
policy resulted in a sharp decline in maternal morbidity, particularly maternal morbidity due
to haemorrhage early in pregnancy. We observe small or null impacts on women’s health
from increasing sanctions on illegal abortion. We find some evidence to suggest that these
impacts were also observed when considering maternal mortality, though effects are less
precisely estimated.
JEL Classification: I18, J13, K38, H75
Keywords: abortion, maternal morbidity, maternal mortality, political economy, legislative reform
Corresponding author:Damian ClarkeUniversidad de Santiago de ChileAv. Libertador Bernardo O’Higgins 3363Estación CentralSantiago de ChileChile
E-mail: [email protected]
* We thank Blair G. Darney, Hans Grönqvist, Randi Hjalmarsson, Lakshmi Iyer, Elin Larsson Andreea Mitrut, Carol
Propper and seminar audiences at IPAS Mexico, The LACEA Health Economics Network, University of Gothenburg,
SOFI Stockholm University, Karolinska Institute and CSAE Oxford. We thank Raffaela Schiavon for detailed discussions
regarding the practical implementation of Mexico D.F.’s ILE reform. We are also grateful to Natalia Volkow at INEGI
for providing access to disaggregated hospitalisation data, Alejandro del Valle for sharing data, and Cristhian Molina
for excellent research assistance. Clarke acknowledges the generous support of FONDECYT grant number 11160200
from the Government of Chile.

1 Introduction
Appeals to women’s health are frequently made when debating the merits of abortion legislation. These
calls are made by both advocates of legal abortion, as well as those advocating for abortion to become, or
remain, illegal. Such appeals are commonly made by so-called “pro-life” and “pro-choice” organizations,
citing academic literature in support of their positions. The arguments backing up such claims are drawn
from a range of sources, which are often correlational or based on small or non-representative samples of
women.1
In this study we present the first population-level evidence of the impact of sub-national variation in
abortion laws on maternal morbidity, as well as maternal mortality, using the universe of administrative
health records fromMexico. We focus on a period in which considerable within-country reform of abortion
policy was undertaken, with both a sweeping legalisation in the Federal District of the country (Mexico
DF), and increasing sanctions on (illegal) abortion in other regions of the country. In this context, we are
able to determine to what extent change in abortion laws, absent other major contraceptive revolutions,
impact health indicators for the population of affected women.
In particular, we examine the effect of a sharply defined local abortion reform in the Mexico DF pro-
viding free access to legal and safe abortion services. This reform, occurring in April of 2007, resulted in
a legislative backlash in other regions of the country, with 18 states following the announcement of the
reform by modifying their own constitutions or penal codes to increase the sanctions attached to suspected
abortions. The original Mexico DF reform—the so called legal interruption of pregnancy (or ILE for its
name in Spanish)—was of considerable importance. During the pre-reform period of 2001-2007 a total
of 62 legal abortions (available in restrictive conditions) were performed in Mexico DF. In the 5 years
following the 2007 reform, more than 90,000 women accessed safe legal abortion. In this paper we com-
bine the state-level variation over time resulting from legislative changes in abortion law with high-quality
vital-statistics data recording over 30 million births, 18.4 thousand maternal deaths and 46million inpatient
1The use of such arguments even when based on weak evidence is not isolated to non-governmental organisations. Similararguments are also made by politicians. One such example is a fact sheet published on the US National Cancer Institute websiteby the Bush administration positing an (unfounded) link between abortion and breast cancer (Special Investigations Division,Committee of Government Reform, House of Representatives, 2003).
2

cases for causes related to maternal health.
This environment provides a unique opportunity to examine simultaneous expansions and contractions
of abortion policies.2 While much of the existing literature on the impact of abortion—and contraceptive
policies more generally—focuses on expansions in access, there are a number of papers which focus on
contractions in policies. These include historical restrictions in Romania (Pop-Eleches, 2010), the impact
of parental consent or notification laws targeted at adolescents in the U.S. (Bitler and Zavodny, 2001;
Joyce and Kaestner, 1996), and a recent hollowing out in the availability of providers due to state-specific
legislation in the U.S. (Lu and Slusky, 2016; Fischer et al., 2017; Cunningham et al., 2017). However, the
legalisation of abortion inMexico DF and resulting spate of constitutional changes increasing the harshness
of sentencing of illegal abortion provides the opportunity to examine the impact of a contemporaneous
series of restrictive and permissive abortion policies in a single country and time.
We begin by bench-marking the reforms’ impacts on fertility. We find—in line with literature on the
fertility impacts of abortion reform in other settings documented in Table 1—that legalisation reduced birth
rates by approximately 5-6 percent. We generally observe little evidence to suggest that the posterior re-
gressive law changes had considerable impacts on fertility. In considering impacts of abortion laws on
maternal health, we implement difference-in-differences (DD), event study, and synthetic control proce-
dures based on state-level reforms. Across methodologies, we find clear evidence pointing to a reduction
in maternal morbidity following the introduction of legalised abortion. This is driven by a sharp reduction
in rates of haemorrhage early in pregnancy, which falls immediately by approximately 40%. We observe
little evidence to suggest consistently estimated statistically significant changes in morbidity following in-
creased sanctions on (illegal) abortion. In general we observe impacts on maternal mortality which agree
with those when examining maternal morbidity. However, estimates are considerably less precise, sug-
gesting that when examining only impacts of abortion law on maternal mortality, analyses fail to account
for the full weight of abortion reform on women’s health. We additionally document, using administrative
2As we discuss at more length in sections 2.3-2.4 of this paper, the change due to the ILE reform was considerably largerthan subsequent legislative tightenings. In the case of the constitutional changes issued by states, in each case abortion wasalready illegal, and any changes owe to an increased threat of prosecution or sanction. Using the universe of legal decisions inthe country, we do document evidence suggesting that these reforms increase the average length of sentences handed down towomen.
3

records from the judiciary, that Mexico’s regressive reforms did have aDe Facto impact on legal sanctions,
with the length of sentences handed down to women following these reforms increasing substantially.
This study adds to the existing literature on abortion reform (described at more length in section 2 of
this paper) by providing evidence on the effect of abortion legalization absent simultaneous changes in
other major contraceptive laws and reforms.3 And to the best of our knowledge, this is the first study
to provide well-identified population-level evidence of the impact of abortion legalization on maternal
morbidity and mortality based on within-country variation in abortion availability. While an association
between abortion legalization and lower abortion-related complications has been documented in previous
studies, comprehensively capturing the impact of the passage of abortion law on abortion-related morbidity
is a considerable challenging, especially in clandestine settings, where under-reporting may occur (Singh
et al., 2010). Maternal mortality is considered the “tip of the iceberg”, where the mass consists of maternal
morbidity (Loudon, 1992). In many settings, analyses of the impact of abortion on population health
focuses only on maternal mortality due to a lack of universal health records measuring maternal morbidity.
This paper joins a handful of studies on Mexico’s ILE reform, spread across a range of fields including
law (Johnson, 2013), public health (Contreras et al., 2011; Schiavon et al., 2012a; Becker, 2013), medicine
(Madrazo, 2009), and demography (Gutierrez-Vazquez and Parrado, 2015).4 The present paper, however is
the first to harness the full power of vital statistics data, the first to collect and combine the ILE reform with
the regressive law changes following this reform, and the first to consider how morbidity and mortality, as
well as fertility and criminal sanctions handed to women, may be affected by abortion reform in Mexico.
All in all, the paper provides strong evidence that abortion legalization in an emerging economy leads to
rapid and discernible changes in political behavior, aggregate fertility rates, and (significant improvements
in) maternal health.
3In Mexico, the country under study, contraception has been legal and freely provided by the government since a constitu-tional declaration in 1974.
4In examining the abortion reform and fertility outcomes, Gutierrez-Vazquez and Parrado (2015) use national vital statisticsto examine the effect on fertility across ages. Due to the use of a limited amount of data and limitations inherent in the empiricaldesign one cannot assign a causal interpretation to the results with confidence. More specifically, only three different years ofdata are used (1990, 2000 and 2010). In a study by Koch et al. (2015), maternal mortality is found to increase in areas with moreliberal abortion laws. This paper however, has received strong criticism for highly misleading and inaccurate data selectionDarney et al. (2017).
4

Table1:
Reviewof
Estim
ates
ofAbortion
Reformon
Fertility
Authors
Context
Reform
Outcome
Estim
ate
PanelA
:Progressive
Law
Changes
Angristand
Evans(1996)
UnitedStates
1970
abortionreform
sProbabilityof
teen
motherhood
−0.045
(0.012)for
blackwom
enand
−0.012(0.04)forw
hitewom
en.a
Ananatetal.(2007)
UnitedStates
Roe
vWade
Num
bero
fchildrenperw
oman
uptoage
39.
−0.054
(0.012).b
Ananatand
Hungerm
an(2012)
UnitedStates
Abortion
andthepill
Birthrateforw
omen
inages
14-20.
−0.0476(0.0135).c
Bailey(2009)
UnitedStates
Abortion
andthepill
Probabilityof
firstbirth
beforeage21.
Effectof
abortion:
−0.009
(0.026).
Effectofabortionandthepill:
−0.013
(0.024).d
Gruberetal.(1999)
UnitedStates
Roe
vWade
Birthrateforw
omen
15-44.
−0.059
(0.005).e
Guldi(2008)
UnitedStates
Abortion
andthepill
Birthrateforw
omen
inages
15-21.
−0.100
(0.054)for
whitewom
en−0.030
(0.048)for
nonw
hitewom
en.f
JoyceandKaestner(1996)
UnitedStates
Expansions
inMedicaid
incomeeligibility
Probabilityof
abortion.
−2to
−5%
points(significanta
tleastat
10%
level)am
ongunmarriednon-blackwom
enaged
19-22and23-27.
g
Joyceetal.(2013)
UnitedStates
(NY)
Roe
v.Wade
Birthrateforw
omen
15-44.
−0.36birth
sper1000
givenameandistance
of23
miles.
h
Levine
etal.(1999)
UnitedStates
Roe
vWade
Birthratewom
en15-44.
−0.050(0.008).
i
Mølland
(2016)
Norway
abortioninOslo
Probabilityof
teen
motherhood(<20).
− 0. 029(0. 009).
j
Myers(2017)
UnitedStates
abortion
Probabilityof
giving
birth
beforeage19.
−0.0284(0.0070).k
Pop-Eleches(2010)
Rom
ania
abortion
plus
contracep-
tion
Probabilityof
giving
birth
.−0.068(0.015)forwom
en20-24
with
low
education.
l
Valente(2014)
Nepal
Accesstoan
abortioncen-
ter
Probabilityof
giving
birth
conditionalon
conceptionwom
enaged
15-49.
Living
within28.6km
toan
abortioncenterled
to−0.0737(0.0272).m
Our
Estim
ate
Mexico
ILEreform
Birthratesw
omen
15-49
−0.054(0.015)
PanelB
:RegressiveLaw
Changes
KaneandStaiger(1996)
UnitedStates
Medicaid
restriction
and
parentalconsent
Num
bero
fbirths
tomothers15-19.
White
wom
en,Medicaid:
−0.0005(0.0002),
parentalconsent:−0.0012(0.0002).n
Cooketal.(1999)
UnitedStates
(NC)
Abortion
funding
Logof
birth
count.
0.047(0.014)forb
lack
wom
enand
0.015(0.010)forw
hitewom
en.o
Levine
etal.(1996)
UnitedStates
Medicaidfundingrestric-
tions
BirthRatewom
en15-44.
−0.582(0.400).
p
Joyceetal.(2006)
UnitedStates
(TX)
Texas
Parental
Notifica-
tionLaw
Rateratio
ofbirth
amongminors17.50-
17.74yearso
fage.
rateratio,1.04(95%
CI,1.00to
1.08).q
Lahey(2014)
UnitedStates
Lawsrestrictingabortion
inthenineteenthcentury
ln(childwom
anratio)forwom
enaged
15-
44.
4−12%
increase.r
Our
Estim
ate
Mexico
Regressivelawchanges
Birthratewom
en15-49
−0.019(0.015)
Notes:a
Colum
ns5and10
(3yearso
fexposure),table3,p.88.b
Colum
n4,Table1p.386.
cColum
n1,table3p.43.d
Table2,p.12.e
Colum
n2,table1p.279.
fColum
n1,table3,p.823.
gColum
ns2-4,
table2,p.186.
hSection4.2.2.
Regressions
ofbirth
rateson
distance,p.813.iColum
n1,table2,p.19.jColum
n1,row1,table1,p.12.kEffectof
“abortion
legal”andModel4,table2p.45.l
Colum
n2
(estimate:β2),table2,p.983.
mTable1p.232.
nAmongnonw
hitewom
en,M
edicaid:
0.0021(0.0011),parentalconsent:x-0.0003(0.0009).Colum
n4,Table3p.485.
column4,Table4p.486.
oTable6p.254.
pColum
n8,table5,p.33.q
Seetexton
p.1030.r
Table2p.943.
5

2 Background
2.1 Abortion Laws, Access, and Women’s Health
Globally, unintended pregnancies lead to approximately 46 million induced abortions each year (Van Ler-
berghe et al., 2005), and estimates suggest that worldwide, 25 million women sought unsafe abortions in
2014 (Ganatra et al., 2017). Unsafe abortions may result in as many as eight maternal deaths per hour
(World Health Organization, 2004).5 By the best available estimates, 13% of all maternal deaths are due
to complications surrounding clandestine and unsafe abortion, with these numbers being much higher in
certain settings (World Health Organization, 2011). The highest estimated rate of unsafe abortion is found
in the Latin America and Caribbean region where each year an estimated 4.2 million unsafe induced abor-
tions are carried out, accounting for 12% of all maternal deaths in the region (World Health Organization,
2011). This region also exhibits some of the world’s most conservative laws on abortion (United Nations,
2014).
Laws codifying access to abortion date from as far back as the early 20th century (Doan, 2009). How-
ever, the issue of abortion legalization remains a highly controversial social topic, with considerable vari-
ation in the availability and legality of elective abortion worldwide. From the 1970s onwards a number of
large-scale reforms have increased access to elective abortion, and these have been documented to have
considerable impacts on the life courses of women, children and families (Ananat et al., 2009; Bailey,
2013; Mitrut and Wolff, 2011; Pop-Eleches, 2006, 2010). However, the political debate around abortion
remains polarized worldwide, which is reflected by the huge differences in abortion laws across as well as
within countries (Berer, 2017). While some countries have increased legal restrictions on abortion, such
as the US, with as many as 334 abortion restrictions enacted during 2011-2016 (Conti et al., 2016), other
countries such as Ireland have gone in the opposite direction, legalizing elective abortion during the first
trimester (Li, 2018). With rapid globalisation, access to abortion is no longer a question only for local and
national governments but also an issue in the global arena. For example, abortion restrictions are at the
5Unsafe abortion is defined by the WHO as a procedure for terminating an unintended pregnancy either by individualswithout the necessary skills or in an environment that does not conform to minimum medical standards, or both (Organizationet al., 1992).
6

center of recent global governance efforts made by the US government when the so called Mexico City
Policy (the Global Gag Rule) was reinstated under the Trump administration in 2017 (Starrs, 2017).
While improved access to modern contraceptives and sexual education is essential for lowering rates
of unwanted pregnancies and the demand for induced abortion that follows, unsafe abortion cannot be
eliminated through these efforts only (Grimes et al., 2006).6 Access to safe abortion is considered imper-
ative to the health of women and children (Grimes et al., 2006). Lack of access to legal and safe abortion
increases the risk of unsafe abortion methods with possibly severe complications including hemorrhage,
sepsis, infection and trauma. Unsafe abortion procedures lead to hospitalisation in an estimated 20-50% of
all cases, where severe complications from unsafe abortion lead to 367 deaths per 100,000 cases. This can
be compared to the risk of death after safe abortion which is 0.7 deaths per 100,000 procedures (Grimes
et al., 2006).
Abortion legalization is associated with decreased maternal morbidity and mortality (Grimes et al.,
2006). This association has been documented within the field of medicine and public health for multiple
countries (Benson et al., 2011) including Albania (Sahatci, 1993), Bangladesh (Chowdhury et al., 2007),
Nepal (Henderson et al., 2013), Romania (Serbanescu et al., 1995; Stephenson et al., 1992), Singapore
(Singh and Ratnam, 2015) and South Africa (Rees et al., 1997). The impact of abortion legalization on
women’s health is significant, for example, abortion-related maternal mortality in Romania fell by 67% and
by 40% in Singapore after induced abortion was legalized (Singh and Ratnam, 2015). A similar pattern of
abortion legalization and abortion-related morbidity has been documented in multiple countries. Existing
studies aremainly based on reviews ofmedical charts at selected hospitals in theUS (Goldstein and Stewart,
1972; Stewart and Goldstein, 1971; Seward et al., 1973; Kahan et al., 1975), Guyana (Nunes and Delph,
1997), Nepal (Henderson et al., 2013) and South Africa (Mbele et al., 2006; Jewkes et al., 2002). There
is also evidence of lower abortion-related morbidity related to abortion legalization based on survey data
from hospitals in the US (Bracken et al., 1982) as well as South Africa (Jewkes et al., 2005).7 We are,
6Even with perfect compliance and use of contraceptives, unwanted pregnancies will still remain as no modern method canprevent pregnancy by 100% Warriner and Shah (2006) and the fact that sexual intercourse can occur without consent of thewoman.
7The study by Bracken et al. (1982) is based on data from Hospital Discharge Survey (HDS) provided by the NationalCenter for Health Statistics for 1970 through 1977.
7
however, aware of no prior studies which are based on population-level data, and based on within-country
variation in abortion reforms.
2.2 Fertility, family planning and abortion laws in Mexico
Between the years of 1975 and 2015, the fertility rate in Mexico declined rapidly from roughly 6 children
per woman to approximately 2.2 children per woman. This major shift in fertility can be partially attributed
to changes in access to modern contraceptive methods in the country (Juarez et al., 2013). In 1975, the
Mexican government passed the General Population Law, which obliged the government to supply family
planning services and provide contraceptives via the public health care sector free of charge. In 1995,
family planning services were decentralized to the state level, where different states fund family planning to
various degrees, possibly making family planning services differentially available across states. Although
67% of all women of childbearing age in Mexico report using modern contraceptive methods (and 5% use
traditional and less efficient methods), it is estimated that more than half of all pregnancies are unintended.8
Estimates suggest that up to 54% of these unintended pregnancies are terminated (Juarez et al., 2013).
Mexico consists of 32 federal entities, 31 of which are federal states plus the federal district of Mexico
(also known as Mexico D.F. or Mexico City). In addition to the national constitution, each of the 32 federal
entities has its own state or local constitution, defined by its own legislative power. Abortion laws in all
of Mexico are determined at the state level (Becker, 2013). Mexico DF contains approximately 8% of
the entire population (8.9 million of Mexico’s 119.5 million inhabitants according to 2015 estimates) and,
since 2007, is the only state that allows for elective abortion during the first trimester.
Prior to the reform in Mexico DF, abortion laws were quite uniform across the 32 federal entities of
Mexico. Induced abortion continues to be considered a criminal offense with the risk of up to 30 years
imprisonment in many states, and legal abortion was only permitted in the limited cases of rape, threat to
the life of the mother, or severe malformation of the fetus. In practice, even in these limited cases, legal
abortion has been described by human rights organizations as extremely difficult to access due to rigid8Modern contraceptives are condoms, oral or/injectable/implants of hormones preventing ovulation, IUD, sterilization and
emergency contraception. Traditional or less efficient methods are calendar method or rhythm method, coitus interrupts, herbsor teas. For a detailed account of modern and traditional methods, see for instance Hubacher and Trussell (2015).
8

legal barriers (Juarez et al., 2013). In the densely populated Mexico DF, only 62 abortions were legally
performed during 2001-2007 (Becker, 2013).
Induced abortion is a procedure or medical treatment for terminating pregnancy, and while induced
abortion under appropriately supervised settings is considered one of the safest medical procedures in
modern medicine, unsafe abortion is associated with substantially increased risks of severe morbidity and
mortality.9 The estimated rate of induced abortions for Mexico in 2006 was 33 abortions per 1,000 women
of fertile age (Juarez et al., 2008), which is considered high internationally (Becker, 2013). As a substitute
to legal options, abortions were performed in clandestine and often unsafe settings. In 2006 alone, medical
records from public hospitals show that an estimated 150,000 women in Mexico were treated for abortion-
related complications (Juarez et al., 2008). The most common method of induced abortion is believed
to be the abortifacient drug Misoprostol, which despite the strict legal restrictions in Mexico, has been
available in pharmacies since 1985 (Lara et al., 2011).10 Despite the fact Misoprostol and other abortifa-
cients formally require a doctor’s prescription in Mexico, studies show that abortifacients are frequently
sold over the counter without prescription (Lara et al., 2011). While a safe and well recognised method for
induced abortion when appropriately taken, instructions on dosage and usage of Misoprostol are generally
not available at pharmacies, leading to considerable risks when self administered (see eg Grimes (2005)).
2.3 The 2007 legal interruption of pregnancy reform in Mexico DF
The legislative assembly of the Federal District of Mexico voted to legalize elective abortion (termed legal
interruption of pregnancy, or ILE for its name in Spanish) on April 24, 2007, reforming Articles 145-148
of the penal code of Mexico DF, and Article 14 of the Health Code. These reforms were signed into law
9Induced abortions in a safe setting are carried out by professional health care providers in safe environment and in linewith evidence based medicine. The procedure generally depends on gestational length of pregnancy. A safe induced abortionusually entails either a surgical operation or medical procedure. During a surgical operation, the products of conception areremoved from the womb. The medical procedure is a non-invasive procedure that causes contractions of the womb, terminatingthe pregnancy. Medical abortion procedures are safer and more cost-efficient compared to other methods for first trimesterabortions. It is common that the patient self-administers the medical abortion at home (Kulier et al., 2007). Induced abortionunder safe conditions exhibits a mortality rate below 1 per 100,000 procedures (Grimes, 2005).
10Misoprostol (sometimes referred to as Cytotec, Arthrotec, Oxaprost, Cyprostol, Mibetec, Prostokos or Misotrol) is oneof the recommended substance for induced abortion by the WHO (Lara et al., 2011). Misoprostol is a prostaglandin withthe original purpose of curing gastric ulcers. It is also utilized for OB/GYN reasons such as induced abortion, post abortionprocedures and induced labor for delivery (Kulier et al., 2007).
9

the following day, and published in the official Gazette of the Federal District on April 26, 2007 (Ciudad
de México, 2007). The reforms, aiming at reducing the high number of unsafe abortions, were supported
by a coalition of pro-choice NGOs together with a growing movement for women’s reproductive health
rights.11 This immediately permitted women above the age of 18 to request legal interruption of pregnancy
at up to 12 weeks of gestation without restriction. Access for minors requires parental or guardian consent.
Under this law, induced abortion was made legal in both the public and private health care sectors.
Immediate implementation was made possible by collaboration between the Ministry of Health of
Mexico DF, members of the health department and international NGOs, which had thoroughly designed
a program for public provision of abortion services called the “the ILE program” and its implementation
even before the law was passed (Singh et al., 2012a). As such, abortion services were made available via
the public health care hospitals immediately after the law was passed in April 2007, although with lower
capacity and efficiency compared to current conditions. Abortion services were also quickly available in
the private health care sector (Blanco-Mancilla, 2011). Additionally, under this law sexual education in
schools was improved, and post-abortion contraceptives weremade freely available directly from the health
clinics which provided abortions (Contreras et al., 2011). Records from public hospitals show that the
demand for post-abortion contraceptives is high (approximately 82% of all women accept contraceptives)
and that prevalence of repeated abortion procedures are low (Becker, 2013). On August 29, 2008 the
decision to pass the ILE law was ratified by the Supreme Court of Mexico, making Mexico DF, together
with Cuba and Uruguay, the most liberal jurisdiction in terms of abortion legislation in the entire Latin
American and Caribbean region (Fraser, 2015).
Figures from the Secretary of Health’s administrative data suggest that abortions were used by women
of all ages, though were disproportionately sought by younger (21-25 year-olds) and older women (36 year-
olds and above), with lower rates of abortion among 26 to 35 year olds. The proportion of all births by age
and all abortions in public health clinics by age is presented in Appendix Figure A1. Approximately half of
the abortions were sought by unmarried women (45.5% to single women, and 4.1% to divorced women),
with the remainder nearly evenly split between married women, or those in a stable union. Information
11A broader discussion of the reform’s social and legal setting is provided in Kulczycki (2011); Madrazo (2009), Blanco-Mancilla (2011) and Johnson (2013).
10

regarding the extent to which women below the age of 18 have access to abortion services is relatively
scarce. However, according to a qualitative study by Tatum et al. (2012), the law on parental consent may
be differentially enforced depending on the caregiver. While Public Hospitals require parental consent,
only one out of three abortion providers in private health clinics require parental consent (Schiavon et al.,
2010). Women with residency outside Mexico DF can also access the public provision of abortion through
the Ministry of Health in Mexico DF (MOH-DF) but are charged with a sliding fee scale determined with
regard to the woman’s socioeconomic background. In 2010, 74% of all women who received an abortion
through the public health care sector were women living in Mexico DF, 24% were living in the state of
Mexico (which shares a border with Mexico DF) and 2% were living in other states (Mondragón y Kalb
et al., 2011).
Information regarding the private provision of abortion services is limited due to a lack of supervision
of the private market for legal abortion services (Becker, 2013). Despite the fact that safe abortion, at no or
low cost, is provided by the public health system in Mexico DF, women do seek abortion services within
the private sector. A descriptive study by Schiavon et al. (2012b) suggests that private abortion services
are provided at high costs (157–505 US dollars) and quality of care is inferior to that in the public sector,
given that the less safe and efficient “dilation and curettage” is used as the main method in the private
sector (71%). A suggested explanation for the high rates of usage of private care relates to beliefs that the
overall quality is higher in the private health sector (Schiavon et al., 2012b).
Records from public hospitals show that during the year of 2007, when the reform was implemented,
more than 7,000 abortion procedures were performed at 14 selected MOH-DF clinics. Over the years, the
MOH-DF abortion program expanded its services and became more efficient in meeting the high demand
for elective abortion. The MOH-DF program offers both surgical and medical abortion procedures and
is the main provider of medical abortion (Winikoff and Sheldon, 2012). The large shift from 25% of all
abortion procedures being medical in 2007 to as much as 74% in 2011 have played a key part of meeting
the demand and reducing complications and side-effects (Becker, 2013).12 As of 2015, approximately
150,000 abortions were carried out at the MOH-DF clinics.
12Misoprostol alone was the main regimen for medical abortions in MOH-DF until 2011 when Mifepristone (combined withMisoprostol) was introduced, making the medical abortion procedures provided by the ILE program more efficient and safe.
11

2.4 Regressive law changes as a response to legalizing abortion in Mexico DF
Almost immediately following Mexico DF’s ILE reform, a number of states began a series of counter-
legislations to change the respective sections of their constitutions or penal codes, defining the beginning
of human life as occurring at conception. Often, these legal responses directly referenced Mexico DF’s
ILE reform.13 Even in cases where they did not directly refer to the ILE reform, it seems highly likely that
the reform was a defining factor. For example, in the 20 years prior to the ILE reform there had been only
two constitutionally defined changes to the articles relating to abortion in the penal codes of all states of
Mexico (Gamboa Montejano and Valdés Robledo, 2014), compared to 18 changes between June 21, 2008
and November 17, 2009. Importantly, these reforms resulted in constitutional changes which recognised
life as beginning at conception, opening the door for potential homicide charges.
In Appendix Figure A2we display the geographical distribution of law changes (progressive, regressive
or neutral) over the period under study. The only progressive reform refers to Mexico DF’s ILE reform,
while 18 states made regressive changes after the initial reform. We have compiled on a state-by-state basis
the exact dates the reforms were passed into law, and these are displayed in Appendix Table A1. To the
best of our knowledge, there exists no centralized record of the dates and laws which were altered in the
post ILE era, and as such we compiled these from our reading of legal source documents. In section 4 of
this paper we return to how we use the state and time variation in the passage of laws in our identification
strategy.
3 Data
3.1 Maternal morbidity, maternal mortality and birth records
Complete data on morbidity and mortality are available for both the public and private health care systems
in Mexico. Microdata on each hospital stay record the age and sex of the patient, the number of nights
13For example, the constitutional decree issued by the state of Nayarit when changing their penal code explicitly refers tothe changes in the penal and civil code of Mexico DF (p. 14) (Gobierno de Nayarit, 2009).
12
in hospital, as well as the principal diagnosis based on ICD-10 codes. There are approximately 165 mil-
lion single records for the period of 2004-2015 accounting for 558 million nights of hospitalisation. Of
these, 46 million visits and 84 million nights of hospitalisation are related to “Pregnancy, childbirth and
the puerperium” (the ICD-10 “O” code). These data are universal and include all hospital visits in the
country.14
Complete microdata are released in three different formats depending on the hospital type where treat-
ment is provided. Hospitals in the public health system are administered by one of two types of providers.
The first, the Mexican Secretariat of Health, is the ministry of health of the national government, and ac-
counts for 47.0% of all hospital stays related to pregnancy, childbirth and the puerperium in the period
under study. The second are hospitals run by public Social Security providers, principally the Mexican In-
stitute of Social Security (IMSS), and the StateWorkers’ Institute of Security and Social Services (ISSSTE),
which account for 29.5% of hospital stays in the ICD-10 “O” class. Finally, the remainder of hospital stays
(23.5% of ICD-10 “O” cases) are treated in private hospitals. All private hospitals are required to provide
information on each hospital stay in a standardised format, which is reported to the National Institute of
Statistics and Geography (INEGI).
All public hospitalisation records are freely available as microdata files. However, data from hospitals
run by the Secretariat of Health are available from 2000-2015 with the exact dates of hospitalisation, while
data from hospitals run by Social Security Providers are available only from 2004-2015, and only provide
the year of hospitalisation. Our principal analysis of impacts of abortion reform on maternal health use
these databases, wherewe compile state by yearmeasures for key causes ofmorbidity for each year between
2004-2015. Data from the private system are available for remote processing by request from INEGI. We
follow a similar process with these microdata files, generating state by year values for the number of events
in key morbidity classes defined below. However, while private hospitals provide information on the cause
of hospitalisation, this is provided at a more highly aggregated level than public records. In particular, 10
different diagnosis classes are provided which map from the 76 diagnosis codes included in the three digit
ICD-10 “O” codes. We document the mapping for each diagnosis in the public and private sector morbidity
14The only exception is that these databases do not include standard hospital-stays for newborns following birth.
13

data in Appendix Table A2. While our principal analysis focuses on the public data given the lower level
of aggregation available, we show that results in aggregate private-sector data are consistent with our main
results.
We focus on two particular morbidity classes when examining the impact of abortion reform on fe-
male health outcomes. These are abortion-related causes, and haemorrhage early in pregnancy. The first
outcome is typically examined when considering the impacts of unsafe abortion on women’s health in the
medical and public health literature. It includes all forms of morbidity classified in ICD-10 codes O02-
O08. A full discussion of this coding is provided in Singh and Maddow-Zimet (1999). We additionally
consider the impact of abortion reform on haemorrhage in early pregnancy. This is classified as haem-
orrhage prior to 20 weeks of gestation, and is coded from ICD-10 code O20. We focus on this outcome
given that haemorrhage (along with incomplete abortion) is one of the two most common complications of
unsafe abortion (World Health Organization, 2018; Gerdts et al., 2013), and given the widespread use of
misoprostol as an abortifacient agent in clandestine abortions prior to the ILE reform in Mexico DF. While
bleeding is a normal side-effect of misoprostol use as an abortive agent, when taken in unsupervised set-
tings misoprostol can lead to heavy bleeding and haemorrhage (Pourette et al., 2018).15 Together these two
outcomes cover 8 of the 76 ICD-10 code classes, but make up 11.1% of all maternal hospitalisations in the
years under study, or 21.5% of maternal morbidity when excluding deliveries (refer to Appendix Table A2
for a full description of all maternal morbidity causes). The remainder of the ICD codes are not examined
as outcomes as it is unlikely that they are sequelae of abortion (for example eclampsia or pre-eclampsia),
or are morbidities occurring in the puerperium period, and so unable to be sequelae of abortion.
Finally, measures of maternal mortality by state and year are generated from INEGI’s full mortality
register. This register classifies maternal deaths according to ICD-10 codes.16 Mexico’s register of mater-
nal deaths is recognised to be of high quality, with Mexico being classified as belonging to the “A-class”
15Accounts of self administered abortion in a case study in Brazil described in Grimes et al. (2006), suggest that eventhough the use of Misoprostol as an abortifacient increased safety, hospitalisation due to haemorrhage was the outcome in casesof complications. They state: “Women would self-administer the drug orally and then seek medical assistance if the uterinebleeding did not stop” (Grimes et al., 2006, p. 1916).
16Formally, maternal deaths are defined by the WHO as “The death of a woman while pregnant or within 42 days of termi-nation of pregnancy, irrespective of the duration and the site of the pregnancy, from any cause related to or aggravated by thepregnancy or its management, but not from accidental or incidental causes”.
14

(World Health Organization, 1987) in the latest WHO report on maternal mortality trends. This data has
had particular improvements from 2001, and as such, we restrict our period of analysis to 2001-2016 (see
Schiavon et al. (2012b)).
Summary statistics of maternal morbidity and mortality are provided in Table 2. The total number of
cases of eachmorbidity class are described in panel A, andmortality outcomes, both for all maternal deaths,
and those only classified as owing to abortion, are provided in panel B. On average, morbidity outcomes
are various orders of magnitude higher than mortality outcomes. For example, the average quantity of
hospitalisations for abortion related causes was 8366 per state and year, versus 36 maternal deaths on
average, or 3 maternal deaths when considering only those classified as owing to abortive causes.
In order to benchmark the Mexico abortion reforms’ impact on fertility with respect to the wider lit-
erature, we also require aggregate data on fertility by state. We generate these state-level measures from
publicly available microdata on births provided by INEGI. We use each birth register occurring to women
aged 15-49 over the time period of 2001-2013; a sample of 30,340,544 births. State by year averages of
the number of births and birth per 1,000 fertile aged women are displayed in panel C of Table 2.
Vital statistics for births in Mexico are compiled by INEGI based on birth registries completed by each
parent or guardian at the civil registry, rather than being based on birth certificates issued at hospitals (as is
the case, for example with the National Vital Statistics System in the USA and in various developing and
emerging economies, like Chile and Argentina).17 The birth register is released once per year, containing
all births registered in that year, as well as the year the birth occurred. In order to avoid problems of under-
reporting, differential reporting over time, and double-reporting, we collate all birth registers between
2002-2016, and then keep all births registered within 3 years of the date of birth.18 This implies that we
have complete birth registers based on birth years up to (and including) 2013.19 Unregistered births will
17Using data from the 2010 census and birth records up until 2009, a recent (backward looking) analysis suggests that 93.4%of all births in Mexico were registered within 1 year of birth of the child, and in total, 94.2% of births are eventually registeredat the national level (Instituto Nacional de Estadística y Geografía, 2012).
18This allows us to record births even when they are registered months after birth (up to 36 months following the birth).Considering additional registration lags results in virtually unchanged estimates, as nearly all ever-registered births are registeredwithin 3 years of birth. This is very similar to the methodology employed by Mexico’s population authority in their calculationof official demographic trends (Consejo Nacional de Población, 2012).
19While these birth registers are not universal, they are considered as being of very good quality compared to many otherregistry systems in developing economies. On average, dated estimates suggest that across all developing countries 41% ofbirths are unregistered, and this figure for Latin America alone is 14% (UNICEF, 2005).
15
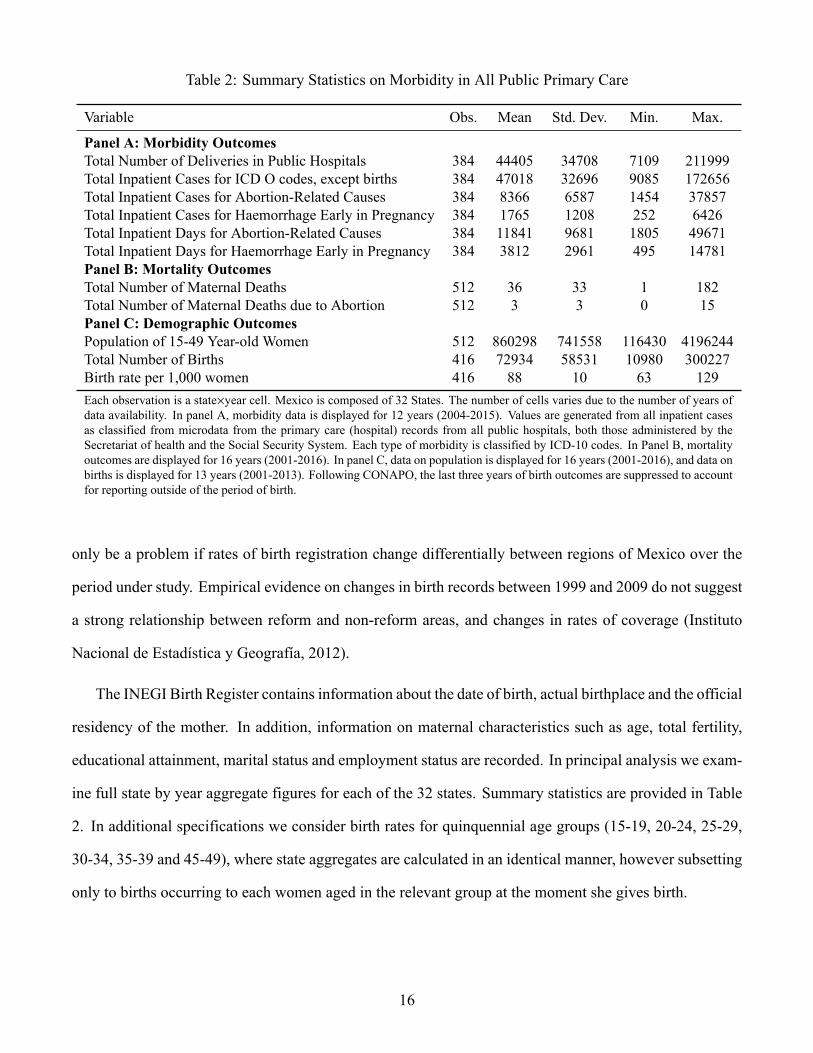
Table 2: Summary Statistics on Morbidity in All Public Primary Care
Variable Obs. Mean Std. Dev. Min. Max.
Panel A: Morbidity OutcomesTotal Number of Deliveries in Public Hospitals 384 44405 34708 7109 211999Total Inpatient Cases for ICD O codes, except births 384 47018 32696 9085 172656Total Inpatient Cases for Abortion-Related Causes 384 8366 6587 1454 37857Total Inpatient Cases for Haemorrhage Early in Pregnancy 384 1765 1208 252 6426Total Inpatient Days for Abortion-Related Causes 384 11841 9681 1805 49671Total Inpatient Days for Haemorrhage Early in Pregnancy 384 3812 2961 495 14781Panel B: Mortality OutcomesTotal Number of Maternal Deaths 512 36 33 1 182Total Number of Maternal Deaths due to Abortion 512 3 3 0 15Panel C: Demographic OutcomesPopulation of 15-49 Year-old Women 512 860298 741558 116430 4196244Total Number of Births 416 72934 58531 10980 300227Birth rate per 1,000 women 416 88 10 63 129Each observation is a state×year cell. Mexico is composed of 32 States. The number of cells varies due to the number of years ofdata availability. In panel A, morbidity data is displayed for 12 years (2004-2015). Values are generated from all inpatient casesas classified from microdata from the primary care (hospital) records from all public hospitals, both those administered by theSecretariat of health and the Social Security System. Each type of morbidity is classified by ICD-10 codes. In Panel B, mortalityoutcomes are displayed for 16 years (2001-2016). In panel C, data on population is displayed for 16 years (2001-2016), and data onbirths is displayed for 13 years (2001-2013). Following CONAPO, the last three years of birth outcomes are suppressed to accountfor reporting outside of the period of birth.
only be a problem if rates of birth registration change differentially between regions of Mexico over the
period under study. Empirical evidence on changes in birth records between 1999 and 2009 do not suggest
a strong relationship between reform and non-reform areas, and changes in rates of coverage (Instituto
Nacional de Estadística y Geografía, 2012).
The INEGI Birth Register contains information about the date of birth, actual birthplace and the official
residency of the mother. In addition, information on maternal characteristics such as age, total fertility,
educational attainment, marital status and employment status are recorded. In principal analysis we exam-
ine full state by year aggregate figures for each of the 32 states. Summary statistics are provided in Table
2. In additional specifications we consider birth rates for quinquennial age groups (15-19, 20-24, 25-29,
30-34, 35-39 and 45-49), where state aggregates are calculated in an identical manner, however subsetting
only to births occurring to each women aged in the relevant group at the moment she gives birth.
16
3.2 Administrative records on criminal offenses, survey data on sexual behaviour
and additional data sources
To examineDe Jure sentencing of abortion, we use administrative records fromMexico’s Judicial Statistics
on Penal Matters provided by INEGI. These records contain microdata registering each prison sentence
handed down by the Mexico judiciary, the reason for the sentence, and the length of each sentence. It
comprise the universe of judiciary decisions in the country based on the first legal judgment, and so does
not include any subsequent appeals. We calculate prison sentence lengths from a categorical variable which
records sentence lengths in binned windows (ranging from 0-2 months to > 20 years). These bin widths in
microdata do not change over the period under study, and are identical in each state of the country. Trends
in De Jure sentencing of abortion are presented in Appendix Figure A3.
For a small number of supplementary tests we use survey data from the Mexican Family Life Survey
(MxFLS). The MxFLS is a nationally and regionally representative longitudinal data set that follows the
Mexican population over time, covering various topics regarding the well-being of individuals including
information on reproductive health.20 The survey was conducted in three waves during 2002-2003, 2005-
2006 and 2009-2012.
We use the reproductive health module from the MxFLS which collects information on contraceptive
knowledge and usage as well as information on sexual behavior such as the number of sexual partners.
This sample consists of a panel of women aged 15-44 who completed the reproductive health questionnaire
resulting in a total of 5,404 women. Summary statistics for reproductive health across regions are provided
in Appendix Table A3) and show that average knowledge of at least any kind of modern contraceptive
methods are generally high across all regions, while the average usage of any kind of contraceptives and
modern contraceptives are higher in Mexico DF compared to other states.
We collect a number of additional variables measured at the level of state and year. These are ei-
ther used to calculate rates of exposure for health and fertility outcomes (in the case of population), or
20The MxFLS dataset is publicly available, developed and operated by the Iberoamerican University (UIA) and the Centerfor Economic Research and Teaching (CIDE) and also supported by multiple institutions in both Mexico (INEGI and NationalInstitute of Public Health) and the USA (Duke University and Universities of California, Los Angeles).
17

as time-varying controls in regression analyses. The population of women aged from 15-49 by state is
accessed from the National Population Council of Mexico (CONAPO). Time-varying controls are com-
piled to capture possible confounders of abortion policy, namely education, health investment and access,
economic development, and women’s social inclusion. We collect measures for each state and year from
2001 to 2016 describing the proportion of each state living in poverty, the proportion of women who are
economically active, the average level of completed schooling of the population, the average salary paid
to full-time workers, the proportion of the population with access to health-care facilities, and the rollout
of the national health insurance program Seguro Popular.21 Summary statistics for each variable as well
as a list of sources are provided in Appendix Table A4. These variables are merged by year and state to
the morbidity, mortality, and birth data discussed earlier in this section.
4 Methodology
In order to examine the joint impact of the ILE reform and the regressive law changes in a single model,
we begin by estimating the following difference-in-differences (DD) specification:
Healthst = β0 + β1ILEst + β2Regressivest + X′stΓ + ϕs + µt + εst . (1)
Here Health refers to average rates of morbidity or mortality in state s at time t, and ILE and Regressive
refer to the post-ILE and post-Regressive Law changes in affected states. Our parameters of interest are β1
and β2. We include state and year fixed effects as ϕs and µt respectively, and examine stability to the in-
clusion of the time-varying controls Xst listed in section 3.2.22 There are 32 states in Mexico (including the
21Mexico’s General Health Law underwent a major reform in 2003, which intended to provide 50 million Mexican citizenslacking social security with subsidized and publicly financed health insurance. The core of this reform was the health insuranceprogram Seguro Popular (SP). The “People’s Insurance” or Seguro Popular was launched in 2002, offering health service freeof charge or subsidized to those without formal health insurance.
22Given the dynamics observed in raw outcomes (refer to Appendix Figures A4, A5 and A6), we believe it is inappropriateto estimate DD models with state-specific linear time trends, ϕs · t. As is well known, the inclusion of state-specific lineartime-trends in DD models where the reform impact is not captured by a simple trend break tends to result in biased parameterestimates, and this problem is “exacerbated when only a few observations are available before the policy shock” (Wolfers, 2006,p. 1807). This is precisely the situation in the empirics of this paper, with impacts often not becoming fully appreciable in thefirst reform year (2007), or emerging with the adoption of new abortion technologies. As such we do not estimate DD modelswith state-specific time trends, preferring to estimate full event studies examining trends, and showing robustness to synthetic
18

Federal District), and these laws are defined at the level of the state. In order to account for the possibility
of unobserved correlations of outcomes for women within a state, standard errors are clustered by state. In
practice, the quantity of clusters (32) is on the border of ‘rule-of-thumb’ type minimum cluster sizes for
asymptotic validity of traditional clustered standard errors, and additionally, the states vary considerably in
size. Given this, we estimate standard errors using a wild bootstrap, with Rademacher resampling weights.
Our outcomes of interest for this procedure are the measures of maternal morbidity and mortality dis-
cussed in section 3, as well as fertility in order to quantify any reform effect on birth rates. We thus
implement the procedure for a measure of all abortion morbidity, morbidity due to haemorrhage early in
pregnancy, and total maternal mortality and maternal mortality due to abortion. In each case in the main
outcomes, we focus on rates of morbidity and mortality per the population of fertile aged women. We
express our outcomes in this way for two reasons. The first is that it allows us to capture the full effect
of the reform. As we will show that the abortion reform reduces fertility, if we express our outcomes as
morbidity or mortality per live birth, this is equivalent to a partial impact, removing any impact of the
reform which flows from the ability to avoid undesired, and potentially risky, births. In practice, we are
interested in the total impact of the reform, which consists of the reduction in morbidity and mortality due
to fewer births, as well as any direct impact the reform may have on the composition of mothers giving
birth. Secondly, this allows us to ignore any challenges arising from the endogenous decision of whether
or not to engage in legal abortion. If we instead report the impact of the law on rates of morbidity and
mortality per live birth, we will be confounding our estimates due to the fact that a non-random group of
women choose to proceed with births following the reform, and this group may be selectively more or less
healthy than the women who elect to abort.23
For difference-in-difference estimates to capture the causal effects of abortion laws, we require a par-
allel trend assumption to hold, or that outcomes in each of the “Regressive”, “ILE” and untreated states
would have evolved similarly in the absence of abortion reforms. We provide a partial test of this, and ad-
control methods.23Among other things, women seeking abortions are younger andmore likely to come from lower socioeconomic background
compared to the average Mexican mother (40% of women seeking abortion in ILE during 2008-2010 had 9 or less years ofschooling, only 30% were employed and 75% are younger than 30 (Mondragón y Kalb et al., 2011)). Thus, these women maybe either less or more healthy on average, and less or more likely to suffer complications conditional on giving birth.
19

ditionally quantify any dynamic reform effects, by estimating the following DD event-study specification:
Healthst = α0 +8∑
j=−3δ− j∆ILEs,t+ j +
7∑k=−5
γ−k∆Regressives,t+k + X′stΓ + ϕs + µt + εst (2)
we normalise both δ and γ setting δ−1 = 0 and γ−1 = 0. These event-study specifications are increas-
ingly common in DD settings, and here we adopt the notation of Freyaldenhoven et al. (2018). In this
specification, we are interested in the leads and the lags of the policy changes, where leads capture any
prevailing trends prior to the reform, and lags show the change in health outcomes following the reform’s
implementation. In specification 2, we present the model for morbidity data available from 2003 to 2015.
In this case we are able to estimate 3 leads and 8 lags of the ILE reform, and 5 leads and 7 lags of regressive
law changes. In the case of mortality or fertility where longer periods of data are available, lags and leads
are modified to provide a fully saturated model in each case. As in specification 1, year and state fixed
effects absorb time-invariant and state-invariant factors, and standard errors are clustered by state with a
wild bootstrap.
Although specification 2 provides evidence in favour of parallel (pre-)trends if we can reject that each
δ j = γ j = 0 ∀ j < 0, we may nonetheless be concerned with unobserved heterogeneity between treated
and non-treated states. As an additional test and a plausability check of estimates from equations 1-2 for
the impact of the ILE reform only, we construct a synthetic control estimate to compare with Mexico DF.
This procedure is particularly suitable to quantify the effect of the ILE reform in Mexico DF where there
is a single treated unit, however not for the Regressive policy changers where a number of states adopt
at different points in time. Our interest is to quantify the impact of the ILE reform, by comparing health
outcomes inMexico DF, the treated area, with outcomes in the rest of Mexico. This consists of determining
the counterfactual state for a single treated state, following Abadie et al.’s (2010) synthetic control method
where the single counterfactual “synthetic control” unit is generated based on a re-weighted pool of all
the untreated states. This counterfactual is chosen to minimise the matrix norm based on the distance
between average outcomes in the pre-treatment period, and the estimated average treatment effect on the
treated (ATT) is inferred as the difference between the treated unit and the synthetic control unit in the
post-treatment period. Our implementation of the synthetic control procedure is standard, as outlined in
20

Abadie et al. (2010). The “donor” pool from which we calculate synthetic controls include each of the
remaining states with the exception of neighbouring Mexico State, in which a non-trivial proportion of
abortions were accessed by women. We return to examine spillover impacts more completely in section
5.4.
In order to conduct inference on the estimated treatment effect, we similarly followAbadie et al. (2010),
and undertake permutation inference. In graphical analysis, we calculate identical synthetic controls for
the 30 untreated donor states, and generate placebo reform estimates assuming an identical reform timing.
We then compare the true reform impact in each year with the impact for each of the placebo estimates in
this year, to determine whether the estimated impact in the treated region is large compared with placebo
cases where no substantial impact should be observed. When considering inference on a single ATT based
on the mean post-treatment decline, we implement permutation inference comparing our main effect with
the effect in all potential control states, and all potential treatment periods, as suggested in Abadie et al.
(2010, p. 497).24 This provides a larger pool of placebo outcomes, giving greater precision to reported
p-values resulting from permutation inference.
5 Results
5.1 Abortion Laws and Fertility Outcomes
The impact of changes in the cost or availability of legal abortion on fertility outcomes have been well
documented in the economic literature. Estimates from a range of contexts are summarised in Table 1.
We present estimates of the impact of abortion laws which result the loosening of restrictions in Panel A,
and those which result in the tightening of access or increasing of sanctions in Panel B. Across studies on
24In particular, the p-value associated with the ATT for the impact of ILE on health outcomes is calculated as:
p =
∑31s=2
∑2014t=2004 1{|α̂1,2007 | ≤ |α̂t,s |}
Ns,t
where α̂s,t refers to the average post-treatment difference between the treated (or placebo) unit and its synthetic control for state swhere the (placebo) treatment is assigned as occurring in year t. Here state s = 1 refers toMexico DF and the true treatment yearis t = 2007, and so α̂1,2007 is the true treatment effect, while permutations of each state×year pair (2, . . . , 31)×(2004 . . . 2014)are placebo trials. Ns,t refers to the total number of placebo permutations.
21

abortion legalization in the US, Nepal, Norway and Romania we observe a drop in fertility (mainly among
younger and low SES women) of between 1.2-7% (see panel A in Table 1). Studies on the impact of
regressive abortion law changes (including parental consent laws and restricted funding of abortions) find
considerably more heterogeneous results, with results ranging from significant reductions in birth rates
(Kane and Staiger, 1996), insignificant impacts (Levine et al., 1996), and increases in rates of birth (Lahey,
2014) (refer to panel B in Table 1).
Table 3: Difference-in-Differences Estimates of Abortion Reforms on Fertility
Births per 1,000 Women
(1) (2) (3) (4)
Post-ILE Reform (DF) -6.091*** -5.608*** -4.600*** -4.838***(0.671) (0.698) (1.202) (1.367)
Post Regressive Law Change -1.824* -1.752 -1.901* -1.802(1.100) (1.248) (1.058) (1.318)
Observations 416 416 416 416Mean of Dependent Variable 87.643 87.643 87.643 87.643Mean of Dependent Variable (Mexico DF) 89.021 89.021 89.021 89.021Mean of Dependent Variable (Regressive States) 90.561 90.561 90.561 90.561
State and Year FEs Y Y Y YPopulation Weights Y YTime-Varying Controls Y YEach column displays a difference-in-differences regression of the impact of abortion reform on rates of fertility. Fertilityis measured as the number of births per 1,000 fertile aged women each year. Time-varying controls are documented insection 3.2. All standard errors are clustered at the level of the state using a wild clustered bootstrap procedure.
Our results from the Mexican abortion reforms suggest broadly similar fertility impacts to those ob-
served in other settings following the elimination of abortion restrictions. We provide a summary DD
estimate for Mexico in the case of progressive (ILE) and regressive reforms for comparison in Table 1.
These estimates are taken from Table 3 which displays DD estimates of the impact of reforms on birth
rates. In Table 3 we present population-weighted and unweighted results, where the population refers to
the total number of fertile aged women in each state by year cell. Columns 1-2 are baseline DD models
including only time and state fixed effects, while columns 3-4 add in time-varying control described in
section 3.2. In general, across specifications, results are quite stable in suggesting a significant reduction
in births in Mexico DF following the ILE reform. Depending on estimation weights, we observe a reduc-
22

tion of between 4.6 and 6.1 births per 1,000 women, or a reduction of between 5.3 and 6.8% in fertility
rates compared with pre-reform levels in the state. Our preferred estimates are those including population
weights with full time-varying controls, which suggest a reduction of 4.8 births per 1,000 women of fer-
tile age in the years following the ILE reform, or a 5.4% reduction in birth rates in Mexico DF. We note
that this reduction is similar to that documented following Roe v. Wade in the US (Levine et al., 1999;
Gruber et al., 1999; Ananat et al., 2007), though slightly smaller than that reported by Pop-Eleches (2010)
in Romania. In the case of states passing regressive laws altering their penal codes or state constitutions
related to abortion, we observe much weaker evidence to suggest any notable effect on fertility, though if
anything estimates point to a slight reduction in rates of fertility in the years following reforms. Depending
on the model, point estimates vary from -1.9 to -1.7 births per 1,000 women, or a 1.9 to 2% reduction in
rates of fertility. In preferred estimates weighting for the population of fertile women, these results are not
statistically significant at the 10% level. We return to examine the nature of these legal reforms in more
detail in section 5.4, revisiting the small estimated impacts on birth rates.
Figure 1: Event Studies for Fertility Rates in Progressive and Regressive Abortion Reforms
−20
−15
−10
−5
05
−6 −5 −4 −3 −2 −1 0 1 2 3 4 5 6
Time to Reform
Point Estimate 95% CI
(a) Progressive Abortion Reform (ILE)
−10
−5
05
−8 −7 −6 −5 −4 −3 −2 −1 0 1 2 3 4 5
Time to Reform
Point Estimate 95% CI
(b) Regressive Abortion Laws (Legislative Tightening)
Notes: Event studies document the evolution of birth rates per 1,000 women surrounding the passage of abortion reforms. Eachpoint estimate refers to the change in rates between treated and non-treated states, compared to their baseline differential (1 yearprior to the reform). The left-hand panel shows the difference between Mexico DF and untreated states surrounding the passageof the ILE reform. The right-hand panel shows the difference between regressive policy changers and non-changers aroundthe (time-varying) date that each reform was passed. In each case the 95% confidence intervals are shaded, and are based onwild-bootstrap clustered standard errors.
We provide full event studies corresponding to the passage of progressive and regressive reforms in23

Figure 1. In the left-hand panel we observe a reduction in rates of fertility in Mexico DF when compared
with all non-reform states, which becomes statistically significant from 1 year post-reform (2008) onwards.
This is in line with lags in birth rates expected to be observed approximately 7-9 months following the
passage of abortion reforms due to the gestational period and limits on gestational length when undertaking
abortion. In the pre-reform period, all estimates are not statistically distinguishable from zero, providing
some supporting evidence of the parallel trends assumption in the pre-reform period. While we note that
point estimates seem to suggest a slight upwards trend, we return to examine the stability of these estimates
to a judiciously chosen synthetic control group in the paragraphs below.
The right-hand panel of Figure 1 documents similar point estimates and standard errors for states al-
tering their constitutions or criminal codes to increase legal sanctions on abortion. While estimates are
displayed in separate panels, as described in equation 2 these are estimated in a single specification imply-
ing both figures control for reforms implemented in other states. In the case of regressive reforms, event
studies agree with average DD estimates in suggesting no statistically distinguishable effects of the reform,
while point estimates point to, if anything, a slight reduction in fertility in the post-reform period. Once
again, there is no evidence of statistically distinguishable prevailing trends in the pre-reform period.
DD and event study estimates base the control group on all non-reform states. As a consistency check
on these results and to ensure that estimates for the impact of the ILE reform are not driven by any pre-
existing differential trends, we also compare outcomes inMexicoDFwith those in a single synthetic control
state. The difference between outcomes in Mexico DF and the synthetic control state are documented in
Figure 2. Here we observe that while there was a downward trend in birth rates in DF including prior to
the reform,25 synthetic control results suggest that this decline accelerated following the implementation
of ILE in 2007 when comparing Mexico DF with the synthetic control state. Figure 2a shows the trend in
Mexico DF (solid line) as compared to the synthetic control (dashed line), where the synthetic control is
chosen to minimise the RMSE in the difference between these two rates prior to the reform. The fertility
rates in Mexico DF are substantially below those of the synthetic control, and appear to diverge over time.
The average difference in rates of birth per 1,000 women over the time-period under study is 6.8 births
25This is in line with a general trend in declining fertility across the country, which began in the 1960’s or 1970’s dependingon the state (Tuiran et al., 2004).
24
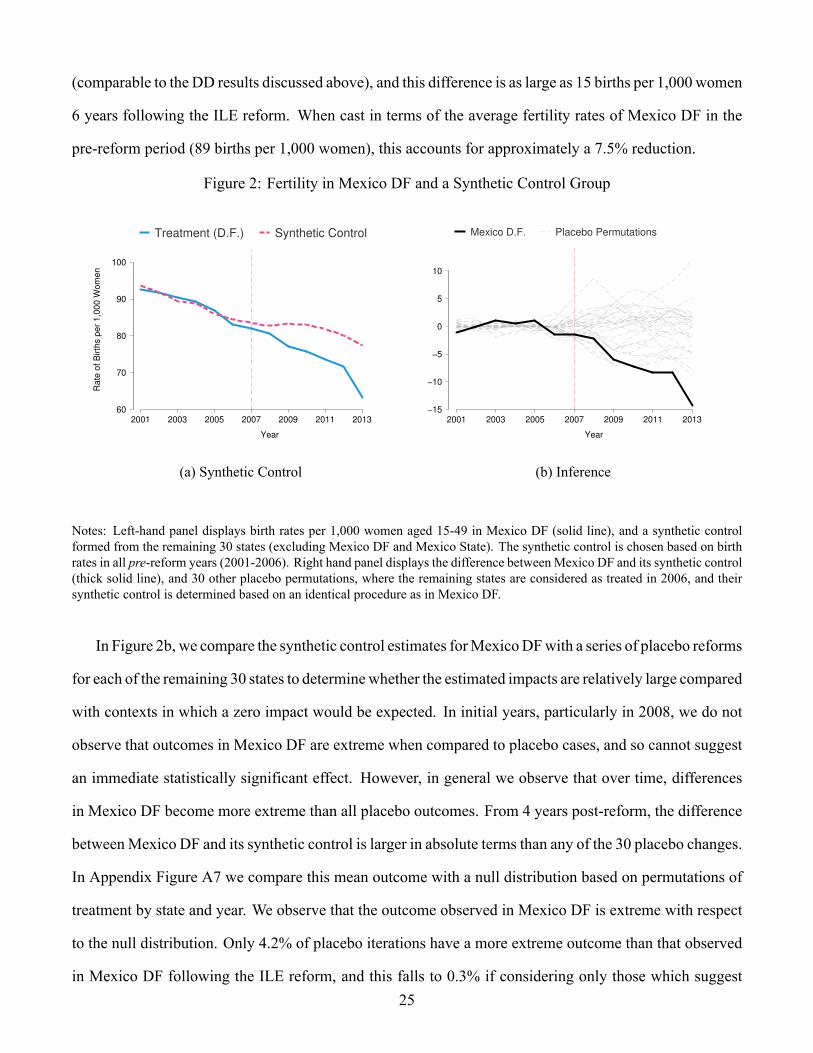
(comparable to the DD results discussed above), and this difference is as large as 15 births per 1,000 women
6 years following the ILE reform. When cast in terms of the average fertility rates of Mexico DF in the
pre-reform period (89 births per 1,000 women), this accounts for approximately a 7.5% reduction.
Figure 2: Fertility in Mexico DF and a Synthetic Control Group
60
70
80
90
100
Rate
of B
irth
s p
er
1,0
00 W
om
en
2001 2003 2005 2007 2009 2011 2013
Year
Treatment (D.F.) Synthetic Control
(a) Synthetic Control
−15
−10
−5
0
5
10
2001 2003 2005 2007 2009 2011 2013
Year
Mexico D.F. Placebo Permutations
(b) Inference
Notes: Left-hand panel displays birth rates per 1,000 women aged 15-49 in Mexico DF (solid line), and a synthetic controlformed from the remaining 30 states (excluding Mexico DF and Mexico State). The synthetic control is chosen based on birthrates in all pre-reform years (2001-2006). Right hand panel displays the difference between Mexico DF and its synthetic control(thick solid line), and 30 other placebo permutations, where the remaining states are considered as treated in 2006, and theirsynthetic control is determined based on an identical procedure as in Mexico DF.
In Figure 2b, we compare the synthetic control estimates forMexicoDFwith a series of placebo reforms
for each of the remaining 30 states to determinewhether the estimated impacts are relatively large compared
with contexts in which a zero impact would be expected. In initial years, particularly in 2008, we do not
observe that outcomes in Mexico DF are extreme when compared to placebo cases, and so cannot suggest
an immediate statistically significant effect. However, in general we observe that over time, differences
in Mexico DF become more extreme than all placebo outcomes. From 4 years post-reform, the difference
betweenMexico DF and its synthetic control is larger in absolute terms than any of the 30 placebo changes.
In Appendix Figure A7 we compare this mean outcome with a null distribution based on permutations of
treatment by state and year. We observe that the outcome observed in Mexico DF is extreme with respect
to the null distribution. Only 4.2% of placebo iterations have a more extreme outcome than that observed
in Mexico DF following the ILE reform, and this falls to 0.3% if considering only those which suggest25

a larger reduction than in Mexico DF (corresponding to two- and one-tailed p-values of 0.042 and 0.003
respectively).
5.2 Maternal Morbidity
Estimates for the impact of abortion reforms on maternal morbidity are presented based on a range of
methodologies, and for the maternal health measures outlined in section 3. Difference-in-difference esti-
mates of the impact of the ILE reform and subsequent restrictive law changes on morbidity are presented
in Table 4. All coefficients are cast as the effect of law changes on morbidity per 1,000 women. We ob-
serve that, on average, conditional on subsequent restrictive reforms, the ILE reform resulted in a reduction
in morbidity by approximately 0.85 to 1.1 cases per 1,000 women when considering all abortion-related
morbidity, or be 0.8 to 0.9 cases per 1,000 women when considering the incidence of haemorrhage early
in pregnancy. When compared to average rates of morbidities of these conditions, this is approximately
a 10% reduction in abortion related morbidity, and a 40% reduction in rates of haemorrhage. Results are
robust to weighting or not by the population of each state, and to the inclusion of time-varying controls.
In the case of subsequent restrictive reforms, we find in general quite weak and noisy evidence when
examining whether these reforms shifted morbidity outcomes. For abortion related morbidity, we find
no significant impacts across specifications reported in Table 4. And in the case of haemorrhage early in
pregnancy, in unweighted DDmodels we observe amarginally significant reduction in morbidity following
a regressive change in laws, however this is rendered insignificant with the introduction of population
weights, suggesting that if anything, this reduction is driven by smaller states. In general, this evidence
does not suggest a consistently significant result of the introduction of restrictive laws, although point
estimates are in general negative. When instead of the total number cases we examine the total number
of inpatient days (Appendix Table A5), we similarly observe a large reduction following Mexico’s ILE
reform, and no significant impact in the case of regressive reforms.
26

Table4:
Difference-in
-DifferencesE
stimates
ofLegalR
eformso
nMorbidity
Abortion
Related
Morbidity
HaemorrhageEarly
inPregnancy
(1)
(2)
(3)
(4)
(5)
(6)
(7)
(8)
Post-ILE
Reform(DF)
-1.048***
-1.130***
-0.994***
-0.857**
-0.939***
-0.900***
-0.933***
-0.809***
(0.235)
(0.239)
(0.339)
(0.423)
(0.109)
(0.105)
(0.196)
(0.162)
Post-RegressiveLawChange
-0.139
-0.081
-0.256
-0.170
-0.309*
-0.198
-0.334*
-0.175
(0.322)
(0.350)
(0.291)
(0.338)
(0.181)
(0.140)
(0.177)
(0.125)
Observations
384
384
384
384
384
384
384
384
Meanof
DependentVariable
10.336
10.336
10.336
10.336
2.343
2.343
2.343
2.343
StateandYearFE
sY
YY
YY
YY
YPopulationWeights
YY
YY
Time-VaryingContro
lsY
YY
YNotes:E
achcolumndisplays
adiffe
rence-in-differencesregressionoftheimpactofabortionreform
onrateso
fmorbidity(in
patientcases).E
achmorbidity
classism
easuredascasesp
er1,000fertileaged
wom
eneach
year,and
averagelevelsinthefullsetofdataareavailableatthefootofthetable.Allstandard
errorsareclusteredatthelevelofthe
state.
27

We examine the DD estimates in more details in Figures 3 and 4, where the treatment indicator in each
of the ILE and Regressive cases is interacted with a full set of lags and leads. Figure 3 examines outcomes
for haemorrhage, and Figure 4 examines outcomes for abortion-related morbidity. In both cases, panel
A shows the event study for Mexico DF surrounding the ILE reform, and panel B shows the event study
for regressive states. In each case, population weights and the full set of time-varying controls are used.
In Figure 3 we observe an immediate sharp decline in rates of haemorrhage in Mexico DF following the
adoption of ILE. Additionally, we observe little evidence of prevailing differences in treated and untreated
states before the reform, with the third and second lead being located close to zero. In the case of regressive
states (panel B), we observe a similar quite flat profile prior to the reform. Following the reform, while
we observe a small reduction in rates of haemorrhage, this reduction is never statistically distinguishable
from zero at 95% confidence intervals.
Figure 3: Event Studies for Rates of Haemorrhage Early in Pregnancy
−2
−1.5
−1
−.5
0.5
−3 −2 −1 0 1 2 3 4 5 6 7 8
Time to Reform
Point Estimate 95% CI
(a) Progressive Abortion Reform (ILE)
−2
−1.5
−1
−.5
0.5
−5 −4 −3 −2 −1 0 1 2 3 4 5 6 7
Time to Reform
Point Estimate 95% CI
(b) Regressive Abortion Laws (Legislative Tightening)
Notes: Event studies document the evolution of rates of haemorrhage early in pregnancy per 1,000 women surrounding thepassage of abortion reforms. Each point estimate refers to the change in rates between treated and non-treated states, comparedto their baseline differential (1 year prior to the reform). The left-hand panel shows the difference between Mexico DF anduntreated states surrounding the passage of the ILE reform. The right-hand panel shows the difference between regressivepolicy changers and non-changers around the (time-varying) date that each reform was passed. In each case the 95% confidenceintervals are shaded, and are based on wild-bootstrap clustered standard errors.
When considering rates of abortion morbidity, event studies document larger prevailing (pre-reform)
differences between DF and untreated states, although with wider confidence intervals. This agrees with
simple trends in outcomes documented in Appendix Figure A4, which suggest an increase in morbidity28

Figure 4: Event Studies for Rates of Abortion Morbidity−
4−
20
2
−3 −2 −1 0 1 2 3 4 5 6 7 8
Time to Reform
Point Estimate 95% CI
(a) Progressive Abortion Reform (ILE)
−4
−2
02
−5 −4 −3 −2 −1 0 1 2 3 4 5 6 7
Time to Reform
Point Estimate 95% CI
(b) Regressive Abortion Laws (Legislative Tightening)
Notes: Refer to notes to Figure 3. Identical event studies are estimated, however now for Abortion related morbidity (ICD codesO02-O08).
due to abortions recorded in Mexico DF in the year 2005 that were not seen in the rest of the country.
This drives the negative (but not statistically significant) pre-reform value observed in the third lead of
Figure 4a, prior to the steady reduction observed in the post-ILE years. In the case of states which altered
legislation in response to ILE, we observe very little evidence of an impact of these reforms on abortion
morbidity in 4b. In both the pre- and post-reform period, all estimates are not statistically distinguishable
from zero, and are centred around a null impact.
In Figure 5 we present results based on a consistency check comparing rates of haemorrhage early in
pregnancy and rates of morbidity for all abortion related causes in Mexico DF and in a synthetic control
state. In Panel Awe observe an immediate and sharp fall in rates of haemorrhage early in pregnancy, falling
from approximately 2.3 cases per 1,000 fertile aged women to approximately 1.3 cases per 1,000 women.
This agrees with DD and event study results documented above. Additionally, this supports claims from
the medical literature that haemorrhage is one of the major drivers of maternal morbidity and mortality
following unsafe abortions (World Health Organization, 2011), as the appearance of a legal and sterile
alternative to clandestine abortion resulted in an immediate a 43% reduction in hospitalisations resulting
from haemorrhage early in pregnancy. In the sub-set of data for which the month as well as the year of
29

hospitalisation is recorded (those in hospitals administered by the Secretary of Health), we observe that
this fall occurs precisely in the month that abortion was legalised, suggesting that changes in haemorrhage
morbidity were immediate with the arrival of new legislation (see Appendix Figure A6).
In Panel B of Figure 5 we present trends in rates of morbidity due to abortive causes. In this case
we observe a more gradual reduction in morbidity, with a clear difference 4 years post-reform. In longer
trends from public hospital data displayed in Appendix Figure A5, descriptive figures do suggest that
this was a turning point in Mexico DF, with a peak in 2008, after a steady increase from 2000, and then
a steady decline in the total number of cases of hospitalisation up until 2015. In the case of abortion
morbidity, it is important to note that the procedure used for abortions realized under the auspices of ILE
has changed over time, which may partially explain the delay in observed impacts on morbidity. Initially,
the majority of abortions were performed by surgical procedures (manual vacuum aspiration or dilation and
curettage) (75%) compared to medical abortions (25%). This gradually changed in subsequent years, with
medical abortion procedures reaching 74% in 2011, and the use of dilation and curettage was eliminated
entirely (in accordance with WHO recommendations for first-trimester abortions). In addition, the quality
of medical abortions performed has also improved, due to the introduction of mifepristone (combined with
misoprostol) in 2011 (Becker, 2013).26 The large rise in medical abortion has both improved the safety of
the program and enabled for the high demand for elective abortion to be met.
In Figure 6 we present a visual representation of permutation inference for synthetic control estimates
following Abadie et al. (2010). In the left-hand panel, we compare the difference between haemorrhage
morbidity in Mexico DF and its synthetic control with placebo differences in each other state in Mexico
compared to its own synthetic control. In the first post-reform year, the true estimate exceeds all other
placebo iterations, and this largely remains to be true in subsequent years, although from 5 years post-
reform a number of more extreme outcomes are observed in certain (generally smaller) states. To calculate
an exact permutation p-value, we follow the state and year permutation procedure, generating the null
distribution displayed in Appendix Figure A8. A two-tailed test suggests a p-value of 0.09, and a one
26The introduction of mifepristone in 2011 allowed for the use of the perceived “gold standard” medical abortion procedureaccording to the WHO, which is a combination of mifepristone and misoprostol (instead of misoprostol alone). This regimenis more efficient and causes less side-effects (Becker, 2013).
30
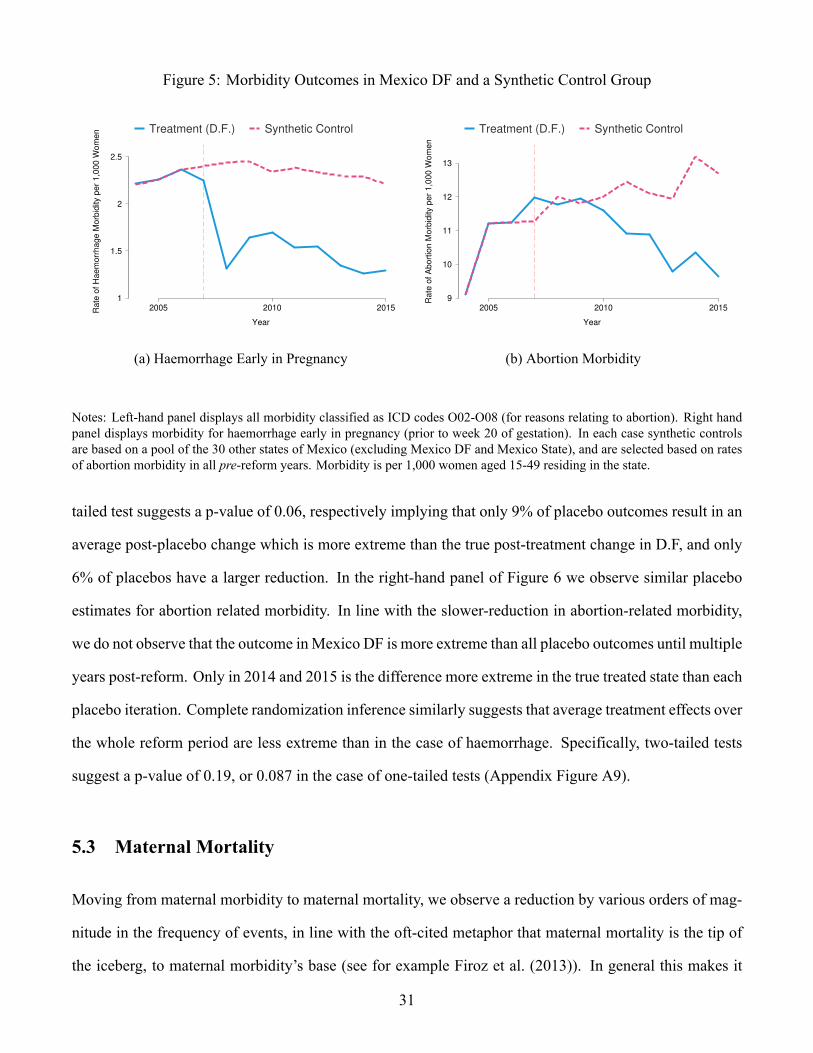
Figure 5: Morbidity Outcomes in Mexico DF and a Synthetic Control Group
1
1.5
2
2.5
Ra
te o
f H
ae
mo
rrh
ag
e M
orb
idity p
er
1,0
00
Wo
me
n
2005 2010 2015
Year
Treatment (D.F.) Synthetic Control
(a) Haemorrhage Early in Pregnancy
9
10
11
12
13
Ra
te o
f A
bo
rtio
n M
orb
idity p
er
1,0
00
Wo
me
n
2005 2010 2015
Year
Treatment (D.F.) Synthetic Control
(b) Abortion Morbidity
Notes: Left-hand panel displays all morbidity classified as ICD codes O02-O08 (for reasons relating to abortion). Right handpanel displays morbidity for haemorrhage early in pregnancy (prior to week 20 of gestation). In each case synthetic controlsare based on a pool of the 30 other states of Mexico (excluding Mexico DF and Mexico State), and are selected based on ratesof abortion morbidity in all pre-reform years. Morbidity is per 1,000 women aged 15-49 residing in the state.
tailed test suggests a p-value of 0.06, respectively implying that only 9% of placebo outcomes result in an
average post-placebo change which is more extreme than the true post-treatment change in D.F, and only
6% of placebos have a larger reduction. In the right-hand panel of Figure 6 we observe similar placebo
estimates for abortion related morbidity. In line with the slower-reduction in abortion-related morbidity,
we do not observe that the outcome inMexico DF is more extreme than all placebo outcomes until multiple
years post-reform. Only in 2014 and 2015 is the difference more extreme in the true treated state than each
placebo iteration. Complete randomization inference similarly suggests that average treatment effects over
the whole reform period are less extreme than in the case of haemorrhage. Specifically, two-tailed tests
suggest a p-value of 0.19, or 0.087 in the case of one-tailed tests (Appendix Figure A9).
5.3 Maternal Mortality
Moving from maternal morbidity to maternal mortality, we observe a reduction by various orders of mag-
nitude in the frequency of events, in line with the oft-cited metaphor that maternal mortality is the tip of
the iceberg, to maternal morbidity’s base (see for example Firoz et al. (2013)). In general this makes it
31

Figure 6: Inference: The Impact of Abortion Reform on Maternal Morbidity
−5
0
5
2005 2010 2015
Year
Mexico D.F. Placebo Permutations
(a) Haemorrhage Early in Pregnancy
−4
−2
0
2
4
2005 2010 2015
Year
Mexico D.F. Placebo Permutations
(b) Abortion Morbidity
Notes: Inference for synthetic control estimates of the impact of the ILE reform on morbidity based on placebo permutations aredisplayed. Each panel displays the difference between Mexico DF and its synthetic control (as a thick solid line), and 30 otherplacebo permutations, where the remaining states are considered as treated in 2006, and their synthetic control is determinedbased on an identical procedure as for Mexico DF. These are displayed as thin dashed lines.
considerably more difficult to estimate precise impacts on maternal mortality. Given this, and challenges
in forming an appropriate counterfactual state for Mexico DF,27 we focus here on DD and event study
estimates, and examine pre-trends in event studies to determine whether impacts appear to be driven by
previously existing differences.
In Table 5we present DD estimates following equation 1 for both all maternal deaths (columns 1-4), and
only maternal deaths originating from abortive causes (columns 5-8). When focusing on the ILE reform,
we observe mixed evidence pointing in the direction of negative, though often imprecisely estimated,
point estimates. Both weighted and unweighted estimates suggest a significant reduction in all maternal
deaths following ILE (columns 1 and 2), of approximately 0.6 per 100,000 fertile aged women (versus a
mean value of 4 deaths per 100,000 women in Mexico). Note however, that when adding time-varying
controls in columns 3 and 4, these estimates are reduced by about one third, and become statistically
insignificant at typical levels. Similarly, in the case of abortion related maternal mortality, we observe
significant reductions when using weighted or unweighted simple DD models (with point estimates of bet-27In particular, given wider year-to-year variation in rates of abortion in Mexico DF and potential donor states, the Mean
Squared Prediction Error in the pre-reform periods in the synthetic control estimate is quite large, and often extremely largewhen undertaking placebo estimates.
32

Table5:
Difference-in
-DifferencesE
stimates
ofLegalR
eformso
nMaternalM
ortality
AllMaternalM
ortality
MaternalM
ortalityduetoAbortion
(1)
(2)
(3)
(4)
(5)
(6)
(7)
(8)
Post-ILE
Reform(DF)
-0.663**
-0.669**
-0.414
-0.658
-0.109**
-0.074*
-0.034
-0.038
(0.273)
(0.317)
(0.590)
(0.585)
(0.050)
(0.044)
(0.077)
(0.071)
PostRegressiveLawChange
-0.502
-0.543
-0.478
-0.580
-0.090
-0.036
-0.081
-0.042
(0.340)
(0.376)
(0.335)
(0.363)
(0.057)
(0.047)
(0.053)
(0.045)
Observations
512
512
512
512
512
512
512
512
Meanof
DependentVariable
4.028
4.028
4.028
4.028
0.276
0.276
0.276
0.276
StateandYearFE
sY
YY
YY
YY
YPopulationWeights
YY
YY
Time-VaryingContro
lsY
YY
YNotes:Each
columndisplays
adiffe
rence-in-differencesregression
oftheimpact
ofabortionreform
onratesof
maternalm
ortality.
Maternalm
ortality(allcauses)andmaternalm
ortalityforabortivecauses
areeach
measuredas
totald
eathsper100,000fertileaged
wom
eneach
year,and
averagelevelsinthefullsetofd
ataareavailableatthefootof
thetable.
Allstandard
errorsareclusteredatthe
levelofthe
state.
33

ween -0.07 to -0.10 per 100,000 fertile aged women), though these become insignificant with the inclusion
of time-varying controls.
In the case of regressive reforms we find, across the board, relatively little evidence of any impacts of
these reforms on maternal mortality. We do consistently observe negative point estimates of a magnitude
approaching that observed in Mexico DF following the ILE reform, however regardless of specifications
estimated, we never observe a significant reduction in maternal mortality. We note however that, as dis-
cussed, standard errors are quite wide, thus precluding us from concluding that these estimates suggest
tightly estimated zero-impacts.
Figure 7: Event Studies for Rates of Maternal Mortality
−2
−1
01
23
−6 −5 −4 −3 −2 −1 0 1 2 3 4 5 6 7 8
Time to Reform
Point Estimate 95% CI
(a) Progressive Abortion Reform (ILE)
−2
−1
01
23
−8 −7 −6 −5 −4 −3 −2 −1 0 1 2 3 4 5 6 7 8
Time to Reform
Point Estimate 95% CI
(b) Regressive Abortion Laws (Legislative Tightening)
Notes: Event studies examine the impact of abortion reforms on maternal deaths (measured as deaths per 100,000 women offertile age). Additional notes related to the procedure are provided in Figure 3.
Thesewide confidence intervals can be observed in event studies presented in Figures 7 (for all maternal
mortality) and 8 (for maternal mortality due to abortion). Each event study includes full time-varying
controls, and is weighted by the population of fertile aged women. In the case of all mortality, pre-reform
point estimates in both progressive and regressive states consistently include zero, and with the exception
of 6 periods prior to the passage of reforms in DF are located within 0.1 death per 100,000 women of a
zero impact. In the post-reform period, we observe no significant impact in the case of the ILE reform, and
in the case of regressive reforms observe two coefficients various years post-reform (four and eight years
34

Figure 8: Event Studies for Rates of Maternal Mortality due to Abortion−
.4−
.20
.2.4
−6 −5 −4 −3 −2 −1 0 1 2 3 4 5 6 7 8
Time to Reform
Point Estimate 95% CI
(a) Progressive Abortion Reform (ILE)
−.4
−.2
0.2
.4
−8 −7 −6 −5 −4 −3 −2 −1 0 1 2 3 4 5 6 7
Time to Reform
Point Estimate 95% CI
(b) Regressive Abortion Laws (Legislative Tightening)
Notes: Event studies examine the impact of abortion reforms on maternal deaths (measured as deaths per 100,000 womenof fertile age) where maternal deaths are classified as due to abortion (ICD codes O02-O08). Additional notes related to theprocedure are provided in Figure 3.
respectively) which point to a reduction in maternal deaths. While this may reflect some disincentive effect
flowing from increased sanctions on (illegal) abortion, we note that this is never observed to be significant
in mean estimates displayed in DD models.
In the case of maternal mortality due to abortion, once again we observe pre-reform impacts which are
not statistically distinguishable from zero. In Figure 8a we observe a divergence in rates of mortality in the
post-reform period following the passage of ILE. In the 8 post-reform years, each point estimate is negative,
and 6 of 8 are statistically significant at the 95% level. In general, these point estimates cluster around -0.2
deaths per 100,000 live births, which is close to the average level of maternal deaths due to abortion in all
of Mexico in the period under study (0.276 deaths per 100,000 fertile-aged women). For comparison, the
average level of maternal deaths due to abortion in Mexico DF only, and in the pre-reform period of 2001-
2006 is approximately 0.5 deaths per 100,000 fertile-aged women. Figure 8b plots the same event study
coefficients and standard errors for rates of maternal deaths due to abortion in states passing regressive
abortion reforms. In this case we observe relatively little evidence of a change in maternal deaths. While
once again we observe largely negative point estimates, only in one case (three years following passage)
does this point estimate significantly differ from zero.
35

5.4 Understanding impacts of abortions laws
Sensitive Populations Previous studies on abortion laws (see Table 1), suggest that these have a par-
ticularly strong effect among sensitive populations such as young and low SES women. We examine
heterogeneous effects of abortions laws by age groups. Similar to previous studies described above, we
find a particularly strong negative impact on teenage fertility (women aged 15-19) and on fertility among
the age groups of 20-24, 25-29 and 30-34 years. When expressed in percentage terms, we observe that rates
of birth among teenagers fall by 7.8%. We document DD estimates in Appendix Table A6, and synthetic
control estimates for each age group in Appendix Figure A10.
In linewith this, we observe a larger drop inmorbidity among youngerwomen. Difference-in-difference
estimates suggest that the impacts of the reform on abortion morbidity is driven largely by women under
the age of 25, and in the case of haemorrhage, while transversal results are observed across age groups,
these are largest for those aged between 15 and 34. These results are observed both when considering DD
results (Appendix Table A6), as well as in synthetic control analyses (presented in Appendix Figures A11-
A12). Given the relatively small number of maternal deaths in quinquennial age groups and corresponding
lack of power, we do not estimate reform impacts on maternal mortality by age group.
De Jure versus De Facto Legal Reforms In general we find relatively little impact of regressive law
changes on resulting fertility, morbidity or mortality. One potential explanation of this is that the although
de jure changes were made to state constitutions, the de facto implementation of laws and penal codes was
unchanged. As we document in Appendix Table A7, in many cases, while constitutions were altered—
generally to declare that human life begins at conception—this did not always translate in concrete legal
changes in the criminal sanctions imposed on women or abortion providers. This has been similarly noted
in legal analyses of the reform (Singh et al., 2012b). And even in cases where criminal sanctions were
increased, it may be the case that state-level judiciaries do not alter the likelihood of imposing sanctions
on abortion.
We examine whether there is evidence of changes in the likelihood of being sentenced to prison for
undertaking an abortion, or in the length of prison sentences received, based on the passage of the abortion36

Table 6: Difference-in-Differences Estimates of Abortion Reforms on Judicial Outcomes
Number of Prison Sentences Length of Prison Sentences
(1) (2) (3) (4)
Post-ILE Reform (DF) -4.111*** -4.233*** 2.744 2.689(0.245) (0.339) (2.386) (2.066)
Post-Regressive Law Change -0.673 -1.374** 4.148* 5.226**(0.456) (0.569) (2.351) (2.426)
Observations 288 288 176 176Mean of Dependent Variable 1.819 1.819 3.676 3.676
State and Year FEs Y Y Y YPopulation Weights Y YDifference-in-difference models illustrate how abortion reforms correlate with prison sentences handed downby the judiciary, and the length of these prison sentences in years. Total number of sentences and the averagelength of prison sentences are generated from administrative records captured inMexico’s Judicial Statistics onPenal Matters. This is the universe of judiciary decisions in the country based on the first legal judgement, andso does not include any subsequent appeals. Analysis of the length of prison sentences presented in columns 3and 4 is conditional on any prison sentences being handed down in each state and year. Prison sentence lengthsare calculated from a categorical variable capturing bins of between 6 months and two years, and in each casewe record the total years (or fractions of years) based on the midpoint of each bin. Bins are consistently usedin the period displayed here. All standard errors are clustered at the level of the state and calculated using awild bootstrap procedure.
laws examined in this paper. DD results following specification 1 are displayed in Table 6. Here we
examine the universe of all custodial sentences handed down by theMexican judiciary. We observe, firstly,
that there is a sharp reduction in the number of prison sentences in Mexico DF following the reform (in line
with the legalisation of abortion), and no significant change in sentence length handed down in Mexico
DF.28 Importantly, we observe evidence of a dual impact in regressive states. We observe mixed evidence
pointing to a slight reduction in the number of prison sentences handed down, falling by 1.374 cases in
weighted regressions (compared with a mean number of sentences per state and year of 1.819). In the case
of the length of sentences, we observe a considerable increase, of between 4.1 and 5.3 years, depending on
the specification estimated. In the case of weighted estimates, we observe an average increase of 5.3 years
(95% confidence interval ranging from 0.5 to 10 years), which is significant, even at the lower end of the
95% confidence interval, when compared with the mean sentence length of 3.7 years. Thus, these results
28Note that in Mexico DF, while abortion was legalised by the ILE reform, this was only the case for abortions realisedup to 12 weeks of gestation. Thus, in theory, custodial sentences can still be handed down for abortion when not meeting thiscondition. In practice, a non-zero number of sentences was only observed in Mexico DF in 2011 (refer to Appendix Figure A3for trends over time).
37

suggest that while the changes in law did not necessarily always prescribe a change in prison sentences,
there is a detectable increase in the length of prison sentences observed in administrative data, conditional
on being sentenced to prison. This increase in average sentence length is observed to hold in event study
analysis, with significant impacts observed from 1 year post-reform onwards (see Appendix Figure A13).
Leakage to the Private Health System One potential alternative explanation of the observed morbidity
results in all public hospitals is that rather than being driven entirely by the abortion reform, they may
reflect changes of usage of the health system, with a larger number of women opting to use the private
health care system. This explanation cannot explain the impact on fertility and maternal mortality, as these
outcomes are based on the complete records of births and deaths in the country. However, it could partially
explain the impacts observed on morbidity, as our administrative data records inpatient stays in the public
health system (refer to section 3 for additional discussion).
While we can’t consistently merge public and private health data at the most dissagregated level of mor-
bidity causes, we are able to consider all causes of abortion morbidity in the private health care system.29
In Appendix Figure A18 we plot rates of abortion related morbidity in the universe of private hospitals
(left-hand panel) and the universe of public hospitals (right-hand panel). These descriptive plots suggest
that if anything, results in the private system will only strengthen our estimates, as we observe a sharper
reduction in abortion related morbidity in private hospitals than we observe in public hospitals. In the case
of morbidity due to haemorrhage early in pregnancy, we are unable to observe this as a sole cause in the
private health records, but we are able to observe the class in which this cause falls (refer to Appendix
Table A2 which provides the description of how public and private records can be matched). Once again,
although we are unable to isolate only haemorrhage morbidity, we observe a considerably sharper reduc-
tion in morbidity following the reform in the private health system than we observe in the public health
system (refer to Appendix Figure A19). In general, these results suggest that focusing only on the public
health care system results in a lower bound estimate of the true reform impact on all maternal health.
29Note that as documented in Appendix Table A2, this mapping captures all ICD-10 codes O00-O08, while typically abortionmorbidity is calculated from codes O02-O08. In Figure A18 we plot comparisons using precisely the same aggregated codes inpublic and private hospitals.
38
Reform Spillovers As outlined in section 2.3, the ILE reform was not strictly limited to residents of
Mexico DF. Recent evidence from the United States documents a willingness to travel over a significant
distance to access abortion providers (Cunningham et al., 2017). In Appendix Table A8 we provide sum-
mary figures of the state of precedence of users of abortion services in Mexico DF based on administrative
data for 2007-2015. While the majority of users (72.5%) are women from Mexico DF, women residing all
throughout Mexico have access to ILE. The largest non-DF population comes from nearby Mexico State
(24.2%). In general, users of the ILE reform are clustered in states geographically close to Mexico DF.
A descriptive plot is presented in Appendix Figure A14. Residents in Mexico DF have by far the highest
rate of abortion, at 5.8 abortions per 1,000 women aged 15-49, followed by Mexico State (at 1 per 1,000),
and then two nearby states (Hidalgo and Morelos) with rates of 0.1 per 1,000. Remaining states have rates
which are an additional order of magnitude lower than this.
Despite geographic spillovers in access consistent with those documented in Cunningham et al. (2017),
we do not observe clear evidence of changes in birth or maternal health outcomes in nearby states. In Table
7, we present estimates comparing each of Mexico State, Morelos and Hidalgo (the three states with most
considerable abortion usage per population) to their synthetic control state. For comparison we present
synthetic control estimates from Mexico DF from Figure 2 (births) and Figure 5 (morbidity). In each
case, the synthetic control is chosen from among all remaining states (ie all states except for Mexico DF,
Mexico State, Morelos and Hidalgo). Along with estimates, p-values are presented, which quantify the
proportion of placebo iterations resulting in more extreme estimates than the difference between the state
in interest and its synthetic control. Here, placebos are all permutations of donor states and years. In each
of the three non-DF states where the largest proportion of abortions were performed, no significant impact
was observed on rates of birth, or maternal morbidity. Point estimates are both considerably smaller in
magnitude to those from Mexico DF (the largest is a reduction of 2 births per 1,000 women in the state
of Morelos), and p-values all suggest little evidence to reject null hypotheses of no spillover impacts of
reforms on these outcomes in this time period.
An alternative model which captures both the impacts of the reform inMexico DF as well as any reform
spillovers to the rest of the country, replaces the ILE variable in equation 1 with the intensity of treatment
39
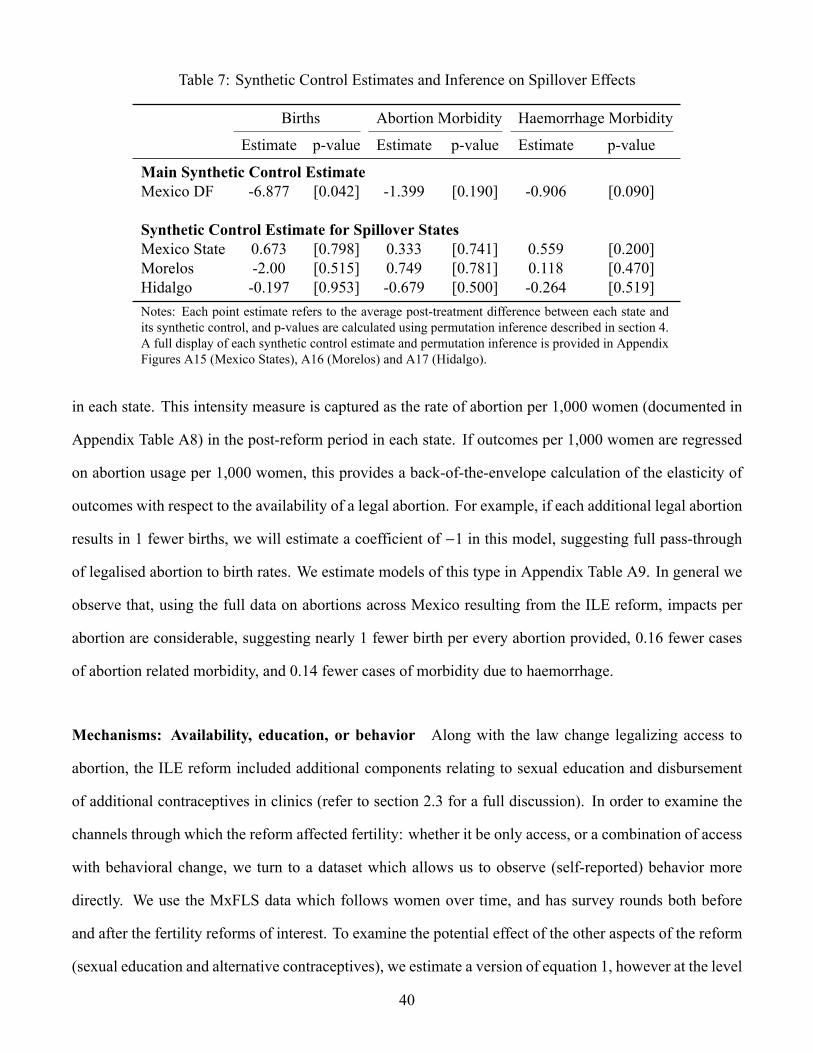
Table 7: Synthetic Control Estimates and Inference on Spillover Effects
Births Abortion Morbidity Haemorrhage Morbidity
Estimate p-value Estimate p-value Estimate p-value
Main Synthetic Control EstimateMexico DF -6.877 [0.042] -1.399 [0.190] -0.906 [0.090]
Synthetic Control Estimate for Spillover StatesMexico State 0.673 [0.798] 0.333 [0.741] 0.559 [0.200]Morelos -2.00 [0.515] 0.749 [0.781] 0.118 [0.470]Hidalgo -0.197 [0.953] -0.679 [0.500] -0.264 [0.519]Notes: Each point estimate refers to the average post-treatment difference between each state andits synthetic control, and p-values are calculated using permutation inference described in section 4.A full display of each synthetic control estimate and permutation inference is provided in AppendixFigures A15 (Mexico States), A16 (Morelos) and A17 (Hidalgo).
in each state. This intensity measure is captured as the rate of abortion per 1,000 women (documented in
Appendix Table A8) in the post-reform period in each state. If outcomes per 1,000 women are regressed
on abortion usage per 1,000 women, this provides a back-of-the-envelope calculation of the elasticity of
outcomes with respect to the availability of a legal abortion. For example, if each additional legal abortion
results in 1 fewer births, we will estimate a coefficient of −1 in this model, suggesting full pass-through
of legalised abortion to birth rates. We estimate models of this type in Appendix Table A9. In general we
observe that, using the full data on abortions across Mexico resulting from the ILE reform, impacts per
abortion are considerable, suggesting nearly 1 fewer birth per every abortion provided, 0.16 fewer cases
of abortion related morbidity, and 0.14 fewer cases of morbidity due to haemorrhage.
Mechanisms: Availability, education, or behavior Along with the law change legalizing access to
abortion, the ILE reform included additional components relating to sexual education and disbursement
of additional contraceptives in clinics (refer to section 2.3 for a full discussion). In order to examine the
channels through which the reform affected fertility: whether it be only access, or a combination of access
with behavioral change, we turn to a dataset which allows us to observe (self-reported) behavior more
directly. We use the MxFLS data which follows women over time, and has survey rounds both before
and after the fertility reforms of interest. To examine the potential effect of the other aspects of the reform
(sexual education and alternative contraceptives), we estimate a version of equation 1, however at the level
40
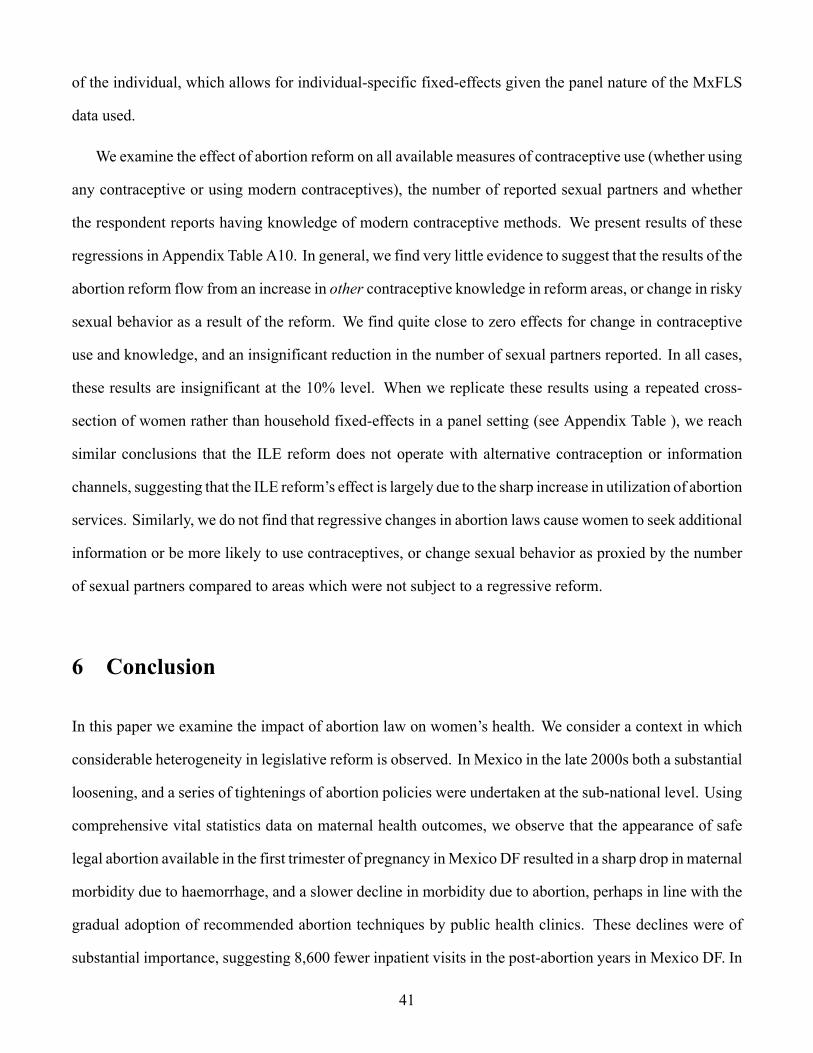
of the individual, which allows for individual-specific fixed-effects given the panel nature of the MxFLS
data used.
We examine the effect of abortion reform on all available measures of contraceptive use (whether using
any contraceptive or using modern contraceptives), the number of reported sexual partners and whether
the respondent reports having knowledge of modern contraceptive methods. We present results of these
regressions in Appendix Table A10. In general, we find very little evidence to suggest that the results of the
abortion reform flow from an increase in other contraceptive knowledge in reform areas, or change in risky
sexual behavior as a result of the reform. We find quite close to zero effects for change in contraceptive
use and knowledge, and an insignificant reduction in the number of sexual partners reported. In all cases,
these results are insignificant at the 10% level. When we replicate these results using a repeated cross-
section of women rather than household fixed-effects in a panel setting (see Appendix Table ), we reach
similar conclusions that the ILE reform does not operate with alternative contraception or information
channels, suggesting that the ILE reform’s effect is largely due to the sharp increase in utilization of abortion
services. Similarly, we do not find that regressive changes in abortion laws cause women to seek additional
information or be more likely to use contraceptives, or change sexual behavior as proxied by the number
of sexual partners compared to areas which were not subject to a regressive reform.
6 Conclusion
In this paper we examine the impact of abortion law on women’s health. We consider a context in which
considerable heterogeneity in legislative reform is observed. In Mexico in the late 2000s both a substantial
loosening, and a series of tightenings of abortion policies were undertaken at the sub-national level. Using
comprehensive vital statistics data on maternal health outcomes, we observe that the appearance of safe
legal abortion available in the first trimester of pregnancy inMexico DF resulted in a sharp drop in maternal
morbidity due to haemorrhage, and a slower decline in morbidity due to abortion, perhaps in line with the
gradual adoption of recommended abortion techniques by public health clinics. These declines were of
substantial importance, suggesting 8,600 fewer inpatient visits in the post-abortion years in Mexico DF. In
41

general, we observe quite weak effects of the tightening of de facto sanctions on abortion, even though, as
we show, these sanctions did lead to changes in the length of sentences handed down to women.
We document that the impact of Mexico DF’s ILE reform on fertility is in line with impacts estimated
in other settings, for example the US in the 1970s. Our estimates suggest that fertility declined by approx-
imately 5-6% in the years following the reform. We observe generally weak effects of regressive reforms
on fertility, though note that in the case of Mexico, these state-level reforms may have reduced fertility by
around 1-2%. Importantly, when examining the impacts of abortion reforms on rates of maternal death,
our estimates are considerably noisier than those for maternal morbidity. This is of importance given that
a range of papers examining the impact of abortion on women’s health limit analyses to maternal death,
given a paucity of high-quality health records. Our results suggest that this focus on “the tip of the iceberg”
may lead to less convincing results than when focusing on maternal morbidity. While focusing on surviv-
ing child birth should be an absolute minimum when designing public policies to protect maternal and
women’s health, maternal morbidity is of considerable importance when quantifying life-time well-being,
and avoiding a considerable health burden leading to chronic conditions.
The results of this paper are becoming relevant once again as a number of countries revisit abortion
legislation and attempt to make considerable changes in constitutions and penal codes. Among others,
legislative reforms have been undertaken or attempted in Ireland, Argentina and Chile in 2017-2018 fo-
cusing on legalising abortion in certain circumstance, and increasing restrictions have been enacted or
proposed in Poland and a number of US states. This paper documents that these policies are likely to have
a considerable impact on women’s health and well-being.
42

ReferencesAbadie, A., A. Diamond, and J. Hainmueller (2010): “Synthetic Control Methods for Comparative CaseStudies: Estimating the Effect of California’s Tobacco Control Program,” Journal of the American Sta-tistical Association, 105, 493–505.
Ananat, E. O., J. Gruber, and P. Levine (2007): “Abortion Legalization and Life-Cycle Fertility,” Journalof Human Resources, XLII, 375–397.
Ananat, E. O., J. Gruber, P. B. Levine, and D. Staiger (2009): “Abortion and Selection,” Review of Eco-nomics and Statistics, 91, 124–136.
Ananat, E. O. and D. M. Hungerman (2012): “The power of the pill for the next generation: oral contra-ception’s effects on fertility, abortion, and maternal and child characteristics,” Review of Economics andStatistics, 94, 37–51.
Angrist, J. D. and W. N. Evans (1996): “Schooling and Labor Market Consequences of the 1970 StateAbortion Reforms,” NBER Working Papers 5406, National Bureau of Economic Research, Inc.
Bailey, M. J. (2009): “Erratum and Addendum to “More Power to the Pill: The Impact of ContraceptiveFreedom on Women’s Life Cycle Labor Supply”,” Posted at The Quarterly Journal of Economics.
——— (2013): “Fifty Years of Family Planning: New Evidence on the Long-Run Effects of IncreasingAccess to Contraception,” Brookings Papers on Economic Activity, 46, 341–409.
Becker, D. (2013): “Decriminalization of Abortion inMexico City: The Effects onWomen’s ReproductiveRights,” American Journal of Public Health, 103, 590–593.
Benson, J., K. Andersen, and G. Samandari (2011): “Reductions in abortion-related mortality followingpolicy reform: evidence from Romania, South Africa and Bangladesh,” Reproductive health, 8, 39.
Berer, M. (2017): “Abortion law and policy around the world: in search of decriminalization,” Health andhuman rights, 19, 13.
Bitler, M. andM. Zavodny (2001): “The effect of abortion restrictions on the timing of abortions,” Journalof Health Economics, 20, 1011–1032.
Blanco-Mancilla, G. (2011): “Implementation of health policies in Mexico City: what factors contribute tomore effective service delivery?” Ph.D. thesis, The London School of Economics and Political Science(LSE).
Bracken, M. B., D. H. Freeman Jr, and K. Hellenbrand (1982): “Hospitalization for medical-legal andother abortions in the United States 1970-1977.” American Journal of Public Health, 72, 30–37.
Chowdhury, M. E., R. Botlero, M. Koblinsky, S. K. Saha, G. Dieltiens, and C. Ronsmans (2007): “Deter-minants of reduction in maternal mortality in Matlab, Bangladesh: a 30-year cohort study,” The Lancet,370, 1320–1328.
Ciudad de México (2007): “Gaceta Oficial del Distrito Federal,” Gaceta Oficial, No 70, Órganodel Gobierno del Distrito Federal, 26 April, 2007, accessed at http://web.archive.org/web/20150924024041/http://www.inmujeres.df.gob.mx/wb/inmujeres/decreto_por_el_que_se_reforma_el_codigo_penal_para (consulted April 26, 2016).
43

Consejo Nacional de Población (2012): “Proyecciones de la población de México 2010–2050,” Tech. Rep.Documento Metodológico, CONAPO.
Conti, J. A., A. R. Brant, H. D. Shumaker, and M. F. Reeves (2016): “Update on abortion policy,” CurrentOpinion in Obstetrics and Gynecology, 28, 517–521.
Contreras, X., M. G. van Dijk, T. Sanchez, and P. S. Smith (2011): “Experiences and Opinions of Health-Care Professionals Regarding Legal Abortion in Mexico City: A Qualitative Study,” Studies in FamilyPlanning, 42, 183–190.
Cook, P. J., A. M. Parnell, M. J. Moore, and D. Pagnini (1999): “The effects of short-term variation inabortion funding on pregnancy outcomes,” Journal of Health Economics, 18, 241 – 257.
Cunningham, S., J. M. Lindo, C. Myers, and A. Schlosser (2017): “How Far Is Too Far? New Evidence onAbortion Clinic Closures, Access, and Abortions,” Working Paper 23366, National Bureau of EconomicResearch.
Darney, B. G., B. Saavedra-Avendano, and R. Lozano (2017): “Maintaining rigor in research: flaws in arecent study and a reanalysis of the relationship between state abortion laws and maternal mortality inMexico,” Contraception, 95, 105–111.
Doan, A. (2009): Opposition and intimidation: The abortion wars and strategies of political harassment,University of Michigan Press.
Firoz, T., D. Chou, P. von Dadelszen, P. Agrawal, R. Vanderkruik, O. Tunçalp, N. v. Laura A Magee, andL. Say (2013): “Measuring maternal health: focus on maternal morbidity,” Bulletin of the World HealthOrganization, 91, 794–796.
Fischer, S., H. Royer, and C.White (2017): “The Impacts of Reduced Access to Abortion and Family Plan-ning Services: Evidence from Texas,” Working Paper 23634, National Bureau of Economic Research.
Fraser, B. (2015): “Tide begins to turn on abortion access in South America,” The Lancet, 383, 2113 –2114.
Freyaldenhoven, S., C. Hansen, and J. M. Shapiro (2018): “Pre-event Trends in the Panel Event-studyDesign,” Working Paper 24565, National Bureau of Economic Research.
GamboaMontejano, C. and S. Valdés Robledo (2014): “Regulación del Aborto enMéxico: Derecho Com-parado de los 31 estados y del Distrito Federal, así como de diversos países en el mundo y estadísticasdel INEGI en el tema,” SAPI-ISS 33-14, Subdirección de Análisis de Política Interior.
Ganatra, B., C. Gerdts, C. Rossier, B. R. Johnson Jr, Ö. Tunçalp, A. Assifi, G. Sedgh, S. Singh, A. Bankole,A. Popinchalk, et al. (2017): “Global, regional, and subregional classification of abortions by safety,2010–14: estimates from a Bayesian hierarchical model,” The Lancet, 390, 2372–2381.
Gerdts, C., D. Vohra, and J. Ahern (2013): “Measuring Unsafe Abortion-Related Mortality: A SystematicReview of the Existing Methods,” PLos ONE, 8, e53346.
Gobierno de Nayarit (2009): “Exposición de Motivos; Reformo y Adición al Artículo 7, Fracción XI, de laConstitución Política del Estado Libre y Soberano de Nayarit y cómputo y Declaratoria de Aprobaciónde la Reforma,” Periódico Oficial 079, Organo del Gobierno de Nayarit.
44

Goldstein, P. and G. Stewart (1972): “Trends in therapeutic abortion in San Francisco.” American journalof public health, 62, 695–699.
Grimes, D. A. (2005): “Risks of mifepristone abortion in context,” Contraception, 71, 161.
Grimes, D. A., J. Benson, S. Singh, M. Romero, B. Ganatra, F. E. Okonofua, and I. H. Shah (2006):“Unsafe Abortion: The Preventable Pandemic,” The Lancet, 368, 1908–1919.
Gruber, J., P. Levine, and D. Staiger (1999): “Abortion Legalization and Child Living Circumstances:Who is the “Marginal Child”?” The Quarterly Journal of Economics, 114, 263–291.
Guldi, M. (2008): “Fertility Effects of Abortion and Birth Control Pill Access for Minors,” Demography,45, 817–827.
Gutierrez-Vazquez, E. Y. and E. A. Parrado (2015): “Abortion Legalization and Fertility Rates in Mexico,”Unpublished manuscript, University of Pennsylvania, available at http://paa2015.princeton.edu/uploads/151146.
Henderson, J. T., M. Puri, M. Blum, C. C. Harper, A. Rana, G. Gurung, N. Pradhan, K. Regmi, K. Malla,S. Sharma, et al. (2013): “Effects of abortion legalization in Nepal, 2001–2010,” PloS one, 8, e64775.
Hubacher, D. and J. Trussell (2015): “A definition of modern contraceptive methods,” Contraception, 92,420–421.
Instituto Nacional de Estadística y Geografía (2012): “Derecho a la identidad. La cobertura del registro denacimiento en México en 1999 y 2009,” Tech. rep., INEGI and UNICEF.
Jewkes, R., H. Brown, K. Dickson-Tetteh, J. Levin, H. Rees, et al. (2002): “Prevalence of morbidityassociated with abortion before and after legalisation in South Africa,” British Medical Journal, 324,1252–1253.
Jewkes, R., H. Rees, K. Dickson, H. Brown, and J. Levin (2005): “The impact of age on the epidemiologyof incomplete abortions in South Africa after legislative change,” BJOG: An International Journal ofObstetrics & Gynaecology, 112, 355–359.
Johnson, T. (2013): “Guaranteed Access to Safe and Legal Abortions: The True Revolution of MexicoCity’s Legal Reforms Regarding Abortion,” Columbia Human Rights Law Review, 44, 437–476.
Joyce, T. and R. Kaestner (1996): “The effect of expansions in medicaid income eligibility on abortion,”Demography, 33, 181–192.
Joyce, T., R. Kaestner, and S. Colman (2006): “Changes in Abortions and Births Following Texas’sParental Notification Law,” New England Journal of Medicine, 354, 1031–1038.
Joyce, T., R.-D. Tan, andY. Zhang (2013): “Abortion Before andAfterRoe,” Journal of Health Economics,32, 804–815.
Juarez, F., S. Singh, S. G. Garcia, and C. D. Olavarrieta (2008): “Estimates of induced abortion in Mexico:what’s changed between 1990 and 2006?” International Family Planning Perspectives, 158–168.
Juarez, F., S. Singh, I. Maddow-Zimet, and D.Wulf (2013): “Unintended Pregnancy and Induced Abortionin Mexico: Causes and Consequences,” Tech. rep., Guttmacher Institute, New York.
45

Kahan, R. S., L. D. Baker, and M. G. Freeman (1975): “The effect of legalized abortion on morbidityresulting from criminal abortion,” American Journal of Obstetrics & Gynecology, 121, 114–116.
Kane, T. J. and D. Staiger (1996): “Teen Motherhood and Abortion Access,” Quarterly Journal of Eco-nomics, 111, 467–506.
Koch, E., M. Chireau, F. Pliego, J. Stanford, S. Haddad, B. Calhoun, P. Aracena, M. Bravo, S. Gatica, andJ. Thorp (2015): “Abortion legislation, maternal healthcare, fertility, female literacy, sanitation, violenceagainst women and maternal deaths: a natural experiment in 32Mexican states,” BMJ open, 5, e006013.
Kulczycki, A. (2011): “Abortion in Latin America: Changes in Practice, Growing Conflict, and RecentPolicy Developments,” Studies in Family Planning, 42, 199–220.
Kulier, R., A. Gülmezoglu, G. Hofmeyr, L. Cheng, and A. Campana (2007): “Medical methods for firsttrimester abortion (Review),” in he Cochrane Library, ed. by T. C. Collaboration, John Wiley & Sons,Ltd.
Lahey, J. N. (2014): “The Effect of Anti-Abortion Legislation on Nineteenth Century Fertility,” Demog-raphy, 51, 939–948.
Lara, D., S. G. García, K. S. Wilson, and F. Paz (2011): “How often and under which circumstances doMexican pharmacy vendors recommend misoprostol to induce an abortion?” International perspectiveson sexual and reproductive health, 75–83.
Levine, P. B., D. Staiger, T. J. Kane, and D. J. Zimmerman (1999): “Roe v Wade and American fertility.”American Journal of Public Health, 89, 199–203.
Levine, P. B., A. B. Trainor, and D. J. Zimmerman (1996): “The effect of Medicaid abortion fundingrestrictions on abortions, pregnancies and births,” Journal of Health Economics, 15, 555–578.
Li, A. (2018): “From Ireland to Northern Ireland: campaigns for abortion law,” .
Loudon, I. (1992): Death in Childbirth. An international study of maternal care and maternal mortality1800-1950. 1992, Oxford: Clarendon Press Oxford.
Lu, Y. and D. J. Slusky (2016): “The Impact of Women’s Health Clinic Closures on Fertility,” WORKINGPAPERS SERIES IN THEORETICAL AND APPLIED ECONOMICS 201607, University of Kansas,Department of Economics.
Madrazo, A. (2009): “The evolution of Mexico City’s abortion laws: From public morality to women’sautonomy,” International Journal of Gynecology & Obstetrics, 106, 266 – 269.
Mbele, A., L. Snyman, and R. C. Pattinson (2006): “Impact of the Choice on Termination of PregnancyAct on maternal morbidity and mortality in the west of Pretoria,” South African Medical Journal, 96,1196–1198.
Mitrut, A. and F.-C. Wolff (2011): “The Impact of Legalized Abortion on Child Health Outcomes andAbandonment. Evidence from Romania,” Journal of Health Economics, 30, 1219–1231.
Mølland, E. (2016): “Benefits from delay? The effect of abortion availability on young women and theirchildren,” Labour Economics, 43, 6–28.
46

Mondragón y Kalb, M., A. Ahued Ortega, J. Morales Velazquez, C. Diaz Olavarrieta, J. Valencia Ro-driguez, D. Becker, and S. Garcia (2011): “Patient characteristics and service trends following abortionlegalization in Mexico City, 2007-10,” American journal of public health, 3, 159–66.
Myers, C. K. (2017): “The Power of Abortion Policy: Reexamining the Effects of YoungWomen’s Accessto Reproductive Control,” Journal of Political Economy, 125, 2178–2224.
Nunes, F. E. and Y. M. Delph (1997): “Making abortion law reform work: steps and slips in Guyana,”Reproductive Health Matters, 5, 66–76.
Organization, W. H. et al. (1992): “The prevention and management of unsafe abortion. Report of a Tech-nical Working Group, Geneva 12–15 April 1992,” Geneva: World Health Organization.
Pop-Eleches, C. (2006): “The Impact of an Abortion Ban on Socioeconomic Outcomes of Children: Evi-dence from Romania,” Journal of Political Economy, 114, 744–773.
———(2010): “The Supply of Birth ControlMethods, Education, and Fertility: Evidence fromRomania,”Journal of Human Resources, 45, 971–997.
Pourette, D., C.M. ndRila Ratovoson, and P. Raharimalala (2018): “Complications with use ofmisoprostolfor abortion in Madagascar: between ease of access and lack of information,” Contraception, 97, 116–121.
Rees, H., J. Katzenellenbogen, R. Shabodien, R. Jewkes, S. Fawcus, J.Mclntyre, C. Lombard, andH. Truter(1997): “The epidemiology of incomplete abortion in South Africa,” South African Medical Journal,87, 432–437.
Romano, J. P. and M. Wolf (2005): “Exact and Approximate Stepdown Methods for Multiple HypothesisTesting,” Journal of the American Statistical Association, 100, 94–108.
Sahatci, E. (1993): “Legal abortion improved women’s health in Albania.” Newsletter (Women’s GlobalNetwork on Reproductive Rights), 10.
Schiavon, R., M. E. Collado, E. Troncoso, J. E. S. Sánchez, G. O. Zorrilla, and T. Palermo (2010): “Char-acteristics of private abortion services in Mexico City after legalization,” Reproductive Health Matters,18, 127–135.
Schiavon, R., E. Troncoso, and G. Polo (2012a): “Analysis of maternal and abortion-related mortality inMexico over the last two decades, 1990–2008,” International Journal of Gynecology & Obstetrics, 118,S78–S86.
——— (2012b): “Analysis of maternal and abortion-related mortality inMexico over the last two decades,1990–2008,” International Journal of Gynecology & Obstetrics, 118, Supplement 2, S78 – S86.
Serbanescu, F., L. Morris, P. Stupp, and A. Stanescu (1995): “The impact of recent policy changes onfertility, abortion, and contraceptive use in Romania,” Studies in family planning, 76–87.
Seward, P. N., C. A. Ballard, and A. L. Ulene (1973): “The effect of legal abortion on the rate of septicabortion at a large county hospital,” American Journal of Obstetrics & Gynecology, 115, 335–338.
Singh, K. and S. Ratnam (2015): “The influence of abortion legislation on maternal mortality,” Interna-tional Journal of Gynecology and Obstetrics, 63, 123–129.
47

Singh, S. and I.Maddow-Zimet (1999): “Facility-based treatment for medical complications resulting fromunsafe pregnancy termination in the developing world, 2012: a review of evidence from 26 countries,”BJOG: An International Journal of Obstetrics and Gynaecology, 123, 1489–1498.
Singh, S., L. Remez, and A. Tartaglione (2010): Methodologies for estimating abortion incidence andabortion-related morbidity: a review., Guttmacher Institute.
Singh, S., G. Sedgh, A. Bankole, R. Hussain, and S. London (2012a): “Making abortion services accessiblein the wake of legal reforms: A framework and six case studies,” Tech. rep., Guttmacher Institute.
——— (2012b): “Making abortion services accessible in the wake of legal reforms: A framework and sixcase studies,” Tech. rep., Guttmacher Institute.
Special Investigations Division, Committee of Government Reform, House of Representatives(2003): “Politics and Science in the Bush Administration. Prepared for Rep. Henry A. Waxman,”Available at: http://web.archive.org/web/20121215150603/http://democrats.oversight.house.gov/images/stories/documents/20080130103545.pdf. Accessed 2 June, 2018.
Starrs, A. M. (2017): “The Trump global gag rule: an attack on US family planning and global health aid,”The Lancet, 389, 485–486.
Stephenson, P., M. Wagner, M. Badea, and F. Serbanescu (1992): “Commentary: the public health con-sequences of restricted induced abortion–lessons from Romania.” American Journal of Public Health,82, 1328–1331.
Stewart, G. K. and P. J. Goldstein (1971): “Effects on Septic Abortion and Maternal Mortality,” Obstetrics& Gynecology, 37, 510–514.
Tatum, C., M. Rueda, J. Bain, J. Clyde, and G. Carino (2012): “Decisionmaking regarding unwantedpregnancy among adolescents in Mexico City: a qualitative study,” Studies in family planning, 43, 43–56.
Tuiran, R., V. Partida, O. Mojarro, and E. Zúñiga (2004): “Fertility in Mexico: trends and forecast,” inExpert Group Meeting on Completing the Fertility Transition, United Nations. Department of Economicand Social Affairs. PopulationDivision. NewYork, NewYork, UnitedNations, Department of Economicand Social Affairs, Population Division, Compilation, 483–506.
UNICEF (2005): “The ‘Rights’ Start to Life: A statistical analysis of birth registration,” Unicef publica-tions, UNICEF.
United Nations (2014): “Abortion Policies and Reproductive Health around the World 2014,” .
Valente, C. (2014): “Access to abortion, investments in neonatal health, and sex-selection: Evidence fromNepal,” Journal of Development Economics, 107, 225–243.
Van Lerberghe, W., A. Manuel, Z. Matthews, and W. Cathy (2005): The World Health Report 2005-makeevery mother and child count, World Health Organization.
Warriner, I. K. and I. H. Shah (2006): “Preventing unsafe abortion and its consequences: priorities forresearch and action,” .
Winikoff, B. and W. R. Sheldon (2012): “Abortion: what is the problem?” The Lancet, 379, 594 – 596.
48

Wolfers, J. (2006): “Did Unilateral Divorce Laws Raise Divorce Rates? A Reconciliation and New Re-sults,” American Economic Review, 96, 1802–20.
World Health Organization (1987): “Studying Maternal Mortality in Developing Countries: A Guide-book,” Tech. Rep. HO/FHE/87.7, WHO.
——— (2004): “Unsafe abortion: global and regional estimates of incidence of unsafe abortion and asso-ciated mortality in 2000,” .
——— (2011): “Unsafe abortion: Global and regional estimates of the incidence of unsafe abortion andassociated mortality in 2008,” Edition 6, WHO Library.
——— (2018): “Preventing unsafe abortion,” Accessed at http://www.who.int/news-room/fact-sheets/detail/preventing-unsafe-abortion (consulted August 28, 2018).
49

Appendices
Appendix Figures and Tables
Table A1: Constitutional Changes Following Mexico DF’s ILE Reforms
State Reform Date Constitutional Article inDecree Question
Baja California Dec 26, 2008 Decree 175 7Chiapas Jan 20, 2009 Decree 139 178Chihuahua Jun 21, 2008 Decree 231-08 143Colima Nov 25, 2009 Decree 296 187Durango May 31, 2009 Decree 273 350Guanajuato May 26, 2009 Dictamen 836 158Jalisco Jul 02, 2009 Decree 22361 228Morelos Dec 11, 2008 Decree 1153 115Nayarit Jun 06, 2009 Decree 50 335Oaxaca Sep 11, 2009 Decree 1383 312Puebla Jun 03, 2009 SPI-ISS-27-09∗ 136Querétaro Sep 18, 2009 P. O. 68‡ 339Quintana Roo May 15, 2009 Decree 158 92San Luis Potosí Sep 02, 2009 Decree 833 128Sonora Apr 06, 2009 Law 174 265Tamaulipas Dec 23, 2009 Decree LX-1850 356Yucatán Aug 07, 2009 Decree 219 389Veracruz Nov 17, 2009 G. L. 155‡ 150Notes: All states which formally altered their constitutions following MexicoDF’s ILE reform are indicated above. Constitutional decree refers to the lawcomposed to alter the state constitution, and article in question refers to the articlealtered in the constitution or penal code which was altered by the decree. Dates,decrees and articles are collated by the authors from various state governmentsources. The official document approving each decree and its associated date isavailable in a zipped folder on the authors’ websites.∗ Decrees or official newspapers for the State of Puebla could not be located bythe authors. The date and article in question is suggested by Gamboa Montejanoand Valdés Robledo (2014).‡ P. O. refers to the official newspaper where laws are published in Querétaro, andG. L. refers to the same newspaper in Veracruz. The law was published withoutnumber (pp. 9857-9859) in P. O. 68 and in G. L. 155 (pp 2-5) in Querétaro andVeracruz respectively.
1

Figure A1: Proportion of births and abortion in MOH-DF clinics
0.1
.2.3
.4
Pro
po
rtio
n
11−15
16−20
21−25
26−30
31−35
36−40
41−45
46−50
Mother’s Age
Proportion of Abortions Proportion of Births
Notes: Proportion of births by age are generated from administrative data provided by INEGI. Proportion of abortions by ageare compiled from summary data released by the Ministry of Health of Mexico DF.
2

FigureA2:
GeographicalD
istributionof
StateLawChanges
(postA
ugust-2
007)
No
ne
Pro
gre
ssiv
eR
eg
ressiv
e
La
w C
ha
ng
es
Notes:Th
eAugust2
007ILEreform
occurred
inMexicoDF(yellow).
Resulting(regressive)
reform
sin
otherstatesareindicatedin
red,
with
states
highlighted
inblue
indicatingthatno
lawchange
occurred
between2007
and2016.
3

Table A2: Maternal Morbidity in Mexico
ICD-10 Private Name Cases PercentCode Code
O00 236 Ectopic pregnancy 187,315 0.534O01 236 Hydatidiform mole 30,190 0.086O02 236 Other abnormal products of conception 650,198 1.852O03 234 Spontaneous abortion 335,081 0.954O04 235 Medical abortion 7,268 0.021O05 236 Other abortion 53,928 0.154O06 236 Unspecified abortion 2,153,004 6.133O07 236 Failed attempted abortion 996 0.003O08 236 Complications following abortion and ectopic/molar preg-
nancy12,047 0.034
O10 237 Complications due to Pre-Existing Hypertension 81,301 0.232O11 237 Pre-existing hypertensive disorder with superimposed protein-
uria2,504 0.007
O12 237 Gestational oedema and proteinuria without hypertension 967 0.003O13 237 Gestational hypertension without significant proteinuria 592,387 1.687O14 237 Severe pre-eclampsia 666,635 1.899O15 237 Eclampsia 49,263 0.140O16 237 Unspecified maternal hypertension 145,099 0.413O20 242 Haemorrhage in early pregnancy 677,757 1.931O21 242 Excessive vomiting in pregnancy 60,311 0.172O22 242 Venous complications in pregnancy 7,322 0.021O23 242 Infections of genitourinary tract in pregnancy 792,372 2.257O24 242 Diabetes mellitus in pregnancy 252,069 0.718O25 242 Malnutrition in pregnancy 956 0.003O26 242 Maternal care for other conditions predominantly related to
pregnancy86,511 0.246
O28 242 Abnormal findings on antenatal screening of mother 1,354 0.004O29 242 Complications of anaesthesia during pregnancy 1,104 0.003O30 239 Multiple gestation 116,853 0.333O31 239 Complications specific to multiple gestation 4,178 0.012O32 239 Maternal care for known or suspected malpresentation of fetus 377,630 1.076O33 239 Maternal care for known or suspected disproportion 1,237,260 3.524O34 239 Maternal care for known or suspected abnormality of pelvic
organs1,483,859 4.227
O35 239 Maternal care for known or suspected fetal abnormality anddamage
16,046 0.046
O36 239 Maternal care for other known or suspected fetal problems 737,348 2.100O40 239 Polyhydramnios 33,782 0.096O41 239 Other disorders of amniotic fluid and membranes 694,761 1.979O42 239 Premature rupture of membranes 1,079,039 3.074O43 239 Placental disorders 12,270 0.035O44 238 Placenta praevia 98,225 0.280
4

O45 238 Premature separation of placenta (abruptio placentae) 54,260 0.155O46 238 Antepartum haemorrhage, not elsewhere classified 8,770 0.025O47 239 False labour 1,214,865 3.461O48 239 Prolonged pregnancy 85,304 0.243O60 242 Preterm delivery 436,889 1.244O61 242 Failed induction of labour 74,634 0.213O62 242 Abnormalities of forces of labour 235,129 0.670O63 242 Long labour 263,861 0.752O64 240 Obstructed labour due to malposition and malpresentation of
fetus255,257 0.727
O65 240 Obstructed labour due to maternal pelvic abnormality 478,134 1.362O66 240 Other obstructed labour 134,555 0.383O67 242 Labour and delivery complicated by intrapartum haemorrhage 9,832 0.028O68 242 Labour and delivery complicated by fetal stress (distress) 761,623 2.169O69 242 Labour and delivery complicated by umbilical cord complica-
tions133,400 0.380
O70 242 Perineal laceration during delivery 82,045 0.234O71 242 Other obstetric trauma 22,141 0.063O72 241 Postpartum haemorrhage 91,844 0.262O73 242 Retained placenta and membranes, without haemorrhage 51,166 0.146O74 242 Complications of anaesthesia during labour and delivery 4,832 0.014O75 242 Other complications of labour and delivery 167,982 0.478O80 243 Single spontaneous delivery 14,383,652 40.972O81 242 Single delivery by forceps and vacuum extractor 57,556 0.164O82 242 Single delivery by caesarean section 2,465,467 7.023O83 242 Other assisted single delivery 98,323 0.280O84 242 Multiple delivery 46,596 0.133O85 244 Puerperal sepsis 25,599 0.073O86 244 Other puerperal infections 35,657 0.102O87 244 Venous complications in the puerperium 2,418 0.007O88 244 Obstetric embolism 1,147 0.003O89 244 Complications of anaesthesia during the puerperium 8,855 0.025O90 244 Complications of the puerperium, not elsewhere classified 76,866 0.219O91 244 Infections of breast associated with childbirth 7,497 0.021O92 244 Other disorders of breast and lactation associated with child-
birth791 0.002
O94 244 Sequelae of complication of pregnancy, childbirth and thepuerperium
1,809 0.005
O95 244 Obstetric death of unspecified cause 38 0.000O96 244 Death from obstetric cause >42 days but < 1 year after delivery 10 0.000O97 244 Death from sequelae of direct obstetric causes 10 0.000O98 244 Maternal infectious and parasitic diseases 97,048 0.276O99 244 Other maternal diseases complicating pregnancy, birth and the
puerperium491,279 1.399
TOTAL 35,106,332 100.000
5

Figure A3: De Jure Sentencing of Abortion: Trends by State Type
0
10
20
30
40
50
Nu
mb
er
of
Ind
ivid
ua
ls S
en
ten
ce
d t
o P
riso
n f
or
Ab
ort
ion
2003 2005 2007 2009 2011
Year
Mexico D.F. Regressive Other
(a) Number of Individuals Sentenced to Prison
0
2
4
6
8
Ave
rag
e P
riso
n S
en
ten
ce
Le
ng
th f
or
Se
nte
nce
s
2003 2005 2007 2009 2011
Year
Mexico D.F. Regressive Other
(b) Average Length of Prison Sentences (Years)
Notes: Total number of sentences and the average length of prison sentences are generated from administrative records capturedin Mexico’s Judicial Statistics on Penal Matters. This is the universe of judiciary decisions in the country based on the first legaljudgement, and so does not include any subsequent appeals. Prison sentence lengths are calculated from a categorical variablecapturing bins of between 6 months and two years, and in each case we record the total years (or fractions of years) based onthe midpoint of each bin. Bins are consistently used in the period displayed here. Regressive states refer to any states tighteningabortion laws in the period under study.
Table A3: Summary Statistics, MxFLS data on women aged 15-44
(1) (2) (3) (4)Mexico City Regressive States Rest of Mexico Full Country
Contraception knowledge 0.991 0.997 1.000 0.998(0.094) (0.051) (0.011) (0.044)
Use modern method 0.676 0.589 0.578 0.590(0.469) (0.492) (0.494) (0.492)
Use any method 0.686 0.638 0.617 0.632(0.465) (0.481) (0.486) (0.482)
Age marriage 20.535 19.603 19.643 19.668(3.891) (3.825) (3.827) (3.834)
Age first sex 18.807 18.957 18.998 18.965(3.676) (3.593) (3.541) (3.577)
Number of sex partners 1.762 1.339 1.354 1.367(1.545) (1.088) (1.037) (1.101)
Observations 187 5081 3526 8794Notes: Data on household decision making and sexual behavior is obtained from theMexican Family Life Survey (MxFLS),which was conducted in 2002-2003, 2005-2006 and 2009-2012. The sample consits of women aged 15-44 who wereinterviewed in all three rounds, and hence form the panel data sample. Panel A presents summary statistics from householddecision making module and Panel B from the reproductive health module. Mean values are displayed with standarddeviations in parentheses. Regressive states are those which ever had a regressive law change posterior to 2008.
6

Figure A4: Raw Trends in Total Cases and Rates of Specific Maternal Morbidities
50000
100000
150000
200000
Dis
charg
es o
ther
sta
tes
20000
25000
30000
35000
Dis
charg
es D
F
2005 2010 2015
Year
DF Other states Regressive
(a) Abortion Morbidity (Total)
7
8
9
10
11
12
Dis
charg
es p
er
1000 w
om
en
2005 2010 2015
Year
DF Other states Regressive
(b) Abortion Morbidity (per 1000 women)
15000
20000
25000
30000
35000
Dis
charg
es o
ther
sta
tes
2000
3000
4000
5000
6000
Dis
charg
es D
F
2005 2010 2015
Year
DF Other states Regressive
(c) Haemorrhage Early in Pregnancy (Total)
1
1.5
2
2.5
Dis
charg
es p
er
1000 w
om
en
2005 2010 2015
Year
DF Other states Regressive
(d) Haemorrhage Early in Pregnancy (per 1000 women)
Notes: Figures present the total number of discharges due to abortion related morbidity (panels a and b), and haemorrhage earlyin pregnancy (panels c and d). Left-hand panels document total cases, with the total number for Mexico DF plotted on theleft-hand y-axis, and the total number for all other states plotted on the right-hand y-axis. Right hand panels document the samevalues per 1,000 women of fertile age. Each trend is based on data from the universe of discharge records from the public healthsystem.
7

Figure A5: Longer Trends in Specific Morbidities using Secretary of Health Hospitals Only
30000
40000
50000
60000
70000
Dis
ch
arg
es o
the
r sta
tes
6000
7000
8000
9000
10000
11000
Dis
ch
arg
es D
F
2000 2005 2010 2015
Year
DF Other states Regressive
(a) Abortion Morbidity (Total)
2000
4000
6000
8000
10000
Dis
ch
arg
es o
the
r sta
tes
300
400
500
600
700
Dis
ch
arg
es D
F
2000 2005 2010 2015
Year
DF Other states Regressive
(b) Haemorrhage Early in Pregnancy (Total)
Notes: Figures present the total number of discharges due to abortion related morbidity (panel A), and haemorrhage early inpregnancy (panel B). Each trend is based on data from hospitals administered from the Secretariat of Health only (available from2000 onwards). Data in Figure 2 is based on the universe of the public health system, and also includes hospitals administeredby Social Security Institutes. 8

Figure A6: Monthly Trends in Specific Morbidities using Secretary of Health Hospitals Only
0
2000
4000
6000
8000
Dis
charg
es o
ther
sta
tes
400
600
800
1000D
ischarg
es D
F
2000 2005 2010 2015
Year
DF Other states Regressive
(a) Abortion Morbidity (Total)
0
200
400
600
800
1000
Dis
charg
es o
ther
sta
tes
20
40
60
80
Dis
charg
es D
F
2000 2005 2010 2015
Year
DF Other states Regressive
(b) Haemorrhage Early in Pregnancy (Total)
Notes: Plots replicate those in Appendix Figure A5, however now displaying monthly averages. Monthly averages can only beplotted for data from hospitals administered by the Secretariat of Health. The dotted vertical line is plotted in April of 2007, thedate of passage of the abortion reform, and wide-scale rollout of available abortions.
9

Table A4: Summary Statistics on Time-Varying Controls
Variable Obs. Mean Std. Dev. Min. Max.
Percent of State Living Below Poverty Line 512 46.81 14.58 17.58 83.85Percent of State Residents with Access to Health Institutions 512 48.88 14.07 20.66 90.69Average Schooling of Adult Population 512 8.43 0.99 5.71 11.05Percent of Women of Working Age Economically Active 512 37.05 2.85 26.66 44.69Average Salary of Full Time Workers 512 5037.28 1089.12 1957.12 8022.83Proportion of Municipalities with Seguro Popular Coverage 512 0.78 0.38 0.00 1.00Each observation is a state×year cell. Mexico is composed of 32 States. The number of observations represents 32 states and years 2001-2016. State poverty is provided by the National Council for the Evaluation of Social Development Policy (CONEVAL). The proportionof residents with access to health institutions is provided by the Mexican Secretary of Health. Years of schooling are compiled fromthe National Educational Information System (SNIP). The proportion of economically active women and average salaries by state arecalculated from the trimestral National Occupation and Employment Survey (ENOE) provided by INEGI. Seguro Popular coverage iscalculated from municipal rollout data, and records the proportion of each municipalities in the state having access. Prior to 2002 thisvalue is always 0, and after 2007 this value is always 1.
Figure A7: Complete Randomization Inference for Synthetic Control: Fertility Rates
0
.05
.1
.15
Density
−5 0 5 10 15
Null Distribution
Two sided p−value: 0.042. RMSPE−trimmed Two sided p−value: 0.009.
One sided p−value: 0.003. RMSPE−trimmed One sided p−value: 0.003.
(a) Null Distribution based on Randomization Inference
0
.5
1
Density
0 5 10
Root Mean Squared Prediction Error
(b) RMSPE from Placebo Synthetic Controls
Notes: Left-hand panel plots the null distribution of average synthetic control placebo estimates α̂∗, and the actual estimate asthe vertical dashed line. The actual estimate in this case is α̂ = −6.877. Each placebo estimate is generated from a syntheticcontrol permutation where the placebo-treatment state is one of the 30 non-ILE states, and the treatment year is one of the yearsfrom 2002-2012. Full permutations for each state and year combination are generated. The right-hand panel plots the RMSPEassociated with each synthetic control procedure. When considering trimmed p-values, we trim the sample at RMSPE<5 toavoid cases where the synthetic control does not re-create pre-reform averages. Untrimmed p-values are based on the full set ofpermutations.
10

TableA5:
Difference-in
-DifferencesE
stimates
ofLegalR
eformso
nMorbidityusingInpatientDays
Abortion
Related
Morbidity
HaemorrhageEarly
inPregnancy
(1)
(2)
(3)
(4)
(5)
(6)
(7)
(8)
Post-ILE
Reform(DF)
-1.513***
-1.356***
-0.878**
-0.727
-1.916***
-1.935***
-1.230***
-1.730***
(0.364)
(0.378)
(0.377)
(0.498)
(0.220)
(0.232)
(0.203)
(0.220)
PostRegressiveLawChange
-0.577
0.029
1.169
1.370
-0.327
-0.202
0.256
0.170
(0.495)
(0.562)
(0.834)
(0.813)
(0.343)
(0.297)
(0.294)
(0.298)
Observations
384
384
384
384
384
384
384
384
Meanof
DependentVar
14.387
14.387
14.387
14.387
4.792
4.792
4.792
4.792
StateandYearFE
sY
YY
YY
YY
YPopulationWeights
YY
YY
TimeVaryingContro
lsY
YY
YNotes:Specifications
replicatethoseinTable4,howevernowinsteadof
estim
atingtheimpactof
thereform
son
thenumbero
finpatientcases,we
estim
ateimpactso
nthetotalnum
bero
finpatientdays
correspondingtothesecases.Additionalnotesa
reavailableinTable4.
11

Figure A8: Complete Randomization Inference for Synthetic Control: Haemorrhage Morbidity
0
.2
.4
.6
.8
1
Density
−2 −1 0 1 2
Null Distribution
Two sided p−value: 0.090. RMSPE−trimmed Two sided p−value: 0.053.
One sided p−value: 0.060. RMSPE−trimmed One sided p−value: 0.042.
(a) Null Distribution based on Randomization Inference
0
2
4
6
Density
0 .2 .4 .6 .8
Root Mean Squared Prediction Error
(b) RMSPE from Placebo Synthetic Controls
Notes: Left-hand panel plots the null distribution of average synthetic control placebo estimates α̂∗, and the actual estimate asthe vertical dashed line. The actual estimate in this case is α̂ = −0.906. Each placebo estimate is generated from a syntheticcontrol permutation where the placebo-treatment state is one of the 30 non-ILE states, and the treatment year is one of the yearsfrom 2005-2014. Full permutations for each state and year combination are generated. The right-hand panel plots the RMSPEassociated with each synthetic control procedure. When considering trimmed p-values, we trim the sample at RMSPE<0.4 toavoid cases where the synthetic control does not re-create pre-reform averages. Untrimmed p-values are based on the full set ofpermutations.
Figure A9: Complete Randomization Inference for Synthetic Control: Abortion Related Morbidity
0
.1
.2
.3
.4
Density
−4 −2 0 2 4
Null Distribution
Two sided p−value: 0.190. RMSPE−trimmed Two sided p−value: 0.163.
One sided p−value: 0.087. RMSPE−trimmed One sided p−value: 0.055.
(a) Null Distribution based on Randomization Inference
0
.5
1
1.5
2
Density
0 1 2 3 4
Root Mean Squared Prediction Error
(b) RMSPE from Placebo Synthetic Controls
Notes: Refer to notes to Appendix Figure A8. An identical procedure is followed, however now using abortion related morbidityas the outcome instead of haemorrhage early in pregnancy. The actual estimate in this case is α̂ = −1.399. The RMSPE trimmingconstant in this case is set at 2 when trimmed p-values are displayed.
12

Table A6: Difference-in-Differences Estimates of Impact of Legal Reforms by Age
15-19 20-24 25-29 30-34 35-39 40-44(1) (2) (3) (4) (5) (6)
Panel A: Birth RatesPost-ILE Reform (DF) -5.002*** -3.363* -5.813*** -9.567*** 1.055 3.179***
(1.132) (1.820) (1.407) (1.611) (1.442) (0.843)Post-Regressive Law Change -1.418 -1.998 -0.774 -0.811 -1.191 -0.796
(2.033) (2.517) (2.059) (2.128) (2.048) (1.204)
Observations 512 512 512 512 512 512Mean of Dependent Var 64.028 114.113 102.399 72.469 37.264 10.811
Panel B: Abortion MorbidityPost-ILE Reform (DF) -1.083*** -0.408 0.331 -0.435 -0.149 -0.002
(0.337) (0.385) (0.251) (0.282) (0.241) (0.122)Post-Regressive Law Change -0.465 -0.155 -0.168 -0.285 -0.140 -0.125
(0.391) (0.406) (0.358) (0.313) (0.244) (0.123)
Observations 512 512 512 512 512 512Mean of Dependent Var 7.886 11.044 10.980 7.030 5.062 2.294
Panel C: Haemorrhage MorbidityPost-ILE Reform (DF) -0.734*** -1.409*** -1.373*** -0.896*** -0.390*** -0.091***
(0.150) (0.263) (0.138) (0.169) (0.097) (0.025)Post-Regressive Law Change -0.268* -0.495* -0.350 -0.309 -0.154 -0.053
(0.157) (0.287) (0.217) (0.189) (0.108) (0.032)
Observations 512 512 512 512 512 512Mean of Dependent Var 1.297 2.480 3.151 1.853 0.992 0.266Notes: Each panel displays DD models for a single outcome, with a separate model estimated for each age group listed incolumn headers. In each case, full time-varying controls are included and population weights are used based on the populationof women of the relevant age group in each state. Each outcome is displayed as occurrences per 1,000 women of this age.Additional notes regarding estimation details are provided in Tables 3 and 4.
13

Figure A10: Synthetic Control Estimates of ILE’s Impact on Fertility by Age
−20
−10
0
10
20
2001 2003 2005 2007 2009 2011 2013
Year
Mexico D.F. Placebo Permutations
(a) 15-19 Year-olds
−20
−10
0
10
20
2001 2003 2005 2007 2009 2011 2013
Year
Mexico D.F. Placebo Permutations
(b) 20-24 Year-olds
−20
−10
0
10
20
2001 2003 2005 2007 2009 2011 2013
Year
Mexico D.F. Placebo Permutations
(c) 25-29 Year-olds
−20
−10
0
10
20
2001 2003 2005 2007 2009 2011 2013
Year
Mexico D.F. Placebo Permutations
(d) 30-34 Year-olds
−20
−10
0
10
20
2001 2003 2005 2007 2009 2011 2013
Year
Mexico D.F. Placebo Permutations
(e) 35-39 Year-olds
−20
−10
0
10
20
2001 2003 2005 2007 2009 2011 2013
Year
Mexico D.F. Placebo Permutations
(f) 40-44 Year-olds
Notes: Synthetic control estimates and inference of the impact of the ILE reform on fertility rates by age groups. Each panelreplicates Figure 2b however only for the subgroup of women aged in the range noted in panel captions.
14

Figure A11: Synthetic Control Estimates of ILE’s Impact on Haemorrhage Morbidity by Age
−6
−4
−2
0
2
4
6
2005 2010 2015
Year
Mexico D.F. Placebo Permutations
(a) 15-19 Year-olds
−6
−4
−2
0
2
4
6
2005 2010 2015
Year
Mexico D.F. Placebo Permutations
(b) 20-24 Year-olds
−6
−4
−2
0
2
4
6
2005 2010 2015
Year
Mexico D.F. Placebo Permutations
(c) 25-29 Year-olds
−6
−4
−2
0
2
4
6
2005 2010 2015
Year
Mexico D.F. Placebo Permutations
(d) 30-34 Year-olds
−6
−4
−2
0
2
4
6
2005 2010 2015
Year
Mexico D.F. Placebo Permutations
(e) 35-39 Year-olds
−6
−4
−2
0
2
4
6
2005 2010 2015
Year
Mexico D.F. Placebo Permutations
(f) 40-44 Year-olds
Notes: Synthetic control estimates and inference of the impact of the ILE reform on rates of morbidity due to abortion by agegroups. Each panel replicates Figure 6a however only for the subgroup of women aged in the range noted in panel captions.
15

Figure A12: Synthetic Control Estimates of ILE’s Impact on Abortion Morbidity by Age
−10
−5
0
5
10
2005 2010 2015
Year
Mexico D.F. Placebo Permutations
(a) 15-19 Year-olds
−10
−5
0
5
10
2005 2010 2015
Year
Mexico D.F. Placebo Permutations
(b) 20-24 Year-olds
−10
−5
0
5
10
2005 2010 2015
Year
Mexico D.F. Placebo Permutations
(c) 25-29 Year-olds
−10
−5
0
5
10
2005 2010 2015
Year
Mexico D.F. Placebo Permutations
(d) 30-34 Year-olds
−10
−5
0
5
10
2005 2010 2015
Year
Mexico D.F. Placebo Permutations
(e) 35-39 Year-olds
−10
−5
0
5
10
2005 2010 2015
Year
Mexico D.F. Placebo Permutations
(f) 40-44 Year-olds
Notes: Synthetic control estimates and inference of the impact of the ILE reform on rates of morbidity due to abortion by agegroups. Each panel replicates Figure 6b however only for the subgroup of women aged in the range noted in panel captions.
16

TableA7:
Changes
inPenalC
odes
SurroundingAbortion
Laws
State
Pre-ReformSanction
Post-ReformSanction
AdditionalChanges
Chiapas
1-3yearsp
rison
1to3yearsp
rison
Added
detailto
thepenalc
ode,
increasedsentences
for“collaborators”
Chihuahua
3monthsto5yearsp
rison
6monthsto3yearsp
rison
Added
detailto
thepenalc
ode,
increasedsentences
for“collaborators”
Colima
1-3yearsp
rison
andfin
e1-3yearsp
rison
andfin
eNochangestopenalcode(onlystateconstitution)
Durango
1-3yearsp
rison
1-3yearsp
rison
andfin
eIncreasedsentencesfor
“collaborators”
Guanajuato
6monthsto3yearsprison
and
fine
6monthsto3yearsprison
and
fine
Increasedsentencesfor
“collaborators”
Jalisco
4monthsto1yearprison
4monthsto1yearprison
Added
possibilityof
psychologicaltreatmentincom-
mutationof
prison
MexicoDF
1-3yearsp
rison
3-6monthsp
rison
orcommu-
nitywork
Added
possibilityofcommunity
workincommutation
ofprison
Morelos
1-5yearsp
rison
1-5yearsp
rison
andfin
eAdded
possibilityof
psychologicaltreatmentincom-
mutationof
prison
Nayarit
1-3yearsp
rison
andfin
e1-3yearsp
rison
andfin
eNochangestopenalcode(onlystateconstitution)
Oaxaca
6monthsto2yearsp
rison
6monthsto2yearsp
rison
Nochangestopenalcode(onlystateconstitution)
Queretaro
1-3yearsp
rison
1-3yearsp
rison
Nochangestopenalcode(onlystateconstitution)
QuintanaRoo
6monthsto2yearsp
rison
6monthsto2yearsp
rison
Nochangestopenalcode(onlystateconstitution)
SanLu
ísde
Potosí
1-3yearsp
rison
andfin
e1-3yearsp
rison
andfin
eMonetaryam
ountof
finealtered
Sonora
1-6yearsp
rison
andfin
e1-6yearsp
rison
andfin
eNochangestopenalcode(onlystateconstitution)
Tamaulipas
1-5yearsp
rison
1-5yearsp
rison
Added
possibilityof
psychologicaltreatmentincom-
mutationof
prison
Yucatan
1-5yearsp
rison
1-5yearsp
rison
Changed
sanctions
incertainspecified
circum
stances
Alldetails
arecollatedfrom
aside-by-side
readingofpenalcodespriortoandposteriortothereform
.Incasesw
hereno
changesw
eremadeinthepenalcodes,thisimplies
thatchangesw
ereonlymadeintheStateConstitutions,w
hich
werealteredtorecogniselifeas
beginningatconception.
17
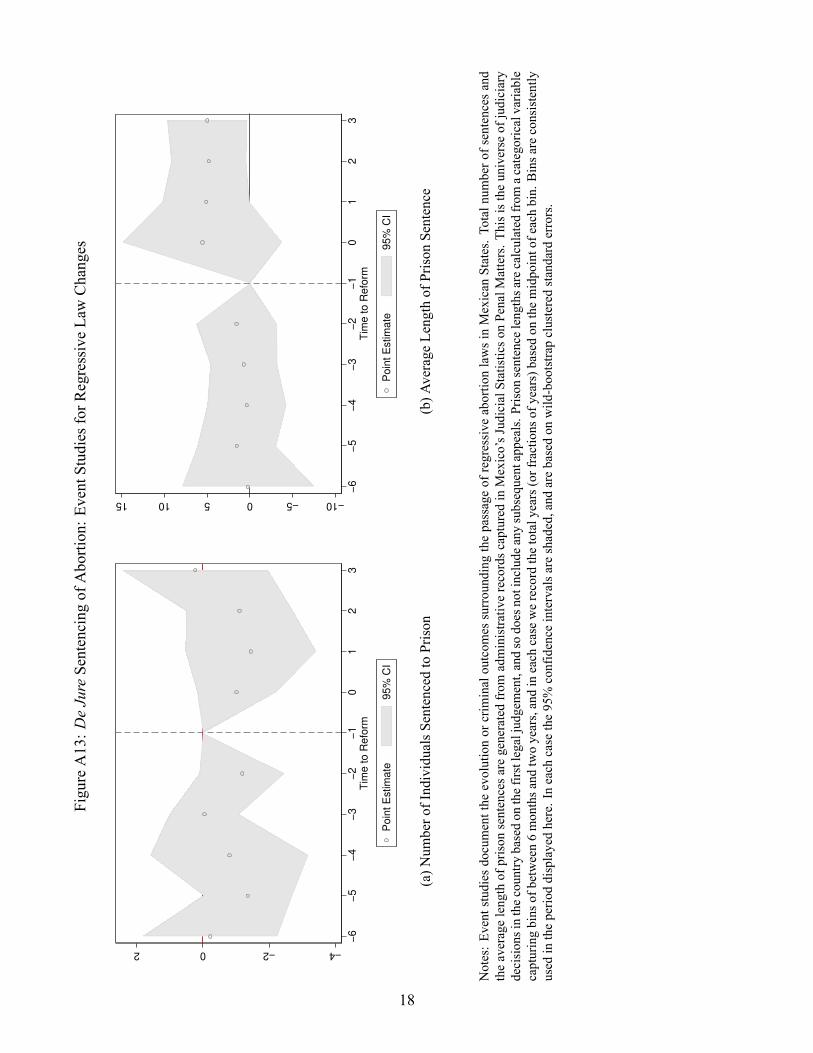
FigureA13:D
eJureSentencing
ofAbortion:E
ventStudiesfor
RegressiveLawChanges
−4−202
−6
−5
−4
−3
−2
−1
01
23
Tim
e to R
efo
rm
Poin
t E
stim
ate
95%
CI
(a)N
umbero
fIndividualsSentencedtoPrison
−10−5051015
−6
−5
−4
−3
−2
−1
01
23
Tim
e to R
efo
rm
Poin
t E
stim
ate
95%
CI
(b)A
verage
Lengthof
Prison
Sentence
Notes:Ev
entstudies
documentthe
evolutionor
criminaloutcom
essurroundingthepassageof
regressive
abortionlawsinMexican
States.Totalnum
bero
fsentences
and
theaveragelengthof
prison
sentencesa
regeneratedfrom
administrativerecordsc
apturedinMexico’sJudicialS
tatisticso
nPenalM
atters.T
hisisthe
universe
ofjudiciary
decisionsinthecountry
basedon
thefirstlegaljudgement,andso
doesnotinclude
anysubsequentappeals.Prison
sentence
lengthsarecalculated
from
acategoricalvariable
capturingbins
ofbetween6monthsa
ndtwoyears,andineach
case
werecord
thetotalyears(orfractions
ofyears)basedon
themidpointofeachbin.
Binsa
reconsistently
used
intheperio
ddisplayedhere.Ineach
case
the95%
confidence
intervalsa
reshaded,and
arebasedon
wild-bootstrapclusteredstandard
errors.
18
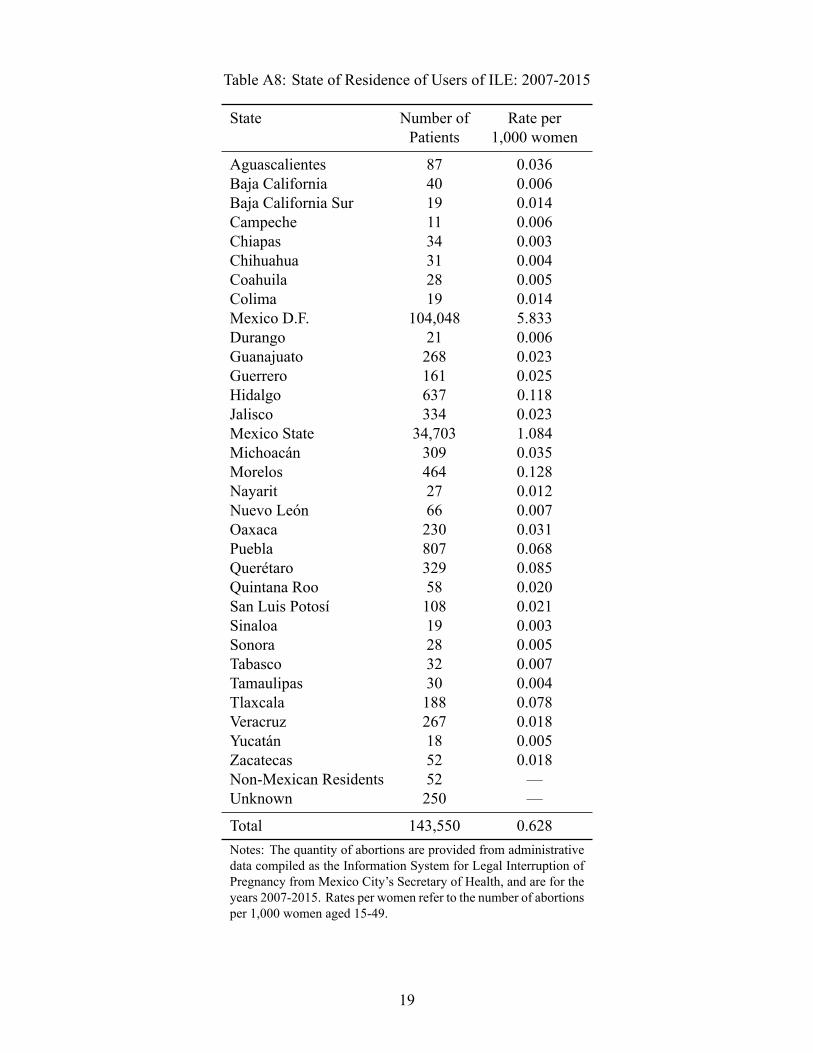
Table A8: State of Residence of Users of ILE: 2007-2015
State Number of Rate perPatients 1,000 women
Aguascalientes 87 0.036Baja California 40 0.006Baja California Sur 19 0.014Campeche 11 0.006Chiapas 34 0.003Chihuahua 31 0.004Coahuila 28 0.005Colima 19 0.014Mexico D.F. 104,048 5.833Durango 21 0.006Guanajuato 268 0.023Guerrero 161 0.025Hidalgo 637 0.118Jalisco 334 0.023Mexico State 34,703 1.084Michoacán 309 0.035Morelos 464 0.128Nayarit 27 0.012Nuevo León 66 0.007Oaxaca 230 0.031Puebla 807 0.068Querétaro 329 0.085Quintana Roo 58 0.020San Luis Potosí 108 0.021Sinaloa 19 0.003Sonora 28 0.005Tabasco 32 0.007Tamaulipas 30 0.004Tlaxcala 188 0.078Veracruz 267 0.018Yucatán 18 0.005Zacatecas 52 0.018Non-Mexican Residents 52 —Unknown 250 —
Total 143,550 0.628Notes: The quantity of abortions are provided from administrativedata compiled as the Information System for Legal Interruption ofPregnancy from Mexico City’s Secretary of Health, and are for theyears 2007-2015. Rates per women refer to the number of abortionsper 1,000 women aged 15-49.
19
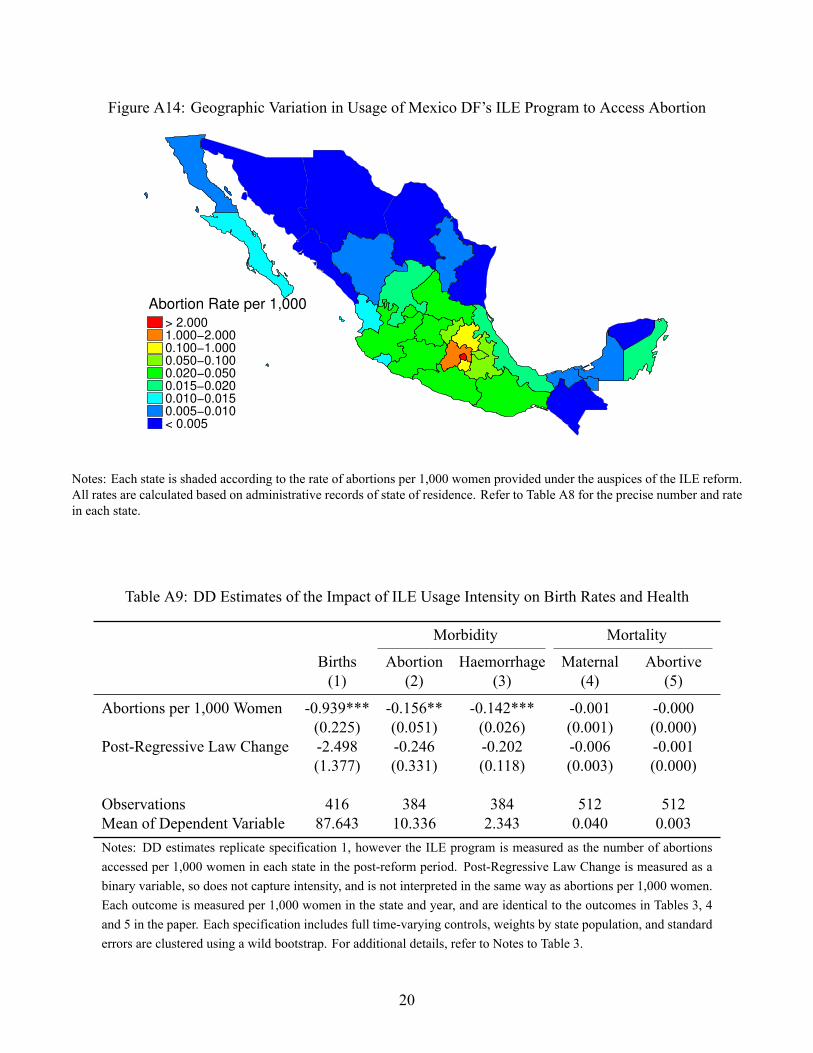
Figure A14: Geographic Variation in Usage of Mexico DF’s ILE Program to Access Abortion
> 2.000
1.000−2.000
0.100−1.000
0.050−0.100
0.020−0.050
0.015−0.020
0.010−0.015
0.005−0.010
< 0.005
Abortion Rate per 1,000
Notes: Each state is shaded according to the rate of abortions per 1,000 women provided under the auspices of the ILE reform.All rates are calculated based on administrative records of state of residence. Refer to Table A8 for the precise number and ratein each state.
Table A9: DD Estimates of the Impact of ILE Usage Intensity on Birth Rates and Health
Morbidity Mortality
Births Abortion Haemorrhage Maternal Abortive(1) (2) (3) (4) (5)
Abortions per 1,000 Women -0.939*** -0.156** -0.142*** -0.001 -0.000(0.225) (0.051) (0.026) (0.001) (0.000)
Post-Regressive Law Change -2.498 -0.246 -0.202 -0.006 -0.001(1.377) (0.331) (0.118) (0.003) (0.000)
Observations 416 384 384 512 512Mean of Dependent Variable 87.643 10.336 2.343 0.040 0.003Notes: DD estimates replicate specification 1, however the ILE program is measured as the number of abortionsaccessed per 1,000 women in each state in the post-reform period. Post-Regressive Law Change is measured as abinary variable, so does not capture intensity, and is not interpreted in the same way as abortions per 1,000 women.Each outcome is measured per 1,000 women in the state and year, and are identical to the outcomes in Tables 3, 4and 5 in the paper. Each specification includes full time-varying controls, weights by state population, and standarderrors are clustered using a wild bootstrap. For additional details, refer to Notes to Table 3.
20

Figure A15: Synthetic Control Estimates for Spillovers: Mexico State
−10
−5
0
5
10
15
2001 2003 2005 2007 2009 2011 2013
Year
Mexico State Placebo Permutations
(a) Birth Rates: Inference by State
0
.05
.1
.15
Density
−5 0 5 10 15
Null Distribution
Two sided p−value: 0.798. RMSPE−trimmed Two sided p−value: 0.790.
One sided p−value: 0.542. RMSPE−trimmed One sided p−value: 0.563.
(b) Birth Rates: Inference by State and Time
−4
−2
0
2
4
2005 2010 2015
Year
Mexico State Placebo Permutations
(c) Abortion Morbidity: Inference by State
0
.1
.2
.3
.4
Density
−4 −2 0 2 4
Null Distribution
Two sided p−value: 0.741. RMSPE−trimmed Two sided p−value: 0.734.
One sided p−value: 0.593. RMSPE−trimmed One sided p−value: 0.575.
(d) Abortion Morbidity: Inference by State and Time
−5
0
5
2005 2010 2015
Year
Mexico State Placebo Permutations
(e) Haemorrhage Morbidity: Inference by State
0
.2
.4
.6
.8
1
Density
−2 −1 0 1 2
Null Distribution
Two sided p−value: 0.200. RMSPE−trimmed Two sided p−value: 0.161.
One sided p−value: 0.922. RMSPE−trimmed One sided p−value: 0.941.
(f) Haemorrhage Morbidity: Inference by State, Time
Notes: Left-hand panels present plots of the difference between outcomes in Mexico State and similar differences betweenplacebo states and their synthetic controls. Right hand plots compare average post-treatment differences between Mexico Stateand its synthetic control with a null distribution constructed permuting treatment over each donor state and time period. Panels(a) and (b) are for birth rates, (c) and (d) for abortion morbidity, and (e) and (f) for haemorrhage morbidity.
21

Figure A16: Synthetic Control Estimates for Spillovers: Morelos
−10
−5
0
5
10
15
2001 2003 2005 2007 2009 2011 2013
Year
Morelos Placebo Permutations
(a) Birth Rates: Inference by State
0
.05
.1
.15
De
nsity
−5 0 5 10 15
Null Distribution
Two sided p−value: 0.515. RMSPE−trimmed Two sided p−value: 0.497.
One sided p−value: 0.219. RMSPE−trimmed One sided p−value: 0.227.
(b) Birth Rates: Inference by State and Time
−4
−2
0
2
4
2005 2010 2015
Year
Morelos Placebo Permutations
(c) Abortion Morbidity: Inference by State
0
.1
.2
.3
.4
De
nsity
−4 −2 0 2 4
Null Distribution
Two sided p−value: 0.470. RMSPE−trimmed Two sided p−value: 0.452.
One sided p−value: 0.733. RMSPE−trimmed One sided p−value: 0.722.
(d) Abortion Morbidity: Inference by State and Time
−5
0
5
2005 2010 2015
Year
Morelos Placebo Permutations
(e) Haemorrhage Morbidity: Inference by State
0
.2
.4
.6
.8
1
De
nsity
−2 −1 0 1 2
Null Distribution
Two sided p−value: 0.781. RMSPE−trimmed Two sided p−value: 0.772.
One sided p−value: 0.678. RMSPE−trimmed One sided p−value: 0.689.
(f) Haemorrhage Morbidity: Inference by State, Time
Notes: Refer to notes to Appendix Figure A15. All details are identical, however now results are displayed for the state ofMorelos.
22

Figure A17: Synthetic Control Estimates for Spillovers: Hidalgo
−10
−5
0
5
10
15
2001 2003 2005 2007 2009 2011 2013
Year
Hidalgo Placebo Permutations
(a) Birth Rates: Inference by State
0
.05
.1
.15
De
nsity
−5 0 5 10 15
Null Distribution
Two sided p−value: 0.953. RMSPE−trimmed Two sided p−value: 0.951.
One sided p−value: 0.421. RMSPE−trimmed One sided p−value: 0.437.
(b) Birth Rates: Inference by State and Time
−4
−2
0
2
4
2005 2010 2015
Year
Hidalgo Placebo Permutations
(c) Abortion Morbidity: Inference by State
0
.1
.2
.3
.4
De
nsity
−4 −2 0 2 4
Null Distribution
Two sided p−value: 0.500. RMSPE−trimmed Two sided p−value: 0.483.
One sided p−value: 0.211. RMSPE−trimmed One sided p−value: 0.181.
(d) Abortion Morbidity: Inference by State and Time
−5
0
5
2005 2010 2015
Year
Hidalgo Placebo Permutations
(e) Haemorrhage Morbidity: Inference by State
0
.2
.4
.6
.8
1
De
nsity
−2 −1 0 1 2
Null Distribution
Two sided p−value: 0.519. RMSPE−trimmed Two sided p−value: 0.496.
One sided p−value: 0.319. RMSPE−trimmed One sided p−value: 0.311.
(f) Haemorrhage Morbidity: Inference by State, Time
Notes: Refer to notes to Appendix Figure A15. All details are identical, however now results are displayed for the state ofHidalgo.
23

FigureA18:T
rendsinPublicandPrivateHealth
System
Morbidity:A
bortion-Related
12000
14000
16000
18000
20000
22000
Discharges for Abortion Morbidity other states
4500
5000
5500
6000
6500
7000
Discharges for Abortion DF
2005
2010
2015
Year
DF
Oth
er
sta
tes
Regre
ssiv
e
(a)Q
uantity
ofHospitalV
isits
inthePrivateSector
50000
100000
150000
200000
Discharges for Abortion Morbidity other states
22000
24000
26000
28000
30000
Discharges for Abortion DF
2005
2010
2015
Year
DF
Oth
er
sta
tes
Regre
ssiv
e
(b)Q
uantity
ofHospitalV
isits
inthePublicSector
Notes:Left-hand
panelp
lotsallabortion
morbidity
accordingtotheuniverse
ofprivatehealth
records.
Microdataon
theserecordsareavailableby
requestfrom
INEG
I.Right-handpanelplotsallabortion
morbiditycodedusingthesamecodesa
sinprivaterecordsb
ased
ontheuniverse
ofpublichospitalrecords.A
descrip
tionof
howthese
codesa
remergedbetweenthepublicandprivatesystem
isavailableinAppendixTableA2.
24

FigureA19:T
rendsinPublicandPrivateHealth
System
Morbidity:O
therMaternalC
auses(includingHaemorrhage)
20000
30000
40000
50000
60000
Discharges for Haemorrhage/Other Morbidity other States
10000
11000
12000
13000
Discharges for Haemorrhage/Other DF
2005
2010
2015
Year
DF
Oth
er
sta
tes
Regre
ssiv
e
(a)Q
uantity
ofHospitalV
isits
inthePrivateSector
150000
200000
250000
300000
350000
Discharges for Haemorrhage/Other Morbidity other States
50000
52000
54000
56000
58000
60000
Discharges for Haemorrhage/Other DF
2005
2010
2015
Year
DF
Oth
er
sta
tes
Regre
ssiv
e
(b)Q
uantity
ofHospitalV
isits
inthePublicSector
Notes:L
eft-h
andpanelplotsall“OtherMaternalC
auses”(in
cludinghaem
orrhagee
arlyinpregnancy)accordingtotheu
niverseo
fpriv
ateh
ealth
records.Microdataon
these
recordsa
reavailableby
requestfromINEG
I.Right-handpanelplotsall“OtherMaternalC
auses”
codedusingthesamecodesa
sinprivaterecordsb
ased
ontheuniverse
ofpublichospitalrecords.A
descrip
tionof
howthesecodesa
remergedbetweenthepublicandprivatesystem
isavailableinAppendixTableA2.
25

Table A10: The Effect of the Abortion Reform on Reported Sexual Behaviour (Panel Specification)
(1) (2) (3) (4)Modern Contracep Any Modern Num of
Knowledge Contraception Contraception Sex Partners
ILE Reform 0.002 -0.012 -0.013 -0.111(0.276) (0.914) (0.901) (0.776)
Regressive Law Change -0.009 0.041 0.014 0.267(0.304) (0.492) (0.814) (0.064)
Observations 10007 10007 10007 10007R-Squared 0.889 0.568 0.558 0.531Mean of Dependent Variable 0.999 0.569 0.610 1.418Each column presents a seperate regression of a contraceptive or sexual behaviour variable on abortion reform mea-sures, household fixed effects, year fixed effects and time-varying controls. p-values are presented below coefficients inparentheses.
Table A11: The Effect of the Abortion Reform on Reported Sexual Behaviour (Repeated Cross-SectionSpecification)
(1) (2) (3) (4)Modern Contracep Any Modern Num of
Knowledge Contraception Contraception Sex Partners
ILE Reform -0.011 -0.050 -0.057 -0.111(0.513) (0.579) (0.520) (0.675)
Regressive Law Change -0.002 0.093 0.065 0.150(0.815) (0.008) (0.065) (0.106)
Observations 10007 10007 10007 10007R-Squared 0.037 0.027 0.029 0.033Mean of Dependent Variable 0.999 0.569 0.610 1.418Each column presents a seperate regression of a contraceptive or sexual behaviour variable on abortion reform measures,year fixed effects and time-varying controls. p-values are presented below coefficients in parentheses.
26
Recommended