CMP 446.40
Target Price 515.00
ISIN: INE202B01012
MAY 2nd
2015
DEWAN HOUSING FINANCE CORPORATION LTD.
Result Update (PARENT BASIS): Q4 FY15
BUYBUYBUYBUY
Index Details
Stock Data
Sector Housing Finance
BSE Code 511072
Face Value 10.00
52wk. High / Low (Rs.) 569.70/217.10
Volume (2wk. Avg. Q.) 94000
Market Cap (Rs. in mn.) 65030.21
Annual Estimated Results (A*: Actual / E*: Estimated)
YEARS FY15A FY16E FY17E
Net Sales 59789.60 67562.25 75669.72
EBITDA 54281.57 61242.46 68440.84
Net Profit 6212.88 6929.43 7642.47
EPS 42.65 47.57 52.46
P/E 10.47 9.38 8.51
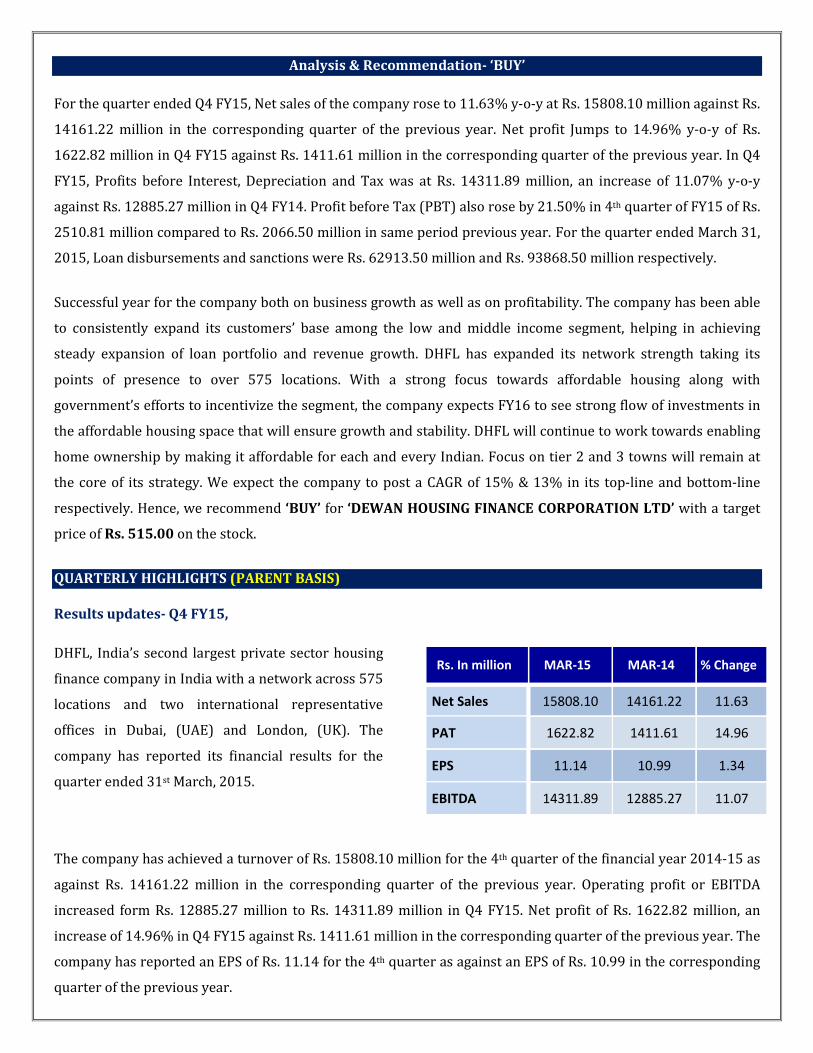
Shareholding Pattern (%)
1 Year Comparative Graph
DHFC LIMITED BSE SENSEX
SYNOPSIS
Dewan Housing Finance Corporation Ltd. (DHFCL)
established on the year 1984, to provide affordable
housing finance to the lower and middle income
groups in semi-urban and rural parts of India.
Net sales rose by 11.63% y-o-y at Rs. 15808.10 million
in 4th quarter of the financial year 2015 against Rs.
14161.22 million in the corresponding quarter of the
previous year.
Net profit Jumps to 14.96% y-o-y of Rs. 1622.82
million in Q4 FY15 against Rs. 1411.61 million in the
corresponding quarter of the previous year.
In Q4 FY15, Profits before Interest, Depreciation and
Tax was at Rs. 14311.89 million, an increase of 11.07%
y-o-y against Rs. 12885.27 million in Q4 FY14.
Profit before Tax (PBT) also rose by 21.50% in 4th
quarter of FY15 of Rs. 2510.81 million compared to Rs.
2066.50 million in same period previous year.
Net Interest Margin stood at 2.89 % as on 31st March,
2015.
Quarter ended March 31st 2015, Loan disbursements
and sanctions were Rs. 62913.50 million and Rs.
93868.50 million respectively.
The company has recommended final dividend @ Rs.
2.00/- per share on face value Rs. 10.00/- each for the
financial year 2015.
Loan Book Outstanding grew 26.18 % to Rs.
510396.50 million as for the year ended March 31,
2015 as against Rs. 404510.40 million in FY14.
Net Sales and PAT of the company are expected to
grow at a CAGR of 15% & 13% over 2014 to 2017E
respectively.
PEER GROUPS CMP MARKET CAP EPS P/E (X) P/BV(X) DIVIDEND
Company Name (Rs.) Rs. in mn. (Rs.) Ratio Ratio (%)
Dewan Housing Finance Corporation Ltd. 446.40 65030.21 42.65 10.47 1.40 60.00
HDFC Ltd. 1169.40 1841451.50 37.16 31.47 6.59 750.00
LIC Housing Finance Ltd. 430.40 217207.00 27.47 15.67 2.44 250.00
GRUH Finance Ltd. 246.10 89428.90 5.61 43.87 14.71 150.00
Analysis & Recommendation- ‘BUY’
For the quarter ended Q4 FY15, Net sales of the company rose to 11.63% y-o-y at Rs. 15808.10 million against Rs.
14161.22 million in the corresponding quarter of the previous year. Net profit Jumps to 14.96% y-o-y of Rs.
1622.82 million in Q4 FY15 against Rs. 1411.61 million in the corresponding quarter of the previous year. In Q4
FY15, Profits before Interest, Depreciation and Tax was at Rs. 14311.89 million, an increase of 11.07% y-o-y
against Rs. 12885.27 million in Q4 FY14. Profit before Tax (PBT) also rose by 21.50% in 4th quarter of FY15 of Rs.
2510.81 million compared to Rs. 2066.50 million in same period previous year. For the quarter ended March 31,
2015, Loan disbursements and sanctions were Rs. 62913.50 million and Rs. 93868.50 million respectively.
Successful year for the company both on business growth as well as on profitability. The company has been able
to consistently expand its customers’ base among the low and middle income segment, helping in achieving
steady expansion of loan portfolio and revenue growth. DHFL has expanded its network strength taking its
points of presence to over 575 locations. With a strong focus towards affordable housing along with
government’s efforts to incentivize the segment, the company expects FY16 to see strong flow of investments in
the affordable housing space that will ensure growth and stability. DHFL will continue to work towards enabling
home ownership by making it affordable for each and every Indian. Focus on tier 2 and 3 towns will remain at
the core of its strategy. We expect the company to post a CAGR of 15% & 13% in its top-line and bottom-line
respectively. Hence, we recommend ‘BUY’ for ‘DEWAN HOUSING FINANCE CORPORATION LTD’ with a target
price of Rs. 515.00 on the stock.
QUARTERLY HIGHLIGHTS (PARENT BASIS)
Results updates- Q4 FY15,
DHFL, India’s second largest private sector housing
finance company in India with a network across 575
locations and two international representative
offices in Dubai, (UAE) and London, (UK). The
company has reported its financial results for the
quarter ended 31st March, 2015.
The company has achieved a turnover of Rs. 15808.10 million for the 4th quarter of the financial year 2014-15 as
against Rs. 14161.22 million in the corresponding quarter of the previous year. Operating profit or EBITDA
increased form Rs. 12885.27 million to Rs. 14311.89 million in Q4 FY15. Net profit of Rs. 1622.82 million, an
increase of 14.96% in Q4 FY15 against Rs. 1411.61 million in the corresponding quarter of the previous year. The
company has reported an EPS of Rs. 11.14 for the 4th quarter as against an EPS of Rs. 10.99 in the corresponding
quarter of the previous year.
Rs. In million MAR-15 MAR-14 % Change
Net Sales 15808.10 14161.22 11.63
PAT 1622.82 1411.61 14.96
EPS 11.14 10.99 1.34
EBITDA 14311.89 12885.27 11.07
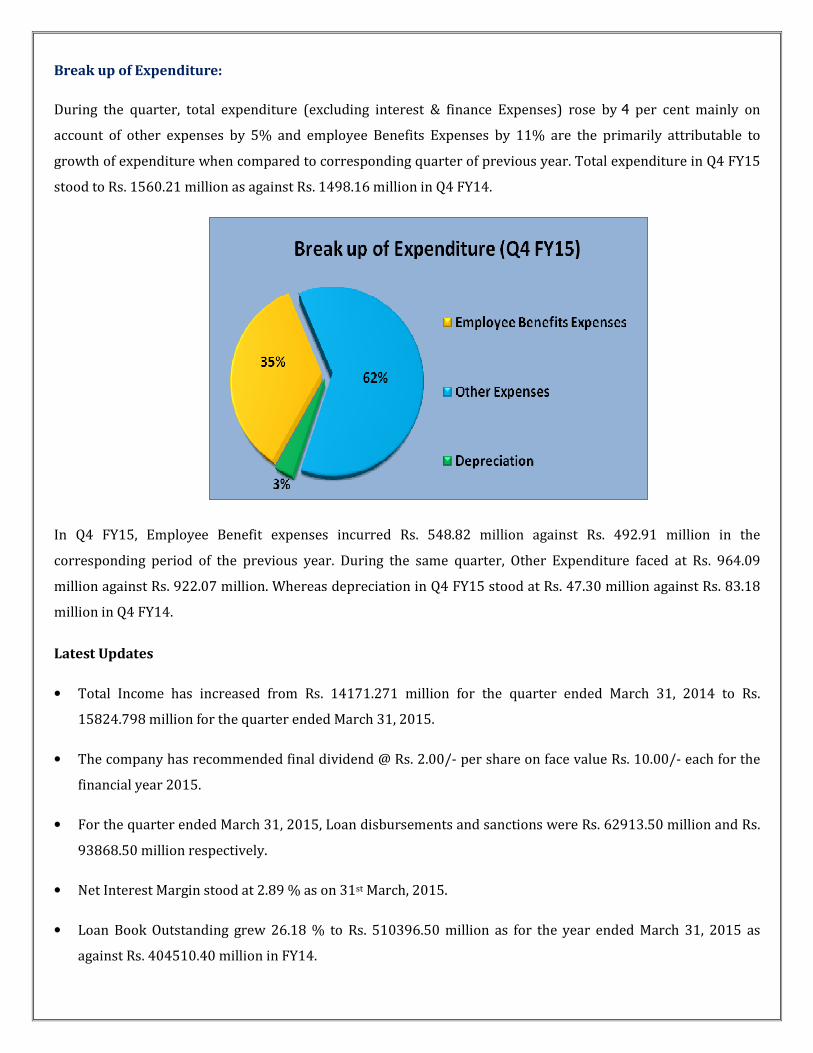
Break up of Expenditure:
During the quarter, total expenditure (excluding interest & finance Expenses) rose by 4 per cent mainly on
account of other expenses by 5% and employee Benefits Expenses by 11% are the primarily attributable to
growth of expenditure when compared to corresponding quarter of previous year. Total expenditure in Q4 FY15
stood to Rs. 1560.21 million as against Rs. 1498.16 million in Q4 FY14.
In Q4 FY15, Employee Benefit expenses incurred Rs. 548.82 million against Rs. 492.91 million in the
corresponding period of the previous year. During the same quarter, Other Expenditure faced at Rs. 964.09
million against Rs. 922.07 million. Whereas depreciation in Q4 FY15 stood at Rs. 47.30 million against Rs. 83.18
million in Q4 FY14.
Latest Updates
• Total Income has increased from Rs. 14171.271 million for the quarter ended March 31, 2014 to Rs.
15824.798 million for the quarter ended March 31, 2015.
• The company has recommended final dividend @ Rs. 2.00/- per share on face value Rs. 10.00/- each for the
financial year 2015.
• For the quarter ended March 31, 2015, Loan disbursements and sanctions were Rs. 62913.50 million and Rs.
93868.50 million respectively.
• Net Interest Margin stood at 2.89 % as on 31st March, 2015.
• Loan Book Outstanding grew 26.18 % to Rs. 510396.50 million as for the year ended March 31, 2015 as
against Rs. 404510.40 million in FY14.
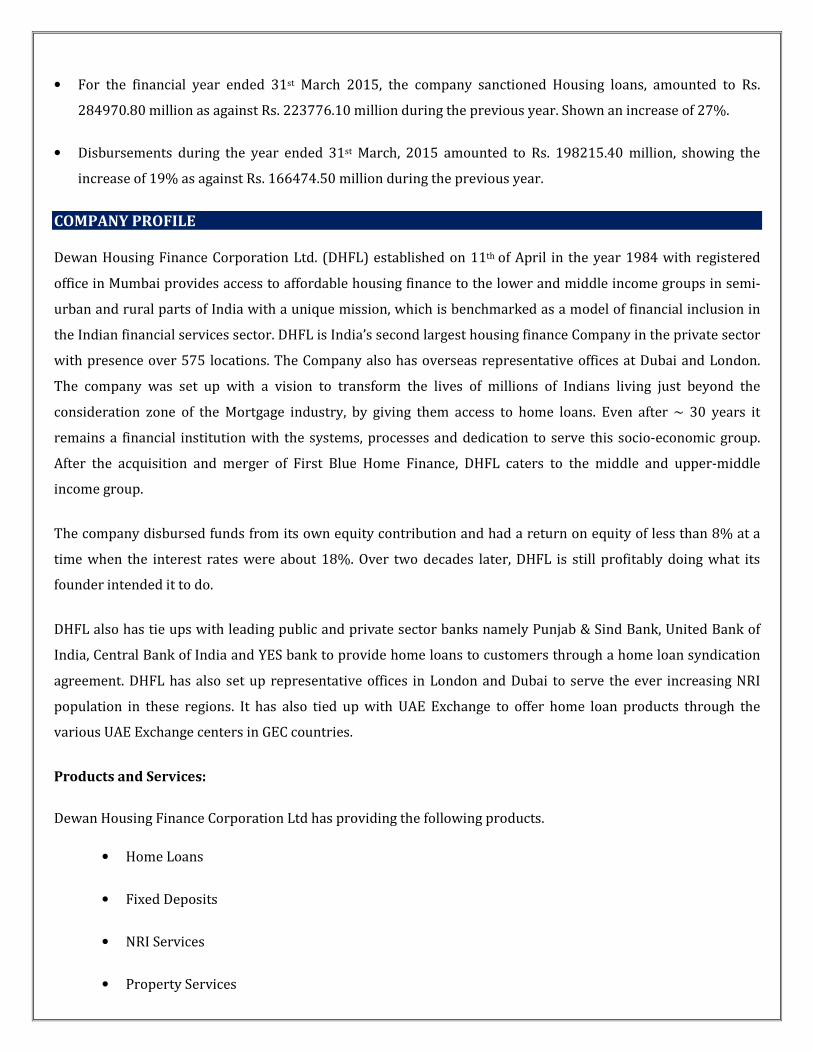
• For the financial year ended 31st March 2015, the company sanctioned Housing loans, amounted to Rs.
284970.80 million as against Rs. 223776.10 million during the previous year. Shown an increase of 27%.
• Disbursements during the year ended 31st March, 2015 amounted to Rs. 198215.40 million, showing the
increase of 19% as against Rs. 166474.50 million during the previous year.
COMPANY PROFILE
Dewan Housing Finance Corporation Ltd. (DHFL) established on 11th of April in the year 1984 with registered
office in Mumbai provides access to affordable housing finance to the lower and middle income groups in semi-
urban and rural parts of India with a unique mission, which is benchmarked as a model of financial inclusion in
the Indian financial services sector. DHFL is India’s second largest housing finance Company in the private sector
with presence over 575 locations. The Company also has overseas representative offices at Dubai and London.
The company was set up with a vision to transform the lives of millions of Indians living just beyond the
consideration zone of the Mortgage industry, by giving them access to home loans. Even after ~ 30 years it
remains a financial institution with the systems, processes and dedication to serve this socio-economic group.
After the acquisition and merger of First Blue Home Finance, DHFL caters to the middle and upper-middle
income group.
The company disbursed funds from its own equity contribution and had a return on equity of less than 8% at a
time when the interest rates were about 18%. Over two decades later, DHFL is still profitably doing what its
founder intended it to do.
DHFL also has tie ups with leading public and private sector banks namely Punjab & Sind Bank, United Bank of
India, Central Bank of India and YES bank to provide home loans to customers through a home loan syndication
agreement. DHFL has also set up representative offices in London and Dubai to serve the ever increasing NRI
population in these regions. It has also tied up with UAE Exchange to offer home loan products through the
various UAE Exchange centers in GEC countries.
Products and Services:
Dewan Housing Finance Corporation Ltd has providing the following products.
• Home Loans
• Fixed Deposits
• NRI Services
• Property Services
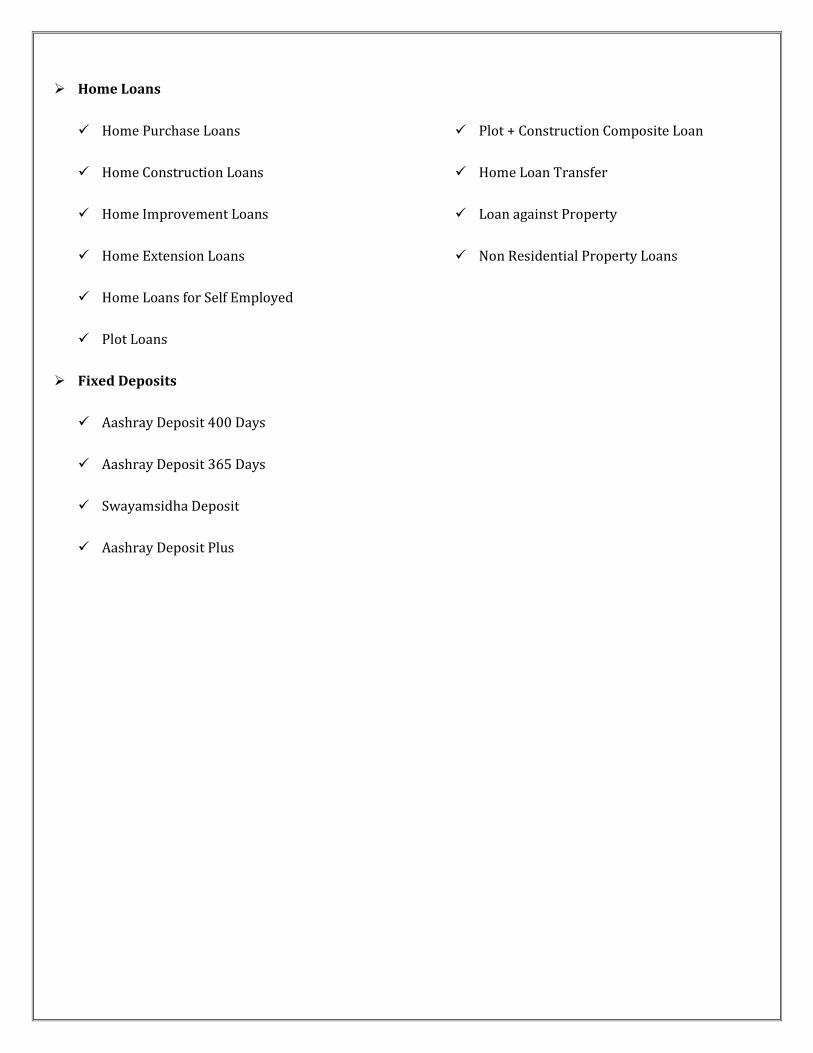
� Home Loans
� Home Purchase Loans
� Home Construction Loans
� Home Improvement Loans
� Home Extension Loans
� Home Loans for Self Employed
� Plot Loans
� Plot + Construction Composite Loan
� Home Loan Transfer
� Loan against Property
� Non Residential Property Loans
� Fixed Deposits
� Aashray Deposit 400 Days
� Aashray Deposit 365 Days
� Swayamsidha Deposit
� Aashray Deposit Plus
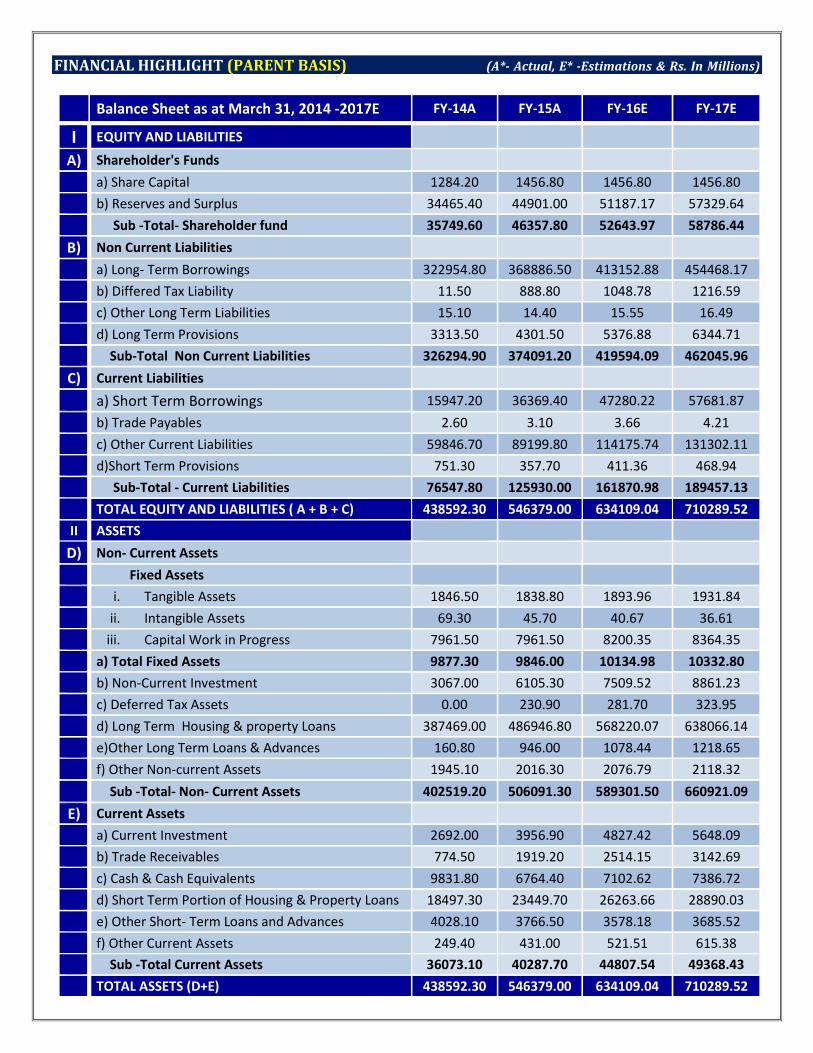
FINANCIAL HIGHLIGHT (PARENT BASIS) (A*- Actual, E* -Estimations & Rs. In Millions)
Balance Sheet as at March 31, 2014 -2017E FY-14A FY-15A FY-16E FY-17E
I EQUITY AND LIABILITIES
A) Shareholder's Funds
a) Share Capital 1284.20 1456.80 1456.80 1456.80
b) Reserves and Surplus 34465.40 44901.00 51187.17 57329.64
Sub -Total- Shareholder fund 35749.60 46357.80 52643.97 58786.44
B) Non Current Liabilities
a) Long- Term Borrowings 322954.80 368886.50 413152.88 454468.17
b) Differed Tax Liability 11.50 888.80 1048.78 1216.59
c) Other Long Term Liabilities 15.10 14.40 15.55 16.49
d) Long Term Provisions 3313.50 4301.50 5376.88 6344.71
Sub-Total Non Current Liabilities 326294.90 374091.20 419594.09 462045.96
C) Current Liabilities
a) Short Term Borrowings 15947.20 36369.40 47280.22 57681.87
b) Trade Payables 2.60 3.10 3.66 4.21
c) Other Current Liabilities 59846.70 89199.80 114175.74 131302.11
d)Short Term Provisions 751.30 357.70 411.36 468.94
Sub-Total - Current Liabilities 76547.80 125930.00 161870.98 189457.13
TOTAL EQUITY AND LIABILITIES ( A + B + C) 438592.30 546379.00 634109.04 710289.52
II ASSETS
D) Non- Current Assets
Fixed Assets
i. Tangible Assets 1846.50 1838.80 1893.96 1931.84
ii. Intangible Assets 69.30 45.70 40.67 36.61
iii. Capital Work in Progress 7961.50 7961.50 8200.35 8364.35
a) Total Fixed Assets 9877.30 9846.00 10134.98 10332.80
b) Non-Current Investment 3067.00 6105.30 7509.52 8861.23
c) Deferred Tax Assets 0.00 230.90 281.70 323.95
d) Long Term Housing & property Loans 387469.00 486946.80 568220.07 638066.14
e)Other Long Term Loans & Advances 160.80 946.00 1078.44 1218.65
f) Other Non-current Assets 1945.10 2016.30 2076.79 2118.32
Sub -Total- Non- Current Assets 402519.20 506091.30 589301.50 660921.09
E) Current Assets
a) Current Investment 2692.00 3956.90 4827.42 5648.09
b) Trade Receivables 774.50 1919.20 2514.15 3142.69
c) Cash & Cash Equivalents 9831.80 6764.40 7102.62 7386.72
d) Short Term Portion of Housing & Property Loans 18497.30 23449.70 26263.66 28890.03
e) Other Short- Term Loans and Advances 4028.10 3766.50 3578.18 3685.52
f) Other Current Assets 249.40 431.00 521.51 615.38
Sub -Total Current Assets 36073.10 40287.70 44807.54 49368.43
TOTAL ASSETS (D+E) 438592.30 546379.00 634109.04 710289.52
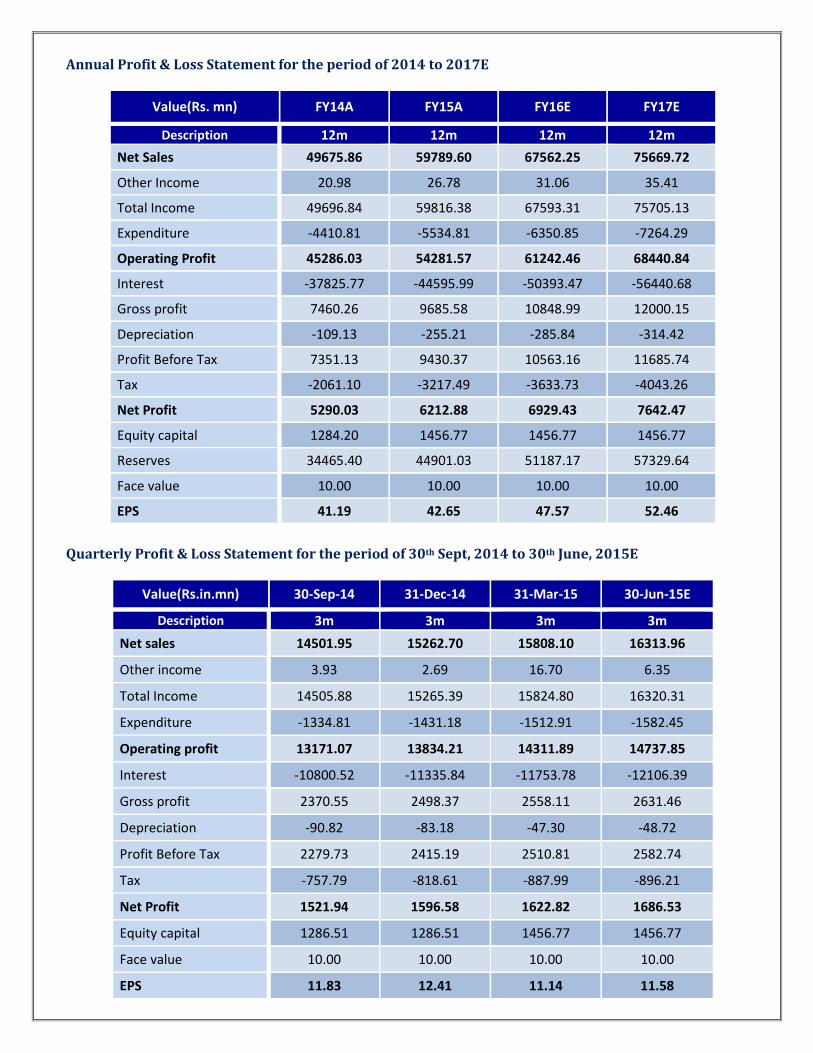
Annual Profit & Loss Statement for the period of 2014 to 2017E
Value(Rs. mn) FY14A FY15A FY16E FY17E
Description 12m 12m 12m 12m
Net Sales 49675.86 59789.60 67562.25 75669.72
Other Income 20.98 26.78 31.06 35.41
Total Income 49696.84 59816.38 67593.31 75705.13
Expenditure -4410.81 -5534.81 -6350.85 -7264.29
Operating Profit 45286.03 54281.57 61242.46 68440.84
Interest -37825.77 -44595.99 -50393.47 -56440.68
Gross profit 7460.26 9685.58 10848.99 12000.15
Depreciation -109.13 -255.21 -285.84 -314.42
Profit Before Tax 7351.13 9430.37 10563.16 11685.74
Tax -2061.10 -3217.49 -3633.73 -4043.26
Net Profit 5290.03 6212.88 6929.43 7642.47
Equity capital 1284.20 1456.77 1456.77 1456.77
Reserves 34465.40 44901.03 51187.17 57329.64
Face value 10.00 10.00 10.00 10.00
EPS 41.19 42.65 47.57 52.46
Quarterly Profit & Loss Statement for the period of 30th Sept, 2014 to 30th June, 2015E
Value(Rs.in.mn) 30-Sep-14 31-Dec-14 31-Mar-15 30-Jun-15E
Description 3m 3m 3m 3m
Net sales 14501.95 15262.70 15808.10 16313.96
Other income 3.93 2.69 16.70 6.35
Total Income 14505.88 15265.39 15824.80 16320.31
Expenditure -1334.81 -1431.18 -1512.91 -1582.45
Operating profit 13171.07 13834.21 14311.89 14737.85
Interest -10800.52 -11335.84 -11753.78 -12106.39
Gross profit 2370.55 2498.37 2558.11 2631.46
Depreciation -90.82 -83.18 -47.30 -48.72
Profit Before Tax 2279.73 2415.19 2510.81 2582.74
Tax -757.79 -818.61 -887.99 -896.21
Net Profit 1521.94 1596.58 1622.82 1686.53
Equity capital 1286.51 1286.51 1456.77 1456.77
Face value 10.00 10.00 10.00 10.00
EPS 11.83 12.41 11.14 11.58
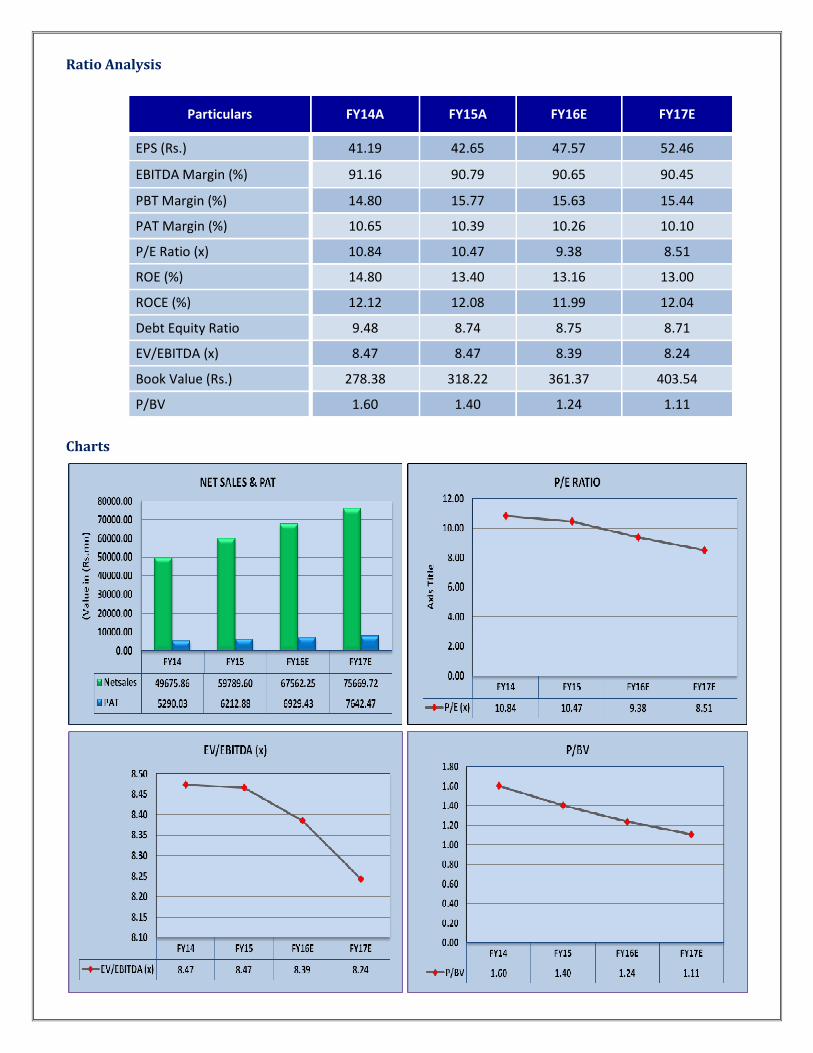
Ratio Analysis
Particulars FY14A FY15A FY16E FY17E
EPS (Rs.) 41.19 42.65 47.57 52.46
EBITDA Margin (%) 91.16 90.79 90.65 90.45
PBT Margin (%) 14.80 15.77 15.63 15.44
PAT Margin (%) 10.65 10.39 10.26 10.10
P/E Ratio (x) 10.84 10.47 9.38 8.51
ROE (%) 14.80 13.40 13.16 13.00
ROCE (%) 12.12 12.08 11.99 12.04
Debt Equity Ratio 9.48 8.74 8.75 8.71
EV/EBITDA (x) 8.47 8.47 8.39 8.24
Book Value (Rs.) 278.38 318.22 361.37 403.54
P/BV 1.60 1.40 1.24 1.11
Charts
OUTLOOK AND CONCLUSION
� At the current market price of Rs. 446.40, the stock P/E ratio is at 9.38 x FY16E and 8.51 x FY17E
respectively.
� Earning per share (EPS) of the company for the earnings for FY16E and FY17E is seen at Rs.47.57 and Rs.
52.46 respectively.
� Net Sales and PAT of the company are expected to grow at a CAGR of 15% & 13% over 2014 to 2017E
respectively.
� On the basis of EV/EBITDA, the stock trades at 8.39 x for FY16E and 8.24 x for FY17E.
� Price to Book Value of the stock is expected to be at 1.24 x and 1.11 x respectively for FY16E and FY17E.
� We recommend ‘BUY’ in this particular scrip with a target price of Rs.515.00 for Medium to Long term
investment.
INDUSTRY OVERVIEW
India has a diversified financial sector, which is undergoing rapid expansion. The sector comprises commercial
banks, insurance companies, non-banking financial companies, co-operatives, pension funds, mutual funds and
other smaller financial entities. The financial sector in India is predominantly a banking sector with commercial
banks accounting for more than 60 per cent of the total assets held by the financial system.
India's services sector has always served the country’s economy well, accounting for about 57 per cent of the
gross domestic product (GDP). In this regard, the financial services sector has been an important contributor.
The Government of India has introduced reforms to liberalise, regulate and enhance this industry. At present,
India is undoubtedly one of the world's most vibrant capital markets. Challenges remain, but the future of the
sector looks good. The advent of technology has also aided the growth of the industry. About 75 per cent of the
insurance policies sold by 2020 would, in one way or another, be influenced by digital channels during the pre-
purchase, purchase or renewal stages, as per a report by Boston Consulting Group (BCG) and Google India.
Market Size
The size of banking assets in India reached US$ 1.8 trillion in FY14 and is expected to touch US$ 28.5 trillion by
FY25. The Association of Mutual Funds in India (AMFI) data show that assets of the mutual fund industry have hit
an all-time high of about Rs 12 trillion (US$ 189.83 billion). Equity funds had inflows of Rs 52170.00 mn (US$
825.49 million), taking total inflows on a year-to-date basis to Rs 610890.00 mn (US$ 9.66 billion). Income funds
and liquid funds account for the largest proportion of AUM, with Income funds accounting for Rs 5.22 trillion
(US$ 82.59 billion) and equity funds accounting for Rs 3.06 trillion (US$ 48.41 billion).
Investments/Developments
• India has moved a step closer to having a Singapore- or Dubai-like financial hub, with the Securities and
Exchange Board of India (SEBI) approving a framework for international financial centres (IFCs)
• The RBI has allowed bonds issued by multilateral financial institutions like World Bank Group, the Asian
Development Bank and the African Development Bank in India as eligible securities for interbank borrowing.
The move will further develop the corporate bonds market, RBI said in a notification.
• Maharashtra’s plans to promote Mumbai as a global financial centre have received further encouragement as
Wall Street firm JPMorgan Chase & Co. and the Japanese government arm Japan External Trade Organization
(Jetro) agreed to partner with the state government to hold road shows to attract financial services
companies to Mumbai.
• Yes Bank Ltd has signed a memorandum of understanding (MoU) with the US government’s development
finance institution Overseas Private Investment Corp. (OPIC) to explore US$ 220 million of financing to lend
to micro, small and medium enterprises (MSMEs) in India, the bank said in a press release.
• Bandhan Financial Services Pvt. Ltd has raised Rs 16000.00 mn (US$ 252.97 million) from two international
institutional investors to help convert its microfinance business into a full service bank.
• JP Morgan Asset Management (UK) Ltd, JP Morgan Investment Management Inc and JP Morgan Chase Bank
NA, have acquired a 4.11 per cent stake in Mahindra & Mahindra Financial Services Ltd for Rs 1137.50 mn
(US$ 17.98 million).
Government Initiatives
Several measures have been outlined in the Union Budget 2014-15 that aim at reviving and accelerating
investment which, inter alia, include fiscal consolidation with emphasis on expenditure reforms and continuation
of fiscal reforms with rationalization of tax structure; fillip to industry and infrastructure, fiscal incentives and
concrete measures for transport, power, and other urban and rural infrastructure; measures for promotion of
foreign direct investment (FDI) in selected sectors, including defence manufacturing and insurance; and, steps to
augment low cost long-term foreign borrowings by Indian companies. Fiscal reforms have been bolstered further
by the recent deregulation of diesel prices. The launch of ‘Make in India’ global initiative is intended to invite
both domestic and foreign investors to invest in India. The aim of the programme is to project India as an
investment destination and develop, promote and market India as a leading manufacturing destination and as a
hub for design and information. The programme further aims to radically improve the Ease of Doing Business,
open FDI regime, improve the quality of infrastructure and make India a globally competitive manufacturing
destination.
Road Ahead
India is today one of the most vibrant global economies, on the back of robust banking and insurance sectors. The
country is projected to become the fifth largest banking sector globally by 2020, as per a joint report by KPMG-
CII. The report also expects bank credit to grow at a compound annual growth rate (CAGR) of 17 per cent in the
medium term leading to better credit penetration. Life Insurance Council, the industry body of life insurers in the
country also projects a CAGR of 12–15 per cent over the next few years for the financial services segment.
Also, the relaxation of foreign investment rules has received a positive response from the insurance sector, with
many companies announcing plans to increase their stakes in joint ventures with Indian companies. Over the
coming quarters there could be a series of joint venture deals between global insurance giants and local players.
Disclaimer:
This document is prepared by our research analysts and it does not constitute an offer or solicitation for the
purchase or sale of any financial instrument or as an official confirmation of any transaction. The information
contained herein is from publicly available data or other sources believed to be reliable but we do not represent that
it is accurate or complete and it should not be relied on as such. Firstcall Research or any of its affiliates shall not be
in any way responsible for any loss or damage that may arise to any person from any inadvertent error in the
information contained in this report. Firstcall Research and/ or its affiliates and/or employees will not be liable for
the recipients’ investment decision based on this document.
Firstcall India Equity Research: Email – [email protected]
C.V.S.L.Kameswari Pharma & Diversified
U. Janaki Rao Capital Goods
B. Anil Kumar Auto, IT & FMCG
M. Vinayak Rao Diversified
G. Amarender Diversified
Firstcall Research Provides
Industry Research on all the Sectors and Equity Research on Major Companies
forming part of Listed and Unlisted Segments
For Further Details Contact:
Tel.: 022-2527 2510/2527 6077 / 25276089 Telefax: 022-25276089
040-20000235 /20000233
E-mail: [email protected]
www.firstcallresearch.com
Recommended