Queensland University of Technology
School of Physical and Chemical Sciences
DEVELOPMENT OF A PARTICLE NUMBER AND
PARTICLE MASS EMISSIONS INVENTORY FOR AN
URBAN FLEET: A STUDY IN SOUTH-EAST
QUEENSLAND
Diane Underwood Keogh
A thesis submitted in partial fulfillment of the requirements of the degree of
Doctor of Philosophy
2009

i
KEYWORDS
Air quality regulation, ambient aerosol, emission factors, modality of particle size
distribution, motor vehicles, motor vehicle inventory, particle mass, particle
number, particle volume, PM1, PM2.5, PM10, South-East Queensland,
submicrometre particles, tailpipe emissions, traffic, transport modelling, ultrafine
particles, urban fleet.

ii
ABSTRACT
Motor vehicles are a major source of gaseous and particulate matter pollution in
urban areas, particularly of ultrafine sized particles (diameters < 0.1 µm).
Exposure to particulate matter has been found to be associated with serious health
effects, including respiratory and cardiovascular disease, and mortality. Particle
emissions generated by motor vehicles span a very broad size range (from around
0.003-10 µm) and are measured as different subsets of particle mass
concentrations or particle number count. However, there exist scientific
challenges in analysing and interpreting the large data sets on motor vehicle
emission factors, and no understanding is available of the application of different
particle metrics as a basis for air quality regulation. To date a comprehensive
inventory covering the broad size range of particles emitted by motor vehicles,
and which includes particle number, does not exist anywhere in the world.
This thesis covers research related to four important and interrelated aspects
pertaining to particulate matter generated by motor vehicle fleets. These include
the derivation of suitable particle emission factors for use in transport modelling
and health impact assessments; quantification of motor vehicle particle emission
inventories; investigation of the particle characteristic modality within particle
size distributions as a potential for developing air quality regulation; and review
and synthesis of current knowledge on ultrafine particles as it relates to motor
vehicles; and the application of these aspects to the quantification, control and
management of motor vehicle particle emissions.
iii
In order to quantify emissions in terms of a comprehensive inventory, which
covers the full size range of particles emitted by motor vehicle fleets, it was
necessary to derive a suitable set of particle emission factors for different vehicle
and road type combinations for particle number, particle volume, PM1, PM2.5 and
PM1 (mass concentration of particles with aerodynamic diameters < 1 µm, < 2.5
µm and < 10 µm respectively). The very large data set of emission factors
analysed in this study were sourced from measurement studies conducted in
developed countries, and hence the derived set of emission factors are suitable for
preparing inventories in other urban regions of the developed world. These
emission factors are particularly useful for regions with a lack of measurement
data to derive emission factors, or where experimental data are available but are
of insufficient scope.
The comprehensive particle emissions inventory presented in this thesis is the first
published inventory of tailpipe particle emissions prepared for a motor vehicle
fleet, and included the quantification of particle emissions covering the full size
range of particles emitted by vehicles, based on measurement data. The inventory
quantified particle emissions measured in terms of particle number and different
particle mass size fractions. It was developed for the urban South-East
Queensland fleet in Australia, and included testing the particle emission
implications of future scenarios for different passenger and freight travel demand.

iv
The thesis also presents evidence of the usefulness of examining modality within
particle size distributions as a basis for developing air quality regulations; and
finds evidence to support the relevance of introducing a new PM1 mass ambient
air quality standard for the majority of environments worldwide. The study found
that a combination of PM1 and PM10 standards are likely to be a more discerning
and suitable set of ambient air quality standards for controlling particles emitted
from combustion and mechanically-generated sources, such as motor vehicles,
than the current mass standards of PM2.5 and PM10.
The study also reviewed and synthesized existing knowledge on ultrafine
particles, with a specific focus on those originating from motor vehicles. It found
that motor vehicles are significant contributors to both air pollution and ultrafine
particles in urban areas, and that a standardized measurement procedure is not
currently available for ultrafine particles. The review found discrepancies exist
between outcomes of instrumentation used to measure ultrafine particles; that few
data is available on ultrafine particle chemistry and composition, long term
monitoring; characterization of their spatial and temporal distribution in urban
areas; and that no inventories for particle number are available for motor vehicle
fleets. This knowledge is critical for epidemiological studies and exposure-
response assessment. Conclusions from this review included the recommendation
that ultrafine particles in populated urban areas be considered a likely target for
future air quality regulation based on particle number, due to their potential
impacts on the environment.
v
The research in this PhD thesis successfully integrated the elements needed to
quantify and manage motor vehicle fleet emissions, and its novelty relates to the
combining of expertise from two distinctly separate disciplines - from aerosol
science and transport modelling. The new knowledge and concepts developed in
this PhD research provide never before available data and methods which can be
used to develop comprehensive, size-resolved inventories of motor vehicle
particle emissions, and air quality regulations to control particle emissions to
protect the health and well-being of current and future generations.

vi
ACKNOWLEDGEMENTS
My sincere appreciation and thanks go to my Supervisors Professor Lidia
Morawska, Professor Luis Ferreira and Dr. Zoran Ristovski for their endless
patience, commitment, encouragement, guidance, academic training and help. In
particular, I would like to especially thank Lidia for her support and encouragement
throughout this very interesting and exciting course.
I am also grateful to Professor Kerrie Mengersen for her professional guidance and
encouragement, and to Joe Kelly, Sean Moynihan and Jaime Mejia for their help
with modelling and maths. The financial support arranged by Ray Donato,
Jurgen Pasieczny and Randall Fletcher is gratefully appreciated. Special thanks go
to Rachael Robinson for her support and friendship. Many thanks to Hussein
Kanaani and Afkar Al Farsi for helping me with physics instrumentation, and for
your kind friendship.
Thanks very much to Dr. Nick Holmes for his kind help, patience and support, to
Dr. Graham Johnson for answering my endless questions; to Dr. Rohan Jayaratne,
Dr. Congrong He and Dr. Milan Jamriska for providing very helpful advice, and to
Xuan Ling for our discussions. The assistance of Scott Cormack, Andrew Joycey
and Dan Harney with traffic modelling and data, Jeff Eaton, Andrew Copland and
Vernon Alcantra for providing transport data, and helpful discussions with Bill
Duncan, John Woodland and Dr. Sama Low Choy are also greatly appreciated.

vii
A very special thank you goes to Kate McKee from the Research Centre for being
such an encouraging and professional ambassador for the Queensland University
of Technology.
My sincere appreciation is extended to the Queensland University of Technology
for enabling me to take up this wonderful opportunity; and to the staff and
students at the International Laboratory for Air Quality and Health for providing a
very positive, happy and encouraging environment in which to work.
Last, but not least, thank you to Dr. David Freebairn and Dr. Sunil Dutta who
were my first ‘unofficial’ Professors in the field of applied climate research; and
to Dr. Alfio Parisi and Dr. Michael Kimlin for introducing me to the exciting
world of Physics.

viii
LIST OF PUBLICATIONS
Morawska, L., Keogh, D.U., Thomas, S.B., Mengersen, K., 2008. Modality in
ambient particle size distributions and its potential as a basis for developing air
quality regulation. Atmospheric Environment 42 (7), 1617-1628.
Morawska, L., Ristovski, Z., Jayaratne, E.R., Keogh, D.U., Ling, Z. 2008.
Ambient nano and ultrafine particles from motor vehicle emissions:
characteristics, ambient processing and implications on human exposure.
Atmospheric Environment 42 (35), 8113-8138.
Keogh, D.U., Kelly, J., Mengersen, K., Jayaratne, R., Ferreira, L., Morawska, L.,
2009. Derivation of motor vehicle tailpipe particle emission factors suitable for
modelling urban fleet emissions and air quality assessments. Environmental
Science and Pollution Research – International. Published online, doi
0.1007/s11356-009-0210-9.
Keogh, D.U., Ferreira, L., Morawska, L., 2009. Development of a particle number
and particle mass vehicle emissions inventory for an urban fleet. Environmental
Modelling & Software 24(11), 1323-1331.

ix
ORAL PRESENTATIONS & COURSE UNIT PRESENTATION
18th Coordinating Research Council On-Road Vehicle Emissions Workshop,
“Development of a particle number and particle mass emissions inventory for an
urban fleet”, San Diego, USA, 31 March – 2 April, 2008.
14th IUAPPA World Congress (International Union of Air Pollution
Prevention & Environmental Associations), “Emission factors for estimating
motor vehicle particle emissions in urban areas”, Brisbane, 9-13 September, 2007.
11th International Health Summer School, International Symposium on
Environmental Health, Climate Change & Sustainability, “Modality in
ambient particle size distributions and its potential as a basis for developing air
quality regulation”, Queensland University of Technology, 21-22 November,
2006.
Air Pollution & Transport Short Course, Transport Futures Institute,
delivered jointly by the University of Queensland and Queensland University of
Technology, “Emission Factors: The Evidence”, Brisbane, 1-3 August, 2007.

x
TABLE OF CONTENTS
Keywords ………………………………………………...…….….. i
Abstract …………………………………………………………….. ii
Acknowledgements ………………………………………………… vi
List of Publications … ……………………………………………... viii
Oral Presentations and Course Unit Presentation ……………….…. ix
List of Tables …..…………………………………………………… xxii
List of Figures …………………………………………………….… xxv
Statement of Original Authorship ………………………………….. xxvi

xi
TABLE OF CONTENTS (cont’d)
CHAPTER 1. INTRODUCTION …………………....................... 1
1.1. Description of the scientific problem investigated …………. 1
1.1.1. Developing comprehensive inventories of motor
vehicle particle emissions …………………….…….. 3
1.1.2. Combining knowledge from two different disciplines to
develop inventories …………………………….…... 5
1.1.3. Why particle number emission inventories are
important …………………………………….…….. 6
1.1.4. Designing environmentally-sustainable
transport systems …………………………………… 7
1.1.5. Examination of modality within particle size
distributions and its potential as a basis for
developing air quality regulation …………….……….. 8
1.2. The major components of this PhD research ……….……..….. 10
1.3. The objectives of the study ………………………………….... 12
1.4. Account of scientific progress linking the scientific papers…… . 18
1.5. The important and novel contribution of this PhD research…… 29
1.6. References ……………………………………………………. 32

xii
TABLE OF CONTENTS (cont’d)
CHAPTER 2. LITERATURE REVIEW ……………….................. 35
2.1. Introduction ……………………………………………………..... 35
2.2. Characteristics of motor vehicle particle emissions ………........... 36
2.2.1. The nature of particle emissions …………………….…... 37
2.2.2. Motor vehicle particle emissions ………………………... 39
2.2.3. Diesel particle emissions ………………………………... 40
2.2.4. Health effects associated with exposure to particles…….. 41
2.2.5. Current air quality standards to control particulate matter .. 43
2.2.6. Modality within particle size distributions …… ..……… 45
2.3. Vehicle emission inventories and local models …….…..…..……. 47
2.3.1. Developing emission inventories ………….……..……… 47
2.3.2. Local inventories and models for South-East Queensland
and Queensland ………………………………………….. 51
2.4. Transport models …………………………………….………… 55
2.5. Estimate of road transport emissions prepared for the UK ..…. 56
2.6. Identifying suitable particle emission factors .…………………. 58
2.7. Summary ………….…………………………………..……… 59
2.8. Knowledge gaps and conclusions from this review …………... 63
2.9. References …………………………………………………… 65
2.10. Bibliography ……………..……………………………… ...... 80
xiii
TABLE OF CONTENTS (cont’d)
CHAPTER 3. STATISTICAL TECHNIQUES USED IN THIS
THESIS …………………………………………………………………… 127
3.1. Introduction …………………………………………….………….... 127
3.2. Statistical techniques used in this thesis …………………………….. 129
3.2.1. Kolmogorov-Smirnov (K-S) test ……………………………… 129
3.2.2. Construction of 95% confidence intervals ………………...…. 130
3.2.3. Trapezoidal rule for integration of the area under a curve ……..131
3.2.4. Development of statistical models using linear regression
and ANOVA …………………………………………………. 132
3.2.5. Linear regression for continuous variables ………………….. 132
3.2.6. Multifactor Analysis of Variance (ANOVA) for categorical
variables ……………………………………..…..………..…..133
3.2.7. The stepwise selection technique for statistical model
selection ……………………………………………………. 134
3.2.8. Scheffe’s multiple comparison tests ……………..…….… . 135
3.3. Alternative approaches considered but not used in this thesis …….…136
3.3.1. Principal Component Analysis …………………………... 136
3.3.2. Non-parametric methods of statistical comparison ……..…. 138
3.3.3. Techniques for integrating the area under a curve …….……138
3.3.4. Techniques for selecting variables in statistical model
development …………………………….…………………. 139
3.3.5. Multiple comparison methods ……………………………. 140
3.4. References ……………………………..…………………………. 143

xiv
TABLE OF CONTENTS (cont’d)
CHAPTER 4. MODALITY IN AMBIENT PARTICLE SIZE
DISTRIBUTIONS AND ITS POTENTIAL AS A BASIS FOR
DEVELOPING AIR QUALITY REGULATION ............................ 146
4.1. Introduction ……………………………….…………………….... 149
4.2. Methods and techniques ………………………….……................ 153
4.3. Results and discussion ………………………………………….... 157
4.3.1. Contribution of the modes in South-East Queensland to
PM1, PM2.5, PM10 ..……………………………………….. 157
4.3.2. Modal locations in the published literature ……………….. 161
4.3.3. Separation between modal location values in mass and
volume particle size distributions at around 1 µm…………... 166
4.4. Conclusions ………………………………………………………….. 168
4.5. References …………………………………………..………………. 171

xv
TABLE OF CONTENTS (cont’d)
CHAPTER 5. DERIVATION OF MOTOR VEHICLE PARTICLE
EMISSION FACTORS ………….....……………………….....……......... 179
5. Overview of Chapters 5.1. and 5.2. .…………………………..……..… 180
CHAPTER 5.1. DERIVATION OF MOTOR VEHICLE TAILPIPE
PARTICLE EMISSION FACTORS SUITABLE FOR MODELLING
URBAN FLEET EMISSIONS AND AIR QUALITY ASSESSMENTS 183
5.1. Background, aim and scope ………………………………………….... 187
5.2. Materials and methods .…………………………………….…………. 189
5.2.1. Model variables examined ……………………………..……... 195
5.2.2. Statistical analysis of variables ………………………………. 200
5.2.3. Basis for selection of the most suitable emission factors …… 202
5.3. Results ……………….…………………………………….………… 203
5.3.1. Sample size of emission factors examined in the statistical
models…………………………………………………………. 203
5.3.2. Statistical models developed to derive average emission factors. 203

xvi
TABLE OF CONTENTS (cont’d)
5.4. Discussion ………………………………………………………… 207
5.4.1. Statistical models used to derive average emission
factors ………………………….……………………..….. 207
Particle number model ……………………….………..…. 207
Particle volume model ……………………………………... 208
PM1 model ………………………………………………… 208
PM2.5 model ……………………………………….…….…. 209
PM10 model …………………………………….…………... 209
Total particle mass model …………………….…………… 211
5.4.2. Statistical differences between published emission
factors ……………………………..…..……………..…... 211
5.4.3. Relevance and application of the average particle
emission factors presented in this study ..………………… 213
5.5. Conclusions .…………………………………………………..... 214
5.6. Recommendations and perspectives …….………………….….. 216
5.7. References ………………………………………………….…. 218

xvii
TABLE OF CONTENTS (cont’d)
CHAPTER 5.2. DERIVATION OF MOTOR VEHICLE PARTICLE
EMISSION FACTORS – STATISTICAL MODEL OUTPUTS …. 232
5. Introduction …………………………………………….…….……. 232
5.1. Statistical model outputs ………………………..…........... 233
5.2. Statistical relationships between categorical variables …... 245
5.3. Additional comments on particle volume and PM10 emission
factors ……............................................... .......................... 254
5.4. Additional comments on PM10 emission factors used in the
urban SEQ inventory……………………………………….. 256
5.5. References ……………………………………….................. 259

xviii
TABLE OF CONTENTS (cont’d)
CHAPTER 6. DEVELOPMENT OF A PARTICLE NUMBER AND
PARTICLE MASS EMISSIONS INVENTORY FOR AN URBAN
FLEET ………………………………..………………………………….. 260
6.1. Introduction …………………………………………………………... 264
6.2. Method ………………………………………………….………….… 268
6.2.1. Study region. ……………… …………….………….……….… 270
6.2.2. Transport model .……………………..………………..…………. 271
6.2.3. Emission factors …………………………….………………….. 274
6.2.4. Variables used in the scenario analyses …………….………….. 276
6.3. Results and discussion …………………..…………………….………. 279
6.3.1. Particle inventory for urban SEQ for 2004 …………….…….….. 279
6.3.2. Comparing the urban SEQ particle inventory with other
inventories and models ……………………….………………… 284
6.3.3. Results of scenario analyses ……………………………….......... 288
6.4. Conclusions ……………………………………..……………………. 297
6.5. References …………………………………………….…..…………... 301

xix
TABLE OF CONTENTS (cont’d)
CHAPTER 7. AMBIENT NANO AND ULTRAFINE PARTICLES
FROM MOTOR VEHICLE EMISSIONS: CHARACTERISTICS,
AMBIENT PROCESSING AND IMPLICATIONS ON HUMAN
EXPOSURE ……………………………………………………………… 308
7.1. Introduction ………………………………………………..…..…….. 312
7.2. Capabilities and limitations of particle number measurement
methods ………………………………………………………………… 313
7.3. Sources of particles in natural environment …..……………….…….. 319
7.4. Vehicle emissions as a source of ultrafine particles ………………… 323
7.4.1. Introduction …………………………………………………… 323
7.4.2. Primary Particles …………………………………………… 325
7.4.3. Secondary Particles ………………………………………… 326
7.5. Role of fuels …………………………………………………………. 328
7.6. Role of after-treatment devices …………………………………….. 332
7.7. Role of ions ……………………………………………………….... 335
7.8. Road-tyre interface ………………………………………………… 338
7.9. Emission factors and emission inventories ………………………… 339
7.10. Transport of particles within urban scale and ambient processing ... 342
7.10.1. Role of meteorological factors on particle concentration … 343
7.10.2. Relative role of various processes ……………………….. 346
7.11. Particle size distributions and modal location in urban
environments ………………………………………………………. 351
7.12. Chemical composition of ultrafine particles in different
environments ……………………………………………………… 352
xx
TABLE OF CONTENTS (cont’d)
7.13. Temporal variation of particle characteristics …………………….. 358
7.13.1. Diurnal variation ……………………………………….. 358
7.13.2. Seasonal variation ………………………………………. 359
7.13.3. Long term variation …………………………………….. 361
7.14. Spatial distribution of particle concentrations within urban
environment ……………………………………….…….………… 363
7.14.1. Particle concentration as a function of the distance
from the road ……………………………………………… 364
7.14.2. Relationship between on-road and urban background
particle concentration ……………………………………… 368
7.15. Nucleation mode and its impact on urban particle concentrations ….. 369
7.16. Comparison of particle concentration levels between different
environments ……………………………………………………….. 375
7.17. Exposure to ultrafine particles ………… ……………………………377
7.18. Relationship between different particle metrics and with gaseous
pollutants …………………………………………………………… 378
7.19. Conclusions and implications for the exposure and epidemiological
studies ………………………..…………………………………. 381
7.20. References ……………………..………………………………… 387

xxi
TABLE OF CONTENTS (cont’d)
CHAPTER 8. CONCLUSIONS ……………………………………… 422
8.1. Introduction ………………………………………….…………….. 422
8.2. Principal significance of the findings ………..………………….. 424
8.3. The principal findings and significance of this study ……………. 430
8.4. General conclusions from this study .…………………………. 470
8.4.1. Modality in ambient particle size distributions …..…… 470
8.4.2. A new mass ambient air quality standard for PM1,
and its combination with PM10 ………………………. 470
8.4.3. A comprehensive set of particle emission factors for
motor vehicles ………………………………….……. 472
8.4.4. The first published comprehensive particle emissions
inventory for a motor vehicle fleet ………..………… 474
8.4.5. Synthesis of current knowledge on ultrafine particles in
relation to motor vehicles ……………………………….… 477
8.5. Scientific challenges and the novel contribution of this PhD
study …………………………………………..…………… 478
8.6 Comparison of emission factors derived in this PhD study
with a selection of Canadian, European, UK and USA
emission factors …………………………………………………… 480
8.7. Future research focus ……………………………………………. 491
8.8. References ……………………………………………................ 497
xxii
LIST OF TABLES
Table 2.1. Estimates of total annual PM10 for South-East Queensland 53 (SEQ) and urban South-East Queensland related to 2004 Table 4.1. Percent contribution of N+A and C modes by mass to PM1, 160 PM2.5 and PM10 in South-East Queensland, Australia Table 4.2. International literature reviewed to identify the location of 162 the modes in a number of different environments worldwide for particle number size distributions Table 4.3. International literature reviewed to identify the location of 163 the modes in a number of different environments worldwide for particle surface area size distributions Table 4.4. International literature reviewed to identify the location of 163 the modes in a number of different environments worldwide for particle volume size distributions Table 4.5. International literature reviewed to identify the location of 164 the modes in a number of different environments worldwide for particle mass size distributions Table 5.1. Source of tailpipe particle emission factors examined in the 190 statistical analysis to derive average emission factors for different vehicle and road type combinations Table 5.1.2. Model variables examined in the statistical analysis to derive 196 average emission factors to use in transport modelling and health impact assessments, to quantify tailpipe particle emissions generated by motor vehicle fleets Table 5.1.3. Sample size of emission factors for different model variables 198 examined in the statistical analysis, listed by particle metric Table 5.1.4. Tailpipe particle emission factors for motor vehicles 205 considered the most suitable to use in transport modelling and health impact assessments, derived based on advanced statistical analysis in this study of 667 emission factors in the international published literature Table 5.2.1. Particle number model explanatory variables and average 235 particle number emission factors

xxiii
LIST OF TABLES
Table 5.2.2. Particle volume model explanatory variables and average 237 particle volume emission factors
Table 5.2.3. PM1 model explanatory variables and average PM1 240 emission factors
Table 5.2.4. PM2.5 model explanatory variables and average PM2.5 241 emission factors
Table 5.2.5. PM10 model explanatory variables and average PM10 243 emission factors
Table 6.1. Tailpipe particle emission factors for motor vehicles used to 275 develop particle number, PM1, PM2.5 and PM10 inventories presented in this study
Table 6.2. Particle emission inventories for the urban South-East 283
Queensland motor vehicle fleet for particle number, PM1, PM2.5 and PM10 on urban and urban-major roads
Table 6.3. Comparison of estimates of total annual PM10 for SEQ and 285 urban SEQ
Table 6.4. Modelled reductions in total particle emissions in urban 290 SEQ in the 24 hour average period Table 6.5. Modelled reductions in total particle emissions in urban 291
SEQ in the peak travel times and in the 24 hour average period
Table 6.6. Scenario 3: Average particle emission factors per 293
passenger per km for LDVs and buses in urban SEQ in the 24 hour average period
Table 6.7. Scenario 4A: Model variables and assumptions used to 295
predict particle number and particle mass emissions in urban SEQ in 2026
Table 6.8. Scenario 4B: Estimated total annual particle emissions in 296
urban SEQ in 2026, compared to the 2004 inventory, this study
xxiv
LIST OF TABLES
Table 7.1. The range of particle number emission factors reported for 341 nano and ultrafine size ranges Table 8.1. Précis of the principal findings of this PhD research and 461 their significance in terms of application Table 8.2. Comparison of Australian National Pollutant Inventory 481 (NPI), Australian Diesel NEPM Preparatory Work, and a selection of Canadian, European, UK and USA particle emission factors, with emission factors derived in this PhD study Table 8.3 Future studies recommended which use the data, 492 knowledge and methods developed in this PhD study

xxv
LIST OF FIGURES
Figure 1.1. The foci of the four major research components 11 of this PhD project Figure 4.1. Normalised number and volume size distributions in 157 South-East Queensland, Australia
Figure 4.2. Published modal location values relating to particle 165 size distributions for South-East Queensland, Australia and for a range of environments worldwide and metrics (n=600) Figure 5.2.1. Multiple comparison plot showing the nature of the 246 statistical relationship between the categorical model variables for different metrics Figure 7.1. Comparison of reported particle number 316 concentrations measured by CPC or DMPS/SMPS Figure 7.2. Mean and median particle number concentrations for different environments 376 Figure 8.1. Diagram of Research Activities 426

xxvi
THE STATEMENT OF ORIGINAL AUTHORSHIP
The work contained in this thesis has not been previously submitted for a degree
or diploma at any other educational institution. To the best of my knowledge and
belief, the thesis contains no material previously published or written by another
person except where due reference is made.
Signed: ……………………..
Date: ……………………..

1
CHAPTER 1. INTRODUCTION
1.1 DESCRIPTION OF THE SCIENTIFIC PROBLEM
INVESTIGATED
Particles emitted from motor vehicle fleets impact on our environment on a
number of scales, from the local scale, polluting areas on or near roads and in
busways and tunnels, to emissions dispersed across regions and by long range
transport across continents. They can also reach into the upper atmosphere, into
the troposphere and stratosphere and contribute to climate change effects and
dimming of the earth’s atmosphere.
At the global scale, aerosols produced from fossil fuel and biomass burning can
reflect solar radiation, leading to a cooling of our climate system (IPCC 2001);
and the effects of aerosols can cause a weakening of the hydrological cycle, which
impacts on the quantity and availability of fresh water (Ramanathan et al. 2001).
A reliable global inventory of aerosol emission rates, concentrations and lifetimes
is needed, as well as breakthroughs in our understanding about how very small
particles in aerosols modify our environment (Ramanathan et al. 2001).
The mechanisms associated with particle formation, and the resultant levels of
particle concentrations in different particle size ranges, and how these relate to
different particle sources, such as motor vehicles, are the subject of ongoing
research. Examining the location of modes in particle size distributions provides
an opportunity to identify the particle size/s associated with the maximum particle

2
concentrations in different environments and for different particle metrics.
Results of such examinations have the potential to aid source apportionment and
inform development of relevant air quality regulations and guidelines. To date, an
investigation of the location of modes in particle size distributions in different
environmental aerosols and for different particle metrics on the broader global
scale has not been comprehensively attempted.
Investigation of the levels of particulate matter emitted from individual vehicles
continue to be the subject of extensive research. However our knowledge about
the quantities of total particulate matter emitted from urban motor vehicle fleets,
including ultrafine particle emissions (diameters < 0.1 µm), are still the subject of
considerable uncertainty. This is because a comprehensive inventory of particles
emitted from a motor vehicle fleet does not currently exist anywhere in the world.
The current state of knowledge is that very little is known about the extent of total
particulate matter emitted by motor vehicle fleets. This means that in urban areas
where vehicles are a major source of particulate matter pollution, urban
populations around the world are being exposed to levels of particulate matter
pollution about which we have insufficient knowledge, and which have not been
comprehensively quantified.
The health effects associated with exposure to particulate matter, however, are
well-documented. There are known serious health effects associated with
exposure to particulate matter, and a number of epidemiological studies have

3
linked exposure with increases in hospital admissions, various respiratory and
cardiovascular diseases and mortality (Pope and Dockery 2006).
This gap in current knowledge about the extent of total particulate matter emitted
by motor vehicle fleets severely limits our ability to develop effective and
relevant ambient air quality standards, and strategies, such as land use and
transport planning, which can protect human health, the ecosystem, and our
earth’s atmosphere.
Development of comprehensive motor vehicle particle emission inventories,
including inventories for particle number, as well as investigations of particle
mechanisms and resultant modality within particle size distributions and how
these relate to different emission sources have the potential to inform
development of effective air quality and vehicle standards, and strategies to
monitor and control this major pollution source.
1.1.1. Developing comprehensive inventories of motor vehicle particle
emissions
Motor vehicles are major emitters of gaseous and particulate matter pollution, and
a dominant source of particulate matter pollution in urban areas. Developing
inventories of particle emissions provide a means for gaining a detailed
understanding of the extent of this major pollution source.

4
To date a comprehensive, size-resolved inventory of motor vehicle particle
emissions for a motor vehicle fleet, covering the full size range of particles
emitted and including particle number and different mass size fractions, is not
available in the literature. Quantifying particle number emissions, in particular,
pose a major challenge as these can be very difficult and costly to measure, hence
an extensive database of information is not currently available.
To develop particle emission inventories, emission factors are used which
quantify particle emissions originating from different vehicle types under varying
driving and road conditions. However, identifying the most suitable emission
factors to use in developing inventories is an extremely complex process because
of the very diverse range of techniques used to derive emission factors. Many
different measurement methods have been used, that have measured different
particle size ranges and been conducted in different parts of the world. A
multiplicity of factors need to be resolved in order to identify the most suitable
emission factors to use in transport modelling and air quality assessments.
Two very important characteristics of effective particle emission inventories for
motor vehicle fleets include:-
• Particle emission inventories needed to be size-resolved. This is because
particle size is a key characteristic of ambient particulate matter which
determines the likelihood of particles depositing in the human
respiratory tract and how deeply they are likely to lodge in the tract
(Morawska et al. 2008). Therefore, from a health effects perspective it

5
is very important that inventories of motor vehicle particle emissions are
size-resolved.
• Particle emission inventories need to quantify both particle number and
also emissions for different particle mass size fractions. This relates to
the fact that particles with diameters < 1 µm are prolific in terms of
their numbers but have little mass and are therefore measured in terms of
particle number; whereas larger-sized particles with diameters > 1 µm
have greater mass and are most effectively measured in terms of
different particle mass size fractions.
1.1.2. Combining knowledge from two different disciplines to develop
inventories
One of a number of complexities associated with developing inventories of fleet
particle emissions is the very significant amount of data required. This includes
transport modelling data, where traffic volumes are assigned to different road
links in a study area; and derivation of suitable emission factors for different
vehicle and road type combinations that are relevant to the vehicle mix in the fleet
being modelled.
Developing inventories of emissions provide data that enable comparisons to be
made between quantified emissions and current air quality standards. This data
also aids identification of emission hotspots, informs development of air quality
guidelines and regulations, and health impact assessments. It also provides
invaluable information for land use and for transport planners to guide their
planning and decision-making.

6
1.1.3. Why particle number emission inventories are important
Most particles emitted from motor vehicles are ultrafine size (Morawska 2003)
and current ambient air quality standards are ineffective for controlling ultrafine
particles as they are mass-based and prescribe measurement of PM2.5 and PM10
(particles with aerodynamic diameters < 2.5 µm and < 10 µm respectively).
Ultrafine particles are more appropriately measured in terms of particle number
emissions, because they have little mass, and are prolific in terms of their
numbers.
Currently ambient air quality standards in terms of the concentration of particle
number emissions do not exist anywhere in the world, which means that the
majority of motor vehicle particle emissions are not regulated. In addition, a
detailed emission inventory for particle number concentration is not available in
the literature (Jones and Harrison 2006). Hence, to address this major gap in our
knowledge it is extremely important to develop inventories which include particle
number, in addition to different particle mass size fractions.
Another important reason for developing particle number inventories is that at
present, in terms of health effects due to exposure to particle emissions, the focus
of current scientific debate is centred on the premise that particle number is more
directly related to health effects than particle mass (ECJRC 2002). Development
of particle number inventories and further epidemiological research will inform
this very important debate.

7
Although considerable toxicological evidence exists on the harmful effects to
human health of exposure to ultrafine particles, current epidemiological evidence
is insufficient to enable a conclusion to be reached on an exposure-response
relationship (WHO 2005). However, two organizations in Europe are taking a
proactive stance to control ultrafine particles by the introduction of particle
number standards, which measure particle emission rates. Based on the
recommendation of the UNECE-GRPE Particulate Measurement Program, the
European Commission is adding a particle number limit and new measurement
procedure to its EURO V/VI emissions standards for light duty diesel vehicles
and to its EURO VI emissions standard for heavy duty diesel vehicles relating to
solid particles (European Union 2007; Commission of the European Communities
2007 a,b; http://ec.europa.eu/index_en.htm). The Swiss Agency for the
Environment, Forests and Landscape has proposed the introduction of a particle
number standard for diesel-fuelled passenger vehicles for solid particles in the
0.02-0.30 µm size range (AQEG 2005).
1.1.4. Designing environmentally-sustainable transport systems
To design and manage transport systems which are environmentally-sustainable
more detailed information is needed about total particulate matter emitted from
fleets to guide land use and transport planning.
One of the problems of major concern in our current transport systems are the
relatively high emission rates of heavy duty diesel vehicles. For example, in
terms of particle number emissions diesel-fuelled vehicles have been found to
emit an order of magnitude higher particle emissions than petrol-fuelled vehicles
8
(Morawska et al. 2004); and although they generally constitute a small proportion
of the fleet in terms of number, their high emission rates make them a major
pollution source. In addition to introducing technologically-based solutions such
as after-treatment devices, eg., particle filters, it is very important to limit
population exposure to these high emitters by monitoring and controlling their
route choices situated close to populations, and to devise and implement lower
polluting options for freight movement, particularly given that diesel exhaust has
been declared a carcinogen in Switzerland (Swiss Clean Air Act 2000;
www.dieselnet.com/standards/ch/).
1.1.5. Examination of modality within particle size distributions and its
potential as a basis for developing air quality regulation
A mode may be defined as a peak in the lognormal function of the number or
mass distribution of an atmospheric aerosol (John 1993). The location of the
mode in a particle size distribution relates to the particle size/s associated with the
maximum particle concentration/s in the aerosol being studied, and are influenced
by particle mechanisms and the dominant sources of pollution.
Most aerosol particle size distributions are not characterised by bell-shaped
distributions of particle size, they are generally not normally distributed and tail
off with increasing particle size, hence log-normal distributions are considered
more appropriate for characterising airborne particle distributions (Ruzer and
Harley 2004). For example, a substantial number of ambient aerosols measured
in terms of number size distributions can be described as the sum of different

9
modes, with each mode being log-normally distributed (Hinds 1999; Seinfeld and
Pandis 1998).
Examination of two specific aspects related to modality within particle size
distributions have the potential to provide important knowledge for understanding
particle formation mechanisms, and atmospheric processes as they relate to
particles. Investigating these aspects could aid source apportionment, inform
exposure and health risk assessments and guide the development of relevant and
effective air quality regulations and guidelines.
These aspects relate to examining the location of modes in aerosol particle size
distributions, and analysing the relative contributions of particle concentrations to
different modal particle size ranges (known as nucleation, accumulation and
coarse modes, which are generally considered to relate to particles with diameters
of < 0.1 µm, 0.1-1 µm and > 1 µm respectively).
It has been shown that a clear separation exists at around 1 µm, or somewhat
above, between the accumulation and coarse modes in ambient air particle size
distributions, where the mass of particles belonging to these two modal particle
size ranges is at a minimum (Lundgren and Burton 1995). The major proportion
of anthropogenic pollution sources are combustion-related and generate particles
with diameters < 1 µm (Jamriska and Morawska 2003); hence a study of modal
location values and particle concentrations related to the 1 µm size range (or
thereabouts) is considered of global significance.

10
1.2. THE MAJOR COMPONENTS OF THIS PHD RESEARCH
The four major research components of this PhD project are depicted in
Figure 1.1. These relate to:-
1. Examination of modality within particle size distributions as a basis
for developing air quality regulation.
2. Derivation of a comprehensive set of particle emission factors for motor
vehicles.
3. Development of a particle number and particle mass emissions inventory
for the urban fleet in South-East Queensland.
4. A review and synthesis of existing knowledge on ultrafine particles
in ambient air, with a specific focus on particles originating from
motor vehicles.
The examination of modality within particle size distributions provided important
contextual information to inform derivation of suitable particle emission factors for
use in development of the motor vehicle emissions inventory. Outputs from the
inventory development, in turn, complemented modality examination findings. The
review and synthesis of current knowledge on ultrafine particles in ambient air
contributed knowledge to both the examination of modality within particle size
distributions and to the derivation of suitable particle emission factors.

11
Is modality useful for developing air quality regulations?
Which emission factors are the mostsuitable to use in transport modelling?
Emission Factors: derivation of a comprehensive set of particle emission factors to estimate fleet emissions
What temporal and spatial characteristics are important in assessing human exposure to ultrafine particles?
Do discrepancies exist between the outcomes of different particle number measurement techniques?
Modality within particle size distributions
Development of a comprehensive inventory of motor vehicle fleet particle emissions for urban South-East Queensland (SEQ)
How much particulate matter does the urban SEQ fleet contribute in terms of particle number and particle mass?
How might this quantification be validated?
Scenario modelling: What are emission levels likely to be in the future? What changes in travel demand might effect reasonable reductions in regional particle emission levels?
Figure 1.1 The foci of the four major research components of this PhD project
Review & synthesis of current knowledge on ultrafine particles, with a specific focus on vehicle emissions
Would a PM1 mass standard suit most environments?
How confident can we be about the values of the derived emission factors?
Are vehicles a significant source of ultrafine particles in populated urban areas, and are ultrafine particle inventories available for motor vehicles?
Are ultrafine particles in urban areas the most likely target for future air quality regulations in relation to particle number?
Do contributions to PM1, PM2.5 and PM10 mass vary for different environments?
To what extent do the derived emission factors explain the variation in published emission factors?
12
1.3. THE OBJECTIVES OF THE STUDY
The overall objectives and specific aims of this study are to:-
1. Examine a wide range of different environments in urban South-East
Queensland, Australia to identify the relationship between fractional
contribution of mass from different sources and modes in particle size
distribution to PM1, PM2.5 and PM10.
1.1 Investigate the characteristics of modality within particle size
distributions in marine-influenced, modified background, suburban
background, traffic-influenced, urban-influenced and vegetation
burning environments in South-East Queensland; and examine the
relationship between the fractional contribution of mass from
different sources and modes in particle size distributions to PM1,
PM2.5 and PM10.

13
2. Examine the relevance of using modality within particle size
distributions as a basis for developing air quality regulations;
and ascertain whether PM1 and PM10 would be a more effective
combination of mass standards than the current standards of
PM2.5 and PM10 for controlling ambient particles generated from
mechanical and combustion-related processes.
2.1 Examine the location of the mode in a wide range of
worldwide environments, including in traffic-influenced
environments, for different particle metrics to assess its
relevance as a basis for developing air quality regulations.
2.2 Determine whether a clear and distinct separation occurs
between the modes at around 1 µm in different environments
throughout the world, and assess the suitability of a PM1 mass
ambient air quality standard for these different worldwide
environments, including for traffic-influenced environments.

14
3. Derive a comprehensive set of particle emission factors for motor
vehicles that are suitable to use in transport modelling to quantify
tailpipe particle emissions from motor vehicle fleets for different
particle sizes and particle metrics.
3.1 Derive the most suitable particle emission factors to use in transport
modelling and health impact assessments for different vehicle and
road type combinations, and for different particle sizes and metrics,
to enable development of size-resolved inventories for motor vehicle
fleets that cover the full size range of particles emitted and which
include quantification of both particle number and different mass
size fractions.
15
4. Develop a comprehensive road-link based inventory of tailpipe
particle emissions generated by the urban South-East Queensland
motor vehicle fleet covering the full size range of particles emitted.
4.1 Develop an inventory of tailpipe particle emissions emitted from
the urban South-East Queensland fleet which quantifies the total
contribution to particulate matter pollution for different particle
size ranges and vehicle and road type combinations.
4.2 Validate the urban South-East Queensland inventory (4.1 above)
with other relevant models and inventories derived for the region.
4.3 Conduct scenario analysis modelling using the urban South-East
Queensland inventory data (4.1 above) to test the air quality
implications of likely future scenarios related to passenger and
freight vehicle travel demand in terms of particle emission levels;
and develop an estimate of fleet emissions in 2026.
16
5. Review and synthesize existing knowledge on ultrafine particles in ambient air, specifically related to emissions generated by motor vehicles.
5.1 Examine and synthesize current knowledge on ultrafine particles in
ambient air, with a specific focus on emissions that originate from
motor vehicles.
5.2 Review and analyse instrumental techniques used for ultrafine
particle measurement, and identify and examine any differences in
outcomes produced by this instrumentation.
5.3 Examine ultrafine particle emission levels and their characteristics
as a function of vehicle technology, fuel used, and after-treatment
devices applied, with a specific focus on secondary particle
formation in urban environments resulting from semi-volatile
precursors emitted by motor vehicles.
5.4 Review existing knowledge on the spatial and temporal variation in
ultrafine particle concentrations, long term monitoring and the
existence of any inventories available for particle number and
ultrafine particles for motor vehicle fleets.

17
5.5. Review current knowledge on ultrafine particle chemical
composition, and the relation between ultrafine particles
and gaseous pollutants.
5.6. Examine the extent of contributions of ultrafine particle
concentrations to different environments.
5.7. Assess the implications of existing knowledge related to the
characteristics of ultrafine particles and dynamics in the air, in
the context of human exposure and epidemiological studies, and
in relation to management and control of particles in vehicle-
affected environments.

18
1.4 ACCOUNT OF SCIENTIFIC PROGRESS LINKING THE SCIENTIFIC PAPERS
This thesis contains a collection of papers that have been published in refereed
journals. The focus and results presented in these papers are précised below.
Paper One:
Examination of modality within particle size distributions as a basis for
developing air quality regulation
The study reported in the first paper (presented in Chapter 4) focused on
examining the suitability of using modality within particle size distributions for
developing air quality regulations; and investigated whether PM1 and PM10 mass
standards may be a more effective combination of standards than PM2.5 and PM10
for controlling mechanical and combustion-generated particles, such as emitted
from motor vehicles.
It emphasized developing an understanding of the differences between locations
of the modes in different worldwide environments for different particle metrics,
and the relative contribution of particle mass to nucleation, accumulation and
coarse particle modes in urban South-East Queensland.

19
It aimed to produce a comprehensive review of the location of modes for different
particle metrics in a wide range of different environments around the world. A
second aim of the study was to examine whether a clear separation exists between
the modes at around 1 µm and determine whether a PM1 mass standard is relevant
for a range of different environments worldwide.
The study presented evidence that modal locations in particle size distributions
have the potential to be used as a basis for developing air quality regulations, and
provide useful information about contributions from different pollution sources
and particle mechanisms. It also presented evidence that a combination of PM1
and PM10 mass standards may provide a more suitable and discerning
combination of particle mass standards than the current mass standards of PM2.5
and PM10 for combustion and mechanically-generated sources, such as motor
vehicles.
The main conclusions of the study were:-
(i) PM10 measurements provided information mainly about the coarse
mode generated from mechanical processes (eg., particles emitted
from tyre wear or resuspended by motor vehicle traffic) but not about
motor vehicle tailpipe emissions.

20
(ii) PM2.5 measurement data can relate to a mix of nucleation and
accumulation mode particles (combustion-generated) and coarse
mode particles (mechanically-generated), making source
apportionment very complex and suggesting that PM2.5 is an
inadequate basis for standards.
(iii) PM1 measurement data related to nucleation and accumulation mode
particles and enabled a much clearer distinction to be made between
combustion and mechanically-generated aerosol contributions. This
finding provides evidence to support the view that PM1 and PM10
mass standards would be more desirable from the legislation point
of view than the current mass standards of PM2.5 and PM10.
(iv) The study suggested that more discussion is needed to consider the
best combination of particle mass and number concentration
standards for a major source of particulate matter pollution such as
motor vehicle fleets, for example, the introduction of particle
number standards for submicrometre and smaller particle size
ranges (eg., ultrafine particles).
These results make an important contribution to developing an understanding
of the value of examining modes within particle size distributions as a basis for
development of air quality regulations and for source apportionment.

21
Paper Two:
Derivation of a comprehensive set of particle emission factors for motor
vehicles.
The second paper (Chapter 5.1) describes the derivation of a comprehensive set
of particle emission factors for motor vehicle tailpipe emissions which can be
used in transport modelling and health impact assessments to quantify particle
emissions from different vehicle and road type combinations, covering the full
size range of particles emitted and including particle number and different particle
mass size fractions.
The specific objective of the study was to derive the most suitable particle
emission factors, based on statistical analysis of more than 600 particle emission
factors published in the international literature. In order to achieve this goal, five
statistical models were developed that estimated average emission factors for
particle number, particle volume, PM1, PM2.5 and PM10.
From the outputs of these five statistical models, the final set of particle emission
factors were selected which are recommended as the most suitable to use in
transport modelling and health impact assessments. These average particle
emission factors, and their 95% confidence intervals, relate to different vehicle
and road type combinations for particle number, particle volume, PM1, PM2.5 and
PM10 for light duty vehicles, heavy duty vehicles and buses. The outputs of these
statistical models are presented in Chapter 5.2.
22
The main study activities included:-
(i) Conducting an extensive review of all published particle emission
factors for different motor vehicle types in the international
literature.
(ii) Identifying suitable model variables to use in developing
statistical models to predict average emission factor values for
different particle metrics.
(iii) Developing statistical models for different particle metrics to produce
average particle emission factors.
(iv) Identifying the most suitable emission factors to use in transport
modelling and health impact assessments, based on examination of the
statistical characteristics of average particle emission factors produced
by the statistical models.

23
Information concerning which motor vehicle particle emission factors are suitable
to use in transport modelling and health impact assessments is currently patchy
and ill-defined. The results of this study advance scientific knowledge of the most
suitable emission factors to use to develop comprehensive, size-resolved
inventories of tailpipe particle emissions from motor vehicle fleets for both
particle mass and particle number, covering the full size range of particles
emitted.
Most importantly, the emission factors derived in this study have application for
urban regions in developed countries, and have particular application for regions
which lack measurement data, or funding to undertake measurements, or where
experimental data is of insufficient scope.
The study also identified gaps in our knowledge and found that very limited data
exists relating to emission factors for particle volume, particle surface area, PM1,
brake and tyre wear, road grade, engine power, on-road bus measurements, and
vehicles travelling at speeds < 50 km/hr. Information and methods that can be
used to discriminate resuspended road dust from tailpipe emissions, particularly
for PM2.5 and PM10 road emission studies, were also found to be limited.

24
Paper Three:
Development of a particle number and particle mass emissions inventory for
the urban fleet in South-East Queensland.
The third paper (presented in Chapter 6) presents the first published
comprehensive inventory for a motor vehicle fleet of particle emissions generated,
covering the full size range of particles emitted, and includes quantification of
emissions in terms of particle number and different particle mass size fractions.
The specific objectives of the study were to:-
(i) Develop a motor vehicle particle emissions inventory for urban South-
East Queensland that included quantification of particle number, PM1,
PM2.5 and PM10 emissions for light and heavy duty vehicles and buses.
(ii) Model the particle emission implications of different proportions of
passengers travelling in light duty vehicles and buses, and to derive an
estimate of vehicle fleet particle emissions in the year 2026.
In order to achieve the goals of this study, particle emission factors for
different vehicle and road type combinations were combined with transport
modelling data to quantify emissions relating to model links in the study
region classed as urban and urban-major roads. Different scenarios were
modelled which involved shifting proportions of light duty vehicle passengers
to new buses added to the network to assess the impact on particle emission
levels.
25
An estimate of fleet emissions in 2026 was modelled which considered the
anticipated freight task in 2026, likely increases in vehicle kilometres travelled by
different vehicle types, possible improvements in vehicle technologies (leading to
reductions in particle mass and particle number emissions), likely changes in
transport mode choice and fleet composition, and the introduction of new, lower
emitting vehicle types.
The results reported in the paper were based on government prototype data from
the Brisbane Strategic Transport Model for 2004 and used vehicle kilometres
travelled data, and excluded consideration of specific origin and destination trip
data.
The study results advance scientific knowledge by presenting the first
comprehensive inventory of motor vehicle particle emissions that has been
published, and which includes particle number. The research work also
demonstrated how small changes in transport mode and passenger occupancy
rates can lead to reductions in particle emission levels, and provided an estimate
of expected emissions in the region in 2026.

26
Paper Four:
A review and synthesis of existing knowledge on ultrafine particles in
ambient air, with a specific focus on particles generated by motor vehicles.
The fourth paper (shown in Chapter 7) presents a synthesis of existing
knowledge on ultrafine particles in air, focusing on particles originating from
motor vehicles.
The main study activities were to:-
(i) Review current knowledge on ultrafine particles as they relate to motor
vehicles, including the extent of their contribution to urban
environments; and analyse instrumentation techniques used to measure
ultrafine particles to examine any differences in outcomes.
(ii) Examine ultrafine particle emission levels and their characteristics in
terms of different vehicle technologies, fuels, and after-treatment
devices used, with a focus on secondary particle formation in urban
environments.
27
(iii) Review knowledge on the characterization of the temporal and spatial
variation in concentration of ultrafine particles and long term
monitoring; examine existing knowledge on particle chemical
composition, and the relationship between ultrafine particles and
gaseous pollutants.
(iv) Examine any differences in concentrations of ultrafine particles in a
range of different environments, and investigate whether any
inventories are available for particle number and ultrafine particles for
motor vehicle fleets.
(v) Review existing knowledge on the characteristics of ultrafine particles,
particle mechanisms and dynamics in the air affecting these
concentrations, and their relationship in terms of human exposure
assessment and epidemiological studies, and the control and
management of particles in environments affected by vehicle
emissions.
The study found that motor vehicles in populated urban areas are a significant
source of air pollution and of ultrafine particles, and that ultrafine particles are a
likely target for future air quality regulation in terms of particle number in urban
areas.

28
It found that no standardized methods exist for measuring particle number, and
that discrepancies exist between the outcomes of different instrumentation used to
measure particle number. These discrepancies need to be borne in mind when
examining the quantification of particle number in different studies. The lack of a
standard approach for measuring particle number has particular significance for
epidemiological studies and human exposure assessment.
The review found that ultrafine particle concentrations can differ between clean
and vehicle-influenced environments by as much as over two orders of
magnitude, which has implications for exposure assessment. Large uncertainties
were found in relation to vehicle emission factors for particle number and other
particle size ranges, and no emission inventories were found for ultrafine particles
or particle number for motor vehicle fleets. In addition, it was found that limited
data is available on long term monitoring of ultrafine particle concentrations in
urban environments and related to ultrafine particle composition and chemistry,
which can be influenced by many vehicle-related factors and post-formation
processes. Hence, a better knowledge of ultrafine particle chemistry in different
environments is needed.
The paper also discusses the need to include consideration of secondary particle
formation in vehicle exhaust plumes and particle formation by nucleation, and
their possible relevance if particle number regulation is proposed, as well as
consideration of location-specific meteorological factors which can influence
these formations.

29
1.5. THE IMPORTANT AND NOVEL CONTRIBUTION OF THIS
PHD RESEARCH
This PhD study contributes new knowledge and understanding to the field in
four different knowledge domains:-
(i) Firstly, a new method has been developed for deriving comprehensive
inventories of motor vehicle particle emissions. This used a novel
approach that involved combining knowledge from two distinctly
different disciplines – from aerosol science and transport modelling.
(ii) Secondly, the work developed new concepts for identifying suitable
particle emission factors to use in developing inventories for different
particle sizes and particle metrics related to different vehicle and road
type combinations, that included rigorous statistical analysis of a very
large set of measurement data sourced from the international published
literature.
(iii) Thirdly, a new approach was developed for examining modality within
particle size distributions, which provided valuable information on
particle mechanisms and contributions from different environmental
sources to different mass size fractions. This approach also identified
that a new particle mass standard, PM1, would be suitable for the
majority of worldwide environments, and found that a combination of
PM1 and PM10 standards have the potential to provide a more
discerning set of ambient particle mass emission standards than the

30
present standards of PM2.5 and PM10 for discriminating between
combustion and mechanically-generated particles, such as emitted
from motor vehicles.
(iv) Fourthly, this work is the first inventory of motor vehicle particle
emissions that has been published, and which includes quantification
of particle number emissions. The work also developed new
approaches for modelling future scenarios of travel demand and their
particle emission implications.
(v) Fifthly, the work made an important contribution by presenting a
review and synthesis of existing knowledge on ultrafine particles in
ambient air as they relate to vehicle emissions, and found that motor
vehicles make a significant contribution to both air pollution and
ultrafine particles in populated urban areas. The work identified
discrepancies between the outcomes of instrumentation that measure
ultrafine particle concentrations; and the absence of a standard process
for measuring particle number; as well as gaps in our knowledge in
relation to vehicle emission factors for different particle size ranges
and for particle number. Few studies were found related to the
composition and chemistry of ultrafine particles and long term
monitoring of ultrafine particles; and no inventories were found for
particle number of ultrafine particles for motor vehicle fleets in the
published literature. The work identified key areas which require

31
further research to enable control of ultrafine particles in populated
urban areas and formulation of appropriate air quality regulation.
This PhD research has produced a complementary toolkit of data, knowledge and
methods which can be used to quantify, monitor and control vehicle fleet particle
emissions, and has identified important, future areas of research needed for the
control of ultrafine particles in populated urban areas, and for development of
possible future particle number regulation. These include methods for source
apportionment, developing air quality regulation and for quantifying fleet particle
emissions. The work presents the first inventory of particle emissions for a fleet
that has been published, and a method and comprehensive set of particle emission
factors which can be used to quantify urban fleet emissions in the developed
world. Vehicle emissions were found to be the most common and significant
source of air pollution in populated urban areas, and a significant source of
ultrafine particles, emphasizing the importance of considering ultrafine particles
as a target for future air quality regulation in relation to particle number in
populated urban areas.

32
1.6. REFERENCES
AQEG., 2005. Particulate Matter in the UK. London, Department for
Environment, Food and Rural Affairs.
DieselNet Emissions Standards, Switzerland. www.dieselnet.com/standards/ch/.
Date verified 20 February 2008.
ECJRC., European Commission Joint Research Centre) 2002. Guidelines for
concentration and exposure-response measurement of fine and ultrafine
particulate matter for use in epidemiological studies. EUR 20238 EN 2002.
Editors D Schwela, L. Morawska, D. Kotzias, European Commission, Italy.
European Commission. http://ec.europa.eu/index_en.htm. Date verified 28 July
2008.
Hinds, W.C., 1999. Aerosol Technology, 2nd edn., Wiley, New York,
IPCC., (Intergovernmental Panel on Climate Change) 2001. Climate Change
2001: The Scientific Basis, Contribution of Working Group I to the Third
Assessment Report of the Intergovernmental Panel on Climate Change
Cambridge. United Kingdom and New York, Cambridge University Press.
Jamriska, M., Morawska, L., Thomas, S., Congrong, H., 2004. Diesel Bus
Emissions Measured in a Tunnel Study. Environmental Science & Technology
38(24), 6701-6709.
John, W., 1993. The characteristics of environmental and laboratory generated-
aerosols, in: Willeke and Baron (Eds.), Aerosol measurement: Principles,
techniques and applications,Van Nostrand Reinhold, New York, 55.
Jones, A.M., Harrison, R.M., 2006. Estimation of the emission factors of particle
number and mass fractions from traffic at a site where mean vehicle speeds vary
over short distances. Atmospheric Environment 40(37), 7125-7137.

33
Lundgren, D.A., Burton, R.M., 1995. Effect of particle size distribution on the
cut point between fine and coarse ambient mass fractions, Inhalation Toxicology
7 (1), 131-148.
Morawska, L., 2003. Chapter 3: Motor Vehicle Emissions as a Source of Indoor
Particles in, Morawska-Salthammer (eds). Indoor Environment, Wiley-VCH, 297-
318.
Morawska, L., Keogh, D.U., Thomas, S.B., Mengersen, K., 2008. Modality in
ambient particle size distributions and its potential as a basis for developing air
quality regulation. Atmospheric Environment 42(7), 1617-1628.
Morawska, L., Moore, M.R., Ristovski, Z.D., 2004. Health Impacts of Ultrafine
Particles - Desktop Literature Review and Analysis. Department of the
Environment and Heritage, September, Canberra.
Parrish, D.D., 2006. Critical evaluation of US on-road vehicle emission
inventories. Atmospheric Environment 40(13), 2288-2300.
Pope, C.A., Dockery, D.W., 2006. Health Effects of Fine Particulate Air
Pollution: Lines that Connect. Journal of the Air & Waste Management
Association 56(6), 709-732.
Ramanathan, V., Crutzen, P.J., Kiehl, J.T., Rosenfeld, D., 2001. Aerosols,
Climate, and the Hydrological Cycle. Science's Compass 294, 2119-2124.
Ruzer, L.S., Harley, N.H. 2004, Aerosols Handbook: Management, Dosimetry
and Health Effects, CRC Press, Florida, USA.
Seinfeld, J.H., Pandis, S.N. 1998. Atmospheric Chemistry & Physics, Wiley-
Interscience, New York.

34
Swiss Clean Air Act 2000, LRV 00, Appl. 1, 83, Schweizerische
Luftreinhalteverordnung, 16 December, 1985, amended 28 March 2000.
WHO (2005). "Guidelines for Air Quality." World Health Organization, Geneva.

35
CHAPTER 2. LITERATURE REVIEW
2.1. INTRODUCTION
This chapter summarises a review of the literature on particles emitted from motor
vehicle tailpipes and the inventories that have been developed to quantify these
emissions in urban areas.
The most relevant topics related to the research work were reviewed in depth and
focused on the current state of knowledge of:-
(i) the characteristics and nature of particulate matter, and modality
within particle size distributions;
(ii) particulate matter emitted from motor vehicle tailpipes;
(iii) methods for developing motor vehicle emission inventories;
(iv) current local and international motor vehicle inventories;
(v) present ambient air quality standards used for control of particle
emissions.
Review of literature on the health effects of particulate matter exposure and
transport models was more general.

36
The characteristics of motor vehicle particle emissions, including modality within
particle size distributions, the health effects of exposure and current air quality
standards are introduced in Chapter 2.2. Vehicle emission inventories and local
models are discussed in Chapter 2.3. Transport models are generally discussed in
Chapter 2.4. An estimate of motor vehicle fleet particle emissions prepared for the
UK is reviewed in Chapter 2.5. Chapter 2.6 discusses the difficulties associated
with identifying suitable particle emission factors to use in developing motor
vehicle particle emission inventories. Chapter 2.7 provides a summary, and the
final chapter, Chapter 2.8, discusses current knowledge gaps and conclusions
from the review.
2.2. CHARACTERISTICS OF MOTOR VEHICLE PARTICLE
EMISSIONS
Motor vehicle tailpipe emissions comprise pollutants in particle and gaseous
forms which are made up of many compounds that are complex in terms of their
chemical composition. Many of these compounds have been found to affect
human health (Morawska 2003b). These emissions have an impact on a range of
scales, from micro to macro environments, ranging from areas in close proximity
to roads, to regional airsheds. They can also be a major source of pollution in
busways, tunnels and in public transport interchanges.
Globally, their effect on earth’s climate and upper atmospheres, including the
troposphere and stratosphere, has neither been quantified, nor is it well
understood.

37
While motor vehicles are also major emitters of gaseous pollution; the current
focus of scientific air quality debate is centred on particulate matter, in particular
on ultrafine particles (particles with diameters < 0.1 µm measured in terms of
number concentration) (ECJRC 2002). The hazard level associated with inhaled
particles is dependent upon the chemical composition of particles and where they
deposit within the respiratory system (Hinds 1982). The aerodynamic size of
particles determines where in the airways they are likely to deposit (Ferin et al.
1990). For these reasons it is vital that quantification of particulate matter
pollution be derived in terms of different particle size ranges.
This literature review is restricted to discussion on motor vehicle tailpipe particle
emissions, because very little information is available in the international
literature on particles produced from brake and tyre wear, nor on methods that
enable discrimination of road dust particles from particles emitted by motor
vehicle tailpipes. Measurement data of ambient particle size distributions in terms
of particle surface area are also rare.
2.2.1. The nature of particle emissions
Most anthropogenic pollution sources are combustion-related and generate
particles with diameters < 1 µm (Jamriska and Morawska 2003). Combustion
source particles, such as those emitted by motor vehicles, are found mainly in the
ultrafine size range (diameters < 0.1 µm) (Morawska 2003). Inhalation and
deposition of particles deep in the alveoli of a human lung can be very detrimental
to human health (Seaton et al. 1995), and cause serious health effects.

38
Particle diameter expresses a particle’s settling velocity, which can be used to
predict where in the respiratory tract a particle may deposit (Morawska et al.
2004). Diffusional deposition is the most important mechanism for deposition in
the lung of the smallest particles (ultrafine size).
Particles can be measured by a number of particle metrics, including particle
mass, number count, volume and surface area. Particles larger than 10 µm tend to
have atmospheric lifetimes that are relatively short (Harrison et al. 2000) and are
of lesser significance from the health point of view since they are mostly removed
by the upper respiratory tract.
Depending on the instrumentation used and their ranges of measurement, particles
in the larger size range that have diameters of 1-10 µm are generally measured in
terms of particle mass and classified by their aerodynamic diameter. Whereas,
particles with diameters < 1 µm are generally measured in terms of particle count
(also termed particle number) and classified according to their equivalent
diameter (electrical mobility diameter, diffusion diameter etc). Ultrafine
particles are very small and numerous in terms of relative number, they have
little weight (mass) and therefore particle number is the most relevant particle
metric to use to measure these sized particles.
39
2.2.2. Motor vehicle particle emissions
Particle size distributions can be presented in terms of particle mass or particle
number distributions, and in terms of particle number size distribution the
majority of airborne particles are ultrafine size (Morawska and Salthammer
2003). In urban environments, where the major source of pollution is motor
vehicle emissions, more than 80% of particle emissions in terms of particle
number are ultrafine size (Morawska et al. 1998a).
Many studies have shown conclusively that the major source of ultrafine particle
pollution in urban environments is from motor vehicle emissions (Harrison et al.
1999; Shi and Harrison 1999; Shi et al. 1999; Shi et al. 2001; Wahlin et al. 2001).
In environments affected by motor vehicle emissions, ultrafine particles can
account for levels of up to an order of magnitude higher than those in natural
environments, and knowledge about the chemical composition of these particles is
very limited as few studies have investigated these concentrations in ambient air
in different environments (Morawska et al. 2008b).
The diameter of particles emitted from motor vehicles can range from around
0.003 to 10 µm; where 0.003 µm is the lowest size range currently able to be
measured. Most motor vehicle particle emissions are in the ultrafine size range.
By comparison, the diameter of a human hair can range from 50-100 µm (Willeke
and Baron 1993). Particles emitted from diesel engines tend to be in the size range
0.02-0.130 µm (Kittelson 1998; Morawska et al. 1998b; Harris and Maricq 2001;
Ristovski et al. 2006) and those emitted from petrol engines in the 0.02-0.06 µm
size range (Harris and Maricq 2001; Ristovski et al. 2006). At the time of this
40
study the literature review revealed that the majority of heavy duty vehicles
(HDVs) were diesel-fuelled and light duty vehicles (LDVs) petrol-fuelled.
As motor vehicle particle emissions span such a wide size range, in order for
inventories to be comprehensive they need to quantify both particle number and
particle mass emissions for different size fractions. As ultrafine particles emitted
from motor vehicles are a significant source of anthropogenic pollution in urban
areas, it is extremely important that they be included in inventories and be
controlled by air quality standards.
2.2.3. Diesel particle emissions
Diesel particulate matter is made up of many small particles that have very little
mass, and the relatively few particles of a larger size account for most of its total
particle mass. Its chemical and physical properties, how they form in the cylinder
of an engine and their effect on human health are not fully understood and diesel
emission regulations exist worldwide to regulate diesel particles (Morawska et al.
2004). In the US, diesel exhaust has been declared a probable human carcinogen
(Zhu 2003); and in Switzerland diesel exhaust is classified as a carcinogen
(www.dieselnet.com/standards/ch). Diesel particle emissions are an important
emission source that requires dedicated effort in terms of its control and
management.
Diesel vehicles release over an order of magnitude more particles, in terms of
particle number, than petrol-fuelled vehicles (Morawska et al. 2004) and a
significant number of these particles are in the ultrafine size range (Morawska et

41
al. 1998b; Ristovski and Morawska 1998). It was found that particle emissions
from light and heavy duty vehicles measured in a tunnel by Kirchstetter et al.
(1999) revealed that heavy duty diesel trucks emitted considerably more particle
number, fine particles, black carbon and sulphate mass per unit of fuel mass
burned as compared to light duty vehicles, in the order of 15-20, 24, 37 and 21
times more respectively. One study found that when petrol vehicles are driven
with high loads (ie., during acceleration) or at very fast speeds (eg., at around 120
km/hr), their particle number emissions can be similar to those emitted by diesel
vehicles (Graskow et al. 1998).
2.2.4. Health effects associated with exposure to particles
A number of epidemiological studies have linked particle exposure with
increases in hospital admissions, mortality, and various cardiovascular and
respiratory diseases (Pope and Dockery 2006). An association has also been
found with effects such as lung cancer (Pope et al. 2002) and heart attacks
(Brook et al. 2000). Research has shown that particles can penetrate the cell
membranes, enter the bloodstream, and even reach the brain (Oberdoerster et
al. 2004); and there are some indications that they can induce inheritable
mutations (Somers et al. 2004).
When considering exposure in terms of dose-response, it has been suggested that
ultrafine number concentration and surface area may be more appropriate metrics
than particulate mass (Young and Keeler 2004). Ultrafine studies have shown
that particle number and surface area, not particle mass, are the most suitable
particle characteristics to evaluate the potential biological effect of ultrafine

42
particles (Morawska et al. 2004). Studies have also suggested that particles
measured in terms of their number concentration may be more suitable than
particles measured in terms of mass concentrations to assess health effects, which
has raised concerns that large particle number concentrations near freeways may
be adversely affecting the health of people situated in close proximity (Zhang and
Wexler 2004). However, it remains unclear whether particle mass, number,
surface area concentration, chemical composition or a combination of these
properties pose the greatest health risk (Zhang 2004).
Present scientific debate is focused on the notion that particle number is more
directly related to health effects than particle mass. Based on exposure-health
response relationships derived in epidemiological studies of exposure to airborne
particles measured in terms of mass concentrations, the World Health
Organization (WHO) has set new particulate matter guidelines with annual mean
values for PM2.5 and PM10 of 10 and 20 µg m-3 respectively (WHO 2005). PM2.5
and PM10 fractions are mass concentration of particles with aerodynamic
diameters smaller than 2.5µm and 10µm respectively. These guidelines were
based on an American Cancer Society study (Pope et al. 2002) and represent the
lowest end of the range across which have been observed significant effects on
survival (WHO 2005). At present the available body of epidemiological evidence
is not sufficient to enable a conclusion to be reached on the exposure-response
relationship of ultrafine particles, hence WHO has stated that “therefore no
recommendations can be provided as to guideline concentrations of ultrafine
particles at this point in time” (WHO 2005).
43
2.2.5. Current air quality standards to control particulate matter
Current national air quality standards in countries across the world are based on
particle mass concentration, not particle count, volume or surface area, and are
restricted to PM2.5 and PM10 fractions. These standards were based, in part, on a
scientific basis and also, in part, on the data and size range limitations of
measuring equipment used at the time the standards were set (Morawska et al.
2008a).
Prior to setting the PM2.5 standard, the USEPA conducted an extensive
examination of the available data on particle size distributions. A decision was
made to introduce 2.5 µm as the upper boundary range for fine particles and as a
basis for a standard; and this decision was strongly influenced by the fact that
epidemiological data available at that time were obtained using PM2.5
measurements (Dockery et al. 1993).
The concentration values of mass-based particle standards can exhibit bias toward
larger particles, which is a major limitation, and the presence of a few larger
particles can mask concentrations of the finer particles that contribute very little to
mass (Morawska et al. 1999).
Very little information can be obtained about particle number from particle mass
measurements (ECJRC 2002), hence it is important to measure ultrafine particles
in terms of particle number, and momentum has been gaining in both scientific
and regulatory circles in this respect. For example, in terms of particle emission

44
rates, the Swiss Agency for the Environment, Forests and Landscape has
proposed the introduction of a particle number standard for diesel passenger
vehicles for solid particles in the 0.02-0.30 µm size range (AQEG 2005); and the
European Commission is adding a particle number limit and new measurement
procedure to its EURO V/VI emissions standards for light duty diesel vehicles
and to its EURO VI emissions standard for heavy duty diesel vehicles relating to
solid particles, based on the recommendation of the UNECE-GRPE Particulate
Measurement Program (European Union 2007; Commission of the European
Communities 2007a,b; Morawska et al. 2008b).
This Particulate Measurement Programme was formed in 2001 and focuses on
providing recommendations for new or additional particle measurement systems to
be used for EU type approval, testing and development approval, testing and
development of future emission standards for both light- and heavy-duty vehicles
(http://www.dieselnet.com/news/2002/10ricardo.php). Its objectives include
identifying the best metrics for future particle measurements; to determine the
methods and instruments utilizing those metrics; and to investigate a test procedure
for measuring particles during type approval tests and recommend a suitable test
system or systems (http://www.dieselnet.com/news/2002/10ricardo.php;
http://www.empa.ch/plugin/template/empa/*/20988/---/I=1).
In Australia air quality standards for a variety of pollutants are set at a
national level through National Environmental Protection Measures (NEPM)
and at State and Territory levels through Environmental Protection Authorities,
and in 1998 the National Environment Protection Council (NEPC), a statutory

45
body, developed Australia's first national ambient air quality standards as part of the
NEPM for Ambient Air Quality (the 'Air NEPM')
(http://www.environment.gov.au/atmosphere/airquality/standards.html).
The Australian Air NEPM sets national standards for six key air pollutants -
carbon monoxide, ozone, sulfur dioxide, nitrogen dioxide, lead and particles
(PM10), and formal reporting against these standards commenced in 2002;
and for PM2.5 a NEPM advisory reporting standard and goal has been set to
collect national data to enable a review of the standard
(http://www.environment.gov.au/atmosphere/airquality/standards.html).
To inform development of the Australian Diesel NEPM, the NEPC has
commissioned preparatory projects, which include the testing of particulate matter
and toxic emissions generated by a range of different diesel-fuelled vehicles
(www.ephc.gov.au/taxonomy/term/70; DOEH 2003; NEPC 2000).
2.2.6. Modality within particle size distributions
A mode may be defined as a peak in the lognormal function of the number or
mass distribution of an atmospheric aerosol (John 1993). Its location can depend
on the particle metric being examined, for example particle number, volume,
mass or surface area, and can change depending on the mathematical
transformation method used (Morawska et al. 2008a).
Three classifications commonly used to categorise modal diameters in
atmospheric aerosol size distributions are based on particle size and production
mechanisms. These are the nucleation mode (< 0.1 µm), accumulation mode

46
(0.1-1 µm) and coarse particle mode (> 1 µm) (Jaenicke 1993). It has also been
shown that a clear separation usually exists between the accumulation and coarse
modes around 1 µm or somewhat above, where the mass of particles belonging to
these two modes is at a minimum (Lundgren and Burton 1995). However, the
delineation of these modal diameters, as discussed above, can vary. For example,
in Whitby’s model of particle volume size distribution (1978), which was based
primarily on atmospheric aerosol number distributions in the size range
0.01-6 µm, when these were transformed to volume distributions, showed modal
size ranges for the nuclei mode (< 0.1 µm), accumulation mode (0.1-2 µm) and
coarse particle mode (> 2 µm) (Baron and Willeke 2001). More recent studies
using instruments measuring down to the smaller size limit of 0.003 µm, have
shown that the nuclei mode needs to be separated into a nucleation mode (< 0.01
µm) and an Aitken nuclei mode (0.01-0.1 µm) (USEPA 2004).
No studies are currently available which have comprehensively investigated the
location of modes in a wide range of different environments and for different
particle metrics in terms of the global picture. The most comprehensive study to
date which has examined the location of modes in a broad range of different
environments is limited to an examination by Morawska et al. (1999b), who
identified modes in particle volume and particle number size distributions in six
different environmental aerosols in South-East Queensland. Other studies to date
have examined modal location values for a smaller number of environmental
aerosols.

47
Gaining knowledge and understanding about the presence and location of modes
in particle size distributions is critical to our understanding about the mechanisms
of atmospheric processes and, most importantly, for assessing risk and exposure,
as modes in particle size distributions have the potential to be used for developing
air quality guidelines and standards (Morawska et al. 2008a).
2.3. VEHICLE EMISSION INVENTORIES AND LOCAL MODELS
This section discusses methods used to develop emission inventories; including
global inventories and models; and local inventories and models developed for
South-East Queensland.
2.3.1. Developing emission inventories
Emission inventories provide information that is critical to guide development of
control strategies, risk assessments, air quality forecasting and transport and
economic incentive programs (Mobley and Cadle 2004). They have supported
major regulatory programs and withstood legal challenges; conversely, their
effectiveness can be limited by cost factors, timeliness, comprehensiveness, data
quality and representativeness (Mobley and Cadle 2004).
Inventory data can inform health impact assessments, aid identification of hot-
spots, be used to model the effects of future land use and transport planning, and
provide guidelines as to the direction needed for future research and development
activities. They can also inform our understanding of air quality and climate
change issues on global, regional and local scales (Parrish 2006).

48
There are many approaches available for estimating motor vehicle inventories.
These can range from estimations developed using a combination of performance-
related emission factors and road traffic data, to estimations based on total fuel
consumption data and fuel properties (Goodwin et al. 1999) or remotely sensed
data (Shifter et al. 2005). The choice of approach is very often dependent upon
available data, and the scale of the inventory required for decision-making (eg.,
road link-based, local, regional, state, country-specific).
Collecting data for inventories can require the use of very expensive
instrumentation, and therefore some countries with limited access to funding to
conduct measurement campaigns may use indirect methods for estimating motor
vehicle emissions, such as basing estimates on total fuel consumption data of a
vehicle fleet. An example is the Rapid Assessment Method, which was developed
based on a study of six cities in developing countries, that links health damages
and other environmental costs to a particular fuel use or pollution source, for cost
benefit analyses of pollution abatement measures (Lvovsky et al. 2000).
In Mexico, for example, limited data exists that is suitable to use in estimating on-
road emissions from petrol-powered vehicles, hence fuel sales have been used to
estimate vehicle activities and remotely sensed data to estimate exhaust emission
factors (Shifter et al. 2005). On the other hand, in the US micro scale emissions
data for quantifying high emission hotspots along roads have been collected using
real-time measurements of on-road vehicle emissions, and this empirical data can
be used to develop emission inventories (Unal et al. 2004).

49
Techniques for estimating emission rates and typical emission patterns can range
from simply deducing these based on measurement of roadside particle
concentration and vehicle mix (Shi et al. 1999; Querol et al. 2002) to considering
the effects of wind direction and speed (Giechaskiel et al. 2005); basing estimates
on road tunnel measurements which may have reduced wind condition effects
(Sturm et al. 2003; Jamriska et al. 2004) and single vehicle chasing experiments
(Kittelson et al. 2000; Kittelson et al. 2002; Vogt et al. 2003; Pirjola et al. 2004).
Developing accurate emission inventories for mobile sources, such as motor
vehicles, require cost-effective methods for determining activity indicators and
emission factors for a representative sample of vehicles using a broad range of
fuels, under different driving conditions and in ambient conditions that have high
spatial and temporal resolution (Mobley and Cadle 2004).
Examples of models used to estimate on-road vehicle emission inventories
include those used in the US, such as MOBILE (USEPA 1993), EMFAC (CARB
2002) in California; and COPERT used in Europe (Ahlvik et al. 1997;
Ntziachristos et al. 2000; Bellasio et al. 2007), as well as a more recent model
VERSIT+ LD (Smit et al. 2007), to name just a few. There are numerous models
and inventories of motor vehicle emissions around the world but these are mainly
restricted to inventories for PM2.5 and PM10.
Many international studies in urban environments that have estimated emission
inventories and the contribution of motor vehicles to total levels of ambient
particle concentrations have related to Total Suspended Particles or PM10 and, to a

50
lesser degree, to PM2.5. To date very little data and insufficient measurements are
available to use in compiling inventories of vehicle emissions to quantify particle
number emissions or additional ranges of sizes in terms of particle mass
(Morawska et al. 2004). No detailed emission inventories currently exist for
particle number concentration (Jones and Harrison 2006); nor are there any
comprehensive inventories available anywhere in the world of motor vehicle
particle emissions that cover the full size range of particles emitted and which
include both particle mass and particle number.
The general approach taken to quantify emissions is based on the concept of
combining a numerical value for an Emission Factor with a numerical factor for
an Activity, ie., Emissions = Emission Factor * Activity
(http://www.naei.org.uk/index.php). For example, to quantify the total number of
particles emitted from one passenger car travelling on a road link, an Emission
Factor (representing the number of particles emitted by a single passenger car
when it drives one kilometre) is multiplied by the Activity (the number of
kilometres the single passenger car travelled on the road link).
However, developing road-link based inventories of motor vehicle emissions can
be extremely complex, involve consideration of a multiplicity of factors and
require a very large amount of data. These complexities include identification of
suitable emission factors for different vehicle and road type combinations, and
assigning traffic data to different road type links in transport network models.
Selection of suitable emission factors to use in transport modelling require
consideration of numerous factors including, but not limited to, vehicle-related

51
factors such as vehicle type, age, fuel type, engine size, engine power, load,
driving mode (idling, accelerating, decelerating, cruising), speed; road type
(urban, highway, rural, motorway, freeway), speed limit on the road and average
vehicle speed (http://www.naei.org.uk/index.php). Average vehicle speed can
often be reduced by congested traffic conditions.
The complexity involved in developing inventories further intensifies when the
inventory is being developed for a number of different particle metrics and
particle size ranges, and a vital component of developing vehicle fleets
inventories is the derivation of suitable emission factors.
2.3.2. Local inventories and models for South-East Queensland and
Queensland
Local model estimates for motor vehicle emissions for South-East Queensland for
total annual PM10 have been prepared by the Queensland Environmental
Protection Agency (QEPA) (EPA 2004) and for urban South-East Queensland by
Apelbaum Consulting (Apelbaum 2006) and the Bureau of Transport and
Regional Economics (BTRE 2003).
The QEPA’s most recent inventory of total annual PM10 was modelled for the
year 2000 and was 2249 tonne for the South-East Queensland region (EPA 2004)
(Table 2.1). They developed a fleet emissions model using estimates of vehicle

52
kilometres travelled (VKT), emission factors and operating conditions; and
estimated emissions for six vehicle classes, four fuel types, operating conditions
(including average travel speed, road grade, engine hot and cold starts), time of
day, day of the week and the summer/winter season (EPA 2004). In this study,
QEPA’s future projection for SEQ for PM10 for 2005 was, in a low population
scenario, 2188 tonne per annum and, in a high population scenario, 2259 tonne
per annum (EPA 2004).
The Apelbaum inventory used speed dependent emission factors for different road
types based on a combination of Australian and European data and estimated
1549 tonne per annum of PM10 for urban South-East Queensland in the period
2003-2004, shown in Table 2.1 (Apelbaum 2006).
The Bureau of Regional and Transport Economics (BTRE) carried out a study of
metropolitan and non-metropolitan areas in Australia and modelled trends in
future levels of noxious pollutant emissions from motor vehicles, including for
particulate matter emissions (BTRE 2003). They considered growth in the
economy, population, travel demand and urban congestion, as well as future
vehicle design and fuel standards, deterioration of vehicle performance due to
vehicle age and rises in fuel consumption. Their estimate of annual PM10 for
2004 emitted from the urban South-East Queensland fleet was 1840 tonne (BTRE
2003), listed in Table 2.1.

53
The BTRE study reported that the uncertainty in their particulate matter estimates
were high, and the part of their analysis with the greatest levels of uncertainty
(BTRE 2003). Although the BTRE model provided some estimates for particle
sizes smaller than PM10, these are not considered to be relevant due to the large
uncertainties they have reported in their particulate matter estimates. They also
reported that their modelled results for total metropolitan particulate matter
emissions lacked data on the details of average fleet particulate matter production,
including for petrol vehicles (BTRE 2003). Therefore, for the purpose of
comparison, only estimates for PM10 are considered relevant.
Table 2.1 Estimates of total annual PM10 for South-East Queensland
(SEQ) and urban South-East Queensland related to 2004 a
Modellers Region modelled Year of
inventory Estimate of total PM10 emissions, Tonne per
annum Queensland Environmental Protection Agency (EPA 2004)
South-East Queensland
2000
2249
Bureau of Transport and Regional Economics (BTRE 2003)
Urban SEQ a 2004 1840
Apelbaum Consulting (Apelbaum 2006)
Urban SEQ a 2003-2004 1549
a Urban South-East Queensland covers around 26% of the South-East
Queensland region, but its fleet accounted for more than 70% of private
passenger trips in SEQ in 2004 (SEQHTS 2004).

54
Australia’s National Pollutant Inventory (NPI) includes State and Territory
estimates for motor vehicle emissions. The NPI is an internet database available
free to Australians which provides information on pollution emitted to the air, land
and water. It reports data on the source and location of 93 toxic substances relating
to manufacturing sites, households and transport emissions to assess their potential
impact on health and the environment (http://www.npi.gov.au/index.html).
Estimates in the NPI for diffuse emissions, such as motor vehicles, are estimated
by State and Territory governments, and relate to the contribution of non-
industrial sources to Australia’s pollutant emissions. Diffuse emissions are not
estimated annually but every 3-5 years, and motor vehicles are considered the
most significant diffuse source nationally (http://www.npi.gov.au/index.html).
The latest NPI estimates for motor vehicle emissions for Queensland are for the
2006-2007 NPI reporting year, and estimated 13 pollutant substances, including
Benzene, 1,3-Butadiene, Carbon monoxide, Cyclohexane, Ethylbenzene,
n-Hexane, Oxides of Nitrogen, Styrene, Sulphur dioxide, Toluene, Total Volatile
Organic Compounds, Xylenes, and PM10 (DEWHA 2008a). The NPI’s estimate
for the Queensland motor vehicle fleet in 2006-2007 is 2200 tonne per annum
(DEWHA 2008b); and no earlier estimate for Queensland is available prior to this
projection for 2006.
55
2.4 TRANSPORT MODELS
Transportation planning is a critical component in the growth and evolution of
metropolitan areas (Murray et al. 1998). It needs to consider trip purpose, spatial
and temporal distributions of trips, as well as modal splits of travel and cost.
Traffic count data is often not available for significant sections of road networks
and in cases where traffic volume data is required, but unavailable, travel demand
models are used to estimate this data (Zhong and Hanson 2008). Travel demand
model data can provide greater detail for transport planning on the spatial
distribution of vehicle activity, different road types and speeds travelled on these
roads, to enable more accurate estimates to be made of emission rates at the local
scale (Cook et al. 2006).
The most common approach to travel demand modelling is the 4-step demand
model, which incorporates trip generation, distribution, modal split and
assignment (Ortuzar and Willumsen 2001). Transport models require very large
amounts of data and apply a number of assumptions in order to assign traffic data
to road links in a road network. A recent literature review found very limited
quantitative data was available on uncertainties in transport model systems as a
whole (Nielsen and Knudsen 2006).
In developed countries transport modellers often have access to large databases,
such as land use and transport network data, but in developing countries these are
often rare (Walker et al. 2008). One recent example is a study by Walker et al.
(2008) who used data from a 1,000 household travel and activity survey for

56
Chengdu in China (which has an urban population of around 3 million) to develop
travel mode choice models for policy analysis and planning.
As more detailed data, such as data available in geographic information systems
related to land use and population distributions becomes available, more detailed
analyses and modelling related to sustainability are possible, eg., developing
ecological and carbon footprints of the transport system.
2.5. ESTIMATE OF ROAD TRANSPORT EMISSIONS PREPARED FOR
THE UK
An extensive review of inventories developed for motor vehicles revealed only
one study which had attempted to estimate particle emissions emitted by a motor
vehicle fleet. This estimate was prepared for the UK for 1996, 1998 and 2001
(Group 1999; Goodwin et al. 2000; AQEG 2005). Their PM10 estimates were
derived by multiplying emission factors for different vehicle and road types by
annual VKT data. In order to derive estimates for PM0.1, PM1 and PM2.5, they
applied distribution profiles for these size ranges to PM10 estimate data, which
means that the emission factors for size ranges below PM10 were based simply on
mass fractions multiplied by PM10 estimate data values, and were not based on
individual measurements of different particle sizes. The method depended on
PM10 emission rates, which in themselves had substantial uncertainties, and
therefore their estimates for smaller sized particles contain even more uncertainty,
due to additional uncertainties in the size fractions (Group 1999).

57
Their estimates of motor vehicle particle emissions for 1996 and 1998 were
derived by applying the same distribution profiles for petrol and diesel exhaust,
viz., mass fractions of PM10 of 85% for PM1 and 90% for PM2.5 based on 33
different particle size distributions (Group 1999; Goodwin et al. 2000). The PM0.1
distribution profile was based on size fractions taken from a European inventory
(TNO 1997). Mass fractions of PM10 used in the 2001 estimate for PM0.1, PM1
and PM2.5 were derived from distribution profiles taken mostly from the USEPA
compilation of emission factors (USEPA 1995) known as AP-42 (AQEG 2005).
The UK emission factors were based on vehicle classes (or EUROs).
The estimate of motor vehicle fleet emissions for 2001 for the UK estimated that
PM10 tailpipe particle emissions emitted from motor vehicles were made up of
about 90% diesel vehicle emissions and 10% petrol vehicle emissions (AQEG
2005), and these estimates are likely to be heavily influenced by the use of petrol
vehicle emission factors that were several orders of magnitude lower than the
diesel values used. In terms of this UK mass fraction, the estimate for the
difference between petrol and diesel vehicle emissions would not normally be as
large. For example, differences between emission rates for these two fuel types
can vary considerably, however as the UK estimates of motor vehicle particle
emissions were based on such few data, these estimates cannot be considered to
be an inventory, comprising of robust and comprehensive estimates.

58
2.6. IDENTIFYING SUITABLE PARTICLE EMISSION FACTORS
Inventories can provide vital information to inform air quality monitoring and
regulation, and transport planning; however the selection of the most suitable
emission factors to use in developing these inventories can be a very complex
process. This is because emission factors can be derived from a range of
different measurement techniques, such as from direct measurements taken on
or near roads, in tunnels or on dynamometers; to indirect methods such as
deriving values based on estimates of fuel consumption or remotely sensed
data.
Many issues need to be considered and resolved in selecting emission factors,
such as vehicle type, fuel type, instrumentation used, size range measured, study
location, road type, vehicle speed or drive cycle tested, to name a few. The
literature review revealed that more than 900 particle emission factors are
published in the international literature, which have been derived from a wide
variety of different instrumentation methods, for different particle size ranges, and
conducted in different parts of the world. These are discussed in more detail in
Chapter 5. However, it remains unclear which of these emission factors are the
most suitable to use in transport modelling.
With the exception of dynamometer studies, the majority of studies reviewed paid
little attention to identifying the average vehicle speed of different vehicle types at
their study sites. The posted speed limit of a road may not necessarily represent
the actual speed of vehicles travelling on the road link, which could substantially

59
influence particle emission levels. Congestion is a major issue in most urban
areas, and there is little information available on speed-related emission factors to
model vehicles travelling at lower speeds in congested conditions, such as at
< 50 and < 30 km/hr.
2.7. SUMMARY
Characteristics of motor vehicle particle emissions
To fully understand the effects of motor vehicle particle emissions on human
health it is important to derive size-resolved inventories of particle emissions that
include both particle number and particle mass. These inventories need to
quantify emissions at a range of scales from the micro scale, in terms of direct
emissions - emission rates related to on-road emissions, to broader scales such as
quantification of the spatial distribution of particle concentrations over a region.
Data from epidemiological studies which investigate particulate matter exposure
and its health impacts are extremely important due to the serious health effects
associated with exposure to and inhalation of particles. Diesel vehicle emissions,
in particular, require special attention due to their relatively high emission rates,
and the fact that diesel exhaust is a declared carcinogen.
Together, inventory and epidemiological data can guide the development of air
quality guidelines and standards, and provide data for monitoring, planning and
health impact assessments. It is essential that these studies investigate particles in
the submicrometre (diameters < 1 µm) and smaller size ranges, such as ultrafine

60
particles, where motor vehicle particle emissions tend to dominate; as well as
particle mass emissions in the size ranges between 1-10 µm. The importance of
controlling ultrafine particles emitted from motor vehicles is receiving greater
attention by regulators, evidenced by efforts in Switzerland and Europe to
introduce regulations to control solid particle number emissions.
Another aspect about which the global picture is lacking and for which there is
limited research, is the nature of modality within particle size distributions.
Modes represent the particle size associated with the highest concentrations in an
environment, and examining this particle characteristic has the potential to
provide a deeper understanding about the nature and mechanisms of particle
emissions in different environments, and may also provide an important basis for
developing air quality regulations.
Motor vehicles are the dominant source of ultrafine particles in urban areas and as
current air quality standards are mass and not particle number-based, this means
that this major global pollution source is not adequately regulated or controlled.
Limited information is available upon which to base the development of particle
number standards for motor vehicle emissions, in order to protect human health
and the environment.

61
Vehicle emission inventories and local models
Current inventories and models of particles emitted from motor vehicle tailpipes
around the world are restricted to particle mass, PM10, and to a limited extent
PM2.5, and no detailed inventories are available that have quantified particle
number or PM1.
There are a number of approaches available for quantifying motor vehicle particle
emission inventories, which are dependent upon availability of data, or resources
to access this data, and the scale or level of detailed required for the inventory.
Further, to develop comprehensive inventories for motor vehicles these
approaches need to include the full size range of particles emitted for both particle
number and particle mass emissions.
Inventories provide key and vital information for developing targeted control
strategies and regulatory programs, to identify hotspots and problem routes, and
provide data that can be used to model scenarios to test the air quality
implications of future land use and transport planning, and events such as the
introduction of new vehicle standards (eg., EUROs) and fuels. Hence, inventories
need to be made an integral part of transport-related projects. In this way they can
be used to evaluate the impact of development projects pre- and post-construction
(eg., building of new busways and tunnels) and the effect of major shifts in
transport mode choice or vehicle occupancy rates, to assess their potential impact
on particle emission levels.

62
The review found that no comprehensive inventory currently exists either for
South-East Queensland or for any region in the world that quantifies particles
emitted from motor vehicle tailpipes covering the full size range of particles
emitted and which includes particle number and particle mass emissions.
Transport models
Transportation planning is a very important task for metropolitan areas. Often
data on traffic volumes for significant sections of road networks are not available
and therefore travel demand models are developed so that more detailed
information and accurate estimates of local scale emissions can be made. These
models require a very large quantity of data which can be obtained from
household travel and activity surveys.
Estimate of road transport emissions prepared for the UK
The only study which has attempted to develop a motor vehicle emissions
inventory for tailpipe particle emissions was prepared for the UK, and this
estimate contained a large degree of uncertainty (Group 1999; Goodwin et al.
2000; AQEG 2005). Their PM10 emission data contained substantial uncertainty,
and their data for the smaller particle size ranges were derived by applying
distribution profiles this PM10 estimate data (Group 1999; Goodwin et al. 2000;
AQEG 2005), and was not based on estimates from individual measurements of
different particle sizes.

63
Identifying suitable particle emission factors
A substantial amount of data is available in the international literature for
motor vehicle particle emission factors which have been derived using a broad
range of different techniques and measuring different size ranges, however it
remains unclear which particle emission factors are the most suitable to use in
transport modelling and air quality assessments. In addition, few emission
factor data is available for motor vehicles travelling at low speeds, such as at
< 50 km/hr and < 30 km/hr, to enable modelling of congested traffic
conditions.
2.8. KNOWLEDGE GAPS AND CONCLUSIONS FROM THIS REVIEW
This literature review has demonstrated that:-
• Very little knowledge currently exists about total particulate
matter pollution emitted by motor vehicle fleets in urban areas, in
terms of both particle number and for different size fractions of
particle mass.
• A large body of data is available of emission factors for different
motor vehicle types under different driving conditions, however
it is unclear which are the most suitable to use in transport
modelling and air quality assessments; and that data relating to
emission factors for motor vehicles travelling at < 50 km/hr is
very limited.

64
• A comprehensive inventory has not been published which has
quantified emissions in terms of the full size range of tailpipe
particle emissions emitted by motor vehicle fleets.
• Little data exists to enable estimation of motor vehicle tyre or
brake wear emissions, or to discriminate road dust from motor
vehicle particle emissions; and data for particle surface area
measurements are also rare.
There are three very important reasons for quantifying particles
emitted from motor vehicle tailpipes:-
o Firstly, motor vehicle fleets are a major source of particulate pollution
in urban areas, particularly of ultrafine particles.
o Secondly, there are known adverse health effects associated with
exposure to particulate matter.
o Thirdly, if we cannot quantify the contribution of particle emissions
from motor vehicle fleets on or near roads, we have little chance of
controlling them or gaining an understanding about their contributions
on a global scale, and their likely effect on our earth’s climate and
upper atmospheres.
It is important to develop size-resolved motor vehicle particle inventories that
cover the full size range of particles emitted from motor vehicle tailpipes, and
include particle number and particle mass emissions; and air quality standards
are needed for particle number and PM1 to control submicrometre and
ultrafine particle emissions.
65
2.9. REFERENCES:
Ahlvik, P., Eggleston, S., Goriben, N., Hassel, D., Hickman, A. J., Joumard, R.,
Ntziachristos, L., Rijkeboer, R., Samaras, Z., Zierock, K. H., 1997. COPERT II
Computer programme to calculate emissions from road transport: methodology
and emission factors. Technical report prepared by the European Environment
Agency, Copenhagen. Report No. 6.
Apelbaum, 2006. Queensland Transport Facts, Apelbaum Consulting Group Pty
Ltd, Mulgrave, Victoria, Australia.
AQEG., 2005. Particulate Matter in the UK. London, Department for
Environment, Food and Rural Affairs.
Baron, P. A., Willeke, K., 2001. Aerosol Measurement, Principles, Techniques
and Applications, 2nd edn. New York, John Wiley & Sons, Inc.
Bellasio, R., Bianconi, R., Corda, G., Cucca, P., 2007. Emission inventory for the
road transport sector in Sardinia (Italy). Atmospheric Environment 41, 677-691.
Brook, R. D., Brooke, J. R., Urch, B. R., Vincent, R., Rajagopalan, S., Silverman,
F., 2000. Inhalation of fine particulate air pollution and ozone causes acute
arterial vasoconstriction in healthy adults. Circulation 105, 1534-1536.
66
BTRE., 2003. Urban pollutant emissions from motor vehicles: Australian trends
to 2020. Final Draft Report for Environment Australia. Canberra, Bureau of
Transport and Regional Economics.
CARB., 2002. EMFAC2001/EMFAC200. Calculating emissions inventories for
vehicles in California, User’s Guide, California California Air Resources Board.
Cook, R., Touma, J. S., Beidler, A., Strum, M., 2006. Preparing highway
emissions inventories for urban scale modeling: A case study in Philadelphia.
Transportation Research Part D: Transport and Environment 11(6), 396-407.
Commission of the European Communities, 2007a. Proposal for a Regulation of
the European Parliament and of the Council on type-approval of motor vehicles
and engines with respect to emissions from heavy duty vehicles (Euro VI) and on
access to vehicle repair and maintenance information, Brussels.
Commission of the European Communities, 2007b. Annex to the Proposal for a
Regulation of the European Parliament and of the Council on the approximation
of the laws of the Member States with respect to emissions from on-road heavy
duty vehicles and on access to vehicle repair information, Impact Statement,
Brussels.
DEWHA (Department of the Environment, Water, Heritage and the Arts) 2008a,
Substance Emissions - Motor Vehicles, Queensland, 20 September.

67
DEWHA (Department of the Environment, Water, Heritage and the Arts) 2008b,
Particulate Matter 10.0 µm Summary - All sources: Queensland, 20 September.
DEWHA (Department of the Environment, Water, Heritage and the Arts),
Ambient Air Quality Standards,
ttp://www.environment.gov.au/atmosphere/airquality/standards.html),
verified 9 July 2009.
DOEH., 2003. Technical Report No. 1: Toxic Emissions from Diesel Vehicles in
Australia, Department of the Environment and Heritage, Canberra.
Dockery, D. W., Pope, C. A., Xu, X., Spengler, J. D., Ware, J. H., Fay, M.E.,
Ferris, B.G., 1993. An Association between Air Pollution and Mortality in Six
U.S. Cities. The New England Journal of Medicine 329(24), 1753-1759.
ECJRC., (European Commission Joint Research Centre) 2002. Guidelines for
concentration and exposure-response measurement of fine and ultrafine
particulate matter for use in epidemiological studies. Italy European Commission.
Environment Protection and Heritage Council, National Environment Protection
Council, Preparatory Work, www.ephc.gov.au/taxonomy/term/70, verified 9 July
2009.
EPA., 2004. Air Emissions Inventory South-East Queensland Region,
Environmental Protection Agency, Brisbane.

68
European Union 2007, Official Journal of the European Union, Regulation (EC)
No 715/2007 of the European Parliament and of the Council of 20 June 2007 on
type approval of motor vehicles with respect to emissions from light passenger
and commercial vehicles (Euro 5 and Euro 6) and on access to vehicle repair and
maintenance information, Strasbourg.
European Commission. http://ec.europa.eu/index_en.htm. Date verified 28 July
2008.
Ferin, J., Oberdoerster, G., Penney, D. P., Soderholm, S. C., Gelein, R., Piper,
H.C., 1990. Increased pulmonary toxicity of ultrafine particles I. Particle
clearance, translocation, morphology. Journal of Aerosol Science. 21(3), 381-384.
Giechaskiel, B., Ntziachristos, L., Samaras, Z., Scheer, V., Casati, R., Vogt, R.,
2005. Formation potential of vehicle exhaust nucleation mode particles on-road
and in the laboratory. Atmospheric Environment 39(18), 3191-3198.
Goodwin, J. W. L., Salway, A. G., Eggleston, H. S., Murrells, T. P., Berry, J.E.,
1999. National Atmospheric Emissions Inventory, UK Emissions of Air
Pollutants 1970 to 1996, National Environmental Technology Centre on behalf of
the Department of the Environment, Transport and the Regions..
Goodwin, J. W. L., Salway, A. G., Murrells, T. P., Dore, C. J., Passant, N.R.,
Eggleston, H.S., 2000. UK emissions of air pollutants 1970-1998. A Report of the
National Atmospheric Emissions Inventory. London, Department of the
Environment, Transport and the Regions.

69
Graskow, B. R., Kittelson, D. B., Abdul-Khalek, I. S., Ahmadi, M., Morris, J.E.,
1998. Characterisation of Exhaust Particulate Emissions from a Spark Ignition
Engine. SAE Paper 980528, 155-165.
Group, 1999, Source Apportionment of Airborne Particulate Matter in the United
Kingdom. Report for the Department of the Environment, Transport and the
Regions, the Welsh Office, the Scottish Office and the Department of the
Environment (Northern Ireland).
Harris, S. J., Maricq, M. M., 2001. Signature size distributions for diesel and
gasoline engine exhaust particulate matter. Journal of Aerosol Science 32, 749-
764.
Harrison, R., Jones, M., Collins, G., 1999. Measurements of the Physical
Properties of Particles in the Urban Atmosphere. Atmospheric Environment 33,
309-321.
Harrison, R. M., Shi, J. P., Zi, S., Khan, A., Mark, D., Kinnersley, R., Yin, J.,
2000, Measurement of number, mass and size distribution of particles in the
atmosphere. Philosophical Transactions of the Royal Society A: Mathematical,
Physical and Engineering Sciences 358(1775), 2567-2580.

70
Hinds, W. C., 1982. Aerosol Technology Properties, Behaviour, and
Measurement of Airborne Particles. New York, John Wiley & Sons.
Jaenicke, R., 1993. Tropospheric Aerosols. San Diego, USA, Academic Press.
Jamriska, M., Morawska, L., 2003. Quantitative Assessment of the Effect of
Surface Deposition and Coagulation on the Dynamics of Submicrometer Particles
Indoors. Aerosol Science and Technology 37(5), 425-436.
Jamriska, M., Morawska, L., Thomas, S., Congrong, H., 2004. Diesel Bus
Emissions Measured in a Tunnel Study. Environmental Science & Technology
38(24), 6701-6709.
John, W., 1993. The characteristics of environmental and laboratory generated-
aerosols, in: Willeke and Baron (Eds.), Aerosol measurement: Principles,
techniques and applications,Van Nostrand Reinhold, New York. 55.
Jones, A. M., Harrison, R. M., 2006. Estimation of the emission factors of particle
number and mass fractions from traffic at a site where mean vehicle speeds vary
over short distances. Atmospheric Environment 40(37), 7125-7137.
Kirchstetter, T. W., Harley, R. A., Kreisberg, N. M., Stolzenberg, M.R., Hering,
S.V., 1999, On-road measurement of fine particle and nitrogen oxide emissions
from light- and heavy-duty motor vehicles. Atmospheric Environment 33, 2955-
2968.
71
Kittelson, D., 1998, Engines and Nanoparticles: a Review. Journal of Aerosol
Science 29(5), 575-588.
Kittelson, D., Johnson, J., Watts, W. F., Wei, Q., Drayton, M., Paulsen, D.,
Bukowiecki, N., 2000, Diesel aerosol sampling in the atmosphere. SAE
Technology Paper 2000-01-2212.
Kittelson, D. B., Watts, W. F., Johnson, J., 2002. Diesel aerosol sampling
methodology. CRC E-43 Final report.
Lundgren, D. A., Burton, R.M., 1995. Effect of particle size distribution on the
cut point between fine and coarse ambient mass fractions. Inhalation Toxicology
7(1), 131-148.
Lvovsky, L., Hughes, G., Maddisoin, D., Ostro, B., Pearce, D., 2000.
Environmental Costs of Fossil Fuels: A Rapid Assessment Method with
Application to Six Cities, The World Bank Environment Department, The World
Bank.
Mobley, J.D., Cadle, S. H., 2004. Innovative Methods for Emission Inventory
Development and Evaluation: Workshop Summary. Journal of the Air & Waste
Management Association 54, 1422-1439.

72
Morawska, L., Salthammer, T., 2003. Chapter 3: Motor Vehicle Emissions as a
Source of Indoor Particles in, Morawska-Salthammer (eds). Indoor Environment,
Wiley-VCH.
Morawska, L., Thomas, S., Bofinger, N., Wainwright, D., Neale, D., 1998a.
Comprehensive characterization of aerosols in a subtropical urban atmosphere:
particle size distribution and correlation with gaseous pollutants. Atmospheric
Environment 32(14/15), 2467-2478
Morawska, L., Bofinger, N. D., Kocis, L., Nwankwoala, A., 1998b.
Submicrometer and supermicrometer particles from diesel vehicle emissions.
Environmental Science & Technology 32(14), 2033-2042.
Morawska, L., Johnson, G., Ristovski, Z.D., Agranovski, V., 1999a. Relation
between particle mass and number for submicrometer airborne particles.
Atmospheric Environment 33(13), 1983-1990.
Morawska, L., Thomas, S., Jamriska, M., Johnson, G., 1999b. The modality of
particle size distributions of environmental aerosols. Atmospheric Environment
33(27), 4401-4411.
Morawska, L., Ristovski, Z., Jayaratne, E. R., Keogh, D.U., Ling, X., 2008a.
Ambient nano and ultrafine particles from motor vehicle emissions:
characteristics, ambient processing and implications on human exposure
Submitted to Atmospheric Environment.

73
Morawska, L., Keogh, D. U., Thomas, S. B., Mengersen, K., 2008b. Modality in
ambient particle size distributions and its potential as a basis for developing air
quality regulation. Atmospheric Environment 42(7), 1617-1628.
Morawska, L., Moore, M. R., Ristovski, Z.D., 2004. Health Impacts of Ultrafine
Particles - Desktop Literature Review and Analysis, Department of the
Environment and Heritage, September, Canberra.
Murray, A. T., Davis, R., Stimson, R. J., Ferreira, L., 1998. Public Transportation
Access. Transportation Research Part D: Transport and Environment 3(5), 319-
328.
National Atmospheric Emissions Inventory, http://www.naei.org.uk/index.php.
Date verified 28 July 2008.
NEPC, 2000, Proposed Diesel Vehicle Emissions National Environment
Protection Measure Preparatory Work, In-Service Emissions Performance - Phase
2: Vehicle Testing, NEPC, Adelaide, November.
NPI (National Pollutant Inventory), Department of the Environment, Water,
Heritage and the Arts, Australian Government, http://www.npi.gov.au/index.html.
verified 1 July 2008.

74
Nielsen, O. A., Knudsen, M.A., 2006. Uncertainty in traffic models. European
Transport Conference Strasbourg, France
Ntziachristos, L., Samaras, Z., Eggleston, S., Goriben, N., Hassel, D., Hickman,
A. J., Joumard, R., Rijkeboer, R., White, L., Zierock, K. H., 2000. COPERT III
Computer programme to calculate emissions from road transport: methodology
and emission factors (version 2.1). Technical report prepared by the European
Environment Agency, Copenhagen, Report 49.
Oberdoerster, G., Sharp, Z., Atudorei, V., Elder, A., Gelein, R., Kreyling, W.,
Cox, C., 2004. Translocation of inhaled ultrafine particles to the brain. Inhalation
Toxicology 16, 437-445.
Ortuzar, J., Willumsen, L.G., 2001. Modelling Transport. 3rd edn., John Wiley &
Sons Inc. .
Particle Measurement Programme, DieselNet website,
http://www.dieselnet.com/news/2002/10ricardo.php, verified 9 July 2009.
Particle Measurement Programme (PMP), home page of PMP
http://www.empa.ch/plugin/template/empa/*/20988/---/I=1, verified 9 July 2009.
Parrish, D.D., 2006. Critical evaluation of US on-road vehicle emission
inventories. Atmospheric Environment 40(13), 2288-2300.

75
Pirjola, L., Parviainen, H., Hussein, T., Valli, A., Hameri, K., Aalto, P., Virtanen,
A., Keskinen, J., Pakkanen, T., Makela, J., Hillamo, R., 2004. "Sniffer" - A novel
tool for chasing vehicles and measuring traffic pollutants. Atmospheric
Environment 38, 3625-3635.
Pope, C. A., Burnett, R. T., Thun, M. J., Calle, E. E., Krewski, D., Ito, K.,
Thurston, G.D., 2002, Lung cancer, cardiopulmonary mortality, and long-term
exposure to fine particulate air pollution. Journal of the American Medical
Association 287(9), 1132-1141.
Pope, C. A., Dockery, D.W., 2006. Health Effects of Fine Particulate Air
Pollution: Lines that Connect. Journal of the Air & Waste Management
Association 56(6), 709-732.
Querol, X., Alastuey, A., de la Rosa, J., Sanchez-de-la-Campa, A., Plana,
F., Ruiz, C.R., 2002. Source apportionment analysis of atmospheric
particulates in an industrialised urban site in southwestern Spain.
Atmospheric Environment 36(19), 3113-3125.
Ristovski, Z., Jayaratne, E. R., Lim, M., Ayoko, G. A., Morawska, L., 2006.
Influence of diesel fuel sulphur on the nanoparticle emissions from city buses.
Environmental Science & Technology 40, 1314-1320.

76
Ristovski, Z. D., Morawska, L., 1998. Emission of submicrometer particles from
spark ignition vehicles. Journal of Aerosol Science 29(Supplement 2), S1001-
S1002.
Seaton, A., MacNee, W., Donaldson, K., Godden, D., 1995. Particulate air
pollution and acute health effects. Lancet 345, 176-178.
SEQHTS., 2003-2004. South-East Queensland Household Travel Survey
(SEQHTS) (Brisbane, Gold Coast and Sunshine Coast Area). Brisbane
Queensland Transport
Shi, J., Evans, D., Khan, A., Harrison, R., 2001. Sources and Concentration of
Nanoparticles ( < 10 nm Diameter) in the Urban Atmosphere. Atmospheric
Environment 35, 1193-1202.
Shi, J., Harrison, R.M., 1999. Investigation of ultrafine particle formation during
diesel exhaust dilution. Environmental Science & Technology 33, 3730-3736.
Shi, J. P., Khan, A. A., Harrison, R.M., 1999. Measurements of ultrafine particle
concentration and size distribution in the urban atmosphere. The Science of the
Total Environment 235, 51-64.
Shifter, I., Diaz, L., Mugica, V., Lopez-Salinas, E., 2005. Fuel-based motor
vehicle emission inventory for the metropolitan area of Mexico city. Atmospheric
Environment 39(5), 931-940.

77
Smit, R., Smokers, R., Rabe, E., 2007, A new modelling approach for road traffic
emissions: VERSIT+. Transportation Research Part D-Transport and
Environment 12, 414-422.
Somers, C. M., McCarry, B.E., Malek, F., Quinn, J. S., 2004, Reduction of
particulate air pollution lowers the rist of heritable mutations in mice. Science,
1008-1010.
Sturm, P. J., Baltensperger, U., Bacher, M., Lechner, B., Hausberger, S., Heiden,
B., Imhof, D., Weingartner, E., Prevot, A.S.H., Kurtenbach, R., Wiesen, P., 2003,
Roadside measurements of particulate matter size distribution. Atmospheric
Environment 37, 5273-5281.
TNO., 1997. Particulate Matter Emissions (PM10, PM2.5, PM<0.1) in Europe in
1990 and 1993, TNO Report TNO-MEP-R96/472. Netherlands.
Unal, A., Frey, H. C., Rouphail, N.M., 2004. Quantification of Highway Vehicle
Emissions Hot Spots based on on-board measurements. Journal of the Air &
Waste Management Association 54, 130-140.
USEPA., 1993. User's Guide to MOBILE5A, Mobile source emissions
factor model, U.S. Environmental Protection Agency.
USEPA., 1995. Compilation of Air Pollutant Emission Factors, 5th edn, AP-
42, North Carolina.

78
USEPA., 2004. Air quality criteria for particulate matter. Washington DC,
US Environmental Protection Agency, 600/P-99/002aF-bF.
Vogt, R., Kirchner, U., Scheer, V., Hinz, K. P., Trimborn, A., Spengler,
B., 2003. Identification of diesel exhaust particles at an Autobahn, urban
and rural location using single particle mass spectometry. Aerosol Science
& Technology 34, 319-337.
Wahlin, P., Palmgren, F., Van Dingenen, R., 2001. Experimental studies
of ultrafine particles in streets and the relationship to traffic. Atmospheric
Environment 35, S63-S69.
Walker, J. L., Li, J., Srinivasan, S., Bolduc, D., 2008. Travel Demand
Models in the Developed World: Correcting for Measurement Errors.
Transportation Research Board 87th Annual Meeting Washington.
WHO., 2000, Guidelines for Air Quality, World Health Organization, Geneva.
WHO., 2005, Guidelines for Air Quality. World Health Organization,
Geneva.
Willeke, K., Baron, P.A., 1993. Aerosol Measurement: Principles, Techniques,
and Applications. John Wiley & Sons, New York.

79
Young, L. H., Keeler, G.J., 2004. Characterization of ultrafine particle number
concentration and size distribution during a summer campaign in southwest
Detroit. Journal of the Air & Waste Management Association 54(9), 1079-1090.
Zhang, K., 2004. Ambient and Plume Processing of Atmospheric Ultrafine
Particles. PhD thesis, University of California, Davis.
Zhang, K. M., Wexler, A. S., 2004. Evolution of particle number distribution near
roadways - Part I: analysis of aerosol dynamics and its implications for engine
emission measurement. Atmospheric Environment 38(38), 6643-6653.
Zhong, M., Hanson, B. L., 2008. GIS-Based Travel Demand Modeling for
Estimating Traffic on Low-Class Roads. Transportation Research Board 87th
Annual Meeting Washington
Zhu, Y., 2003. Ultrafine particle and freeways. PhD thesis, University of
California, Los Angeles.

80
2.10. BIBLIOGRAPHY
ABS., 2004. Population by Age and Sex. Australian Bureau of Statistics,
Canberra.
ABS., 2004. Survey of Motor Vehicle Use Australia. Australian Bureau of
Statistics, Canberra.
Abu-Allaban, M., 2002. Exhaust particle size distribution measurements at the
Tuscarora Mountain tunnel. Aerosol Science and Technology 36(6), 771-789.
Abu-Allaban, M., Gillies, J. A., Gertler, A.W., 2003. Application of a multi-lag
regression approach to determine on-road PM10 and PM2.5 emission rates.
Atmospheric Environment 37(37), 5157-5164.
Abu-Allaban, M., Gillies, J. A., Gertler, A. W., Clayton, R., Proffitt, D., 2003.
Tailpipe, resuspended road dust, and brake-wear emission factors from on-road
vehicles. Atmospheric Environment 37(37), 5283-5293.
Affum, J. K., Brown, A. L., Chan, Y.C., 2003. Integrating air pollution modelling
with scenario testing in road transport planning: the TRAEMS approach. The
Science of The Total Environment 312(1-3), 1-14.
Ahlvik, P., Eggleston, S., Goriben, N., Hassel, D., Hickman, A.J., Joumard, R.,
Ntziachristos, L., Rijkeboer, R., Samaras, Z., Zierock, K. H., 1997. COPERT II
81
Computer programme to calculate emissions from road transport: methodology
and emission factors. Technical report prepared by the European Environment
Agency, Copenhagen. Report No. 6.
Almeida, S. M., Pio, C. A., Freitas, M. C., Reis, M. A., Trancoso, M.A., 2005.
Source apportionment of fine and coarse particulate matter in a sub-urban area at
the Western European Coast. Atmospheric Environment 39(17), 3127-3138.
Anderson, H. R., 2000. Differential epidemiology of ambient aerosols.
Philosophical Transactions of the Royal Society of London Series a-Mathematical
Physical and Engineering Sciences 358(1775), 2771-2785.
Apelbaum, 2006. Queensland Transport Facts, Apelbaum Consulting Group Pty
Ltd, Mulgrave, Victoria, Australia.
AQEG., 2005. Particulate Matter in the UK. Department for Environment, Food
and Rural Affairs, London.
ARB's., 2002. Study of Emissions from Two "Late Model" Diesel and CNG
Heavy-Duty Transit Buses. California Air Resources Board, 12th CRC On-Road
Vehicle Emissions Workshop, April 15-17, San Diego.
Ayala, A., Kado, N. Y., Okamoto, R.A., 2002. Diesel and CNG Heavy-duty
Transit Bus Emissions over Multiple Driving Schedules: Regulated Pollutants and
Project Overview. Society of Automotive Engineers SAE 2002-01-1722, 1-13.

82
Baron, P.A., Willeke, K., 2001. Aerosol Measurement, Principles, Techniques
and Applications, 2nd edn. New York, John Wiley & Sons, Inc.
Becker, S., Soukup, J. M., Sioutas, C., Cassee, F.R., 2003. Response of human
alveolar macrophages to ultrafine, fine, and coarse urban air pollution particles.
Experimental Lung Research 29(1), 29-44.
Bellasio, R., Bianconi, R., Corda, G., Cucca, P., 2007. Emission inventory for the
road transport sector in Sardinia (Italy). Atmospheric Environment 41, 677-691.
Berner, A., Galambos, Z., Ctyroky, P., Fruhaug, P., Hitzenberger, R., Gomiscek,
B., Hauck, H., Preining, O., Puxbaum, H., 2004. On the correlation of
atmospheric aerosol components of mass size distributions in the larger region of
a central European city. Atmospheric Environment 38(24), 3959-3970.
Bigg, E. K., Turvey, D.E., 1978. Sources of atmospheric particles over Australia.
Atmospheric Environment 12, 1643-1655.
Bin, O., 2003. A logit analysis of vehicle emissions using inspection and
maintenance testing data. Transportation Research Part D: Transport and
Environment 8(3), 215-227.

83
Birmili, W., Heintzenberg, J., Wiedensohler, A., 1999. Representative
measurement and parameterization of the submicron continental particle size
distribution Journal of Aerosol Science 30, Suppl. 1, S229-S230.
Birmili, W., Wiedensohler, A., Heintzenberg, J., Lehmann, K, 2001. Atmospheric
particle number size distribution in central Europe: Statistical relations to air
masses and meteorology. Journal of Geophysical Research - Atmospheres 106
(D23), 32005-32018.
Boddy, J. W. D., Smalley, R. J., Goodman, P. S., Tate, J. E., Bell, M. C., Tomlin,
A.S., 2005. The spatial variability in concentrations of a traffic-related pollutant
in two street canyons in York, UK-Part II: The influence of traffic characteristics.
Atmospheric Environment 39(17), 3163-3176.
Bradley, M. J., 2000. Hybrid-Electric Drive Heavy-Duty Vehicle Testing Project;
Final Emissions Report. Northeast Advanced Vehicle Consortium, Defense
Advanced Research Projects Agency, West Virginia University, USA.
Brodrick, C.J., 2001. Effects of real-world vehicle activities and loads on heavy-
duty diesel vehicle emissions. University of California, Davis.
Brook, R. D., Brooke, J. R., Urch, B. R., Vincent, R., Rajagopalan, S., Silverman,
F., 2000. Inhalation of fine particulate air pollution and ozone causes acute
arterial vasoconstriction in healthy adults. Circulation 105, 1534-1536.

84
Brown, A.L, .Affum, J.K., 2002. A GIS-based environmental modelling system
for transportation planners. Computers, Environment and Urban Systems 26(6),
577-590.
BTRE., 2003. Urban pollutant emissions from motor vehicles: Australian trends
to 2020, Final Draft Report for Environment Australia. Canberra, Bureau of
Transport and Regional Economics.
Bukowiecki, N., Dommen, J., Prevot, A. S. H., Richter, R., Weingartner, E.,
Baltensperger, U., 2002. A mobile pollutant measurement laboratory--measuring
gas phase and aerosol ambient concentrations with high spatial and temporal
resolution. Atmospheric Environment 36(36-37), 5569-5579.
BUWAL., 2004, 1 March. Ordinance on the determination of the particle number
emission level of passenger cars with compression ignition engines, Draft.
http://www.puntofocal.gov.ar/doc/che39.pdf. Date verified 20 February 2008.
Byers, R. J., 1999. Measurement of particulate matter size, concentration and
mass emissions from in-use heavy duty vehicles. United States - West Virginia,
West Virginia University.
Cadle, S. H., Belian, T. C., Black, K. N., Minassian, F., Natarajan, M., Tierney, E.
J., Lawson, D.R., 2005. Real-world vehicle emissions: A summary of the 14th
Coordinating Research Council On-Road Vehicle Emissions Workshop. Journal
of the Air & Waste Management Association 55(2), 130-146.
85
Cadle, S. H., Mulawa, P., Groblicki, P., Laroo, C., Ragazzi, R. A., Nelson, K.,
Gallagher, G., Zielinska, B., 2001. In-use light-duty gasoline vehicle particulate
matter emissions on three driving cycles. Environmental Science & Technology
35(1), 26-32.
Cadle, S. H., Mulawa, P. A., Ball, J., Donase, C., Weibel, A., Sagebiel, J. C.,
Knapp, K. T., Snow, R., 1997. Particulate emission rates from in use high
emitting vehicles recruited in Orange County, California. Environmental Science
& Technology 31(12), 3405-3412.
CARB., 2001. Heavy-Duty Emissions Laboratory, Heavy Duty Testing and Field
Support Section, California Air Resources Board. Report No. 01-01.
CARB., 2002. EMFAC2001/EMFAC200. Calculating emissions inventories for
vehicles in California, User’s Guide California California Air Resources Board.
Chatterjee, S., Conway, R., Lanni, T., Frank, B., Tang, S., Rosenblatt, D., Bush,
C., Lowell, D., Evans, J., McLean, R., Levy, S., 2002. Performance and
Durability Evaluation of Continuously Regenerating Particulate Filters on Diesel
Powered Urban Buses at NY City Transit - Part II. Society of Automotive
Engineers SAE 2002-01-0430.
Chen, C., Niemeier, D., 2005. A mass point vehicle scrappage model.
Transportation Research Part B: Methodological 39(5), 401-415.

86
Chung, A., Chang, D.P.Y., Kleeman, M.J., Perry, K. D., Cahill, T.A., Dutcher, D.,
McDougall, E.M., Stroud, K., 2001. Comparison of real-time instruments used to
monitor airborne particulate matter. Journal of the Air & Waste Management
Association 51(1), 109-120.
Clark, N.N., Gautam, M., Rapp, B.L., Lyons, D.W., Graboski, M. S., McCormick,
R. L., Alleman, T.L., Norton, P., 1999. Diesel and CNG Transit Bus Emissions
Characterization by Two Chassis Dynamometer Laboratories: Results and Issues.
Society of Automotive Engineers SAE 1999-01-1469.
Clark, N.N., Lyons, D.W., Bata, R.M., Gautam, M., Wang, W.G., Norton, P.,
Chandler, K., 1997. Natural Gas and Diesel Transit Bus Emissions: Review and
Recent Data. Society of Automotive Engineers Tech. Pap. No. 973203.
Clark, N.N., Lyons, D.W., Rapp, B.L., Gautam, M., Wang, W.G., Norton, P.,
White, C., Chandler, C., 1998. Emissions from Trucks and Buses Powered by
Cummins L-10 Natural Gas Engines. Society of Automotive Engineers Tech. Pap.
No. 981393.
Clarke, A.G., Robertson, L.A., Hamilton, R.S., Gorbunov, B., 2004. A
Lagrangian model of the evolution of the particulate size distribution of vehicular
emissions. Science of the Total Environment 334-35, 197-206.
Commission of the European Communities, 2007a. Proposal for a Regulation of
the European Parliament and of the Council on type-approval of motor vehicles

87
and engines with respect to emissions from heavy duty vehicles (Euro VI) and on
access to vehicle repair and maintenance information, Brussels.
Commission of the European Communities, 2007b. Annex to the Proposal for a
Regulation of the European Parliament and of the Council on the approximation
of the laws of the Member States with respect to emissions from on-road heavy
duty vehicles and on access to vehicle repair information, Impact Statement,
Brussels.
CONCAWE., 1998. A study of the number, size & mass of exhaust particles
emitted from european diesel and gasoline vehicles under steady-state and
european driving cycle conditions. CONCAWE, Brussels Report no. 98/51.
Converse, M.K.N., 2004. Roadside ultrafine and nanoparticle number
distributions in northern Central Valley, California and relationships to
meteorology and traffic. United States -- California, University of California,
Davis.
Cook, R., Touma, J. S., Beidler, A., Strum, M., 2006. Preparing highway
emissions inventories for urban scale modeling: A case study in Philadelphia.
Transportation Research Part D: Transport and Environment 11(6), 396-407.

88
Corsmeier, U., Imhof, D., Kohler, M., Kuhlwein, J., Kurtenbach, R., Petrea, M.,
Rosenbohm, E., Vogel, B., Vogt, U., 2005. Comparison of measured and model-
calculated real-world traffic emissions. Atmospheric Environment 39(31), 5760-
5775.
Dickens, C., Booker, D., 1998. Characterisation of vehicle emissions. Journal of
Aerosol Science 29(Supplement 1), 351.
DieselNet Emissions Standards, Switzerland. www.dieselnet.com/standards/ch/.
Date verified 20 February 2008.
Dockery, D.W., Pope, C.A., Xu, X., Spengler, J.D., Ware, J.H., Fay, M.E., Ferris,
B.G., 1993. An Association between Air Pollution and Mortality in Six U.S.
Cities. The New England Journal of Medicine 329(24), 1753-1759.
DOEH., 2003. Technical Report No. 1: Toxic Emissions from Diesel Vehicles in
Australia, Department of the Environment and Heritage, Canberra.
Dora, C., 1999. A different route to health: implications of transport policies
British Medical Journal 318(7199), 1686-1689.
Earnshaw, K., Booker, D.R., 1998. City centre and industrial pollution
measurement using mass- and number-weighted instrumentation. Journal of
Aerosol Science 29(Supplement 1), 591-592.
89
ECJRC., (European Commission Joint Research Centre) 2002. Guidelines for
concentration and exposure-response measurement of fine and ultrafine
particulate matter for use in epidemiological studies. European Commission, Italy.
El-Shawarby, I., Ahn, K., Rakha, H., 2005. Comparative field evaluation of
vehicle cruise speed and acceleration level impacts on hot stabilized emissions.
Transportation Research Part D: Transport and Environment 10(1), 13-30.
Englert, N., 2004. Fine particles and human health - a review of epidemiological
studies. Toxicology Letters 149(1-3), 235-242.
Eninger, R. M., Rosenthal, F.S., 2004. Heart rate variability and particulate
exposure in vehicle maintenance workers: A pilot study. Journal of Occupational
and Environmental Hygiene 1(8), 493-499.
EPA (Environmental Protection Agency), 2004. Air Emissions Inventory South-
east Queensland Region. Brisbane.
EurActiv.com 2006. EURO 5 emissions standards for cars, EU News, Policy
Positions & EU Actors online. http://www.euractiv.com/en/transport/euro-5-
emissions-standards-cars/article-133325. Date verified 26 June 2008.

90
European Union 2007, Official Journal of the European Union, Regulation (EC)
No 715/2007 of the European Parliament and of the Council of 20 June 2007 on
type approval of motor vehicles with respect to emissions from light passenger
and commercial vehicles (Euro 5 and Euro 6) and on access to vehicle repair and
maintenance information, Strasbourg.
Feldpausch, P., Fiebig, M., Fritzsche, L., Petzold, A., 2006. Measurement of
ultrafine aerosol size distributions by a combination of diffusion screen separators
and condensation particle counters. Journal of Aerosol Science 37(5), 577-597.
Ferin, J., Oberdoerster, G., Penney, D.P., Soderholm, S.C., Gelein, R., Piper,
H.C., 1990. Increased pulmonary toxicity of ultrafine particles I. Particle
clearance, translocation, morphology. Journal of Aerosol Science. 21(3), 381-384.
Fine, P., Shen, S., Sioutas, C., 2004. Inferring the sources of fine and ultrafine
particulate matter at downwind receptor sites in the Los Angeles basin using
multiple continuous measurements. Aerosol Science and Technology 38(S1), 182-
195.
Gajananda, K., Kuniyal, J. C., Momin, G. A., Rao, P. S. P., Safai, P. D., Tiwari,
S., Ali, K., 2005. Trend of atmospheric aerosols over the north western
Himalayan region, India. Atmospheric Environment 39(27), 4817-4825.
Gehrig, R., Hill, M., Buchmann, B., Imhof, D., Weingartner, E., Baltensperger,
U., 2004. Separate determination of PM10 emission factors of road traffic for

91
tailpipe emissions and emissions from abrasion and resuspension processes.
International Journal of Environment & Pollution 22(3), 312-325.
Gertler, A.W., Gillies, J. A., Pierson, W. R., Rogers, C.F., Sagebiel, J.C., Abu-
Allaban, M., Coulombe, W., Tarnay, L., Cahill, T.A., 2002. Real-World
Particulate Matter and Gaseous Emissions from Motor Vehicles in a Highway
Tunnel. Health Effects Institute Research Report 107.
Gidhagen, L., Johansson, C., Langner, J., Foltescu, V.L., 2005. Urban scale
modeling of particle number concentration in Stockholm. Atmospheric
Environment 39(9), 1711-1725.
Gidhagen, L., Johansson, C., Langner, J., Olivares, G., 2004. Simulation of NOx
and ultrafine particles in a street canyon in Stockholm, Sweden. Atmospheric
Environment 38(14), 2029-2044.
Gidhagen, L., Johansson, C., Omstedt, G., Langner, J., Olivares, G., 2004. Model
simulations of NOx and ultrafine particles close to a Swedish highway.
Environmental Science & Technology 38(24), 6730-6740.
Gidhagen, L., Johansson, C., Strom, J., Kristensson, A., Swietlicki, E., Pirjola, L.,
Hansson, H., 2003. Model simulation of ultrafine particles inside a road tunnel.
Atmospheric Environment 37, 2023-2036.

92
Giechaskiel, B., Ntziachristos, L., Samaras, Z., Scheer, V., Casati, R., Vogt, R.,
2005. Formation potential of vehicle exhaust nucleation mode particles on-road
and in the laboratory. Atmospheric Environment 39(18), 3191-3198.
Gillies, J.A., Gertler, A.W., Sagebiel, J. C., Dippel, W.A., 2001. On-road
particulate matter (PM2.5 and PM10) emissions in the Sepulveda Tunnel, Los
Angeles, California. Environmental Science & Technology 35(6), 1054-1063.
Goodwin, J.W.L., Salway, A.G., Murrells, T. P., Dore, C.J., Passant, N.R.,
Eggleston, H.S., 2000. UK emissions of air pollutants 1970-1998. A Report of the
National Atmospheric Emissions Inventory. London, Department of the
Environment, Transport and the Regions.
Gramotnev, G., Brown, R., Ristovski, Z., Hitchins, J., Morawska, L., 2003.
Determination of average emission factors for vehicles on a busy road.
Atmospheric Environment 37(4), 465-474.
Gramotnev, G., Ristovski, Z., 2004. Experimental investigation of ultra-fine
particle size distribution near a busy road. Atmospheric Environment 38(12),
1767-1776.
Gramotnev, G., Ristovski, Z.D., Brown, R. J., Madl, P., 2004. New methods of
determination of average particle emission factors for two groups of vehicles on a
busy road. Atmospheric Environment 38(16), 2607-2610.

93
Gras, J. L., Ayers, G.P., 1983. Marine aerosol at southern mid-latitudes. Journal
of Geophysical Research 88(C15), 10661-10666.
Graskow, B.R., Kittelson, D. B., Abdul-Khalek, I.S., Ahmadi, M., Morris, J.E.,
1998. Characterisation of Exhaust Particulate Emissions from a Spark Ignition
Engine. SAE Paper 980528, 155-165.
Group, 1999. Source Apportionment of Airborne Particulate Matter in the United
Kingdom. Report for the Department of the Environment, Transport and the
Regions, the Welsh Office, the Scottish Office and the Department of the
Environment (Northern Ireland).
Gutfinger, C., 1996. Aerosol measurement: Principles, techniques, and
applications : edited by K. Willeke and P. A. Baron., Van Nostrand Reinhold,
New York (1993). 876 pp.
Harris, S. J., Maricq, M.M., 2001. Signature size distributions for diesel and
gasoline engine exhaust particulate matter. Journal of Aerosol Science 32, 749-
764.
Harrison, R., Jones, M., Collins, G. 1999. Measurements of the Physical
Properties of Particles in the Urban Atmosphere. Atmospheric Environment 33,
309-321.

94
Harrison, R.M., Jones, M., Collins, G., 1999. Measurements of the physical
properties of particles in the urban atmosphere. Atmospheric Environment 33(2),
309-321.
Harrison, R.M., Shi, J.P., Zi, S., Khan, A., Mark, D., Kinnersley, R., Yin, J., 2000.
Measurement of number, mass and size distribution of particles in the
atmosphere. Philosophical Transactions of the Royal Society A: Mathematical,
Physical and Engineering Sciences 358(1775), 2567-2580.
Hasegawa, S., Hirabayashi, M., Kobayashi, S., Moriguchi, Y., Kondo, Y.,
Tanabe, K., Wakamatsu, S., 2005. Size distribution and characterization of
ultrafine particles in roadside atmosphere. Journal of Environmental Science and
Health Part a-Toxic/Hazardous Substances & Environmental Engineering, 2671-
2690.
Hausberger, S., Rodler, J., Sturm, P., Rexeis, M., 2003. Emission factors for
heavy-duty vehicles and validation by tunnel measurements. Atmospheric
Environment 37(37), 5237-5245.
Hazi, Y., 2001. Measurements of acidic sulfates and trace metals in fine and
ultrafine ambient particulate matter: Size distribution, number concentration and
source region. United States - New York, New York University.

95
Heintzenberg, J., Birmili, W., Wiedensohler, A., Nowak, A., Tuch, T., 2004.
Structure, variability and persistence of the submicrometer marine aerosol. Tellus
Series B - Chemical and Physical Meteorology 56, 357-367.
Herner, J.D., Aw, J., Gao, O., Chang, D. P., Kleeman, M.J. 2005. Size and
composition distribution of airborne particulate matter in northern California: I-
particulate mass, carbon, and water-soluble ions. Journal of the Air & Waste
Management Association 55(1), 30-51.
Hibberd, M.F., 2005. Vehicle NOx and PM10 Emission Factors from Sydney's
M5-East Tunnel. 17th International Clean Air & Environment Conference
proceedings, Hobart. Clean Air Society of Australia and New Zealand.
Hidy, G.M., 1975. Summary of the California Aerosol Characterization
Experiment. Journal of the Air Pollution Control Association 25, 1106-1114.
Hillamo, R., Kerminen, V. M., Aurela, M., Makela, J., Maenhaut, W., Leck, C.,
2001. Modal structure of chemical mass size distribution in the high Arctic
aerosol. Journal of Geophysical Research - Atmospheres 106(D21), 27555-27571.
Hitchins, J., Morawska, L., Wolff, R., Gilbert, D., 2000. Concentrations of
submicrometre particles from vehicle emissions near a major road. Atmospheric
Environment 34(1), 51-59.

96
Holmen, B., Chen, Z., Davila, A., Gao, O., Vikara, D.M. 2005. Particulate matter
emissions from Hybrid Diesel-electric and Conventional Diesel Transit Buses:
Fuel and Aftertreatment Effects. The University of Connecticut Report No. JHR
05-304.
Holmes, N.S., Morawska, L., Mengersen, K., Jayaratne, E.R., 2005. Spatial
distribution of submicrometre particles and CO in an urban microscale
environment. Atmospheric Environment 39(22), 3977-3988.
Hoppel, W. A., Larson, R., Vietti, M.A., 1990. Aerosol size distributions and
optical boundaries found in the marine boundary layer over the Atlantic Ocean
Journal of Geophysical Research 95(D4), 3659-3686.
Hueglin, C., Buchmann, B., Weber, R.O., 2006. Long-term observation of real-
world road traffic emission factors on a motorway in Switzerland. Atmospheric
Environment 40(20), 3696-3709.
Hussein, T., Hameri, K., Heikkinen, M., Kulmala, M., 2005. Indoor and outdoor
particle size characterisation at a family house in Espoo, Finland. Atmospheric
Environment 39, 3697-3709.
Hussein, T., Hameri, K. A., Aalto, P.P., Paatero, P., Kulmala, M., 2005. Modal
structure and spatial-temporal variations of urban and suburban aerosols in
Helsinki - Finland. Atmospheric Environment, 1655-1668.

97
Hussein, T., Puustinen, A., Aalto, P., Makela, J., Hameri, K., Kulmala, M., 2004.
Urban Aerosol Number Size Distributions. Atmospheric Chemistry and Physics
Discussions 4, 391-411.
Imhof, D., Weingartner, E., Ordonez, C., Gehrigt, R., Hill, N., Buchmann, B.,
Baltensperger, U., 2005. Real-world emission factors of fine and ultrafine aerosol
particles for different traffic situations in Switzerland. Environmental Science &
Technology 39(21), 8341-8350.
Imhof, D., Weingartner, E., Prevot, A., Ordonez, C., Kurtenbach, R., Wiesen, P.,
Rodler, J., Sturm, P., McCrae, I., Sjodin, A., Baltersperger, U., 2005. Aerosol and
NOx Emission Factors and Submicron Particle Number Size Distributions in Two
Road Tunnels with Different Traffic Regimes. Atmospheric Chemistry and
Physics Discussions 5, 5127-5166.
Imhof, D., Weingartner, E., Vogt, U., Dreiseidler, A., Rosenbohm, E., Scheer, V.,
Vogt, R., Nielsen, O. J., Kurtenbach, R., Corsmeier, U., Kohler, M.,
Baltensperger, U., 2005. Vertical distribution of aerosol particles and NOx close
to a motorway. Atmospheric Environment 39(31), 5710-5721.
Jaenicke, R., 1993. Tropospheric Aerosols. San Diego, USA, Academic Press.
Jamriska, M., Morawska, L., 2000. The effect of surface deposition, coagulation
and ventilation on submicrometer particles indoors. Clean Air and Envirionment
Conference, Sydney, Australia, 26-30 November 2000.

98
Jamriska, M., Morawska, L., 2001. A model for determination of motor vehicle
emission factors from on-road measurements with a focus on submicrometer
particles. Science of the Total Environment 264(3), 241-255.
Jamriska, M., Morawska, L., 2003. Quantitative Assessment of the Effect of
Surface Deposition and Coagulation on the Dynamics of Submicrometer Particles
Indoors. Aerosol Science and Technology 37(5), 425 - 436.
Jamriska, M., Morawska, L., Thomas, S., Congrong, H., 2004. Diesel Bus
Emissions Measured in a Tunnel Study. Environmental Science & Technology
38(24), 6701-6709.
Jayaratne, E.R., Ristovski, Z.D., Meyer, N., Morawska, L., 2008. Particle and
Gaseous Emissions from Compressed Natural Gas and Ultralow Sulphur Diesel-
Fuelled Buses at Four Steady Engine Loads. Submitted to Science of the Total
Environment. .
Jayaratne, E.R., Verma, T.S., 2001. The impact of biomass burning on the
environmental aerosol concentration in Gaboroen, Botswana Atmospheric
Environment 35, 1821-1828.
John, W., 1993. The characteristics of environmental and laboratory generated-
aerosols, in: Willeke and Baron (Eds.), Aerosol measurement: Principles,
techniques and applications,Van Nostrand Reinhold, New York. 55.

99
Johnson, J.P., Kittelson, D.B., Watts, W.F., Source apportionment of diesel and
spark ignition exhaust aerosol using on-road data from the Minneapolis
metropolitan area. Atmospheric Environment, 2111-2121.
Johnson, J.P., Kittelson, D. B., Watts, W.F., 2005. Source apportionment of diesel
and spark ignition exhaust aerosol using on-road data from the Minneapolis
metropolitan area. Atmospheric Environment 39(11), 2111-2121.
Jones, A.M., Harrison, R.M. 2006. Estimation of the emission factors of particle
number and mass fractions from traffic at a site where mean vehicle speeds vary
over short distances. Atmospheric Environment 40(37), 7125-7137.
Kado, N. Y., Okamoto, R. A., Kuzmicky, P. A., Kobayashi, R., Ayala, A., Gebel,
M. E., Rieger, P. L., Maddox, C., Zafonte, L., 2005. Emissions of toxic pollutants
from compressed natural gas and low sulfur diesel-fueled heavy-duty transit buses
tested over multiple driving cycles. Environmental Science & Technology 39(19),
7638-7649.
Kern, J.M., 2000. Inventory and prediction of heavy-duty diesel vehicle
emissions. United States -- West Virginia, West Virginia University.
Ketzel, M., Berkowicz, R., 2004. Modelling the fate of ultrafine particles from
exhaust pipe to rural background: an analysis of time scales for dilution,
coagulation and deposition. Atmospheric Environment 38(17), 2639-2652.

100
Ketzel, M., Wahlin, P., Berkowicz, R., Palmgren, F., 2003. Particle and trace gas
emission factors under urban driving conditions in Copenhagen based on street
and roof-level observations. Atmospheric Environment 37(20), 2735-2749.
Ketzel, M., Wahlin, P., Kristensson, A., Swietlicki, E., Berkowicz, R., Nielsen, O.
J., Palmgren, F., 2004. Particle size distribution and particle mass measurements
at urban, near-city and rural level in the Copenhagen area and Southern Sweden.
Atmospheric Chemistry and Physics 4, 281-292.
Keywood, M.D., Ayers, G. P., Gras, J.L., Gillett, R.W., Cohen, D.D. 1999.
Relationships between size segregated mass concentration data and ultrafine
particle number concentrations in urban areas. Atmospheric Environment 33(18),
2907-2913.
Khlystov, A., Kos, G.P.A., Ten Brink, H.M., Mirme, A., Tuch, T., Roth, C.,
Kreyling, W.G. 2001. Comparability of three spectrometers for monitoring urban
aerosol. Atmospheric Environment 35(11), 2045-2051.
Kirchstetter, T.W., Harley, R.A., Kreisberg, N.M., Stolzenberg, M.R., Hering,
S.V., 1999. On-road measurement of fine particle and nitrogen oxide emissions
from light- and heavy-duty motor vehicles. Atmospheric Environment 33, 2955-
2968.

101
Kittelson, D., 1998. Engines and Nanoparticles: a Review. Journal of Aerosol
Science 29(5), 575-588.
Kittelson, D., Johnson, J., Watts, W. F., Wei, Q., Drayton, M., Paulsen, D.,
Bukowiecki, N., 2000. Diesel aerosol sampling in the atmosphere. SAE
Technology Paper 2000-01-2212.
Kittelson, D.B., 1998. Engines and nanoparticles: a review. Journal of Aerosol
Science 29(5-6), 575-588.
Kittelson, D.B., Watts, W.F., Johnson, J., 2002. Diesel aerosol sampling
methodology. CRC E-43 Final report.
Kittelson, D.B., Watts, W.F., Johnson, J.P., 2004. Nanoparticle emissions on
Minnesota highways. Atmospheric Environment 38(1), 9-19.
Kousa, A., Kukkonen, J., Karppinen, A., Aarnio, P., Koskentalo, T., 2002. A
model for evaluating the population exposure to ambient air pollution in an urban
area. Atmospheric Environment 36(13), 2109-2119.
Kristensson, A., Johansson, C., Westerholm, R., Swietlicki, E., Gidhagen, L.,
Wideqvist, U., Vesely, V., 2004. Real-world traffic emission factors of gases and
particles measured in a road tunnel in Stockholm, Sweden. Atmospheric
Environment 38(5), 657-673.
102
Kukkonen, J., Bozo, L., Palmgren, F., Sokhi, R.S., 2003. Particulate matter in
urban air. Air Quality in Cities. Berlin, Springer-Verlag, Berlin 91-120.
Lancaster, M.J., Booker, D.R., 1998. Sampling concentrated aerosols diluter
design for ultrafine particles. Journal of Aerosol Science 29(Supplement 1), 333-
334.
Lanni, T., Frank, B. P., Tang, S., Rosenblatt, D., Lowell, D., 2003. Performance
and Emissions Evaluation of Compressed Natural Gas and Clean Diesel Buses at
New York City's Metropolitan Transit Authority. SAE 2003-01-0300.
Lighty, J.S., Veranth, J.M., Sarofim, A.F., 2000. Combustion Aerosols: Factors
Governing Their Size and Composition and Implications to Human Health.
Journal of the Air & Waste Management Association 50, 1565-1618.
Lowell, D.M., Parsley, W., Bush, C., Zupo, D.. 2003. Comparison of Clean Diesel
buses to CNG Buses. 9th Diesel Engine Emissions Reduction (DEER) Workshop,
Newport, RI, USA, 24-28 August.
Lundgren, D.A., Burton, R.M., 1995. Effect of particle size distribution on the cut
point between fine and coarse ambient mass fractions. Inhalation Toxicology
7(1 ), 131-148.

103
Macharis, C., Mierlo, J. van .Bossche, P. van den., 2007. Transportation Planning
and Technology. Combining Intermodal Transport With Electric Vehicles:
Towards More Sustainable Solutions 30(2-3), 311-323.
Magari, S.R., Hauser, R., Schwartz, J., Williams, P. L., Smith, T. J., Christiani,
D.C., 2001. Association of heart rate variability with occupational and
environmental exposure to particulate air pollution. Circulation 104(9), 986-991.
Makela, J., Koponen, I., Aalto, P., Kulmala, M., 2000. One Year Data of
Submicron Size Modes of Tropospheric Background Aerosols in Southern
Finland. Journal of Aerosol Science 31, 595-611.
Mark, D., Yin, J., Harrison, R., Booker, J., Moorcroft, S., 1998. Measurements of
PM10, PM2.5 particles at four outdoor sites in the UK. Journal of Aerosol Science
29(Supplement 1), 95-96.
Marshall, I.A., Booker, D.R., 1998. An aerosol concentration standard. Journal of
Aerosol Science 29(1-2), 227.
Mazzoleni, C., Kuhns, H. D., Moosmuller, H., Keislar, R.E., Barber, P.W.,
Robinson, N.F., Watson, J.G., 2004. On-road vehicle particulate matter and
gaseous emission distributions in Las Vegas, Nevada, compared with other areas.
Journal of the Air & Waste Management Association 54(6), 711-726.

104
McGregor, F., Ferreira, L., Morawska, L., 2003. Modelling of sub-micrometer
particle concentrations in free-flowing freeway traffic, Brisbane, Australia: some
empirical results. Transportation Research Part D: Transport and Environment
8(3), 229-241.
Mensink, C., De Vlieger, I., Nys, J., 2000. An urban transport emission model for
the Antwerp area. Atmospheric Environment 34(27), 4595-4602.
Meszaros, A., 1977. On the size distribution of atmospheric aerosol particles of
different composition. Atmospheric Environment 11(1075-1081).
Miller, T.L., Davis, W. T., Reed, G.D., Doraiswamy, P., Tang, A., Sanhueza, P.,
2001. Corrections to mileage accumulation rates for older vehicles and the effect
an air pollution emissions. Energy, Air Quality, and Fuels 2001, 49-55.
Mobley, J.D., Cadle, S.H., 2004. Innovative Methods for Emission Inventory
Development and Evaluation: Workshop Summary. Journal of the Air & Waste
Management Association 54, 1422-1439.
Mohr, M., Lehmann, U., Rutter, J., 2005. Comparison of mass-based and non-
mass-based particle measurement systems for ultra-low emissions from
automotive sources. Environmental Science & Technology 39(7), 2229-2238.

105
Monkkonen, P., Koponen, I., Lehtinen, K., Hameri, K., Uma, R., Kulmala, M.,
2005. Measurements in a highly polluted Asian mega city: Observations of
aerosol number size distribution, modal parameters and nucleation events.
Atmospheric Chemistry and Physics 5, 57-66.
Moosmuller, H., Arnott, W. P., Rogers, C. F., Bowen, J.L., Gillies, J.A., Pierson,
W. R., Collins, J.F., Durbin, T.D., Norbeck, J.M., 2001. Time resolved
characterization of diesel particulate emissions. 1. Instruments for particle mass
measurements. Environmental Science & Technology 35(4), 781-787.
Morawska, L., Salthammer, T., 2003. Chapter 3: Motor Vehicle Emissions as a
Source of Indoor Particles in, Morawska-Salthammer (eds). Indoor Environment,
Wiley-VCH, 297-318.
Morawska, L., 2004. Indoor particles, combustion products and fibres, The
Handbook of Environmental Chemistry. Springer-Verlag Heidelberg.
Morawska, L., Zhang, J. 2002. Combustion sources of particles. 1. Health
relevance and source signatures. Chemosphere 49(9), 1045-1058.
Morawska, L., Bofinger, N.D., Kocis, L., Nwankwoala, A., 1998. Submicrometer
and supermicrometer particles from diesel vehicle emissions. Environmental
Science & Technology 32(14), 2033-2042.

106
Morawska, L., Ferreira, L., Thomas, S., Jamriska, M., McGregor, F., 2004.
Quantification and modelling of particle emissions from motor vehicles in urban
environment: Final Report. Queensland University of Technology, Brisbane.
Morawska, L., Jamriska, M., Thomas, S., Ferreira, L., Mengersen, K., Wraith, D.,
McGregor, F., 2005. Quantification of particle number emission factors for motor
vehicles from on-road measurements. Environmental Science & Technology
39(23), 9130-9139.
Morawska, L., Jayaratne, E.R., Mengersen, K., Jamriska, M., Thomas, S., 2002.
Differences in airborne particle and gaseous concentrations in urban air between
weekdays and weekends. Atmospheric Environment 36(27), 4375-4383.
Morawska, L., Johnson, G., Ristovski, Z.D., Agranovski, V., 1999. Relation
between particle mass and number for submicrometer airborne particles.
Atmospheric Environment 33(13), 1983-1990.
Morawska, L., Keogh, D. U., Thomas, S. B., Mengersen, K., 2008. Modality in
ambient particle size distributions and its potential as a basis for developing air
quality regulation. Atmospheric Environment 42(7), 1617-1628.
Morawska, L., Moore, M., Ristovski, Z., 2004. Health impacts of ultrafine
particles: Desktop literature review and analysis. Canberra, Department of
Environment and Heritage.

107
Morawska, L., Ristovski, Z., Ayoko, G.A., Jayaratne, E.R., Lim, M., 2001. Report
of a short investigation of emissions from diesel vehicles operating on low and
ultralow sulphur content fuel. Prepared for BP Australia by Queensland
University of Technology. Queensland University of Technology, Brisbane.
Morawska, L., Ristovski, Z., Jayaratne, E. R., Keogh, D. U., Ling, X., 2008.
Ambient nano and ultrafine particles from motor vehicle emissions:
characteristics, ambient processing and implications on human exposure
Submitted to Atmospheric Environment.
Morawska, L., Salthammer, T., 2003. Motor vehicle emissions as a source of
indoor particles. Indoor Environment, Airborne Particles and Settled Dust. L.
Morawska and T. Salthammer. Weinheim, Germany, Wiley-VCH.
Morawska, L., Schwela, D., 1998. Airborne particles and health implications:
Directions for the future. Journal of Aerosol Science 29(Supplement 1), 167.
Morawska, L., Thomas, S., Bofinger, N.D., Wainwright, D., Neale, D., 1998.
Comprehensive characterisation of aerosol in a subtropical urban atmosphere:
particle size distribution and correlation with gaseous pollutants. Atmospheric
Environment 32, 2467-2478.
Morawska, L., Thomas, S., Jamriska, M., Johnson, G., 1999. The modality of
particle size distributions of environmental aerosols. Atmospheric Environment
33(27), 4401-4411.

108
Morawska, L., Zhang, J., 2002. Combustion sources of particles. 1. Health
relevance and source signatures. Chemosphere 49(9), 1045-1058.
Murray, A.T., Davis, R., Stimson, R.J., Ferreira, L., 1998. Public Transportation
Access. Transportation Research Part D: Transport and Environment 3(5), 319-
328.
Nanzetta, M.K., Holmen, B.A., 2004. Roadside particle number, distributions and
relationships between number concentrations, meteorology, and traffic along a
northern California freeway. Journal of the Air & Waste Management Association
54(5), 540-554.
Nazaroff, W., Ligocki, M., Ma, T., Cass, C., 1990. Particle Deposition in
Museums, Comparison of Modelling and Measurement Results. Aerosol Science
& Technology 13(332-348).
NEPC., 2000. Proposed Diesel Vehicle Emissions National Environment
Protection Measure Preparatory Work, In-Service Emissions Performance - Phase
2: Vehicle Testing, NEPC, Adelaide, November.
Neususs, C., Wex, H., Birmili, W., Wiedensohler, A., Koziar, C., Busch, B.,
Bruggemann, E., Gnauk, T., Ebert, M., Covert, D.S., 2002. Characterization and
parameterization of atmospheric particle number-, mass, and chemical-size
distributions in central Europe during LACE 98 and MINT - art. no. 8127. Journal
of Geophysical Research - Atmospheres 107(D21), 8127.

109
Nichols, A., Read, P., Booker, D., 1998. Valid analytical measurements:
particulates and aerosols. Journal of Aerosol Science 29(Supplement 2), S863-
S864.
Nielsen, O.A., Knudsen, M.A., 2006. Uncertainty in traffic models. European
Transport Conference Strasbourg, France
Niemeier, D.A., Zheng, Y., Kear, T., 2004. UCDrive: a new gridded mobile
source emission inventory model. Atmospheric Environment 38(2), 305-319.
NPI (National Pollutant Inventory), Department of the Environment, Water, Heritage and the Arts, Australian Government, http://www.npi.gov.au/index.html Date verified 1 July 2008.
Ntziachristos, L., Samaras, Z., Eggleston, S., Goriben, N., Hassel, D., Hickman,
A.J., Joumard, R., Rijkeboer, R., White, L., Zierock, K.H., 2000. COPERT III
Computer programme to calculate emissions from road transport: methodology
and emission factors (version 2.1). Technical report prepared by the European
Environment Agency, Copenhagen, Report 49.
O'Dowd, C., Becker, E., Kulmala, M., 2001. Mid-Latitude North-Atlantic Aerosol
Characteristics in Clean and Polluted Air. Atmospheric Research 58, 167-185.

110
Oberdoerster, G., Ferin, J., Finkelstein, G., Wade, P., Corson, N., 1990. Increased
pulmonary toxicity of ultrafine particles? II. Lung lavage studies. Journal of
Aerosol Science 21(3), 384-387.
Oberdoerster, G., Sharp, Z., Atudorei, V., Elder, A., Gelein, R., Kreyling, W.,
Cox, C., 2004. Translocation of inhaled ultrafine particles to the brain. Inhalation
Toxicology 16, 437-445.
Office of Urban Management, 2004. Draft South East Queensland Regional Plan:
For Consultation. Brisbane Department of Local Government, Planning, Sport &
Recreation, Queensland Government.
Ortuzar, J. de., Willumsen, L.G., 2001. Modelling Transport. John Wiley & Sons
Inc
Paatero, P., Aalto, P., Picciotto, S., Bellander, T., Castano, G., Cattani, G., Cyrys,
J., Kulmala, M., Lanki, T., Nyberg, F., 2005. Estimating time series of aerosol
particle number concentrations in the five HEAPSS cities on the basis of
measured air pollution and meteorological variables. Atmospheric Environment
39(12), 2261-2273.
Pakkanen, T.A., Kerminen, V.M., Loukkola, K., Hillamo, R. E., Aarnio, P.,
Koskentalo, T., Maenhaut, W., 2003. Size distributions of mass and chemical
components in street-level and rooftop PM1 particles in Helsinki. Atmospheric
Environment 37(12), 1673-1690.
111
Pakkanen, T.A., Kerminen, V.M., Korhonen, C.H., Hillamo, R.E., Aarnio, P.,
Koskentalo, T., Maenhaut, W., 2001. Urban and rural ultrafine (PM0.1) particles
in the Helsinki area. Atmospheric Environment 35(27), 4593-4607.
Parkhurst, G., 2004. Air quality and the environmental transport policy discourse
in Oxford. Transportation Research Part D: Transport and Environment 9(6), 419-
436.
Parrish, D.D., 2006. Critical evaluation of US on-road vehicle emission
inventories. Atmospheric Environment 40(13), 2288-2300.
Peace, H., Owen, B., Raper, D.W., 2004. Comparison of road traffic emission
factors and testing by comparison of modelled and measured ambient air quality
data. Science of The Total Environment 334-335, 385-395.
Pirjola, L., Parviainen, H., Hussein, T., Valli, A., Hameri, K., Aalto, P., Virtanen,
A., Keskinen, J., Pakkanen, T., Makela, J., Hillamo, R., 2004. "Sniffer" - A novel
tool for chasing vehicles and measuring traffic pollutants. Atmospheric
Environment 38, 3625-3635.
Pohjola, S. K., Savela, K., Kuusimaki, L., Kanno, T., Kawanishi, M., Weyand, E.,
2004. Polycyclic aromatic hydrocarbons of diesel and gasoline exhaust and DNA
adduct detection in calf thymus DNA and lymphocyte DNA of workers exposed
to diesel exhaust. Polycyclic Aromatic Compounds 24(4-5), 451-465.

112
Pokharel, S.S., Bishop, G.A., Stedman, D.H., 2002. An on-road motor vehicle
emissions inventory for Denver: an efficient alternative to modeling. Atmospheric
Environment 36(33), 5177-5184.
Pope, C.A., Burnett, R.T., Thun, M.J., Calle, E.E., Krewski, D., Ito, K., Thurston,
G.D., 2002. Lung cancer, cardiopulmonary mortality, and long-term exposure to
fine particulate air pollution. Journal of the American Medical Association
287(9), 1132-1141.
Pope, C.A., Dockery, D.W., 2006. Health Effects of Fine Particulate Air
Pollution: Lines that Connect. Journal of the Air & Waste Management
Association 56(6), 709-732.
Pope, C. A., Burnett, R. T., Thun, M. J., Calle, E. E., Krewski, D., Ito, K.,
Thurston, G. D., 2002. Lung cancer, cardiopulmonary mortality, and long-term
exposure to fine particulate air pollution. Journal of the American Medical
Association 287(9), 1132-1141.
Porter, J.N., Clarke, A.D., 1997. Aerosol size distribution models based on in situ
measurements. Journal of Geophysical Research 102(D5), 6035-6045.
113
Querol, X., Alastuey, A., de la Rosa, J., Sanchez-de-la-Campa, A., Plana, F.,
Ruiz, C. R., 2002. Source apportionment analysis of atmospheric particulates in
an industrialised urban site in southwestern Spain. Atmospheric Environment
36(19), 3113-3125.
Reddy, M. S., Venkataraman, C., 2002. Inventory of aerosol and sulphur dioxide
emissions from India: I--Fossil fuel combustion. Atmospheric Environment 36(4),
677-697.
Reynolds, A.W., Broderick, B. M., 2000. Predicting real-time traffic-related PM10
and PM2.5 emissions and concentrations in urban areas. Journal of Aerosol
Science 31(Supplement 1), 250-251.
Ristovski, Z., Jayaratne, E.R., Lim, M., Ayoko, G.A., Morawska, L., 2006.
Influence of diesel fuel sulphur on the nanoparticle emissions from city buses
Environmental Science & Technology 40, 1314-1320.
Ristovski, Z., Morawska, L., Ayoko, G. A., Johnson, G., Gilbert, D., Greenaway,
C., 2004. Emissions from a vehicle fitted to operate on either petrol or
compressed natural gas. Science of The Total Environment 323(1-3), 179-194.
Ristovski, Z.D., Jayaratne, E.R., Morawska, L., Ayoko, G. A., Lim, M., 2005.
Particle and carbon dioxide emissions from passenger vehicles operating on
unleaded petrol and LPG fuel. Science of The Total Environment 345(1-3), 93-98.

114
Ristovski, Z.D., Morawska, L., 1998. Emission of submicrometer particles from
spark ignition vehicles. Journal of Aerosol Science 29(Supplement 2), S1001-
S1002.
Ristovski, Z.D., Morawska, L., Ayoko, G. A., Jayaratne, E. R., Lim, M., 2002.
Final report of a comparative investigation of particle and gaseous emissions from
twelve in-service B.C.C. buses operating on 50 and 500 ppm sulphur diesel fuel.
Queensland University of Technology, Brisbane.
Ristovski, Z.D., Morawska, L., Bofinger, N.D., Hitchins, J., 1998. Submicrometer
and supermicrometer particulate emission from spark ignition vehicles.
Environmental Science & Technology 32(24), 3845-3852.
Romilly, P., 1999. Substitution of bus for car travel in urban Britain: an economic
evaluation of bus and car exhaust emission and other costs. Transportation
Research Part D-Transport and Environment 4(2), 109-125.
Rosenbohm, E., Vogt, R., Scheer, V., Nielsen, O., Drieseidler, A., Baumbach, G.,
Imhof, D., Baltensperger, U., Fuchs, J., Jaeschke, W., 2005. Particulate size
distributions and mass measured at a motorway during the BAB II campaign.
Atmospheric Environment 39, 5696-5709.
SAE., 2001. Performance and Durability Evaluation of Continuously
Regenerating Particulate Filters on Diesel powered Urban Transit Buses at NY
City Transit. Society of Automotive Engineers SAE 2001-01-0511.

115
SAE., 2002. Performance and Durability of Continuously Regenerating
Particulate Filters on Diesel powered Urban Transit Buses at NY City Transit -
Part II. Society of Automotive Engineers SAE 2002-01-0430.
SAE., 2002. Speciation of Organic Compounds from the Exhaust of Trucks and
Buses: Effect of Fuel and After-treatment on Vehicle Emission Profiles. Society
of Automotive Engineers SAE 2002-01-2873.
SAE., 2002. Year-Long Evaluation of Trucks and Buses Equipped with Passive
Diesel Diesel Particulate Filters. Society of Automotive Engineers SAE 2002-01-
0433.
SAE., 2003. Oxidation catalyst effect on CBG Transit Bus Emissions. Society of
Automotive Engineers SAE 2003-01-1900.
SAE., 2003. Performance and Emissions Evaluation of Compressed Natural Gas
and Clean Diesel Buses at New York City's Metropolitan Transit Authority.
Society of Automotive Engineers SAE 2003-01-0300.
Salma, I., Dal Maso, M., Kulmala, M., Zaray, G., 2002. Modal characteristics of
particulate matter in urban atmospheric aerosols. Microchemical Journal 73, 19-
26.

116
Salma, I., Ocskay, R., Raes, N., Maenhaut, W., 2005. Fine structure of mass size
distributions in an urban environment. Atmospheric Environment 39(29), 5363-
5374.
Scheffe, H., 1959. The Analysis of Variance, John Wiley & Sons, Inc.
Schifter, I., Diaz, L., Mugica, V., Lopez-Salinas, E., 2005. Fuel-based motor
vehicle emission inventory for the metropolitan area of Mexico city. Atmospheric
Environment 39(5), 931-940.
Schmid, H., Pucher, E., Ellinger, R., Biebl, P., Puxbaum, H., 2001. Decadal
reductions of traffic emissions on a transit route in Austria - results of the
Tauerntunnel experiment 1997. Atmospheric Environment 35(21), 3585-3593.
Seaton, A., MacNee, W., Donaldson, K., Godden, D., 1995. Particulate air
pollution and acute health effects. Lancet 345, 176-178.
Sem, G.J., 2002. Design and performance characteristics of three continuous-flow
condensation particle counters: a summary. Atmospheric Research 62(3-4), 267-
294.
SEQHTS., 2003-2004. South-East Queensland Household Travel Survey
(SEQHTS) (Brisbane, Gold Coast and Sunshine Coast Area). Brisbane
Queensland Transport

117
Shah, S.D., Cocker, D.R., Miller, J. W., Norbeck, J.M., 2004. Emission rates of
particulate matter and elemental and organic carbon from in-use diesel engines.
Environmental Science & Technology 38(9), 2544-2550.
Sharma, M., Agarwal, A. K., Bharathi, K.V.L., 2005. Characterization of exhaust
particulates from diesel engine. Atmospheric Environment 39(17), 3023-3028.
Shi, J., Evans, D., Khan, A., Harrison, R., 2001. Sources and Concentration of
Nanoparticles ( < 10 nm Diameter) in the Urban Atmosphere. Atmospheric
Environment 35, 1193-1202.
Shi, J., Harrison, R.M., 1999. Investigation of ultrafine particle formation during
diesel exhaust dilution Environmental Science & Technology 33, 3730-3736.
Shi, J.P., Khan, A.A., Harrison, R.M., 1999. Measurements of ultrafine particle
concentrations and size distribution in the urban atmosphere The Science of the
Total Environment 235, 51-64.
SKM (Sinclair Knight Merz), 2006. Twice the Task: A review of Australia's
freight transport tasks. Melbourne, Victoria, National Transport Commission.
Shifter, I., Diaz, L., Mugica, V., Lopez-Salinas, E., 2005. Fuel-based motor
vehicle emission inventory for the metropolitan area of Mexico city. Atmospheric
Environment 39(5), 931-940.

118
Smit, R., Smokers, R., Rabe, E., 2007. A new modelling approach for road traffic
emissions: VERSIT+. Transportation Research Part D-Transport and
Environment 12, 414-422.
Sokhi, R.S., 2005. Fourth international conference on urban air quality--
measurement, modelling and management, 25-28 March 2003, Prague, Czech
Republic. Atmospheric Environment 39(15), 2695-2696.
Somers, C.M., McCarry, B.E., Malek, F., Quinn, J.S., 2004. Reduction of
particulate air pollution lowers the rist of heritable mutations in mice. Science,
1008-1010.
Stedman, J.R., Linehan, E., Conlan, B., 2000. Receptor modelling of PM10
concentrations at a United Kingdom national network monitoring site in central
London. Atmospheric Environment 35(2), 297-304.
Sturm, P. J., Baltensperger, U., Bacher, M., Lechner, B., Hausberger, S., Heiden,
B., Imhof, D., Weingartner, E., Prevot, A.S.H., Kurtenbach, R., Wiesen, P., 2003.
Roadside measurements of particulate matter size distribution. Atmospheric
Environment 37, 5273-5281.
Sturm, P.J., Pucher, K., Sudy, C.Almbauer, R.A., 1996. Determination of traffic
emissions--intercomparison of different calculation methods. Science of The
Total Environment 189-190, 187-196.
119
Sundqvist, K. L., Wingfors, H., Brorstom-Lunden, E., Wiberg, K., 2004. Air-sea
gas exchange of HCHs and PCBs and enantiomers of [alpha]-HCH in the Kattegat
Sea region. Environmental Pollution 128(1-2), 73-83.
Swiss Agency for the Environment, Forests and Landscape (SAEFL), 2004. Air
Pollutant emissions from Road Transport 1980-2030 Environmental Series No.
355. Berne SAEFL.
Thomas, S., Morawska, L., 2002. Size-selected particles in an urban atmosphere
of Brisbane, Australia. Atmospheric Environment 36(26), 4277-4288.
TNO., 1997. Particulate Matter Emissions (PM10, PM2.5, PM<0.1) in Europe in
1990 and 1993, TNO Report TNO-MEP-R96/472. Netherlands.
Tran, T. V., Ng, Y. L., Denison, L., 2003. Emission Factors for In-Service
Vehicles Using Citylink Tunnel. Proceedings of the National Clean Air
Conference, Newcastle.
Translink, 2007. Bus patronage and bus fleet statistics. Queensland Transport,
Brisbane.
Tuch, T., Mirme, A., Tamm, E., Heinrich, J., Heyder, J., Brand, P., Roth, C.,
Wichmann, H.E., Pekkanen, J., Kreyling, W.G., 2000. Comparison of two
particle-size spectrometers for ambient aerosol measurements. Atmospheric
Environment 34(1), 139-149.

120
Tunved, P., Nilsson, E., Hansson, H., Strom, J., 2005. Aerosol characteristics of
air masses in Northern Europe: Influences of location, transport, sinks and
sources. Journal of Geophysical Research - Atmospheres 110(D7), 7201.
Ubanwa, B., Burnette, A., Kishan, S., Fritz, S.G., 2003. Exhaust particulate matter
emission factors and deterioration rate for in-use motor vehicles. Journal of
Engineering for Gas Turbines and Power-Transactions of the Asme 125(2), 513-
523.
Unal, A., Frey, H. C., Rouphail, N.M., 2004. Quantification of Highway Vehicle
Emissions Hot Spots based on on-board measurements. Journal of the Air &
Waste Management Association 54, 130-140.
USEPA., 1993. User's Guide to MOBILE5A, Mobile source emissions factor
model, U.S. Environmental Protection Agency.
USEPA., 1995. Compilation of Air Pollutant Emission Factors, 5th edn, AP-42,
North Carolina.
USEPA., 2004. Air quality criteria for particulate matter. Washington DC, US
Environmental Protection Agency, 600/P-99/002aF-bF.

121
Van Dingenen, R., Putaud, J. P., Martins-Dos Santos, S., Raes, F., 2005. Physical
aerosol properties and their relation to air mass origin at Monte Cimone (Italy)
during the first MINATROC campaign. Atmospheric Chemistry and Physics 5,
2203-2226.
Vardoulakis, S., Gonzalez-Flesca, N., Fisher, B. E. A., Pericleous, K., 2005.
Spatial variability of air pollution in the vicinity of a permanent monitoring
station in central Paris. Atmospheric Environment 39(15), 2725-2736.
Vedal, S., 1997. Ambient particles and health: lines that divide. Journal of the Air
& Waste Management Association 47, 551-581.
Venkatram, A., Fitz, D., Bumiller, K., Du, S. M., Boeck, M., Ganguly, C., 1999.
Using a dispersion model to estimate emission rates of particulate matter from
paved roads. Atmospheric Environment 33(7), 1093-1102.
Vogt, R., Kirchner, U., Scheer, V., Hinz, K. P., Trimborn, A., Spengler, B., 2003.
Identification of diesel exhaust particles at an Autobahn, urban and rural location
using single-particle mass spectrometry. Journal of Aerosol Science 34(3), 319-
337.
Wahlin, P., Palmgren, F., Van Dingenen, R., 2001. Experimental studies of
ultrafine particles in streets and the relationship to traffic Atmospheric
Environment 35, S63-S69.

122
Walker, J. L., Li, J., Srinivasan, S., Bolduc, D., 2008. Travel Demand Models in
the Developed World: Correcting for Measurement Errors Transportation
Research Board 87th Annual Meeting Washington.
Watson, J.G., Chow, J. C., Houck, J.E., 2001. PM2.5 chemical source profiles for
vehicle exhaust, vegetative burning, geological material, and coal burning in
Northwestern Colorado during 1995. Chemosphere 43(8), 1141-1151.
Watson, J.G., Zhu, T., Chow, J.C., Engelbrecht, J., Fujita, E. M., Wilson, W.E.,
2002. Receptor modeling application framework for particle source
apportionment. Chemosphere 49(9), 1093-1136.
Wayne, W.S., Clark, N.N., Nine, R.D., Elefante, D., 2004. A comparison of
emissions and fuel economy from hybrid-electric and conventional-drive transit
buses. Energy & Fuels 18(1), 257-270.
Wehner, B., Birmili, W., Gnauk, T., Wiedensohler, A., 2002. Particle number size
distributions in a street canyon and their transformation into the urban-air
background: measurements and a simple model study. Atmospheric Environment
36(13), 2215-2223.
Weijers, E.P., Khlystov, A. Y., Kos, G.P.A., Erisman, J.W., 2004. Variability of
particulate matter concentrations along roads and motorways determined by a
moving measurement unit. Atmospheric Environment 38(19), 2993-3002.

123
Weingartner, E., Nyeki, S., Baltensperger, U., 1999. Seasonal diurnal variation of
aerosol size distribution (10<D<750 nm) at a high-alpine site. Journal of
Geophysical Research - Atmospheres 104(D21), 26809-26820.
WHO., 2005. Guidelines for Air Quality. World Health Organization, Geneva.
Wiedensohler, A., Wehner, B., Birmili, W., 2002. Aerosol number concentrations
and size distributions at mountain rural, urban-influenced rural and urban-
background sites in Germany. Journal of Aerosol Medicine 15(2), 237-243.
Willeke, K., Baron, P.A., 1993. Aerosol Measurement: Principles, Techniques,
and Applications. John Wiley & Sons, New York.
Wingfors, H., Sjodin, A., Haglund, P., Brorstrom-Lunden, E., 2001.
Characterisation and determination of profiles of polycyclic aromatic
hydrocarbons in a traffic tunnel in Gothenburg, Sweden. Atmospheric
Environment 35(36), 6361-6369.
Winther, M., 1998. Petrol passenger car emissions calculated with different
emission models. Science of the Total Environment 224(1-3), 149-160.
Woo, K.S., 2003. Measurement of atmospheric aerosols: Size distributions of
nanoparticles, estimation of size distribution moments and control of relative
humidity. United States -- Minnesota, University of Minnesota.

124
Wu, Y., Hao, J., Fu, L., Wang, Z.. Tang, U., 2002. Vertical and horizontal profiles
of airborne particulate matter near major roads in Macao, China. Atmospheric
Environment 36(31), 4907-4918.
Xie, S., Yu, T., Zhang, Y., Zeng, L., Qi, L., Tang, X., 2005. Characteristics of
PM10, SO2, NOx and O3 in ambient air during the dust storm period in Beijing.
Science of The Total Environment 345(1-3), 153-164.
Young, L.H., Keeler, G.J., 2004. Characterization of ultrafine particle number
concentration and size distribution during a summer campaign in southwest
Detroit. Journal of the Air & Waste Management Association 54(9), 1079-1090.
Zhang, J. J., Morawska, L., 2002. Combustion sources of particles: 2. Emission
factors and measurement methods. Chemosphere 49(9), 1059-1074.
Zhang, K., 2004. Ambient and Plume Processing of Atmospheric Ultrafine
Particles. PhD Thesis, University of California, Davis.
Zhang, K.M., Wexler, A.S., 2004. Evolution of particle number distribution near
roadways--Part I: analysis of aerosol dynamics and its implications for engine
emission measurement. Atmospheric Environment 38(38), 6643-6653.

125
Zhang, K. M., Wexler, A. S., Niemeier, D. A., Zhu, Y. F., Hinds, W. C., Sioutas,
C., 2005. Evolution of particle number distribution near roadways. Part III:
Traffic, analysis and on-road size resolved particulate emission factors.
Atmospheric Environment 39(22), 4155-4166.
Zhang, K. M., Wexler, A. S., Zhu, Y. F., Hinds, W. C., Sioutas, C., 2004.
Evolution of particle number distribution near roadways. Part II: the 'Road-to-
Ambient' process. Atmospheric Environment 38(38), 6655-6665.
Zhong, M., Hanson, B.L., 2008. GIS-Based Travel Demand Modeling for
Estimating Traffic on Low-Class Roads Transportation Research Board 87th
Annual Meeting Washington
Zhu, Y. 2003. Ultrafine particle and freeways. PhD Thesis, University of
California, Los Angeles.
Zhu, Y., Hinds, W. C., Kim, S., Shen, S., Sioutas, C., 2002. Study of ultrafine
particles near a major highway with heavy-duty diesel traffic. Atmospheric
Environment 36(27), 4323-4335.
Zhu, Y., Hinds, W. C., Kim, S., Shen, S., Sioutas, C., 2004. Study of ultrafine
particles near a major highway with heavy-duty diesel traffic. Atmospheric
Environment 36(27), 4323-4335.

126
Zhu, Y., Hinds, W.C., Kim, S., Sioutas, C., 2002. Concentration and size
distribution of ultrafine particles near a major highway. Journal of the Air &
Waste Management Association 52(9), 1032-1042.
Zhu, Y., Hinds, W.C., Shen, S., Sioutas, C., 2004. Seasonal trends of
concentration and size distribution of ultrafine particles near major highways in
Los Angeles. Aerosol Science & Technology 38(S1), 5-13.
Zhu, Y., Kuhn, T., Mayo, P., Hinds, W.C., 2006. Comparison of daytime and
nighttime concentration profiles and size distributions of ultrafine particles near a
major highway. Environmental Science & Technology 40, 2531-2536.
Zhu, Y.F., Hinds, W.C., 2005. Predicting particle number concentrations near a
highway based on vertical concentration profile. Atmospheric Environment 39(8),
1557-1566.
Zhu, Y.F., Hinds, W.C., Kim, S., Sioutas, C., 2002. Concentration and size
distribution of ultrafine particles near a major highway. Journal of the Air &
Waste Management Association 52(9), 1032-1042.
Zhu, Y. F., Hinds, W.C., Shen, S., Sioutas, C., 2004. Seasonal trends of
concentration and size distribution of ultrafine particles near major highways in
Los Angeles. Aerosol Science and Technology, 5-13.

127
CHAPTER 3. STATISTICAL TECHNIQUES USED IN
THIS THESIS
3.1. INTRODUCTION
This chapter discusses the statistical methods used in this study, their
strengths and limitations, and outlines alternative methods which are
available but were not considered suitable.
The statistical techniques used in this thesis included:-
(i) Kolmogorov-Smirnov (K-S) test (modality paper, Chapter 4)
(ii) Construction of 95% confidence intervals (modality paper, Chapter 4);
(iii) Trapezoidal rule for integration of the area under a curve (modality
paper, Chapter 4);
(iv) Linear regression for continuous variables (emission factor paper,
Chapter 5.1);
(v) Multifactor Analysis of Variance (ANOVA) for categorical variables
(emission factor paper, Chapter 5.1);
(vi) The stepwise selection technique for statistical model selection
(emission factor paper, Chapter 5.1)
(vii) Scheffe’s multiple comparison tests (emission factor paper,
Chapter 5.1).
128
The nature of air quality data
Aerosol particle size distributions are rarely normally distributed (Baron and
Willeke 2001). These distributions have a tendency to tail off as particle size
increases (Ruzer and Harley 2004) and often their standard deviations are large
compared with the mean particle size, a condition not permitted in a non-negative
normal distribution, hence they are described mathematically more effectively by
lognormal distributions (Baron and Willeke 2001). When particle size
distributions measured in ambient and indoor air environments are plotted on a
logarithmic scale, the distribution is approximated by a Gaussian distribution
(bell-shaped or approximately normal) (Baron and Willeke 2001).
Two basic approaches are currently used for determining sources of air pollution,
including particulate matter, the top-down or receptor-based source
apportionment approach, or the bottom-up or source-based method (Guttikunda et
al. 2008). The receptor-based approach is based on the premise that particulate
matter sources often exhibit characteristic profiles or chemical patterns; whereas
with source-based models the pollution sources are identified and then emission
factors are estimated based on source model information (Guttikunda et al. 2008).

129
3.2. STATISTICAL TECHNIQUES USED IN THIS THESIS
3.2.1. Kolmogorov-Smirnov (K-S) test
This method tests for statistically significant differences between two
cumulative distributions at a chosen significance level (Liao 2002), for
example, between measured aerosol particle size distributions. Unlike other non-
parametric tests, such as the Mann Whitney-U test that assess the equality of two
medians, the K-S test assesses the equivalence of the whole distributions. This
type of test is useful for data with non-standard distributions. For normally
distributed data, for example, the mean and standard deviation would be
considered sufficient statistics for the distribution, but this is not the case for
much of the air quality data considered in this thesis.
The use and applicability of the K-S test for comparing aerosol particle size
distributions which are characterised by a large number of sizing channels (or
bins) has been described by Heitbrink et al. (1991). The K-S test is quite effective
if data are assigned to a large number of intervals, generally (n » 10) which have
the same boundaries (Baron and Willeke 2001). The Aerodynamic Particle Sizer
instrumentation has a large number of sizing channels and Heitbrink et al. (1991)
successfully used the K-S test to analyse its particle count data (Baron and
Willeke 2001). Details of the application of the technique for comparison of
aerosol particle size distributions measured by Scanning Mobility Particle Sizer
instrumentation are provided in Morawska et al. (1999).

130
The non-parametric method selected for use was the K-S test, which is
commonly used in aerosol science, and was employed to examine
statistically significant differences between particle size distributions for
different aerosol types (modality paper, Chapter 4).
3.2.2. Construction of 95% confidence intervals
The reliability of a sample statistic as an estimator of a parameter of interest is
commonly expressed in terms of a confidence interval. A 95% confidence
interval for a population mean, for example, is centred around the
sample mean with upper and lower bounds that are determined by the sample
variance, sample size and 5% Type I error rate.
The interpretation of this interval is such that if samples of n size were repeatedly
taken from a population and corresponding confidence intervals were constructed
for each sample, it could be expected that 95% of the intervals between these
limits would contain the true mean (Sokal and Rohlf 2000). These limits, in this
case, are referred to as the lower and upper 95% confidence limits of the mean,
termed confidence interval (Sokal and Rohlf 2000).
Confidence intervals can be used for examining differences in data sets and when
comparing the means of different groups. For example, a lack of overlap between
confidence intervals for different data sets can confirm the existence of groups
with statistically significantly different means. In this thesis 95% confidence
intervals were constructed for data set clusters situated closest to, on either side,

131
of 1µm (Chapter 4), to determine if an overlap existed between these confidence
intervals, and whether these data sets had statistically significantly different
means.
A 95% confidence interval was constructed to examine whether an overlap
existed between particle mode data sets for different particle metrics located
close to 1 µm, either above or below 1 µm (modality paper, Chapter 4).
3.2.3. Trapezoidal rule for integration of the area under a curve
Classical formulas for numerical integration include Simpson’s rule and the
trapezoidal rule (Dyer and Dyer 2008). Simpson’s rule is discussed later in
Section 3.3 under alternative approaches.
The trapezoidal rule is suitable to apply to sections of different widths (Chapra
2002), such as to different particle bin sizes, which represent particle diameter
size ranges used for analysing aerosol measurement data. For example, the
fractional contributions to different particle size ranges can be calculated by
integrating the area under the curve of each particle size range using the
trapezoidal rule, since this rule takes specific account of the different widths of
the x-axis in each bin. The trapezoidal rule may be applied to either the original
data scale or the log transformed data. The area in each bin size is approximated
to be the shape of a trapezium, and the sum of these areas for all bin sizes
provides an approximation of the total area.
132
The trapezoidal rule was selected as the numerical integration method to
estimate the area under the curve relating to different particle size ranges
(modality paper, Chapter 4).
3.2.4. Development of statistical models using linear regression and
ANOVA
When examining the relationship between a response variable and a number of
independent variables, or covariates, regression and ANOVA (Analysis of
Variance) are considered reasonable models (Hosmer and Lemeshow 2000).
Regression methods are commonly used to explain outcome differences for
differing groups (Liao 2002). Model choice can depend on the type of covariates
(categorical or continuous) and aim of the analysis (for example, test of
significant effect of covariates on the response variable or estimation of
magnitude of the effect).
3.2.5. Linear regression for continuous variables
Regression analysis depends on the general assumption that an underlying
deterministic or systematic relationship exists between the response variable and
the covariates (Olden and Jackson 2000).
In a general linear regression model an assumption is made that the residuals are
normally distributed and independently centred around zero with constant
variance. A residual is the difference between the predicted value under the
model and the observed value. Moreover, in the linear regression model, it is

133
assumed that the outcome variable is continuous (Hosmer and Lemeshow 2000).
The response or covariates can be transformed to meet this assumption, or a
generalisation of the regression model can be used eg., logistic regression for
binary responses, generalised linear model for non-normal data or non-linear
models. The significance of the influence of covariates on the response can be
tested using ANOVA, F and t-tests.
Linear regression was used to develop statistical relationships, and
associated ANOVA, F and t-tests were used to assess the statistical
significance of the covariates on the response of interest (ie., emission
factors) (emission factor paper, Chapter 5.1).
3.2.6. Multifactor Analysis of Variance (ANOVA) for categorical
variables
ANOVA (Analysis of Variance) is a general statistical method which tests
complex hypotheses. Two applications of ANOVA were considered in this thesis
(i) to test the equality of multiple group means and (ii) to test the statistical
significance of relationships between covariates and responses in linear regression
(Liao 2002), where the total variation in the response is split into that explained
by the model and the residual variation. Variation within groups and between
groups, variation between the sample means and the inherent variability within
each sample are compared (Devore and Farnum 2005). In multifactor designs, the
interaction between two or more factors can also be examined (Devore and
Farnum 2005).

134
In the ANOVA model an assumption is made that the data are normally
distributed (Hays and Winkler 1970).
Multifactor ANOVA was used to test the statistical significance of
categorical variables in development of the statistical models.
ANOVA was also used for regression analysis (emission factor
paper, Chapter 5.1).
3.2.7. The stepwise selection technique for statistical model selection
The stepwise selection technique alternates between forward selection and
backward elimination (described later in this Chapter) and at each step of forward
inclusion of an appropriate variable, the model then assesses the significance of
all its variables, and those found to be no longer significant are taken out of the
model before the next forward selection step (Olden and Jackson 2000). The
order in which variables are added does not affect the final model. The problem of
multicollinearity can be avoided to some extent using this method, as the model
will check to ensure that the variable/s is needed in the model.

135
The method employed was stepwise selection to identify the best
statistical model (emission factor paper Chapter 5.1).
3.2.8. Scheffe’s multiple comparison tests
ANOVA (see previous section) only tests whether group means are the same, and
if rejected confirms that at least one mean is different from the others but provides
no information as to which mean this is. Often the aim of a study is to identify
which of the means are different, and hence in these cases multiple comparison
methods are used.
In this thesis the multiple comparison tests were unplanned, and comparison tests
were decided upon once the results of the analysis of the statistical models
developed in this study were completed.
Unplanned multiple comparison tests include comparison tests between all
possible pairs of means. There are two main methods for unplanned tests,
Tukey’s and Scheffe. Both methods have their strengths and weaknesses,
however key differences relate to the fact that Scheffe’s method can undertake
multiple comparison for both equal and unequal sample sizes, whereas Tukey’s
method is based on equal sample sizes (Sahai and Ageel 2000). Secondly,
assumptions of homoscedasticity and normality are more critical for Tukey’s as
opposed to Scheffe’s method (Liao 2002).

136
Scheffe’s method is used for multiple comparison tests (Scheffe 1953, 1959). It is
a powerful method that is suitable to use where unplanned contrasts are sought to
be made among means that have been suggested by experimental results, and is
mathematically equivalent to the sum of squares simultaneous test procedure
(Sokal and Rohlf 2000).
Scheffe’s method was used to identify statistically significant differences
between means of subclasses of different categorical variables (emission
factor paper, Chapter 5.1).
3.3. ALTERNATIVE APPROACHES CONSIDERED BUT NOT USED
IN THIS THESIS
The following approaches were considered but were not used in this thesis study.
3.3.1. Principal Component Analysis
Principal component analysis (PCA) and, more generally factor analysis (FA), are
multivariate statistical techniques used in atmospheric science, where variables
with similar characteristics are grouped together into factors, and the techniques
produce a small set of linear combinations, with the aim of retaining as much of
the original information as is possible (Lin et al. 2008).

137
PCA has been widely used in Europe as a receptor model to suggest likely sources
of particulate matter (Viana et al. 2008). For example, PCA has been used to
analyse concentrations of polycyclic aromatic hydrocarbons in Central Taiwan
(Lin et al. 2008) and long term multisite air quality monitoring site data for PM10,
Nox, CO, SO2 and O3 in Birmingham and Athens (Statheropoulos et al. 1998).
The limitations of PCA with respect to the applications and inference have also
been acknowledged. For example, it has been suggested that in terms of
atmospheric data, factor analysis as a method can attempt to extract more
information than really exists (Henry 1987). In addition, a common problem that
has been reported to occur with components or factors is that these can represent
mixtures of emission sources, instead of representing clear, independent source
profiles (Viana et al. 2008). In its favour, Lioy et al. (1989) found that PCA based
on data which is highly time-resolved can lead to resolving more sources.
PCA/FA was not considered a relevant technique for these research objectives, as
the focus in this PhD research was not on identifying lower dimension indices. In
addition, source apportionment techniques require careful inference interpretation.
Statistical techniques used in this thesis study relate to research which focused on
examination of the characteristic modality within particle size distributions as a
possible basis for developing air quality regulation (Chapter 4); and derivation of
a comprehensive set of particle emission factors for different vehicle types that
can be used in transport modelling and health impact assessments of urban fleets
(Chapter 5.1).

138
3.3.2. Non-parametric methods of statistical comparison
Some major non-parametric methods of statistical comparison include
Kolmogorov-Smirnov (K-S) test and the Mann-Whitney U- test (Liao 2002). Non-
parametric test methods that are used for testing the equality of two sample means
differ from the two sample t-test as the latter makes an assumption that the
difference between the two sample means is normally distributed, whereas this
assumption is not made in non-parametric test methods (Liao 2002).
The Mann-Whitney U-test aims to test the equality of medians from two
populations, and this approach can be applied to ranked or ordered nonmetric data
(Liao 2002). This test was considered less powerful than parametric tests or K-S
tests for the type of data encountered in this thesis.
3.3.3. Techniques for integrating the area under a curve
The Simpson’s rule requires that points be equally spaced (Chapra 2002).
Although this rule can be used for either the original data or the log transformed
data, if the data are highly skewed and highly peaked, it may be considered more
effective to use log scale data which requires less adjustment of the bin sizes.
One of the advantages of using the trapezoidal rule is that this method accounts
for the difference in bin size widths. This feature is not available under Simpson’s
rule, hence the trapezoidal rule was the preferred choice. Bin sizes can vary for
data on the linear scale or log transformed scale, especially for highly skewed
data, such as particle diameters. This can lead to different estimates of area, even

139
under monotone transformation of the data. This concern motivated the choice of
the trapezoidal rule over the Simpson’s rule.
3.3.4. Techniques for selecting variables in statistical model development
Possible approaches for inclusion or exclusion of significant variables in the
development of statistical models include forward selection, backward
elimination and stepwise selection. The forward selection and backward
elimination methods do not allow variables to be added back into a model for
evaluation, however with the stepwise technique variables are able to be added
back into the model for evaluation.
The forward selection technique adds each possible predictor variable in turn to
the model and the most statistically significant, if available, are included in the
model, until no variables remain that are statistically significant (Olden and
Jackson 2000).
The backward elimination technique begins with a model that contains all the
possible predictor variables and the variable that is least significant is deleted,
one by one, until none of the variables are left which are statistically
non-significant (Olden and Jackson 2000).
Often, but not always, all three approaches produce identical models. It is
important to note that under any approach, the model is chosen on the basis of
goodness of fit measures and is not assumed to be the “correct” model.
140
Moreover, it is important to distinguish between a model for description of current
data versus a model used to develop predictions; in the latter case, a model with
poorer goodness of fit to the observed data but greater robustness to alternative
datasets may be preferred.
3.3.5. Multiple comparison methods
Multiple comparison methods include Least Significant Differences Test,
Bonferroni’s method, Tukey’s method and Scheffe’s method. The differences
in these methods relate to two different aspects (i) whether these methods are
suitable for planned or unplanned comparisons; and (ii) their approach for
controlling experimentwise error rate, and the degree of protection against a
Type I error. A Type I error is asserted to have occurred if the null
hypothesis is rejected when it is true (Sokal and Rohlf 2000).
Non-orthoganility exists whenever more tests are conducted than degrees of
freedom existing between groups, and where comparisons are non-orthogonal
they do not exhibit independence (Sokal and Rohlf 2000). For example, when
planned comparisons are found to be non-orthogonal, tests with adjusted
values for Type I error are used (Sokal and Rohlf 2000). In this case a
conservative approach is taken and the Type I error of the statistic of
significance is lowered for each comparison so that the chance of making a
Type I error in the whole series of comparison tests does not exceed the level
of significance (Sokal and Rohlf 2000). This probability is referred to as the
experimentwise error rate (Sokal and Rohlf 2000).

141
Planned comparison tests (or a-priori comparisons) relate to tests designed and
chosen independently of experimental results, they are planned before the
experiment has been conducted (Sokal and Rohlf 2000), and a decision is made
concerning how many tests will be done. Comparison tests suggested as a result
of a completed experiment are referred to as unplanned comparison tests (or
posteriori tests) and include comparison tests between all possible pairs of means
(Sokal and Rohlf 2000).
The Least Significant Differences Test is only valid for planned comparisons,
Bonferroni’s method is a conservative test used for planned comparisons, Tukey’s
method is suitable for unplanned comparisons, and Scheffe’s method is a powerful
unplanned comparison test (Sokal and Rohlf 2000).
The Least Significant Differences Test involves, in the first instance, conducting
an ANOVA to determine whether there are statistically significant differences
among groups, which will be suggested by the results of an overall F-test at a
selected significance level (Liao 2002). Group means are compared and declared
to be significantly different if greater than a specified magnitude that is based on
the desired overall error rate and the number of comparisons to be made.
Bonferroni’s method is used for planned comparisons (Sokal and Rohlf 2000).
This method can be used for linear combinations or pairwise contrasts prior to an
ANOVA with either unequal or equal sample sizes, however, the set of
combinations may not be infinite, as is permitted with Scheffe’s method, but can

142
exceed the number allowed in Tukey’s procedure (Liao 2002). The power of the
Bonferroni method is lowered if more than one null hypothesis is found to be
false (Sokal and Rohlf 2000).
Tukey’s method compares all likely pairwise differences of means (Liao 2002)
and is suitable for unplanned comparison tests (Sahai and Ageel 2000).
However, as discussed in the previous section (3.2.8), Tukey’s method requires
equal sample sizes (Sahai and Ageel 2000) and assumptions of homoscedasticity
and normality are more critical for Tukey’s as opposed to Scheffe’s method (Liao
2002), hence Scheffe was considered a better choice in the thesis for the conduct
of unplanned multiple comparison tests.
143
3.4. REFERENCES
Baron, P. A.,Willeke, K., 2001. Aerosol Measurement, Principles,
Techniques and Applications, 2nd edn. New York, John Wiley & Sons, Inc.
Chapra, S., 2002. Numerical Methods for Engineers with Software and
Programming Applications. New York McGraw Hill.
Devore, J., Farnum, N., 2005. Applied Statistics for Engineers and Scientists.
2nd edn. , Thomson Brooks, California.
Dyer, S. A., Dyer, J.S., 2008. bythenumbers - Numerical integration.
Instrumentation & Measurement Magazine 11(2), 47-49.
Guttikunda, S., Wells, G. J., Johnson, T. M., Artaxo, P., Bond, T. C., Russel, A.
G., Watson, J. G., West, J., 2008. Source Apportionment of Particulate Matter for
Air Quality Management: Review of Techniques and Applications in Developing
Countries Joint UNDP/World Bank Energy Sector Management Assistance
Programme (ESMAP)
Hays, W. L., Winkler, R. L., 1970. Statistics New York, Holt, Reinhart and
Winston
Heitbrink, W., Baron, P., Willeke, K., 1991. Coincidence in time-of-flight aerosol
spectrometers: Phantom particle creation. Aerosol Science and Technology 14,
112-126.
Henry, R.C., 1987. Current factor analysis receptor models are ill-posed.
Atmospheric Environment 21, 1815-1820.

144
Hosmer, D. W., Lemeshow, S., 2000. Applied Logistic Regression. New
York, John Wiley & Sons, Inc.
Liao, T.M., 2002. Statistical Group Comparison. Canada, John Wiley & Sons
Inc.
Lin, M., Rau, J., Tseng, H., Wey, M., Chu, C., Lin, Y., Wei, M., Lee, C.,
2008. Characterizing PAH emission concentrations in ambient air during a
large-scale joss paper open-burning event Journal of Hazardous Materials
156, 223-229.
Lioy, P. J., Zelenka, M. P., Cheng, M. D., Reiss, N. M., Wilson, W. E., 1989.
The effect of sampling duration of the ability to resolve source types using
factor analysis. Atmospheric Environment 23, 239-254.
Morawska, L., Thomas, S., Gilber, D., Greenaway, C., Rijnders, E., 1999. A
study of the horizontal and vertical profile of submicrometer particles in
relation to a busy road. Atmospheric Environment 33 (8), 1261-1274.
Olden, J. D., Jackson, D. A., 2000. Torturing data for the sake of generality:
How valid are our regression models? Ecoscience 7(4), 501-510.
Ruzer, L. S., Harley, N. H., 2004. Aerosols Handbook Management,
Dosimetry and Health Effects. Florida, USA CRC Press

145
Sahai, H., Ageel, M. I., 2000. The Analysis of Variance: Fied, Random, and
Mixed Models. Boston, Brikhauser.
Scheffe, H., 1953. A method for judging all contrasts in the analysis of variance.
Biometrika 40, 87-104.
Scheffe, H,. 1959. The Analysis of Variance. New York Wiley.
Sokal, R.R., Rohlf, F.J., 2000. Biometry: The Principles and Practice of Statistics
in Biological Research, 3rd edn., W.H. Freeman and Company, New York.
Statheropoulos, M., Vassiliadis, N., Pappa, A., 1998. Principal component and
canonical correlation analysis for examining air pollution and meteorological
data. Atmospheric Environment 32, 1087-1095.
Viana, M., Kuhlbusch, T. A. J., Querol, X., Alastuey, A., Harrison, R. M., Hopke,
P. K., Winiwarter, W., Vallius, M., Szidat, S., Prevot, A. S. H., Hueglin, C.,
Bloemen, H., Wahlin, P., Vecchi, R., Miranda, A. I., Kasper-Giebl, A., Maenhaut,
W., Hitzenberger, R., 2008. Source apportionment of particulate matter in Europe:
A review of methods and results. Journal of Aerosol Science 39, 827-849.
146
CHAPTER 4
MODALITY IN AMBIENT PARTICLE SIZE DISTRIBUTIONS
AND ITS POTENTIAL AS A BASIS FOR DEVELOPING
AIR QUALITY REGULATION
Lidia Morawska1, Diane U. Keogh1, Stephen B. Thomas2,
Kerrie Mengersen3
1 International Laboratory for Air Quality and Health, Queensland
University of Technology, Brisbane, Queensland, Australia
2 ENSR Australia, Fortitude Valley, Queensland, Australia
3 School of Mathematical Sciences, Queensland University of
Technology, Brisbane, Queensland, Australia
(2008) Atmospheric Environment 42 (7), 1617-1628
147
STATEMENT OF JOINT AUTHORSHIP
Title: Modality in ambient particle size distributions and its potential
as a basis for developing air quality regulation
Authors: Lidia Morawska, Diane U. Keogh, Stephen B. Thomas, and
Kerrie Mengersen
Lidia Morawska
Developed the experimental design and scientific method for the South-
East Queensland study and interpreted the data. Wrote the majority of the
manuscript.
Diane U. Keogh (candidate)
Developed the scientific method for the worldwide review of modes. Data
collection, processing, analysis and interpretation of modal data and wrote
this section of the manuscript. Contributed to the manuscript.
Stephen B. Thomas
Contributed to development of the South-East Queensland study
experimental design and scientific method. Conducted the South-East
Queensland measurements and contributed to interpretation of the data.
Contributed to the manuscript.
Kerrie Mengersen
Developed the experimental design of the statistical tests.
Contributed to the manuscript.

148
ABSTRACT
Current ambient air quality standards are mass-based and restricted to PM2.5
and PM10 fractions. The major contribution to both PM2.5 and PM10 fractions is
from particles belonging to the coarse mode and generated by mechanical
processes. These standards are thus unable to effectively control particle
concentrations from combustion sources, such as motor vehicles and power
plants, which tend to emit very small particles that are almost entirely
respirable and in the submicron range, and dominate the nucleation and
accumulation modes, which contribute much less to particle mass
concentration.
The aim of this work was to examine whether PM1 and PM10 would be a more
effective combination of mass standards than PM2.5 (dominant in the nucleation
and accumulation modes) and PM10 (dominant in the coarse mode) in controlling
combustion related ambient particles, as well as those originating from
mechanical processes. Firstly, a large body of data on particle size distributions
in a range of environments in South East Queensland, Australia was analysed,
with an aim of identifying the relation between modality in the distributions and
sources of particles belonging to different modes. The analyses included a matrix
of the following elements: particle volume and number distributions, type of
environment and locations of the modes in the range of PM1, PM2.5 and PM10
fractions.
Secondly, with the same aim, 600 published modal location values relating to
number, surface area, volume and mass size distributions for a range of
environments worldwide, were analysed. The analysis identified a clear and
149
distinct separation between the location of the modes for a substantial number of
environments worldwide and particle metrics, which suggests that modality in
particle size distributions may be a parameter that has potential to be used in the
development of PM1 air quality guidelines and standards. Based on these
analyses, implications for choosing different mass standards for airborne
particulate matter are discussed in the paper.
Keywords: modality of particle distribution, ambient aerosol, PM1, PM2.5,
PM10, air quality regulation.
4.1. INTRODUCTION
Various aspects are considered when developing ambient air quality standards of
which the most important are the exposure-response relationship and the
characteristics of the pollutant, which determine the exposure. Size distribution is
one of the key characteristics of ambient particulate matter, on one hand related to
particle formation and post-formation processes and, on the other hand,
determining the fate of particles in the air and the likelihood of their deposition in
the human respiratory tract. Current ambient air quality standards for PM2.5 and
PM10 fractions are based in part on a scientific basis, but also in part on the data
and limitations of the size ranges measured by equipment at the time of setting the
standards. PM2.5 and PM10 fractions are mass concentration of particles with
aerodynamic diameters smaller than 2.5 and 10 μm, respectively. PM1 is the mass
concentration of particles with aerodynamic diameters smaller than 1 μm.
150
Size-selective inlets which remove particles that exceed a specific aerodynamic
diameter are characterised by sampling effectiveness curves which show the
fraction of particles passing through as a function of aerodynamic diameter.
Sampling effectiveness is summarised by the 50% cut-point (relating to the
diameter that represents half the particles passing through the inlet) and includes a
slope function, representing the contribution from different particle sizes above and
below the 50% cut-point, because an exact sharp cut-point cannot be achieved in
practice (Baron and Willeke 2001).
The PM2.5 fraction is sometimes referred to as fine particles, while the difference
between PM10 and PM2.5 is sometimes referred to as coarse particles. Particles
larger than 10 μm tend to have atmospheric lifetimes that are relatively short
(Harrison et al. 2000) and are of lesser significance from the health point of view
since they are mostly removed by the nose. Prior to setting the PM2.5 standard,
the US EPA conducted an extensive examination of the available data on particle
size distributions. The Air Quality Criteria for Particulate Matter (EPA 1996)
contains a comprehensive discussion of the relative merits of PM1 and PM2.5.
The decision by the US EPA to introduce 2.5 µm as the upper end of the
boundary for fine particles and as a basis for a standard (Reference US Federal
Register) was strongly influenced by the fact that the available epidemiological
data at the time were obtained using PM2.5 measurements (Dockery et al. 1993).

151
An alternative approach in classification of the particles for the purpose of
developing control measures, is to consider location of the modes in particle size
distributions, which relate to the contribution from different pollution sources. A
mode may be defined as a peak in the lognormal function of the number or mass
distribution of an atmospheric aerosol (John 1993). A number of investigations
into the variation of the aerosol size spectrum over a variety of size intervals have
been made. Three terms have been introduced for atmospheric aerosol size
distribution in terms of modal diameters; these classifications focused on particle
size and production mechanism and were the nucleation mode (< 0.1 µm),
accumulation mode (0.1-1 µm) and coarse particle mode (> 1 µm) (Jaenicke
1993).
However it is acknowledged that the location of the modes generally depends on
the metric being referred to, such as particle number, surface area, volume or
mass, and modes will also change depending on the mathematical transformation
method used. For example, Whitby’s model of particle volume size distribution
(1978) was based primarily on atmospheric aerosol number distributions in the
size range 0.01-6 µm, which when transformed to volume distributions, revealed
three modal size ranges, with the nuclei mode (< 0.1 µm), the accumulation mode
(0.1-2 µm) and coarse particle mode (> 2 µm) (Baron and Willeke 2001). More
recently, studies with instruments extending the small size limit to 3 nm have
shown that the nuclei mode needs to be separated into a nucleation mode (< 0.01
µm) and an Aitken nuclei mode (0.01-0.1 µm) (USEPA 2004).
152
In environments affected by anthropogenic influences most of the nucleation
mode particles originate either from the condensation and coagulation of hot,
highly supersaturated vapours released during combustion or arise from the
condensation and coagulation of low vapour pressure materials formed in the
atmosphere by photochemically initiated processes. Coagulation and
heterogeneous nucleation tend to accumulate the aerosol in the accumulation
mode. Nucleation, Aitken, and accumulation modes contain soot, acid
condensates, sulfates and nitrates, as well as trace metals and other toxins. Most
anthropogenic pollution sources are combustion-related and generate particles
with diameters < 1 µm (Jamriska and Morawska 2000). Submicrometer particles
(diameters < 1 µm) represent most particle matter that is dispersed in urban
environments in terms of particle number concentrations (Morawska et al. 1998;
Nazaroff et al. 1990). Almost all particles in the coarse particle mode originate
from natural and anthropogenic mechanical processes, including grinding,
breaking and wear of material and dust resuspension.
The currently accepted division between fine and coarse particles of 2.5 µm does
not follow the natural division between modes attributable to different types of
sources. Instead, it tends to cut through the mode originating from mechanical
processes. It has been shown, however, that there is usually a clear separation
between the accumulation and coarse modes around 1 µm or somewhat above,
where the mass of particles belonging to these two modes is at a minimum
(Lundgren and Burton 1995). Therefore the rationale behind the classification of
one micrometer as a division between fine and coarse particles in particle mass
and particle volume size distributions would be that it constitutes a natural
division between particles generated mainly from combustion and photochemical
153
processes and particles generated from mechanical processes. Obviously this
definition, as any, would still be somewhat arbitrary, as nature itself does not
provide a perfect division.
Knowledge and understanding of the presence and location of modes in particle
distributions is of importance not only for understanding the mechanisms of
atmospheric processes, but also, importantly, for exposure and risk assessment,
particularly for setting standards and guidelines for air quality. The disparity
between what the standards divide into fine and coarse particles and what nature
divides into modes originating from different sources may make control of
particles more difficult and in fact may also be less desirable from the health
point of view.
The aim of the work reported in this paper was to analyse the available
information on modal locations in ambient particle size distributions and, based
on this, to explore the potential for PM1 as an effective mass standard together
with PM10 in controlling contributions from different types of air pollution
sources.
4.2. METHODS AND TECHNIQUES
The analysis conducted within the scope of this work was divided into two steps.
Firstly, characteristics of the modality in particle size distributions for a range of
environments in South East Queensland, Australia were investigated to examine
the relationship between fractional contribution of mass from different modes in
particle size distribution (and thus from different sources) to PM1, PM2.5 and
PM10. South East Queensland was chosen because for this environment the

154
authors have detailed information available on particle size distributions, with
thousands of spectra collected. The conclusions as to modality of particle size
distributions reached by Morawska et al. (1999), as well as the averaged size
distributions obtained, served as bases for the analyses presented in this paper.
Particle modal characteristics, their dependence on local conditions in South East
Queensland and their variability with time were reviewed by Morawska et al.
(1999). This paper also provided a detailed analysis of the modal characteristics
of over 6,000 particle size spectra collected over a period of three years for a
range of environments, including marine, modified background, suburban
background, traffic influenced, urban influenced and vegetation burning. Details
concerning the classification of these environments are provided in Morawska et
al. (1999). Measurements of size distributions in the size range 0.016 to 30 µm
were conducted using SMPS and APS instrumentation. Spectra corresponding to
one sample were combined, normalised and smoothed using a chi-square fitting
procedure to give one distribution, and Kolmogorov-Smirnov (K-S) tests were
used to compare measured aerosol size distributions (For details see Morawska et
al. 1999). The aim of the analysis was to combine the distributions from two
instruments measuring submicrometer and supermicrometer particle size
distributions for the calculation of the volume size distributions and to allow
interpretation of the modal characteristics for each environment studied. The
focus of that work was on source identification and identification of the
relationship between the sources and size distribution of particles generated. For
each environment there was a clear division between the accumulation and coarse
modes, but not between the nucleation and accumulation modes. As the densities
of the aerosols were not known, only volume and not mass distributions were

155
calculated. As there is, however, a direct correlation between mass and volume
distributions, where density acts as a scaling factor, modality displayed by
volume and mass distributions are the same.
For each distribution referred to above, in this work, the fractional contribution of
N+A (nucleation and accumulation) and C (coarse) modes to volumes of PM1,
PM2.5 and PM10 were calculated. Ultrafine particles (diameters of < 0.1 µm) tend
to dominate particle number and make a significant contribution to surface area but
little to mass, with the cube dependence of volume (and therefore mass) resulting
in significantly different particle size distributions for particle number and mass
distributions (Harrison et al. 2000). In simple terms, it is likely that the majority of
particle number is in the transient nucleation and Aitken modes, particle surface
area in the accumulation mode, and volume and mass divided between the
accumulation and coarse particle modes (Harrison et al. 2000).
The relative contributions were calculated by summing the volumes under the
peaks of the modes with the boundary between the accumulation and coarse
modes being taken as the sharp visible division on the figures. The total volume
of the individual modes was not calculated, which could have been done by
extrapolating the curves that describe the mode down to zero on the horizontal
axis or fitting a statistical mixture model. Instead the contributions to PM1, PM2.5
and PM10 were calculated assuming sharp cut-offs. While due to the limitations in
the measurement techniques these cut-offs are not sharp, it was considered that
for the purpose of the assessment conducted in this work this assumption would
not affect the overall outcome of the assessment, but would significantly simplify
the calculations. Moreover, where modes overlap, the concentration levels are

156
usually a few orders of magnitude lower than in the peaks and therefore the
contribution from the volumes not included was considered to be negligible.
Fractional contributions to the modes were calculated by integrating the area
under the curve using the trapezoidal rule. The trapezoidal rule takes account of
the different width of the x-axis in each bin, and may be applied to either the
original data scale or the log scale. Log scale values were used in our
calculations and calculations were undertaken using Origin (Version 6.0).
Secondly, an analysis of modal locations reported in international literature was
conducted to determine whether a clear and distinct separation occurs in the log-
transformed data between the modes around 1 µm, in different environments and
for different metrics. This was evaluated by constructing a 95% confidence
interval for the mean of those modal values lying below 1 µm, and a second 95%
confidence interval for the mean of those values lying above 1 µm. The means of
the two groups were asserted to be significantly different if these two confidence
intervals did not overlap. Moreover, the value of 1 µm was determined to be an
effective threshold if it separated the two intervals, so that it was larger than the
confidence interval for the smaller mean, and smaller than the confidence interval
for the larger mean. This was evaluated by testing for the existence of two modal
groups with significantly different means, as determined by non-overlapping
95% confidence intervals. This analysis was used to ascertain which
environments and metrics may possibly be suited to PM1 standards.

157
4.3. RESULTS AND DISCUSSION
4.3.1. Contribution of the modes in South East Queensland to PM1, PM2.5,
PM10
Figure 4.1 presents averaged size distributions for different types of
environments in South East Queensland in terms of both number and volume size
distribution. To enable the distinctions between the modes and identification of
the size boundaries of the modes, both types of spectra are presented in double
logarithmic scale. A vertical line shows the location of the division according to
the boundary of PM2.5 and coarse particles.
Figure 4.1. Normalised number and volume size distributions in South East Queensland, Australia (a) traffic influenced aerosol (b) urban influenced aerosol (c) vegetation burning influenced aerosol (d) marine influenced aerosol (e) modified background aerosol (f) suburban background aerosol. N + A (nucleation and accumulation modes), Coarse (coarse mode). 157

158
A general conclusion that can be made from inspection of the distributions
presented in Figure 4.1 is that in all of the environments there is a good
separation between accumulation and coarse particle modes, but that this
separation occurs at or below 1 μm. Harrison et al. (2000) found a similar
separation at around 1 μm in measured particle size distributions from suburban
Birmingham, United Kingdom in terms of number, surface area and volume. It
can be seen in the South East Queensland environments that in all cases the
division at 2.5 µm cuts across the coarse particle mode, close to its peak.
Inspection of the spectra presented in Figure 4.1 reveals that for traffic influenced
aerosols as well as for urban influenced, suburban background and modified
background aerosols both number and volume distributions are bimodal, with the
majority of particle number being associated with the fine particle mode
(nucleation, Aitken and accumulation regions, N+At +A), while most of the mass
is associated with the coarse particle mode (C). Since our instruments only
extended to 16 nm, we do not have information on the nucleation mode and the
Aitken mode and the accumulation mode are not clearly separated in all size
distributions. Similarity between the modal locations in the N+At and A region in
these environments leads to the conclusion that in this urban environment
automobile exhausts are the major contributors.
The coarse particles, on the other hand, may more likely result from a number of
different sources and not just the predominant road dust source for aerosols sampled
adjacent to the freeway, as indicated by differences between the shapes of the size
distribution curves. For example, the distributions for modified background aerosols
are considered representative of the influences by biogenic sources, with the broad

159
width of the coarse particle mode being a reflection of the presence of particles
originating from plant emissions in the aerosols. The existence of several more
peaks in the suburban aerosol is likely the result of several background aerosol
sources, which in urban type locations are usually masked by the presence of much
stronger sources, such as traffic emissions.
There is also close similarity between the shapes of the size distribution curves of
vegetation burning influenced aerosols and the traffic and urban aerosols in South
East Queensland. There is a difference, however, in the width of the modes, with
the N+A mode of the vegetation burning influenced aerosol being at a larger
particle size than the other two aerosols typically encountered in urban
environments. There are a number of peaks present within the N+A modes of the
marine influenced aerosol as presented in Figure 4.1. They include free
troposphere nuclei mode, effects related to the influence of cloud processing of
coagulating nuclei and the sea salt component of marine aerosols. While the
majority of the particles in the number size distribution are smaller than 1 μm
diameter, the majority of the volume is in fact occupied by particles with
diameters greater than 1 µm.
For each of the distributions presented in Figure 4.1, fractional contribution of
N+A and C modes to the volumes of PM1, PM2.5 and PM10 was calculated,
assuming, as discussed above, sharp cut-offs of 1, 2.5 and 10 µm. These
contributions are shown in Table 4.1 and form the basis of our study conclusions.
The most obvious conclusion from Table 4.1 is that PM10 volume in all
environments, except vegetation burning, can be attributed mainly to particles
from the coarse mode (C), that is, particles generated from mechanical processes.

160
Contribution from combustion processes to PM10 is negligible. Volume from
N+A modes for vegetation burning contributes about 50% to PM10 volume.
Similarly to PM10, in most of the environments the Coarse (C) mode has the
strongest contribution to PM2.5 volume. However, in traffic influenced and
vegetation burning the contribution from N+A is substantial. In the case of
vegetation burning, N+A volume has a stronger contribution to PM2.5 volume
compared to C volume and to its contribution to PM10 volume. Contribution
from N+A mode volume to PM1 is dominant for traffic influenced, vegetation
burning, marine influenced and modified background.
Table 4.1 Percent contribution of N+A and C modes by mass to
PM1, PM2.5 and PM10 in South East Queensland, Australia
PM1
% contribution
(by mass)
PM2.5
% contribution
(by mass)
PM10
% contribution
(by mass)
Environment
Type N+A C N+A C N+A C
Traffic Influenced 99 1 61 39 24 76
Urban Influenced 49 51 3 97 < 1 > 99
Vegetation burning 100 0 90 10 52 48
Marine influenced 82 18 2 98 <1 >99
Modified
background
88 12 13 87 < 1 > 99
Suburban
background
38 62 1 99 < 1 > 99

161
4.3.2. Modal locations in the published literature
The review of published studies revealed 605 modes reported for particle
number, surface area, volume and mass size distributions. Since access to the
data used by other authors was not available, the examination focused on the
location of these reported modes. Moreover, for the purposes of this study, only
modal location values ≤ 10 µm were extracted. Of the 605 modes identified, five
occurred at ≥ 10 µm in particle volume and were not included in the review,
leaving a total of 600 examined in our study. Particle concentrations and their
relative variations were not considered in this study. The published values
spanned diverse environments, and included background, central european
aerosol, desert, fires, forest, high alpine, marine and modified marine, modified
background, north-west Himalayas, rural/continental, suburban, traffic-
influenced, urban-influenced, urban background and vegetation burning
environments. Tables 4.2-4.5 present listings of the international studies
reviewed.
Figure 4.2 presents a compilation of all 600 modal location values from the
analysis for a range of environments and metrics. Modal location value ranges for
the different metrics spanned from 0.006 to 3 µm for number; 0.02 to 3.5 µm for
surface area; 0.008 to 10 µm for volume and 0.06 to 7.8 µm in mass particle size
distributions. Approximately 98% of number modal location values occurred at ≤ 1
µm. Surface area modal locations showed a similar pattern to mass but were
shifted to the right, to the larger size ranges.
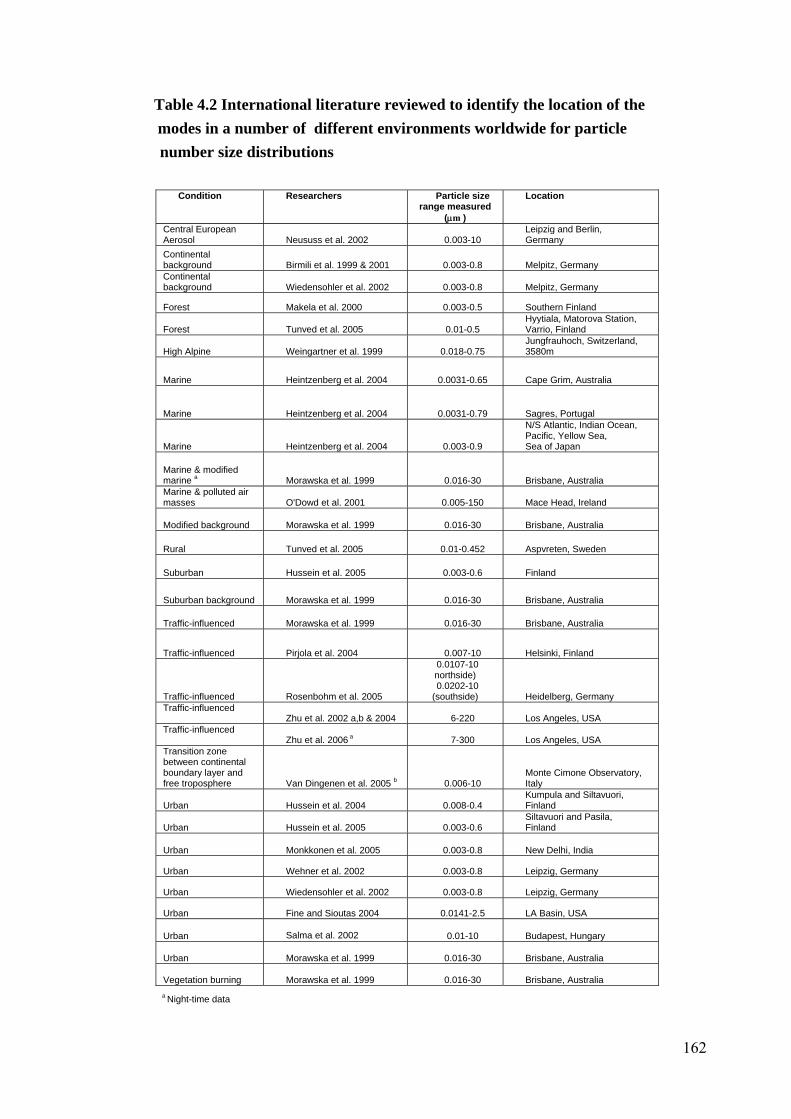
162
Table 4.2 International literature reviewed to identify the location of the modes in a number of different environments worldwide for particle number size distributions
Condition Researchers Particle size range measured
(μm )
Location
Central European Aerosol Neususs et al. 2002 0.003-10
Leipzig and Berlin, Germany
Continental background Birmili et al. 1999 & 2001 0.003-0.8 Melpitz, Germany Continental background Wiedensohler et al. 2002 0.003-0.8 Melpitz, Germany
Forest Makela et al. 2000 0.003-0.5 Southern Finland
Forest Tunved et al. 2005 0.01-0.5 Hyytiala, Matorova Station, Varrio, Finland
High Alpine Weingartner et al. 1999 0.018-0.75 Jungfrauhoch, Switzerland, 3580m
Marine Heintzenberg et al. 2004 0.0031-0.65 Cape Grim, Australia
Marine Heintzenberg et al. 2004 0.0031-0.79 Sagres, Portugal
Marine Heintzenberg et al. 2004 0.003-0.9
N/S Atlantic, Indian Ocean, Pacific, Yellow Sea, Sea of Japan
Marine & modified marine a Morawska et al. 1999 0.016-30 Brisbane, Australia Marine & polluted air masses O'Dowd et al. 2001 0.005-150 Mace Head, Ireland
Modified background Morawska et al. 1999 0.016-30 Brisbane, Australia
Rural Tunved et al. 2005 0.01-0.452 Aspvreten, Sweden
Suburban Hussein et al. 2005 0.003-0.6 Finland
Suburban background Morawska et al. 1999 0.016-30 Brisbane, Australia
Traffic-influenced Morawska et al. 1999 0.016-30 Brisbane, Australia
Traffic-influenced Pirjola et al. 2004 0.007-10 Helsinki, Finland
Traffic-influenced Rosenbohm et al. 2005
0.0107-10 northside) 0.0202-10
(southside) Heidelberg, Germany Traffic-influenced
Zhu et al. 2002 a,b & 2004 6-220 Los Angeles, USA Traffic-influenced
Zhu et al. 2006 a 7-300 Los Angeles, USA Transition zone between continental boundary layer and free troposphere Van Dingenen et al. 2005 b 0.006-10
Monte Cimone Observatory, Italy
Urban Hussein et al. 2004 0.008-0.4 Kumpula and Siltavuori, Finland
Urban Hussein et al. 2005 0.003-0.6 Siltavuori and Pasila, Finland
Urban Monkkonen et al. 2005 0.003-0.8 New Delhi, India
Urban Wehner et al. 2002 0.003-0.8 Leipzig, Germany
Urban Wiedensohler et al. 2002 0.003-0.8 Leipzig, Germany
Urban Fine and Sioutas 2004 0.0141-2.5 LA Basin, USA
Urban Salma et al. 2002 0.01-10 Budapest, Hungary
Urban Morawska et al. 1999 0.016-30 Brisbane, Australia
Vegetation burning Morawska et al. 1999 0.016-30 Brisbane, Australia a Night-time data

163
Table 4.3 International literature reviewed to identify the location of the
modes in a number of different environments worldwide for particle
surface area distributions
Condition Researchers
Particle size range
measured (μm ) Location
Transition zone between continental Boundary layer and free troposphere Van Dingenen et al. 2005 a 0.006-10
Monte Cimone Observatory, Italy
Urban
Salma et al. 2002 0.01-10 Budapest, Hungary
Vegetation burning Jayaratne & Verma 2001 0.1-5 Gaborone, Botswana, Southern Africa
a Night-time data
Table 4.4 International literature reviewed to identify the location of the
modes in a number of different environments worldwide for particle
volume size distributions
Condition Researchers
Particle size range
measured (μm ) Location
Background Hidy 1975 0.015-30 Southern California, USA
Central European Aerosol Neususs et al. 2002 0.003-10 Leipzig and Berlin, Germany
Desert Hidy 1975 0.015-30 Southern California, USA Marine Hidy 1975 0.015-30 Southern California, USA
Marine and modified marine a Hoppel et al. 1990 0.006-2.2 Wallops Island, USA
Marine and modified marine a Gras and Ayers 1983 0.0025-5 Tasmania, Australia
Marine and modified marine a Porter and Clarke 1997 0.17-7.5 Tasmania, Australia
Marine and modified marine a Porter and Clarke 1997 0.17-7.5 Hawaii, USA
Modified marine a Morawska et al. 1999 0.016-30 Brisbane, Australia Marine and polluted air masses O'Dowd et al. 2001 0.005-150 Mace Head, Ireland
Modified background Morawska et al. 1999 0.016-30 Brisbane, Australia
Suburban Meszaros 1977 0.020-100 Budapest, Hungary
Suburban background Morawska et al. 1999 0.016-30 Brisbane, Australia
Traffic-influenced Hidy 1975 0.015-30 Southern California, USA
Traffic-influenced Morawska et al. 1998 0.016-30 Brisbane, Australia
Transition zone between continental boundary layer & free troposphere
Van Dingenen et al. 2005 b 0.006-10
Monte Cimone Observatory, Italy
Urban Morawska et al. 1999 0.016-30 Brisbane, Australia
Vegetation burning Jayaratne & Verma 2001 0.1-5
Gaborone, Botswana Southern Africa
Vegetation burning Morawska et al. 1999 0.016-30 Brisbane, Australia
a Modified marine in these cases refers to marine aerosol influenced by continental air parcels. b Night-time data

164
Table 4.5 International literature reviewed to identify the location of
the modes in a number of different environments worldwide for particle
mass size distributions
Condition Researchers
Particle size range measured
(μm ) Location
Himalayas Gajananda et al. 2005 0.08-9 North-west Himalayas, India
Marine Hillamo et al. 2001 0.045-10 High Arctic, remote boundary layer
Rural Berner et al. 2004
0.06-16 Vienna, Austria
Traffic Berner et al. 2004 0.06-16 Vienna, Austria
Urban Berner et al. 2004 0.06-16 Vienna, Austria
Urban Salma et al. 2002 0.01-10 Budapest, Hungary
Urban Salma et al. 2005 0.05-10 Budapest, Hungary
Three conclusions can be made from inspection of the results presented in
Figure 4.2. Firstly, it can be seen that there is a clear and distinct separation
between the modes at 1 µm for all worldwide environmental data reviewed for
surface area, volume and mass size distributions. The one exception is a volume
size distribution mode identified in marine and modified marine in Tasmania at
1 μm by Gras and Ayers (1983) where the salt component was found to comprise
more than 95% of the total volume. Secondly, it can be seen in Figure 4.2 that
clusters of modal values appear for each metric. Finally, the figure shows that
number and volume size distribution modal location values for South East
Queensland generally fell within the modal size ranges reported for the worldwide
environments.

165
1 10 100 1000 10000
Number
Surface Area
Volume
Mass
Figure 4.2. Published modal location values relating to particle size distributions for South East Queensland, Australia (marked x) and for a range of environments worldwide and metrics (n=600). Vertical dashed lines indicate the 95% confidence interval upper bounds for modal value clusters to the left of 1 μm and 95% confidence interval lower bounds for modal value clusters to the right of 1 µm in particle volume and mass size distributions, these modal value clusters are circled above

166
The effect of relative humidity on particle size under certain circumstances is
important and has been the topic of many investigations. For example,
Mobility Analysers can change relative humidity conditions during sampling,
and in many cases heat the sampled air sufficiently to reduce the size of the
particles. Mass size distributions measured at high relative humidity or in
clouds or fog show considerable fine particulate matter above 1 µm.
However, the papers reviewed by this study comprised a very wide range of
conditions, including studies related to high humidity conditions. Overall this
has not had an impact on the inferences. In fact the study region in South-East
Queensland experiences an annual average relative humidity of between 60-
73% in the mornings and 49-60% in the afternoons. Therefore it appears that
in the majority of cases (or under most circumstances) humidity is not a factor
changing the location of the mode according to the conclusions discussed
here. This is an important conclusion in relation to considerations in setting
standards, as these need to account for the majority of cases, especially in
relation to anthropogenic contributions.
4.3.3. Separation between modal location values in mass and volume
particle size distributions at around 1 µm
Of the 600 modal values examined in this study in particle number, surface
area, volume and mass size distributions 87 modes (15%) were clustered
closely on either side of 1 µm, and five modes were found at exactly 1 µm.
As clearly indicated in Figure 4.2, the modal values formed two distinct
subgroups above and below 1 μm. The upper 95% confidence bound of the

167
smaller mean, and the lower 95% confidence bound of the larger mean for
particle volume and mass size distributions, are displayed by vertical dashed
lines in Figure 4.2. The lack of overlap between these confidence intervals is
apparent, confirming the existence of two groups with statistically different
means. The confidence intervals were calculated for modal value clusters at
between 0.197 and 0.5 µm and 1.84 and 8 µm in volume; and 0.43 and 0.65
µm and 3.16 and 5.06 µm in mass size distributions. To facilitate comparison
between South East Queensland and modal values reported elsewhere in the
world, confidence intervals for South East Queensland modal values in
volume size distribution were not calculated.
When considering all the modal location values depicted in Figure 4.2, a
distinct gap was found between the location of the modes at both below and
above 1 µm. This distinct gap occurred at between 0.65 and 2 µm in mass
particle size distributions; between 0.3 and 2.2 µm in surface area; between
0.5 and 1.8 µm in volume and between 0.8 and 1.2 µm for number. It should
be noted that two distinct modal location values present at 1 µm and 2 µm in
Figure 4.2 related to marine environments. These were a mode found at 2 µm
in particle mass, which related primarily to sea salt particles in the remote
marine boundary layer in the high Arctic over the central Arctic Ocean
(Hillamo et al. 2001) and a mode at 1 µm in volume in an undisturbed marine
environment in the southern mid-latitudes, west coast of Tasmania, Australia,
where the salt component made up more than 95% of the total volume (Gras
and Ayers 1983).

168
4.4. CONCLUSIONS
The relation between fractional contribution to volume and mass from
different modes in the particle size distribution (and thus from different
sources) to PM1, PM2.5 and PM10 was examined in this paper, based on a large
body of data on ambient particle size distributions from the measurements
conducted in South East Queensland, Australia. The conclusions from the
analyses in relation to developing air quality regulations are as follows.
Firstly, PM10 measurements provide information almost entirely on particles
generated from mechanical processes and belonging to the coarse mode. In an
urban environment this could also mean particles resuspended by the vehicular
traffic and mechanical wear and tear of the tyres, but not emitted from motor
vehicles.
Secondly, PM2.5 measurements (coarse mode) also provide information mainly
on particles generated by mechanical processes, but the contribution from
combustion process modes (nucleation and accumulation modes) becomes
significant for some environments. Thus interpretation of PM2.5 data could
become very complex in order to distinguish the contribution from different
types of sources. It follows that the application of this PM2.5 parameter, as a
basis for standards may not adequately facilitate control of particle emissions
and concentrations.

169
Thirdly, PM1 measurements (nucleation and accumulation modes) provide
very good information about contributions from combustion processes and
enable a much better distinction to be made between combustion and
mechanically generated aerosols. It would thus appear that PM1 and PM10
mass standards would be most desirable from the legislation point of view.
The review of 600 modal location values for particle number, surface area,
volume and mass size distributions in a wide range of environments
worldwide revealed a clear and distinct separation around 1 µm. A similar
separation was found in all the South-East Queensland environments
examined in terms of the separation between accumulation and coarse modes
for volume and number size distributions, which occurred at around 1 µm.
We conclude that examination of the location of the modes in particle size
distributions has potential as a basis for developing air quality standards and
guidelines as modes provide useful information about contributions from
different pollution sources and particle mechanisms. Therefore, based on both
the local South East Queensland study and the other studies conducted around
the world, it is concluded that PM1 and PM10 offer greater potential as a
combination for particle mass standards than the current mass standards of
PM2.5 and PM10.
Two additional points need to be discussed when considering a PM1 standard.
Firstly, while at the moment very little data are available on PM1
concentrations, there are measurement technologies available to undertake

170
these measurements, which are very similar to those used for PM2.5
monitoring. Secondly, in addition to particle mass concentration standards,
future legislations may also consider number concentration standards, which
would be focused on submicrometer or even smaller, ultrafine particles. In
urban areas, for example, motor vehicles are the major emitter of ultrafine
particles, which are very small and prolific in terms of particle number, but
have negligible mass. The rapid progress in the monitoring technologies
available to measure particle number concentration currently makes such
measurements possible. While this paper considered only the rationale for the
most advantageous combination of particle mass standards from the legislative
point of view, more discussion should be conducted to consider the best
combination of particle mass and number concentration standards.

171
4.5. REFERENCES
Baron, P.A., Willeke, K., (Eds.) 2001. Aerosol Measurement, Principles,
Techniques and Applications, 2nd edn, John Wiley & Sons, Inc., New York.
Berner, A., Galambos, Z., Ctyroky, P., Fruhauf, P., Hitzenberger, R.,
Gomiscek, B., Hauck, H., Preining, O., Puxbaum, H., 2004. On the correlation
of atmospheric aerosol components of mass size distributions in the larger
region of a central European city. Atmospheric Environment 38 (24), 3959-
3970.
Birmili, W., Wiedensohler, A., Heintzenberg, J., Lehmann K., 2001.
Atmospheric particle number size distribution in central Europe: Statistical
relations to air masses and meteorology. Journal of Geophysical Research-
Atmospheres 106 (D23), 32005-32018.
Birmili, W., Heintzenberg, J., Wiedensohler, A., 1999. Representative
measurement and parameterization of the submicron continental particle size
distribution. Journal of Aerosol Science 30, Suppl. 1, S229-S230.
Dockery, D.W., Pope, C.A., Xu, X., Spengler, J.D., Ware, J.H, Fay., M.E,
Ferris., B.G., Speizer, F.E., 1993. An Association between Air Pollution and
Mortality in Six U.S. Cities. The New England Journal of Medicine, 329 (24),
1753-9.

172
Fine, PM., Shen, S., Sioutas, C., 2004. Inferring the sources of fine and
ultrafine particulate matter at downwind receptor sites in the Los Angeles
basin using multiple continuous measurements. Aerosol Science and
Technology 38, 182-195 Suppl. 1.
Gajananda, K., Kuniyal, J.C., Momin, G.A., Rao, P.S.P., Safai, P.D., Tiwari,
S., Ali, K., 2005. Trend of atmospheric aerosols over the north western
Himalayan region, India. Atmospheric Environment 39 (27), 4817-4825.
Gras, J.L., Ayers, G.P., 1983. Marine aerosol at southern mid-latitudes.
Journal of Geophysical Research 88(C15), 10661-10666.
Harrison, R.M., Shi, J.P., Zi, S., Khan. A., Mark, D., Kinnersley, R., Yin, J.,
2000. Measurement of number, mass and size distribution of particles in the
atmosphere, Philosophical Transactions of the Royal Society A:
Mathematical, Physical and Engineering Sciences, 358 (1775), 2567-2580.
Heintzenberg, J., Birmili, W., Wiedensohler, A., Nowak, A., Tuch, T., 2004.
Structure, variability and persistence of the submicrometre marine aerosol,
Tellus Series B-Chemical and Physical Meteorology 56 (4), 357-367.
Hidy, G.M., 1975. Summary of the California Aerosol Characterization
Experiment. Journal of the Air Pollution Control Association 25, 1106-1114.

173
Hillamo, R., Kerminen, V.M., Aurela, M., Makela, T., Maenhaut, W., Leck,
C., 2001. Modal structure of chemical mass size distribution in the high
Arctic aerosol, Journal of Geophysical Research-Atmospheres 106 (D21),
27555-27571.
Hoppel, W.A., Larson, R., Vietti, M.A., 1990. Aerosol size distributions and
optical boundaries found in the marine boundary layer over the Atlantic
Ocean. Journal of Geophysical Research 95(D4), 3659-3686.
Hussein, T., Hameri, K., Heikkinen, M.S.A., Kulmala, M. 2005. Indoor and
outdoor particle size characterization at a family house in Espoo-Finland,
Atmospheric Environment 39, 3697-3709.
Hussein, T., Puustinen A., Aalto P.P., Makela, J.M., Hameri K., Kulmala, M.
2004. Urban aerosol number size distributions. Atmospheric Chemistry and
Physics 4, 391-411.
Jamriska, M., Morawska, L., 2000. The effect of surface deposition,
coagulation and ventilation on submicrometer particles indoors. Clean Air
and Environment Conference, Sydney, Australia, 26-30 November 2000.
Jaenicke, R., 1993. Tropospheric aerosols. In Hobbs, P.V. (ed) Aerosol-
Cloud-Climate Change Interactions, Academic Press, San Diego, USA, 1-31.

174
Jayaratne, E.R., Verma, T.S., 2001. The impact of biomass burning on the
environmental aerosol concentration in Gaborone, Botswana, Atmospheric
Environment 35, 1821-1828.
John, W., 1993. The characteristics of environmental and laboratory
generated-aerosols, in: Willeke and Baron (Eds.), Aerosol measurement:
Principles, techniques and applications,Van Nostrand Reinhold, New York,
55.
Lundgren, D.A., Burton, R.M., 1995. Effect of particle size distribution on
the cut point between fine and coarse ambient mass fractions, Inhalation
Toxicology 7 (1), 131-148.
Makela, J.M., Koponen, I.K., Aalto, P., Kulmala., M., 2000. One-year data of
submicron size modes of tropospheric background aerosol in Southern
Finland. Journal of Aerosol Science 31 (5), 595-611.
Meszaros, A., 1977. On the size distribution of atmospheric aerosol particles
of different composition. Atmospheric Environment 11, 1075-1081.
Monkkonen, P., Koponen, I.K., Lehtinen, K.E.J., Hameri, K., Uma, R.,
Kulmala, M., 2005. Measurements in a highly polluted Asian mega city:
observations of aerosol number size distribution, modal parameters and
nucleation events. Atmospheric Chemistry and Physics 5, 57-66.

175
Morawska, L., 2004. Indoor particles, combustion products and fibres. The
Handbook of Environmental Chemistry , Springer-Verlag Heidelberg, 4F,
117-147.
Morawska, L., Thomas, S., Jamriska, M., 1999. The modality of particle size
distributions of environmental aerosols, Atmospheric Environment 33: 4401-
4411.
Morawska, L., Thomas, S., Bofinger, N.D., Wainwright, D., Neale D., 1998.
Comprehensive characterisation of aerosols in a subtropical urban
atmosphere: particle size distribution and correlation with gaseous pollutants.
Atmospheric Environment 32, 2467–2478.
Nazaroff, W., Ligocki, M., Ma, T., Cass, G., 1990. Particle Deposition in
Museums, Comparison of Modelling and Measurement Results, Aerosol
Science and Technology 13, 332-348.
Neususs, C., Wex. H., Birmili, W., Wiedensohler, A., Koziar, C., Busch, B.,
Bruggemann, E., Gnauk, T., Ebert, M., Covert, D.S. 2002. Characterization
and parameterization of atmospheric particle number-, mass-, and chemical-
size distributions in central Europe during LACE 98 and MINT - art. no.
8127. Journal of Geophysical Research-Atmospheres 107 (D21), 8127-8127.
O'Dowd, C.D., Becker, E., Kulmala, M., 2001. Mid-latitude North-Atlantic
aerosol characteristics in clean and polluted air. Atmospheric Research 58
(3), 167-185.
176
Pirjola, L., Parviainen, H., Hussein, T., Valli, A., Hameri, K., Aaalto, P.,
Virtanen, A., Keskinen, J., Pakkanen, T.A., Makela, T., Hillamo, R.E., 2004.
"Sniffer" - a novel tool for chasing vehicles and measuring traffic pollutants,
Atmospheric Environment 38 (22), 3625-3635.
Porter, J.N., Clarke A.D., 1997. Aerosol size distribution models based on in
situ measurements. Journal of Geophysical Research 102(D5), 6035-6045.
Rosenbohm, E., Vogt, R., Scheer, V., Nielsen, O.J., Dreiseidler, A.,
Baumbach, G., Imhof, D., Baltensperger, U., Fuchs, J., Jaeschke, W., 2005.
Particulate size distributions and mass measured at a motorway during the
BAB II campaign. Atmospheric Environment 39 (31), 5696-5709.
Salma, I., Ocskay, R., Raes, N., Maenhaut, W., 2005. Fine structure of mass
size distributions in an urban environment. Atmospheric Environment 39 (29),
5363-5374.
Salma, I., Dal Maso, M., Kulmala, M., Zaray, G., 2002. Modal characteristics
of particulate matter in urban atmospheric aerosols. Microchemical Journal 73
(1-2), 19-26.
Tunved, P., Nilsson, E.D., Hansson, H.C., Strom, J., 2005. Aerosol
characteristics of air masses in northern Europe: Influences of location,
transport, sinks, and sources - art. no. D07201. Journal of Geophysical
Research-Atmospheres 110 (D7), 7201-7201.

177
USEPA., 2004. Air Quality Criteria for Particulate Matter 2004. U.S.
Environmental Protection Agency, Washington, DC, EPA 600/P-99/002aF-
bF, 2004.
Van Dingenen, R., Putaud, J.P., Martins-Dos Santos, S., Raes, F., 2005.
Physical aerosol properties and their relation to air mass origin at Monte
Cimone (Italy) during the first MINATROC campaign. Atmospheric
Chemistry and Physics 5, 2203-2226.
Wehner, B., Birmili, W., Gnauk T., Wiedensohler, A., 2002. Particle number
size distributions in a street canyon and their transformation into the urban-air
background: measurements and a simple model study. Atmospheric
Environment 36 (13), 2215-2223.
Weingartner, E., Nyeki, S., Baltensperger, U., 1999. Seasonal and diurnal
variation of aerosol size distributions (10 < D < 750 nm) at a high-alpine site
(Jungfraujoch 3580 m asl). Journal of Geophysical Research-Atmospheres
104 (D21), 26809-26820.
Wiedensohler, A., Wehner, B., Birmili, W., 2002. Aerosol number
concentrations and size distributions at mountain-rural, urban-influenced
rural, and urban-background sites in Germany. Journal of Aerosol Medicine-
Deposition Clearance and Effects in the Lung 15 (2), 237-243.

178
Zhu, Y., Hinds, W.C., Kim, S., Sioutas C., 2002a. Concentration and size
distribution of ultrafine particles near a major highway. Journal of the Air &
Waste Management Association 52 (9), 1032-1042.
Zhu, Y., Hinds, W.C., Kim, S., Shen, S, Sioutas, C., 2002b. Study of ultrafine
particles near a major highway with heavy-duty diesel traffic. Atmospheric
Environment 36 (27), 4323-4335.
Zhu, Y., Hinds, W.C., Shen, S., Sioutas, C., 2004, Seasonal trends of
concentration and size distribution of ultrafine particles near major highways
in Los Angeles, Aerosol Science & Technology 38 (S1), 5-13.
Zhu, Y., Kuhn, T., Mayo, P., Hinds, W.C., 2006. Comparison of daytime and
nighttime concentration profiles and size distributions of ultrafine particles
near a major highway. Environmental Science & Technology 40, 2531-2536.
179
CHAPTER 5
DERIVATION OF MOTOR VEHICLE TAILPIPE PARTICLE EMISSION FACTORS

180
5. OVERVIEW OF CHAPTERS 5.1. AND 5.2.
Current knowledge concerning which are the most suitable emission factors to use in
transport modelling is patchy and ill-defined.
This Chapter presents a rigourous method developed to derive a comprehensive set of
particle emission factors that can be used in transport modelling and health impact
assessments to quantify inventories for motor vehicle fleets, and also presents the
outputs from the statistical models developed to derive these average emission
factors.
181
CHAPTER 5.1.
This Chapter presents the second paper of the PhD project. This paper presents a
comprehensive set of particle emission factors for urban motor vehicle fleets, which
can be used in transport modelling and health impact assessments to derive size-
resolved inventories of tailpipe particle emissions covering the full size range of
particles emitted from vehicles, and includes emission factors for particle number,
particle volume, PM1, PM2.5 and PM10 for different Vehicle and Road Type
combinations.
The paper discusses the method used to derive average emission factors and the
rationale for selection of the most suitable emission factors. The approach included
development of five statistical models that produced average emission factors, based
on a statistical analysis of 667 particle emission factors in the international published
literature. The paper also identified a number of gaps in our current knowledge about
motor vehicle emission factors related to exhaust and non-exhaust emissions.
The emission factors considered the most suitable to use in transport modelling
presented in this paper are suitable for deriving inventories for urban fleets in other
developed countries, and have particular application for areas which may have no, or
insufficient measurement data, upon which to derive emission factors.

182
CHAPTER 5.2.
Chapter 5.2 presents the outputs of the five statistical models developed to produce
average emission factors; and results of statistical tests that examined differences in
average emission factors related to categorical variables examined in the statistical
models. These two topics are also discussed in the paper presented in Chapter 5.1.
The statistical model outputs presented in this Chapter include the explanatory model
variables and their average emission factors, associated 95% confidence intervals and
standards errors, for particle number, particle volume, PM1, PM2.5 and PM10. From
these statistical model outputs, the most suitable emission factors for different Vehicle
and Road Type combinations for different particle metrics were selected. These are
shown in Tables 5.2.1-5.2.5 in bold italics shaded gray in Chapter 5.2, and are also
summarised in Table 5.1.4 in Chapter 5.1.
Chapter 5.2 also presents a multiple comparison plot, Figure 5.2.1, which depicts the
statistical relationships between average values of published emission factors for
categorical variables examined in the statistical analysis. The results depicted in this
plot are also referred to in the paper presented in Chapter 5.1.

183
CHAPTER 5.1
DERIVATION OF MOTOR VEHICLE TAILPIPE PARTICLE
EMISSION FACTORS SUITABLE FOR MODELLING URBAN
FLEET EMISSIONS AND AIR QUALITY ASSESSMENTS
Diane U. Keogh1, Joe Kelly2, Kerrie Mengersen2, Rohan Jayaratne1, Luis Ferreira3,
Lidia Morawska1
1 International Laboratory for Air Quality and Health, Queensland University of
Technology, Gardens Point, Brisbane, Australia
2 School of Mathematical Sciences, Queensland University of Technology,
Gardens Point, Brisbane, Australia
3 School of Urban Development, Queensland University of Technology,
Gardens Point, Brisbane, Australia
Environmental Science and Pollution Research – International. Published online, doi
0.1007/s11356-009-0210-9.

184
STATEMENT OF JOINT AUTHORSHIP
Title: Derivation of motor vehicle particle tailpipe particle emission
factors suitable for modelling urban fleet emissions and air
quality assessments
Authors: Diane U. Keogh, Joe Kelly, Kerrie Mengersen, Rohan Jayaratne,
Luis Ferreira, and Lidia Morawska
Diane U. Keogh (candidate)
Developed the experimental design and scientific method of the study. Data
collection, interpretation and processing. Analysis and interpretation of statistical
model outputs. Wrote the majority of the manuscript.
Joe Kelly
Developed the statistical models and conducted the statistical tests.
Kerrie Mengersen
Contributed to the experimental design and scientific method for the
statistical models and statistical tests. Contributed to the manuscript.
Rohan Jayaratne
Assisted with the manuscript
Luis Ferreira
Reviewed the manuscript.
Lidia Morawska
Contributed to the design in relation to classification of emission factors
relating to measurement methodology used.
185
ABSTRACT
Background, aim, and scope Urban motor vehicle fleets are a major source of
particulate matter pollution, especially of ultrafine particles (diameters < 0.1 µm), and
exposure to particulate matter has known serious health effects. A considerable body
of literature is available on vehicle particle emission factors derived using a wide
range of different measurement methods for different particle sizes, conducted in
different parts of the world. Therefore the choice as to which are the most suitable
particle emission factors to use in transport modelling and health impact assessments
presented as a very difficult task. The aim of this study was to derive a
comprehensive set of tailpipe particle emission factors for different vehicle and road
type combinations, covering the full size range of particles emitted, which are suitable
for modelling urban fleet emissions.
Materials and methods A large body of data available in the international literature
on particle emission factors for motor vehicles derived from measurement studies was
compiled and subjected to advanced statistical analysis, to determine the most
suitable emission factors to use in modelling urban fleet emissions.
Results This analysis resulted in the development of five statistical models which
explained 86%, 93%, 87%, 65% and 47% of the variation in published emission
factors for particle number, particle volume, PM1, PM2.5 and PM10 respectively. A
sixth model for total particle mass was proposed but no significant explanatory
variables were identified in the analysis. From the outputs of these statistical models,
the most suitable particle emission factors were selected. This selection was based on

186
examination of the statistical robustness of the statistical model outputs, including
consideration of conservative average particle emission factors with the lowest
standard errors, narrowest 95% confidence intervals and largest sample sizes, and the
explanatory model variables, which were Vehicle Type (all particle metrics),
Instrumentation (particle number and PM2.5), Road Type (PM10) and Size Range
Measured and Speed Limit on the Road (particle volume).
Discussion A multiplicity of factors need to be considered in determining emission
factors that are suitable for modelling motor vehicle emissions, and this study derived
a set of average emission factors suitable for quantifying motor vehicle tailpipe
particle emissions in developed countries.
Conclusions The comprehensive set of tailpipe particle emission factors presented in
this study for different vehicle and road type combinations enable the full size range
of particles generated by fleets to be quantified, including ultrafine particles
(measured in terms of particle number). These emission factors have particular
application for regions which may have a lack of funding to undertake measurements,
or insufficient measurement data upon which to derive emission factors for their
region.
Recommendations and perspectives In urban areas motor vehicles continue to be a
major source of particulate matter pollution and of ultrafine particles. It is critical
that in order to manage this major pollution source methods are available to quantify
187
the full size range of particles emitted for transport modelling and health impact
assessments.
Keywords: ANOVA; emission factors; linear regression; motor vehicles;
multiple comparison; particle mass; particle number; Scheffe; ultrafine
particles.
5.1. BACKGROUND, AIM AND SCOPE
In urban areas motor vehicle fleets are the main source of particulate matter pollution,
and these particles span a very broad size range (diameters 0.003–10 µm); however
most are ultrafine size and measured in terms of particle number (number
concentration of particles with diameters < 0.1 µm) (Harrison et al. 1999; Shi and
Harrison 1999; Shi et al. 1999; Shi et al. 2001; Morawska 2003; Wahlin et al. 2001).
For this reason, it is critical that particle number emissions be included in
development of motor vehicle inventories and health impact assessments.
Emission factors are used in combination with transport data to develop inventories,
and a very large body of data on emission factors derived from measurements is
available in the international literature. These relate to measurement studies of
vehicles under different driving conditions conducted on dynamometers in
laboratories, on or near roads, and in tunnels. A wide range of different measurement
methods have been used for different particle sizes, conducted in different parts of the
world, and a multiplicity of issues need to be considered and resolved in order to

188
derive emission factors. Factors can include vehicle type, fuel type, vehicle age,
technologies fitted, speed and load, road environment characteristics, driving cycles,
driving patterns, method and instrumentation used and size range measured, to name
a few. This extensive body of data on particle emission factors has never been
comprehensively analysed, and the question that remains is - Which tailpipe particle
emission factors are the most suitable to use in transport modelling and health
impact assessments of motor vehicle fleets?
Many mobile emission source models are available in developed countries which
utilise performance-based emission factors (related to emissions generated per
vehicle per kilometre derived from measurement data), for example, the average
speed models MOBILE (USEPA 1993), EMFAC (CARB 2002), COPERT (Ahlvik et
al. 1997; Ntziachristos et al. 2000; Bellasio et al. 2007); and VERSIT+ LD (Smit et
al. 2007) which considers actual driving pattern data. Most of these models provide
estimates for PM10, and to a lesser extent PM2.5. COPERT IV, however, has available
a small suite of solid particle number emission factors for different vehicle types
derived from dynamometer measurements (Samaras et al. 2005).
In developing countries access to land use and transport network data is often rare
(Walker et al. 2008) and hence more indirect methods for estimating emissions are
commonly used, such as basing emission factors on estimated total fuel consumed or
on remotely sensed data. Emission estimates based on remotely sensed data usually
provide a snapshot of emissions relating to a limited number of locations, and may
189
not be representative of activity patterns for a typical trip in a region (Frey et al.
2002b); and the accuracy of fuel-based models can depend on how well the driving
modes, vehicle and age distribution from which the emission factors were derived
represent the study region (Frey et al. 2002 a,b).
The aim of this work was to identify the most suitable tailpipe particle emission
factors to use in transport modelling and health impact assessments to quantify motor
vehicle fleet particle emissions in terms of particle number, particle volume, PM1,
PM2.5 and PM10 emissions, based on analysis of emission factors derived from
measurement data. Emission factors for brake and tyre wear, road dust and particle
surface area emissions were not considered in this analysis as only limited data exists
in the literature.
5.2. MATERIALS AND METHODS
An extensive review was conducted of emission factors published in the international
literature for particle number, particle volume, total particle mass, PM1, PM2.5 and
PM10 for motor vehicle tailpipe emissions. Details of the literature reviewed and
studies from which emission factor data was sourced for this study are outlined in
Table 5.1.1. Based on this review, statistical models were developed and emission
factor data classified and grouped into relevant sub-classes within each model
variable class. Statistical model output data were analysed and a rationale developed
to identify the most suitable average emission factors to use in modelling urban motor
vehicle emissions.
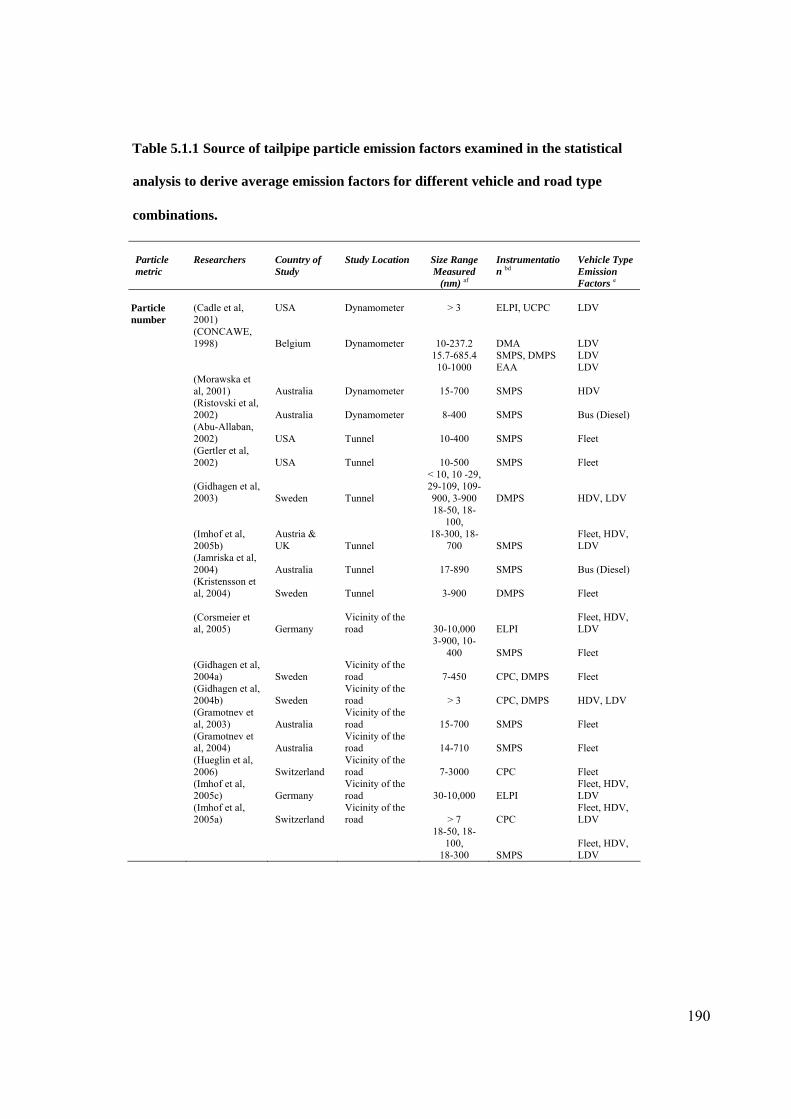
190
Table 5.1.1 Source of tailpipe particle emission factors examined in the statistical
analysis to derive average emission factors for different vehicle and road type
combinations.
Particle metric
Researchers
Country of Study
Study Location
Size Range Measured
(nm) af
Instrumentation bd
Vehicle Type Emission Factors e
Particle number
(Cadle et al, 2001)
USA
Dynamometer
> 3
ELPI, UCPC
LDV
(CONCAWE, 1998) Belgium Dynamometer 10-237.2 DMA LDV
15.7-685.4 SMPS, DMPS LDV 10-1000 EAA LDV
(Morawska et al, 2001) Australia Dynamometer 15-700 SMPS HDV
(Ristovski et al, 2002) Australia Dynamometer 8-400 SMPS Bus (Diesel)
(Abu-Allaban, 2002) USA Tunnel 10-400 SMPS Fleet
(Gertler et al, 2002) USA Tunnel 10-500 SMPS Fleet
(Gidhagen et al, 2003) Sweden Tunnel
< 10, 10 -29, 29-109, 109-900, 3-900 DMPS HDV, LDV
(Imhof et al, 2005b)
Austria & UK Tunnel
18-50, 18-100,
18-300, 18-700 SMPS
Fleet, HDV, LDV
(Jamriska et al, 2004) Australia Tunnel 17-890 SMPS Bus (Diesel)
(Kristensson et al, 2004) Sweden Tunnel 3-900 DMPS Fleet
(Corsmeier et al, 2005) Germany
Vicinity of the road 30-10,000 ELPI
Fleet, HDV, LDV
3-900, 10-
400 SMPS Fleet
(Gidhagen et al, 2004a) Sweden
Vicinity of the road 7-450 CPC, DMPS Fleet
(Gidhagen et al, 2004b) Sweden
Vicinity of the road > 3 CPC, DMPS HDV, LDV
(Gramotnev et al, 2003) Australia
Vicinity of the road 15-700 SMPS Fleet
(Gramotnev et al, 2004) Australia
Vicinity of the road 14-710 SMPS Fleet
(Hueglin et al, 2006) Switzerland
Vicinity of the road 7-3000 CPC Fleet
(Imhof et al, 2005c) Germany
Vicinity of the road 30-10,000 ELPI
Fleet, HDV, LDV
(Imhof et al, 2005a) Switzerland
Vicinity of the road > 7 CPC
Fleet, HDV, LDV
18-50, 18-100,
18-300 SMPS Fleet, HDV, LDV

191
Particle metric
Researchers
Country of Study
Study Location
Size Range Measured
(nm) af
Instrumentation bd
Vehicle Type Emission Factors e
Particle Number (c’td)
(Jamriska and Morawska, 2001) Australia
Vicinity of the road 17-890 SMPS Fleet
(Jones and Harrison, 2006) UK
Vicinity of the road
11-30, 30-100,
11-450, 101-450 SMPS HDV, LDV
(Ketzel et al, 2003) Denmark
Vicinity of the road 10-700 CPC, DMPS Fleet
(Kittelson et al, 2004) USA
Vicinity of the road 8-300 SMPS Fleet
3-1000 CPC Fleet
(Morawska et al, 2005) Australia
Vicinity of the road 17-890 SMPS
Fleet, HDV, LDV
700-20,000 APS Fleet, HDV, LDV
(Zhu and Hinds, 2005) USA
Vicinity of the road > 6 CPC Fleet
Particle volume
(Imhof et al, 2005b)
Austria & UK Tunnel
18-50, 18-100,
18-300, 18-700 SMPS
Fleet, HDV, LDV
(Corsmeier et al, 2005) Germany
Vicinity of the road 30-10,000 ELPI HDV, LDV
(Imhof et al, 2005c) Germany
Vicinity of the road 29-250 ELPI
Fleet, HDV, LDV
29-640, 29-
1000 ELPI Fleet
(Imhof et al, 2005a) Switzerland
Vicinity of the road
18-50, 18-100,
18-300 SMPS Fleet, HDV, LDV
Total Particle mass
(Ayala et al, 2002) USA Dynamometer
MOUDI, ELPI, SMPS
Bus (Diesel & CNG)
(Chatterjee et al, 2002) USA Dynamometer not reported Bus (Diesel)
(Clark et al, 1997 & 1998) USA Dynamometer not reported
Bus (Diesel & CNG)
(Clark et al, 1999) USA Dynamometer not reported
Bus (Diesel & CNG)
(CONCAWE, 1998) Belgium Dynamometer 17.9-16,000
Berner impactor & filter paper LDV
(Kado et al, 2005) USA Dynamometer not reported
Bus Diesel & CNG)
(Lanni et al, 2003) Canada Dynamometer Pallflex filters
Bus Diesel & CNG)
(Lowell et al, 2003)
USA & Canada Dynamometer not reported
Bus( Diesel, CNG, LNG)

192
Particle metric
Researchers
Country of Study
Study Location
Size
Range Measured
(nm) af
Instrumentation bd
Vehicle Type Emission Factors e
Total Particle mass (c’td)
(Morawska et al, 1998) Australia Dynamometer 8-300 SMPS Bus Diesel
(Bradley, 2000) USA Dynamometer Fibreglass filters Bus (Diesel, CNG, Hybrid)
(SAE, 2001; 2002a,b; 2003a, b; cited in Lowell et al, 2003)
USA & Canada Dynamometer not reported
Bus (Diesel, CNG)
(CARB, 2001; ARB's, 2002 cited in Lowell et al, 2003) USA Dynamometer not reported
Bus (Diesel & CNG)
(Ubanwa et al, 2003) USA Dynamometer not reported
HDV, Bus (Diesel)
(Wayne et al, 2004) USA Dynamometer not reported
Bus (Diesel, LNG, Hybrid)
(Jamriska et al, 2004) Australia Tunnel 17-700 SMPS Bus (Diesel)
(Holmen et al, 2005) USA
Vicinity of the road Telfon filters
Bus (Diesel), Hybrid Bus
(Kittelson et al, 2004) USA
Vicinity of the road 8-300 SMPS Fleet
(Mazzoleni et al, 2004) USA
Vicinity of the road Remote sensing Fleet
(Shah et al, 2004) USA
Vicinity of the road Teflon filters Fleet, HDV
(Zhang et al, 2005) USA
Vicinity of the road 6-220 inverse modelling
HDV, LDV
> 220c inverse modelling HDV, LDV
(Abu-Allaban et al, 2003b) USA
Vicinity of the road Chemical balance HDV, LDV

193
Particle metric
Researchers
Country of Study
Study
Size Range Measured
(nm) af
Instrumentation bd
Vehicle Type Emission Factors e
PM1 (DOEH, 2003) Australia Dynamometer sm APS HDV, LDV
(Imhof et al, 2005b) Austria & UK Tunnel sm Kleinfiltergerate
Fleet, HDV, LDV
(Gehrig et al, 2004) Switzerland
Vicinity of the road sm Beta-ray
Fleet, HDV, LDV
(Imhof et al, 2005a) Switzerland
Vicinity of the road sm Betameter
Fleet, HDV, LDV
PM2.5 (NEPC, 2000) Australia Dynamometer sm APS HDV, LDV
(Wayne et al, 2004) USA Dynamometer sm Glass-fibre filter
Bus (Diesel & LNG), Hybrid Bus
(Gertler et al, 2002) USA Tunnel sm
IMPROVE sampler
Fleet, HDV, LDV
(Gillies et al, 2001) USA Tunnel sm
Medium-volume samplers Fleet
(Imhof et al, 2005b) UK Tunnel sm TEOM
Fleet, HDV, LDV
(Jamriska et al, 2004) Australia Tunnel sm TEOM, DustTrak Bus (Diesel)
(Kristensson et al, 2004) Sweden Tunnel sm TEOM & DMPS Fleet
(Tran et al, 2003) Australia Tunnel sm Teflon filters HDV, LDV
(Abu-Allaban et al, 2003a) USA
Vicinity of the road sm DustTrak
HDV, LDV, Bus
(Morawska et al, 2004) Australia
Vicinity of the road sm DustTrak Fleet
(Abu-Allaban et al, 2003b) USA
Vicinity of the road sm Chemical balance HDV, LDV
PM10
(Cadle et al, 1997)
USA
Dynamometer
sm
Teflon & Quartz filters LDV
(Cadle et al, 2001) USA Dynamometer sm MOUDI LDV
(Lowell et al, 2003)
USA & Canada
Dynamometer
sm
not reported
Bus (Diesel)
(NEPC, 2000) Australia Dynamometer sm APS HDV, LDV
(Romilly, 1999) UK Dynamometer sm not reported
LDV, Bus, Midibus, Minibus
(SAE, 2001; SAE, 2002a) cited in Lowell et al, 2003)
USA & Canada Dynamometer sm not reported
Bus (Diesel & CNG)
(Wayne et al, 2004) USA Dynamometer sm not reported
Bus (Diesel & LNG), Hybrid Bus
(Gertler et al, 2002) USA Tunnel sm DustTrak
Fleet, HDV, LDV
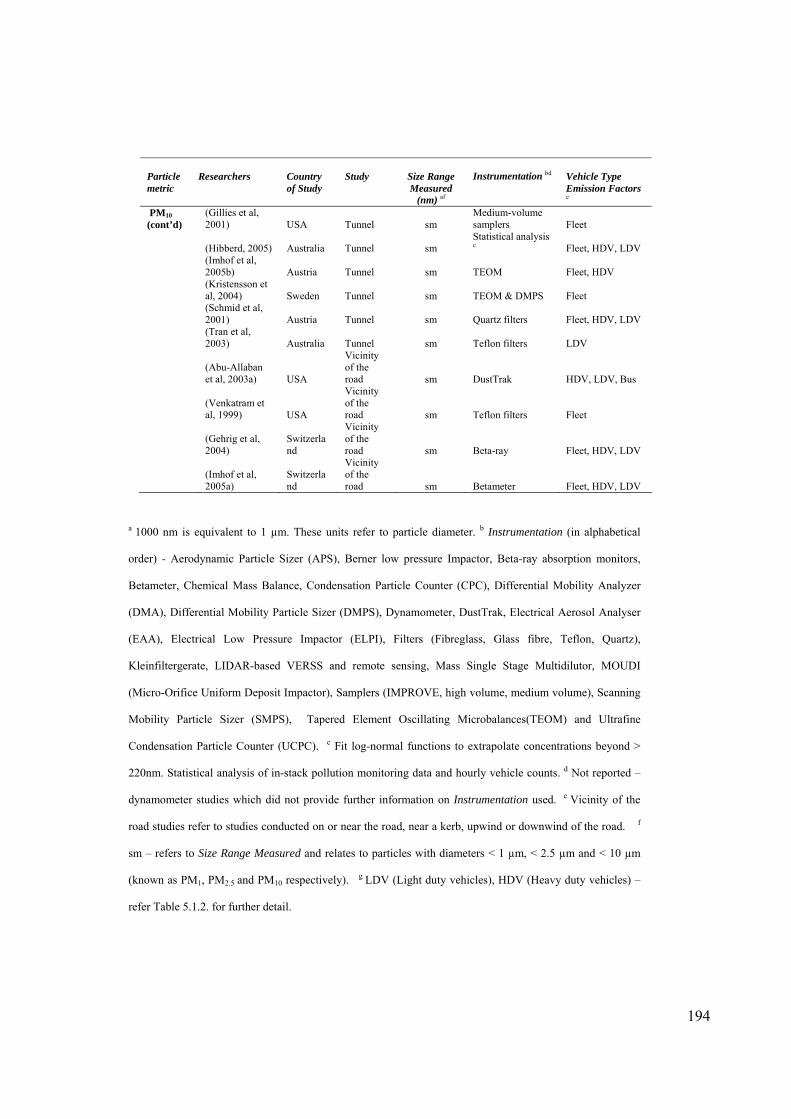
194
Particle metric
Researchers
Country of Study
Study
Size Range Measured
(nm) af
Instrumentation bd
Vehicle Type Emission Factors e
PM10 (cont’d)
(Gillies et al, 2001) USA Tunnel sm
Medium-volume samplers Fleet
(Hibberd, 2005) Australia Tunnel sm
Statistical analysis c Fleet, HDV, LDV
(Imhof et al, 2005b) Austria Tunnel sm TEOM Fleet, HDV
(Kristensson et al, 2004) Sweden Tunnel sm TEOM & DMPS Fleet
(Schmid et al, 2001) Austria Tunnel sm Quartz filters Fleet, HDV, LDV
(Tran et al, 2003) Australia Tunnel sm Teflon filters LDV
(Abu-Allaban et al, 2003a) USA
Vicinity of the road sm DustTrak HDV, LDV, Bus
(Venkatram et al, 1999) USA
Vicinity of the road sm Teflon filters Fleet
(Gehrig et al, 2004)
Switzerland
Vicinity of the road sm Beta-ray Fleet, HDV, LDV
(Imhof et al, 2005a)
Switzerland
Vicinity of the road sm Betameter Fleet, HDV, LDV
a 1000 nm is equivalent to 1 µm. These units refer to particle diameter. b Instrumentation (in alphabetical
order) - Aerodynamic Particle Sizer (APS), Berner low pressure Impactor, Beta-ray absorption monitors,
Betameter, Chemical Mass Balance, Condensation Particle Counter (CPC), Differential Mobility Analyzer
(DMA), Differential Mobility Particle Sizer (DMPS), Dynamometer, DustTrak, Electrical Aerosol Analyser
(EAA), Electrical Low Pressure Impactor (ELPI), Filters (Fibreglass, Glass fibre, Teflon, Quartz),
Kleinfiltergerate, LIDAR-based VERSS and remote sensing, Mass Single Stage Multidilutor, MOUDI
(Micro-Orifice Uniform Deposit Impactor), Samplers (IMPROVE, high volume, medium volume), Scanning
Mobility Particle Sizer (SMPS), Tapered Element Oscillating Microbalances(TEOM) and Ultrafine
Condensation Particle Counter (UCPC). c Fit log-normal functions to extrapolate concentrations beyond >
220nm. Statistical analysis of in-stack pollution monitoring data and hourly vehicle counts. d Not reported –
dynamometer studies which did not provide further information on Instrumentation used. e Vicinity of the
road studies refer to studies conducted on or near the road, near a kerb, upwind or downwind of the road. f
sm – refers to Size Range Measured and relates to particles with diameters < 1 µm, < 2.5 µm and < 10 µm
(known as PM1, PM2.5 and PM10 respectively). g LDV (Light duty vehicles), HDV (Heavy duty vehicles) –
refer Table 5.1.2. for further detail.

195
5.2.1. Model variables examined
From an original population of over 900 emission factors reviewed in this study, the
final emission factor sample size obtained was 667. This occurred due to the high
number of missing data in the studies, as not all studies reported the same
information. The model variables developed for the statistical analysis were based on
data commonly reported in studies.
Data relating to a total of 667 particle emission factors were examined grouped into
relevant sub-classes within each model variable class. The categorical model
variables developed were Particle Metric, Country of Study, Study Location,
Instrumentation, Vehicle Type, Fuel Type, Road Type, Road Class; and the
continuous model variables were Size Range Measured, Average Vehicle Speed,
Speed Limit on the Road, Average Number of Vehicles travelling in a fleet per day,
Drive Cycles, Engine Power, Heavy Duty Vehicle (HDV) Share, Number of HDVs
travelling in a fleet per day. These model variables are described in Table 5.1.2, and
the sample size of emission factors relating to these model variables are shown in
Table 5.1.3.

196
Table 5.1.2 Model variables examined in the statistical analysis to derive average
emission factors to use in transport modelling and health impact assessments, to
quantify tailpipe particle emissions generated by motor vehicle fleets
Model Variable Name
Model Variable Sub-classes
Particle Metric Particle number, particle volume, total particle mass, PM1, PM2.5, PM10
Country of Study Australia; USA/Canada; Other Countries (Austria, Belgium, Denmark, Germany, Sweden, Switzerland, UK) a
Study Location Dynamometer (in a laboratory), tunnel or in the vicinity of a road b Road Type Boulevard, freeway, highway, motorway, rural area, tunnel, urban c Speed Limit on the Road
The reported Speed Limit on the Road d
Road Class Urban and Non-Urban roads; Highway and Non-Highways roads e Average Number of Vehicles Per Day
The average number of vehicles travelling in a vehicle fleet per day f
Heavy Duty Vehicle Share
Percentage of heavy duty vehicles (HDVs) travelling in a vehicle fleet per day g
Number of HDVs Per Day
Number of HDVs travelling in a vehicle fleet per day h
Vehicle Type Fleet, light duty vehicles (LDVs), heavy duty vehicles (HDVs) Bus i Fuel Types Diesel, Gasoline, Compressed Natural Gas, Liquefied Natural Gas j Drive Cycles Drive Cycles for Buses, Trucks and Other vehicles k Average Vehicle Speed
Average Vehicle Speed tested on a dynamometer or reported in a tunnel or vicinity of the road study l
Engine Power Reported for two bus studies m Instrumentation 20 different types of Instrumentation n Size Range Measured
Size Range Measured by Instrumentation o
a Groups based on numbers of studies found. b Vicinity of the road - on or near the road, near a curb,
upwind, downwind of a road. c Urban Drive Cycle data classed as urban Road Type. d Few studies
reported, where reported was Boulevard 82, highway 82 and 100, freeway 100, motorway 120, tunnel
60, 64, 80, 89, urban 50 and 57 km/hr. e Road Class based on either the reported Speed Limit on the
Road, or the speed limit that would most likely be associated with the Road Type. < 60 road classed
Urban; ≥ 60 non-Urban; ≥ 80 Highway; < 80 km/hr non-Highway. Insufficient data were available to
examine individual speeds or other specific speed ranges. f Ranges 13,128-103,080 per day particle
number; 23,000-30,000 particle volume; 12,540-12,900 total particle mass; 20,000-69,816 PM1;
20,000-69,816 per day PM10. 5 buses/minute particle number and PM2.5. g Ranges 5-100% particle
197
number, 7-60% particle volume; 1-100% total particle mass, PM2.5; 6.1-18% PM1; 2.6-83% for PM10.
h Derived where data for both Average Number of Vehicles Per Day and Heavy Duty Vehicle Share (%)
were available. i Based on author classifications, including HDV (number of axles, gross vehicle mass
or length); LDV (wheel pair distance, vehicle length or weight). LDVs included cars and trucks with
specified vehicle weights; and HDVs with gross vehicle mass ranging from 3.5-12 tonne to > 25 tonne.
j Few reported diesel fuel sulphur content, where reported was < 15ppm, < 30 ppm Ultralow sulphur
diesel (ULSD) HDV; 300ppm Low sulphur diesel (LSD) for Bus, 24-480ppm for LDV and HDV.
Diesel, ULSD and LSD classed as diesel Fuel Type. k Buses - Bus Route, Central Bus District, Central
Business District – Aggressive Driving, Composite, CUEDC cycle, Manhattan, New York Bus,
Orange County Transit Authority, Route 22, Route 77, UDDS and Urban. Other vehicles - CUEDC
cycle, FTP, HHDDT; Hot UC, Hot Cycle, Cold Cycle, REP05, Steady State, UC and Urban. Trucks -
CBD–CBD14, HDCC. l Ranges < 50, 50-120 particle number, 86-113 particle volume; 80-120 total
particle mass; 30-90 PM1; 45-91 PM2.5; < 65 and 45-91 km/hr for PM10. m Engine Power: Reported in
two diesel bus studies (Jamriska et al. 2004; Ristovski et al. 2002). Instrumentation (in alphabetical
order) Aerodynamic Particle Sizer, Berner low pressure Impactor, Betameter, Beta-ray absorption
monitors, Chemical Mass Balance, Condensation Particle Counter, Differential Mobility Analyzer,
Differential Mobility Particle Sizer, DustTrak, Electrical Aerosol Analyser, Electrical Low Pressure
Impactor, Filters (Fibreglass, Glass fibre, Teflon, Quartz), Kleinfiltergerate, LIDAR-based VERSS and
remote sensing, Mass Single Stage Multidilutor, Micro-Orifice Uniform Deposit Impactor, Samplers,
Scanning Mobility Particle Sizer, Tapered Element Oscillating Microbalances, Ultrafine Condensation
Particle Counter. o Particle number 0.003-1 µm (dynamometer), 0.01-0.9 µm (tunnel), 0.003-20 µm
(vicinity of the road); particle volume 0.018-10 µm. Ranges particle number 0.003-1 µm
(dynamometer), 0.01-0.9 µm (tunnel studies), 0.003-20 µm (vicinity of the road), total particle number
count > 3 nm; 0.018-10 µm (particle volume). Few size ranges reported in total particle mass studies,
where reported 0.008-16 µm (dynamometer), 0.017-0.7 µm (tunnel), 0.008-0.3 µm, > 0.22 µm vicinity
of the road.
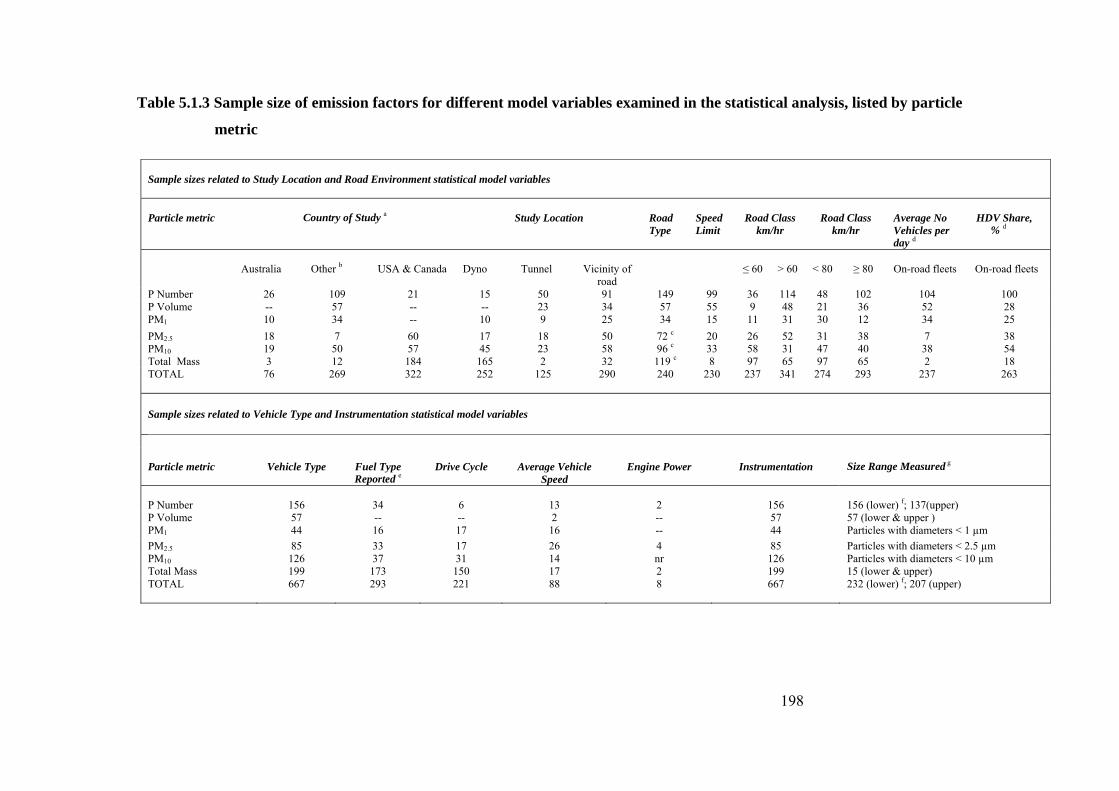
198
Table 5.1.3 Sample size of emission factors for different model variables examined in the statistical analysis, listed by particle
metric
Sample sizes related to Study Location and Road Environment statistical model variables Particle metric
Country of Study a
Study Location
Road Type
Speed Limit
Road Class
km/hr
Road Class
km/hr
Average No Vehicles per day d
HDV Share,
% d
Australia
Other b
USA & Canada
Dyno
Tunnel
Vicinity of
road
≤ 60
> 60
< 80
≥ 80
On-road fleets
On-road fleets
P Number 26 109 21 15 50 91 149 99 36 114 48 102 104 100 P Volume -- 57 -- -- 23 34 57 55 9 48 21 36 52 28 PM1 10 34 -- 10 9 25 34 15 11 31 30 12 34 25 PM2.5 18 7 60 17 18 50 72 c 20 26 52 31 38 7 38 PM10 19 50 57 45 23 58 96 c 33 58 31 47 40 38 54 Total Mass 3 12 184 165 2 32 119 c 8 97 65 97 65 2 18 TOTAL 76 269 322 252 125 290 240 230 237 341 274 293 237 263 Sample sizes related to Vehicle Type and Instrumentation statistical model variables
Particle metric
Vehicle Type
Fuel Type Reported e
Drive Cycle
Average Vehicle
Speed
Engine Power
Instrumentation
Size Range Measured g
P Number
156
34
6
13
2
156
156 (lower) f; 137(upper)
P Volume 57 -- -- 2 -- 57 57 (lower & upper ) PM1 44 16 17 16 -- 44 Particles with diameters < 1 µm PM2.5 85 33 17 26 4 85 Particles with diameters < 2.5 µm PM10 126 37 31 14 nr 126 Particles with diameters < 10 µm Total Mass 199 173 150 17 2 199 15 (lower & upper) TOTAL 667 293 221 88 8 667 232 (lower) f; 207 (upper)
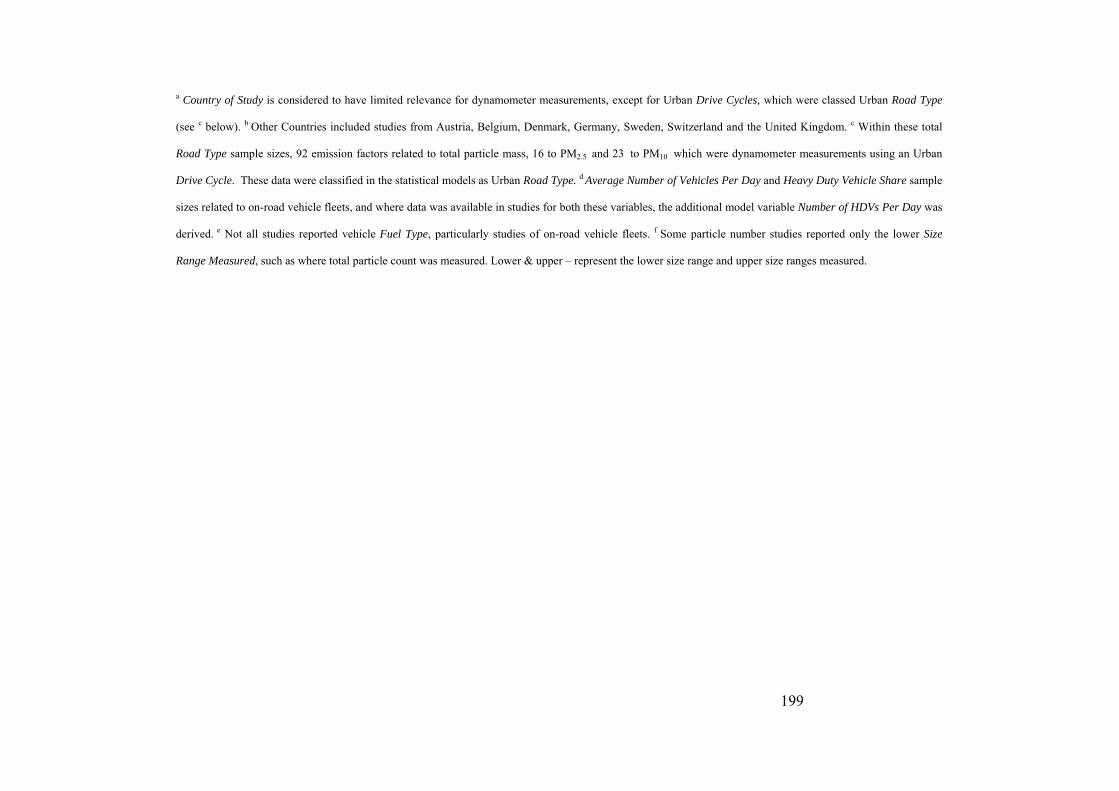
199
a Country of Study is considered to have limited relevance for dynamometer measurements, except for Urban Drive Cycles, which were classed Urban Road Type
(see c below). b Other Countries included studies from Austria, Belgium, Denmark, Germany, Sweden, Switzerland and the United Kingdom. c Within these total
Road Type sample sizes, 92 emission factors related to total particle mass, 16 to PM2.5 and 23 to PM10 which were dynamometer measurements using an Urban
Drive Cycle. These data were classified in the statistical models as Urban Road Type. d Average Number of Vehicles Per Day and Heavy Duty Vehicle Share sample
sizes related to on-road vehicle fleets, and where data was available in studies for both these variables, the additional model variable Number of HDVs Per Day was
derived. e Not all studies reported vehicle Fuel Type, particularly studies of on-road vehicle fleets. f Some particle number studies reported only the lower Size
Range Measured, such as where total particle count was measured. Lower & upper – represent the lower size range and upper size ranges measured.

200
5.2.2 Statistical analysis of variables
We considered the relationship between reported tailpipe particle emission factors for
different particle sizes to the various study-specific explanatory variables (Table
5.1.3) using linear models. In particular, the model for particle number (here denoted
Yi) in study i is related to Vehicle Type (j=1,2,3) and Instrumentation (k=1, …10):
= and Yi = + ei
where is the intercept, is the effect of Vehicle Type j, and is the effect of
instrumentation k, and ei ~ N (0, σ2). A similar model applies on changing the
response (Yi) with different explanatory variables (Xi).
A separate statistical model was developed for each of the six particle metrics
examined in this study and the proportion of variation explained was calculated using
R2 = 1 – ∑ ei2 / Var (Yi). This is the fraction of variability in the dependent variable
(the emission factor) that may be accounted for, or explained, by variation in the
independent variable or variables, where the Var (Yi) is the usual sample variance of
Yi.
In this study the analysis of the data for the categorical variables involved fitting a
univariate general linear model (a multi-factor ANOVA). A stepwise technique, using
both forward and backward elimination, was then used to select the best model. For
the continuous variables linear regression analysis was undertaken with the variables
added as independent explanatory covariates in the general linear model. All analysis

201
was undertaken at a 5% level of significance. Statistically significant variables were
identified through ANOVA tests and post-hoc Scheffe multiple comparisons (Scheffe,
1959). The multiple comparison statistical tests were conducted at a 95% confidence
level for all categorical variables and their sub-classes to determine whether, within
each class of categorical variable, there were statistically significant differences
between the average published emission factor values for different sub-classes of
variable.
Analyses were undertaken in SPSS (SPSS Version 14.0) and from these average
particle emission factors for the different particle metrics, together with their standard
error and 95% confidence interval values, were derived. A separate statistical model
was developed for each of the six particle metrics examined in this study and model
coefficients of determination derived (R2), which provided information about the
fraction of variability in the dependent variable (the emission factor) that may be
accounted for, or explained, by variation in the independent variable or variables.
The statistical models produced average particle emission factors, and their
associated standard error and 95% confidence intervals. The standard error value
provides an indication of how reliable the model is as a means of predicting the
average particle emission factor for the particular combination of values of the
independent variables it relates to. The lower the standard error value, in relation to
its associated average emission factor, the more reliable the predicted average
emission factor may be considered. The lower and upper bound 95% confidence

202
interval values produced by the statistical models for each average emission factor
represent the range within which we can be 95% confident the true value will lie. In
some statistical models combinations of dependent and independent variables
produced high standard error values, and a lower bound 95% confidence interval
value which, although physically uninterpretable, can be obtained as a consequence
of the normal assumptions underlying the models, where these lower bound values
were obtained they were not reported.
5.2.3 Basis for selection of the most suitable emission factors
The wide range of different capabilities of Instrumentation used to derive emission
factors were not evaluated as an aim of this study. The rationale for selection of the
most suitable tailpipe particle emission factors to use in transport modelling and
health impact assessments from the five statistical model outputs was based on the
statistical robustness of the statistical model outputs, including consideration of
conservative average particle emission factors with the lowest standard errors,
narrowest 95% confidence intervals and largest sample sizes. Other factors taken into
account were the explanatory variables found for the statistical models. In
considering the explanatory variable Size Range Measured the focus was on
Instrumentation that measured the widest size ranges, including down to the lowest
size range.
203
5.3. RESULTS
This section presents the tailpipe particle emission factors considered the most
suitable to use in transport modelling and health impact assessments.
5.3.1 Sample sizes of emission factors examined in the statistical models
All average emission factors predicted by the statistical models and presented in this
paper are expressed in particle emissions generated per vehicle per kilometre driven.
It is important to note when considering the sample sizes of emission factors
examined in this study, that a single emission factor may represent one individual
vehicle (or group of vehicles) tested on a dynamometer, or be the average emission
factor derived for a vehicle type (eg., light duty vehicles) travelling in a vehicle fleet
on a road or in a tunnel. Hence, the total sample size examined in this study of 667
emission factors represents a relatively very large sample of motor vehicles.
5.3.2 Statistical models developed to derive average emission factors
Six statistical models were proposed for particle number, particle volume, total
particle mass, PM1, PM2.5 and PM10. The analysis revealed that the statistical models
developed for particle number, particle volume, PM1 and PM2.5 were robust, and
explained 86%, 93%, 87% and 65% respectively of the variation in published
emission factors. However the PM10 model was found to be less robust as it
explained only 47% of the variation in published emission factor values. PM10
emission factors derived from studies conducted on or near roads may have been

204
influenced by varying quantities of resuspended road dust occurring at the PM10 size
range, leading to higher values than those derived from dynamometer and tunnel
studies, and which may have confounded the ability of the statistical model to
explain the variation in published emission factors.
The sixth statistical model for total particle mass was found to be a null model, as no
explanatory variables were identified. This result is likely to be attributed to the fact
that most of the studies simply measured total particle mass, and not different
subsets of particle mass size fractions which typically have differing proportions of
particle mass associated with them.
The final set of average tailpipe particle emission factors considered the most
suitable for use in transport modelling and health impact assessments for different
vehicle and road type combinations, together with their 95% confidence interval
values, are presented in Table 5.1.4. Aspects related to their selection are discussed
below.

205
Table 5.1.4. Tailpipe particle emission factors for motor vehicles considered the most suitable to use in transport modelling and health
impact assessments, derived based on statistical analysis in this study of 667 emission factors in the international published literature
Particle metric
Emission unit per vehicle
Explanatory variables (in bold font)
Fleet emission factor
95% confidence interval
HDV emission factor
95% confidence interval
LDV emission factor
95% confidence interval
Bus emission factor
95% confidence interval
Vehicle Type & Instrumentation
CPC c 7.26 3.85-10.66 65 60.19-69.81 3.63 a-9.85 -- --
Particle number
1014 particles per km
SMPS c -- -- -- -- -- -- 3.08b a-9.30 Particle volume
Cubic cm per km
Vehicle Type, Size Range Measured & Speed Limit on the Road
18-300nm, <= 60 km/hr 0.07 a-0.19 0.93 0.81-1.06 0.03 a-0.15 -- -- 18-700nm, > 60 km/hr 0.04 a-0.16 0.41 0.32-0.49 0.05 a-0.3 -- -- PM1 mg per km Vehicle Type & Fuel
Type Fuel not specified Fuel not specified & diesel Combined
36
--
2-70
--
--
287
--
257-317
16
--
a-50
--
--
--
--
-- PM2.5 mg per km Vehicle Type &
Instrumentation
TEOM & DMPS c DustTrak All Instrumentation
60 -- --
a-166 -- --
-- --
302
-- --
236-367
-- 33 --
-- a-80
--
-- 299b
--
-- 205-394
-- PM10 mg per km Vehicle Type &
Road Type
Boulevard -- -- 4815 3459-6171 454 a-1413 4130ce 2774-5486 Urban 688 a-1546 538 a-1145 156 a-635 1089ce 306-1872 Freeway 200 a-2118 2500 1144-3856 285 a-1244 -- -- Highway 66 a-1421 840 a-1947 141 a-924 -- -- Motorway 77 a-1432 213 a-1568 63 a-1419 -- -- Rural Area 67 a-1984 394 a-2312 46 a-1964 -- -- Tunnel
Dynamometer e 306 a-884 1019 236-1802 14 a- 797 --
313ce --
a-753

206
a The lower bound 95% confidence interval value calculated to be negative and therefore is not valid. These values, although physically uninterpretable, can be
obtained as a consequence of the normal assumptions underlying the models, and hence are not reported. b Diesel buses. c Buses – Fuel not specified (can be
assumed to be Diesel-fuelled due to the timing and location of the studies), principally Diesel-fuelled buses. d Condensation Particle Counter (CPC), Scanning
Mobility Particle Sizer (SMPS), Tapered Element Oscillating Microbalances(TEOM) and Differential Mobility Analyzer (DMA). e The average dynamometer
emission factor for buses for PM10 is also presented; as the on-road boulevard and urban Road Type studies were reported to be affected by very high levels of
resuspended road dust and the influence of variation in acceleration and speed (Abu-Allaban et al. 2003).

207
5.4. DISCUSSION
This section discusses the tailpipe particle emission factors considered the most
suitable to use in transport modelling and health impact assessments for different
particle metrics; and the results of statistical tests that examined differences in
mean values of published emission factors.
5.4.1. Statistical models used to derive average emission factors
These are discussed below for different particle metrics.
Particle number model: This statistical model explained 86% of the variation in
published emission factors (n=156). Vehicle Type and Instrumentation were the
explanatory model variables and emission factors were available for 10 different
Instrumentation. In selecting the most suitable emission factors, it was important
to consider Instrumentation that measured the lowest possible size range,
including down to 0.003 µm where particle number emissions tend to be very
prolific. This lower limit size range is commonly measured by the Condensation
Particle Counter (CPC), which estimates particle count, and emission factors
based on CPC measurements were available in the literature for Fleet, light duty
vehicles (LDV) and heavy duty vehicles (HDV). However particle number
emission factors for Diesel buses were restricted to those derived from Scanning
Mobility Particle Sizer (SMPS) measurements.
The SMPS focuses on estimating particle size distribution (as opposed to total
particle count) and does not measure the lower size range of the nucleation mode
< 0.01 µm. The lower size window for the SMPS is commonly set higher than for

208
the CPC, usually in the range 0.01-0.02 µm, whereas for the CPC the range is
usually 0.002-0.01 µm, which means that generally the CPC measures the lower
size range of the nucleation mode and the SMPS does not.
Particle volume model: This statistical model explained 93% of the variation in
published emission factors (n=57) and the explanatory model variables included
Vehicle Type, Speed Limit on the Road and Size Range Measured. Consideration
was given to selecting emission factors which related to the broadest size ranges
measured, including down to the lowest possible size range, and to different
reported Speed Limits on the Road. Most of the average particle volume emission
factors, and their 95% confidence interval values, produced by the statistical
model were less than 1 cm3 per vehicle per kilometre. For almost all the particle
volume emission factors Speed Limit on the Road or in the tunnel was reported,
and the availability of this data may have contributed to the statistical model’s
high R2 value of 0.93.
PM1 model: The explanatory variables for this statistical model were Vehicle
Type and Fuel Type, which explained 87% of the variation in published emission
factors (n=44). Emission factors examined in the analysis included those derived
for diesel vehicles measured on a dynamometer; and from studies conducted on or
near roads or in tunnels where the Fuel Type was not specified. The literature
review revealed that at the time of this study the majority of LDVs were petrol-
fuelled and HDVs diesel-fuelled, hence it can be assumed that these were the
dominant Fuel Types in the vehicle fleets studied.
209
Few data are available in the literature for PM1 emission factors, and given that
most motor vehicle particle emissions are < 1 µm (dominated by ultrafine
particles) this is an important size range to have a comprehensive database for.
Recent research found that a combination of PM1 and PM10 mass ambient air
quality standards are likely to be more suitable to control combustion and
mechanically-generated sources, such as motor vehicles, than the current
standards of PM2.5 and PM10 (Morawska et al. 2008), further emphasising the
importance of deriving PM1 emission factors.
PM2.5 model: Sixty-five percent of the variation in published emission factors
(n=85) was explained by this statistical model, and its explanatory variables were
Vehicle Type and Instrumentation. Emission factors were examined for 8
different Instrumentation reported in the literature.
PM10 model: For PM10 the explanatory variables were Vehicle Type and Road
Type, and this statistical model explained 47% of the variation in published
emission factors (n=126). This low value for R2 is reflected in the large values for
standard errors (in relation to the predicted average emission factor) and high
values for upper bound 95% confidence intervals produced by the statistical
model. The presence of varying amounts of resuspended road dust at the PM10
size range are likely to have influenced emission factors derived in on-road
studies, as compared to those derived from dynamometer and tunnel studies, and
is likely to have confounded the explanation of variation. Few methods are
available for discriminating road dust from tailpipe emissions, particularly at the
PM2.5 and PM10 size ranges, and quantities of road dust can vary depending on the

210
construction material of road surfaces and their maintenance, climatic conditions,
and other factors such as vehicle speed and traffic volumes.
Few bus emission factors are available derived from on-road measurements and
those available and included in the statistical model related to measurements on
boulevard and urban Road Types in the US (Abu-Allaban et al. 2003a). However
the authors of this study considered their high PM10 emission factors were
influenced by significantly high contributions from resuspended road dust and,
within each vehicle category, by the effects of speed and acceleration (Abu-
Allaban et al. 2003a). For this reason the average emission factor for buses
derived from dynamometer measurements is also presented as a suitable emission
factor in Table 5.1.4, in addition to average emission factors for bus for urban and
boulevard Road Types, as it is considered more conservative and unlikely to be
affected by high rates of resuspended road dust. This average dynamometer
emission factor for bus included emission factors for a wide range of different
urban bus Drive Cycles.

211
Total particle mass model: No statistically significant variables were identified
for this statistical model. The sample size was 199 and overall mean from this null
model was 158 mg/km for all combined Vehicle Types; 158 mg/km for bus, and
91 mg/km for Fleet, 380 mg/km for heavy duty vehicles (HDV) and 32 mg/km for
light duty vehicles (LDV). The inability to identify relationships in this statistical
model may stem from the fact that these studies measured a broad range of
different particle sizes, and most emission factors were not derived segregated by
different subsets of particle mass fractions, but simply measured total particle
mass.
5.4.2 Statistical differences between published emission factors
Post-hoc Scheffe’s multiple comparison statistical tests (Scheffe 1959) were used
to investigate the differences in means between levels corresponding to sub-
classes within all categorical variables, irrespective of whether they had a
significant effect on the response variable (the published emission factor value), at
a 95% confidence level. The findings of these statistical tests are discussed
below.
Country of Study; Study Location; Road Types vs Dynamometer: It was found
that the variables Country of Study and Study Location (dynamometer, on or near
the road, tunnel) were not statistically significant in explaining the variation in the
means of published emission factors for most particle metrics. When comparing
the means for different Road Types with those derived from dynamometer
measurements, statistically significant differences were only found between
dynamometer and motorway (PM1) and dynamometer and boulevard Road Types

212
(PM10). These differences, however, are likely to have been influenced by high
speed scenarios, as the PM1 study measured emissions on a motorway in
Switzerland with a speed limit of 120km/hr (Imhof et al, 2005a) and the PM10
study in the US attributed the significantly high PM10 emission rates to
contributions from resuspended road dust and to the influence of variation in
acceleration and speed (Abu-Allaban et al. 2003a).
Vehicle Type and Fuel Type: For Vehicle Type statistically significant
differences were found between the means for Fleet and HDV for particle
number, PM1 and PM2.5; and between the means for Fleet and LDV for PM2.5.
The means for LDV and HDV were found to be statistically significantly different
for all particle metrics. No statistically significant differences were found between
the means of different Fuel Types for particle number, or between the means for
different Fuel Types for total particle mass. However statistically significant
differences were found between the means for petrol and diesel Fuel Types for
PM10.
Instrumentation: No statistically significant differences were found between
mean values measured by different Instrumentation for PM2.5 and total particle
mass. However, a significant difference was found between the mean value for
published emission factors for particle number derived from the Condensation
Particle Counter (CPC) of 22.69 x 10¹⁴ particles per vehicle per km and the
Scanning Mobility Particle Sizer (SMPS) of 2.08 x 10¹⁴ particles per vehicle per
km, highlighting a major difference between the results of these two measurement
techniques, which requires investigation as a broader issue.
213
Statistically significant differences were found for PM1 between the means for the
Aerodynamic Particle Sizer (APS) and Betameter and between the APS and Beta-
ray absorption monitors, however these differences are likely to be influenced by
the fact that the PM1 measurements related exclusively to diesel vehicles (LDVs
and HDVs) tested on dynamometers in Australia. Higher values of emission
factors are likely to be associated with diesel-fuelled vehicles as compared to
petrol and other fuelled-vehicles.
Size Range Measured for particle number: In relation to the Size Range
Measured for particle number, no statistically significant differences were found
for the lower and upper size ranges measured for particle number between the
average emission factors for the various levels of each of the categorical
variables, after accounting for the associated variability of these estimates.
Emission factors derived using the CPC for total particle count which reported
only the lower size ranges measured (and did not report the upper size range
measured) were unable to be included in these statistical tests. Their inclusion
may have led to a different result as the CPC generally measures down to 0.002
µm, where particle numbers are very prolific.
5.4.3 Relevance and application of the average particle emission factors
presented in this study
A general conclusion from examination of the results of the post-hoc multiple
comparison tests discussed above is that these findings support the relevance and
applicability of using the average emission factors derived in this study for
modelling tailpipe particle emissions from urban fleets in developed countries.

214
Where statistically significant differences were found these were generally
associated with emission factors for diesel-fuelled vehicles, or related to high
speed scenarios or to conditions with significantly high levels of resuspended road
dust.
It is suggested that when using the average emission factors presented in this
study, that three calculations be made. Firstly, a calculation using the relevant
average emission factor, and two further calculations using the lower and upper
bound 95% confidence interval values associated with the average emission factor
(where available). It should be noted that where a single, individual road is
concerned, the lower and upper bound 95% confidence interval values will be
more widely distributed than those reported in this study.
5.5. CONCLUSIONS
This paper presents a comprehensive set of tailpipe particle emission factors,
covering the full size range of particles emitted by motor vehicles, which are
suitable for use in transport modelling and health impact assessments of urban
fleet emissions in developed countries. These emission factors were derived for
different Vehicle and Road Type combinations based on advanced statistical
analysis of a large body of data on emission factors derived from measurement
studies, and include emission factors for particle number and different fractions of
particle mass.

215
The average emission factors were derived from statistical models which were
found to explain 86%, 93%, 87% and 65% of the variation in published emission
factors for particle number, particle volume, PM1, and PM2.5 respectively, and
hence are concluded to have been derived from robust models. The statistical
model for PM10, however, explained only 47% of the variation in published
emission factors and it is likely may have been confounded by the effects of
resuspended road dust at this size range.
The explanatory variables identified in the statistical models included Vehicle
Type (all particle metrics), Instrumentation (particle number and PM2.5), Fuel
Type (PM1), Road Type (PM10) and Size Ranged Measured and Speed Limit on
the Road (particle volume), and we conclude that these are important variables to
consider in design and interpretation of data in emission factor studies for
different particle metrics.
The relevance and suitability of the derived set of tailpipe particle emission
factors for use in urban areas in developed countries is supported by the findings
from the statistical analysis of published emission factors in the international
literature, which were as follows.
First, statistical analysis of published emission factors revealed that few
statistically significant differences were found between the mean values for
different particle metrics for Country of Study and Study Location (dynamometer,
on or near a road, tunnel).
216
Second, few statistically significant differences were found between the means of
published emission factors derived in dynamometer studies and those derived for
different Road Types, except under high speed scenarios or conditions with
significantly high levels of resuspended road dust, suggesting that for most
particle metrics the two methods provide generally similar results.
Third, statistically significant differences were found between mean published
emission factors for LDVs and HDVs for all particle metrics; and between petrol
and diesel-fuelled vehicles for PM10, consistent with higher emission rates that
would be expected from diesel-fuelled vehicles, as compared to petrol and other
fuelled vehicles.
5.6. RECOMMENDATIONS AND PERSPECTIVES
The average emission factors presented in this study are suitable for developing
road-link based inventories, quantifying the spatial distribution of particle
concentrations and for developing health impact assessments, covering the full
size range of particles emitted by fleets. They are particularly useful for regions
which may have insufficient funding to conduct measurements, or little or no data
upon which to derive emission factors for their local region.
Better scientific techniques and tools are needed to produce data that can be used
to model fleet emissions, as variations were found between different
Instrumentation and methods used to derive emission factors. For example,
statistically significant differences were found between the mean values of
published emission factors for particle number measured by the Condensation

217
Particle Counter of 22.69 x 10¹⁴ particles per vehicle per km, as compared to
Scanning Mobility Particle Sizer (SMPS) Instrumentation of 2.08 x 10¹⁴ particles
per vehicle per km, a difference which requires further investigation as a broader
issue. Particle number emission factors for buses are rare and limited to estimates
derived from SMPS measurements, which generally do not measure down to the
lower size range of 0.002 µm in the nucleation mode where particle number tends
to be very prolific.
While this study examined available tailpipe particle emission factors in the
international literature, more studies are needed that derive speed-related particle
emission factors for on-road and tunnel studies, particularly for speeds less than
50 km/hr to model congestion. More studies are also needed to derive emission
factors for particle number for buses, and for different subsets of particle number
< 1 µm, such as for ultrafine and nanoparticles (diameters < 0.05 µm), where
particle number tends to be very prolific, for different Vehicle Types. Limited
particle emission factor data are available for motor vehicles for particle volume,
particle surface area, PM1, brake and tyre wear, road grade, engine power, and for
buses measured on different Road Types.

218
5.7. REFERENCES
Abu-Allaban, M., 2002. Exhaust particle size distribution measurements at the
Tuscarora Mountain tunnel. Aerosol Science and Technology 36(6), 771-789.
Abu-Allaban, M., Gillies, J.A., Gertler, A.W., 2003a. Application of a multi-lag
regression approach to determine on-road PM10 and PM2.5 emission rates.
Atmospheric Environment 37(37), 5157-5164.
Abu-Allaban, M., Gillies, J.A., Gertler, A.W., Clayton, R., Proffitt, D., 2003b.
Tailpipe, resuspended road dust, and brake-wear emission factors from on-road
vehicles. Atmospheric Environment 37(37), 5283-5293.
Ahlvik P, Eggleston S, Goriben N, Hassel D, Hickman AJ, Joumard R,
Ntziachristos L, Rijkeboer R, Samaras Z, Zierock K.H (1997) COPERT II
Computer programme to calculate emissions from road transport: methodology
and emission factors. Technical report prepared by the European Environment
Agency, Copenhagen. Report No. 6.
ARB's, 2002. Study of Emissions from Two "Late Model" Diesel and CNG
Heavy-Duty Transit Buses. California Air Resources Board, 12th CRC On-Road
Vehicle Emissions Workshop, April 15-17, San Diego.

219
Ayala, A., Kado, N.Y., Okamoto, R.A., 2002. Diesel and CNG Heavy-duty
Transit Bus Emissions over Multiple Driving Schedules: Regulated Pollutants and
Project Overview. Society of Automotive Engineers SAE 2002-01-17221-13.
Bradley, M.J., 2000. Hybrid-Electric Drive Heavy-Duty Vehicle Testing Project;
Final Emissions Report. Northeast Advanced Vehicle Consortium, Defense
Advanced Research Projects Agency, West Virginia University, USA.
Bellasio R, Bianconi R, Corda G, Cucca P (2007) Emission inventory for the road
transport sector in Sardinia (Italy). Atmospheric Environment 41, 677-691.
Cadle, S.H., Mulawa, P.A., Ball, J., Donase, C., Weibel, A., Sagebiel, J. C.,
Knapp, K. T., Snow, R., 1997. Particulate emission rates from in use high
emitting vehicles recruited in Orange County, California. Environmental Science
& Technology 31(12), 3405-3412.
Cadle, S.H., Mulawa, P., Groblicki, P., Laroo, C., Ragazzi, R. A., Nelson, K.,
Gallagher, G., Zielinska, B., 2001. In-use light-duty gasoline vehicle particulate
matter emissions on three driving cycles. Environmental Science & Technology
35(1), 26-32.
CARB., 2001. Heavy-Duty Emissions Laboratory, Heavy Duty Testing and Field
Support Section, California Air Resources Board. Report No. 01-01.

220
CARB, 2002. EMFAC2001/EMFAC200. Calculating emissions inventories for
vehicles in California, User’s Guide, California California Air Resources Board.
Chatterjee, S., Conway, R., Lanni, T., Frank, B., Tang, S., Rosenblatt, D., Bush,
C., Lowell, D., Evans, J., McLean, R., Levy, S., 2002. Performance and
Durability Evaluation of Continuously Regenerating Particulate Filters on Diesel
Powered Urban Buses at NY City Transit – Part II. Society of Automotive
Engineers SAE 2002-01-0430.
Clark, N.N., Lyons, D.W., Bata, R.M., Gautam, M., Wang, W.G., Norton, P.,
Chandler, K., 1997. Natural Gas and Diesel Transit Bus Emissions: Review and
Recent Data. Society of Automotive Engineers Tech. Pap. No. 973203.
Clark, N.N., Lyons, D.W., Rapp, B.L., Gautam, M., Wang, W.G., Norton, P.,
White, C., Chandler, C., 1998. Emissions from Trucks and Buses Powered by
Cummins L-10 Natural Gas Engines. Society of Automotive Engineers Tech. Pap.
No. 981393.
Clark, N.N., Gautam, M., Rapp, B.L., Lyons, D.W., Graboski, M.S., McCormick,
R. L., Alleman, T. L., Norton, P., 1999. Diesel and CNG Transit Bus Emissions
Characterization by Two Chassis Dynamometer Laboratories: Results and Issues.
Society of Automotive Engineers SAE 1999-01-1469.

221
CONCAWE., 1998. A study of the number, size & mass of exhaust particles
emitted from european diesel and gasoline vehicles under steady-state and
european driving cycle conditions. CONCAWE, Brussels Report no. 98/51.
Corsmeier, U., Imhof, D., Kohler, M., Kuhlwein, J., Kurtenbach, R., Petrea, M.,
Rosenbohm, E., Vogel, B., Vogt, U., 2005. Comparison of measured and model-
calculated real-world traffic emissions. Atmospheric Environment 39(31), 5760-
5775.
DOEH., 2003. Technical Report No. 1: Toxic Emissions from Diesel Vehicles in
Australia, Department of the Environment and Heritage, Canberra.
Frey HC, Unal A, Chen J (2002a) Recommended strategy for on-board emission
data analysis and collection for the new generation model. Prepared for Office of
Transportation and Air Quality, US Environmental Protection Agency.
Frey HC, Unal A, Chen J, Li S, Xuan C (2002b) Methodology for developing
modal emission rates for EPA's multi-scale motor vehicle and equipment
emission estimation system, North Carolina State University for the Office of
Transportation and Air Quality, US Environmental Protection Agency.
Gehrig, R., Hill, M., Buchmann, B., Imhof, D., Weingartner, E., Baltensperger,
U., 2004. Separate determination of PM10 emission factors of road traffic for
tailpipe emissions and emissions from abrasion and resuspension processes.
International Journal of Environment & Pollution 22(3), 312-325.
222
Gertler, A.W., Gillies, J.A., Pierson, W.R., Rogers, C.F., Sagebiel, J. C., Abu-
Allaban, M., Coulombe, W., Tarnay, L., Cahill, T.A., 2002. Real-World
Particulate Matter and Gaseous Emissions from Motor Vehicles in a Highway
Tunnel. Health Effects Institute Research Report 107.
Gidhagen, L., Johansson, C., Strom, J., Kristensson, A., Swietlicki, E., Pirjola, L.,
Hansson, H.C., 2003. Model simulation of ultrafine particles inside a road tunnel.
Atmospheric Environment 37(15), 2023-2036.
Gidhagen, L., Johansson, C., Langner, J., Olivares, G., 2004a. Simulation of NOx
and ultrafine particles in a street canyon in Stockholm, Sweden. Atmospheric
Environment 38(14), 2029-2044.
Gidhagen, L., Johansson, C., Omstedt, G., Langner, J., Olivares, G., 2004b.
Model simulations of NOx and ultrafine particles close to a Swedish highway.
Environmental Science & Technology 38(24), 6730-6740.
Gillies, J.A., Gertler, A.W., Sagebiel, J.C., Dippel, W.A., 2001. On-road
particulate matter (PM2.5 and PM10) emissions in the Sepulveda Tunnel, Los
Angeles, California. Environmental Science & Technology 35(6), 1054-1063.
Gramotnev, G., Brown, R., Ristovski, Z., Hitchins, J., Morawska, L., 2003.
Determination of average emission factors for vehicles on a busy road.
Atmospheric Environment 37(4), 465-474.

223
Gramotnev, G., Ristovski, Z.D., Brown, R.J., Madl, P., 2004. New methods of
determination of average particle emission factors for two groups of vehicles on a
busy road. Atmospheric Environment 38(16), 2607-2610.
Harrison R, Jones M, Collins G (1999) Measurements of the Physical Properties
of Particles in the Urban Atmosphere. Atmospheric Environment 33, 309-321.
Hibberd, M.F., 2005. Vehicle NOx and PM10 Emission Factors from Sydney's
M5-East Tunnel. 17th International Clean Air & Environment Conference
proceedings, Hobart. Clean Air Society of Australia and New Zealand.
Holmen, B., Chen, Z., Davila, A., Gao, O., Vikara, D.M., 2005. Particulate matter
emissions from Hybrid Diesel-electric and Conventional Diesel Transit Buses:
Fuel and Aftertreatment Effects. The University of Connecticut Report No. JHR
05-304.
Hueglin, C., Buchmann, B., Weber, R. O., 2006. Long-term observation of real-
world road traffic emission factors on a motorway in Switzerland. Atmospheric
Environment 40(20), 3696-3709.
Imhof, D., Weingartner, E., Ordonez, C., Gehrigt, R., Hill, N., Buchmann, B.,
Baltensperger, U., 2005a. Real-world emission factors of fine and ultrafine
aerosol particles for different traffic situations in Switzerland. Environmental
Science & Technology 39(21), 8341-8350.

224
Imhof, D., Weingartner, E., Prevot, A., Ordonez, C., Kurtenbach, R., Wiesen, P.,
Rodler, J., Sturm, P., McCrae, I., Sjodin, A., Baltersperger, U., 2005b. Aerosol
and NOx Emission Factors and Submicron Particle Number Size Distributions in
Two Road Tunnels with Different Traffic Regimes. Atmospheric Chemistry and
Physics Discussions 55127-55166.
Imhof, D., Weingartner, E., Vogt, U., Dreiseidler, A., Rosenbohm, E., Scheer, V.,
Vogt, R., Nielsen, O.J., Kurtenbach, R., Corsmeier, U., Kohler, M.,
Baltensperger, U., 2005c. Vertical distribution of aerosol particles and NOx close
to a motorway. Atmospheric Environment 39(31), 5710-5721.
Jamriska, M., Morawska, L., 2001. A model for determination of motor vehicle
emission factors from on-road measurements with a focus on submicrometer
particles. Science of the Total Environment 264(3), 241-255.
Jamriska, M., Morawska, L., Thomas, S., Congrong, H., 2004. Diesel Bus
Emissions Measured in a Tunnel Study. Environmental Science & Technology
38(24), 6701-6709.
Jones, A.M., Harrison, R.M. 2006. Estimation of the emission factors of particle
number and mass fractions from traffic at a site where mean vehicle speeds vary
over short distances. Atmospheric Environment 40(37), 7125-7137.
225
Kado, N.Y., Okamoto, R.A., Kuzmicky, P.A., Kobayashi, R., Ayala, A., Gebel,
M. E., Rieger, P.L., Maddox, C., Zafonte, L., 2005. Emissions of toxic pollutants
from compressed natural gas and low sulfur diesel-fueled heavy-duty transit buses
tested over multiple driving cycles. Environmental Science & Technology 39(19),
7638-7649.
Ketzel, M., Wahlin, P., Berkowicz, R., Palmgren, F., 2003. Particle and trace gas
emission factors under urban driving conditions in Copenhagen based on street
and roof-level observations. Atmospheric Environment 37(20), 2735-2749.
Kittelson, D.B., Watts, W.F., Johnson, J.P., 2004. Nanoparticle emissions on
Minnesota highways. Atmospheric Environment 38(1), 9-19.
Kristensson, A., Johansson, C., Westerholm, R., Swietlicki, E., Gidhagen, L.,
Wideqvist, U., Vesely, V., 2004. Real-world traffic emission factors of gases and
particles measured in a road tunnel in Stockholm, Sweden. Atmospheric
Environment 38(5), 657-673.
Lanni, T., Frank, B. P., Tang, S., Rosenblatt, D., Lowell, D., 2003. Performance
and Emissions Evaluation of Compressed Natural Gas and Clean Diesel Buses at
New York City's Metropolitan Transit Authority. SAE 2003-01-0300.
Lowell, D.M., Parsley, W., Bush, C., Zupo, D., 2003. Comparison of Clean Diesel
buses to CNG Buses. 9th Diesel Engine Emissions Reduction (DEER) Workshop,
Newport, RI, USA, 24-28 August.

226
Mazzoleni, C., Kuhns, H.D., Moosmuller, H., Keislar, R.E., Barber, P.W.,
Robinson, N. F., Watson, J.G., 2004. On-road vehicle particulate matter and
gaseous emission distributions in Las Vegas, Nevada, compared with other areas.
Journal of the Air & Waste Management Association 54(6), 711-726.
Morawska, L., Bofinger, N.D., Kocis, L., Nwankwoala, A., 1998. Submicrometer
and supermicrometer particles from diesel vehicle emissions. Environmental
Science & Technology 32(14), 2033-2042.
Morawska, L., Ristovski, Z., Ayoko, G.A., Jayaratne, E.R., Lim, M., 2001. Report
of a short investigation of emissions from diesel vehicles operating on low and
ultralow sulphur content fuel. Prepared for BP Australia by Queensland
University of Technology, Brisbane.
Morawska L, Salthammer T (2003) Chapter 3: Motor Vehicle Emissions as a
Source of Indoor Particles in, Morawska-Salthammer (eds). Indoor Environment,
Wiley-VCH; 297-318.
Morawska L, Moore M R, Ristovski ZD (2004) Health Impacts of Ultrafine
Particles - Desktop Literature Review and Analysis, Department of the
Environment and Heritage, September, Canberra.

227
Morawska, L., Jamriska, M., Thomas, S., Ferreira, L., Mengersen, K., Wraith, D.,
McGregor, F., 2005. Quantification of particle number emission factors for motor
vehicles from on-road measurements. Environmental Science & Technology
39(23), 9130-9139.
Morawska L, Keogh DU, Thomas SB, Mengersen K (2008) Modality in ambient
particle size distributions and its potential as a basis for developing air quality
regulation. Atmospheric Environment 42 (7), 1617-1628.
NEPC, 2000, Proposed Diesel Vehicle Emissions National Environment
Protection Measure Preparatory Work, In-Service Emissions Performance - Phase
2: Vehicle Testing, NEPC, Adelaide, November.
Ntziachristos L, Samaras Z, Eggleston S, Goriben N, Hassel D, Hickman AJ,
Joumard R, Rijkeboer R, White L, Zierock K H (2000) COPERT III Computer
programme to calculate emissions from road transport: methodology and emission
factors (version 2.1). Technical report prepared by the European Environment
Agency, Copenhagen, Report 49.
Ristovski, Z.D., Morawska, L., Ayoko, G.A., Jayaratne, E.R., Lim, M., 2002.
Final report of a comparative investigation of particle and gaseous emissions from
twelve in-service B.C.C. buses operating on 50 and 500 ppm sulphur diesel fuel.
Queensland University of Technology, Brisbane.

228
Romilly, P., 1999. Substitution of bus for car travel in urban Britain: an economic
evaluation of bus and car exhaust emission and other costs. Transportation
Research Part D-Transport and Environment 4(2), 109-125.
SAE., 2001. Performance and Durability Evaluation of Continuously
Regenerating Particulate Filters on Diesel powered Urban Transit Buses at NY
City Transit. Society of Automotive Engineers SAE 2001-01-0511.
SAE., 2002a. Performance and Durability of Continuously Regenerating
Particulate Filters on Diesel powered Urban Transit Buses at NY City Transit -
Part II. Society of Automotive Engineers SAE 2002-01-0430.
SAE., 2002b. Year-Long Evaluation of Trucks and Buses Equipped with Passive
Diesel Diesel Particulate Filters. Society of Automotive Engineers SAE 2002-01-
0433.
SAE., 2003a. Oxidation catalyst effect on CBG Transit Bus Emissions. Society of
Automotive Engineers SAE 2003-01-1900.
SAE., 2003b. Performance and Emissions Evaluation of Compressed Natural Gas
and Clean Diesel Buses at New York City's Metropolitan Transit Authority.
Society of Automotive Engineers SAE 2003-01-0300.

229
Samaras Z, Ntziachristos L, Thompson N, Hall D, Westerholm R, Boulter P
(2005). Characterisation of Exhaust Particulate Emissions from Road Vehicles,
PARTICULATES program, European Commission. Contract No 2000-
RD.11091, source http://lat.eng.auth.gr/particulates/downloads.htm.
Scheffe H (1959) The Analysis of Variance, John Wiley & Sons, Inc.
Schmid, H., Pucher, E., Ellinger, R., Biebl, P., Puxbaum, H., 2001. Decadal
reductions of traffic emissions on a transit route in Austria - results of the
Tauerntunnel experiment 1997. Atmospheric Environment 35(21), 3585-3593.
Shah, S.D., Cocker, D.R., Miller, J.W., Norbeck, J.M., 2004. Emission rates of
particulate matter and elemental and organic carbon from in-use diesel engines.
Environmental Science & Technology 38(9), 2544-2550.
Shi J, Harrison RM (1999) Investigation of ultrafine particle formation during
diesel exhaust dilution. Environmental Science & Technology 33, 3730-3736.
Shi J P, Khan AA, Harrison RM (1999) Measurements of ultrafine particle
concentration and size distribution in the urban atmosphere. The Science of the
Total Environment 235, 51-64.
Shi J, Evans D, Khan A, Harrison R (2001) Sources and Concentration of
Nanoparticles (<10 nm Diameter) in the Urban Atmosphere. Atmospheric
Environment 35, 1193-1202.

230
Smit R, Smoker, R, Rab, E (2007) A new modelling approach for road traffic
emissions: VERSIT+. Transportation Research Part D-Transport and
Environment 12, 414-422.
Tran, T. V., Ng, Y. L., Denison, L., 2003. Emission Factors for In-Service
Vehicles Using Citylink Tunnel. Proceedings of the National Clean Air
Conference, Newcastle.
Ubanwa, B., Burnette, A., Kishan, S., Fritz, S.G., 2003. Exhaust particulate matter
emission factors and deterioration rate for in-use motor vehicles. Journal of
Engineering for Gas Turbines and Power-Transactions of the Asme 125(2), 513-
523.
USEPA (1993) User's Guide to MOBILE5A, Mobile source emissions factor
model, U.S. Environmental Protection Agency.
Wahlin P, Palmgren F, Van Dingenen R (2001) Experimental studies of ultrafine
particles in streets and the relationship to traffic. Atmospheric Environment 35,
S63-S69.
Venkatram, A., Fitz, D., Bumiller, K., Du, S.M., Boeck, M., Ganguly, C., 1999.
Using a dispersion model to estimate emission rates of particulate matter from
paved roads. Atmospheric Environment 33(7), 1093-1102.
231
Walker JL, Li J, Srinivasan S, Bolduc D (2008) Travel Demand Models in the
Developed World: Correcting for Measurement Errors Transportation Research
Board 87th Annual Meeting Washington.
Wayne, W.S., Clark, N.N., Nine, R.D., Elefante, D., 2004. A comparison of
emissions and fuel economy from hybrid-electric and conventional-drive transit
buses. Energy & Fuels 18(1), 257-270.
Zhang, K.M., Wexler, A.S., Niemeier, D.A., Zhu, Y.F., Hinds, W. C., Sioutas, C.,
2005. Evolution of particle number distribution near roadways. Part III: Traffic,
analysis and on-road size resolved particulate emission factors. Atmospheric
Environment 39(22), 4155-4166.
Zhu, Y. F., Hinds, W. C., 2005. Predicting particle number concentrations near a
highway based on vertical concentration profile. Atmospheric Environment 39(8),
1557-1566.
232
CHAPTER 5.2
DERIVATION OF MOTOR VEHICLE
PARTICLE EMISSION FACTORS - STATISTICAL
MODEL OUTPUTS
5. INTRODUCTION
This Chapter presents the outputs of five statistical models which were developed
to produce average emission factors for different Vehicle Types, and identify the
most suitable particle emission factors to use in transport modelling and health
impact assessments. The method for developing these statistical models is
discussed in detail in the paper presented in Chapter 5.1.
A multiple comparison plot is also presented in this Chapter which depicts the
statistical relationships between the average values of published emission factors
in terms of categorical variables examined in the statistical analysis. The results
shown in this plot are commented on in the paper presented in Chapter 5.1.
Additional comments discussing average emission factors derived by the
statistical models for particle volume and PM10, and the rationale for selection of
LDV, HDV and bus PM10 emission factors used in developing the urban South-
East Queensland inventory (presented in paper three, Chapter 6) are also
discussed.

233
5.1. STATISTICAL MODEL OUTPUTS
The statistical model outputs shown in Tables 5.2.1-5.2.5 present the explanatory
model variables, their average emission factors and corresponding 95%
confidence intervals and standards errors for particle number, particle volume,
PM1, PM2.5 and PM10.
From these statistical model outputs, the most suitable emission factors for
different Vehicle Types and different particle metrics were selected. These were
selected based on their statistical characteristics, including consideration of
conservative average particle emission factors with the lowest standard errors,
narrowest 95% confidence intervals and largest sample sizes. Other factors
considered for some particle metrics were Size Range Measured and Road Type.
The most suitable emission factors to use in transport modelling are shown in
Tables 5.2.1-5.2.5 in bold italics shaded gray (and summarised in Table 5.1.4,
Chapter 5.1).
234
Emission factor sample sizes in the statistical models
It should be noted that when considering the sample size of emission factors in
Tables 5.2.1-5.2.5, that one single emission factor may represent emissions from
one individual vehicle (or group of vehicles) tested on a dynamometer, or
represent the average emissions of an entire vehicle fleet measured on or near a
road or in a tunnel. A single emission factor may also represent an average
emission factor derived for a vehicle class, such as for all LDVs, HDVs or buses,
travelling in a large vehicle fleet on a road or in a tunnel. Therefore the total
sample size examined in this study of 667 emission factors represents a relatively
very large sample of motor vehicles.

235
Table 5.2.1. Particle number model explanatory variables and average particle number emission factors
Sample
Size
95% Confidence Interval
Vehicle Type
Average particle
emission factor value
1014 particles per vehicle per
km
Standard Error
Lower Bound
Upper Bound
HDV 1 0.02 5.44 (a) 10.77
Instrumentation, Size Range Measured* and Study Location(b) APS 700-20,000nm Vicinity of the road Combined 1 0.02 5.44 (a) 10.77
Fleet 10 7.26 1.72 3.85 10.66 HDV 5 65.00 2.43 60.19 69.81 LDV 3 3.63 3.14 (a) 9.85
CPC > 6nm, > 7nm, 3-3000nm Vicinity of the road
Combined 18 25.30 1.44 22.44 28.15 Fleet 2 3.35 3.85 (a) 10.96 HDV 1 52.00 5.44 41.24 62.76 LDV 1 1.40 5.44 (a) 12.16
CPC, DMPS >3nm, 10-700nm Vicinity of the road
Combined 4 18.92 2.87 13.25 24.59 LDV 3 1.06 3.14 (a) 7.27 DMA 10-237.2nm
Dynamometer Combined 3 1.06 3.14 (a) 7.27 Fleet 5 5.40 2.43 0.59 10.21 HDV 5 29.32 2.43 24.51 34.13 LDV 8 2.82 1.92 (a) 6.63
DMPS <10nm, 3-900nm Tunnel
Combined 18 12.51 1.31 9.92 15.11 LDV 2 1.42 3.85 (a) 9.02 EAA 10-1000nm
Dynamometer Combined 2 1.42 3.85 (a) 9.02 Fleet 2 1.80 3.85 (a) 9.41 HDV 2 7.79 3.85 0.18 15.40 LDV 2 1.22 3.85 (a) 8.83
ELPI 30-10,000nm Vicinity of the road
Combined 6 3.60 2.22 (a) 8.00 LDV 6 0.68 2.22 (a) 5.07 ELPI, UCPC
> 3nm Dynamometer Combined 6 0.68 2.22 (a) 5.07
BUS – Diesel (e)
3 3.08 3.14 (a) 9.30
Fleet 41 1.28 0.85 (a) 2.96 HDV 26 4.86 1.07 2.75 6.97
SMPS 3-900nm Mix of Tunnel, Vicinity of the road & Dynamometer(c)
LDV 26 0.46 1.07 (a) 2.57 Combined 96 2.42 0.90 0.65 4.19
LDV 2 1.22 3.85 (a) 8.82 SMPS, DMPS 15.7-685.4nm Dynamometer
Combined
2 1.22 3.85 (a) 8.82 BUS 3 3.08(d) 3.14 (a) 9.30 Fleet 60 3.18(d) 1.12 0.97 5.40 HDV 40 26.50(d) 1.56 23.42 29.57 LDV 53 1.39(d) 1.15 (a) 3.67
*ALL
Combined 156 8.48(d) 0.72 7.06 9.91
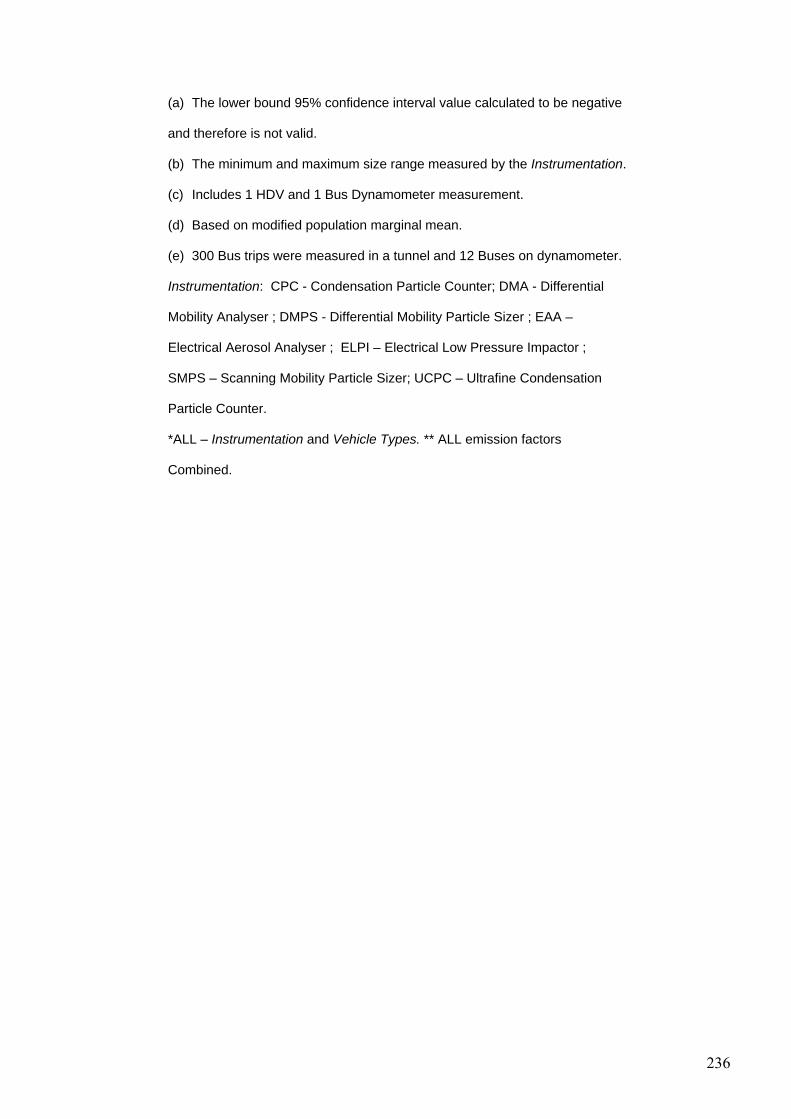
236
(a) The lower bound 95% confidence interval value calculated to be negative
and therefore is not valid.
(b) The minimum and maximum size range measured by the Instrumentation.
(c) Includes 1 HDV and 1 Bus Dynamometer measurement.
(d) Based on modified population marginal mean.
(e) 300 Bus trips were measured in a tunnel and 12 Buses on dynamometer.
Instrumentation: CPC - Condensation Particle Counter; DMA - Differential
Mobility Analyser ; DMPS - Differential Mobility Particle Sizer ; EAA –
Electrical Aerosol Analyser ; ELPI – Electrical Low Pressure Impactor ;
SMPS – Scanning Mobility Particle Sizer; UCPC – Ultrafine Condensation
Particle Counter.
*ALL – Instrumentation and Vehicle Types. ** ALL emission factors
Combined.

237
Table 5.2.2. Particle volume model explanatory variables and average particle volume emission factors
95% Confidence
Interval
Vehicle Type
Study Location & Size Range Measured, (nm)
Urban vs Non-Urban Roads, Speed Limit on the Road =<60km/hr, >60km/hr
Sample Size
Average particle
emission factor value
per cubic cm per km
Standard Error
Lower Bound
Upper Bound
=<60
1 0.01 0.06 (a) 0.13
>60 4 0.01 0.03 (a) 0.07
18-100 Tunnel and Vicinity of the road
Combined
5 0.01 0.03 (a)
0.08 =<60 1 0.07
0.06
(a) 0.19
>60 4 0.05 0.03 (a) 0.12
18-300 Vicinity of the road =<60; Tunnel > 60
Combined
5 0.06 0.03
(a) 0.13 =<60 1 0.00 0.06 (a) 0.13 >60 4 0.00 0.03 (a) 0.06
18-50 Tunnel and Vicinity of the road Combined 5 0.00 0.03 (a) 0.07
>60 1 0.04 0.06 (a) 0.16 18-700 Tunnel Combined 1 0.04 0.06 (a) 0.16
>60 1 0.09
0.06
(a) 0.22
29-1000 Vicinity of the road
Combined
1 0.09 0.06
(a)
0.22 >60
1 0.06
0.06
(a) 0.19
29-250 Vicinity of the road Combined 1 0.06 0.06 (a) 0.19
>60 1 0.07 0.06 (a) 0.20 29-640 Vicinity of the road Combined 1 0.07 0.06 (a) 0.20
=<60 3 0.03 0.04 (a) 0.10 >60 16 0.05 0.02 0.01 0.09
FLEET
ALL - Fleet and Size Ranges Measured
Combined
19 0.04 0.02 0.01 0.07

238
95% Confidence
Interval
Vehicle Type
Study Location & Size Range Measured, (nm)
Urban vs Non-Urban Roads, Speed Limit on the Road =<60km/hr, >60km/hr
Sample Size
Average particle
emission factor
value per cubic cm per km
Standard Error
Lower Bound
Upper Bound
=<60 1 0.09 0.06 (a) 0.22 >60 4 0.03 0.03 (a) 0.10
18-100 Tunnel and Vicinity of the road Combined 5 0.06 0.03 (a) 0.13
=<60 1 0.93
0.06
0.81
1.06
>60 4 0.21 0.03 0.15 0.27
18-300 Vicinity of the road =<60; Tunnel > 60 Combined 5 0.57 0.03 0.50 0.64
=<60 1 0.01 0.06 (a) 0.14 >60 4 0.01 0.03 (a) 0.07
18-50 Tunnel and Vicinity of the road Combined 5 0.01 0.03 (a) 0.08 18-700 Tunnel
>60 2 0.41
0.04
0.32
0.49
Combined 2 0.41 0.04 0.32 0.49 >60 1 0.41 0.06 0.29 0.54 29-250
Vicinity of the road Combined 1 0.41 0.06 0.29 0.54
>60 1 0.41 0.06 0.29 0.54 30-10000(b) Vicinity of the road Combined 1 0.41 0.06 0.29 0.54
=<60 3 0.35 0.04 0.27 0.42 >60 16 0.25 0.02 0.21 0.28
HDV
ALL - HDV and Size Ranges Measured Combined 19 0.28 0.02 0.24 0.31
=<60 1 0.00 0.06 (a) 0.13 >60 4 0.01 0.03 (a) 0.07
18-100 Tunnel and Vicinity of the road Combined 5 0.00 0.03 (a) 0.07
=<60 1 0.03
0.06
(a) 0.15
>60 4 0.03 0.03 (a) 0.09
18-300 Vicinity of the road =<60; Tunnel > 60 Combined 5 0.03 0.03 (a) 0.10
=<60 1 0.00 0.06 (a) 0.13 >60 4 0.00 0.03 (a) 0.06
18-50 Tunnel and Vicinity of the road Combined 5 0.00 0.03 (a) 0.07 18-700 Tunnel
>60 2 0.05
0.04
(a) 0.13
Combined 2 0.05 0.04 (a) 0.13 >60 1 0.03 0.06 (a) 0.16 29-250
Vicinity of the road Combined 1 0.03 0.06 (a) 0.16
>60 1 0.03 0.06 (a) 0.16 30-10000(b) Vicinity of the road Combined 1 0.03 0.06 (a) 0.16
=<60 3 0.01 0.04 (a) 0.08
LDV
>60 16 0.02 0.02
(a) 0.06
ALL - LDV and Size Range Measured Combined 19 0.02 0.02 (a) 0.05

239
95% Confidence
Interval
Vehicle Type
Study Location & Size Range Measured, (nm)
Urban vs Non-Urban Roads, Speed Limit on the Road =<60km/hr, >60km/hr
Sample Size
Average particle
emission factor
value per cubic cm per km
Standard Error
Lower Bound
Upper Bound
=<60 3 0.03 0.04 (a) 0.11 >60 12 0.02 0.02 (a) 0.05
18-100 Tunnel and Vicinity of the road Combined 15 0.02 0.02 (a) 0.07
=<60 3 0.34 0.04 0.27 0.42 >60 12 0.10 0.02 0.06 0.13
18-300 Vicinity of the road =<60; Tunnel > 60
Combined 15 0.22 0.02 0.18 0.26
=<60 3 0.01 0.04 (a) 0.08 >60 12 0.00 0.02 (a) 0.04
18-50 Tunnel and vicinity of the road Combined 15 0.00 0.02 (a) 0.04
>60 5 0.16 0.03 0.10 0.22 18-700 Tunnel Combined 5 0.16 0.03 0.10 0.22
>60 1 0.09 0.06 (a) 0.22 29-1000 Vicinity of the road Combined 1 0.09 0.06 (a) 0.22
>60 3 0.17 0.04 0.10 0.24
*ALL
29-250 Vicinity of the road Combined 3 0.17 0.04 0.10 0.24
>60 1 0.07 0.06 (a) 0.20 29-640 Vicinity of the road Combined 1 0.07 0.06 (a) 0.20
>60 2 0.22 0.04 0.13 0.31 30-10000(c) Vicinity of the road Combined 2 0.22 0.04 0.13 0.31
=<60 9 0.13 0.02 0.09 0.17 >60 48 0.10 0.01 0.08 0.12
Combined*
Combined** 57 0.11 0.01 0.09 0.13
(a) The lower bound 95% confidence interval value calculated to be negative and
therefore is not valid. (b) This study measured a vehicle fleet that comprised 60%
HDVs. (c) Based on modified population marginal mean.
*All emission factors for Vehicle Types and Size Ranges Measured Combined.
** All emission factors Combined.
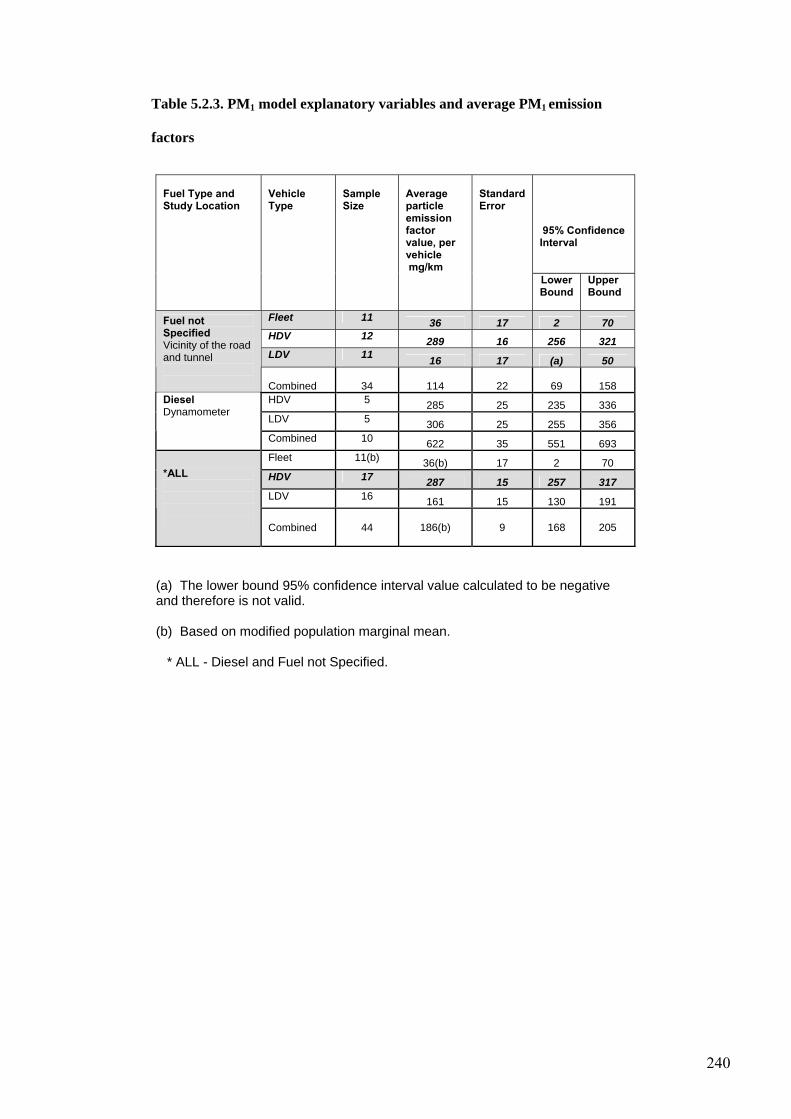
240
Table 5.2.3. PM1 model explanatory variables and average PM1 emission factors
Fuel Type and Study Location
Vehicle Type
Sample Size
Average particle emission factor value, per vehicle mg/km
Standard Error
95% Confidence Interval
Lower Bound
Upper Bound
Fleet 11 36 17 2 70 HDV 12 289 16 256 321 LDV 11 16 17 (a) 50
Fuel not Specified Vicinity of the road and tunnel
Combined
34
114
22
69
158
HDV 5 285 25 235 336 LDV 5 306 25 255 356
Diesel Dynamometer
Combined 10 622 35 551 693 Fleet 11(b) 36(b) 17 2 70 HDV 17 287 15 257 317 LDV 16 161 15 130 191
*ALL
Combined
44 186(b)
9
168
205
(a) The lower bound 95% confidence interval value calculated to be negative and therefore is not valid.
(b) Based on modified population marginal mean.
* ALL - Diesel and Fuel not Specified.

241
Table 5.2.4. PM2.5 model explanatory variables and average PM2.5 emission factors
Instrumentation & Study Location
Vehicle Type
Sample
size
Average particle emission factor value per vehicle, mg/km
Standard Error
95% Confidence Interval
Lower Bound
Upper Bound
HDV – Diesel
5 286 47 192 380
LDV – Diesel
5 306 47 212 401
APS Dynamometer
Combined 10 296 33 229 363 HDV 8 182 37 106 256
LDV 10 23 33 (a) 89
Chemical balance Vicinity of the road Combined 18 102 25 52 152
Bus (c) 5 299 47 205 394 DustTrak Vicinity of the road and tunnel
Fleet 2 15 74 (a) 164
HDV 7 301 40 221 380 LDV 20 33 24 (a) 80 Combined 34 162 24 112 212
Bus (d) 7 42 40 (a) 122 Glass-Fibre Filter Dynamometer Combined 7 42 40 (a) 122
HDV 1 526 106 315 737 Teflon Filters Tunnel LDV 1 7 106 (a) 218 Combined 2 267 74 117 416
Fleet 3 60 61 (a) 182 Samplers Tunnel
HDV 1 135 106 (a) 346 LDV 1 14 106 (a) 225 Combined 5 70 54 (a) 177
Bus – Diesel (e)
2 234 75 84 383 TEOM Tunnel
Fleet 1 49 106 (a) 260 HDV 1 381 106 170 592 LDV 1 19 106 (a) 230 Combined 5 171 49 72 269
Fleet 4 60 53 (a) 166 TEOM & DMPS Tunnel Combined 4 60 53 (a) 166
Bus 14 192(b) 32 127 256 Fleet 10 46(b) 38 (a) 122 HDV 23 302 33 236 367 LDV 38 67 32 3 131
*ALL
Combined 85 156(b) 17 122 191

242
(a) The lower bound 95% confidence interval value calculated to be negative and
therefore is not valid.
(b) Based on modified population marginal mean.
(c) Relate to 300 Diesel Bus trips measured in a tunnel, and Buses, fuel not specified,
tested in the vicinity of the road.
(d) Buses included 3 hybrid buses (2 fitted with catalysed particulate filters); 3 Buses
fuelled with Diesel (fitted with oxidation catalysts) and 1 Bus fuelled with liquified natural
gas.
(e) TEOM equivalent data, where the correlation between TEOM and DustTrak response
to diesel emissions was assessed and the DustTrak results were recalculated into TEOM
equivalent data.
Instrumentation: APS – Aerodynamic Particle Sizer; DMPS – Differential Mobility Particle
Sizer; TEOM – Tapered Element Oscillating Microbalances.
* ALL – Instrumentation and Vehicle Types.

243
Table 5.2.5. PM10 model explanatory variables and average PM10 emission factors
Sample
Size
Average particle
emission factor per
vehicle
95% Confidence Interval
Vehicle Type
Road Type
mg/km Standard
Error Lower Bound
Upper Bound
Bus BOULEVARD(c) 2 4130 684 2774 5486 URBAN (d) 6 1089 395 306 1872 Dynamometer
(e) 19
313 222 (a) 753 Combined 27 1844 273 1302 2386 Fleet FREEWAY 1 200 967 (a) 2118 HIGHWAY 2 66 684 (a) 1421 MOTORWAY 2 77 684 (a) 1432 RURAL AREA 1 67 967 (a) 1984 TUNNEL 11 306 291 (a) 884 URBAN 5 688 432 (a) 1546 Combined 22 234 292 (a) 814 HDV BOULEVARD 2 4815 684 3459 6171 FREEWAY 2 2500 684 1144 3856 HIGHWAY 3 840 558 (a) 1947 MOTORWAY 2 213 684 (a) 1568 RURAL AREA 1 394 967 (a) 2312 TUNNEL 6 1019 395 236 1802 URBAN 10 538 306 (a) 1145 Dynamometer 2 259 684 (a) 1615 Combined 28 1322 229 867 1777 LDV BOULEVARD 4 454 483 (a) 1413 FREEWAY 4 285 483 (a) 1244 HIGHWAY 6 141 395 (a) 924 MOTORWAY 2 63 684 (a) 1419 RURAL AREA 1 46 967 (a) 1964 TUNNEL 6 14 395 (a) 797 URBAN 16 156 242 (a) 635 Dynamometer 10 47 306 (a) 653 Combined 49 151 191 (a) 529
BOULEVARD 8 3133(b) 360 2418 3848 FREEWAY 7 995(b) 426 149 1841 HIGHWAY 11 349(b) 322 (a) 988 MOTORWAY 6 117(b) 395 (a) 900 Dynamometer 31 206(b) 260 (a) 723 RURAL AREA 3 169(b) 558 (a) 1276 TUNNEL 23 446(b) 210 30 863 URBAN 37 618 176 269 966
*ALL
Combined 126 749 123 505 993

244
(a) The lower bound 95% confidence interval value calculated to be negative and
therefore is not valid.
(b) Based on modified population marginal mean.
(c) Fuel not specified by the studies (can be assumed to be Diesel-fuelled due to the
timing and location of the study).
(d) Five of the 6 buses were tested on the CBD (Central Business District) Urban bus
Drive Cycle, and 1 bus (Fuel not specified, can be assumed to be Diesel-fuelled due to
the timing and location of the study) was tested on an Urban road. In this analysis CBD
Drive Cycle emission factors were classed as Urban Road Type, due to the scarcity of
studies available that have measured PM10 for buses in on-road measurement
campaigns, and as this Drive Cycle closely emulates urban driving conditions. Of the 5
buses tested on the CBD Drive Cycle - 3 were Diesel-fuelled (1 Low Sulphur Diesel
(LSD) with an oxidation catalyst and 2 Ultralow Sulphur Diesel (ULSD) - one with an
oxidation catalyst and 1 with both an oxidation catalyst and a particle filter) and 2 Diesel
Hybrids (with catalysed particle filters).
(e) These 19 buses emulated a mixed bus fleet. They comprised 9 buses where the fuel
was not specified (these may have been Diesel-fuelled, however the Fuel Types were not
reported); 5 buses were Diesel-fuelled fitted with oxidation catalysts (of these 1 LSD; and
1 ULSD with a particle filter); 2 Diesel Hybrids (with oxidation catalysts; one also had a
catalysed particle filter); and 3 LNG-fuelled with no aftertreatment devices. Although
removal of the 3 LNG bus emission factors would have increased the overall average
emission factor produced by the PM10 statistical model for buses for dynamometer from
313 to 371 mg/km, these LNG emission factors were not removed because for 9 of the
19 buses tested the fuel used was not specified and was unable to be determined.

245
5.2 STATISTICAL RELATIONSHIPS BETWEEN CATEGORICAL
VARIABLES
Figure 5.2.1 presents a multiple comparison plot depicting the statistical
relationships between the average values of published emission factors in terms of
categorical variables examined in the statistical analysis. These related to the
results of post-hoc Scheffe’s multiple comparison statistical tests that investigated
the differences in means between levels corresponding to all categorical variables
(Scheffe 1959), irrespective of whether they had a significant effect on the
response variable (the published emission factor value).
In Figure 5.2.1 variables whose mean values are statistically similar are connected
by joined-lines, and those also annotated with an ‘X’ indicate the variable marked
‘X’ is statistically similar to the variables to which it is joined. Variables without
joined-lines between them have statistically significant relationships at a 95%
confidence level. These results are commented on in the paper presented in
Chapter 5.1.

246
Figure 5.2.1. Multiple comparison plot showing the nature of the statistical
relationship between the categorical model variables for different metrics
Variables connected by a joined-line are statistically similar and those marked X
show the variable marked X and the variables to which it is joined are statistically
similar. Variables without a joined-line are statistically significantly different at a
95% confidence level.
(a) Country of Study
PM1 (a)
Australia Other Countries USA PM2.5 (b)
Australia Other Countries USA, Canada
PM10
Australia Other Countries USA, Canada
Total P mass
Australia Other Countries USA P number
Austria Germany Switzerland UK P volume
(a) Post-hoc multiple comparison tests were not performed for PM1 as there were
fewer than 3 Country of Study groups.
(b) Australian PM2.5 emission factors related mainly to diesel-fuelled vehicles, which
could generally be expected to produce higher values than other fuelled vehicles.

247
(b) Study Location
Vicinity of the Road (a)
Tunnel Dynamometer
PM1 (b)
PM2.5
PM10
P number
Total p mass
P volume (c)
(a) Vicinity of the Road relates to measurements on or near the road (near a curb,
upwind and downwind, downwind only, using vehicle chasing or on-road mobile
laboratories)
(b) The PM1 dynamometer measurements related exclusively to diesel LDVs and
HDVs tested in Australia. Diesel vehicles would generally produce higher emission
factors than other fuelled vehicles.
(c) No dynamometer values were available for particle volume, and there were less
than 3 groups so post-hoc multiple comparison tests were not able to be performed.

248
(c) Dynamometer and Road Types
Motorway Rural area Highway Tunnel Dynamometer Urban Road
PM1
Dynamometer Boulevard Highway Freeway Tunnel Urban Road
PM2.5
Boulevard Highway Motorway Dynamometer Urban Road Tunnel
PM10
PM10
Boulevard
Rural area
Freeway
Dynamometer Boulevard Highway Freeway Tunnel Urban Road Total mass
Dynamometer Highway Freeway Motorway Tunnel Urban Road
Particle number
Highway Motorway Tunnel Urban Road
Particle volume
X

249
(d) Dynamometer and Road Classes
Dyno Speed
Limit on the Road < 80 km/hr
Speed Limit on the Road ≥ 80 km/hr
Dyno Speed Limit on the Road ≤ 60km/hr
Speed Limit on the Road > 60km/hr
PM1
PM2.5
PM10
Total Particle
mass
(a)
(a)
(a)
Particle number
Particle volume
(b) (b)
(a) Total particle mass was not tested as sample sizes were too small. (b) No dynamometer emission factors were available for particle volume.
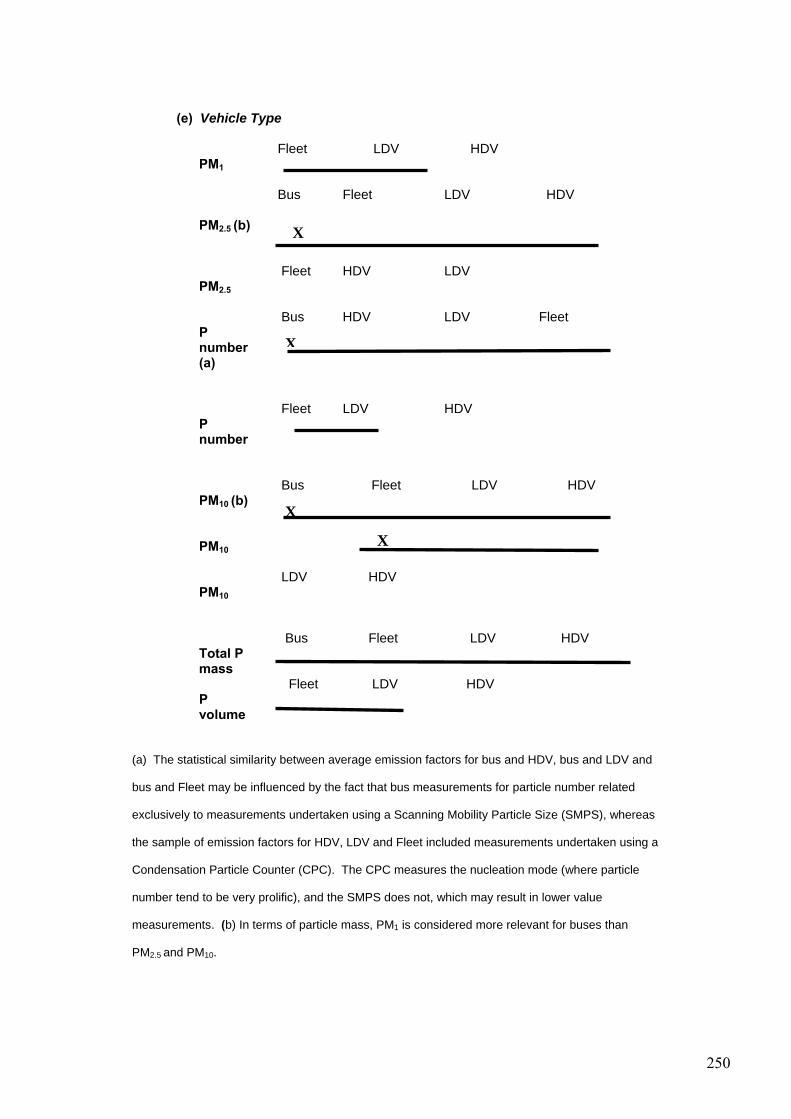
250
(e) Vehicle Type
Fleet LDV HDV PM1
Bus Fleet LDV HDV PM2.5 (b)
Fleet HDV LDV PM2.5 Bus HDV LDV Fleet P number (a)
Fleet LDV HDV P number
Bus Fleet LDV HDV PM10 (b) PM10
LDV HDV PM10
Bus Fleet LDV HDV Total P mass
Fleet LDV HDV P volume
(a) The statistical similarity between average emission factors for bus and HDV, bus and LDV and
bus and Fleet may be influenced by the fact that bus measurements for particle number related
exclusively to measurements undertaken using a Scanning Mobility Particle Size (SMPS), whereas
the sample of emission factors for HDV, LDV and Fleet included measurements undertaken using a
Condensation Particle Counter (CPC). The CPC measures the nucleation mode (where particle
number tend to be very prolific), and the SMPS does not, which may result in lower value
measurements. (b) In terms of particle mass, PM1 is considered more relevant for buses than
PM2.5 and PM10.
X
X
X
X

251
(f) Fuel Type
PM1 (a)
PM2.5 (a)
Fuel not Specified
Diesel Petrol
PM10
Diesel Petrol PM10 Particle number
Fuel not Specified
Diesel Petrol
CNG Diesel Petrol LNG ULSD LSD Total particle mass
P volume (b)
(a) Post-hoc multiple comparison tests were not performed for PM1 and PM2.5 as
there were fewer than 3 groups.
(b) Fuel Types were not reported for particle volume.
Fuel Types: CNG – Compressed Natural Gas, LNG – Liquified Natural Gas, ULSD –
Ultralow Sulphur Diesel, LSD – Low Sulphur Diesel.
X

252
(g) Instrumentation
Beta-ray Betameter Kleinfiltergerate APS
PM1
APS Telfon filters
Chemical balance
DustTrak Glass fibre filter
Sampler TEOM TEOM, DMPS
PM2.5
Chemical balance
Filters Impactor MOUDI, ELPI, SMPS
Remote sensing
SMPS SMPS & Others
Total mass
CPC SMPS APS (a) CPC, DMPS DMA ELPI EAA ELPI & UCPC
Particle number
SMPS DMPS
Particle number
Particle volume (b)
PM10 (c)

253
(a) The small sample size (n=7) and very small mean value for APS in particle number of
0.002 x 10¹⁴ particles per vehicle per kilometre hampered a meaningful comparison with
mean values for CPC and SMPS, which both had substantially larger sample sizes and
larger mean values of CPC 22.69 x 10¹⁴ particles per vehicle per kilometre (n=18) and
SMPS 2.083 x 10¹⁴ particles per vehicle per kilometre (n=96). The APS also measures a
vastly different particle size range to CPC and SMPS, as shown in Table 5.2.1.
b) Post-hoc multiple comparison tests were not performed as there were fewer than 3
groups.
(c) PM10 Instrumentation sample sizes were too small to test for significant differences
between the means.
Instrumentation - APS Aerodynamic Particle Sizer; CPC - Condensation Particle Counter;
DMA - Differential Mobility, DMPS – Differential Mobility Particle Sizer; EAA – Electrical
Aerosol Analyser ; ELPI – Electrical Low Pressure Impactor ; SMPS – Scanning Mobility
Particle Sizer. TEOM – Tapered Element Oscillating Microbalances.

254
5.3. ADDITIONAL COMMENTS RELATED TO PARTICLE VOLUME
AND PM10 EMISSION FACTORS
The majority of emission factors used to develop the urban South-East
Queensland (SEQ) inventory were sourced from those identified as the most
suitable to use in transport modelling and health impact assessments presented in
this Chapter.
Particle volume emission factors
It should be noted that average emission factors for particle volume were not used
in developing the urban SEQ inventory. This decision was taken because a direct
correlation exists between particle mass and volume distributions, where density
acts as a scaling factor (Morawska et al. 2008), and it was considered that a more
detailed understanding of particle mass emission rates could be obtained by using
average emission factors for subsets of mass fractions for PM1, PM2.5 and PM10.
In addition, these mass fractions have greater relevance to current mass-based
ambient air quality standards.
Possible influence of road dust in LDV and HDV PM10 emission factor
measurements
Considerable variation can be seen between the values of average emission
factors produced by the statistical models for PM10 for LDVs, HDVs and buses
for different Road Types, as compared to tunnel and dynamometer average
emission factors (Table 5.2.5).
255
For example, the LDV statistical model (Table 5.2.5) had a sample size of 49
emission factors and produced average emission factors that ranged from 14
mg/km for tunnel (n=6) to 47 mg/km (n=10) for dynamometer studies; and for
different Road Types ranged from 46 mg/km for a rural area road (n=1) to 63
mg/km for motorway (n=2); 141 mg/km (n=6) for highway; 156 mg/km (n=16)
for urban road; 285 mg/km (n=4) for freeway; and 454 mg/km (n=4) for
boulevard. Even greater variation can be seen between PM10 average emission
factors for HDVs for tunnel, dynamometer and studies of different Road Types
(Table 5.2.5). Differences in average bus emission factors are discussed in
Section 5.5. below.
The PM10 statistical model showed the lowest correlation coefficient, as compared
to the statistical models developed for the other particle metrics, of 0.47 (see
Chapter 5.1). This low correlation coefficient may be influenced by the presence
of varying quantities of road dust occurring at the PM10 size range found near
roads or in tunnels that were stirred up and resuspended by vehicle traffic. These
levels of road dust can vary depending on the road surface and climatic
conditions, as well as the influence of other factors such as traffic volumes,
vehicle speed, and congested driving conditions, where there may be more
stopping and starting, such as on urban roads. Few methods are presently
available for discriminating resuspended road dust from tailpipe vehicle particle
emissions; and as LDVs usually make up the major proportion of vehicles
travelling in on-road fleets, the presence of road dust is likely to more heavily
influence the LDV emission factor derived from measured fleet emissions, than

256
that for HDVs, as these usually only comprise a small proportion of the fleet in
terms of their numbers.
5.4. ADDITIONAL COMMENTS ON PM10 EMISSION FACTORS
USED IN THE URBAN SEQ INVENTORY
The basis for selection of the average PM10 emission factors to use in developing
the urban SEQ inventory, from those produced by the statistical models, is
generally discussed below.
LDV and HDV emission factors for PM10
The average emission factors for LDVs and HDVs for PM10 selected from
the statistical model outputs presented in this Chapter to use in developing
the urban SEQ inventory were those for urban and highway Road Types
(Table 5.1.4, Chapter 5.1).
These average emission factors generally had lower standard errors and
lower upper bound 95% confidence intervals values than the other average
emission factors, and the speed limits on these Road Types closely matched
the two road classifications used in the SEQ inventory. Urban road
emission factors related to roads with speed limits of 50 and 57 km/hr; and
for highway to roads with speed limits of 82 and 100 km/hr. The two road
classifications in the SEQ inventory related to roads with average vehicle
speeds of < 80 km/hr for urban roads and ≥ 80 km/hr for urban-major roads.
Although speed limits on the road and average vehicle speeds are not
257
directly comparable, nevertheless due to the lack of available data on
average vehicle speeds reported in the studies, this is the only comparison
able to be made.
PM10 Bus emission factors
Although the explanatory variables for the PM10 statistical model were found to be
Vehicle Type and Road Type, the decision was taken to use the average emission
factor produced by the statistical model derived from dynamometer measurements
in development of the urban SEQ inventory (presented in Chapter 6).
The statistical model for PM10 for buses was based on emission factor data derived
from measurements on boulevard (n=2) and urban Road Types (n=6) and from
dynamometer measurements (n=19) (Table 5.2.5).
The authors of the boulevard Road Type study (from which two emission factors
for buses were sourced) reported that they considered their very high values of
PM10 emission factors were influenced by contributions from resuspended road
dust and, within each vehicle category, by the effects of speed and acceleration
(Abu-Allaban et al. 2003). This same study derived one bus emission factor for
PM10 from measurements on an urban Road Type. The three PM10 bus emission
factors derived in this study were measured using DustTrak Instrumentation,
which the authors stated may have overestimated measurements (Abu-Allaban et
al. 2003).

258
The remaining five emission factors in the Urban Road Type sample related to
dynamometer measurements of buses on the Central Business District (CBD)
Drive Cycle, which very closely emulates urban driving conditions, and were
included due to the extreme lack of available on-road data for buses travelling on
urban Road Types. Hence it was decided to use the more conservative average
emission factor for PM10 dynamometer bus measurements, for all Road Types in
the urban South-East Queensland inventory, as this average emission factor was
less likely to be affected by excessively high rates of resuspended road dust, and
as this sample of emission factors included a very wide range of different urban
bus Drive Cycles and had the largest sample size.
259
5.5. REFERENCES
Abu-Allaban, M., Gillies, J.A., Gertler, A.W., 2003. Application of a multi-
lag regression approach to determine on-road PM10 and PM2.5 emission
rates. Atmospheric Environment 37(37), 5157-5164.
Morawska, L., Keogh, D. U., Thomas, S. B., Mengersen, K., 2008.
Modality in ambient particle size distributions and its potential as a basis
for developing air quality regulation. Atmospheric Environment 42(7),
1617-1628.
Scheffe, H., 1959. The Analysis of Variance, John Wiley & Sons, Inc.
260
CHAPTER 6
DEVELOPMENT OF A PARTICLE NUMBER AND
PARTICLE MASS EMISSIONS INVENTORY FOR AN
URBAN FLEET
Diane U. Keogh1, Luis Ferreira2, Lidia Morawska1
1 International Laboratory for Air Quality and Health, Queensland
University of Technology, Gardens Point, Brisbane, Australia
2 School of Urban Development, Queensland University of
Technology, Gardens Point, Brisbane, Australia
Environmental Modelling and Software 24(11), 1323-1331.
261
STATEMENT OF JOINT AUTHORSHIP
Title: Development of a particle number and particle mass
emissions inventory for an urban fleet
Authors: Diane U. Keogh, Luis Ferreira, and Lidia Morawska
Diane U. Keogh (candidate)
Developed the experimental design and scientific method. Developed the
inventory of emissions and scenario models. Carried out all the calculations and
analysis for these models. Data interpretation. Wrote the majority of the
manuscript.
Luis Ferreira
Reviewed the manuscript.
Lidia Morawska
Contributed to the manuscript.

262
ABSTRACT
Motor vehicles are major emitters of gaseous and particulate matter pollution in
urban areas, and exposure to particulate matter pollution can have serious health
effects, ranging from respiratory and cardiovascular disease to mortality. Motor
vehicle tailpipe particle emissions span a broad size range from 0.003-10µm, and
are measured as different subsets of particle mass concentrations or particle
number count. However, no comprehensive inventories currently exist in the
international published literature covering this wide size range.
This paper presents the first published comprehensive inventory of motor vehicle
tailpipe particle emissions covering the full size range of particles emitted. The
inventory was developed for urban South-East Queensland by combining two
techniques from distinctly different disciplines, from aerosol science and transport
modelling. A comprehensive set of particle emission factors were combined with
transport modelling, and tailpipe particle emissions were quantified for particle
number (ultrafine particles), PM1, PM2.5 and PM10 for light and heavy duty
vehicles and buses. A second aim of the paper involved using the data derived in
this inventory for scenario analyses, to model the particle emission implications of
different proportions of passengers travelling in light duty vehicles and buses in
the study region, and to derive an estimate of fleet particle emissions in 2026.
It was found that heavy duty vehicles (HDVs) in the study region were major
emitters of particulate matter pollution, and although they contributed only
around 6% of total regional vehicle kilometres travelled, they contributed more
than 50% of the region’s particle number (ultrafine particles) and PM1
263
emissions. With the freight task in the region predicted to double over the next
20 years, this suggests that HDVs need to be a major focus of mitigation efforts.
HDVs dominated particle number (ultrafine particles) and PM1 emissions; and
LDV PM2.5 and PM10 emissions. Buses contributed approximately 1-2% of
regional particle emissions.
Keywords: Motor vehicle inventory, emission factors, traffic modelling,
particle number, particle mass, ultrafine particles.

264
6.1. INTRODUCTION
Tailpipe particle emissions generated by motor vehicles span a very wide size
range, from around 0.003µm (the current detection limit on scientific measuring
equipment) to 10µm. Only one inventory exists which attempted to estimate all
the particle metrics and subclasses, and this was developed for the UK (Group
1999). However this inventory was restricted to estimating particle emissions for
the smaller particle size ranges by applying distribution profiles for these size
ranges to PM10 estimate data (Group 1999; Goodwin et al. 2000; AQEG 2005).
This means that emission factors for these size ranges below PM10 were not based
on individual measurements of different particle sizes, but simply on mass
fractions multiplied by PM10 data values.
Current worldwide air quality standards for controlling particulate matter
pollution are mass-based and restricted to PM2.5 and PM10 (mass concentration of
particles with aerodynamic diameters < 2.5 µm and 10 µm respectively).
However, these standards are ineffective for controlling ultrafine particles
(diameters < 0.1 µm), which are very numerous in terms of their numbers, but
have little mass (weight). Most particle emissions generated by motor vehicle
tailpipes are ultrafine size and are measured in terms of particle number; hence it
is critical that future inventories include estimates for particle number emissions.
As the majority of particles measured in terms of particle number are in the
ultrafine size range, the terms particle number and ultrafine particles

265
will be used interchangeably in this paper. From this point on in the paper
tailpipe motor vehicle particle emissions will be referred to as motor vehicle
particle emissions.
In urban areas motor vehicle particle emissions are a dominant pollution source,
where more than 80% of particle number concentrations are found in the ultrafine
size range (Morawska and Salthammer 2003). However, very little information
can be obtained about particle number from particle mass measurements (ECJRC
2002), and as current air quality standards are mass and not particle number-
based, this means that the greater proportion of motor vehicle particle emissions
are not controlled or regulated.
There are many different types of emission models that have been developed to
model particle emissions generated by motor vehicle fleets. These have employed
a wide range of different methods and related to varying geographic scales. The
application of these models include developing an understanding of air quality
and climate change issues on global, regional and local scales (Parrish 2006) and
for developing control strategies, risk assessments, air quality forecasting and
transport and economic incentive programs (Mobley and Cadle 2004).
Examples of emission models which have estimated vehicle fleet emissions
include well-known models such as EMFAC (CARB 2001) and MOBILE
(USEPA 1993); as well as BRUTAL (Oxley et al. 2009), CALPUFF (Cohen et al.
2005), MM5-ARPS-CMAQ (Cheng et al. 2007), OSCAR (Sokhi et al. 2008),
TAPM (Hurley et al. 2005), TEMMS (Namdeo et al. 2002) and VERSIT+ LD
(Smit et al. 2007), to name a few. However these emission models are generally

266
limited to providing estimates for PM10 or, in some cases, PM2.5. One model,
however, COPERT IV, has available a small suite of solid particle number
emission factors for different vehicle types derived from dynamometer
measurements (Samaras et al. 2005).
Emission models can be developed with a specific focus, eg., such as for
modelling the effects of congestion (Smit et al. 2008), estimating the spatial and
temporal resolution of emissions (Constabile et al. 2008), for modelling street
canyons (Mensink et al. 2006) or modelling the influence of road classifications
on personal exposure to emissions (Chen et al. 2008). A number of emission
models often use indirect data, such as total fuel consumption data or based on
fuel properties (Goodwin et al. 1999) or remotely sensed data (Shifter et al. 2005),
rather than using performance-related emission factors and road traffic data.
A number of epidemiological studies have linked particle exposure with increases
in hospital admissions, various respiratory and cardiovascular diseases and
mortality (Pope and Dockery 2006); and current scientific debate is focused on the
premise that particle number (ultrafine particles) is more directly related to health
effects than particle mass (ECJRC 2002). In relation to the health effects due to
exposure to ultrafine particles, of which the majority are in the nanosize range
(diameters < 0.05 µm), the World Health Organization (WHO 2005) has stated
that “While there is considerable toxicological evidence of potential detrimental
effects of ultrafine particles on human health, the existing body of epidemiological
evidence is insufficient to conclude on exposure/response relationship to ultrafine
particles. Therefore no recommendations can be provided as to guideline
concentrations of these particles at this point.”
267
Whilst recommendations as to guideline concentrations for ultrafine
particles cannot presently be determined, nevertheless the importance and
high priority given to controlling these sized particles is evidenced by the
fact that particle number limits for solid particles are being introduced by the
European Union for light duty diesel vehicles in EURO V/VI and for heavy
duty diesel vehicles in EURO VI (European Union 2007; Commission of the
European Communities 2007 a,b); and are proposed for light duty diesel
vehicles in Switzerland (AQEG 2005). The particle number inventory
presented in this study for urban South-East Queensland is the first of its
kind, and to our knowledge no such extensive inventory is available. No
detailed emission inventories are available that include particle number
concentration (Jones and Harrison 2006).
Particle emissions can be reduced in a variety of ways, ranging from fitting
particle traps or introducing new vehicle standards (eg., EUROs), to policies
such as congestion charging and incentives for scrapping older vehicles.
Higher density living and transit oriented development is causing the public
to become more concerned about particulate matter pollution, and they are
demanding greater quantification of particle emission levels. Particle
emission inventories are an important tool for understanding current levels
and controlling emissions, as well as for testing the air quality implications
of future alternative transport and land use strategies.

268
This paper presents the first published comprehensive inventory of motor
vehicle tailpipe particle emissions. It was developed for urban South-East
Queensland by combining a comprehensive set of emission factors with
transport modelling to produce road-link based estimates of particle number
(ultrafine particles), PM1, PM2.5 and PM10 for light and heavy duty vehicles
and buses for different road types. Future scenarios were tested involving
moving proportions of LDV trips to new buses to quantify the impact on
emission levels. Modelling bus trips was important as major busways and
tunnels are under construction in the study region to address urban sprawl,
increased travel demand and congestion. An estimate of fleet emissions in
2026 was also derived.
It is important to note that inventory estimates are based on government
prototype data from the Brisbane Strategic Transport Model for 2004
(Queensland Department of Main Roads 2008), and utilised vehicle
kilometres travelled (VKT) data, but excluded consideration of specific origin
and destination trip data.
6.2. METHOD
Particle number (ultrafine particles), PM1, PM2.5 and PM10 inventories for the
motor vehicle fleet in urban South-East Queensland for 2004 were developed
and different scenario analyses were modelled relating to travel behaviour and
mode choice. Details related to the study region, the emissions inventory

269
model components (both for the travel demand and emission factor models), and
variables used in scenario analyses conducted are outlined below.
The inventory was calculated by combining two techniques from distinctly
separate disciplines – from aerosol science and transport modelling. Computation
of the emissions inventory involved compilation of relevant emission factors for
different vehicle and road type combinations for different particle metrics with
individual travel demand model links. The method applied appropriate particle
emission factors for different vehicle and road type combinations, which were
derived from statistical analysis of a large body of published emission factor data,
as well as identifying a small number of relevant local bus emission factors.
Travel data for the region was sourced from a Government household travel
survey (SEQHTS 2004) and freight matrices, this data was analysed in terms of
trip mode and trip purpose and assigned to different travel demand model links
that represented roads in the study region, and the average fleet speed on each
model link was estimated (Queensland Department of Main Roads 2008). Model
links were classified into different road types based on the average speed of the
fleet on different model links. Inventories were calculated for different particle
metrics based on average weekday travel data scaled up to annual estimates. The
scaling factor used was based on the difference found between weekday and
weekend VKT in a local household travel survey conducted over an entire week
(Ministry of Transport 2007).

270
Average passenger occupancy rates for buses in different travel times were
derived from an analysis of all bus timetable and occupancy rate data relating to
the study region. Raw data for this analysis was provided by Translink (2007).
Scenario models were developed based on assumptions related to varying shifts in
travel modes in different travel times, and corresponding average vehicle
occupancy rates, and on anticipated future levels of particle emissions. The
inventory was validated based on the results of an extensive worldwide literature
review.
6.2.1. Study region
This was the Brisbane Statistical Region located in South-East Queensland
(SEQ), Australia (hereafter termed urban SEQ), which had 1.2 million motor
vehicles and a resident population in 2004 of 1.7 million (ABS 2004 a,b).
Although urban SEQ only makes up around 26% of the area in SEQ (ABS 2006;
OESR 2005), the urban SEQ vehicle fleet accounted for more than 70% of private
passenger trips in SEQ in 2004 (SEQHTS 2004). One million people are
predicted to move to SEQ in the next 20 years (Office of Urban Management
2004) and the Bureau of Transport and Regional Economics have forecast that the
freight task will double over this period (SKM 2206).

271
6.2.2. Transport model
Traffic data from the Brisbane Strategic Transport Model (BSTM) was used to
derive the inventory, and this model covers an area of around 4600 square
kilometres (Queensland Department of Main Roads 2008). The latest version of
this model is in the prototype stage and does not represent current Government
policy. It is a conventional 4-step demand model, incorporating trip generation,
distribution, modal split and assignment (Ortuzar and Willumsen 2001). It covers
urban SEQ and is populated with data from a Queensland Government household
travel survey (SEQHTS 2004). The model contains VKT data for a typical
weekday in 2004 in four travel times for light and heavy duty vehicles and buses.
Roads in urban SEQ are represented by 22,985 individual model links.
VKT on each model link: was calculated by multiplying the number of vehicles
in each vehicle class by the length of the model link in kilometres. Total weekday
VKT was 45.5 million km (93.3% from LDVs, 6.3% from HDVs and 0.4% from
buses). LDVs were classed as passenger cars and trucks with vehicle weights ≤ 5
tonnes; and HDVs vehicles had gross vehicle weights ranging from 3.5-12 tonnes
to > 25 tonnes (Keogh et al. 2009). A slight overlap in the weight ranges of LDV
and HDV vehicle classes occurred due to the nature of the data reported by the
authors of emission factor studies (Keogh et al. 2009). At the time of this study
the majority of LDV vehicles were petrol-fuelled and HDVs diesel-fuelled
(Keogh et al. 2009).

272
Total annual VKT for the 2004 BSTM was 14,514 million, which excluded
transport-related industry travel (eg., couriers and taxis) and trips by persons
staying in non-private accommodation (eg., tourists and business travellers
staying in hotels) (SEQHTS 2004). The BSTM VKT is within 20% of the VKT
estimate for the region derived in the 2004 Survey of Motor Vehicle Use of
18,331 million (ABS 2004a), which would be considered reasonable accuracy for
a strategic model. Other VKT estimates used to model the study region in 2004
ranged from 16,340-21,017 million (BTRE 2003; Apelbaum 2006).
Road types: Model links were classed as urban or urban-major roads, based on
the average vehicle speed travelled on the links in the different travel times.
Urban roads had average vehicle speeds of < 80 km/hr and urban-major ≥ 80
km/hr. Different vehicle speeds can be associated with different levels of
particulate matter emissions for different vehicle types. Hence the model links
representing roads in the study region were classified according to average
vehicle speed and the technique used to develop the inventory applied emission
factors relevant to those average vehicle speeds.
Travel times: VKT related to four travel times - 7am-9am, 9am-4pm, 4pm-6pm,
and 6pm-7am. The 24 hour average VKT was the sum of VKT in the four travel
times. Emissions were calculated for each travel time, and summed for each
model link.

273
Average vehicle speed: on each individual model link was available for the four
travel times. The 24 hour average vehicle speed was the length of time based
average of the four time periods, that is, 2*7am-9am speed + 7*9am-4pm speed +
2*4pm-6pm speed + 13*6pm-7am speed)/24 hours, weighted by kilometres
travelled for each vehicle class in the BSTM model (LDV, HDV and Bus).
Annual VKT: Model VKT represented a typical weekday and was converted to
annual VKT by multiplying by 319 days based on the average difference found
between weekday and weekend VKT in a household travel survey. Inventories
were calculated for different particle metrics based on average weekday travel
data scaled up to annual estimates. The scaling factor used was based on the
difference found between weekday and weekend VKT in a local household travel
survey conducted over a full seven-day week (Ministry of Transport 2007).
Calculation of the inventory: The calculation for the total particle inventory for
urban SEQ for each particle metric consisted of the sum of:-
Total particle emissions on each model link = (EFLDV * VKTLDV) + (EFHDV * VKTHDV) + (EFCNG buses * VKTCNG buses ) + (EF Diesel buses* VKT Diesel buses) Daily total on each model link = emissions 7-9am + emissions 9-4pm + emissions 4-
6pm, + emissions 6pm-7am Scaled up to per annum * 319 days where EF relates to the emission factor relevant to the model link in terms of its road type classification (urban or urban major road type)

274
6.2.3. Emission factors
Emission factors used to derive the inventory are shown in Table 6.1, sourced
from two studies (Keogh et al. 2009; Jayaratne et al. 2008).
Particle metrics: Emission factors related to particle number (number
concentration of particles with diameters 0.003-1µm); and PM1, PM2.5 and PM10.
Instrumentation measuring particle number does not usually measure particles
with diameters greater than 1µm, and the majority of these particles are ultrafine
particles, < 0.1 µm in diameter.
LDV and HDV emission factors: were sourced from a study that derived
emission factors based on a statistical analysis of 667 emission factors published
in the international literature derived from measurement studies. The derived
emission factors had 95% confidence interval values associated with them,
providing the range within which there is a 95% probability that the true value
will lie (Keogh et al. 2009). The statistical models developed to derive these
emission factors were found to explain 86%, 93%, 87%, 65% and 47% of the
variation in published emission factors (Keogh et al. 2009).
Bus emission factors: In 2004 the bus fleet in the study region comprised 89%
Diesel and 11% CNG buses (Translink 2007). Diesel bus emission factors for
particle number on urban roads and for PM10 for urban and urban-major roads
were sourced from Keogh et al. (2009). The remaining bus emission factors were
sourced from a chassis dynamometer study in Brisbane that tested six Scania

275
Table 6.1 Tailpipe particle emission factors for motor vehicles used to develop particle number, PM1, PM2.5 and
PM10 inventories presented in this study
Particle metric
Road Type
HDV emission
factor c h
LDV emission
factor c
Diesel Bus
emission factor
CNG Bus
emission factor
1014 particles per km
65 [60.19-69.81]
3.63 [9.85 a]
--
--
Particle number
All Road Types Urban Road e Urban-major Road e
-- --
-- --
3.08 [9.30 a] 1.80 d g
9.75 d f 0.22 d g
mg per km
PM1 All Road Types 287 [257-317] 16 [50 a] b b PM2.5 All Road Types 302 [236-367] 33 [80 a] 299 [205-394] b PM10 All Road Types 313 [753 a]
Urban Road e 538 [1145 a] 156 [635 a] 1.10 d f Urban-major Road e
840 [1947 a] 141 [924 a] 0.05 d g
a In the statistical analysis used to derive the emission factor values, the lower bound 95% confidence interval value calculated to be negative, and although physically uninterpretable, can be obtained as a consequence of the normal assumptions underlying the models (Keogh et al. 2009). b Relevant emission factors were not available for this class of vehicle. c LDVs had vehicle weights ≤ 5 tonnes and HDVs gross vehicle weights ≥ 3.5 tonnes. d Lower and upper bound 95% confidence interval values were not available for these emission factors. e Urban roads had average vehicle speeds of < 80 km/hr and urban-major ≥ 80 km/hr. f Based on DT80 transient drive cycle test (Jayaratne et all. 2008). g Based on 50% engine load test (Jayaratne et al. 2008).

276
CNG buses and 5 new generation Mercedes OC500 Diesel Buses (Jayaratne et al.
2008). Their emission factors derived from the DT-80 transient drive cycle test
were selected to represent urban road emissions and those from the 50% engine
load test to represent urban-major road emissions. No relevant bus emission
factors are currently available in the literature for PM1, or for PM2.5 for CNG
buses (Keogh et al. 2009).
6.2.4. Variables used in the scenario analyses
The scenarios modelled in this paper investigate aspects of the transport system
relating to travel mode choice and vehicle occupancy rates (private passenger car
versus public transport bus travel), as well as the effect of growing urbanisation in
a metropolitan city and predicted doubling of the on-road freight task.
They illustrate not only the particulate matter emission rate associated with each
passenger-km travelled for different travel modes, but also highlight the extent of
shift in travel behaviour needed in a passenger car-dependent environment to
effect reasonable reductions in particulate matter pollution.
These scenarios reflect current trends around the world and the aims of many
government initiatives which seek to deal with the problems of congestion and
growing urbanisation, by encouraging shifts from private passenger car travel to
public transport, such as buses, and by increasing vehicle occupancy rates.

277
The rationales for scenarios presented in this paper were based on local
government initiatives, policies and strategic plans developed for the region,
which were the obvious choice for scenario analyses. To encourage shifts from
private passenger car travel to buses, the Brisbane City Council boosted public
transport spending by 76% during 2003-2006, and since 2001 has added an
additional 330 new business to the Brisbane fleet (BCC 2007). The relevance of
modelling emissions in terms of passenger-km trips for different travel modes and
their effect on emission rates was informed by the TravelSmart™ initiative, which
had been introduced in the study region in 2003-2007 to encourage sustainable
transport choices, including car pooling, use of public transport, walking and
cycling, and reductions in single-occupancy car usage (McKay & McGaw 2005).
Mode of travel, trip purpose and average LDV occupancy data were sourced from
the same household travel survey used to populate the BSTM model (SEQHTS
2004). In order to derive the average bus occupancy rates for bus travel in the
region the authors analysed data provided by Translink (2007) relating to bus
timetable and occupancy rate information for all buses operating in the study
region, including Brisbane City Council and privately owned and operated bus
fleets. From this analysis, the average passenger occupancy rates for buses in the
region were derived for the four different travel times.
Trip Mode: categories included Vehicle Driver, Vehicle Passenger, Public
Transport, Walk/Cycle and Other (non-road based, eg., air and rail travel).

278
Trip purpose: categories included trips to and from home to work, education,
shopping, other, and trips to and from work which did not begin or end at home.
Home Based Work trips: were trips between home and work. Only Vehicle
Driver trip data was used in scenario analyses, and these related to vehicle
numbers. This avoided possible double counting of trips which had both a driver
and passenger in the same vehicle. These trips accounted for 46% of total VKT in
7am-9am, 50% in 4pm-6pm and 41% for the 24 hour average (SEQHTS 2004).
Average VKT: was calculated for LDVs and buses for different time periods and
used to compare emission scenarios.
Average vehicle occupancy: was 1.6 passengers for LDVs (7am-9am); and 1.5
passengers (9am-4pm, 4pm-6pm and for the 24 hour average) (Translink 2007).
Average bus occupancy rates calculated to be 18.3, 13.4, 16.9, 13.3 and 15.5
passengers for 7am-9am, 9am-4pm, 4pm-6pm, 6pm-7pm and 24 hour average
respectively. As specific rates were not available for the different fuel types, the
same occupancy bus rate was used for Diesel and CNG buses.
New bus VKT: was calculated for future scenarios that modelled movement of
LDV passengers to new buses. The number of new buses required was calculated
based on LDV and bus occupancy rates in the different travel times. New bus
VKT was assigned as 40% to Diesel buses and 60% to CNG buses. For the
scenario modelling involving the movement of different proportions of LDV
passengers to new buses, we made the assumption that these additional new buses

279
would change the composition of the bus fleet to 40% CNG-fuelled buses and
60% diesel-fuelled buses. This assumption was based on the purchase by
Brisbane City Council of 300 additional new CNG buses for their vehicle fleet
(Brisbane City Council, 2007).
Average particle emission factors per passenger per km: These were derived by
dividing LDV and bus emission factors used to develop the urban SEQ inventory
(Table 6.1) by the respective average vehicle occupancy rates in the 24 hour
average period.
6.3. RESULTS AND DISCUSSION
This section presents the total inventory for urban SEQ for 2004; compares its
PM10 inventory with three other model estimates; compares emission factors
from a UK inventory with the urban SEQ inventory; and discusses scenario
analyses results.
6.3.1. Particle inventory for urban SEQ for 2004
Table 6.2 presents the estimated particle inventory for urban SEQ for 2004.
Most model links were classed as urban roads; hence urban road emissions
dominated the inventory. The inventory was also influenced by very high LDV
VKT which was 93% of total regional VKT. The conclusions below are based
on data in Table 6.2.

280
On lower speed roads (urban roads) total LDV emissions were high for PM2.5 and
PM10 influenced by the fact that total LDV VKT is almost double that of total
HDV VKT on these roads. However, on higher speed roads (urban-major roads)
total HDV emissions dominated particle number and PM1 influenced by the
higher value HDV emission factor, which was almost 6 times higher than the
emission factor for LDVs, and the fact that total HDV VKT was slightly higher
than total LDV VKT on this Road Type.
On urban roads total LDV and total HDV particle number and PM1 emissions
were found to be similar; total LDV emissions for PM2.5 were more than double
total HDV emissions; and for PM10 were more than 5 times total HDV emissions.
On urban-major roads total HDV emissions for particle number and PM1 were
almost double total LDV emissions; PM2.5 total emissions for LDV and HDV
were similar; and PM10 total LDV emissions were more than 2.75 times total
HDV emissions.
Most HDVs were diesel-fuelled and their large contribution to the smaller
particle size range is of considerable concern from the health effects
perspective. In Switzerland these diesel particle emissions are classified as
carcinogenic (Dieselnet 2008).
Total particle number emissions for CNG buses on urban roads were more than 4
times total Diesel bus emissions; however on urban-major roads total Diesel bus
emissions were almost 10 times those for CNG buses; and were 3 orders of
magnitude higher than total CNG buses for PM10. Cadle et al. (2008) also found

281
CNG buses had higher particle number and lower particle mass emissions than
diesel and diesel-hybrid bus emissions. Although bus emission contributions to
the region were small (only around 1-2%) their quantification at the local scale is
important. This is due to high localised exposure to particulate matter emissions at
busways and in tunnels.
Particle number inventory: Total LDV and HDV emissions were similar; and
total bus emissions around 2-3 orders of magnitude lower. HDVs contributed
only around 6% of VKT, but contributed 54% of total particle number emissions
in the region. Freight is predicted to double over the next 20 years and therefore
HDVs are a pollution source that requires urgent attention. Total bus emissions
were less than 1%. Annual total particle number emissions were 3.40 (1.71-6.18)
x 1022 per day or 1.08 (0.54-1.97) x 1025 per annum. No studies were found which
can be compared to the urban SEQ particle number inventory. The only study
available estimated particle flux from all sources, from both natural and
anthropogenic sources (Bigg and Turvey 1978), and as data is not available on
particle flux from natural sources in urban SEQ, the studies can not be compared.

282
PM1 inventory: Relevant PM1 emission factors were not available for Diesel or
CNG buses, hence were not included in the inventory. The annual estimate for
PM1 emissions was 477 (233-964) tonne, and total HDVs contributed 55% of this
particulate matter pollution. More studies are needed to measure the PM1 mass
size range; as it has been shown that PM1 and PM10 are likely to be a more
relevant and discerning combination of air quality standards than the current
standards of PM2.5 and PM10 for combustion sources such as motor vehicles
(Morawska et al. 2008).
PM2.5 inventory: No relevant emission factors were available for CNG buses,
therefore these were not included. Total LDVs emitted 61% of PM2.5 as compared
to 37% from total HDVs and about 2% from total Diesel buses. The annual
estimate for PM2.5 was 736 (225-1436) tonne.
PM10 inventory: Total LDVs contributed 81% and total HDVs 18%. Buses
contributed less than 1%. The annual PM10 estimate was 2614 tonne, with an
upper 95% confidence interval value of 9668 tonne. This high upper confidence
interval value indicates lower certainty in the upper bound value estimate.

283
Table 6.2 Particle emission inventories for the urban South-East Queensland motor vehicle fleet for particle number, PM1, PM2.5 and PM10 on urban and urban-major roads. Lower and upper 95% confidence interval bound values are shown in parentheses.
PARTICLE METRIC & ROAD TYPE d
ESTIMATED PARTICLE EMISSIONS PER DAY
ESTIMATED PARTICLE
EMISSIONS PER ANNUM e Particle number
Light Duty Vehicles
1022
Heavy Duty Vehicles 1022
CNG Buses 1019
Diesel Buses 1020
All Vehicles 1022
All Vehicles 1025
Urban roads
1.13 [3.07 b]
1.08 [1.00-1.16]
1.76 c
0.4 [1.31 b]
2.22 [1.00-4.24]
0.70 [0.31-1.35]
Urban-major roads 0.41 [1.11b] 0.77 [0.71-0.83] 0.006 c 0.04 c 1.18 [0.71-1.94] 0.38 [0.23-0.62] Total Particle Number 1.54 [4.18 b] 1.85 [1.71-1.99] 1.76 c 0.44 [1.31 b] 3.40 [1.71-6.18] 1.08 [0.54-1.97] Particle mass Light Duty
Vehicles kg Heavy Duty Vehicles
kg CNG Buses
kg Diesel Buses
kg All Vehicles
kg All Vehicles
Tonne PM1 Urban roads 498 [1556 b] 478 [428-527] a a 976 [428-2083] 311 [136-664] Urban-major roads 181 [565 b] 340 [304-375] a a 521 [304-940] 166 [97-300] Total PM1 679 [2121 b] 818 [732-902] a a 1497 [732-3023] 477 [233-964] PM2.5 Urban roads 1027 [2490 b] 502 [393-610] a 42 [29-56] 1571 [422-3156] 501 [134-1006] Urban-major roads 373 [904 b] 358 [279-435] a 7 [5-9] 738 [284-1348] 235 [91-430] Total PM2.5 1400 [3394 b] 860 [672-1045] a 49 [34-65] 2309 [706-4504] 736 [225-1436] PM10 Urban roads 4855 [19765 b] 895 [1905 b] 0.02 c 44 [109 b] 5794 [21779 b] 1847 [6943 b] Urban-major roads 1763 [7176 b] 637 [1356 b] 0.0001 c 7 [15 b] 2407 [8547 b] 767 [2725 b] Total PM10 6618 [26941 b] 1532 [3261 b] 0.02 c 51 [124 b] 8201 [30326 b] 2614 [9668 b]
a Relevant bus emission factors were not available. b Lower bound 95% confidence interval values, although physically uninterpretable, can be obtained as a consequence of the normal assumptions underlying the models. c Lower and upper 95% confidence interval values were not available. d Urban roads had average vehicle speeds < 80 km/hr and urban-major roads ≥ 80 km/hr. e The number of days per annum were considered to be 318.8 (refer method section).

284
6.3.2. Comparing the urban SEQ particle inventory with other inventories &
models
Inventories and models which can be compared to the inventory in this study are
discussed below.
Local model estimates of PM10
Local model estimates of total annual PM10 are compared with the quantification
derived for the inventory in this study, and these are shown in Table 6.3.
The urban SEQ inventory quantification for total PM10 of 2614 tonne presented in
this study for 2004 (Table 6.2) compares well with the EPA’s estimate for SEQ of
2249 tonne prepared for 2000 (EPA 2004) shown in Table 6.3. EPA developed a
fleet emissions model using estimates of VKT, emission factors and operating
conditions, and estimated emissions for 6 vehicle classes, 4 fuel types, operating
conditions (average travel speed, road grade, engine hot and cold starts), time of
day, and day of week, summer/winter season (EPA 2004). Despite differences in
area and year of preparation of the inventories, a 10-20% difference for a strategic
model would not be considered unreasonable. Hence we believe this comparison
is valid. Therefore we can have confidence in the total particle inventory
developed in our study for urban SEQ (Table 6.2).

285
Table 6.3 Comparison of estimates of total annual PM10 for SEQ and urban SEQ a
Modellers
Region modelled
Year of inventory
Annual VKT,
millions
Estimate of total PM10 emissions,
Tonne per annum
This study
Urban SEQ a
2004
14,514 b
2614
Environmental Protection Agency (EPA 2004)
SEQ
2000
21,362
2249
Bureau of Transport and Regional Economics (BTRE 2003)
Urban SEQ a
2004
16,340
1840
Apelbaum Consulting (Apelbaum 2006)
Urban SEQ a 2003-2004
21,017 1549
a Although Urban SEQ covers only around 26% of South-East Queensland (ABS 2006;
OESR 2005), the urban SEQ vehicle fleet accounted for more than 70% of private
passenger trips in SEQ in 2004 (SEQHTS 2004).
b Excludes transport-related industry travel (eg., couriers and taxis) and trips by persons
staying in non-private accommodation (eg., tourists and business travellers staying in
hotels) (SEQHTS 2004).

286
PM10 inventories and models prepared by Apelbaum and BTRE were prepared for
2003-2004 and 2004 respectively for urban SEQ (Table 6.3). The Apelbaum
inventory used speed dependent emission factors for different road types based on
a combination of Australian and European data (Apelbaum 2006) and the BTRE
model considered growth in the economy, population, travel demand and urban
congestion, as well as deterioration due to vehicle age and rises in fuel
consumption (BTRE 2003).
Both the Apelbaum and BTRE models exhibited deficiencies. Although
Apelbaum’s annual estimate for PM10 for HDV emissions of 520 tonne was
similar to this study of 488 tonne (Table 6.2), their LDV emission factors were
lower than those used in this study. The BTRE study reported that the uncertainty
in their particulate matter estimates were high, and the part of their analysis with
the greatest levels of uncertainty (BTRE 2003).
Comparing this inventory to a UK inventory
There is only one example of a particle emissions inventory attempted for motor
vehicles that can be compared to this study, prepared for the UK in 1996, 1998
and 2001 (Group 1999; Goodwin et al. 2000; AQEG 2005). These PM10
inventories were derived by multiplying emission factors for different vehicle and
road types by annual VKT data.
Most importantly, in order to derive estimates for PM0.1, PM1 and PM2.5, they
applied distribution profiles for these particle size ranges to PM10 estimate data.
This means that emission factors for these particle size ranges below PM10 were
287
not based on individual measurements of different particle sizes, but simply on
mass fractions multiplied by PM10 data values. The authors stated that their
method depended on PM10 emission rates, which in themselves had substantial
uncertainties, and therefore believe their inventories for small size particles
contain even more uncertainty, due to additional uncertainties in the size
fractions (Group 1999).
The 1996 and 1998 inventories applied the same distribution profiles for petrol
(catalyst) and diesel exhaust, viz., mass fractions of PM10 of 85% for PM1 and
90% for PM2.5 based on 33 different particle size distributions (Group 1999;
Goodwin et al. 2000). The PM0.1 distribution profile was based on size fractions
taken from a European inventory (TNO 1997). Mass fractions of PM10 used in
the 2001 inventory for PM0.1, PM1 and PM2.5 were derived from distribution
profiles taken mostly from the USEPA compilation of emission factors (USEPA
1995) known as AP-42 (AQEG 2005).
Our urban SEQ mass fractions are influenced by the high proportion of LDV
VKT (93% of total VKT). Other possible differences between the inventories are
likely to relate to differences in fleet composition, fuel types, road types, VKT for
different vehicle types, and methods for deriving PM1 and PM2.5 emission factors.
Emission factors used in the UK inventory for petrol vehicles were several orders
of magnitude lower than their diesel values.

288
6.3.3. Results of scenario analyses
Four future scenarios were modelled to emulate likely future responses to events
such as rises in fuel costs, congestion charging, higher density living and transit
oriented development, which could see reductions in on-road VKT, and increases
in walking and cycling, car pooling or rail travel. Other events were staggering of
work and school hours, home based work or schooling, and regular, voluntary
“car free” days. PM1 was not included as relevant Diesel and CNG bus emission
factors were not available, nor PM2.5 emission factors for CNG buses. The
scenarios provide indications of the rates of change in VKT and travel mode
associated with reasonable reductions in particle emissions.
HDV regional emissions
The inventory estimated high levels of HDV emissions, which present a major
problem for the region. Although not entirely feasible or practical, the effect of
completely removing HDVs from urban SEQ would result in reductions in
particle emissions of 54%, 55%, 37% and 19% for particle number, PM1, PM2.5
and PM10 respectively. These reductions do not take into account the predicted
doubling of the on-road freight task within 20 years.

289
Scenarios modelling changes in LDV and bus VKT
Scenarios 1 and 2 modelled percentages of passengers travelling in LDVs and
buses. The results of these scenarios are shown in Tables 6.4 and 6.5, and are
discussed below.
Scenario 1 modelled reductions of 30% and 50% in LDV VKT shifting
percentages of these trips onto new buses. Given that the 24 hour average LDV
occupancy rate was 1.5 passengers, an increase in this occupancy rate to 3
passengers would lead to a 50% reduction in LDV VKT.
In Scenario 1 for each 10% reduction in LDV VKT added to new bus trips,
reductions of around 3-4% for particle number, 1-2% for PM2.5 and 1-6% for
PM10 were modelled for the 24 hour average period (Table 6.4). Table 6.4 shows
modelled reductions in particle number, PM2.5 and PM10, with PM10 modelled
reductions under these scenarios almost double those for particle number.

290
Table 6.4 Modelled reductions in total particle emissions in urban SEQ
in the 24 hour average period
Scenario 1: Reducing Light Duty Vehicle VKT 30% and 50%, and moving proportions of these passengers onto new buses in the 24 hour average period
Reduction in LDV VKT
30%
50%
Percentage of passengers moved to new buses
100% 70% b 100% 70% b
Modelled reduction in total particle emissions (%)
Particle number
9.6
11.2
15.9
18.7
PM2.5 a 1.9 6.0 3.1 10.0
PM10 18.1 19.5 30.2 32.2
a PM2.5 excluded CNG buses due to lack of relevant emission factors, hence the bus fleet was
assumed Diesel-fuelled, resulting in lower modelled reductions. b Assumed the remaining LDV
passengers chose to walk, cycle, catch a train or fill an existing bus, car pool or undertook home-
based work or schooling.

291
Scenario 2 reduced 20% of Home Based Work trip VKT and added 50% of these
trips onto new buses. For each 10% reduction in Home Based Work trip VKT,
where half these trips were added to new buses, reductions were about 2% for
particle number, 2-3% for PM2.5 and 3-4% for PM10 (Table 6.5).
Table 6.5 Modelled reductions in total particle emissions in urban SEQ in
the peak travel times and in the 24 hour average period
Scenario 2: Reducing Home Based Work trip VKT by 20%, and moving 50% of these passengers onto new buses in the peak periods and in the 24 hour average period b
Travel times
7am-9am
4pm-6pm
24 hour
average
Modelled reduction in total particle emissions (%)
Particle number
3.5
4.8
3.1
PM2.5 a
4.7 6.1 4.3
PM10
6.1 7.5 5.5
a PM2.5 excluded CNG buses due to lack of relevant emission factors, hence the bus fleet was
assumed Diesel-fuelled, resulting in lower modelled reductions. b Assumed the remaining LDV
passengers chose to walk, cycle, catch a train or fill an existing bus, car pool, or undertook home-
based work or schooling.

292
Average particle emissions per passenger per km for LDVs and Buses:
Scenario 3 is shown in Table 6.6. As relevant emission factors were not available
for buses for PM1 and for PM2.5 for CNG Buses, these were not included. Average
particle emission factors per passenger per km for particle number for LDVs were
1-2 orders of magnitude higher than for buses; on urban roads for CNG buses
were three times those for Diesel buses; and on urban-major roads Diesel buses
were ten times higher than CNG buses. PM2.5 average particle emission factors
per passenger per km were similar for LDVs and Diesel buses.
On urban roads average particle emission factors per passenger per km for PM10
for LDVs were about 5 times higher than those for Diesel buses, and several
orders of magnitude higher than CNG buses, suggesting opportunities for major
reductions in PM10 by moving proportions of LDV passengers to CNG buses.
There is also ample opportunity to comfortably double LDV and bus occupancy
rates in the region, which were 1.5 passengers and 15.5 passengers respectively
(for the 24 hour average period), leading to further reductions in regional
emissions.
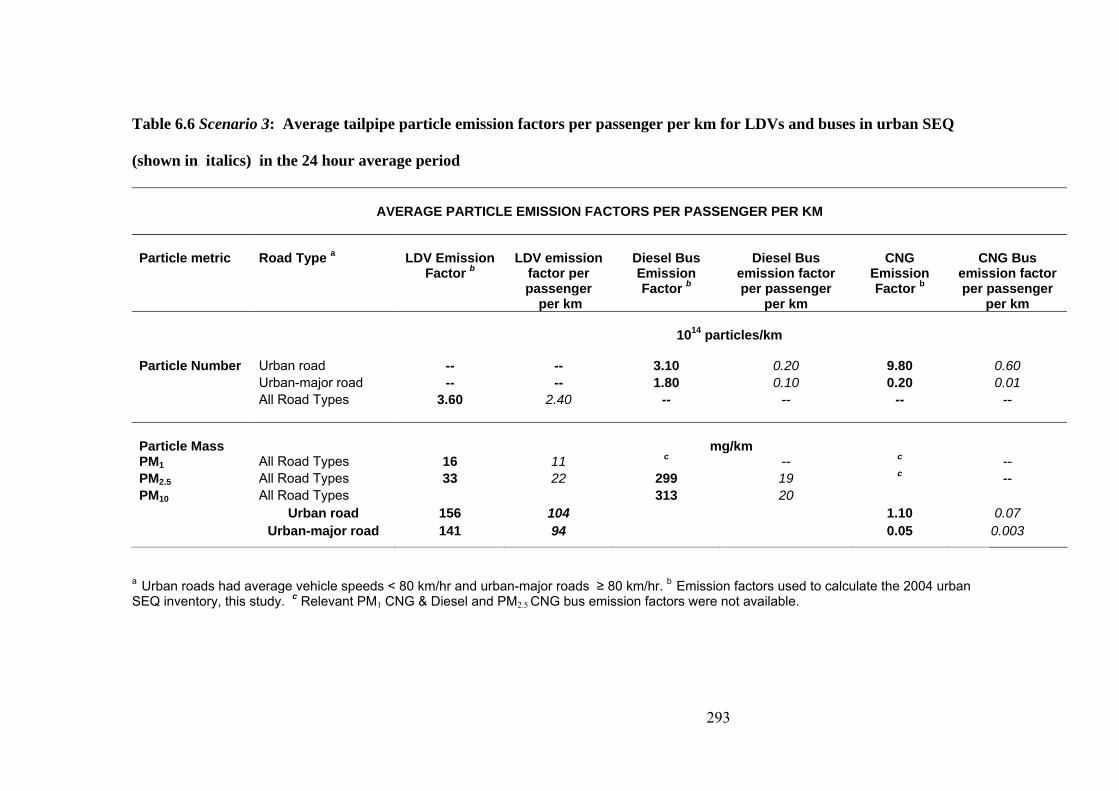
293
Table 6.6 Scenario 3: Average tailpipe particle emission factors per passenger per km for LDVs and buses in urban SEQ (shown in italics) in the 24 hour average period
AVERAGE PARTICLE EMISSION FACTORS PER PASSENGER PER KM
Particle metric
Road Type a
LDV Emission
Factor b
LDV emission
factor per passenger
per km
Diesel Bus Emission Factor b
Diesel Bus
emission factor per passenger
per km
CNG
Emission Factor b
CNG Bus
emission factor per passenger
per km
1014 particles/km
Particle Number Urban road -- -- 3.10 0.20 9.80 0.60 Urban-major road -- -- 1.80 0.10 0.20 0.01 All Road Types 3.60 2.40 -- -- -- --
Particle Mass
mg/km
PM1 All Road Types 16 11 c -- c -- PM2.5 All Road Types 33 22 299 19 c -- PM10 All Road Types 313 20
Urban road 156 104 1.10 0.07 Urban-major road 141 94 0.05 0.003
a Urban roads had average vehicle speeds < 80 km/hr and urban-major roads ≥ 80 km/hr. b Emission factors used to calculate the 2004 urban SEQ inventory, this study. c Relevant PM1 CNG & Diesel and PM2.5 CNG bus emission factors were not available.
294
An estimate of particle emissions in urban SEQ in 2026
The assumptions applied to Scenario 4 are shown in Scenario 4A in Table 6.7,
and the estimated 2026 inventory is presented in Scenario 4B in Table 6.8.
Emission factors for 2026 were based on the emission factors used in the 2004
inventory (Table 6.1), reduced by different percentages (Table 6.7).
The percentage reduction applied to the 2004 emission factor values to derive
emission factors for the 2026 scenarios were generally, but not precisely, based on
vehicle regulations. Firstly, the proposed Swiss ordinance which requires
reductions in solid particle number emissions for LDV Diesel vehicles of 95%, or
greater (BUWAL 2004) and, secondly, the 40% reduction observed between the
highest emission limit values for EURO III and those for EURO IV LDV Diesel
vehicles for PM10 (SAEFL 2004). Based on these vehicle regulations, to derive
emission factors for the 2026 scenario model developed in this paper, the 2004
particle emission factor for LDV Diesel vehicles was reduced by 80% and the
2004 particle emission factor for LDV petrol vehicles by 20%.

295
Table 6.7 Scenario 4A: Model variables and assumptions used to
predict particle number and particle mass emissions in urban
SEQ in 2026
Percentage reduction in 2004 particle emission factor values
Vehicle Type % increase in 2004 VKT
2026 Fleet composition
Particle number
Particle mass,
PM1, PM2.5, PM10
LDV 26% a 50% Diesel 45% Petrol 5% Electric (zero emissions)
80% 20% n/a
40% 40% n/a
HDV 90% b Mainly Diesel 20% 40% Buses 29% a 40% Diesel
50% CNG 10% Hybrid
20% 20%
10% of 2004 Diesel Bus emission
factor
40% 40%
10% of 2004 Diesel Bus emission
factor
a These percentage increases are lower than those predicted for the study region for 2004-2020 of
32% for LDVs and 36% for buses by BTRE (BTRE 2003), as we are basing our assumption on an
assumed shift to walking, cycling, rail or car pool trips in the region in 2026 of around 6-7%.
b HDV VKT is predicted to double over the next 20 years (SKM 2006). It was assumed 10% of
this freight increase would be transported by rail, or other less polluting options that may be
available in the future, such as the use of hybrid/electric intermodal solutions.

296
Table 6.8 Scenario 4B: Estimated total annual particle emissions in
urban SEQ in 2026, compared to the 2004 inventory, this study
Particle metric
2004 inventory
2026
Prediction
Increase/Decrease over
2004 estimates
1025 particles 1027 particles Particle Number
1.08
1.47
Approx. 100-fold Increase
Particle mass
Tonne
Tonne
PM1 477 296 38% Decrease PM2.5 736 472 36% Decrease PM10 2614 1808 31% Decrease
The 20% assumed reduction for LDV petrol vehicles was based on the
assumption that higher reductions in emissions would only be likely to be
achieved if significant advances in technology in the future were realised, and
mandatory particle number emission standards for these vehicle types were
introduced.
Although reductions in PM10 emission limit values of 80% are proposed under
EURO V in 2020 for LDV diesel vehicles (the same limit value is proposed for
LDV petrol vehicles) (EurActiv 2006), a more conservative approach was
adopted in the modelling, and an across the board 40% reduction applied to all
particle mass emission factors. It was also considered that the proportion of 2020-
compliant vehicles would be unlikely to dominate the 2026 fleet.

297
Total particle number emissions for urban SEQ for 2026 were predicted to
increase by more than 2 orders of magnitude, as compared to the 2004 inventory.
This was influenced by an assumed 90% increase in HDV VKT. However,
particle mass emissions in 2026 were predicted to reduce 31-36% (Table 6.8).
6.4. CONCLUSIONS
This study presents the first published comprehensive inventory of motor
vehicle tailpipe particle emissions for particle number and particle mass.
Conclusions from its development and scenario analyses are as follows:-
• Firstly, although HDVs contributed only around 6% of regional
VKT, they contributed more than 50% of particle number and
PM1 emissions to the region, signalling the need for strategies to
reduce HDV diesel vehicle emissions. This finding relates to the
study region, however similar results would be expected in other
areas that have high HDV diesel VKT. Given that the study
region is not highly industrialised and is more service and
tourism oriented, this means that regions with higher levels of
industrialisation could have even larger HDV particle emission
levels. HDV particle emissions are a global problem which
requires reduction strategies such as mandatory fitting of particle
filters, regular emissions testing, and identification of freight
options and freight routes that produce lower emissions per

298
tonne-kilometre and result in lower exposures for populations in
close proximity to truck routes.
• Secondly, the study found that when modelling the movement of
different proportions of LDV passengers to new buses,
reasonable reductions in particulate matter emissions, particularly
for PM10, were able to be achieved. Our study demonstrates the
value of examining and modelling changes in travel mode from
LDVs to new buses, which can be useful to identify the extent to
which changes in travel mode choice between these two travel
modes may lead to reductions in particle emission rates.
The study also found that when calculating average emission
factors per passenger-km for particle number and PM10 for
LDVs, that these were substantially higher than those for buses in
the study region, emphasizing the value of initiatives that
encourage shifts from LDV passenger cars to buses, and which
focus on increasing bus vehicle occupancy rates.
• Thirdly, modelling future scenarios, such as done for 2026 for the
study region which predicted an 100-fold increase in particle
number and 31-36% reduction in particle mass, offer opportunities
to design mitigation efforts tailored to expected changes in travel
demand and vehicle technologies.

299
• Fourthly, recent research has found that PM1 and PM10 constitute a
more discerning combination of mass-based air quality standards for
combustion sources such as motor vehicles than the current
standards of PM2.5 and PM10 (Morawska et al. 2008). To adequately
control particle emissions emitted by motor vehicles, guidelines and
standards need to be introduced for both particle number and PM1 to
complement existing standards. Future development of inventories
for these particle metrics, such as presented in our study, can provide
very important data to inform development of future ambient air
quality guidelines and standards, and this research supports the
relevance and importance of modelling emission inventories which
cover the full size range of particles generated by motor vehicle
fleets.
• Fifthly, urban congestion is a problem not only in SEQ but in many
urban centres around the world. It affects travel time and also has
environmental implications in terms of particle pollution and issues
such as climate change. Regular particle inventories are needed for
urban areas that focus not only on quantifying total daily and annual
particle emissions, but on identifying ‘hot-spots’ and travel routes,
such as roads, truck routes, busways and tunnels posing a risk to
exposed populations. The problem of congestion is an issue
requiring further research, particularly the need to derive speed-
related particle emission factors to model congestion and vehicles
travelling at lower speeds. In addition, research is needed to
300
evaluate particle emission levels pre- and post construction of
transport infrastructure, high density living and transit oriented
developments.
• Sixthly, it is important to extend work such as that presented in this
inventory to estimate the spatial distribution of particle
concentrations, and to gain an understanding of the socioeconomic
characteristics of populations affected by ‘hot-spots’. Inventories
such as presented in our work provide new knowledge that can be
used in climate models to develop an understanding of the quantity
and impacts of motor vehicle particle emissions on the global
airshed, including particle concentrations reaching into the
troposphere and stratosphere, as well as their potential effects, such
as contributing to the cooling and dimming of the planet.

301
6.5. REFERENCES
Apelbaum, 2006. Queensland Transport Facts, Apelbaum Consulting Group Pty
Ltd, Mulgrave, Victoria, Australia.
Australian Bureau of Statistics (ABS), 2004a. Survey of Motor Vehicle Use
Australia. Australian Bureau of Statistics, Canberra.
Australian Bureau of Statistics (ABS), 2004b. Population by Age and Sex.
Australian Bureau of Statistics, Canberra.
Australian Bureau of Statistics, Census Data (ABS) 2006, Community Profile for
Brisbane, Australian Bureau of Statistics, Canberra.
Brisbane City Council, 2007, Brisbane City Council Transport Plan for Brisbane
2006-2026 Draft, Brisbane City Council, Brisbane.
Air Quality Expert Group (AQEG), 2005. Particulate Matter in the UK. London,
Department for Environment, Food and Rural Affairs.
Bigg, E.K., Turvey, D.E., 1978. Sources of atmospheric particles over Australia.
Atmospheric Environment 12, 1643-1655.
Bureau of Transport and Regional Economics (BTRE), 2003. Urban pollutant
emissions from motor vehicles: Australian trends to 2020, Final Draft Report for
Environment Australia. Canberra, BTRE.
BUWAL., 2004, 1 March. Ordinance on the determination of the particle number
emission level of passenger cars with compression ignition engines, Draft.
http://www.puntofocal.gov.ar/doc/che39.pdf. Date verified 1 November 2008.

302
Cadle, S. H., Ayala, A., Black, K. N., Graze, R. R., Koupal, J., Minassian, F.,
Murray, H. B., Natarajan, M., Tennan, C. J., Lawson, D. R., 2008. Journal of Air
and Waste Management Association. Real-World Vehicle Emissions: A Summary
of the Seventeenth Coordinating Research Council On-Road Vehicle Emissions
Workshop 58, 3-11.
California Air Resources Board (CARB), 2001. Heavy-Duty Emissions
Laboratory, Heavy Duty Testing and Field Support Section, California Air
Resources Board. Report No. 01-01.
Chen, H., Namdeo, A., Bell, M., 2008. Classification of road traffic and roadside
pollution concentrations for assessment of personal exposure. Environmental
Modelling & Software, 23(3), 282-287.
Cheng, S., Chen, D., Li, J., Wang, H., Guo, X., 2007. The assessment of
emission-source contributions to air quality by using a coupled MM5-ARPS-
CMAQ modeling system: A case study in the Beijing metropolitan region, China.
Environmental Modelling & Software, Volume 22, Issue 11, November 2007,
Pages 1601-1616.
Cohen, J., Cook, R., Bailey, C.R., Carr, E., 2005. Relationship between motor
vehicle emissions of hazardous pollutants, roadway proximity, and ambient
concentrations in Portland, Oregon. Environmental Modelling & Software,
Volume 20(1), 7-12.
Commission of the European Communities, 2007a. Proposal for a Regulation of
the European Parliament and of the Council on type-approval of motor vehicles
and engines with respect to emissions from heavy duty vehicles (Euro VI) and on
access to vehicle repair and maintenance information, Brussels.

303
Commission of the European Communities, 2007b. Annex to the Proposal for a
Regulation of the European Parliament and of the Council on the approximation
of the laws of the Member States with respect to emissions from on-road heavy
duty vehicles and on access to vehicle repair information, Impact Statement,
Brussels.
Costabile, F., Allegrini, I., 2008. A new approach to link transport emissions and
air quality: An intelligent transport system based on the control of traffic air
pollution. Environmental Modelling & Software, 23(3, 258-267.
DieselNet Emissions Standards, Switzerland. www.dieselnet.com/standards/ch/.
Date verified 1 November 2008.
Environmental Protection Agency (EPA), 2004. Air Emissions Inventory South-
east Queensland Region. Queensland Government, Brisbane.
EurActiv.com 2006. EURO 5 emissions standards for cars, EU News, Policy
Positions & EU Actors online. http://www.euractiv.com/en/transport/euro-5-
emissions-standards-cars/article-133325. Date verified 1 November 2008.
European Commission Joint Research Centre (ECJRC), 2002. Guidelines for
concentration and exposure-response measurement of fine and ultrafine
particulate matter for use in epidemiological studies. EUR 20238 EN 2002. L. M.
D. Schwela, D. Kotzias, European Commission, Italy.
European Union 2007, Official Journal of the European Union, Regulation (EC)
No 715/2007 of the European Parliament and of the Council of 20 June 2007 on
type approval of motor vehicles with respect to emissions from light passenger
and commercial vehicles (Euro 5 and Euro 6) and on access to vehicle repair and
maintenance information, Strasbourg.
304
Goodwin, J. W. L., Salway, A. G., Murrells, T. P., Dore, C. J., Passant, N. R.,
Eggleston, H. S., 2000. UK emissions of air pollutants 1970-1998. A Report of
the National Atmospheric Emissions Inventory. London, Department of the
Environment, Transport and the Regions.
Goodwin, J. W. L., Salway, A. G., Eggleston, H. S., Murrells, T. P., Berry, J.E.,
1999. National Atmospheric Emissions Inventory, UK Emissions of Air
Pollutants 1970 to 1996, National Environmental Technology Centre on behalf of
the Department of the Environment, Transport and the Regions.
Group, 1999. Source Apportionment of Airborne Particulate Matter in the United
Kingdom. Report for the Department of the Environment, Transport and the
Regions, the Welsh Office, the Scottish Office and the Department of the
Environment (Northern Ireland).
Hurley, P.J., Physick, W.L., Luhar, A.K., 2005. TAPM: a practical approach to
prognostic meteorological and air pollution modelling. Environmental Modelling
& Software, Volume 20, Issue 6, June 2005, Pages 737-752.
Jayaratne, E.R., Ristovski, Z.D., Meyer, N., Morawska, L., 2008. Particle and
Gaseous Emissions from Compressed Natural Gas and Ultralow Sulphur Diesel-
Fuelled Buses at Four Steady Engine Loads. Science of the Total Environment
407 (8), 2845-2852.
Jones, A. M., Harrison, R.M., 2006. Estimation of the emission factors of particle
number and mass fractions from traffic at a site where mean vehicle speeds vary
over short distances. Atmospheric Environment 40(37), 7125-7137.
Keogh, D.U., Kelly, J., Mengersen, K, Jayaratne, E.R., Ferreira, L., Morawska, L.,
2009. Derivation of motor vehicle tailpipe particle emission factors suitable
modelling urban fleet emissions and air quality assessments. Environmental
Science and Pollution Research – International. Published online, doi
0.1007/s11356-009-0210-9.

305
McKay, L., McGaw, N., 2005, TravelSmart™ - the innovative solution to
competing demands. National Conference Proceedings of the Australian Institute
of Traffic Planning & Management Inc., Brisbane.
Mensink, C., Lefebre, F., Janssen, L., Cornelis, J., 2006. A comparison of three
street canyon models with measurements at an urban station in Antwerp,
Belgium, Environmental Modelling & Software, Volume 21(4), 514-519.
Ministry of Transport, 2007. 2005 Household Travel Survey Summary Report
2007 Release, NSW Ministry of Transport, Transport Data Centre, August.
Mobley, J.D., Cadle, S. H., 2004. Innovative Methods for Emission Inventory
Development and Evaluation: Workshop Summary. Journal of the Air & Waste
Management Association 54, 1422-1439.
Morawska, L., Salthammer, T., 2003. Chapter 3: Motor Vehicle Emissions as a
Source of Indoor Particles in, Morawska-Salthammer (eds). Indoor Environment,
Wiley-VCH.
Morawska, L., Keogh, D. U., Thomas, S. B., Mengersen, K., 2008. Modality in
ambient particle size distributions and its potential as a basis for developing air
quality regulation. Atmospheric Environment 42(7), 1617-1628.
Namdeo, A., Mitchell, G., Dixon., R. 2002. TEMMS: an integrated package for
modelling and mapping urban traffic emissions and air quality. Environmental
Modelling & Software, Volume 17(2), 177-188.
Office of Urban Management, 2004. Draft South East Queensland Regional Plan:
For Consultation. Brisbane Department of Local Government, Planning, Sport &
Recreation, Queensland Government.
Ortuzar, J. de., Willumsen, L.G., 2001. Modelling Transport. John Wiley & Sons
Inc.
306
Parrish, D.D., 2006. Critical evaluation of US on-road vehicle emission
inventories. Atmospheric Environment 40(13), 2288-2300.
Pope, C. A., .Dockery, D. W., 2006. Health Effects of Fine Particulate Air
Pollution: Lines that Connect. Journal of the Air & Waste Management
Association 56(6), 709-732.
Queensland Department of Main Roads, 2008. Brisbane Strategic Transport
Model, Queensland Government, Brisbane.
Office of Economic and Statistical Research (OESR) 2005, Queensland Regional
Profiles 2004, Brisbane and Moreton Statistical Divisions, Office of Economic
and Statistical Research, Queensland Treasury, Brisbane.
Oxley, T., Valiantis, M., Elshkaki, A., ApSimon, H.M., 2009. Background, Road
and Urban Transport modelling of Air quality Limit values (The BRUTAL
model). Environmental Modelling & Software, 24(9), 1036-1050.
Samaras, Z., Ntziachristos, L., Thompson, N., Hall, D., Westerholm, R., Boulter,
P., 2005. Characterisation of Exhaust Particulate Emissions from Road Vehicles,
PARTICULATES program, European Commission. Contract No 2000-
RD.11091, source http://lat.eng.auth.gr/particulates/downloads.htm.
Shifter, I., Diaz, L., Mugica, V., Lopez-Salinas, E., 2005. Fuel-based motor
vehicle emission inventory for the metropolitan area of Mexico city. Atmospheric
Environment 39(5), 931-940.
Sinclair Knight Merz (SKM), 2006. Twice the Task: A review of Australia's
freight transport tasks. Melbourne, Victoria, National Transport Commission.
Sokhi, R.S., Mao, H., et al., 2008. An integrated multi-model approach for air
quality assessment: Development and evaluation of the OSCAR Air Quality
Assessment System. Environmental Modelling & Software, 23(3), 268-281.

307
South-East Queensland Household Travel Survey (SEQHTS), 2004. South-East
Queensland Household Travel Survey 2003-2004 (Brisbane, Gold Coast and
Sunshine Coast Area). Queensland Transport, Brisbane.
Smit, R., Brown, A.L., Chan, Y.C., 2008. Do air pollution emissions and fuel
consumption models for roadways include the effects of congestion in the
roadway traffic flow?. Environmental Modelling & Software, 23(10-11), 1262-
1270.
Smit, R., Smokers, R., Rabe, E., 2007. A new modelling approach for road traffic
emissions: VERSIT+. Transportation Research Part D-Transport and
Environment 12, 414-422.
Swiss Agency for the Environment, Forests and Landscape (SAEFL), 2004. Air
Pollutant emissions from Road Transport 1980-2030 Environmental Series No.
355. Berne SAEFL.
TNO, 1997. Particulate Matter Emissions (PM10, PM2.5, PM<0.1) in Europe in
1990 and 1993, TNO Report TNO-MEP-R96/472. Netherlands.
Translink, 2007. Bus patronage and bus fleet statistics. Queensland Transport,
Brisbane.
US EPA., 1993. User's Guide to MOBILE5A, Mobile source emissions factor
model, U.S. Environmental Protection Agency.
US EPA., 1995. Compilation of Air Pollutant Emission Factors, 5th edn, AP-42,
North Carolina.
World Health Organization (WHO) 2005. Guidelines for Air Quality. World
Health Organization, Geneva.

308
CHAPTER 7
AMBIENT NANO AND ULTRAFINE PARTICLES
FROM MOTOR VEHICLE EMISSIONS:
CHARACTERISTICS, AMBIENT PROCESSING AND
IMPLICATIONS ON HUMAN EXPOSURE
Lidia Morawska1, Zoran Ristovski1, Rohan Jayaratne1,
Diane.U. Keogh1, Xuan Ling1
1 International Laboratory for Air Quality and Health, Queensland
University of Technology, Brisbane, Queensland, Australia
(2008) Atmospheric Environment 42 (35), 8113-8138

309
STATEMENT OF JOINT AUTHORS
Title: Ambient nano and ultrafine particles from motor vehicle emissions:
characteristics, ambient processing and implications on human
exposure
Authors: Lidia Morawska, Zoran Ristovski, Rohan Jayaratne,
Diane. U. Keogh and Xuan Ling
Lidia Morawska
Review and synthesis of current knowledge on factors affecting particle
concentrations, including transport, processing, dynamics, chemical
composition, temporal, spatial and seasonal variation; and ultrafine particle
correlations with gaseous pollutants. Contributed to the manuscript.
Zoran Ristovski
Review and synthesis of current knowledge on sources of particles in natural
environments, and of the role of after-treatment devices in terms of motor
vehicle emissions. Contributed to the manuscript.
Rohan Jayaratne
Review and synthesis of current knowledge on vehicle emissions as a source of
ultrafine particles, primary and secondly particles, the role of fuels, ions, and
road-tyre interface in terms of ultrafine particles. Contributed to the manuscript.

310
Diane U. Keogh (candidate)
Review and synthesis of current knowledge related to the location of the mode
within particle size distributions in a wide range of different worldwide
environments. Review and synthesis of current knowledge on published
emission factors for different vehicle types for particle number, and on
development of motor vehicle particle emission inventories. Contributed to the
manuscript.
Xuan Ling
Literature review, analysis and synthesis of current knowledge on the
capabilities and limitations of current measurement techniques used to measure
particle number concentration. Contributed to the manuscript.

311
ABSTRACT
The aim of this work was to review and synthesize the existing knowledge on
ultrafine particles in the air with a specific focus on those originating due to
vehicles emissions. This constitutes Part II of a literature review on ultrafine
(UF) particles, with industrial and power plant emissions covered in Part I. As
the first step, the review considered instrumental approaches used for UF
particle monitoring and the differences in the outcomes they provide. This was
followed by a discussion on the emission levels of UF particles and their
characteristics as a function of vehicle technology, fuel used and after treatment
devices applied. Specific focus was devoted to secondary particle formation in
urban environments resulting from semi volatile precursors emitted by the
vehicles. The review discussed temporal and spatial variation in UF particle
concentrations, as well as particle chemical composition and relation with
gaseous pollutants. Finally, the review attempted to quantify the differences
between UF particle concentrations in different environments. These, as well as
other aspects of UF characteristics and dynamics in the air, were discussed in
the context of human exposure and epidemiological studies as well as in relation
to management and control of the particles in vehicle affected environments.

312
7.1. INTRODUCTION
Ultrafine and nano particles present in the air due to natural sources and
processes, as well as those resulting from anthropogenic activities have attracted
an increasing level of interest in the last decade. Ultrafine particles (UF) are
defined as those with diameters smaller than 0.1 μm, and their subset,
nanoparticles as smaller than 0.05 μm. Both these terms constitute a somewhat
arbitrary classification of particles in terms of their size, indicating the
significant role of this physical characteristic on particle fate in the air. Also
health and environmental effects of particles are strongly linked to particle size,
as it is the size which is a determinant (in a probabilistic sense) of the region in
the lung where the particles would deposit or the outdoor and indoor locations,
to which the particles can penetrate or be transported. In addition, sampling of
particles and choice of an appropriate instrumentation and methodology is
primarily based on particle size. Airborne concentration of UF and nanoparticles
is most commonly measured and expressed in terms of number concentrations
of particles per unit volume of air, in contrast to larger particles, which are
measured in terms of mass concentration.
The size of particles, however, depends on the multiplicity of sources and
processes which lead to their formation, and therefore, on the material from
which the particles were formed, with the complex scientific knowledge behind
these processes still containing many significant gaps. The recent interest in UF
particles is to a large extent due to the impact of anthropogenic processes,
resulting in unprecedented increases in particle concentration, often by one or
two orders of magnitude above their natural concentrations. The most

313
significant are the various outdoor anthropogenic combustion sources, including
vehicles (and other forms of transport), as well as industrial and power plants,
all utilising fossil fuels. Another significant combustion source is biomass
burning, including controlled and uncontrolled forest and savannah fires. There
are also indoor combustion sources such as stoves and heaters utilising fossil
fuels and biomass, as well as tobacco smoking.
The interest in UF particles has resulted in a large body of literature published in
recent years, reporting on various aspects and characteristics of these particles.
Therefore, the aim of this work was to review and synthesize the existing
knowledge and to draw conclusions as to the picture emerging with regard to
these particles in atmospheric systems. Out of the two main outdoor
anthropogenic sources, this paper is focused on vehicle emissions, while the
companion paper targets industrial and power plants as sources of UF particles.
Not included in this review is the contribution of biomass burning (controlled
and uncontrolled fires), and incineration of refuse to local or global UF particle
concentrations. Both are topics for independent reviews.
7.2. CAPABILITIES AND LIMITATIONS OF PARTICLE NUMBER MEASUREMENT METHODS
A full review of the instrumental methods for measuring of UF particle
properties is outside the scope of this review paper and the reader is directed to
several recent publications addressing this topic, e.g. (McMurry 2000).
However, it is important to consider the existing methods for particle number
and size distribution measurements, since it is the very nature of the

314
instrumental method which determines the measurement outputs and in turn
their compatibility with those obtained utilising different methods. The majority
of the published studies reporting on particle number and number size
distribution applied electrostatic classifiers (EC) and condensation particle
counters (CPC) manufactured by TSI Incorporated (www.tsi.com), with a much
smaller number using other instruments, for example GRIMM
(www.dustmonitor.com), or air ion mobility spectrometers, which have enabled
measurements down to 0.4 nm (Mirme et al. 2007). The latter measures only
naturally charged particles, and have been used only in a handful of studies.
When referring to UF or nanoparticles, an unspoken assumption is made that the
instrumental methods used provide information on particles in the two specific
size ranges (<0.05 and <0.1 μm, respectively). This is possible if the
instrumental method enables measurements of particle number size distribution,
usually in a broader range, from which the sections of data encompassing UF or
nanoparticles is extracted. Such methods are most commonly based on
electrostatic classifiers operating in combination with particle counters as
differential/scanning mobility particle sizers (DMPS or SMPS, respectively)
(Baron and Willeke 2001). The lower end of the size window is determined both
by instrumental factors and operator decisions. In the first instance, the lower
size limit is determined by the capability of the CPC and ranges from 2-10 nm.
However, most commonly the DMPS/SMPS lower end of the window is set to a
value above this, in the range from 10 – 20 nm. The reason for setting it up to 10
nm higher than the achievable lower limit is that this provides a compromise as
to the overall size of the window. Losing the few nanometres at the lower end

315
enables a significant extension of the window at the upper end, which in most
cases is a preferable option, unless a study specifically focuses on the nucleation
mode.
If, rather than employing instrumentation for particle size distribution
measurement, only a particle counter is used, the outcome of the measurement is
the total particle number concentration in the detection size range of the
instrument. There are two important implications of this to the interpretation of
this value as a measure of UF particles. Firstly, this means that the outcomes of
the measurements are not specifically UF or nano particle concentrations, unless
specific inlets are used which restrict the range of particles entering the
detecting arm of the instrument. While it is true that in most typical
environments particle number concentration is dominated by UF particles,
which is, thus, usually a good approximation of the total particle number
concentration, it is important to keep in mind that these are not the same, that
there are environments where there are significant particle modes outside the
UF range (see section 7.1, below) and therefore the two concentrations (UF and
total number) differ significantly. Secondly, and even more significantly, the
condensation particle counters often detect particles in the range extending to
lower sizes than the window set by the DMPS/SMPS. This means that the
counters are capable of detecting particles in the earlier stages of nucleation, and
the presence of the nucleation mode which is below the size detection limit set
by the DMPS/SMPS. Therefore in most situations, the counters would detect
more particles than the DMPS/SMPS, and significantly more in the
environments where a nucleation mode is frequently present.

316
The above points are important when comparing particle number concentrations
reported in different papers and when specifically considering UF or
nanoparticles. Since different studies use different sets of instrumentation and
investigate a different size range window, comparison of the total particle number
concentrations reported should be conducted with caution. In order to develop at
least a broad understanding of the impact which these differences have on the
measured particle concentrations, data from 52 studies reporting total particle
number concentrations for a range of different environments was compiled and
then the results grouped according to the measurement technique used: CPC or
DMPS/SMPS.
1
10
100
CPC SMPSInstrument
103 Pa
rtic
les/
cm3
meanmedian
Figure 7.1. Comparison of reported particle number concentrations measured
by CPC or DMPS/SMPS*.
* These CPC and SMPS results were extracted from the following papers: Aalto et al. (2001), Harrison et
al. (1999), Kittelson et al. (2004) and Shi et al. (2001a) who used both the CPC and SMPS; Vakeva et al.
(1999), Zhu et al. (2004), Imhof et al. (2005a), Paatero et al. (2005) and Westerdahl et al. (2005) who used
only the CPC and McMurry and Woo (2002), Tuch et al. (1997), Morawska et al. (1999a), Hitchins et al.

317
(2000), Junker et al. (2000), Jamriska and Morawska (2001), Pitz et al. (2001), Ruuskanen et al. (2001),
Cheng and Tanner (2002), Molnar et al. (2002), Morawska et al. (2002), Thomas and Morawska (2002),
Wehner et al. (2002), Zhu et al. (2002a), Zhu and Hinds (2002b), Ketzel et al. (2003), Longley et al.
(2003), Tunved et al. (2003), Wehner and Wiedensohler (2003), Gidhagen et al. (2004), Gramotnev and
Ristovski (2004), Gramotnev et al. (2004), Hussein et al. (2004), Jamriska et al. (2004), Janhall et al.
(2004), Jeong et al. (2004), Ketzel et al. (2004), Morawska et al. (2004), Stanier et al. (2004a), Gidhagen et
al. (2005), Holmes et al. (2005), Imhof et al. (2005b), Rodriguez et al. (2005), Janhall et al. (2006),
Virtanen et al. (2006), Wahlin et al. (2001), Woo et al. (2001b), Abu-Allaban et al. (2002), Laakso et al.
(2003), Hussein et al. (2005a) and Mejia et al. (2007a) who used only the SMPS. Other studies, such as
(Hameri et al. 1996; Kaur et al. 2006), which measured particle concentration without using a CPC or
SMPS (e.g. P-trak etc.) were not included in Figure 7.1, nor were the four tunnel studies (Abu-Allaban et
al. 2002; Gouriou et al. 2004; Jamriska et al. 2004; Imhof et al. 2005b) (see comments in relation to tunnels
in section 7.4 below).
The mean concentrations measured by the CPC's and DMPS/SMPS's are
36.8×10³/cm3 and 30.6×10³/cm3, respectively, and the median concentrations
are 24.9×10³/cm3 and13.5×103/cm3, respectively. In other words, the mean and
the median CPC measurements are 32% and 56%, higher than DMPS/SMPS's
measurements, respectively. The difference in the means was tested using a
Students t-test and found to be statistically significant at a confidence level of
over 99%.
The overall comparison of the differences between the total particle
concentration values measured by CPCs and DMPS/SMPSs has some
shortcomings. In particular, the differences for specific environments could
vary, where larger differences are expected for environments where a nucleation
mode is present and smaller where aged aerosol dominates. Moreover,
corrections for particle losses within the two instruments may play a significant
role. Nevertheless, the comparison shows what overall magnitude of differences
318
can be expected when comparing results using these different measuring
techniques. It is important to keep these differences in mind when attempting to
establish quantitative understanding of variation in particle concentrations
between different environments, which is of significance for human exposure
and epidemiological studies.
It is worth mentioning that large discrepancies have also been observed when
comparing the results of particle number concentrations measured directly from
vehicle exhaust. While particle volume/mass showed reasonable reproducibility
in between different studies, results of particle number measurements were
difficult to reproduce, even in the same study. Some artefacts and poor
reproducibility in vehicle emission measurements were due not only to the
different instruments used but also to the fact that the majority of particles (in
terms of number) belonged to the nucleation mode and were formed in the
process of dilution. The number of particles formed in the nucleation mode is
very sensitive to the dilution conditions and any slight changes (of the dilution
temperature, for example) can result in a significant change in particle number
concentration. A detailed discussion on the effects of dilution conditions on
sampling and measurements of particle numbers in vehicle emissions can be
found in Kasper (2005). In order to develop a method that could be used in a
reproducible and comparable manner in laboratories around the world, the
UNECE-GRPE Particulate Measurement Program (PMP) was formed. This
program focused on future regulation of nano-particle emissions from light duty
vehicles and heavy duty engines with the goal to amend existing approval
legislation to stipulate an extensive reduction of particle emissions from mobile

319
sources (Mohr and Lehmann 2003). Based upon the recommendation of the PMP,
the European Commission has added a particle number limit to its Euro 5/6
proposed emission standards for light-duty vehicles. Only solid particles are
counted, as volatile material is removed from the sample, according to the PMP
procedure.
7.3. SOURCES OF PARTICLES IN NATURAL ENVIRONMENT
While the main focus of this review is on the impact of vehicle emissions on
ambient characteristics of UF and nanoparticles, for completeness, and in order to
fully understand this impact, firstly natural sources and their contributions are
discussed, as they result in the natural background of the particles in ambient air.
Vehicle emissions increase particle concentrations over this background and result
in an overall change of particle characteristics.
Of particular importance in natural environments is the formation of new
particles, of which the main mechanism is nucleation of low-volatile gas-phase
compounds, followed by their growth into small particles. It is not the intention of
this review to go into great detail about the mechanisms of particle formation
(both natural and anthropogenic). For more details on this topic, the reader is
referred to several recent literature reviews (Kulmala et al. 2004; Holmes 2007).
There were a number of observations of new particle formation in natural
environments ranging from very clean environments such as the arctic (Birmili
and Wiedensohler 2000), boreal forests in the northern hemisphere (O'Dowd et al.
2002; Tunved et al. 2006), eucalypt forests of Australia (Suni et al. 2007) and a
large number of studies in the coastal areas (see for example a review by Kulmala
320
et al (2004)). In general, there are a much larger number of observations from the
northern hemisphere than from the southern hemisphere. Observations were also
made from a variety of platforms ranging from ground based to ships and
aeroplanes. In most of these observations the measurements were made such that
the platform was not moving along with the same air parcel. Therefore
observations of new particle formation may be biased by spatial variations of
constituents in different air parcels (Kulmala et al. 2004).
In remote environments particle formation events are preceded by an increase in
the atmospheric concentration of sulphuric acid, with the increase in the particle
number occurring about 1–2 h after an increase in sulphuric acid was measured
(Weber et al. 1997). This is followed by a relatively small particle growth rate
between 1 and 2nm h-1 (Weber et al. 1996; Marti and Weber 1997; Weber et al.
1997; Birmili and Wiedensohler 2000). These events showed a linear relationship
between the number of newly formed particles and the production rate of
sulphuric acid indicating the importance of sulphuric acid. The question still
remains: Is the binary nucleation solely responsible for the formation of these
particles or is a third species such as ammonia or an organic involved? Birmilli
and Wiedensohler (2000) estimated that the concentration of sulphuric acid
needed to achieve the same nucleation rates through binary nucleation was over
two orders of magnitudes higher than that measured. Napari et al. (2002) using
their observations and parameterisation of the ternary nucleation rate with an
atmospheric ammonia concentration of 20 pptv and the measured sulphuric acid
concentration obtained good agreement with the observed nucleation rates.

321
In forests the sources of new particle formation are different. The mechanisms
responsible for the formation and growth of these particles are still uncertain.
Although sulphuric acid is one of the most likely candidates thought to be
responsible for the formation of the initial nanometer-sized particles (Riipinen et
al. 2007), sulphur chemistry does not sustain enough sulphuric acid in the
atmosphere to explain more than a small fraction of the observed particle-size
growth rate. To explain the observed growth, which is up to a diameter of 50 to
100 nm, other compounds are required. O’Dowd et al (2002) showed that particle
formation can commonly occur from biogenic precursors. A recent study by
Tunved et al. (2006) showed a direct relation between emissions of monoterpenes
and gas-to-particle formation over these regions which were substantially lacking
in anthropogenic aerosol sources. Therefore, secondary organic aerosol formation
from monoterpenes is an important source in these environments. Further, the
authors show that the forest provides an aerosol population of 1-2 x 103 cm-3 of
climatically active particles during the late spring to early fall period, presenting a
substantial source of global importance.
Proposed particle production mechanisms in the marine environment include the
seawater bubble-burst process (O'Dowd et al. 2004), ternary nucleation
producing a reservoir of undetectable particles upon which vapours can
condense (Kulmala et al. 2000), free tropospheric production with mixing down
to the boundary layer (Raes 1995), and the generation of coastal iodine particles
from macroalgal iodocarbon emissions (Raes 1995; Kulmala et al. 2000;
O'Dowd et al. 2004; O'Dowd and Hoffmann 2005). While iodine-containing
particles were found in large numbers at Mace Head research station in Ireland,

322
they are not likely to play an important role globally (McFiggans 2005). Wind-
produced bubble-burst particles containing salt are ubiquitous in the marine
environment (Ayers and Gras 1991), but these represent less than 10% of
particle numbers. The majority of particles are much smaller than these salt
particles and their origins remain only partially explained.
Several conclusions can be derived from this brief review. Firstly, particles are
formed in the environment due to natural processes and therefore are always
present at some background concentration levels. Therefore, when considering
particle concentrations in urban environments it is important to compare them to
the background levels in order to assess the magnitude of the anthropogenic
impacts (see Section 7.6 below). Secondly, the mechanisms of new particle
formation exhibit similar complexities in both types of environments (natural
and vehicle affected), strongly depend on local meteorological factors, and
therefore a complete picture of the dynamics of particle formation in urban
environments must include all factors involved. These issues are further
discussed in Section 7.6 below.

323
7.4. VEHICLE EMISSIONS AS A SOURCE OF ULTRAFINE
PARTICLES
7.4.1. Introduction
As discussed previously, many studies have conclusively shown that motor vehicle
emissions constitute the major source of ultrafine particle pollution in urban
environments (Harrison et al. 1999; Shi and Harrison 1999; Shi et al. 1999; Shi et
al. 2001a; Wahlin et al. 2001). Particles emitted from diesel engines are in the size
range 20-130 nm (Kittelson 1998; Morawska et al. 1998a; Harris and Maricq
2001; Ristovski et al. 2006) and from petrol engines in the range 20-60 nm
(Harris and Maricq 2001; Ristovski et al. 2006). Therefore, it is not surprising that
a large fraction of the particle number concentration in urban air is found in the
UF size range (Morawska et al. 1998b). Overall, it has been shown that in urban
environments the smallest particles make the highest contribution to the total
particle number concentrations, while only a small contribution to particle volume
or mass. A US study by Stanier et al. (2004a) showed that 25% of the aerosol
number is less than 10 nm and 75% of the aerosol number is less than 50 nm.
Similarly Woo et al. (2001b) showed that 26% of particle number is smaller than
10 nm and 89% smaller than 100 nm. Zhang et al. (2004b) showed that the
number concentrations of particles the size ranges of 0.011-0.050 µm and 0.011-
0.1 µm accounted for approximately 71% and 90%, respectively of the total
number concentration. However, particles smaller than 0.050 µm contributed only
3% to the total volume concentration, while the largest contribution of 87% was
from particles larger than 0.1 µm. In Europe Junker et al. (2000) found that the
highest in terms of number were concentrations of particle <0.1 μm, averaging
between 82–87% of the total particle numbers <0.421 μm while the accumulation
324
mode (0.1–2.8 μm) made up for most of the particle mass (mean >82%). Shi et al.
(2001a) showed that particles smaller than 10 nm contributed more than 36-44%
of the total particle number concentration in an urban roadside location and
particles within the size range 3–7nm accounted for 37% of total measured
particles. Charron and Harrison (2003) showed that particles ranging from 11 to
100 nm represent from 71% to 95% (median 88.7%) of the particle number
between 11 and 450 nm. Pirjola et al. (2006) reported that in winter in Helsinki,
Finland, 90–95%, and in summer, 86–90% of particles were smaller than 50 nm,
while Virtanen et al. (2006) estimated for the same data set that particles smaller
than 63 nm made up ~90% of particles in the winter and ~80% of particles in
summer. Peak concentrations often exceeded 2 x 105 cm-3 and sometimes reached
1 x 106 cm-3. In Australia, Mejia et al. (2007a) showed that UF contributed to 82-
90% of the particle number and nanoparticles to around 60-70%, except at a site
mainly influenced by heavy duty diesel vehicles, where the nanoparticle
contribution dropped to 50%.
A large fraction of these ultrafine particles come from heavy-duty diesel vehicles.
Kirchstetter et al. (1999) measured particle emissions from light and heavy duty
vehicles in a roadway tunnel and showed that heavy-duty diesel trucks emitted 24,
37 and 21 times more fine particles, black carbon and sulphate mass per unit fuel
mass burned than light duty vehicles. Heavy-duty vehicles also emitted 15-20
times the number of particles per unit mass of fuel burned compared to light-duty
vehicles. In general, a heavy duty diesel truck or bus exhibits particle number
emission factors that are one to two orders of magnitude larger than a typical
petrol car (Morawska et al. 2005; Ristovski et al. 2005; Ristovski et al. 2006). The

325
only exception was observed by Graskow et al. (1998) who found that when
petrol vehicles were driven at higher velocities (~120 km/h) or with higher
loads, i.e. during acceleration, the particle number emissions from petrol
vehicles came close to that observed from diesel vehicles.
In general, particles from vehicle emissions can be divided into two broad
categories, depending on the location of their formation. They can be formed in
the engine or tailpipe (primary particles) or they can be formed in the
atmosphere after emission from the tailpipe (secondary particles).
7.4.2. Primary Particles
Primary particles are generated directly from the engine and are mostly
submicrometer agglomerates of solid phase carbonaceous material ranging in
size from 30 to 500 nm and residing mainly in the accumulation mode. They
may also contain metallic ash and adsorbed or condensed hydrocarbons and
sulphur compounds. Metallic ash is generally derived from lubricating oil
additives and from engine wear. The size distribution of particles in the
accumulation mode are very well represented by lognormal distributions, with
an almost constant standard deviation of 1.8–1.9 (Harris and Maricq 2001), and
it does not vary significantly between measurements from a given vehicle under
different operating conditions. Repeated measurements from a diesel engine, in
particular, can be very consistent (Kasper 2005; Ristovski et al. 2006). For this
reason, the primary solid particle number limit has been added to the European
Commissions proposed Euro 5/6 emission standards for light-duty vehicles.

326
7.4.3. Secondary Particles
As the hot exhaust gases are expelled from the tailpipe of a vehicle, they cool
and condense to form large numbers of very small particles in the air. They are
volatile and consist mainly of hydrocarbons and hydrated sulphuric acid. These,
so-called secondary particles, are generally in the nanoparticle size range below
30 nm and compose the nucleation mode, which have been commonly observed
near busy freeways, especially carrying a large fraction of heavy duty diesel
vehicles (Harrison et al. 1999; Kittelson et al. 2002; Charron and Harrison 2003;
Sturm et al. 2003; Gramotnev and Ristovski 2004; Zhu et al. 2004; Rosenbohm
et al. 2005; Westerdahl et al. 2005; Ntziachristos et al. 2007). They have also
been observed in on-road studies, such as when a vehicle is being followed by a
mobile laboratory (Vogt et al. 2003; Kittelson et al. 2004; Pirjola et al. 2004;
Gieshaskiel et al. 2005; Kittelson et al. 2006a; Ronkko et al. 2006; Casati et al.
2007). However, while sometimes present, they are not commonly observed in
dynamometer measurements where dilution tunnels are used to cool and dilute
the exhaust gases (Rickeard et al. 1996; Khalek et al. 1999, 2000; Kittelson et
al. 2006a; Ristovski et al. 2006).
It has been shown that the conditions necessary for the production of these
volatile nanoparticles are strongly affected by the dilution conditions such as the
dilution rate, dilution ratio, temperature and residence time (Khalek et al. 1998,
1999; Shi and Harrison 1999; Khalek et al. 2000; Kawai et al. 2004; Mathis et
al. 2004; Kasper 2005). Lyyranen et al (2004) investigated particle number
distributions obtained from a turbo-charged diesel off-road engine using several
different dilution systems and concluded that nucleation modes were observed

327
when the dilution process involved rapid cooling and mixing of the exhaust.
Casati et al. (2007) measured particle emissions from a diesel passenger car in
field and laboratory conditions and concluded that the nucleation mode was
strongly affected by dilution conditions and decreased when the exhaust was
more diluted.
Similarly, on-road dilution of the exhaust plume is very important in the
generation of secondary particles in the exhaust plume. Ronkko et al. (2006)
studied particle size distributions in emissions from an on-road heavy-duty
diesel vehicle and demonstrated that the formation of the nucleation mode 5m
behind the vehicle was favoured by low ambient temperatures and high relative
humidity. For smaller distances no nucleation modes were observed neither by
Ronkko et al (2006) or Morawska et al (2007b) for a diesel vehicle. During on-
road measurements using light duty spark ignition (SI) vehicles, Kittelson et al
(2006b) did not observe a significant particle signature above background under
highway cruise conditions. Much higher number emissions were observed
during acceleration, at high-speed cruise, and during cold starts.
In addition to the dilution and cooling effects, there is another factor that plays
an important role in determining the concentration of secondary particles. The
gaseous precursors condense or adsorb on to the surface of carbon particles in
the accumulation mode. If the concentration of carbon particles is low, the gases
will nucleate homogeneously, giving rise to large concentrations of volatile
nanoparticles. This has been clearly observed with diesel vehicles equipped with
particle filters (Burtscher 2001), where the accumulation mode has been
328
removed by the particle filter leading to large nucleation modes. The presence
of a large accumulation mode will act to suppress the formation of the nuclei
mode because the carbonaceous agglomerates scavenge volatile material
reducing the likelihood of nucleation. Older vehicles with excess soot emissions
are less likely to exhibit nucleation modes. Therefore, the number concentration
of the nucleation mode particles, unlike the accumulation mode particles, is
highly unstable and unpredictable. Further, as in some instances, as many as
90% of the total particle number may occur in the nucleation mode, total
particle number emissions from similar types of motor vehicles may vary by
over an order of magnitude (Ristovski et al. 2004).
7.5. ROLE OF FUELS
Particle emissions from motor vehicles are significantly affected by the nature
of the fuel used and thus a considerable effort is being devoted to investigations
of fuel properties and their impacts on particle emissions.
Sulphur in Diesel Fuel: The main source of chemically-bound sulphur in diesel
fuel is that which occurs naturally in crude oil and is in a volatility range which
leads to its incorporation in the diesel fuel fraction. The presence of sulphur is
useful as it increases the lubricating properties of the fuel. During combustion, a
fraction of this sulphur is oxidised to sulphur trioxide which binds with water to
form sulphuric acid that contributes to total particle emissions. However, the
presence of sulphur in diesel has several other adverse effects such as the
corrosion of the exhaust system and increased wear and tear on engine parts. For
these reasons, measures have been taken to progressively reduce the sulphur

329
content in diesel fuel worldwide. Currently, most industrialised countries use
diesel fuel with a sulphur level of 5 to 50 ppm. In addition, it should be noted
that sulphur compounds are also present in lubricating oils.
Several studies were conducted to investigate the effect of reducing the sulphur
content in diesel on particle number emissions. Bagley et al. (1996) found a
significant reduction of the number of nuclei-mode particles from a heavy duty
engine when the sulphur levels were reduced from 3200ppm to 100ppm.
Andersson et al. (2001) investigated three heavy duty vehicles using diesel fuel
of three sulphur levels: 340 ppm, 53 ppm, and less than 10 ppm, and showed
that, while changes in accumulation mode particles could be attributed to
changes in engine technology, the variation in nanoparticle number was more
likely influenced by fuel properties. The fuel containing the highest sulphur
content (340 ppm) showed the highest nanoparticle emissions for the ‘weighted
cycle’ (where each stage of the cycle was weighted according to the time it
contributed to the overall cycle), while the fuel with the lowest sulphur content
(<10ppm) shared the lowest. They also concluded that the influence of the fuel
sulphur content could not be fully decoupled from other chemical and physical
effects within the tested fuels, such as the total aromatic content which varied
between the fuels.
Ristovski et al. (2006) reported particle emissions from a fleet of twelve in-
service buses fuelled by 50 and 500 ppm sulphur diesel at four driving modes
on a chassis dynamometer and showed that particle number emission rates were
330
30-60% higher with the 500 ppm over the 50 ppm fuel. Most of the excess
particles were smaller than 50 nm and resided in the nucleation mode.
Kittelson et al. (2002) measured nanoparticle emissions from a diesel engine on
a dynamometer using fuels with three different levels of sulphur (1, 49 and 325
ppm) and two different lubricating oils (4000 ppm and 385 ppm sulphur). They
observed that for conventional lubricating oil (385 ppm) and both 1 ppm and 49
ppm sulphur fuel, there was no significant formation of a nucleation mode.
Increasing fuel sulphur to 325 ppm increased nanoparticle emissions, especially
at high engine load. Sulphate particles are formed at high temperature
conditions, such as at full engine load when more of the fuel sulphur is
converted to sulphuric acid. When present, most of the nucleation mode
particles were removed when passed through a thermodenuder, suggesting that
they were highly volatile. Other researchers have observed nucleation mode
particles even with very low sulphur levels (<10ppm) (Vaaraslahti et al. 2004)
suggesting that other components, such as unburned hydrocarbons, can have an
important role. At the low levels of sulphur in the fuel the amount of sulphur in
the lubricating oil can have a major influence. The most surprising result was
the large influence of specially formulated lubricating oil (Kittelson et al. 2002).
Contrary to expectations, low sulphur oil led to an increase in nanoparticle
formation in nearly all cases. It is possible that the increase in nanoparticle
formation when using low sulphur oil was related to the formulation of the oil
necessary to compensate for the removal of sulphur. It could also be due, in
part, to the release of volatile components from the oil, related to the lack of oil
break-in. Lubricating oil, unburned hydrocarbons from the fuel, as well as
331
PAH’s, could also play critical role in the formation of the nucleation mode
(Kittelson et al. 2002; Sakurai et al. 2003; Vaaraslahti et al. 2005; Ristovski et
al. 2006). On the other hand, Vaaraslahti et al (2005) have observed clear
correlation between the lubricating oil sulphur content and nanoparticle
formation only when the engine was equipped with a continuously regenerating
diesel particulate filter (CRDPF).
Alternative Fuels: Liquefied petroleum gas (LPG) is generally perceived to be a
cleaner fuel than unleaded petrol (Gamas et al. 1999). Ristovski et al. (2005)
found that particle number emissions from LPG cars were up to 70% less than
from similar unleaded petrol cars. Compressed natural gas (CNG) vehicles are
known to emit considerably lower particle mass than equivalent diesel vehicles.
However, there is considerable disagreement as to particle number emission
levels. This is due to the small number of measurements reported and the
difficulties in quantifying the effects of engine operating and testing conditions
and fuel and lubricating oil composition on secondary particle production. In
relation to buses, it has been shown that, in general, particle number emissions
from CNG buses are smaller than from diesel buses, but there are some
exceptions, particularly related to high engine load conditions where large
nuclei modes (<10 nm) and ultrafine particle number concentrations have been
observed (Holmen and Ayala 2002). In addition, the nuclei mode particles
observed at high loads are highly volatile (Meyer et al. 2006).

332
7.6. ROLE OF AFTER-TREATMENT DEVICES
There are two main particulate matter control technologies in use today. They
are oxidation catalysts and particle traps.
Oxidation Catalysts: While oxidation catalysts reduce the soluble organic
fraction (SOF), they have little effect on the soot or black carbon in the exhaust.
Still, some reduction in particle mass emissions is achieved through the removal
of the SOF. The maximum total particle mass reduction is dependent on the
magnitude of the SOF compared to the carbonaceous portion in the engine-out
exhaust, and is usually between 20% and 30% (Harayama 1992). The sulphate
fraction of diesel particles (SO4) is increased in the diesel oxidation catalyst, due
to the oxidation of SO2 with subsequent formation of sulphuric acid. Under
certain conditions, however, the SOF decrease can be more than off-set by an
increase of sulphate particle mass, leading to an overall increase in total particle
mass emission. In general, the effect of oxidation catalysts on particle number
emissions is often unpredictable. Total particle number concentrations,
especially in diesel emissions, are attributed primarily to nucleation mode
particles which are composed mostly of hydrocarbon and sulphuric acid
condensates. If the catalyst removes hydrocarbons (gas phase and SOF), it will
prevent their subsequent nucleation, thus reducing the particle number
concentrations. If, however, the catalyst produces sulphates, an effect more
prominent with high sulphur fuels, and more active noble metal catalysts, the
observed particle number concentrations may be higher than with no catalyst
due to sulphuric acid nucleation (Vogt et al. 2003).
333
Particle Traps: Particle traps are very effective in controlling the solid fraction
of exhaust particles, including elemental carbon (soot) and the related black
smoke emissions. The filtration efficiencies of some commercially available
diesel particle traps frequently exceed 90%. In light duty vehicles, Mohr et al
(2006) showed a high efficiency of diesel particle filters (DPFs) in curtailing
nonvolatile particle emissions over the entire size range. High emissions were
observed only during short periods of DPF regeneration and immediately
afterwards. However, they have limited effectiveness in controlling the non-
solid fractions of particle mass, such as the SOF or sulphate particles that occur
mainly in the liquid phase within the hot and humid emissions. For this reason,
trap systems designed to control the total particle mass emission are likely to
incorporate additional functional components targeting the SOF emission (e.g.,
oxidation catalysts). More recently, the introduction of ultra low sulphur diesel
has helped to improve the efficiency of abatement devices, many of which are
poisoned by sulphur. Emissions from diesel fuels containing sulphur levels of
less than about 12 ppm will not poison these devices. Very often, volatile
material pass through particle traps and nucleate to form nanoparticles that
increase the total particle number. To make matters worse, by retaining carbon
particles, the trap removes the material, which otherwise acts as a “sponge” for
condensates formed in the sampling system. Therefore there is a possibility that
in some cases particle traps can increase the formation of nanoparticles through
nucleation. In effect, particle traps reduce the numbers of solid agglomeration
mode particles by replacing them with liquid nucleation mode nanoparticles
(Burtscher 2001).
334
Vaaraslahti et al (2004) have observed that in heavy duty vehicles at high
loads nucleation mode particles form only when the engine is equipped with a
continuously regenerating diesel particulate filter (CRDPF). The tests were
conducted with two fuels of 2 and 40 ppm sulphur content and the nucleation
mode correlated with the sulphur level in the diesel fuel. In a later publication,
Vaaraslahti et al (2006) show that the formation of nucleation modes in heavy
duty engines with CRDPF is positively correlated not only with the fuel
sulphur level but also with the lubricant sulphur level, suggesting that
sulphuric compounds are the main nucleating species in this situation.
Formation of nucleation mode particles was also observed on a heavy duty
vehicle equipped with a continuously regenerating trap (CRT) during on-road
highway cruise conditions (Kittelson et al 2006). The CRT has reduced the
concentrations of accumulation mode particles to levels indistinguishable
from background while increasing the emissions of particles in the nucleation
mode. Similar to the observation by Vaaraslahti et al the increased emissions
of nanoparticles was observed at higher engine loads when the exhaust
temperature increased above about 300 °C therefore increasing the conversion
of SO2 emitted by the engine to SO3.
However, the toxicity of these particles has recently been brought into question.
Grose et al (2006) showed that nucleation mode particles emitted by a heavy
duty diesel engine equipped with a catalytic trap are composed mainly of
sulphates. This provides support for the argument that particulate emissions
from diesel vehicles equipped with advanced particulate control devices might
be less toxic than typical uncontrolled diesel emissions, which contain high

335
concentrations of organic compounds. However, due to the complexity of diesel
exhaust and the fact that sulphuric acid enhances polymerisation of organic
compounds, as well as solubilises metals, further toxicology studies are required
to evaluate the toxicity of these particles.
7.7. ROLE OF IONS
The mechanisms behind particle nucleation in the atmosphere have been
discussed in section 7.3 above, and in particular the role of binary homogeneous
nucleation of sulphuric acid and water or ternary homogeneous nucleation
involving sulphuric acid, water and ammonia. Theoretical models and
experimental observations show that binary homogeneous nucleation alone
cannot explain the observed formation and growth rates of particles in the
environment and, while ternary nucleation can explain observed nucleation rates
in urban areas, it does not assist in explaining the rates observed in other
environments that do not contain sufficiently high concentrations of sulphuric
acid (Weber et al. 1996; Clarke et al. 1998; Yu 2001; Kulmala 2003; Alam et al.
2003). However, neither mechanism is capable of explaining the observed
growth rates of ultrafine particles to cloud condensation nuclei (CCN) sizes. For
example, Weber et al. (1997) demonstrated that growth rates of nanoparticles
driven by binary and ternary nucleation is an order of magnitude too low to
explain the rapid appearance of fresh ultrafine aerosols during midday. Alam et
al (2003), while noting similar observations at urban sites showed that particle
formation by homogeneous nucleation occurred on approximately 5% of the
days studied and required condensable materials apart from sulphuric acid and
water, together with a relatively low pre-existing particle surface area.

336
An alternative mechanism of particle formation is ion-induced nucleation. It has
been shown that ion-induced nucleation occurs at a lower saturation ratio than
homogeneous nucleation (Hara et al. 1997, 1998). Homogeneous nucleation can
only occur spontaneously in highly supersaturated air. These conditions do not
occur naturally in the atmosphere. However, homogeneous nucleation is aided
by ions as gas molecules tend to condense and cluster around them. Yu and
Turco (2000; 2001) showed that charged molecular clusters can grow
significantly faster than neutral clusters and achieve stable observable sizes.
Thus, this mechanism can operate under conditions that are unfavourable for
binary or ternary nucleation. However, in a recent paper based on results from a
study conducted in Hyytiala, Southern Finland, Kulmala (2007) has argued that
ion-induced nucleation cannot explain the large number of neutral clusters that
were observed, suggesting that ternary, and not ion-induced, nucleation was
probably the dominant process taking place in this Boreal forest environment.
On the other hand, Yu and Turco (2008) used a global chemical transport model
to show that ion-induced nucleation was an important global source of
tropospheric aerosols. From these studies, it is clear that the relative importance
of ion-induced nucleation and neutral nucleation under varying atmospheric
conditions remains largely unresolved.
Environmental ions are formed naturally by cosmic rays at a rate of about 2 ion
pairs cm-3 s-1, while the main anthropogenic source of ions is combustion. The
ion concentration falls off rapidly with distance from the source due to
recombination. Ions generated from hydrocarbon flames play an important role

337
in the formation of nanoparticles (Yu 2001). Positively charged ions have been
detected in concentrations of up to 1.6 x 108 cm-3 in jet engine plumes (Arnold
et al. 2000) and these might play a key role in the formation of volatile particles
in the aircraft wake (Yu and Turco 1997). Also motor vehicle combustion is a
significant source of ions that may play an important role in the formation of
nanoparticles via ion-induced nucleation during the dilution and cooling of the
hot emissions in air, especially in urban environments. Kittelson et al. (1986)
monitored electric charges present on diesel emission particles and they showed
approximately equal numbers of positively and negatively charged particles
with 1-5 units of elementary charge per particle. The charge distribution with
respect to size followed a Boltzmann equilibrium relationship equivalent to
1500K.
Yu et al. (2004) measured the ionic emissions from a petrol car and a diesel
generator engine. They found that the total ion concentrations from the two
engines were about 3.3 x 106 cm-3 and greater than 2.7 x 108 cm-3, respectively.
Maricq (2006) studied the electric charge of particles in petrol and diesel vehicle
exhaust using single and tandem differential mobility analysis. This method
provided the means to sort the particles according to both their size and charge.
About 60-80% of the particles were charged but with nearly equal numbers of
positive and negative charge, leaving the exhaust electrically neutral. Charge
increased with particle size, up to about ±4 units of charge per particle. At a
fixed particle size, charge per particle followed a Boltzmann distribution with
temperature range 800-1100 K. Jung and Kittelson (2005) used an electrostatic
filter and an SMPS to examine the charged fraction of diesel particles as a

338
function of their size. They showed that the diesel nanoparticles carried very
little charge, while there was a large charged fraction of 60-80%, in the
accumulation mode. In summary, these results show that vehicles emit ions of
both signs, with the majority of the charges being carried on the larger particles.
7.8. ROAD-TYRE INTERFACE
So far, tyre wear on the road has been considered to contribute mainly larger
size particles (>10 µm) in the air (Pierson and Brachaczek 1974). A recent
study by Dahl et al. (2006) showed, however, that road–tire interface can also be
a source of sub-micrometer particles. The study conducted in a road simulator
showed that the mean particle number diameters were between 15–50 nm. The
emission factor increased with increasing vehicle speed, and varied between
3.7×10¹¹ and 3.2×10¹² particles vehicle−1 km−1 at speeds of 50 and 70 km h−1,
which corresponds to between 0.1–1% of tail-pipe emissions in real-world
emission studies. The authors hypothesised that the particles may originate
from three components of the tires: (i) the carbon black reinforcing filler, (ii)
small inclusions of excess ZnO or ZnS (ZnO is an activator for organic
accelerators that are used to speed up the vulcanization process), (iii) the oils
used as softening fillers. The authors suggested that since speed determines the
amount of mechanical stress in the tire material it also determines the
temperature in the tire, and increased temperature in turn leads to increased
emissions of loosely bound reinforcing filler material and evaporation of semi-
volatile softening oils. Clearly more research is needed on this topic.

339
7.9. EMISSION FACTORS AND EMISSION INVENTORIES
Emission Factors: An emission factor is the amount of pollutant emitted either
when an activity is performed, for example, a vehicle drives a kilometre; or the
amount of pollutant emitted per unit of fuel burned. Emission factor values are
used for developing inventories for gaseous or particulate motor vehicle
emissions, however in order to derive them many issues need to be considered
and resolved. In particular, they depend on motor vehicle type, fuel used,
engine load, after-treatment devices fitted, road type, travel speed, road grade
and local meteorological conditions. Current methods for deriving emission
factor values range from measurement of single vehicles, to vehicle fleets using
direct methods, such as measurements on a dynamometer, on or near roadways
or in tunnels, or indirect methods such as estimates based on remote sensing or
fuel consumption, particularly in relation to UF particles. In addition, a wide
range of different instrumentation are used that measure different size ranges (as
discussed in section 7.2). As a result, there are a lot of different values of
emission factors published, on different types of measurements, in different
parts of the world. This leads to the question as to which values should be used
in quantifying and modelling traffic emissions.
Statistical analysis of particle number emission factors around the world: A
detailed analysis by Keogh et al. (2007) that included statistical analysis of more
than 160 particle number emission factors relating to motor vehicle tailpipe
emissions revealed that emission factor values estimated from CPC
measurements produced the highest mean values for Fleet, Heavy Duty Vehicle
(HDV) and Light Duty Vehicles (LDV) of 7.26, 65 and 3.63 x 10¹⁴ particles per
340
vehicle per kilometre respectively. The mean Diesel Bus emission factor value
relating to measurements using the SMPS was found to be 3.08 x 10¹⁴ particles
per vehicle per kilometre.
The review found that there is a significant difference between the means for
measured particle number for CPC and SMPS instrumentation (23 and 2 x 10¹⁴
particles per vehicle per kilometre respectively); but no significant difference
between the means of particle number emission factors for studies conducted in
different countries (Australia, Austria, Germany, Sweden, Switzerland, United
Kingdom, USA), nor between those for studies conducted on a dynamometer, or
near roadways. Particle number emission factors for HDV were found to be
significantly higher than the corresponding values from Fleet and LDV.
The range of particle number emission factors reported in four studies, that
measured nanoparticle and ultrafine subclasses using the SMPS and DMPS
(Gidhagen et al. 2003; Imhof et al. 2005a; Imhof et al. 2005b; Jones and
Harrison 2006), are summarised in Table 7.1 below, where the range given
represents the sum of the ranges taken from the four studies. Examination of this
table highlights the importance of measuring size ranges < 18nm, where particle
numbers tend to be more prolific, and in which the emission factor values are
generally larger than those estimated for 18-50nm and 18-100nm.

341
Table 7.1. The range of particle number emission factors reported for nano and ultrafine size ranges
Particle size classification
Size range measured, nm
Fleet 1014 particles
per vehicle per km
Heavy Duty Vehicles
1014 particles per vehicle per km
Light Duty Vehicles
1014 particles per vehicle per km
Nanoparticles
< 10
--
14.5
0.63-4.14
10-30 -- 2.14-37.8 0.067-4.87
18-50 0.59-1.31 1.55-8.2 0.13-0.56
Ultrafine 18-100 0.84-1.55 1.7-10.5 0.37-0.81
30-100 -- 3.19 0.284
Inventories of motor vehicle particle emissions: Estimates of emission
inventories for particle number concentration are not available (Jones and
Harrison 2006); nor does there exist a comprehensive inventory of vehicle
particle emissions covering the full size range emitted by motor vehicles. The
one reported inventory is the assessment conducted by Airborne Particles Expert
Group (1999). For this assessment emission trends for the years 1970 to 1996
including inventories for PM2.5, PM1 and PM0.1 were estimated based on PM10
UK monitoring data, using mass fractions in this size range available for
different emission sources and fuel types and 33 particle number size
distribution spectra. It was shown that in all size fractions, vehicle emissions are
the major contributor, compared with all other combustion and non-combustion
sources in urban areas. With decreasing particle size, the contribution of road
transport to the total emissions increases and for PM0.1 reaches 60%.
Contributions from other combustion sources tend to decrease with decreasing
particle size. One of the conclusions from the data presented in the report is that

342
there was a significant decrease in emissions in the PM10 and PM2.5 ranges
during the investigated period of time, less in the PM1 range and very little in
the PM0.1 range. This could be related to the lack of strategies for decreasing
emissions of the UF particles. More effort is needed towards compilation of
vehicle emission inventories for UF particles.
7.10. TRANSPORT OF PARTICLES WITHIN URBAN SCALE AND
AMBIENT PROCESSING
Vehicle emissions are highly dynamic and consist of reactive mixtures of hot
gases and particles. The main factor determining the speed and direction of the
pollutant plume away from the emission site is generally the prevalent wind.
Other contributing factors include the initial speed of the pollutants emitted
from vehicles, turbulence caused by vehicle motion, location of the exhaust,
precipitation and the topography of the area. The pollutant plume undergoes
dilution with ambient air and is subject to a range of physical and chemical
processes, which change its chemical composition, physical characteristics and
concentration in the air during the transport process. Also, soon after emission,
when the pollutant plume is still concentrated, is the most likely period for
secondary particle formation by nucleation involving precursors present in the
emission plume, as discussed in section 7.4. Therefore particles measured away
from the emission site, and some time after emission, have different
characteristics to those measured immediately after formation.
343
7.10.1. Role of meteorological factors on particle concentration
The most important factors to consider include wind speed, precipitation,
relative humidity and temperature.
Wind speed. Wind speed affects dispersion and dilution and thus atmospheric
mixing, but also resuspention of particles. Several studies shown that UF
particle concentration decreases, while concentrations of larger particles
displays a “U shape” relationship with wind speed (Harrison et al. 2001;
Ruuskanen et al. 2001; Molnar et al. 2002; Charron and Harrison 2003).
Hussein et al. (2005a) showed that UF particle number concentrations are best
represented by a decreasing exponential function, with the minimum observed
during wind speeds >5ms−1, as a result of a higher coagulation rate, better air
mixing, and more particle losses due to deposition and scavenging at these wind
speeds. Particles larger than 100 nm showed a “U-shape” relationship, best
represented by a second-order polynomial, with the minimum during wind
speeds between 5–10 m s−1. Similar results were found by Charron and Harrison
(2003) as to the trends for particles ranging from 30 to 100 nm and from 100 to
450 nm, as well as a twofold decrease from the weaker to the stronger winds. A
decrease of about 10,000 normalised counts per cm3 was seen for particles in the
range from 30 to 100 nm and modal shift toward smaller values with increasing
wind speed. However, no obvious relationship with the wind speed was seen for
the particles ranging from 11 to 30 nm, and thus no dilution effect was evident
for this particle range, which could be explained as characteristic of new particle
formation. A study by Hussein et al. (2005a) showed another trend, namely that
at some sites, particle number concentrations displayed a linear decrease with

344
wind speed. This was explained by higher summer temperatures, which are
accompanied by a high boundary layer and thus mixing of aerosol particles
within a bigger volume. Under such conditions, the relative changes of particle
concentration with wind speed are smaller compared to a shallow boundary
layer and thus smaller volume of air mixing.
Precipitation. In general, precipitation has been shown to have a washout effect,
which means removing particles from the atmosphere e.g. (Garcia-Nieto et al.
1994; Morawska et al. 2004) (Jamriska et al. 2007). However, a study by
Charron and Harrison (2003) showed an opposite effect in relation to particles
below 150 nm, namely an increase of particle numbers during rain, with larger
rain drops (more than 0.4 mm) leading to higher particle numbers than smaller
ones (0.2 mm). In addition, the highest particle numbers were measured just
after a rain event (1 h after). The possible explanation for this phenomenon is an
effect of reduced temperatures during precipitation events and thus higher
saturation ratio of semi volatile species combined with low pre-existing surface
area of particles, both favouring new particle formation, and thus a significant
increase of particle number concentration.
Relative humidity and temperature. These two parameters commonly display
diurnal anti-correlation, with the increased temperature during the day
accompanied by a decreased relative humidity. In general, both temperature and
relative humidity play a role in UF particle number concentration (Charron and
Harrison, 2003; Ruuskanen et al. 2001; Jamriska et al. 2007). Kim et al. (2002)
showed that during the warmer months, there was some increase in particles
345
smaller than 100 nm, in the afternoon, linked to an increase in temperature.
Charron and Harrison (2003) showed that particles in the size range 11-30 nm in
a roadside environment peaked during the early morning showing an inverse
association with air temperature. Olivares et al (2007) found a distinctive
dependence of particle number concentration with ambient temperature in a
street canyon in Sweden. They found that the total particle number more than
doubled when the temperature decreased from 15°C to -15°C. The variation was
most pronounced for particles smaller than 40 nm. Modelling results predicted
that the changes in the particle sizes observed were consistent with the
condensation of volatile compounds onto pre-existing aerosols. They also
showed that nucleation mode particles were largely influenced by relative
humidity with high concentrations during high humidity periods. Hussein et al.
(2005a) found that the high number concentration of particles larger than
100 nm during the higher summer temperatures was partly due to the growth of
aerosol particles in the presence of condensable vapours emitted from the
surrounding boreal forest in southern Finland. In general, higher atmospheric
water content is expected to favour homogeneous binary nucleation of sulphuric
acid and water (Easter and Peters 1994), while ternary nucleation involving
ammonia (Korhonen et al. 1999), similarly to nucleation from organic
compounds, is expected to be independent of relative humidity Therefore, in the
study by Charron and Harrison (2003) for example, the lack of a dependence on
the relative humidity during the daytime was considered indicative that the
binary nucleation from sulphuric acid and water was not a major factor in
particle production.

346
Temperature inversion. Under such conditions, there is little vertical mixing,
wind speeds are lower and thus pollution concentration in general is expected to
increase. For example, Janhall et al. (2006) showed that morning temperature
inversion in Göteborg, Sweden, resulted in significantly elevated concentrations
of traffic-related pollutants, including UF particles. Mean particle number
concentrations on the days with and without morning inversions were 6500 ±
4800 and 2800 ± 1900 particles cm−3, respectively. However, there was no
impact of inversion on PM10 concentrations.
7.10.2. Relative role of various processes
The processes that dominate particle dynamics shortly after emissions by
vehicles (i.e. when the concentration of the emission plume, while decreasing
due to dilution and mixing, is still high) include: condensation/evaporation,
coagulation and new particle formation. Several studies investigated the relative
importance of these processes under various meteorological and pollution
concentration conditions. During the dilution, when the initially hot mixture of
pollutants is cooled down, the saturation ratio of gaseous compounds of low
volatility reaches a maximum. This is when two of the above processes are
possible: new particles formation by nucleation of vapours, and vapour
condensation onto existing particles. The availability of pre-existing particle
surface area for the condensation of the semi-volatile vapours along with the
dilution rate, since it governs the cooling rate, will determine which of the two
processes dominates. Small aerosol concentrations favour new particles
formation and their growth to larger sizes (Kulmala et al. 2000), while high
concentrations promote the condensation of the vapours on the existing particles

347
and disfavour new particle formation (Kerminen et al. 2001). This is the reason
why cleaner air resulting from stronger winds and rain, as discussed above,
favour the occurrence of high numbers of UF particles. For example, Charron
and Harrison (2003) showed that large amounts of semi-volatile vapours from
vehicle exhausts in the early morning, associated with low pre-existing particle
surface area at that time (from about 300 to 500 μm2/cm3) favour production of
new particles and their growth to detectable sizes (>11 nm). However, during
daytime, when the particle surface area ranges from 800 to 1100 μm2/cm3,
condensation of the condensable gases onto existing particles is likely to
dominate. In comparison to the processes discussed above, coagulation appears
to be overall a less important process, due to short time available for it to be
effective before the high initial concentrations at the road are diluted. Analysis
conducted by Shi et al (1999) to estimate the expected effect of coagulation on
the decrease of particle number concentration showed that the concentrations
between the road and a site 100m away from the road would decrease by less
than 11% due to coagulation, compared to a 72% decrease in measured
concentrations, implying that dilution with background air is the main
mechanism for the rapid decrease in particle number concentration. However,
Zhu et al. (2002a) concluded that both atmospheric dilution and coagulation
play important roles in the rapid decrease of particle number concentration and
the change in particle size distribution with distance away from a freeway. The
study by Zhu et al. (2002b) suggested that coagulation is more important than
atmospheric dilution for ultrafine particles and the reverse is true for large
particles. This contradicts some earlier studies which concluded that the rapid
dilution of the exhaust plume made coagulation insignificant (Vignati et al.

348
1999; Shi et al. 2001a), with the possible reason for this being that the earlier
studies assumed a much lower particle number concentration for particles
smaller than 15 nm, while this study accurately measured freshly emitted
particles down to 6 nm.
Zhang and Wexler (2004a) identified two distinct dilution stages after emission.
The first stage, termed tailpipe-to-road, was induced by traffic-generated
turbulence and occurred soon after emission, lasting about 1-3 s, when the
dilution ratio reached up to 1000. The second stage was mainly dependent on
atmospheric turbulence and lasted 3-10 min, with an additional dilution ratio of
about 10. In the first stage, aerosol dynamic processes such as nucleation,
condensation and coagulation played major roles. In the second stage,
condensation was the dominant mechanism in altering the aerosol size
distribution, with coagulation and deposition playing minor roles. Exhaust
plumes emitted by different types of engines maintained their characteristics in
the first stage but generally mixed with each other in the second stage. A similar
conclusion was reached by Pohjola et al. (2003) based on the application of a
aerosol process model MONO32. The effect of coagulation was substantial
only if the dilution of the exhaust plume was neglected, which is not realistic
under most conditions (unless during temperature inversions or a very stable
atmosphere). Condensation of an insoluble organic vapor was shown to be
important if its concentration exceeds a threshold value of 1010 or 1011 cm-3 for
the Aitken (~50nm) and accumulation (>100nm) mode particles, respectively.
The importance of condensation or evaporation of water was shown to be
strongly dependent on the hygroscopicity of particles. The modeling showed

349
that after a time of 25s, most of the particulate matter transformation processes
have already taken place.
It has been suggested that sulphuric acid induced nucleation was the dominant
secondary particle production mechanism in the first stage, followed by the
condensation of organic compounds (Kittelson 1998; Maricq et al. 2002; Zhang
and Wexler 2004a). Schneider et al. (2005) showed that nucleation was mainly
due to sulphuric acid and water and low volatile organic species condensed only
on pre-existing sulphuric acid/water clusters. However, other studies have
suggested that the volatile component of total diesel emission particles was
comprised mainly of unburned lubricating oil (Tobias et al. 2001; Sakurai et al.
2003). Recently, Meyer and Ristovski (2007) have shown that ternary nucleation
involving ammonia as the third species, is the main nucleating mechanism,
followed by the condensation of volatile organic components. Zhang and Wexler
(2004a) showed that the first stage of dilution was crucial for the activation of
nuclei mode particles due to the high concentration of condensable material
during this time.
A deeper insight into the role of the key process was provided by Zhang and
Wexler (2004b) whose modelling showed that for particles larger than 0.05 μm,
coagulation is too slow to influence number distributions and condensation is
the leading process. However, for particles smaller than this, under typical urban
conditions, condensation and evaporation, coagulation, nucleation and
emissions interact with each other and the Kelvin effect must be considered in
modelling. Gravitational settling was shown to significantly affect particle dry

350
deposition, but negligible for vertical turbulent transport; chemical reactions are
negligible. It was noted that the relative importance of different mechanisms
remains about the same during the day and night time. During the night time,
with photochemistry cut off and significantly decreased emissions,
concentrations of both volatile or condensable gases and particles is lower
leading to the increased time scales for the process, but thus maintaining their
relative importance.
In addition to particle growth and dilution, Jacobson et al (2005) showed that
that small (< 15 nm) liquid nanoparticles emit semi volatile organics (< C-24)
almost immediately upon emission and that the shrinking of these particles
enhances their rates of coagulation by over an order of magnitude. Enhanced
coagulation in isolated emission plumes may also affect evolution of particle
size distribution. Importantly, they concluded that neither condensation,
complete evaporation, coagulation alone, nor preferential small-particle dilution
appears to explain the evolution of particle sizes in the vicinity of busy roads.

351
7.11. PARTICLE SIZE DISTRIBUTIONS AND MODAL LOCATION
IN URBAN ENVIRONMENTS
Particle number size distributions in vehicle emissions often show a
characteristic bimodal distribution (Kittelson 1998; Kwon et al. 2003; Vogt et
al. 2003; Ristovski et al. 2006). Most of the particulate mass is generally found
in the accumulation mode (> 50nm) while a considerable number fraction of the
particles may occur in the nucleation mode (< 30nm). Bimodal size distributions
have also been observed near busy roads (Pirjola et al. 2006). Distinct ultrafine
modes in the particle number distributions have been found in the size range 10-
20 nm on the downwind side but not on the upwind side of busy freeways (Zhu
et al. 2002a; Rosenbohm et al. 2005).
A recent literature review of modal locations identified in ambient particle size
distributions in a range of worldwide environments (34 studies) found that for
particle number modal location values spanned 0.006 to 30 µm, with
approximately 98% of these values being ≤ 1 µm (Morawska et al. 2007a).
Anthropogenic-influenced environments included those in suburban
environments in Australia and Finland (Morawska et al. 1999c; Hussein et al.
2005b), urban in Australia, Finland, Germany, Hungary, India and the USA
(Morawska et al. 1999c; Salma et al. 2002; Wehner et al. 2002; Wiedensohler et
al. 2002; Fine et al. 2004; Hussein et al. 2004; Hussein et al. 2005b; Monkkonen
et al. 2005); and traffic-influenced environments in Australia, Finland and
Germany and the US (Morawska et al. 1999c; Zhu et al. 2002a; Zhu et al.

352
2002b; Pirjola et al. 2004; Zhu et al. 2004; Rosenbohm et al. 2005; Zhu et al.
2006).
When considering modes identified in these studies in the ≤ 50nm size range it
was found that in anthropogenic-influenced environments they ranged from 8.2-
50nm for suburban and urban, and included modes at 7,10, 13, 15, 16, 19, 20,
27 and 30nm in traffic influenced, likely reflecting the influence of motor
vehicle emissions. Modes identified in the > 50 ≤ 100nm size range in the
anthropogenic-influenced environments were in the range 50.2-65nm in
suburban, traffic and urban; and at around 80nm in urban and traffic. Additional
modes were found in suburban in the range 92-100nm.
7.12. CHEMICAL COMPOSITION OF ULTRAFINE PARTICLES IN DIFFERENT ENVIRONMENTS
There have been relatively few studies reported, which investigated any aspects
of chemical composition of UF particles in ambient air. Moreover, each study
was conducted in a different way, sampled particles in a different size range,
and focused on different aspects of particle chemical composition. Therefore, at
present a comprehensive knowledge on UF particle composition in different
environments is not available. This review summarises the results of the few
studies reporting UF particle chemical composition.
As discussed earlier, engine emissions include SO2 or SO3 and NO (later
converted to NO2). Transformations in the air of SO2, NO2 and NH3 from
vehicle emissions into SO42−, NO3
−, and NH4+ is important for increasing

353
secondary aerosol formation near traffic sites. Three studies investigated these
aspects of UF particle chemistry in urban environments. (Kuhn et al. 2005)
investigated particle chemical composition in a park 5 km downwind of
downtown Pittsburgh. The study showed that UF mass was about 0.6 μg m−3
and its summer composition was 45% organic matter and 40% salts of
ammonium and sulphate, compared to 55% organic matter and 35% of the sum
of ammonium and sulphate during winter. This shift was explained as being
likely due to higher summertime levels of photochemical activity for oxidation
of SO2, and increased wood burning and vehicular organic contributions in
wintertime. UF chemical composition was also studied by Sardar et al. (2005)
and showed a significant seasonal change from summer to winter. Lin et al.
(2007) investigated water-soluble ions in nano (PM0.01–0.056) and ultrafine
(PM0.01–0.1) size ranges in samples collected near a busy road and at a rural site.
Several conclusions were derived from this study. It was shown that the
primary, secondary and tertiary peaks of SO42− and NH4
+ were in the fine (0.56–
1.0 μm), coarse (3.2–5.6 μm), and nano (0.032–0.056 μm) size ranges,
respectively. The second and third peaks of NO3− were in the same sizes ranges
as those for SO42− and NH4
+; however, the primary peak for NO3− was in the
size range of 1–1.8 μm and slightly larger than that of SO42− and NH4
+. Nano
(PM0.01-0.056) and coarse (PM2.5-10) particles exhibited the highest (16.3%) and
lowest (8.37%) ratio of nitrate mass to total particle mass, respectively. The
mass ratio of NO3− was higher than that of SO4
2− (contrary to the trend
commonly observed for urban atmospheric particles) and also more variation
existed in NO3− concentrations for different size range particles at the roadside
site than at the rural site. For both sites, NO3− concentrations in nano and UF

354
particles were about two times higher than that for coarse particles and the nano
NO3− concentration at the roadside site was 1.34 times that at the rural site. The
peak of NO3− in the ultra-fine size range in this study was attributed mainly to
vehicle engines, while the peaks of SO42− and NH4
+ in the nano size range to
(NH4)2SO4 aerosols formed via the interaction of NH4+ and SO4
2−. At the two
sites, no significant difference in NH4+ concentration was found in each of the
different size ranges investigated. However, at the rural site, NH4+ was highly
correlated with SO42− in each of the three particle size ranges - nano, ultrafine,
and coarse, with R values of 0.89, 0.60, and 0.86, respectively.
Somewhat different aspects of UF particle chemistry were studies by Woo et al.
(2001a) who investigated evaluation of outdoor and indoor particle volatility
near a freeway by heating particles and detecting changes in their diameters and
number concentrations. The study showed that aerosol volatility decreases with
increasing distance from the source (in this case the differences between
outdoor and indoor particles). Monodisperse distribution was observed for 18
and 27 nm particles with the mode diameter decreasing with increasing heater
temperature (thus suggesting that all of these particles are composed mostly of
volatile material), and also broadening because not all particles shrink to the
same degree due to differences in their chemical composition. Bi-modal
distributions were observed for outdoor 45 and 90 nm particles heated to 1100C.
In particular the 90 nm mode split into two at heater temperatures of 900C, with
one mode remaining close to the monodisperse mode of the unheated aerosol,
while the other shifting to a lower diameter. This bi-modal distribution indicates
that a fraction of the 90 nm aerosol consists of particles that are composed of

355
almost entirely non-volatile material and therefore does not change size upon
heating, and the remaining fraction contains mostly volatile material and
continue to shrink in size with increasing temperature. For temperatures of up to
1300C the diameter of the volatile particles in the whole range investigating
(18–90 nm) was still shrinking (at this temperature decreased to about half the
diameter compared to the original size at ambient temperature) without a clear
evidence of a plateau which would indicating the presence of a non-volatile
core; thus if a non-volatile core exists, its diameter will be smaller than that
reached by particles at 1300C.
Elemental Carbon (EC) is usually considered a marker of the combustion
process; with diesel engines as predominant sources of EC to the urban
atmosphere. Sardar et al. (2005) investigated chemical composition of UF
particles at two sites (urban and inland). The study showed that organic carbon
(OC) ranged from 32 to 69%, EC from 1 to 34%, sulphate from 0 to 24% and
nitrate from 0 to 4%. This was somewhat different to the findings from the
study by Kim et al. (2002) who showed that OC and EC contribute 35%,
sulphate 33%, and nitrate and ammonium 6% and 14%, respectively, with other
unknown substances contributing 12%. Kim et al. (2002) also showed that in all
cases, a greater fraction of the total mass consists of OC in the UF mode than in
the corresponding accumulation mode. Similar conclusions can also be drawn
for EC. A distinct OC mode was observed between 18 and 56 nm in the summer
and not present in the other seasons, indicating photochemical secondary
organic aerosol formation. The EC levels were higher in winter at the source
sites and in summer at the receptor sites due to lower inversion heights and

356
increased long-range transport from upwind source areas, respectively. Nitrate
was more prevalent in the accumulation mode and almost not measurable in the
UF particles. This was related to the process of formation of ammonium nitrate
when the nitric acid in photochemical smog in air parcels originating near
downtown Los Angeles Basin encounters ammonia. Higher summertime
temperatures and lower relative humidity favour the dissociation of particulate
ammonium nitrate, which is more pronounced for UF particles due to the Kelvin
effect. Sulphate, which similar to nitrate, was only detectable in the size ranges
above 56 nm made up greater percentage of the total mass in the accumulation
than the UF mode in fall and winter, however a higher proportion in both modes
during the summer, likely due to its photochemical origin. It was suggested that
the absence of sulphate in the smaller particles indicted that the majority of the
particulate sulphate is formed on pre-existing particle surfaces or by liquid-
phase reactions of sulphuric acid. The study by Kim et al. (2002) also supported
the general findings from an earlier study conducted in the same area by Turpin
and Hutzincker (1995), who also investigated the significance of secondary
organic aerosol formation by plotting OC against the EC concentrations. The
average ratio of OC to EC at a site affected directly by traffic and at a site
downwind from that one estimated from slope of the linear regression, were 3.5
and 8.6, respectively implying the existence of secondary organic aerosols in
UF particles at second site.
UF chemistry, including elemental composition was investigated by Pakkanen
et al. (2001), including over 40 chemical components of samples from an urban
and rural site in the Helsinki area. While the average UF particle mass
357
concentration was higher at the rural (520 ng/m3) than at the urban site (490
ng/m3), the average chemical composition of UF particles was similar at the two
sites. The most abundant of the measured components were sulphate (32 and 40
ng/m3 for the urban and rural sites, respectively), ammonium (22 and 25
ng/m3), nitrate (4 and 11 ng/m3) and the Ca2+ ion (5 and 7ng/m3). The most
important metals at both sites were Ca, Na, Fe, K and Zn with concentrations
between 0.7 and 5 ng/m3. Of the heavy metals, Ni, V, Cu, and Pb were
important with average ultrafine concentrations between about 0.1 and 0.2
ng/m3. Also the organic anions oxalate (urban 2.1 ng/m3 and rural 1.9 ng/m3)
and methanesulphonate (1.3 and 1.7 ng/m3) contributed similarly at both sites.
The measured species accounted for only about 15-20% of the total UF mass.
While not measured, it was estimated that the amount of water was about 10%
(50ng/m3) and that of carbonaceous material about 70% (350 ng/m3) at both
sites. At both sites the contribution of UF to fine was especially high for Se, Ag,
B, and Ni (10-20%) and at the rural site also for Co (20%), Ca2+ (16%) and Mo
(11%). Enrichment in the UF particles suggests that local sources may exist for
these elements. Aitken modes turned out to be useful indicators of local sources
for several components. The Aitken modes of Ba, Ca, Mg and Sr were similar in
several samples, suggesting a common local combustion source for these
elements, possibly traffic exhaust. Co, Fe, Mo and Ni formed another group of
elements often having similar Aitken modes, the likely source being combustion
of heavy fuel oil.
In summary, it can be concluded from the review of the studies which analyse
UF particle composition that almost all the studies focused on different aspects

358
of particle chemistry, with some of them targeting ion or elemental composition,
other studies particle volatility, and yet others investigating elemental and
organic carbon fractions. It is therefore important that more studies are
conducted on particle chemical composition, which would investigate in parallel
a range of different aspects to provide a more complete understanding on the
chemistry of UF particles and its local variation.
7.13. TEMPORAL VARIATION OF PARTICLE CHARACTERISTICS
7.13.1. Diurnal variation
In urban environments, strong diurnal variation of particle concentration has
been reported by many studies and shown to closely follow the temporal
variation in traffic density, with the highest levels observed on weekdays during
rush hours (Ruuskanen et al. 2001; McMurry and Woo 2002; Charron and
Harrison 2003; Paatero et al. 2005; Morawska et al. 2007c). It has been reported
that there are differences in the pattern for different weekdays, with for example
Friday having higher concentrations, and also between Saturday and Sunday,
reflecting different traffic flowrate patterns on different days (Hussein et al.
2004). As shown by many studies (e.g. (Morawska et al. 2002; Hussein et al.
2004)), the daily pattern of aerosols on weekdays is characterized by two peaks
coinciding with the traffic rush hours, while on weekends, by a wide peak in the
middle of the day. It is, however, the concentration of the nucleation and Aitken
modes particles which follows this trend, with far fewer particles in the
accumulation mode, indicating exhaust as a major source of UF, but not of
larger particles in urban air (Hussein et al. 2004; Hussein et al. 2005a). Stanier

359
et al. (2004a) showed that strong diurnal trends were most apparent in the
aerosol number, in contrast to aerosol volume distribution, for which seasonal
trends were the strongest. In addition to the impact of traffic emissions, the
process of secondary particle formation contributes to the variation in daily
pattern of aerosol concentration, with the impact varying during different
seasons.
7.13.2. Seasonal variation
There are several factors contributing to seasonal variation in particle
concentration, including those leading to an increase, such as: lower mixing
layer height and greater atmospheric stability in winter (due to less dispersion),
lower winter temperature (increased nucleation events of combustion exhaust
emitted from motor vehicles particularly during morning rush), and increased
photochemical particle formation during summer; as well as those leading to a
decrease, such as: lower traffic flow rate during summer holiday periods. All the
studies investigating seasonal variation in particle concentration in the Northern
hemisphere showed that there are clear seasonal trends (Zhang et al. 2004a;
Zhang et al. 2004b; Paatero et al. 2005; Pirjola et al. 2006; Virtanen et al. 2006),
contrary to a study conducted in the Southern Chemosphere, in Brisbane,
Australia, which did not show a trend (Mejia et al. 2007b). While the studies
conducted in the Northern Chemosphere were in areas where there are
significant meteorological differences between the seasons, and thus seasonal
variations in human activities, in subtropical Brisbane there are much smaller
differences between the seasons.

360
With the number of factors affecting particle concentrations it is not surprising
that there are differences in the magnitude and time of occurrence of peaks and
troughs in the concentrations between different geographical locations. Most of
the studies reported the lowest total number concentrations in summer with the
highest in winter but sometimes also in other seasons. Pirjola et al (2006) and
Virtanen et al. (2006) showed that the average concentrations in winter in
Finland were 2–3 times higher, with the highest of 183 000 cm−3 observed in
February. Similar results were reported by Wehner and Wiedensohler (2003) in
Leipzig, Germany. Zhang et al. (2004b) found the highest monthly mean for
N11-50 particles for Pittsburgh, USA, in December, with a mean of 7630 ± 3710
cm-3 while lowest of 4280 ± 2250 cm-3 in July. In winter most of the factors
leading to the increase in particle concentration tend to occur at the same time:
morning traffic rush, when the mixing height is the lowest, coinciding with the
lowest wind speed and temperature. However, Hussein et al. (2004) and Laakso
et al. (2003) showed that while the lowest total and nucleation mode particle
number concentrations were observed in Helsinki and in northern Finland
during summer, the highest were during spring and autumn, and the cleaner the
air, the stronger the cycle was. Summer minima were associated with higher
temperatures (which limit the nucleation due to temperature dependence of
saturation vapour pressures) and better mixing, and in Helsinki, with less traffic
in July. Springtime maximum was associated with nucleation of exhaust gases
(favoured by low temperatures combined with the low boundary layer height
and high radiation) and transport of new particles from cleaner areas.

361
In general, seasonal daily variation in the accumulation mode particles is less or
not significant, while the variation was larger in the UF particles; especially
nucleation mode particles (Hussein et al. 2004). Wehner and Wiedensohler
(2003) showed that the maximum concentration for both summer and winter
occurred for a particle size between 10 and 20 nm. McMurry and Woo (2002)
studied ambient aerosols in urban Atlanta, Georgia, and found that for particles
between 10 and 100 nm, average concentrations tended to be highest during
winter, while concentrations of particles in the 3-10 nm range increased in the
summer due to photochemical nucleation, which depends strongly on the
intensity of solar radiation. Evidence of summer nucleation was also found by
Sardar et al. (2005) and Geller et al. (2002), who showed elevated levels in the
mass concentrations in the 32-56 nm size range. Summer nucleation events lead
to rapid changes in particle concentrations and as Zhang et al. (2004b) showed,
the highest variation was found in July.
7.13.3. Long term variation
The number of studies investigating long term trends in particle concentrations
is limited. Some insight into particle number concentration trends was provided
by the studies conducted at different locations in former East Germany,
including the city of Erfurt and the counties of Bitterfeld, Hettstedt and Zerbst,
during two different campaigns, the first one in the early and the second one in
the late 1990’s, which found that UF particle number increased between 38.1%
(Pitz et al. 2001) and 115% (Ebelt et al. 2001). Wahlin et al (2001) measured
particle number concentration and size distributions in a street canyon in
Copenhagen over two 2-month campaigns during Jan-Mar 1999 and Jan-Mar

362
2000 and found a significant decrease in ultrafine particle concentration. This
observation was attributed to a 56% fall in the average particle emission from
diesel vehicles due to the reduction of the sulphur content in the fuel from
approximately 0.05% to less than 0.005% implemented in Denmark in July
1999. A handful of investigations have continuously monitored submicrometer
particles for periods of at least one year but no evidence on the long-term trends
was reported (Morawska et al. 1998b; Woo et al. 2001a; Wehner and
Wiedensohler 2003; Cabada et al. 2004; Paatero et al. 2005; Watson et al.
2005). Exceptions to this are two studies conducted in Finland and in Australia.
Hussein et al. (2004), who measured particle number for over a six-year period
in Helsinki, found that annual geometric mean particle number concentration
increased by 3.2% in 1999, followed by a decrease of 6.7% in 2000, and 17.6%
in 2002. Although the monitoring site was moved after the first three years 3km
from its original location, thereby influencing the results, their main conclusion
was that the annual variation in total particle number was associated with traffic
density and the predominance of new vehicles in the Helsinki area. Long trends
were investigated over a five-year period in Brisbane, Australia. Particle size
distribution was summarized by total number concentration and number median
diameter (NMD) as well as the number concentration of the 0.015-0.030 (N15-
30), 0.030-0.050 (N30-50), 0.050-0.100 (N50-100), 0.100-0.300 (N100-300) and 0.300-
0.630 (N300-630) µm size classes. Morning and afternoon measurements, the
former representing fresh traffic emissions from a nearby freeway (based on the
local meteorological conditions) and the latter well-mixed emissions from the
central business district, during weekdays were extracted for time series
analysis. Only the morning measurements exhibited significant trends. During

363
this time of the day, total particle number increased by 105.7% over the period
of five years and the increase was greater for larger particles, resulting in a shift
in NMD by 7.9%. There was no evidence to suggest that traffic flow in the
freeway has increased to cause the increase in particle concentration, and it was
suggested that the increase was likely due to changes in the composition of the
freeway traffic, however, this hypothesis could not be verified. More studies on
long term trends are critically needed.
7.14. SPATIAL DISTRIBUTION OF PARTICLE CONCENTRATIONS
WITHIN URBAN ENVIRONMENT
The three most common approaches to experimental studies concerned with
small-scale (urban scale) spatial variation in particle concentration, have
generally included: (i) measurements as a function of the distance from a major
road; (ii) measurements at a major road or in its immediate vicinity, as well as at
side streets; and (iii) measurements at several locations within the city. This
section discusses separately the outcomes of each of these types of studies, and
concludes with an overall comparison of ultrafine particle number concentration
in different environments. Not discussed here are vertical profiles of particle
concentrations, of particular importance in relation to urban canyon effects,
which are discussed elsewhere (Hitchins et al. 2002; Longley et al. 2003;
Vardoulakis et al. 2003; Imhof et al. 2005b).

364
7.14.1. Particle concentration as a function of the distance from the road
These studies are ideally conducted in areas where airflow between the road and
the monitoring site is undisturbed by buildings or other barriers. As an outcome,
such studies provide information about small-scale particle dispersion, where
the shape of the dispersion function is similar between the studies, and thus of
general applicability to other sites of similar topography. The studies
investigated changes to the total particle number concentration as well as to the
size distribution, and some of them also compared changes to particle
concentrations with the concentrations of gaseous pollutants emitted by
vehicles. In general, all such studies showed, as expected, a decrease in particle
concentration with distance from the road, up to about 300 m, beyond which
particle concentration levels and size distributions approach the local urban
background (Morawska et al. 1999b; Shi et al. 1999; Hitchins et al. 2000; Zhu et
al. 2002a).
At the road, particle concentrations range between 104 and 106 particles cm−3,
and show association with vehicle flow characteristics (higher the speed, the
greater the particle concentration, and the smaller the particle size), with less
variation observed in particle volume compared to particle number size
distributions (Kittelson et al. 2004). Virtanen et al.(2006) showed that the total
concentrations at roadside were dominated by nucleation mode particles, were
increasing with increasing traffic rate and the effect of traffic rate were stronger
on particles smaller than 63 nm than on the larger particles. Harrison et
al.(1999) reported that at the road significant numbers of particles are in the 3-7
nm size range, with a mode below 10nm, attributable to homogeneous
365
nucleation processes. The roadside measurements show rapid variation, with
two modes at 10 and 30 nm, and other modes present at a number of different
particle sizes (between 20 and 50 nm and 100 and 200 nm), and changing very
quickly between measurements (Harrison et al. 1999; Morawska et al. 2004).
Studies investigating total particle concentration levels showed the decrease
with the distance from the road to be exponential or according to the power law.
This is similar to the studies investigating gradients of NO2 concentrations in
the vicinity of roads (e.g. (Nitta et al. 1993; Kuhler et al. 1994; Roorda-Knape et
al. 1998)), which found them to be curvilinear. Shi et al (1999) showed that total
particle number concentration in the size range from 9.6 to 352 nm at the busy
road site was 3.6 and 3 times higher, compared to two sites at a distances of 30
and 100m from the road, respectively. A study by Hitchins et al. (2000)
conducted for total particle number concentration in the size range from 15 to
697 nm showed that for conditions where the wind was blowing directly from
the road, at a distance of approximately 100 - 150 m from the road, the
concentration decayed to about half that of the maximum occurring at 15 m
from the road (the nearest measuring point to the road), which reduced to 50 –
100 m for wind blowing parallel to the road. Zhu et al. (2002a) showed that
particle number concentration in the size range from 6 to 220 nm as a function
of distance from a road ranging from 17 to 300 m displayed an exponential
decreasing trend, similarly to the concentrations of CO and black carbon. Pirjola
et al. (2006) showed that at a distance of 65 m from the roadside, the average
concentration reduced to 39% in winter and to 35% in summer with the wind

366
perpendicular to the road whilst for wind blowing along the road in it decreased
to 19% in summer.
Gramotnev et al (2003) modelled particle dispersion using a scaling procedure
for CALINE4 developed for this purpose, and compared the results with
measured total particle concentration in the size range of 0.015 to 0.700 μm at
distances between 15 and 265 m from the road. The authors concluded that
particle concentration reduces as a power law with the distance from the road,
with the typical difference between the theory and average measured
concentration being of the order of 10%, which was likely due to processes not
included in the modelling, in particular coagulation.
As discussed in Section 7.2, it has been shown that the dynamic pollutant mix
evolves during transport from the road: nucleation leads to formation of new
particles very soon after emissions, followed by their growth by condensation,
diffusion to surfaces and coagulation. Therefore, at the road, particle
concentrations are dominated by the smallest particles, with the peak in
distribution shifting to the larger sizes at greater distances. Initially these
smallest particles are below < 10 nm, and therefore not measured if the
instrument window is above this. As they grow with time and thus distance
from the road, they become “visible” to these instruments. As this occurs over
the distance of about 90 m, there have been particle number increases reported
at such distances. In particular Zhang et al. (2004a) showed that a large number
of sub-6nm particles emitted from freeways may grow above 10 nm around 30–
90 m downwind. Afterwards, some shrink back to sub-10 nm and some

367
continue growing to above the 100nm range. Zhu et al. (2002a) measured
particle size distributions in the size range of 6–220nm at a distance from 17 to
300m downwind of freeway. At 17m downwind from the freeway, the dominant
mode was around 10nm with a modal concentration above 3.2×10⁵/cm3 and at
20m from the freeway its concentration decreased to 2.4×10⁵/cm3. At 30 m its
concentration decreased by about 60% with a slight shift in its location. It then
kept shifting to larger size ranges with its concentration decreasing for farther
sampling locations and to disappear at distance >150m from the freeway. The
second mode at 17m downwind from the freeway was around 20nm with a
concentration of 1.5×10⁵/cm3 which remained more or less unchanged at 20m,
but the mode shifted to 30 nm at 30 m and continued to shift to larger sizes with
the distance from the freeway. Number concentrations of particles <50nm,
dropped significantly with increasing distances from the freeway, but for those
>100nm, number concentrations decreased only slightly. Particles in the size
range of 6 to 25nm accounted for about 70% of total UF particle number
concentration, which decayed exponentially to about 80% of the roadside value,
at 100m, levelling off after 150m. The concentrations in the size ranges 25–50
and 50–100nm, experienced a shoulder between 17 and 150 m. Very similar
results were obtained by Zhu et al. (2002b) who also showed that at 30 m
downwind from the freeway, three distinct modes were observed with geometric
mean diameters of 13, 27 and 65 nm and the smallest mode, with a peak
concentration of 1.6 x 105 cm-3, disappeared at distances greater than 90 m.

368
7.14.2. Relationship between on-road and urban background particle
concentration
A number of studies monitored concentration of particle characteristics in urban
sites located at various orientations in relation to the urban traffic, or from mobile
laboratories moving around the city. Most commonly the aims of such studies
were to compare the differences between local hot spots and urban background
locations, rather than to provide a comprehensive characterization of the
relationship between the concentrations and the distance from a particular street or
traffic flow. In addition, each of the studies was concerned with investigating
some other relationship, for example between the parameters measured in relation
to the site location. While direct comparison of the results from the studies is not
possible, as the design of each of the studies was different in terms of site
locations in relation to traffic areas, and also in terms of parameters measured,
some more general conclusions can be drawn from them. In particular the studies
showed that:
• Concentration of particle number decreases as the distance of the monitoring
site from the street increases e.g. (Buzorius et al. 1999; Kittelson et al. 2004;
Westerdahl et al. 2005) and that the difference between close to traffic and
away from the traffic concentrations are much larger for particle number
than PM10 concentrations e.g. (Harrison et al. 1999; Holmes et al. 2005).
• Particle size distribution is much more stable at background urban sites,
where it its likely to be unimodal, than close to traffic where it is multimodal
and rapidly changing e.g. (Harrison et al. 1999; Morawska et al. 2004).

369
• Near traffic, the nanometre fraction of UF dominates the total particle
number concentrations, and their contribution decreases with distance from
traffic (Ketzel et al. 2003; Kittelson et al. 2004).
• Characteristics of UF particles are more closely related to the number of
heavy-duty vehicles than to the number of light-duty vehicles (Junker et al.
2000; Holmes et al. 2005; Westerdahl et al. 2005).
All these findings support the findings of studies which investigated particle
characteristics as a function of distance from the road (see Section 7.1), which, by
their design, controlled better for all the influencing factors. The main
significance of studies comparing particle characteristics across different urban
areas is in provision of information on the magnitude of local variation in particle
concentrations levels as well as size distribution, with less significance for global
comparisons.
7.15. NUCLEATION MODE AND ITS IMPACT ON URBAN PARTICLE
CONCENTRATIONS
The mechanisms and conditions that favour formation of secondary particles by
nucleation of condensable species in the air were discussed in general in chapter
4.4. This section will focus on the frequency, temporal variation and the
magnitude of the contribution of nucleation events to particle number
concentrations. Since during some of these events particle concentrations
increase sometimes by one to two orders of magnitude, their occurrence may
have a profound impact on any future approaches to routine monitoring of
particle number concentration, interpretation of monitoring results and setting
370
particle number concentration guidelines or standards. Most commonly,
nucleation events were observed during: (i) morning rush hours, and (ii) around
midday. Therefore, mainly these two types of events and their impact on particle
characteristics are discussed here. However, Woo et al. (2001b) reported a third
type of event, with particles in the range 35–45 nm, occurring during the late
evening on several days in April and September, at an average temperature of
23°C, which showed extraordinarily high concentrations, with an increase by
factors ranging from 26 to 350. The source of these particles remains unknown,
although elevated levels of SO2, NOx and NOy were also observed, indicating
that a plume from a larger source may have passed the measurement site during
this time. The presence of elevated SO2 suggests that an industrial source may
have played a role.
Morning rush hours nucleation events, when increased emissions of
condensable species from vehicles combined with lower temperatures
(particularly during winter months), result in conditions enabling particle
nucleation when exhaust mixes with cool ambient air. Occurrence of such
events were reported by Wehner et al. (2002), Zhang et al. (2004b) and Zhang
and Wexler (2004a). Particles during these events are formed following direct
emissions from motor vehicles and thus their concentrations are correlated with
CO increases (Zhang et al. 2004b). Woo et al. (2001b) also reported elevated
concentrations of SO2, NO, NOx, as well as CO (for 12 out of 18 events).
Increased concentrations of particles in the size range of 3–10 nm, but mainly
10–100-nm, were reported during these events in urban Atlanta, Georgia
(Kittelson et al. 2004), with the average values of particle concentrations in the

371
latter size range being a factor of two to three higher than the average values
reported for three European cities (Aalto et al. 2005). Woo et al. (2001b)
reported early morning, winter concentrations elevated by a factor of two in the
10–35 nm range, with the average particle size being 51% of the diameter
before the event. This was mostly associated with temperatures exceeding 10°C,
while for temperatures below 10°C, however, the data showed a pronounced
enhancement of particles in the 4–10 nm range. The latter was explained by
nucleation that occurs as hot exhaust gases mix with the cool ambient air,
however, the study was unable to identify which source or combination of
sources was predominant. It is important to mention, that while such events
have been reported to occur predominantly in the morning, they have also been
observed in the afternoon, during rush hour, particularly in winter when the
mixing heights remain low (Woo et al. 2001b; Zhang et al. 2004b).
Midday nucleation events, when increased solar radiation (>750 W/m2 (Woo et
al. 2001a)), presence of SO2 and water vapour in the air (Pirjola et al. 1998), and
relatively low concentration of pre-existing particles (often occurring under
conditions of good atmospheric mixing: higher wind speed and high boundary
layer) lead to photo oxidation of SO2 to sulphuric acid and its subsequent binary
nucleation with water and thus formation of sulphuric acid nanoparticles. Shi et
al. (2001a) concluded that nucleation events cannot occur without the input of
solar radiation, but high solar radiation alone will not necessarily lead to a
nucleation event. Wehner and Wiedensohler (2003) found that midday
nucleation occurred on weekdays as well as on weekends, concluding that the
immediate emission of anthropogenic trace gases is not critical for particle

372
formation in urban areas, or that concentrations of these gases are always
sufficiently high to trigger new particle formation. Contrary to other studies,
Laakso et al. (2003) showed that nucleation mode particle concentration had a
minimum in summer, which was explained as related to high temperatures
which limit the nucleation (due to temperature dependence of saturation vapour
pressures). Alam et al (2003) reported occurrences of nucleation events on 8 out
of 232 days distributed throughout the year at two urban sites in Birmingham,
UK, and inferred that both the nucleation and particle growth processes
involved condensable molecules other than, or in addition to, sulphuric acid,
together with the requirement of a low total particle surface area.
Particle formation may be followed by growth of the newly formed particles,
sometimes rapid (Monkkonen et al. 2005), sometimes over longer periods of
time of up to 18 h (Zhang et al. 2004b). Ternary nucleation mechanisms
involving (H2SO4/H2O/NH3) have been proposed to account for discrepancies
found between calculated binary H2SO4/H2O nucleation rates and experimental
results (Stanier et al. 2004b). Woo et al. (2001b) observed that NOx was
typically depleted during these events (while higher before and after the event).
The same study also showed that O3 was elevated during the events. Such
events have been reported to occur predominantly in spring and summer (Zhang
et al. 2004b), but also in autumn (Laakso et al. 2003; Kittelson et al. 2004).
Particles formed through such event have been reported to be very small, mainly
in the 3-10 nm range (Harrison et al. 1999; Woo et al. 2001b; Kittelson et al.
2004; Monkkonen et al. 2005). Sardar et al.(2005) showed elevated mass
concentrations in the 32-56 nm size range during summer, which may be linked

373
to additional summer nucleation events. Interestingly, the study also showed a
mode in organic carbon (OC) between 18 and 56 nm in the summer that was not
present in the other seasons, linking it to summertime photochemical secondary
organic aerosol formation through hydroxyl radicals, which occurs by the
photolysis of ozone, and reacts with organic gases to reduce their volatility. The
frequency, intensity, meteorology, and possible chemistry of such new particle
formation has been analysed by Stanier et al. (2004b), based on sampling
conducted in a park 5 km downwind of downtown Pittsburgh, showing that the
nucleation events are associated with photochemical sulphuric acid production
and occur on approximately 30% of the study days. The same type of behaviour
has also been reported to occur in St. Louis (Shi 2003). Keeler (2004) detected
the presence of the noon nucleation peak on 5 out of 11 sampling days in
southwest Detroit during the summer. Woo et al. (2001a) observed that 19 of
the 23 pronounced noon peaks over 12 months occurred during August and
April. During such nucleation events, peaks of SO2 are strongly associated with
the number concentrations of UF (sources are vehicle emissions but also
industry). Particle number concentrations during such events can be as high as
3x104 cm-3 (Zhang et al. 2004b) and 7.3x104 cm-3 (Keeler, 2004). The latter
value was 3.5 times higher than the morning peak concentration. Similarly, Woo
et al. (2001a) showed that, during one such mid-day nucleation event, the
particle concentration increased by a factor of 50 over the morning peak.
McMurry and Woo (2002) concluded that the concentrations produced by the
photochemical nucleation event were about an order of magnitude higher than
concentration peaks that occurred during both morning and afternoon rush
hours.

374
It is expected that under high concentrations of pre-existing particles new
particle formation will not be favoured but rather condensation of condensable
species on these particles. For example Vakeva et al. (1999) conducted model
calculations, which showed that within a street canyon pre-existing particles
prevent new particle formation via the H2SO4ÐH2O-route, while above roof
height (25 m) nucleation potential is much higher. However, studies conducted
in highly polluted environments, such as Dunn et al. (2004), also reported
occurrence of nucleation events. Monkkonen et al. (2005) also reported some
around noon nucleation events in New Delhi (linked to the presence of SO2),
with the formation rate of the particles varying from 3.3 to 13.9 cm-3 s-1, despite
the fact that most commonly, the formation and growth of nucleation mode
particles were disturbed by high aerosol background concentration.
In general, as concluded by Kittelson et al.(2004), nucleation processes have a
greater effect on mean rather than median concentrations, with different trends
for particles in different size ranges (thus originating from different nucleation
events). For 10–100nm particles, both the median and mean are elevated during
the cold months, while mean values for 3–10nm particles are highly variable
and can be high both in winter and summer, with the highest mean occurring
during summer and the highest median observed in the winter. For example
Woo et al. (2001a) observed that annual average concentrations of particles in
the 3–10 nm range were elevated due to the appearance of very high
concentrations of these particles between 11 am and 2 pm on 23 days of the
year.

375
7.16. COMPARISON OF PARTICLE CONCENTRATION LEVELS
BETWEEN DIFFERENT ENVIRONMENTS
Comparison of particle concentration levels reported for different environment
was conducted for the purpose of this review by grouping the results from the
studies into eight categories according to measurement location including: road
tunnel, on-road, road-side (which indicates varying degree of distance from the
road), street canyon, urban, urban background, rural, and clean background, and
calculating mean and median values for each category. This review only
considered those papers that presented concentrations numerically; papers that
showed concentrations only graphically have not been included in this
comparison since values derived from graphs are of limited accuracy. The
majority of the studies reported their results in terms of mean values, and thus
for the purpose of this comparison only the reported mean particle number
concentrations were considered. Some studies used both CPC and SMPS
measurements for the same location; hence there were several overlaps between
the number of CPC and SMPS measuring sites. Most of the studies reported
multiple measurements at each study site, from which the average was
calculated. The overall average for each site was then calculated using the
averages for each study. Also, many studies included more than one site.
Overall, there were 3 tunnel studies (with 4 sites using the SMPS), 2 on-road
studies (with 7 sites using the CPC), 18 road-side studies (with 5 sites using the
CPC and 19 using the SMPS), 7 street canyon studies (with 1 site using the CPC
and 7 using the SMPS), 24 urban studies (with 1 site using the CPC and 24 sites
using the SMPS), 4 urban background studies (with 3 sites using the SMPS), 8

376
rural studies (with 2 sites using the CPC and 11 sites using the SMPS) and 5
clean background studies (with 9 sites using the SMPS).
Figure 7.2 presents a comparison of mean and median concentrations for
the different environments.
4.8310.76
42.0771.45
48.18
167.64
7.29
2.612.91
34.58 39.1399.09
47.00
8.83 8.10
3.20
1
10
100
1000
Tunnel (3) On Road (2) Road Side(18)
StreetCanyon(7)
Urban (24) UrbanBackground
(4)
Rural (8) CleanBackground
(5)Measurement Location
103 Pa
rtic
les/
cm3
meanmedian
Figure 7.2. Mean and median particle number concentrations for different
environments. In brackets are the numbers of sites for each environment*.
* 3 tunnel studies (Abu-Allaban et al. 2002; Jamriska et al. 2004; Imhof et al. 2005b), 2 on-road studies
(Shi et al. 2001b; Westerdahl et al. 2005), 18 road-side studies (Harrison et al. 1999; Morawska et al.
1999b; Hitchins et al. 2000; Shi et al. 2001a; Molnar et al. 2002; Thomas and Morawska 2002; Zhu et al.
2002a; Zhu et al. 2002b; Gramotnev et al. 2003; Ketzel et al. 2003; Gramotnev et al. 2004; Janhall et al.
2004; Ketzel et al. 2004; Kittelson et al. 2004; Morawska et al. 2004; Zhu et al. 2004; Gidhagen et al.
2005; Imhof et al. 2005a), 7 street canyon studies (Vakeva et al. 1999; Jamriska and Morawska 2001;
Wåhlin et al. 2001; Wehner et al. 2002; Longley et al. 2003; Gidhagen et al. 2004; Gidhagen et al. 2005),
24 urban studies (Tuch et al. 1997; Harrison et al. 1999; Hitchins et al. 2000; Junker et al. 2000; Pakkanen
et al. 2001; Ruuskanen et al. 2001; Woo et al. 2001a; McMurry and Woo 2002; Morawska et al. 2002;
Ketzel et al. 2003; Laakso et al. 2003; Wehner and Wiedensohler 2003; Hussein et al. 2004; Jamriska et al.
2004; Jeong et al. 2004; Ketzel et al. 2004; Morawska et al. 2004; Stanier et al. 2004a; Young and Keeler
2004; Gidhagen et al. 2005; Holmes et al. 2005; Hussein et al. 2005a; Janhall et al. 2006; Mejia et al.
2007a), 8 rural studies 4 urban background studies ( Hussein et al. 2004; Ketzel et al. 2004; Virtanen et al.

377
2006; Hameri et al, 1996), 5 clean background studies (Pitz et al. 2001; Laakso et al. 2003; Tunved et al.
2003; Morawska et al. 2004; Gidhagen et al. 2005;)
It can be seen from Figure 7.2 that both tunnel and roadside categories have
high standard deviations. In relation to the tunnel category, it could be due to the
small number of studies conducted. In relation to the roadside category, one
reason could be that the studies report concentrations for different distances
from the road kerb and many studies had different reference distances, and/or
more than one distance, which were difficult to normalize.
The mean concentration measured at both urban and urban background sites
were statistically different to that measured at rural and clean background. As
such, they were considered as a combined category, the mean of which was
compared with the mean of the other site categories (on-road, road side etc),
using a Students t-test, and in each case, the differences were found to be
statistically significant. The mean concentration measured at the tunnel sites
(1.67×10⁵/cm3) was statistically higher than the means of each of the other
categories.
7.17. EXPOSURE TO ULTRAFINE PARTICLES
There have been very few studies investigating human exposure to UF particles.
In general exposure means concentrations experienced over a periods of time
spent in different microenvironments. A study by Kaur et al. (2006)
investigated exposures of volunteers walking or travelling by bus, car or taxi,
along two busy roads with approximate average daily traffic of 83,000 and
18,000 vehicles per day, respectively. The volunteers carried P-TRAK®
378
Ultrafine Particle Counters (TSI Model 8525) and the study showed that
different modes of transport resulted in different exposures, with average
personal UF particle count exposure (104 particles/cm3) of 4.61 (walking), 8.40
(cycling), 9.50 (bus), 3.68 (car) and 10.81 (taxi). (Note: the values presented in
the paper were rounded for the purpose of this review). Considerable variability
was seen in UF particle exposure, of up to an order of magnitude above
background, within a few seconds and over a few metres as people moved
through the polluted microenvironments, which implies that the influence of
time-activity and movement can be easily missed by using averaged results, thus
ultimately leading to underestimation of the exposures. Similar conclusions
were derived by Gouriou et al. (2004) who showed that particle concentration
encountered by car passengers may present high peaks, up to 106 particles cm−3.
Hourly average exposure is strongly influenced by the frequency with which an
individual encounters such exposure events, as well as their severity, and thus
mean and median concentrations over a time-averaged period may not reflect all
aspects of population exposure patterns.
7.18. RELATIONSHIP BETWEEN DIFFERENT PARTICLE
METRICS AND WITH GASEOUS POLLUTANTS
Many studies in addition to particle number, measured concentrations of particle
mass (or mass surrogate) and of gaseous pollutants. The relationship between
the measured pollutants was analysed with an aim to gain a better insight into
pollution sources or pollution dynamics. In some cases existence of quantifiable
relationship between some of the pollutants would provide justification for

379
using some of the pollutants as a surrogate of others and thus lowering the
overall costs of monitoring.
Relationship between particle number, surface area, volume or mass
concentrations. Correlations have been considered between total or size
classified particle number concentrations and other particle metrics. Harrison
and Jones (2005) measured particle number concentrations at eight different
urban sites and showed that hourly and daily averaged number concentrations
were only weakly correlated to PM10. Harrison et al. (1999) showed that
correlation between particle number concentrations and PM10 was higher at
traffic, than at a background sites. Zhang et al. (2004b) reported that there was
no correlation between UF particle number and PM2.5 mass concentrations, and
modest and good correlation between N50-100 and N100-470 and PM2.5,
respectively. Laakso et al. (2003) showed that there was no correlation between
particle mass and nucleation mode, total concentration or Aitken mode. Woo et
al. (2001b) did not find correlation between the number and surface area or
volume concentrations. Ruuskanen et al. (2001) showed that the total and UF
number concentrations were poorly correlated with PM2.5 levels while the
number concentration of accumulation particles showed better correlation. Lin
et al. (2007) showed that the ratios of PM0.056/PM10 and PM0.1/PM10 mass
concentrations at the roadside were 0.13 and 0.17, respectively, and were
significantly lower at the rural site (0.05 and 0.06, respectively), suggesting that
the roadside is exposed to more nano and UF particles than the rural area. Thus
in general, while there is some level of correlation between some particle
metrics reported by some studies, other studies did not find any correlation. This

380
can be explained by different sources of bigger and smaller particles in different
environments, and therefore, without local measurements, the degree, if any, of
local correlations cannot be predicted from studies conducted elsewhere.
Relationship between particle number, gaseous pollutant and black carbon
concentrations. Most of the studies conducted in the proximity to traffic showed
existence of correlations between these pollutants. Zhu et al. (2002a) and Zhu et
al. (2002b) reported that concentration of CO, BC and particle number tracked
each other with the increasing distance from the freeway. Ketzel et al. (2003)
established that NOx and total particle number were well correlated at the urban
and near-city level indicating a common traffic source. Sardar et al. (2005)
showed that during fall and winter (when vehicular emissions become the
dominant pollution source) particles greater than 56 nm are correlated well with
CO and NOx, while very low correlations are observed between O3 and particle
number of any size range. Westerdahl et al. (2005), who measured pollutant
concentrations from an all-electric mobile platform, found that particles <1µm
were highly correlated with BC and NO, while moderately correlated with CO2
and poorly with CO. The latter was explained by the fact that CO emissions are
primarily from gasoline-powered vehicles, and relatively unrelated to those
pollutants dominated by diesel vehicles (including particle number). Similar
conclusion was derived by Bukowiecki et al. (2002).
Thus, while in general there is a reasonably good correlation between UF
particles and traffic emitted gaseous pollutants as well as BC, the existence and
the degree of correlation varies. As concluded by Paatero et al. (2005), who

381
estimated levels of particle number concentrations by retrospective modelling
using measured air pollution and weather variables, models must be city-
specific: associations of particle number concentrations with other pollutants
differ between different cities.
7.19. CONCLUSIONS AND IMPLICATIONS FOR THE EXPOSURE
AND EPIDEMIOLOGICAL STUDIES
This review compiled and synthesized the existing knowledge on UF particles
in the air with a specific focus on those originating due to vehicles emissions.
As it has been shown in this review, vehicles are a significant sources of UF
particles, and it is the vehicle emissions that are commonly the most significant
source of air pollution in general in populated urban areas. It is therefore of
particular significance to understand the magnitude and characteristics of the
vehicle-affected UF particles in urban air, as it is this type of environment which
is the most likely to be considered as a target for future air quality regulations in
relation to particle number. Industrial and power plant emissions (covered in
Part I) have a significant impact on the environment and climate, but as they
often (but not always) occur outside the most populated urban settings, their
direct impact on human exposure is lower than the impact of vehicle emissions.
UF particles are most commonly measured in terms of their number
concentrations, and unlike particle mass concentration (PM2.5, PM10), there is no
standard methods for conducting size classified particle number measurement.
The review showed that the term “UF particles” is often used imprecisely,
meaning various ranges of particle number concentration in a subset of the

382
submicrometer range. In addition, the number concentrations reported depend
on the instrument used and its setting. It has been shown by this review that the
mean and the median CPC's measurements are 32% and 56%, respectively,
higher than DMPS/SMPS's ones. While the differences for specific
environments could vary (larger differences expected for the environments
where nucleation mode is present and smaller where aged aerosol dominates), it
nevertheless shows what overall magnitude of differences can be expected when
comparing results using these different measuring techniques. It is important to
keep these differences in mind when attempting to establish quantitative
understanding of variation in particle concentrations reported by different
studies. This also points out the need to develop and utilize standardised
measurement procedures, enabling meaningful comparison between the results
from different studies, which is of particular significance for human exposure
and epidemiological studies.
Despite these differences in reporting measured concentration levels, this review
showed that it is possible to quantify the differences between background
concentrations of UF particles in clean environments, with the levels in the
environments affect by vehicle emissions. It has been shown that the clean
background levels are on average of the order of 2.67 ± 1.79 x 103 cm-3 , while
levels at urban sites are 4 times higher and levels at street canyons, roadside,
road and tunnel sites [R3] are 27, 18, 16 and 64 times higher, respectively. Thus
the range of concentrations between clean and vehicle effected environments
spans over two orders of magnitude. This is very different from particle mass;
for example a review by Morawska (2003) showed the decrease in mass

383
concentration between a busy road and urban background ranges only from 0 to
about 25–30%. This large variation in particle number concentration across
different environments has profound significance in relation to human exposure
assessment and epidemiological studies. This means that unless exposure
assessment is conducted where the exposures occur and at time scales that
elucidates the temporal nature of the exposure, it is unlikely that
epidemiological studies would provide answers based only on monitoring in
central locations. In other words, central monitoring alone underestimates
exposures and may lead to inappropriate management of public health risks.
Lack of answers from epidemiological studies in relation to UF particles
(exposure-response relationships) means, that it is not possible to develop health
guidelines, a basis for national regulations. In relation to airborne particle mass
it has been shown that within the current range of concentrations studied in
epidemiological studies there are no threshold levels and that there is a linear
exposure-health response relationship. Based on this, in the recent review the
World Health Organization Air Quality Guidelines, a new set of guidelines for
particulate matter was introduced, with annual mean values for PM2.5 and PM10
of 10 and 20 µg m-3, respectively. This was based on an American Cancer
Society
study (Pope et al. 2002) and represents the lowest end of the range over which
significant effects on survival have been observed (WHO 2005). It is important
to note that these values are not much higher than the concentration levels
encountered most commonly in natural environments (while it should be
acknowledged that, in some locations and under some circumstances,

384
concentrations in natural environments may be well below or above those cited).
If future epidemiological studies report response at lower concentration levels
PM2.5 and PM10, it is likely that the guideline values will be lowered even
further. While lack of exposure response relationship makes it impossible to
propose health guideline for UF particles, it is important to point out that as
discussed above, the current levels in environments affected by vehicle
emissions are up to an order of magnitude higher than in the natural
environments. Thus, if there is also no threshold level in response to exposure to
UF particles (or if it is very low), future control and management strategies
should target a decrease of these particles in urban environments by more than
one order of magnitude. At present there is a long way to go to achieve this.
When considering future management strategies for UF particles, as discussed
in this review, there are a few challenges, which include:
1. Currently there are large uncertainties in relation to vehicle emission factors
for different particle size ranges and for particle numbers, there are no
emission inventories of UF particles from motor vehicles, and there is only
very limited data on long term trends in UF particle concentrations in urban
environments. All these aspects should attract significant research efforts, as
this knowledge is critical for management and control of UF particles.
2. Estimations of pollution concentration in the air are commonly derived
based on source emission inventories, which in turn are derived utilizing the
source emission factors. However, due to the process of secondary particle
385
formation, estimation of UF particle concentration cannot be derived solely
based on vehicle emission factors (which are more likely to reflect
emissions of primary particles), but have to include also predictions for
secondary particle formation in exhaust plumes and particle formation by
nucleation processes in the wider atmosphere.
3. Secondary particle formation results in rapid increase of particle number
concentrations by one to two orders of magnitude to the concentration levels
of the order of 105 particles cm-3. The majority of the new particles are
formed by ion-induced or binary nucleation of sulphuric acid and water or
by ternary nucleation involving a third molecule followed by condensation
of semi-volatile organics, with photochemistry playing an important role in
some of these processes. The mechanisms of new particle formation
strongly depend on local meteorological factors, and therefore models of the
dynamics of particle formation in urban environments have to include all
factors involved and thus must be local area specific.
4. These significant peaks in particle number concentration due to secondary
particle formation are a challenge, if there were future regulations
considered based on particle number. Issues to resolve include: (i) whether
the regulations should be set around the base line concentrations without the
peak concentrations, or whether they should include the peaks; and (ii) how
to define the peaks. Developing a much better picture of particle formation
dynamics in different environments, including those which are influenced by
traffic, would greatly assist such regulation formulation.

386
5. It is not only the particle number concentration, but also particle
composition which should be considered when characterising UF particles.
The review showed that there have been only a relatively small number of
studies focused on UF particle chemistry. There are large differences in
particle chemical composition including particle solubility, volatility,
elemental composition, etc reported by the studies. The differences depend
on many factors, including vehicle technology, fuel used and after treatment
devices, but also on the post formation processes occurring atmospheric
transport. Since particle composition may be a factor determining particle
toxicity there is a need for developing a much better knowledge on UF
particle chemistry in different environments.
In summary, the magnitude of the impact of UF particles on human health and
the environment has still not been fully quantified (while the picture starts
emerging) nor is it fully understood, and the first step in this direction is to
develop an in depth understanding of particle concentrations, characteristics,
time trends and spatial distribution in clean and anthropogenic modified
environments. This knowledge would, in turn, lead to an understanding of the
potential impacts of the particles on the environment and would provide
scientific foundation for future studies in the area of human epidemiology. It
would also be used as a basis for setting any future emission and air quality
standards based on particle number.

387
7.20. REFERENCES
Aalto, P., Hameri, K., Becker, E., Weber, R., Salm, J., Makela, J., Hoell, C.,
O'Dowd, C., Karlsson, H., Hansson, H., Vakeva, M., Koponen, I., Buzorious,
G., Kulmala, M., 2001. Physical Characterization of Aerosol Particles During
Nucleation Events, Tellus B53, 344-358.
Aalto, P., Hameri, K., Paatero, P., Kulmala, M., Bellander, T., Berglind, N.,
Bouso, L., Castano-Vinyals, G., Cattani, G., Cyrys, J., Von Klot, S., Lanki, T.,
Marconi, A., Nyberg, F., Pekkanen, J., Peters, A., Sjovall, B., Sunyer, J.,
Zetzsche, K., Forastiere, F., 2005. Aerosol particle number concentration
measurements in five European citied using TSI-3022 condensation particle
counter over a three year period during HEAPSS (Health Effects of Air
Pollution on susceptible Subpopulations), Journal of the Air and Waste
Management Association 55, 1064-1076.
Abu-Allaban, M., Coulomb, W., Gertler, A., Gillies, J., Pierson, W., Rogers,
C., Sagebiel, J., Tarnay, L., 2002. Exhaust Particle Size Distribution
Measurements at the Tuscarora Mountain Tunnel, Aerosol Science and
Technology 36, 771-789.
Airborne Particles Expert Group (1999). Source apportionment of airborne
particulate matter in the United Kingdom. Report for the Department of the
Environment, Transport and the Regions, the Welsh Office, the Scottish
Office and the Department of the Environment (Northern Ireland).

388
Andersson, J., Wedekind, B., Hall, D., Stradling, R., Wilson, G., 2001.
DETR/SMMT/CONCAWE Particulate Research Programme: Light Duty
Results. SAE Technical Paper Series, Society of Automotive Engineers, No.
2001-01-3577.
Arnold, F., Kiendler, A., Wiedemer, V., Aberle, S., Stilp, T., Busen, R., 2000.
Chemiionconcentration measurements in jet engine exhaust at the ground:
implications for ion chemistry and aerosol formation in the wake of a jet
aircraft, Geophysical Research Letters 27, 1723-1726.
Ayers, G., Gras, J., 1991. Seasonal Relationship between cloud condensation
nuclei and aerosol methanesulphonate in marine air, Nature 353, 834-835.
Bagley, S.T., Baumgard, K.J., Gratz, L.D., Johnson, J.J., Leddy, D.G., 1996.
Characterization of Fuel and After-Treatment Device Effects on Diesel
Emissions, Health Effects Institute: Research Report No. 76.
Baron, P.A., Willeke, K., Eds. 2001. Aerosol Measurement: Principles,
Techniques and Applications. New York, van Nostrand Reinhold.
Birmili, W., Wiedensohler, A., 2000. Evolution of newly formed aerosol
particles in the continental boundary layer: a case study including OH and
H2SO4 measurements, Geophysical Research Letters 27, 2205-2208.

389
Bukowiecki, N., Dommen, J., Prévôt, A. S. H., Richter, R., Weingartner, E.,
Baltensperger, U., 2002. A mobile pollutant measurement laboratory-
measuring gas phase and aerosol ambient concentrations with high spatial and
temporal resolution , Atmospheric Environment 36, 5569-5579.
Burtscher, H., 2001. Literature study on tailpipe particulate emission
measurement for diesel engines. Particulate Measurement Program
BUWAL/GRPE.
Buzorius, G., Hameri, K., Pekkanen, J. and Kulmala, M., 1999. Spatial
variation of aerosol number concentration in Helsinki city, Atmospheric
Environment 33, 553-565.
Cabada, J.C., Takahama, S., Khlystov, A.Y., Wittig, B., Pandis, S., Rees, S.,
Davidson, C.I., Robinson, A.L., 2004. Mass size distributions and size
resolved chemical composition of fine particulate matter at the Pittsburgh
Supersite, Atmospheric Environment 38(10), 3127-3141.
Casati, R., Scheer, V., Vogt, R., Benter, T., 2007. Measurement of nucleation
and soot mode particle emission from a diesel passenger car in real world and
laboratory in situ dilution, Atmospheric Environment 41, 2125-2135.
Charron, A., Harrison, M., 2003. Primary Particle Formation from Vehicle
Emission During Exhaust Dilution in the Roadside Atmosphere, Atmospheric
Environment 37, 4109-4119.
390
Cheng, M., Tanner, R., 2002. Characterization of Ultrafine and Fine Particles
at a Site Near the Great Smoky Mountains National Park, Atmospheric
Environment 36, 5795-5806.
Clarke, A., Davis, D., Kapustin, V. N., Eisele, F. L., Chen, G., Paluch, I.,
Lenschow, D., Bandy, A.R., Thornton, D., Moore, K., Mauldin, L., Tanner, D.
J., Litchy, M., Carroll, M.A., Collins, J., Albercook, G., 1998. Particle
nucleation in the tropical boundary layer and its coupling to marine sulphur
sources, Science 282, 89-92.
Dahl, A., Gharibi, A., Swietlicki, E., Gudmundsson, A., Bohgard, M.,
Ljungman, A., Blomqvist, G., Gustafsson, M., 2006. Traffic Generated
Emissions of Ultrafine Particles from Pavement-Tire Interface, Atmospheric
Environment 40, 1314-1323.
Dunn, M. J., Jimnez, J. L., Baumgardner, D., Castro, T., Mc-Murry, P. H.,
Smith, J. N., 2004. Measurements of Mexico City nanoparticles size
distributions: Observations of new particle formation and growth,
Geophysical Research Letters 31 31, L10102.
Easter, R.C., Peters, L. K., 1994. Binary homogeneous nucleation:
temperature and relative humidity fluctuations, nonlinearity and aspects of
new particle production in the atmosphere, Journal of Applied Meteorology
33, 775-784.
391
Ebelt, S., Brauer, M., Cyrys, J., Thomas, T., Kreyling, W. G. , Wichmann,
H.E., 2001. Air quality in postunification erfurt, East Germany: Associating
changes in pollutant concentrations with changes in emissions, Environmental
Health Perspectives 109(4), 325-333.
Fine, P., Shen, S., Sioutas, C., 2004. Inferring the sources of fine and ultrafine
particulate matter at downwind receptor sites in the Los Angeles basin using
multiple continuous measurements, Aerosol Science and Technology 38(S1),
182-195.
Gamas, E.D., Diaz, L., Rodriguez, R., Lopez-Salinas, E., Schifter, I., 1999.
Exhaust emissions from gasoline and LPG-powered vehicles operating at the
altitude of Mexico City, Journal of the Air & Waste Management Assoc., 49,
1179-1189.
Garcia-Nieto, P.J., Garcia, B.A., Diaz, J.M.F., Brana, M.A R., 1994.
Parametric study of selective removal of atmospheric aerosol by below-cloud
scavenging, Atmospheric Environment 28, 2335-2342.
Geller, M.D., Kim, S., Misra, C., Sioutas, C., Olson, B. A., Marple, V. A.,
2002. A methodology for measuring size-dependent chemical composition of
ultrafine particles, Aerosol Science and Technology 36, 748-762.

392
Gidhagen, L., Johansson, C., Langner, J., Foltescu, V., 2005. Urban Scale
Modelling of Particle Number Concentration in Stockholm, Atmospheric
Environment 39, 1711-1725.
Gidhagen, L., Johansson, C., Langner, J., Olivares, G., 2004. Simulation of
NOx and Ultrafine Particles in a Street Canyon in Stockholm, Sweden,
Atmospheric Environment 38, 2029-2044.
Gidhagen, L., Johansson, C., Strom, J., Kristensson, A., Swietlicki, E., Pirjola,
L., Hansson, H., 2003. Model simulation of ultrafine particles inside a road
tunnel, Atmospheric Environment 37, 2023-2036.
Gieshaskiel, B., Ntziachristos, L., Samaras, Z., Scheer, V., Casati, R., Vogt,
R., 2005. Formation Potential of Vehicle Exhaust Nucleation Mode Particles
On-Road and in the Laboratory, Atmospheric Environment 39, 2191-2198.
Gouriou, F., Morin, J., Weill, M., 2004. On Road Measurements of Particle
Number Concentrations and Size Distributions in Urban and Tunnel
Environments, Atmospheric Environment 38, 2831-2840.
Gramotnev, G., Brown, R., Ristovski, Z., Hitchins, J., Morawska, L., 2003.
Determination of average emission factors for vehicles on a busy road,
Atmospheric Environment 37(4), 465-474.

393
Gramotnev, G., Ristovski, Z., 2004. Experimental Investigation of Ultrafine
Particle Size Distribution Near a Busy Road, Atmospheric Environment 38,
1767-1776.
Gramotnev, G., Ristovski, Z. D., Brown, R. J., Madl, P., 2004. New methods
of determination of average particle emission factors for two groups of
vehicles on a busy road, Atmospheric Environment 38(16), 2607-2610.
Graskow, B., Kittelson, D. B., Abdul-Khalek, I., Ahmadi, M., Moris, J., 1998.
Characterisation of Exhaust Particulate Emissions from a Spark Ignition
Engine, SAE Paper 980528, 155-165.
Grose, M., Sakurai, H., Savstrom, J., Stolzenburg, M. R., Watts, W.F.,
Morgan, C. G., Murray, I.P., Twigg, M.V., Kittelson, D.B., McMurry, P.H.,
2006. Chemical and physical properties of ultrafine diesel exhaust particles
sampled downstream of a catalytic trap, Environmental Science &
Technology 40, 5502-5507.
Hameri, K., Kulmala, M., Aalto, P., Leszczynski, K., Visuri, R., Hamekoski,
K., 1996. The Investigations of Aerosol Particle Formation in Urban
Background of Helsinki, Atmospheric Research 41, 281-298.
Hara, K., Nakae, S., Miura, K., 1997. Properties of ion nucleation in the
atmosphere, Atmospheric Electricity 17, 53-58.

394
Hara, K., Nakae, S., Miura, K., 1998. Properties of ion-induced nucleation
obtained from mobility measurements, Journal of Aerosol Science 29, S139-
140.
Harayama, N., 1992. Effects of sulfate adsorption on performance of diesel
oxidation catalysts. SAE Technical Paper Series, Society of Automotive
Engineers, No. 920852.
Harris, S.J., Maricq, M.M., 2001. Signature size distributions for diesel and
gasoline engine exhaust particulate matter, Journal of Aerosol Science 32,
749-764.
Harrison, R., Jones, M., Collins, G., 1999. Measurements of the Physical
Properties of Particles in the Urban Atmosphere, Atmospheric Environment
33, 309-321.
Harrison, R.M., Yin, J., Mark, D., Stedman, J., Appleby, R.S., Booker, J.,
Moorcroft, S., 2001. Studies of the coarse particle (2.5-10 μm) component in
UK urban atmospheres, Atmospheric Environment 35, 3667-3679.
Hitchins, J., Morawska, L., Gilbert, D., Jamriska, M., 2002. Dispersion of
particles from vehicle emissions around high- and low-rise buildings, Indoor
Air 12(1), 64-71.

395
Hitchins, J., Morawska, L., Wolff, R., Gilbert, D., 2000. Concentrations of
submicrometre particles from vehicle emissions near a major road,
Atmospheric Environment 34(1), 51-59.
Holmen, B.A., Ayala, A., 2002. Ultrafine PM emissions from natural gas,
oxidation catalyst diesel and particle trap diesel heavy-duty transit buses,
Environmental Science & Technology 36, 5041-5050.
Holmes, N., 2007. A Review of Particle Formation Events and Growth in the
Atmosphere in the Various Environments and Discussion of Mechanistic
Implications, Atmospheric Environment 41, 2183-2201.
Holmes, N.S., Morawska, L., Mengersen, K., Jayaratne, R., 2005. Spatial
distribution of submicrometre particles and CO in an urban microscale
environment, Atmospheric Environment 39(22), 3977-3988.
Hussein, T., Hameri, K., Aalto, P., Paatero, P., Kulmala, M., (2005a). Modal
structure and spatial-temporal variations of urban and suburban aerosols in
Helsinki-Finland, Atmospheric Environment 39, 1655-1668.
Hussein, T., Hameri, K., Heikkinen, M., Kulmala, M., 2005b. Indoor and
outdoor particle size characterisation at a family house in Espoo, Finland,
Atmospheric Environment 39, 3697-3709.

396
Hussein, T., Puustinen, A., Aalto, P., Makela, J., Hameri, K., Kulmala, M.,
2004. Urban Aerosol Number Size Distributions, Atmospheric Chemistry and
Physics Discussions 4, 391-411.
Imhof, D., Weingartner, E., Ordonez, C., Gerhig, R., Hill, M., Buchmann, B.,
Baltersperger, U., 2005a. Real World Emission Factors of Fine and Ultrafine
Aerosol Particles for Different Traffic Situations in Switzerland,
Environmental Science and Technology 39, 8341-8350.
Imhof, D., Weingartner, E., Prevot, A., Ordonez, C., Kurtenbach, R., Wiesen,
P., Rodler, J., Sturm, P., McCrae, I., Sjodin, A., Baltersperger, U., 2005b.
Aerosol and NOx Emission Factors and Submicron Particle Number Size
Distributions in Two Road Tunnels with Different Traffic Regimes,
Atmospheric Chemistry and Physics Discussions 5, 5127-5166.
Jacobson, M., Kittelson, D., Watts, W., 2005. Enhanced coagulation due to
evaporation and its effect on nanoparticle evolution, Environmental Science &
Technology 39, 9486-9492.
Jamriska, M., Morawska, L., 2001. A model for determination of motor
vehicle emission factors from on-road measurements with a focus on
submicrometer particles, The Science of The Total Environment 264(3), 241-
255.

397
Jamriska, M., Morawska, L., Mengersen, K., 2007. The Effect of Temperature
and Relative Humidity on size Generated Traffic Exhaust Particle Emissions,
Atmospheric Environment, Submitted.
Jamriska, M., Morawska, L., Thomas, S., He, C., 2004. Diesel bus emissions
measured in a tunnel study, Environmental Science & Technology 38, 6701-
6709.
Janhall, S., Jonsson, A., Molnar, P., Svensson, E., Hallquist, M., 2004. Size
Resolved Traffic Emissions Factors of Submicrometer Particles, Atmospheric
Environment 38, 4331-4340.
Janhall, S., Olofson, F., Andersson, P., Pettersson, J., Hallquist, M., 2006.
Evolution of the Urban Aerosol During Winter Temperature Inversion
Episodes, Atmospheric Environment 40: 5355-5366.
Jeong, C., Hopke, P., Chalupa, D., Utell, M., 2004. Characteristics of
Nucleation and Growth Events of Ultrafine Particles Measured in Rochester
NY, Environmental Science and Technology 38, 1933-1940.
Jones, A., Harrison, R., 2006. Estimation of the emission factors of particle
number and mass fractions from traffic at a site where mean vehicle speeds
vary over short distances, Atmospheric Environment 40, 7125-7137.

398
Jung, H., Kittleson, D., 2005. Measurement of electrical charge on diesel
particles, Aerosol Science and Technology 39, 1129-1135.
Junker, M., Kasper, M., Roosli, M., Camenzind, M., Kunzli, N., Monn, C.,
Theis, G., Braun, C., 2000. Airborne particle number profiles, particle mass
distribution and particle bound PAH concentrations within the city
environment of Basle: An assessment of the BRISKA project, Atmospheric
Environment 43(19), 3171-3181.
Kasper, M., 2005. Sampling and measurement of nanoparticle emissions for
type approval and field control. SAE Technical Paper Series, Society of
Automobile Engineers, No. 2005-26-013.
Kaur, S., Clark, R., Walsh, P., Arnold, S., Colvile, R., Nieuwenhuijsen, M.,
2006. Exposure visualisation of ultrafine particle counts in a transport
microenvironment, Atmospheric Environment 40, 386-398.
Kawai, T., Goto, Y., Odaka, M., 2004. Influence of dilution process on engine
exhaust nanoparticles. SAE Technical Paper Series, Society of Automobile
Engineers, No. 2004-01-0963.
Keeler, G., 2004. Characterization of ultrafine particle number concentration
and size distribution during a summer campaign in southwest Detroit, Journal
of the Air and Waste Management Association 54, 1079-1090.

399
Keogh, D., Kelly, J., Mengersen, K., Morawska, L., Jayaratne, E.R., 2007.
Emission factors for estimating motor vehicle particle emissions in urban
areas, Environmental Science & Technology, Submitted. This paper is now
published in ESPR - see:- Keogh, D.U., Kelly, J., Mengersen, K., Jayaratne,
R., Ferreira, L., Morawska, L., 2009. Derivation of motor vehicle tailpipe
particle emission factors suitable for modelling urban fleet emissions and air
quality assessments. Environmental Science and Pollution Research –
International. Published online, doi 0.1007/s11356-009-0210-9.
Kerminen, V.-M., L.,P., Kulmala, M., 2001. How significantly does
coagulational scavenging limit atmospheric particle production?, Journal of
Geophysical Research 106, 24119-24125.
Ketzel, M., Wahlin, P., Berkowicz, R., Palmgren, F., 2003. Particle and trace
gas emission factors under urban driving conditions in Copenhagen based on
street and roof-level observations, Atmospheric Environment 37(20), 2735-
2749.
Ketzel, M., Whalin, P., Kristensson, A., Swietlicki, E., Berkowicz, R.,
Nielsen, O., Palmgren, F., 2004. Particle Size Distribution and Particle Mass
Measurement at Urban, Near City and Rural Level in the Copenhagen Area
and Southern Sweden, Atmospheric Chemistry and Physics 4, 281-292.
400
Khalek, I.A., Kittleson, D., Brear, F., 1998. Diesel exhaust particle size:
Measurement issues and trends. SAE Technical Paper Series, Society of
Automobile Engineers, No. 980525, 133-145.
Khalek, I.A., Kittleson, D., Brear, F., 1999. The influence of dilution
conditions on diesel exhaust particle size distribution measurements. SAE
Technical Paper Series, Society of Automobile Engineers, No. 1999-01-1142.
Khalek, I. A., Kittleson, D., Brear, F., 2000. Nanoparticle growth during
dilution and cooling of diesel exhaust: Experimental investigation and
theoretical assessment. SAE Technical Paper Series 2000, Society of
Automobile Engineers, No. 2000-01-0515.
Kim, S., Shen, S., Sioutas, C., Zhu, Y., Hinds, W. C., 2002. Size Distribution
and Diurnal and Seasonal Trends of Ultrafine Particles in Source and Receptor
Sites of the Los Angeles Basin, Air & Waste Manage Association 52, 297-
307.
Kirchstetter, T.W., Harley, R.A., Kreisberg, N.M., Stolzenberg, M R. and
Hering, S.V., 1999. On-road measurement of fine particle and nitrogen oxide
emissions from light- and heavy-duty motor vehicles, Atmospheric
Environment 33, 2955-2968.
Kittelson, B.D., 1998. Engines and Nanoparticles: a Review, Journal of
Aerosol Science 29(5), 575-588.

401
Kittelson, D., Watts, W., Johnson, J. , 2006a. On-road and laboratory
evaluation of combustion aerosols - Part1: Summary of diesel engine results,
Journal of Aerosol Science 37, 913-930.
Kittelson, D., Watts, W., Johnson, J., 2006b. On-road and laboratory
evaluation of combustion aerosols - Part 2: Summary of spark ignition engine
results, Journal of Aerosol Science 37, 931-949.
Kittelson, D.B., Watts, W.F. , Johnson, J., 2002. Diesel Aerosol Sampling
Methodology - CRC E-43, Final Report, University of Minnesota, Report for
the Coordinating Research Council.
Kittelson, D.B., Watts, W.F., Johnson, J.P., 2004. Nanoparticle emissions on
Minnesota highways, Atmospheric Environment 38, 9-19.
Kittleson, D., Pui, D.Y H., Moon, K.C., 1986. Electrostatic collection of
diesel particles. SAE Technical Paper Series, Society of Automotive
engineers, No. 860009.
Korhonen, P., Kulmala, M., Laaksonen, A., Viisanen, Y., McGraw, R.,
Seinfeld, J.H., 1999. Ternary nucleation of H2SO4, NH3, and H2O in the
atmosphere, Journal of Geophysical Research 104, 26349-26353.
Kuhler, M., Kraft, J., Bess, H.U.H., Schurmann, D., 1994. Comparison
between measured and calculated concentrations of nitrogen oxides and ozone
in the vicinity of a motorway, Science of the Total Environment 147, 387-394.

402
Kuhn, T., Krudysz, M., Zhu, Y., Fine, P., Hinds, W., Froines, J., Sioutas, C.,
2005. Volatility of indoor and outdoor ultrafine particulate matter near a
freeway, Journal of Aerosol Science 36, 291-302.
Kulmala, M., Pirjola, L., Makela, J., 2000. Stable sulphate clusters as a source
of new atmospheric particles, Nature 404, 66-69.
Kulmala, M., Vehkamaki, H., Petaja, T., Dal Maso, M., Lauri, A., Kerminen,
V., Birmilli, W., McMurry, P., 2004. Formation and Growth Rates of
Ultrafine Atmospheric Particles: A Review of Observations, Journal of
Aerosol Science 35, 143-176.
Kulmama, M., 2003. How Particles Nucleate and Grow, Science 302, 1000-
1001.
Kwon, S., Lee, K. W., Saito, K., Shinozaki, O., Seto, T., 2003. Size-dependent
volatility of diesel nanoparticles: Chassis dynamometer experiments,
Environmental Science & Technology 37, 1794-1802.
Laakso, L., Hussein, T., Aarino, P., Komppula, M., Hiltunen, V., Viisanen,
Y., Kulmala, M., 2003. Diurnal and Annual Characteristics of Particle Mass
and Number Concentrations in Urban, Rural and Arctic Envrionments in
Finland, Atmospheric Environment 37, 2629-2641.

403
Lin, C., Chen, S., Huang, K., Lee, W., Lin, W., Liao, C., Chaung, H., Chiu,
C., 2007. Water Soluble Ions in Nano/Ultrafine/Fine/Coarse Particles
Collected Near a Busy Road and at a Rural Site, Environmental Pollution 145,
562-570.
Longley, I., Gallagher, M., Dorsey, J., Flynn, M., Allan, J., Alfarra, M., Inglis,
D., 2003. A Case Study of Aerosol (4.6 nm < Dp < 10 um) Number and Mass
Size Distribution Measurements in a Busy Street Canyon in Manchester, UK,
Atmospheric Environment 37, 1563-1571.
Lyyranen, J., Jokiniemi, J., Kauppinen, E. I., Backman, U., Vesala, H., 2004.
Comparison of different dilution methods for measuring diesel particle
emissions, Aerosol Science and Technology 38, 12-23.
Maricq, M.M., 2006. On the electrical charge of motor vehicle exhaust
particles, Journal of Aerosol Science 37, 858-874.
Maricq, M.M., Chase, R. E., Xu, N., Laing, P.M., 2002. The effects of the
catalytic converter and fuel sulphur level on motor vehicle particulate matter
emissions, Environmental Science & Technology 36, 283-289.
Marti, J., Weber, R., 1997. New particle formation at a remote continental
site: assessing the contributions of SO2 and organic precursors, Journal of
Geophysical Research - Atmospheres 102, 6331-6339.

404
Mathis, U., Ristimaki, J., Mohr, M., Keskinen, J., Ntziachristos, L., Samaras,
Z., Mikkanen, P., 2004. Sampling conditions for the measurement of
nucleation mode particles in the exhaust of a diesel vehicle, Aerosol Science
and Technology 38, 1149-1160.
McFiggans, G., 2005. Atmospheric science: Marine aerosols and iodine
emissions, Nature 433(E13).
McMurry, P., 2000. A Review of Atmospheric Aerosol Measurements,
Atmospheric Environment 34, 1959-1999.
McMurry, P., Woo, K., 2002. Size Distributions of 3-10nm Urban Atlanta
Aerosols: Measurements and Observations, Journal of Aerosol Medicine 15,
169-178.
Mejia, J., Morawska, L., Mengersen, K., 2007a. Spatial variation in particle
number size distribution in a large metropolitan area, Atmospheric Chemistry
and Physics, Submitted.
Mejia, J., Wraith, D., Mengersen, K., Morawska, L., 2007b. Trends in size
classified particle number concentration in subtropical Brisbane, Australia,
based on a five year study, Atmospheric Environment 41, 1064 - 1079.
Meyer, N., Ristovski, Z., Jayaratne, R., 2006. Volatile Properties of CNG and
Diesel Bus Emissions Produced During Steady State and Transient Driving
Modes. 10th ETH-Conference on Combustion Generated Nanoparticles.
405
Meyer, N.K., Ristovski, Z.D., 2007. Ternary Nucleation as a Mechanism for
the Production of Diesel Nanoparticles: Experimental Analysis of the Volatile
and Hygroscopic Properties of Diesel Exhaust Using the Volatilization and
Humidification Tandem Differential Mobility Analyzer, Environmental
Science & Technology 41, 7309 - 7314.
Mirme, A., Tamm, E., Mordas, G., Vana, M., Uin, J., Mirme, S., Bernotas, T.,
Laakso, L., Hirsikko, A., Kulmala, M., 2007. A wide-range multi-channel Air
Ion Spectrometer, Boreal Environmental Research 12, 247-264.
Mohr, M., Lehmann, U., 2003. Comparison Study of Particle Measurement
Systems for Future Type Approval Application, Swiss Contribution to GRPE
Particulate Measurement Program (GRPE-PMP CH5). EMPA Report No.
202779
Molnar, P., Janhall, S., Hallquist, M., 2002. Roadside Measurements of Fine
and Ultrafine Particles at a Major Road North of Gothenburg, Atmospheric
Environment 36, 4115-4123.
Monkkonen, P., Koponen, I., Lehtinen, K., Hameri, K., Uma, R., Kulmala,
M., 2005. Measurements in a highly polluted Asian mega city: Observations
of aerosol number size distribution, modal parameters and nucleation events,
Atmospheric Chemistry and Physics 5, 57-66.

406
Morawska, L., 2003. Motor vehicle emissions as a source of indoor particles.
Indoor Environment, Airborne Particles and Settled Dust. L. Morawska and T.
Salthammer. Weinheim, Germany, WILEY-VCH.
Morawska, L., Bofinger, N., Kocis, L., Nwankowala, A., 1998a. Submicron
and supermicron particulates from diesel vehicle emissions, Environmental
Science & Technology 32, 2033-2042.
Morawska, L., Hofmann, W., Thomas, S., Ristovski, Z.D., Jamriska, M.,
Rettenmoser, T., Kagerer, S., 2004. Exploratory cross sectional investigations
on ambient submicrometer particles in the alpine region of Salzburg, Austria,
Atmospheric Environment 38(21), 3529-3533.
Morawska, L., Jamriska, M., Thomas, S., Ferreira, L., Mengersen, K., Wraith,
D., McGregor, F., 2005. Quantification of particle number emission factors
for motor vehicles from on-road measurements, Environmental Science &
Technology 39, 9130-9139.
Morawska, L., Jayaratne, E. R., Mengersen, K., 2002. Differences in airborne
particle and gaseous concentrations in urban air between weekdays and
weekends, Atmospheric Environment 36, 4375-4383.
Morawska, L., Johnson, G., Ristovski, Z.D., Agranovski, V., 1999a. Relation
between particle mass and number for submicrometer airborne particles,
Atmospheric Environment 33, 1983-1990.

407
Morawska, L., Keogh, D., Thomas, S., Mengersen, K., Wilson, W., 2007a.
Modality in ambient particle size distributions and its potential as a basis for
developing air quality regulation, Atmospheric Environment, 42 (7), 1617-
1628.
Morawska, L., Ristovski, Z., Johnson, G., Jayaratne, R., Mengersen, K.,
2007b. A Novel Method for On Road Emission Factor Measurements Using a
Plume Capture Trailer, Environmental Science & Technology 41, 574-579.
Morawska, L., Thomas, S., Bofinger, N. D., Wainwright, D., Neale, D.,
1998b. Comprehensive characterisation of aerosols in a subtropical urban
atmosphere: particle size distribution and correlation with gaseous pollutants,
Atmospheric Environment 32(14/15), 2461-2478.
Morawska, L., Thomas, S., Gilbert, D., Greenaway, C., Rijnders, E., 1999b. A
study of the horizontal and vertical profile of submicrometer particles in
relation to a busy road, Atmospheric Environment 33(8), 1261-1274.
Morawska, L., Thomas, S., Jamriska, M., Johnson, G., 1999c. The modality of
particle size distributions of environmental aerosols, Atmospheric
Environment 33(27), 4401-4411.
Morawska, L., Vishvakarman, D., Swanson, C., 2007c. Diurnal variation of
PM10 concentrations and its spatial distribution in the South East Queensland
airshed, Clean Air, Submitted.

408
Napari, I., Noppel, M., 2002. An improved model for ternary nucleation of
sulfuric acid-ammonia-water, Journal of Chemical Physics 116, 4221-4227.
Nitta, H., Sato, T., Nakai, S., Maeda, K., Aoki, S., Ono, M., 1993. Respiratory
health associated with exposure to automobile exhaust. I. Results of cross-
sectional studies in 1979, 1982, and 1983, Archives of Environmental Health
48, 53-58.
Ntziachristos, L., Ning, Z., Geller, M.D., Sioutas, C., 2007. Particle
concentration and characteristics near a major freeway with heavy duty diesel
traffic, Environmental Science & Technology 41, 2223-2230.
O'Dowd, C., Aalto, P., Hameri, K., Kulmala, M. , Hoffmann, T., 2002.
Aerosol formation - Atmospheric particles from organic vapours, Nature 416.
O'Dowd, C., Facchini, M. C., Cavalli, F., Ceburnis, D., Mircea, M., Decesari,
S., Fuzzi, S., Yoon, Y.J., Putaud, J.P., 2004. Biogenically driven organic
contribution to marine aerosol, Nature 431, 676-680.
O'Dowd, C., Hoffmann, T., 2005. Coastal New Particle Formation: A Review
of the Current State-Of-The-Art, Environmental Chemistry 2, 245-255.
Paatero, P., Aalto, P., Picciotto, S., Bellander, T., Castano, G., Cattani, G.,
Cyrys, J., Kulmala, M., Lanki, T., Nyberg, F., Pekkanen, J., Peters, A.,
Sunyer, J., Forastiere, F., 2005. Estimating Time Series of Aerosol Particle

409
Numner Concentrations in Five HEAPSS Cities on the Basis of Measured Air
Pollution and Meterological Variables, Atmospheric Environment 39, 2261-
2273.
Pakkanen, T., Kerminen, V., Korhonen, C., Hillamo, R., Aarino, P.,
Koskentalo, T., Maenhaut, W., 2001. Urban and Rural Ultrafine (PM0.1)
Particles in the Helsinki Area, Atmospheric Environment 35, 4593-4607.
Pierson, W., Brachaczek, W.W., 1974. Airborne particulate debris from
rubber tyres, Rubber Chemistry and Technology 47, 1275-1299.
Pirjola, I., Paasonen, P., Pfeiffer, D., Hussein, T., Hameri, K., Koskentalo, T.,
Virtanen, A., Ronkko, T., Keskinen, J., Pakkanen, T., Hillamo, R., 2006.
Dispersion of Particles and Trace Gases Nearby a City Highway: Mobile
Laboratory Measurements in Finalnd, Atmospheric Environment 40, 867-879.
Pirjola, L., Laaksonen, A., Aalto, P., Kulmala, M., 1998. Sulfate aerosol
formation in the Arctic boundary layer, Journal of Geophysical Research 10,
8309-8322.
Pirjola, L., Parviainen, H., Hussein, T., Valli, A., Hameri, K., Aalto, P.,
Virtanen, A., Keskinen, J., Pakkanen, T., Makela, J., Hillamo, R., 2004.
"Sniffer" - A novel tool for chasing vehicles and measuring traffic pollutants,
Atmospheric Environment 38, 3625-3635.
410
Pitz, M., Kreyling, W., Holscher, B., Cyrys, J., Wichmann, H., Heinrich, J.,
2001. Change of the Ambient Particle Size Distribution in East Germany
between 1993 and 1999, Atmospheric Environment 35, 4357-4366.
Pohjola, M., Pirjola, L., Kukkonen, J., Kulmala, M., 2003. Modelling the
influence of aerosol processes for the dispersion of vehicular exhaust plumes
in a street environment, Atmospheric Environment 37, 339-351.
Pope, C.A., Burnett, R.T., Thun, M.J., Calle, E.E., Krewski, D., Ito, K.,
Thurston, G. D., 2002. Lung cancer, cardiopulmonary mortality, and long-
term exposure to fine particulate air pollution, Journal of the American
Medical Association 287(9), 1132-1141.
Raes, F., 1995. Entrainment of free tropospheric aerosols as a regulating
mechanism for cloud condensation nuclei in the remote marine boundary
layer, Journal of Geophysical Research 100, 2893-2904.
Rickeard, D J., Bateman, J.R., Kwon, Y.K., McAughey, J.J., Dickens, C.J.,
1996. Exhaust Particulate Size Distribution: Vehicle and Fuel Influence in
Light Duty Vehicles, SAE Papers, 961980 97-111.
Riipinen, S., Kulmala, M., Arnold, F., Dal Maso, M., Birmili, W., Saarnio, K.,
Teinil¨a, K., Kerminen, V., Laaksonen, A., Lehtinen, K., 2007. Connections
between atmospheric sulphuric acid and new particle formation during

411
QUEST III-IV campaigns in Heidelberg and Hyytiala, Atmospheric
Chemistry and Physics 7, 1899-1914.
Ristovski, Z., Jayaratne, E.R., Lim, M., Ayoko, G.A., Morawska, L., 2006.
Influence of diesel fuel sulphur on the nanoparticle emissions from city buses,
Environmental Science & Technology 40, 1314-1320.
Ristovski, Z.D., Jayaratne, E.R., Morawska, L., Ayoko, G.A., Lim, M., 2005.
Particle and carbon dioxide emissions from passenger vehicles operating on
unleaded petrol and LPG fuel, Science of the Total Environment 345(1-3), 93-
98.
Ristovski, Z.D., Morawska, L., Ayoko, G. A., Johnson, G., Gilbert, D.,
Greenaway, C., 2004. Emissions from a vehicle fitted to operate on either
petrol or compressed natural gas, Science of the Total Environment 323(1-3),
179-194.
Rodriguez, S., van Dingenen, R., Putaud, J., Martins-Dos Santos, S., Roselli,
D., 2005. Nucleation and Growth of New Particles in the Rural Atmosphere
of Northern Italy - Relationship to Air Quality Monitoring, Atmospheric
Environment 39, 6734-6746.
Ronkko, T., Virtanen, A., Vaaraslahti, K., Koskinen, J., Pirjola, L., Lappi, M.,
2006. Effect of dilution conditions and driving parameters on nucleation mode
particles in diesel exhaust: Laboratory and on-road study, Atmospheric
Environment 40, 2893-2901.
412
Roorda-Knape, M. C., Janssen, N.A.H., de Hartog, J.J., van Vliet, P.H.N.,
Harssema, H., Brunekreef, B., 1998. Air pollution from traffic in city districts
near major motorways, Atmospheric Environment 32(11), 1921-1930.
Rosenbohm, E., Vogt, R., Scheer, V., Nielsen, O., Drieseidler, A., Baumbach,
G., Imhof, D., Baltensperger, U., Fuchs, J., Jaeschke, W., 2005. Particulate
size distributions and mass measured at a motorway during the BAB II
campaign, Atmospheric Environment 39, 5696-5709.
Ruuskanen, J., Tuch, T., Brink, H., Peters, A., Khlystov, A., Mirme, A., Kos,
G., Brunekreef, B., Wickmann, H., Buzorious, Z., Vallius, M., Kreyling, W.,
Pekkanen, J., 2001. Concentrations of Ultrafine, Fine and PM2.5 Particles in
Three European Cities, Atmospheric Environment 35, 3729-3738.
Sakurai, H., Tobias, H., Park, K., Zarling, D., Docherty, K.S., Kittleson, D.,
McMurray, P., Ziemann, P.J., 2003. On-line measurements of diesel
nanoparticle composition and volatility, Atmospheric Environment 37, 1199-
1210.
Salma, I., Dal Maso, M., Kulmala, M., Zaray, G., 2002. Modal characteristics
of particulate matter in urban atmospheric aerosols, Microchemical Journal
73, 19-26.

413
Sardar, S.B., Fine, P.M., Mayo, P.R., Sioutas, C., 2005. Size-Fractionated
Measurements of Ambient Ultrafine Particle Chemical Composition in Los
Angeles Using the NanoMOUDI, Environmental Science and Technology 39,
932-944.
Schneider, J., Hock, N., Weimer, S., Borrmann, S., 2005. Nucleation particles
in diesel exhaust: Composition inferred from in situ mass spectrometric
analysis, Environmental Science & Technology 39, 6153-6161.
Shi, J., Evans, D., Khan, A., Harrison, R., 2001a. Sources and Concentration
of Nanoparticles (<10nm Diameter) in the Urban Atmosphere, Atmospheric
Environment 35, 1193-1202.
Shi, J., Harrison, R., Evans, D., 2001b. Comparison of Ambient Particle
Surface Area Measurement by Epiphaniometer and SMPS/APS, Atmospheric
Environment 35, 6193-6200.
Shi, J., Harrison, R.M., 1999. Investigation of ultrafine particle formation
during diesel exhaust dilution, Environmental Science & Technology 33,
3730-3736.
Shi, J.P., Khan, A.A., Harrison, R.M., 1999. Measurements of ultrafine
particle concentrations and size distribution in the urban atmosphere, The
Science of the Total Environment 235, 51-64.

414
Shi, Q., 2003. Aerosol size distributions (3 nm to 3 μm) measured at the St.
Louis Supersite (4/1/01-4/30/02), Department of Mechanical Engineering.
Minneapolis, University of Minnesota.
Stanier, C., Khlystov, A., Pandis, S., 2004a. Ambient Aerosol Size
Distributions and Number Concentrations Measured During the Pittsburgh Air
Quality Study (PAQS), Atmospheric Environment 38, 3275-3284.
Stanier, C., Khlystov, A., Pandis, S., 2004b. Nucleation events during the
Pittsburgh air quality study: Description and relation to key meteorological,
gas phase, and aerosol parameters, Aerosol Science and Tecnhology 38 (S1),
253-264.
Sturm, P., Baltensperger, U., Bacher, M., Lechner, B., Hausberger, S., Heiden,
B., Imhof, D., Weingartner, E., Prevot, A., Kurtenbach, R., Wiesen, P., 2003.
Roadside measurements of particulate matter size distribution, Atmospheric
Environment 37, 5273-5281.
Suni, T., Kulmala, M., Hirsikko, A., Bergman, T., Laakso, L., Aalto, P.,
Leuning, R., Cleugh, H., Zegelin, S., Hughes, D., van Gorsel, E., Kitchen, M.,
Vana, M., Hõrrak, U., Mirme, S., Mirme, A., Twining, J., Tadros, C., 2007.
Formation and characteristics of ions and charged aerosol particles in a native
Australian Eucalypt forest, Atmospheric Chemistry and Physics Discussions
7, 10343-10369.
415
Thomas, S., Morawska, L., 2002. Size selected particles in an urban
atmosphere in Brisbane, Australia, Atmospheric Environment 36(26), 4277-
4288.
Tobias, H.J., Beving, D.E., Ziemann, P.J., Sakurai, H., Zuk, M., McMurry, P.,
Zarling, D., Waytulonis, R., Kittelson, D.B., 2001. Chemical Analysis of
Diesel Engine Nanoparticles Using a Nano-DMA / Thermal Desorption
Particle Beam Mass Spectrometer, Environmental Science & Technology 35,
2233-2243.
Tuch, T., Brand, P., Wichmann, H., Heyder, J., 1997. Variation of Particle
Number and Mass Concentration in Various Size Ranges of Ambient Aerosols
in Eastern Germany, Atmospheric Environment 31, 4193-4197.
Tunved, P., Hansson, H., Kerminen, V., Strom, J., Dal Maso, M., Lihavainen,
H., Viisanen, Y., Aalto, P., Komppula, M., Kulmala, M., 2006. High natural
aerosol loading over boreal forests, Science 312, 261-263.
Tunved, P., Hansson, H., Kulmala, M., Aalto, P., Viisanen, Y., Karlsson, H.,
Kristensson, A., Swietlicki, E., Maso, M., Strom, J., Komppula, M., 2003.
One Year Boundary Layer Aerosol Size Distribution Data from Five Nordic
Background Stations, Atmospheric Chemistry and Physics Discussions 3,
2183-2205.

416
Turpin, B.J., Hutzincker, J.J., 1995. Identification of Secondary Organic
Aerosol Episodes and Quantitation of Primary and Secondary Organic
Aerosol Concentrations during SCAQS, Atmospheric Environment 29(23),
3527-3544.
Vaaraslahti, K., Keskinen, J., Gieshaskiel, B., Solla, A., Murtonen, T. ,
Vesala, H., 2005. Effect of lubricant on the formation of heavy duty diesel
exhaust nanoparticles, Environmental Science & Technology 39, 8497-8504.
Vaaraslahti, K., Virtanen, A., Ristimaki, J., Keskinen, J., 2004. Nucleation
mode formation in heavy-duty diesel exhaust with and without a particulate
filter, Environmental Science & Technology 38, 4484-4890.
Vakeva, M., Hameri, K., Kulmala, M., Lahdes, R., Ruuskanen, J., Laitinen,
T., 1999. Street level versus rooftop concentrations of submicron aerosol
particles and gaseous pollutants in an urban street canyon, Atmospheric
Environment 33, 1385-1397.
Vardoulakis, S., Fisher, B. E. A., Pericleous, K., Gonzalez-Flesca, N., 2003.
Modeling air quality in street canyons: a review, Atmospheric Environment
37, 155 -182.
Vignati, E., Berkowicz, R., Palmgren, F., Lyck, E., Hummelshoj, P., 1999.
Transformation of size distributions of emitted particles in streets. The
Science of The Total Environment 235, 37-49.

417
Virtanen, A., Ronkko, T., Kannosto, J., Ristimaki, J., Makela, J., Keskinen, J.,
Pakkanen, T., Hillamo, R., Pirjola, L., Hameri, K., 2006. Winter and Summer
Time Distributions and Densities of Traffic Related Aerosol Particles at a
Busy Highway in Helsinki, Atmospheric Chemistry and Physics 6, 2411-
2421.
Vogt, R., Scheer, V., Casati, R., Benter, T., 2003. On-road measurement of
particle emissions in the exhaust plume of a diesel passenger car,
Environmental Science & Technology 37, 4070-4076.
Wahlin, P., Palmgren, F., Dingenen, R., Raes, F., 2001. Pronounced Decrease
of Ambient Particle Number Emissions from Diesel Traffic in Denmark After
Reduction of the Sulphur Content in Diesel Fuel, Atmospheric Environment
35, 3549-3552.
Wåhlin, P., Palmgren, F., Van Dingenen, R., 2001. Experimental studies of
ultrafine particles in streets and the relationship to traffic, Atmospheric
Environment 35, S63-S69.
Watson, J.G., Chow, J.C., Lowenthal, D.H., Kreisberg, N.M., Hering, S.V.,
Stolzenburg, M.R., 2005. Variations of nanoparticle concentrations at the
Fresno Supersite, Science of The Total Environment 358, 178-187.

418
Weber, R., Marti, J.J., McMurray, P., Eisele, F.L., Tanner, D.J. and Jefferson,
A. , 1996. Measured atmospheric new particle formation rates: Implications
for nucleation mechanisms, Chemical Engineering Communications 151, 53-
64.
Weber, R., Marti, J.J., McMurray, P., Eisele, F.L., Tanner, D.J., Jefferson, A.,
1997. Measurement of new particle formation and ultrafine particle growth
rates at a clean continental site, Journal of Geophysical Research 102, 4375-
4386.
Wehner, B., Birmili, W., Gnauk, T., Wiedensohler, A., 2002. Particle number
size distributions in a street canyon and their transformation into the urban-air
background: measurements and a simple model study, Atmospheric
Environment 36(13), 2215-2223.
Wehner, B., Wiedensohler, A., 2003. Long Term Measurements of
Submicrometer Urban Aerosols: Statistical Analysis for Correlations with
Meteorological Conditions and Trace Gases, Atmospheric Chemistry and
Physics Discussions 3, 867-879.
Westerdahl, D., Fruin, S., Sax, T., Fine, P., Sioutas, C., 2005. Mobile platform
measurements of ultrafine particles and associated pollutant concentrations on
freeways and residential streets in Los Angeles, Atmospheric Environment 39,
3597-3610.

419
WHO (2005). Guidelines for Air Quality. World Health Organization.
Wiedensohler, A., Wehner, B., Birmili, W., 2002. Aerosol number
concentrations and size distributions at mountain rural, urban-influenced rural
and urban-background sites in Germany, Journal of Aerosol Medicine 15(2),
237-243.
Woo, K.S., Chen, D.R., Pui, D.Y.H., McMurry, P.H., 2001a. Measurement of
Atlanta Aerosol Size Distributions: Observation of ultrafine particle events,
Aerosol Science and Technology 34(1), 75-87.
Woo, K.S., Chen, D.R., Pui, D.Y.H., Wilson, W.E., 2001b. Use of continuous
measurements of integral aerosol parameters to estimate particle surface area,
Aerosol Science and Technology 34(1), 57-65.
Young, L., Keeler, G., 2004. Characterization of Ultrafine Particle Number
Concentration and Size Distribution During a Summer Campaign in
Southwest Detroit, Journal of the Air & Waste Management Assoc. 54, 1079-
1090.
Yu, F., 2001. Chemiions and nanoparticle formation in diesel engine exhaust,
Geophysical Research Letters 28, 4191-4194.
Yu, F., Lanni, T., Frank, B.P., 2004. Measurements of ion concentration in
gasoline and diesel engine exhaust, Atmospheric Environment 38, 1417-1423.

420
Yu, F., Turco, R.P., 1997. The role of ions in the formation and evolution of
particles in aircraft plumes, Geophysical Research Letters 24, 1927-1930.
Yu, F., Turco, R.P., 2000. Ultrafine aerosol formation via ion-mediated
nucleation, Geophysical Research Letters 27, 883-886.
Yu, F., Turco, R.P., 2001. From molecular clusters to nanoparticles: Role of
ambient ionisation in tropospheric aerosol formation, Journal of Geophysical
Research 106(D5), 4797-4814.
Zhang, K., Wexler, A., 2004a. Evolution of Particle Number Distribution Near
Roadways Part I: Analysis of Aerosol Dynamics and its Implications for
Engine Emission Measurement, Atmospheric Environment 38, 6643-6653.
Zhang, K., Wexler, A., 2004b. Modeling the Number Distributions of Urban
and Regional Aerosols: Theoretical Foundations, Atmospheric Environment
(38), 1863-1874.
Zhang, K., Wexler, A., Niemeier, D., Zhu, Y., Hinds, W., Sioutas, C., 2005.
Evolution of Particle Number Distribution Near Roadways Part III: Traffic
Analysis and On-Road Size Resolved Particulate Emission Factors,
Atmospheric Environment 39, 4155-4166.
421
Zhang, K., Wexler, A., Zhu, Y., Hinds, W., Sioutas, C., 2004a. Evolution of
Particle Number Distribution Near Roadways Part II: The Road-to-Ambient
Process, Atmospheric Environment 38, 6655-6665.
Zhang, Q., Stanier, C., Canagaratna, M., Jayne, J., Worsnop, D., Pandis, S.,
Jiminez, J., 2004b. Insights into the Chemistry of New Particle Formation and
Growth Events in Pittsburgh Based on Aerosol Mass Spectrometry,
Environmental Science and Technology 38, 4797-4809.
Zhu, Y., Hinds, W., Kim, S., Shen, S., Sioutas, C., 2002a. Study of Ultrafine
Particles Near a Major Highway with Heavy Duty Diesel Traffic,
Atmospheric Environment 36, 4323-4335.
Zhu, Y., Hinds, W., Shen, S., Sioutas, C., 2004. Seasonal Trends of
Concentration and Size Distribution of Ultrafine Particles Near Major
Highways in Los Angeles, Aerosol Science and Technology 38, 5-13.
Zhu, Y., Hinds, W. C., Kim, S., Sioutas, C., 2002b. Concentration and Size
Distribution of Ultrafine Particles Near a Major Highway, Journal of the Air
& Waste Management Assoc. 52(9), 1032-1042.
Zhu, Y., Kuhn, T., Mayo, P., Hinds, W., 2006. Comparison of Daytime and
Nighttime Concentration Profiles and Size Distributions of Ultrafine Particles
Near a Major Highway, Environmental Science and Technology 40, 2531-
2536.
422
CHAPTER 8. CONCLUSIONS
8.1. INTRODUCTION
A myriad of diverse transport problems are occurring in urban areas, ranging from
traffic congestion to the challenges of urban sprawl. Some new initiatives that
have been introduced into urban living include higher density living and transit
oriented developments, however these developments are causing the public to
become more concerned about higher exposure rates to particulate matter,
including ultrafine particles (diameters < 0.1 µm), and the likelihood of increased
health risks.
Recent advances in vehicle technologies have seen dramatic reductions in
particulate matter emissions from motor vehicles in terms of particle mass
emissions, but these newer technologies can often be associated with increases in
the smaller particle size ranges (Morawska et al. 2004). These smaller sized
particles, due to their size, are particularly adept at traversing and lodging deep in
the human respiratory system, which can lead to serious health effects in the
human body.
The currently very high particle emission rates of HDVs are a global problem, and
one for which solutions are urgently needed. Solutions can range from
technological improvements, such as installing after-treatment devices; to
adopting less polluting options such as moving freight using electric and hybrid
HDVs in the same unit or vehicle for multiple modes (eg., road, road and water)

423
(Macharis et al. 2007). HDV fleets emit more than an order of magnitude more
particulate matter than LDVs (Morawska et al. 2004) ; and their exhaust is a
declared cancer-causing substance (Swiss Clean Air Act 2000;
www.dieselnet.com/standards/ch).
Most motor vehicle particle emissions are ultrafine size and are not currently
regulated by air quality standards. Current ambient air quality standards in terms
of concentrations are based on the findings of epidemiological studies, which
have shown that airborne particle mass has a linear exposure-health response
relationship. Based on an American Cancer Society study (Pope et al. 2002) the
World Health Organization has set new particulate matter guidelines with annual
mean values for PM2.5 and PM10 of 10 and 20 µg m-3 respectively, and these
guidelines relate to the lowest end of the range across which significant effects on
survival have been observed (WHO 2005).
Inventories and air quality standards are needed to manage and control fleet
particle emissions. Inventory data provides vital information for land use and
transport planning and decision-making. It informs the development of relevant
air quality guidelines and standards and air quality assessments, and is useful for
modelling the air quality implications of changes in fleet composition and travel
demand, and changes such as the introduction of new vehicle technologies and
fuels.

424
The public and policymakers need accurate information on the health
consequences of transport and land use policies, and health professionals have an
important role to play in providing this information and in making assessments of
the health impacts of transport policies (Dora 1999). One of the current challenges
facing us today is that no one has ever quantified how much particulate matter is
emitted from motor vehicle fleets in terms of both particle number and particle
mass emissions. A comprehensive inventory covering the full particle size range
emitted by motor vehicle fleets has not been published.
8.2. PRINCIPAL SIGNIFICANCE OF THE FINDINGS
The research reported in this thesis significantly advances our
understanding of the extent of particulate matter pollution emitted from an
urban fleet. The original and significant contribution of this research
included:-
(i) Developing the first published inventory which comprehensively
quantified the total particulate matter emitted by a motor vehicle
fleet in terms of both particle number emissions and emissions
for different particle mass size fractions.
(ii) The novelty of this study relates to its successful integration of
expertise from two distinctly separate disciplines, and
development of an approach for quantifying vehicle fleet particle
emissions which takes into account all the elements. The method
included derivation of a comprehensive set of particle emission
factors for particle number and particle mass for different vehicle
425
and road type combinations. These emission factors can be used
to develop inventories and quantify the spatial distribution of
particle concentrations in urban areas of developed countries.
(iii) Investigating the location of the mode in a range of different
worldwide environments and for different particle metrics,
including traffic-influenced environments; and demonstrating the
suitability of examining modes as an effective basis for
developing air quality regulation.
(iv) Providing evidence that a PM1 mass ambient air quality standard
would suit the majority of worldwide environments and that, in
combination with PM10, is likely to be a more useful set of
standards than the current standards of PM2.5 and PM10 for
discriminating mechanical and combustion-generated particles,
such as emitted by motor vehicles.
(v) Reviewing and synthesizing existing knowledge on ultrafine
particles as it relates to motor vehicles, and the implications of
the findings of the review for exposure and epidemiological
studies, and for identifying the future directions of research
needed on ultrafine particles.
Figure 8.1 depicts the research activities undertaken in this study.

426
INVENTORY
OF EMISSIONS (MODEL)
Validation (by comparing with EPA
and other inventories) PAPER 3
Emission factors for different particle
size ranges
Travel demand model
PAPER 2
Model future scenarios (passenger & freight vehicles) to examine emission implications PAPER 3
PAPER 3
Modality: Investigation of the fractional contribution of motor vehicle emissions to different particle mode distributions
Paper 1: Modality and the fractional contribution of vehicle emissions to different particle modes; and modality within particle size distributions in a wide range of different worldwide environments.
Paper 2: Derivation of suitable emission factors to use in transport modelling and inventory development.
Paper 3: Development of a motor vehicle particle emissions inventory and validation of the inventory.
Paper 4: Review and synthesis of current knowledge on ultrafine particles, with a specific focus on motor vehicles.
Notes: 1. The dashed rectangle depicts future activities recommended based on the study results. 2. The dotted rectangle depicts a Government prototype travel demand model.
Figure 8.1 Diagram of Research Activities. 426
Modality and air
quality and emission standards for vehicles
PAPER 1
Review & synthesis of current knowledge on ultrafine particles, with specific focus on motor vehicles
PAPER 4

427
The first step of this study involved investigating modality within particle size
distributions as a potential basis for developing air quality standards, based
on gaining an understanding of particle mechanisms and source apportionment in
terms of particle size distributions. The location of the mode in a wide range of
different worldwide environments was examined for different particle metrics,
including traffic-influenced environments, and the fractional contribution of
motor vehicle particle emissions to different modes.
The second step involved deriving a comprehensive set of particle emission
factors for different particle sizes for motor vehicles which can be used in
transport modelling and air quality assessments to quantify fleet particle
emissions in urban areas. Average particle emission factors, and their 95%
confidence intervals, were derived from statistical models developed for different
vehicle and road type combinations and particle metrics.
The third step involved combining the most suitable average emission factors
produced by the statistical models with transport demand model data to
develop a road link-based inventory of tailpipe particle emissions emitted from
the urban South-East Queensland motor vehicle fleet in 2004. Where available,
the inventory quantification was validated with a relevant local model.
The fourth step involved modelling future scenarios, including different
proportions of passengers travelling in light duty vehicles and buses, to examine
the air quality implications of these scenarios, and deriving an estimate of fleet
particle emissions in 2026.

428
The fifth step involved reviewing and synthesizing current knowledge on
ultrafine particles as it relates to motor vehicles, and identifying the
implications of its findings in terms of important future directions for research
needed on ultrafine particles, and on air quality regulation, epidemiological
studies and human impact assessments.
The rectangle in Figure 8.1 depicted with dotted lines labelled ‘Travel demand
model’ relates to a Government prototype travel demand model; and the rectangle
shown by dashed lines and labelled ‘Modality and air quality and emission
standards for vehicles’, represents future research that is recommended. This
research could relate to determining the suitability of examining modes within
particle size distributions for different vehicle types as a basis for developing
vehicle standards; examine relevant vehicle characteristics such as fuel type,
vehicle technologies (eg., aftertreatment devices) etc which could be used to
develop vehicle standards and source signatures for source apportionment related
to different vehicle classes; and examine factors specifically related to ultrafine
particles emitted by different motor vehicle types.
This PhD research has provided evidence that a combination of PM1 and PM10
mass ambient air quality standards have the potential to be a more suitable and
discerning combination of air quality standards to control combustion and
mechanically-generated particle mass emissions than the present standards of
PM2.5 and PM10. The review of modality within particle size distributions
examined in this study showed that ultrafine particles, measured in terms of

429
particle number, were the dominant source of motor vehicle particle emissions
and hence the urban South-East Queensland (SEQ) inventory was developed to
include particle number.
The urban SEQ inventory provides valuable knowledge not only to understand
total emissions in the region, but also constitutes the first published
comprehensive inventory of motor vehicle particle emissions prepared for a
vehicle fleet, and includes the first published comprehensive particle number
inventory. The inventory provides regulators and planners with benchmark values
of the levels of particulate pollution emitted from the motor vehicle fleet in 2004,
which can be used to test future alternative transport and land use strategies, and
to design of health impact assessments. This inventory data is also useful
information as a basis for developing air quality standards and standards for
motor vehicles.
The comprehensive set of particle emission factors derived in this study has
application for other regions, particularly where there may be a lack of data or
insufficient measurement data to use in estimating inventories and for air quality
assessments. Estimating motor vehicle particle emissions inventories is important,
in order to understand and control human exposure, and to inform the
development of land use and transport planning, as well as to provide data for the
development of relevant ambient air quality standards and standards.

430
The outcomes of this research provide a multi-pronged approach to managing
fleet particulate matter pollution, firstly by developing a method to quantify the
pollution, secondly by devising methods to develop standards to control the
pollution, and thirdly by identifying key areas of research needed in relation to
understanding and quantifying ultrafine particles generated by motor vehicles.
8.3. THE PRINCIPAL FINDINGS AND SIGNIFICANCE OF THIS STUDY
These are summarized below grouped into nine subsections:-
(i) modality within particle size distributions;
(ii) a new method for developing comprehensive particle inventories;
(iii) derivation of suitable particle emission factors;
(iv) statistically significant differences found between mean values of
published emission factors;
(v) other particle emission inventories;
(vi) gaps in our knowledge related to motor vehicle emission factor data;
(vii) development of a comprehensive particle emissions inventory;
(viii) validation of the developed inventory;
(ix) scenario modelling findings and likely future particle emissions.
(x) review and synthesis of current knowledge on ultrafine
particles, with a specific focus on motor vehicles.

431
Table 8.1 appears at the end of this Section and provides a précis of principal
findings and the significance of their application.

432
MODALITY WITH PARTICLE SIZE DISTRIBUTIONS
1. The research found that in marine-influenced, modified background,
suburban background, traffic-influenced, urban-influenced and vegetation
burning environments examined in urban South-East Queensland, a clear
separation existed between the accumulation and coarse modes for particle
volume and particle number size distributions at around 1 µm. A similar
clear and distinct separation was also found between the modes at around
1 µm in an examination of 600 modal location values reported in the
international literature for a wide range of worldwide environments for
particle number, surface area, volume and mass size distributions. These
findings demonstrate the relevance of developing a PM1 mass ambient air
quality standard and its suitability for the majority of environments
worldwide, including traffic-influenced environments. The research also
demonstrated the usefulness of examining modes within particle size
distributions as a basis for developing air quality regulations, and its value
in providing information about contributions from different pollution
sources and for understanding particle mechanisms.

433
2. Another important finding of the research was that PM1 and PM10 mass
measurements enabled a clearer distinction to be made between
mechanically-generated and combustion-generated particles than the
current standards of PM2.5 and PM10. An investigation of the fractional
contribution of particle mass from marine-influenced, modified
background, suburban background, traffic-influenced, urban-influenced
and vegetation burning environments in South-East Queensland, and
different particle modes in particle size distributions to PM1, PM2.5 and
PM10 revealed that PM2.5 measurements may not be an adequate parameter
as a basis for a standard to control particle emissions and concentrations.
It was found that in all South-East Queensland environments examined the
division at 2.5 µm cut across the coarse particle mode close to its peak.
PM2.5 coarse mode measurements provided information mainly on
mechanically-generated processes, but for some environments
contributions from the combustion process modes (nucleation and
accumulation modes) were significant. These results make evident the
substantial complexity which may be associated with interpreting PM2.5
data in order to distinguish contributions from different sources.

434
3. The study found that PM1 mass contributions from marine-influenced,
modified background, traffic-influenced and vegetation burning
environments were from particles in the nucleation and accumulation
modes, and not from particles in the coarse mode. The PM1 measurements
provided very good information about nucleation and accumulation mode
particles (such as from combustion sources, eg., motor vehicles) and
enabled a clearer distinction to be made between combustion and
mechanically-generated aerosols.
4. Another finding of the study was that contributions to PM10 mass from all
urban South-East Queensland environments examined (with the exception
of vegetation burning) were mainly from coarse mode particles generated
from mechanical processes (such as particle resuspension by motor
vehicle traffic or production from mechanical wear and tear of tyres), with
negligible contribution from combustion processes. Therefore PM10
measurements were found to be suitable for discriminating mechanically-
generated particles in the coarse mode.
5. The findings of the modality review and examination of the urban South-
East Queensland study and other studies conducted around the world (1-4
above) make a unique and significant contribution to knowledge by
identifying that PM1 and PM10 mass standards may be a more suitable and
discerning combination of air quality standards than the current standards
of PM2.5 and PM10 for controlling particle emissions and concentrations,

435
including in traffic-influenced environments, and that a PM1 mass standard
would suit the majority of environments worldwide. Although few data are
available on PM1 concentrations, measurement technologies are currently
available to undertake measurements in this size range.
6. Examination of the location of the modes in traffic-influenced environments
revealed that most modes were found in the submicrometre size range, and
were dominant in the ultrafine size range. As most motor vehicle particle
emissions are < 1 µm and concentrated in the ultrafine size range, further
scientific investigation is needed to identify the best possible combination of
particle number and particle mass standards to control motor vehicle
emissions. Future legislation needs to consider the inclusion of particle
number standards, in addition to particle mass standards, to control motor
vehicle particle emissions, as ultrafine particles have negligible mass, but
are prolific in terms of their numbers. Therefore particle number-based
standards are very relevant for controlling motor vehicle emissions.
436
A NEW METHOD FOR DEVELOPING COMPREHENSIVE
INVENTORIES
7. A new method for developing comprehensive inventories of motor vehicle
particle emissions was devised in this study, which enables quantification
of emissions in terms of the full size range of particles emitted for both
particle number and particle mass. The method included derivation of a
comprehensive set of average particle emission factors for different
vehicle and road type combinations for particle number, particle volume,
PM1, PM2.5 and PM10 to use in transport modelling and air quality
assessments.
The derivation of average particle emission factors contribute significant
knowledge as these emission factors have application not only for urban
regions in the developed world, but for regions which do not have specific
location or application data, or have measurement data of insufficient
scope. They can be combined with traffic data to produce road link-based
inventories, and used as input values to motor vehicle mobile emission
inventories to quantify the spatial distribution of particle concentrations in
urban areas. Without the development of these inventories land use and
transport planners will have a very limited capacity to consider the
important and severe health effects of exposure to particulate matter in
land use and transport planning decisions.

437
DERIVATION OF SUITABLE PARTICLE EMISSION FACTORS
8. The data reported in the international literature showed that there were
more than 900 particle emission factors found for different vehicle types
cited in 59 papers. From this review, sixteen model variables were
developed, based on variables measured in several of the papers, and data
relating to 667 particle emission factors were classified and examined in a
statistical analysis. Five separate statistical models were developed, which
produced average particle emission factors, and these statistical models
were found to explain 86%, 93%, 87%, 65% and 47% of the variation in
published emission factor values for particle number, particle volume,
PM1, PM2.5 and PM10 respectively. The sixth model for total particle
mass was found to be a null model, which is likely to relate to the fact that
the emission factors were derived for total particle mass, and not for more
discrete sub-sets of particle mass fractions.
The explanatory variables for the five statistical models were Vehicle Type
and Instrumentation for particle number and PM2.5; Vehicle Type and Fuel
Type for PM1; Vehicle Type, Size Ranged Measured and Speed Limit on
the Road for particle volume; and Vehicle Type and Road Type for PM10.
The results of the statistical analysis provide important information
on key factors which may have a major influence on the values of derived
emission factors. Such key factors require special attention in the design,
conduct and reporting of results of emission factor studies.

438
9. The five statistical models produced average particle emission factors, and
their corresponding standard error and 95% confidence intervals, for
different vehicle and road type combinations for particle number, particle
volume, PM1, PM2.5 and PM10, for estimating particle emissions emitted
per vehicle per kilometre travelled. The most suitable emission factors to
use in transport modelling and air quality assessments were selected based
on examination of the statistical characteristics of the average emission
factor values, and for some particle metrics Size Range Measured and
Road Type were also considered. These emission factors have universal
application, and are suitable to be used for urban regions of developed
countries, and in particular for regions which have little or no
measurement data to develop particle inventories.
10. The most suitable average particle emission factors to use in transport
modelling and air quality assessments are outlined below, those relating to
HDVs and buses related principally to diesel-fuelled vehicles, and for
LDVs principally to petrol-fuelled vehicles.
(i) particle number derived from Condensation Particle Counter
measurements for Fleet, HDV and LDV and from Scanning Mobility
Particle Sizer measurements for Diesel buses;
(ii) particle volume related to Fleet, HDV and LDV emission factors
for roads with Speed Limits on the Road of ≤ 60 km/hr where the Size
Range Measured was 18-300nm, and > 60 km/hr related to Size Range
Measured of 18-700nm;
(iii) PM1 for Fleet, LDV and HDV based on Fuel Type.

439
(iv) PM2.5 for Fleet were measured using Tapered Element Oscillating
Microbalances and the Differential Mobility Analyzer; for LDV measured
by DustTrak and for HDV related to the overall average emission factor
value derived from all Instrumentation used in PM2.5 measurements; and
(v) PM10 for Fleet, HDV and LDV related to different Road Types,
including freeway, highway, motorway, rural road, tunnel and urban road;
and for buses to boulevard, and urban Road Types and dynamometer
measurements. The authors of the boulevard and urban Road Type study
for buses reported that they considered their very high values of PM10
emission factors were influenced by contributions from resuspended road
dust and, within each vehicle category, by the effects of speed and
acceleration. Hence as the average emission factor for buses measured on
dynamometers was more conservative than those derived for the two Road
Types, and less likely to be affected by resuspended road dust, the
dynamometer emission factor was considered a more suitable emission
factor for buses for PM10 for all Road Types.

440
STATISTICALLY SIGNIFICANT DIFFERENCES IN MEAN
VALUES OF PUBLISHED EMISSION FACTORS
11. The research found that for the majority of particle metrics no statistically
significant differences were found between the mean values of published
emission factors for different categories of Country of Study and Study
Location (eg., measured on a dynamometer, in a tunnel or in the vicinity
of the road). The exceptions related to statistically significant differences
found between the mean values for PM2.5 for Country of Study between
Australian and Other Countries (Austria, Belgium, Denmark, Germany,
Sweden, Switzerland and the United Kingdom) studies and between
Australian and USA studies. However, it is crucial to note these
differences are likely to be influenced by the fact that the majority of the
Australian PM2.5 emission factors were derived for diesel vehicles.
Statistically significant differences were also found for PM1 between
dynamometer and vicinity of the road and between dynamometer and
tunnel mean values. These differences are likely to be influenced by the
fact that the PM1 dynamometer measurements related exclusively to LDV
and HDV diesel vehicles tested in Australia. Higher values of emission
factors are likely to be associated with diesel-fuelled vehicles as compared
to petrol and other fuelled-vehicles. More data and studies are needed for
PM1 as there was insufficient data to test Country of Study, and no bus
emission factors available for this metric.

441
An important finding of this research is that relatively few statistically
significant differences were found between the mean values of published
emission factors for the different particle metrics for different Countries of
Study and Study Locations. This finding reinforces the value and universal
application of the average particle emission factors derived in this research
work, and their application for other urban areas, including for areas that
have limited measurement data and emission factors for developing motor
vehicle particle emission inventories.
12. No statistically significant differences were found between the means of
published emission factors relating to vehicle emissions measured on a
dynamometer and those measured on different Road Types for all particle
metrics (particle number, particle volume, total particle mass, and PM1,
PM2.5, PM10), with only two exceptions. Firstly, statistically significant
differences were found between the mean values for published emission
factors for PM1 between motorway and the four Road Types - rural area,
highway, tunnel and urban; and between motorway and dynamometer.
Secondly, statistically significant differences were found for PM10
between boulevard and the Road Types – highway, motorway, tunnel and
urban, and between boulevard and dynamometer. However, it should be
noted that these statistically significant differences found for motorway
and boulevard Road Types may have been influenced by high vehicle
speed scenarios. Therefore, the relatively few statistically significant
differences found between published emission factors derived from

442
dynamometer and most Road Types suggests that these two methods provide
generally similar results.
13. No statistically significant differences were found for particle number, total
particle mass, and PM1, PM2.5, PM10 between the mean values for published
emission factors for dynamometer studies and four Road Classes (based on
Speed Limit on the Road, where urban roads had limits of ≤ 60 km/hr, non-
urban > 60 km/hr; highway ≥ 80 km/hr and non-highway < 80 km/hr).
These statistical tests did not include total particle mass for highway and
non-highway or dynamometer for particle volume due to insufficient data
being available. Although few statistical differences were found, it is
important that future studies investigate the Average Vehicle Speeds
associated with their derived emissions factors in on-road studies, to provide
more realistic information about actual driving conditions and vehicle
speeds, in addition to reporting the Speed Limit on the Road.
14. For Vehicle Type statistically significant differences were found between the
means of published emission factors for Fleet and HDV for particle number,
PM1, PM2.5; between the means for Fleet and LDV for PM2.5; and between
LDV and HDV for all particle metrics (particle number, particle volume,
PM1, PM2.5 and PM10). This finding highlights the wide gap between the
mean particle emission factors for LDVs and HDVS, and emphasizes the
high emission rates of HDVs and the need to limit population exposure to
emissions from this Vehicle Type.

443
15. For buses statistical tests showed that the mean values of published
emission factors for particle number, total particle mass, and PM2.5, PM10
were statistically similar to the mean values for Fleet, LDV and HDV.
The mean values for buses for particle number are likely to be influenced
by the fact that the bus emission factors were derived from Scanning
Mobility Particle Sizer measurements (Instrumentation which places a
major focus on determining particle size distribution) and which measures
a different size range to Condensation Particle Counter (CPC). Whereas
the Fleet, LDV and HDV emission factors for particle number were
derived using the Condensation Particle Counter (Instrumentation which
focuses on determining total particle count, including down to the very
small particle size range of 3 nm, where particle numbers tend to be very
prolific). In addition, the same size of values for buses were considerably
lower than those for Fleet, LDV and HDV. Greater differences between
mean values for buses and other Vehicle Types would be expected in the
future when vehicle standards are introduced that require the fitting of
technologies such as particle filters to diesel vehicles. No data was
available to examine the means for PM1 and particle volume for buses.
16. No statistically significant differences were found between the means
of published emission factors for different Fuel Types for particle
number, or between the means for total particle mass. However,
statistically significant differences were found between petrol and
diesel in PM10. Fuel Types were not reported in particle volume
444
studies and as PM1 had fewer than three Fuel Type groups, multiple
comparison tests were not able to be conducted.
17. Statistical tests showed no significant difference between the mean values
for published emission factors measured by different Instrumentation for
PM2.5 and total particle mass. However, a very important finding of this
research was that statistically significant differences were found between
the mean values for published emission factors measured by Condensation
Particle Counter (CPC) and the Scanning Mobility Particle Sizer (SMPS)
for particle number of 22.69 x 10¹⁴ particles per vehicle per km and 2.08 x
1014 particles per vehicle per km, respectively. This finding highlights
major differences in the measurements of these two Instrumentation, and
is a finding that needs to be addressed as a much broader issue. One
possible explanation, however, is that the lower and upper size window for
measurement is determined by instrument capability and operator choice.
In the case of the lower size window for the SMPS this is usually set
higher, commonly in the range 0.010-0.02 µm, than that for the CPC
which ranges from 0.002-0.01 µm, which means that generally the CPC
measures the nucleation mode and the SMPS does not. The nucleation
mode tends to be prolific in terms of particle number emissions for motor
vehicles; as evidenced by larger emission factor values derived for LDVs
and HDVs motor vehicles relating in the < 0.018 µm size range
(Morawska et al. 2008).

445
In relation to Size Range Measured for particle number no statistically
significant differences were found between the means of published
emission factors for the lower and upper size ranges measured for the
various levels of each of the categorical variables, after accounting for the
associated variability of these estimates. This means that for studies which
reported both the lower and upper size ranges for Instrumentation used, no
statistically significant differences were found between the means in terms
of the different size ranges measured. However, further studies may be
needed that focus on the nucleation mode, in particular less than 18 nm,
where particle number emissions tend to be very prolific (please refer
point 17 above).
OTHER PARTICLE EMISSION INVENTORIES
18. A detailed review of the international literature found only one example of
a study that attempted to develop an inventory of particle emissions for a
motor vehicle fleet. This was prepared for the UK in 1996, 1998 and 2001
(Group 1999; Goodwin et al. 2000; AQEG 2005). However, this estimate
used emission factors for the smaller particle size ranges derived by
applying distribution profiles for these size ranges to PM10 estimate data,
and not based on specific, individual measurement data for the different
particle size ranges. As these UK estimates were based on such few input
data and were not comprehensively assessed, they cannot be considered
one inventory.
446
Therefore, another very significant and unique contribution of the work of
this PhD study is derivation of a comprehensive set of particle emission
factors for different vehicle and road type combinations covering the full
size range of particles emitted. These were derived for both particle
number and particle mass, based on measurement data for different
particle size ranges, and used to develop the a comprehensive inventory of
motor vehicle particle emissions presented in this PhD research study,
which is the first comprehensive inventory that has been published.
GAPS IN OUR KNOWLEDGE OF MOTOR VEHICLE EMISSION
FACTORS
19. The research identified a number of important gaps in our current
scientific knowledge about motor vehicle particle emissions. Limited
emission factor data was found for particle volume, particle surface area,
PM1, brake and tyre wear, road grade, engine power and for vehicles
travelling in congested traffic conditions at speeds < 50 km per hour.
There was also limited information available in the literature on methods
which would enable discrimination of resuspended road dust from motor
vehicle tailpipe emissions. Further research work on these areas is needed
to develop emission factors related to these different factors for tailpipe
and non-exhaust emissions, mentioned above.

447
20. No relevant emission factors were found for buses for particle number
where Instrumentation had measured total particle count down to the
smaller size range of 3 nm, nor for particle volume or PM1. Further
research is needed to derive emission factors for buses for particle number
(including relevant size sub-classes in the range 3 nm-1 µm) and for
particle volume, particle surface area, and for different mass size fractions.
This research needs to derive emission factor values for different vehicle
speeds and engine loads, including for speeds less than 50 km/hr, so that
bus emissions can be accurately modelled for congested traffic conditions;
as well as for different road environment conditions such as different road
or tunnel gradients (slopes).
21. Very limited emission factor data is available in the international literature
for speed-related emission factors for vehicles travelling at speeds < 50
km/hr. Few studies have reported the Average Vehicle Speed of on-road
fleets or different vehicle types, such as for LDVs, HDVs and buses, or
even reported the Speed Limit on the Road. Authors may have assumed
that Speed Limit on the Road would be implied by the Road Type studied.
These practices have contributed to a lack of available data on speed-
related emission factors in the international literature. New Drive Cycle
tests are needed which focus specifically on simulating different driving
speeds and driving patterns commonly associated with congested traffic
conditions, to bridge the gap in knowledge.

448
DEVELOPMENT OF A COMPREHENSIVE PARTICLE
INVENTORY
22. The inventory developed in this PhD project quantified total particulate
matter emissions for the urban South-East Queensland fleet for 2004
covering the full size range of particle emitted, and included particle
number and different particle mass fractions. The method developed in
this research project was used and a comprehensive set of particle
emission factors (derived in this research) were combined with transport
modelling data, to quantify emissions for different vehicle and road type
combinations for particle number, PM1, PM2.5 and PM10. Traffic data used
in the inventory related to vehicle kilometres travelled (VKT) and was
sourced from a government prototype model, the Brisbane Strategic
Transport Model, which covered an area of approximately 4600 square
kilometres. The study region had a resident population of 1.7 million and
1.2 million motor vehicles (ABS 2004 a,b). Analysis of the VKT travelled
in the region revealed that 93.3% of VKT was contributed by LDVs, 6.3%
by HDVs and 0.4% by buses. The bus fleet in 2004 comprised 89%
Diesel and 11% CNG buses (Translink 2007). It was found that although
LDVs dominated total VKT, HDVs made the most significant contribution
to particle emissions in the smaller size ranges, including PM1 and particle
number (please refer to in point no 24).

449
23. A major finding of this research was that the development of the urban
South-East Queensland inventory revealed that HDVs were the major
emitters of particle number and PM1 emissions, and although they only
travelled about 6% of the total distance travelled by the vehicle fleet, they
contributed more than 50% of the region’s particle number and PM1
emissions. This is a very significant finding, particularly also given that
the freight task is expected to double in the next 20 years (SKM 2006).
This finding strongly emphasizes the need to expend major effort to
reduce HDV emissions both now and in the future, particularly as HDVs
tend to emit around 20 times more particles than LDVs in the smaller
particle sizes ranges < 1 µm.
24. The developed inventory for urban South-East Queensland showed
that in 2004 total annual particle emissions emitted by the fleet were
for :-
(i) particle number were 1.08 (0.54-1.97) x 1025 per annum. Of these
total particle number emissions total HDVs contributed
approximately 54%, total LDVs 45% and total buses close to 1%.
No studies were found which can be compared to the urban SEQ
particle number inventory, and the only one available estimated
particle flux from all sources, from both natural and
anthropogenic sources and as data is not available on particle flux
from natural sources in urban SEQ, the studies cannot be
compared.

450
The inventory quantified in this PhD study for particle number for
urban South-East Queensland constitutes the first detailed, published
particle number inventory of motor vehicle particle emissions.
(ii) PM1 were 477 (233-964) tonne, which did not include Diesel or CNG
buses as relevant PM1 emission factors were not available. Although
total HDVs only contributed around 6% of the total VKT travelled in
the region, they contributed 55% of total PM1 emissions, and total
LDVs contributed 45%. Again, this high contribution by total HDVs to
submicrometre particle emissions in the region further supports the
need to focus on reducing HDV particle emissions in the study region.
As discussed previously, research conducted as part of this PhD
project found that PM1 and PM10 are likely to be a more relevant and
discerning combination of air quality standards than the current
standards of PM2.5 and PM10 for combustion sources such as motor
vehicles. It is therefore important to conduct further studies to derive
emission factors for bus and other vehicle types for PM1 mass, and to
take steps to introduce air quality standards for motor vehicles for the
PM1 mass size range;

451
(iii) PM2.5 were 736 (225-1436) tonne, and CNG buses were not included as
relevant emission factors were not available. Total LDVs contributed 61%
of PM2.5 emissions, total HDVs 37% and total Diesel buses 2%; and
(iv) PM10 were 2614 tonne, with an upper 95% confidence interval value of
9668 tonne. Total LDVs contributed 81%, total HDVs 18% and total
buses contributed approximately 1%.
25. The developed inventory for urban South-East Queensland found that total
LDVs emissions dominated the total PM2.5 and PM10 inventories and total
emissions on lower speed roads (urban roads). This was influenced by the
fact that total LDV VKT was almost double that of total HDV VKT on
these roads. Whereas, total HDVs were found to dominate the total
particle number and PM1 emission inventories and total emissions on
higher speed roads (urban-major roads). This was influenced by the
higher value for the HDV emission factor, which was almost 6 times
higher than the emission factor for LDVs, and total HDV VKT was
slightly higher than total LDV VKT on this Road Type. Although total
buses only contributed around 1-2% of total emissions, nevertheless
quantification of these emissions at the local scale is important due to high
localized exposure by populations in busways, tunnels and on roads.

452
VALIDATION OF THE DEVELOPED INVENTORY
26. The study found no local models available which had quantified total
annual particle number, PM1 or PM2.5 that could be compared with the
quantifications derived in this research. However, a comparison was able
to be made between the PM10 inventory developed for urban South-East
Queensland in this research of 2614 tonne per annum and the inventory
derived by the Queensland Environmental Protection Agency for South-
East Queensland for the year 2000 of 2249 tonne (EPA 2004). These two
PM10 inventories are in close agreement and suggest confidence can be
had in the total particle inventory developed for urban South-East
Queensland in this PhD research.
SCENARIO MODELLING FINDINGS & LIKELY FUTURE PARTICLE
EMISSIONS
27. Other important findings of this research related to the modelling of
the particle emission implications of future scenarios for urban South-
East Queensland. This modelling was considered important as the
region has major busway, tunnel and road infrastructure under
construction and many initiatives promoting shifts from passenger car
travel to buses. The modelling conducted in this research found that
reductions of:-

453
(i) 3-4%, 1-2%, 1-6% in particle number, PM2.5 and PM10 emissions,
respectively, were associated with each 10% reduction in LDV
VKT, where 70-100% of these passengers were moved to new
buses; and
(ii) reductions of 2%, 2-3% and 3-4% in particle number, PM2.5 and
PM10 emissions, respectively, were associated with each 10%
reduction in work trips (trips to and from work from home), where
50% of these passengers were moved to new buses.
It could be expected, therefore, that even greater reductions in particulate
matter emissions could be achieved by moving these LDV passengers to
existing buses and increasing the average vehicle occupancy rates of
buses. In 2004 the average vehicle occupancy rate for LDVs was 1.5
passengers and 15.5 passengers for buses in the average 24 hour period
(Translink 2007). This bus occupancy rate is considerably less than half
the maximum carrying capacity of most buses in the fleet. In addition, a
small reduction in the percent of HDV VKT would lead to substantial
particle emission reductions, particularly in the region’s total particle
number and PM1 emissions.
28. The research found that on a per passenger per km basis particle number
emissions from LDVs were 1-2 orders of magnitude higher than those for
buses. LDV emissions per passenger per km were similar to Diesel buses
for PM2.5; and for PM10 were close to 5 times those of Diesel buses, and
several orders of magnitude higher than CNG buses. Even greater

454
differences between LDV and bus emission factors per passenger per km
could be expected if bus occupancy rates increased. These findings
highlight major opportunities for reducing particle number and particle
mass emissions by shifting proportions of LDV passengers to buses. As
relevant PM1 emission factors for buses were not available, these were not
included in the modelling.
29. Scenario modelling undertaken in this research to estimate expected
emissions in urban South-East Queensland in 2026 revealed that, when
compared to the 2004 inventory, an 100-fold increase could be expected in
particle number emissions in 2026 and reductions of 38%, 36% and 31%
in PM1, PM2.5 and PM10 respectively. The results of this modelling
further emphasize the need to focus on strategies to dramatically reduce
HDV emissions, such as mandatory fitting of particle filters, limiting HDV
access to roads situated in close proximity to populations, and finding
alternative lower polluting options for moving freight. The majority of
HDVs presently are diesel-fuelled; and in Switzerland diesel exhaust is
classified as a carcinogen (www.dieselnet.com/standards/ch/). The very
high proportion of the HDV fleet contributions to the smaller particle size
range in urban South-East Queensland is a major concern from a health
effects perspective. More action is needed to regulate HDV emissions and
limit population exposure.

455
REVIEW AND SYNTHESIS OF CURRENT KNOWLEDGE ON
ULTRAFINE PARTICLES, WITH A SPECIFIC FOCUS ON MOTOR
VEHICLES
30. The review and synthesis of existing knowledge on ultrafine particles in
the air, with a specific focus on those originating from motor vehicles,
showed that vehicles are a significant source of ultrafine particles, and are
commonly the most significant source of air pollution in general in
populated urban areas. For this reason, it is critical to understand the
magnitude and characteristics of ultrafine particles in urban air generated
by motor vehicles, and hence this type of environment is the most likely to
be considered as a target for future air quality regulations in relation to
particle number.
31. No standard methods are currently available for conducting size classified
particle number measurement, and ultrafine particles are most commonly
measured in terms of their number concentrations. The review found that
the term “ultrafine particles” is often used imprecisely, and can be taken to
mean various ranges of particle number concentration in a subset of the
submicrometer range. Particle number concentrations reported in the
literature were found to depend on the instrument used and its setting.

456
The review showed that the mean and the median measurements by CPCs
are 32% and 56%, respectively, higher than those for DMPS/SMPS, and
while differences for specific environments could be expected to vary (eg.,
larger differences may be expected for environments where the nucleation
mode is present, and smaller differences where aged aerosol dominates),
this finding nevertheless shows the overall magnitude of difference that
can be expected when comparing results using these different measuring
techniques. The significance of this finding is that it highlights the
importance of keeping these differences in mind when attempting to
establish a quantitative understanding of variation in particle
concentrations reported by different studies. Secondly, the finding further
emphasizes the need for use of standardized measurement procedures to
enable meaningful comparison between results from different studies, and
this has particular significance for human exposure and epidemiological
studies.
32. Despite differences found in reporting measured concentration levels, the
review found that it was possible to quantify the differences between
background concentrations of ultrafine particles in clean environments,
with the levels in vehicle-influenced environments, and that the latter can
span over two orders of magnitude higher than levels in clean
environments. Clean background levels were found to be, on average, of
the order of 2.67 ± 1.79 x 103 cm-3 , while levels at urban sites are 4 times
higher and levels at street canyons, roadside, road and tunnel

457
sites are 27, 18, 16 and 64 times higher, respectively. This finding is of
profound significance in relation to human exposure assessment and
epidemiological studies, and emphasizes the importance of exposure
assessments being conducted in locations where exposures actually occur,
and at time scales that elucidate the temporal nature of the exposure.
These findings suggest that it is unlikely that epidemiological studies
would provide answers based only on monitoring in central locations, and
that central monitoring data alone underestimates exposure and may lead
to inappropriate management of public health risk.
33. The current lack of answers from epidemiological studies in relation to
ultrafine particles and exposure-response relationships is hampering the
development of health guidelines and national regulations. Recent World
Health Organization Air Quality Guidelines set for particulate matter in
relation to mass concentration related to annual mean values for PM2.5 and
PM10 of 10 and 20 µg m-3, respectively (WHO 2005), and these guidelines
are not substantially higher than the concentration levels encountered most
commonly in natural environments (while some locations, and under some
circumstances, concentrations in natural environments may be well below
or above those cited). While the lack of exposure-response relationship
for ultrafine particles makes it impossible to propose health guidelines for
ultrafine particles, it is important to point out that this review found in
vehicle-influenced environments ultrafine particle emissions were up to an
order of magnitude higher than in the natural environments. Hence, it is
suggested that in the absence of a threshold level in response to exposure

458
to ultrafine particles, that future control and management strategies should
target a decrease in ultrafine particles in urban environments of more than
one order of magnitude.
34. The review found large uncertainties currently exist in relation to vehicle
emission factors for particle number and different particle size ranges; no
emission inventories for ultrafine particles generated by motor vehicles are
available; and only very limited data is available on long term trends in
ultrafine particle concentrations in urban environments. The implications
of these findings are that in order to control and manage this major
pollution source, it is critical that significant research effort be expended
to fill this gap in our current knowledge.
35. Findings of the review suggest that although estimations of pollution
concentration in the air are commonly derived based on source emission
inventories, which in turn are derived using the source emission factors,
with respect to the process of secondary particle formation, estimation of
ultrafine particle concentration cannot be derived solely based on vehicle
emission factors, (as these are more likely to reflect emissions of primary
particles), but predictions for secondary particle formation in exhaust
plumes and particle formation by nucleation processes in the wider
atmosphere may need to be considered.

459
Secondary particle formation can result in a rapid increase in particle
number concentrations by one to two orders of magnitude to the
concentration levels of the order of 105 particles cm-3, and most of the new
particles are formed by ion-induced or binary nucleation of sulphuric acid
and water or by ternary nucleation involving a third molecule followed by
condensation of semi-volatile organics, with photochemistry playing an
important role in some of these processes. The mechanisms of new
particle formation strongly depend on local meteorological factors, and
hence models of the dynamics of particle formation in urban environments
need to include all factors involved and be location-specific.
Significant peaks in particle number concentration can occur due to
secondary particle formation, and if future regulations considered were
based on particle number, then the implications of these findings would be
that issues relating to whether the regulations should be set around the base
line concentrations without the peak concentrations, or whether they should
include the peaks and how peaks should be are defined would need to be
resolved. Hence, the significance of this finding is that a much better
understanding of particle formation dynamics in different environments
needs to be obtained, including in traffic-influenced environments, and this
understanding would greatly assist regulation formulation, if secondary
particle formation we found to be relevant and appropriate to include in
regulations.

460
36. The review found that there have been only a relatively small number
of studies which have focused on ultrafine particle chemistry, and
that large differences in particle chemical composition can relate to
factors such as particle solubility, volatility and elemental differences,
for example. Differences can depend on a number of factors,
including fuel, after-treatment devices and vehicle technology used,
and also on post-formation processes occurring during atmospheric
transport. Since particle composition may be a factor determining
particle toxicity, there exists a need to develop a more detailed
understanding on ultrafine particle chemistry in different
environments.
Table 8.1 follows, and provides a précis of principal findings referred to in
1-36 above and their significance in terms of application.

461
Table 8.1 Précis of the principal findings of this PhD research and their significance in terms of application RESEARCH COMPONENT AND PRINCIPAL FINDINGS
SIGNIFICANCE AND APPLICATION FOCUS
Modality within particle size distributions
1. A clear and distinct separation was found between the accumulation and coarse modes at 1 µm in
different worldwide environments for particle number, mass, volume and surface area metrics.
Introduction of a PM1 mass ambient air quality standard is likely to suit the majority of environments worldwide.
2. PM2.5 measurements in the coarse mode related mainly to mechanically-generated sources, but for some environments were from combustion sources, making it complex to distinguish between these sources in different environments. 3. PM1 measurements provided very good information about nucleation and accumulation modes and enabled a clear distinction to be made between combustion and mechanically-generated aerosols. 4. PM10 measurements were found to be suitable for discriminating mechanically-generated particles in the coarse mode. 5. PM1 and PM10 measurements enabled clearer distinction to be made between emissions from combustion and mechanically-generated sources than PM2.5 and PM10.
Provides evidence that modality is a useful basis for developing air quality regulations. A combination of PM1 and PM10 mass ambient air quality standards are likely to be more suitable than the current air quality standards of PM2.5 and PM10 for distinguishing between emissions from combustion and mechanically-generated sources, such as emitted from motor vehicles.
6. Most modes in traffic-influenced environments occurred in the submicrometre size range (diameters < 1 µm) and were dominant in the ultrafine size range (< 0.1 µm).
Particle number standards related to the submicrometre size range, and smaller size ranges such as ultrafine size, need to be introduced to control motor vehicle particle emissions.

462
RESEARCH COMPONENT AND PRINCIPAL FINDINGS
SIGNIFICANCE AND APPLICATION FOCUS
A new method for developing comprehensive particle inventories 7. A new method was developed for estimating comprehensive particle emission inventories for different Vehicle and Road Type combinations for different particle metrics which are suitable to use in transport modelling.
This method provides a comprehensive set of particle emission factors which cover the full size range of particles emitted, including particle number and mass.
8. The comprehensive set of average emission factors derived from the statistical models developed in this study explain:- 86% of the variation in published emission factors for particle number;
93% of the variation in published emission factors for particle volume;
87% of the variation in published emission factors for in PM1;
65% of the variation in published emission factors for in PM2.5;
47% of the variation in published emission factors for in PM10.
Very good correlations were found between the average emission factors derived in this study and those in the international literature. Hence confidence can be had in the average emission factors derived in this study. The lower correlation for PM10 may be confounded by the influence of resuspended road dust at this size range. More methods are needed to enable road dust to be discriminated from exhaust tailpipe emissions.
9. The explanatory variables in the statistical models developed to derive average emission factors were found to be:-
Particle number: Vehicle Type and Instrumentation Particle volume : Vehicle Type, Size Range Measured, Speed Limit on the Road PM1: Vehicle Type and Fuel Type, PM2.5 : Vehicle Type and Instrumentation PM10: Vehicle Type and Road Type
These explanatory variables highlight critical components of emission factor studies, which may need to be given special attention and consideration in study design, conduct and reporting
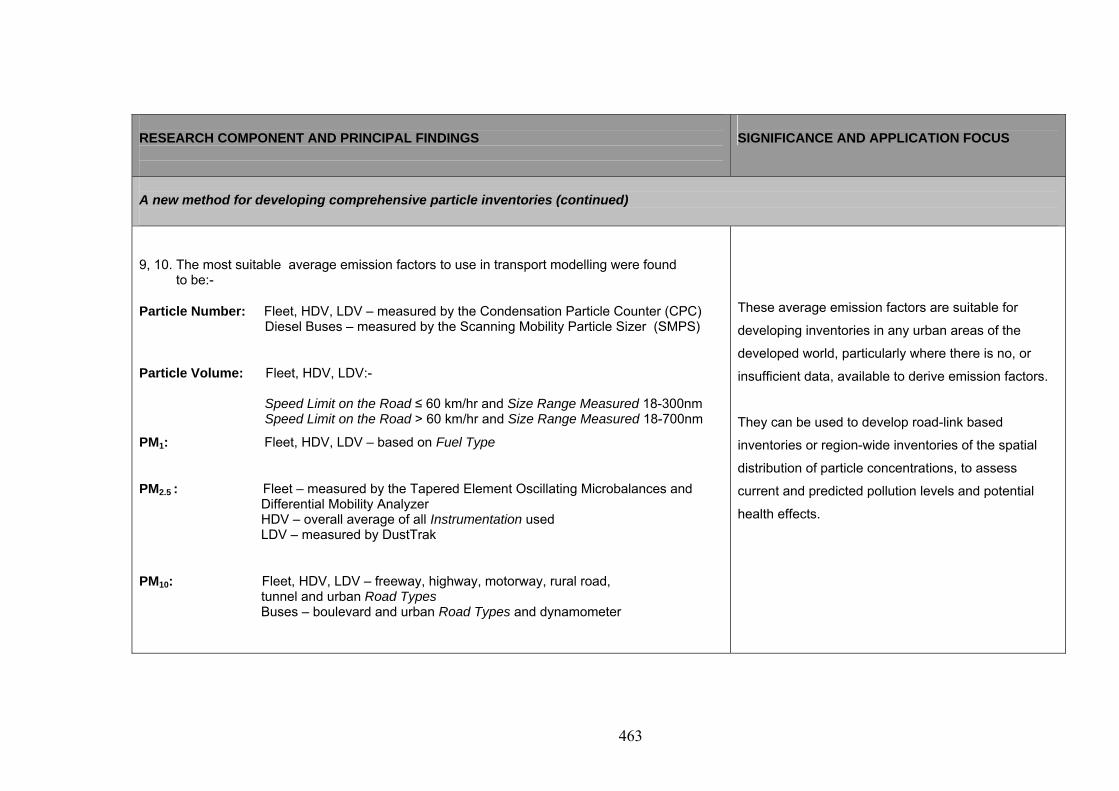
463
RESEARCH COMPONENT AND PRINCIPAL FINDINGS
SIGNIFICANCE AND APPLICATION FOCUS
A new method for developing comprehensive particle inventories (continued) 9, 10. The most suitable average emission factors to use in transport modelling were found to be:-
Particle Number: Fleet, HDV, LDV – measured by the Condensation Particle Counter (CPC) Diesel Buses – measured by the Scanning Mobility Particle Sizer (SMPS)
Particle Volume: Fleet, HDV, LDV:- Speed Limit on the Road ≤ 60 km/hr and Size Range Measured 18-300nm Speed Limit on the Road > 60 km/hr and Size Range Measured 18-700nm
PM1: Fleet, HDV, LDV – based on Fuel Type
PM2.5 : Fleet – measured by the Tapered Element Oscillating Microbalances and Differential Mobility Analyzer HDV – overall average of all Instrumentation used LDV – measured by DustTrak
PM10: Fleet, HDV, LDV – freeway, highway, motorway, rural road, tunnel and urban Road Types Buses – boulevard and urban Road Types and dynamometer
These average emission factors are suitable for
developing inventories in any urban areas of the
developed world, particularly where there is no, or
insufficient data, available to derive emission factors.
They can be used to develop road-link based
inventories or region-wide inventories of the spatial
distribution of particle concentrations, to assess
current and predicted pollution levels and potential
health effects.
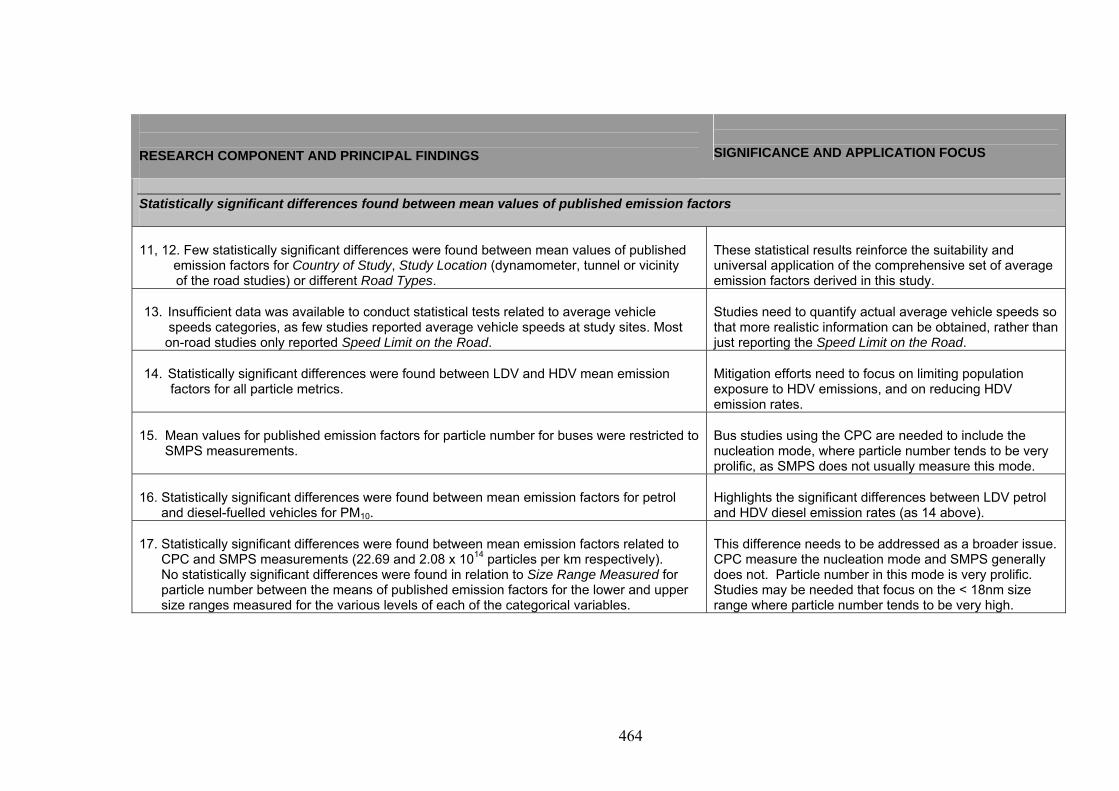
464
RESEARCH COMPONENT AND PRINCIPAL FINDINGS
SIGNIFICANCE AND APPLICATION FOCUS
Statistically significant differences found between mean values of published emission factors
11, 12. Few statistically significant differences were found between mean values of published emission factors for Country of Study, Study Location (dynamometer, tunnel or vicinity
of the road studies) or different Road Types.
These statistical results reinforce the suitability and universal application of the comprehensive set of average emission factors derived in this study.
13. Insufficient data was available to conduct statistical tests related to average vehicle
speeds categories, as few studies reported average vehicle speeds at study sites. Most on-road studies only reported Speed Limit on the Road.
Studies need to quantify actual average vehicle speeds so that more realistic information can be obtained, rather than just reporting the Speed Limit on the Road.
14. Statistically significant differences were found between LDV and HDV mean emission
factors for all particle metrics.
Mitigation efforts need to focus on limiting population exposure to HDV emissions, and on reducing HDV emission rates.
15. Mean values for published emission factors for particle number for buses were restricted to SMPS measurements.
Bus studies using the CPC are needed to include the nucleation mode, where particle number tends to be very prolific, as SMPS does not usually measure this mode.
16. Statistically significant differences were found between mean emission factors for petrol and diesel-fuelled vehicles for PM10.
Highlights the significant differences between LDV petrol and HDV diesel emission rates (as 14 above).
17. Statistically significant differences were found between mean emission factors related to CPC and SMPS measurements (22.69 and 2.08 x 10¹⁴ particles per km respectively). No statistically significant differences were found in relation to Size Range Measured for particle number between the means of published emission factors for the lower and upper size ranges measured for the various levels of each of the categorical variables.
This difference needs to be addressed as a broader issue. CPC measure the nucleation mode and SMPS generally does not. Particle number in this mode is very prolific. Studies may be needed that focus on the < 18nm size range where particle number tends to be very high.
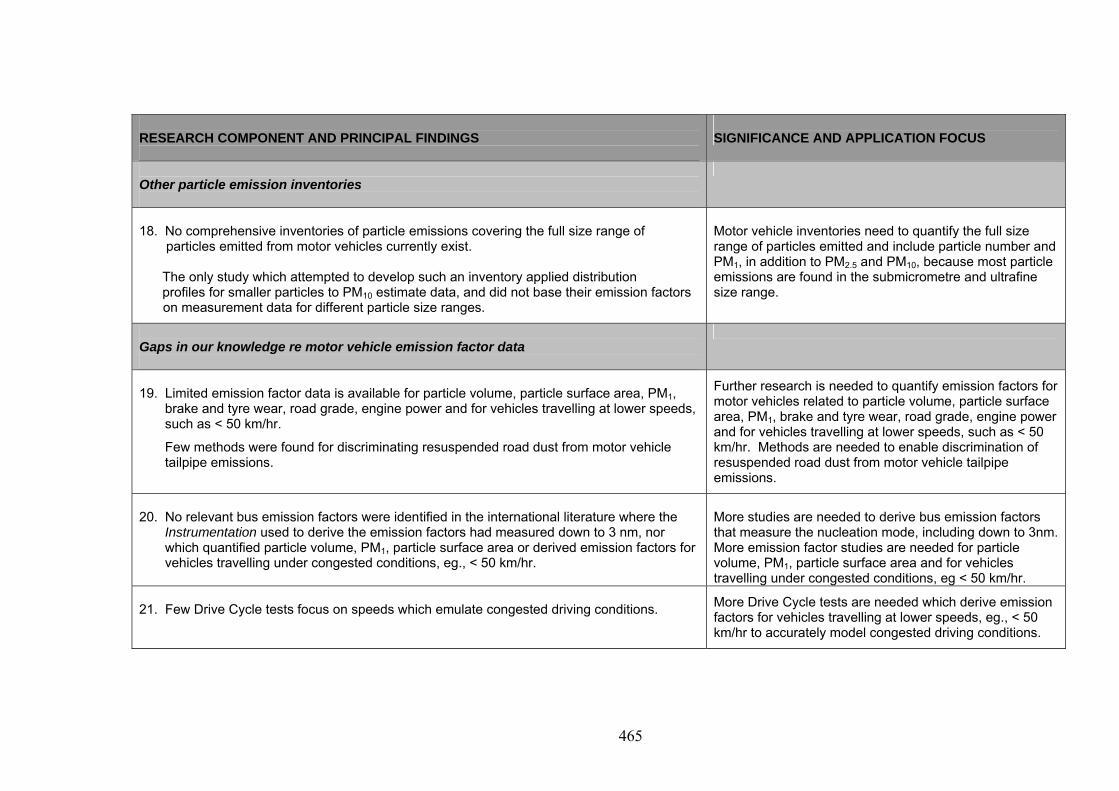
465
RESEARCH COMPONENT AND PRINCIPAL FINDINGS
SIGNIFICANCE AND APPLICATION FOCUS
Other particle emission inventories
18. No comprehensive inventories of particle emissions covering the full size range of particles emitted from motor vehicles currently exist. The only study which attempted to develop such an inventory applied distribution profiles for smaller particles to PM10 estimate data, and did not base their emission factors
on measurement data for different particle size ranges.
Motor vehicle inventories need to quantify the full size range of particles emitted and include particle number and PM1, in addition to PM2.5 and PM10, because most particle emissions are found in the submicrometre and ultrafine size range.
Gaps in our knowledge re motor vehicle emission factor data
19. Limited emission factor data is available for particle volume, particle surface area, PM1, brake and tyre wear, road grade, engine power and for vehicles travelling at lower speeds, such as < 50 km/hr.
Few methods were found for discriminating resuspended road dust from motor vehicle tailpipe emissions.
Further research is needed to quantify emission factors for motor vehicles related to particle volume, particle surface area, PM1, brake and tyre wear, road grade, engine power and for vehicles travelling at lower speeds, such as < 50 km/hr. Methods are needed to enable discrimination of resuspended road dust from motor vehicle tailpipe emissions.
20. No relevant bus emission factors were identified in the international literature where the Instrumentation used to derive the emission factors had measured down to 3 nm, nor which quantified particle volume, PM1, particle surface area or derived emission factors for vehicles travelling under congested conditions, eg., < 50 km/hr.
More studies are needed to derive bus emission factors that measure the nucleation mode, including down to 3nm. More emission factor studies are needed for particle volume, PM1, particle surface area and for vehicles travelling under congested conditions, eg < 50 km/hr.
21. Few Drive Cycle tests focus on speeds which emulate congested driving conditions. More Drive Cycle tests are needed which derive emission
factors for vehicles travelling at lower speeds, eg., < 50 km/hr to accurately model congested driving conditions.

466
RESEARCH COMPONENT AND PRINCIPAL FINDINGS
SIGNIFICANCE AND APPLICATION FOCUS
Development of a comprehensive particle emissions inventory for urban SEQ 22. The 2004 inventory revealed that 93.3% of VKT is related to LDVs, 6.3% to HDVs and
0.4% to buses.
Strategies are needed to reduce LDV VKT and increase vehicle occupancy rates, which were 1.5 passengers in 2004, in order to reduce particle emission levels.
23. HDVs in urban South-East Queensland although they contributed only around 6% of total regional VKT, contributed more than 50% of particle number and PM1 emissions. HDV average emission factors were 20 times higher than LDVs in the submicrometre size range.
Greater effort is needed to focus on reducing population exposure to HDV particle emissions, and to introducing technologies that will reduce emission rates, particularly in the submicrometre size range.
24. The urban South-East Queensland fleet in 2004 was found to emit: 1.08 (0.54-1.97) x 1025 particle number (HDVs contributed 54%) 477 (233-964) tonne of PM1 (HDVs contributed 55%) 736 (225-1436) tonne of PM2.5 (LDVs contributed 61%) 2614 (9668a) tonne PM10 (LDVs contributed 81%) a only the upper 95% confidence level value is available for this particle metric
Particle number inventories for motor vehicle fleets are needed in addition to particle mass inventories.Increasing average vehicle occupancy rates and shifting trips from private car travel to buses have the potential to reduce particle emissions. In 2004 the average vehicle occupancy rate for LDVs was 1.5 passengers and buses 15.5 passengers per vehicle, indicating ample opportunity for increases to occur.
25. In the 2004 urban South-East Queensland inventory:-
total LDV emissions dominated PM2.5 and PM10 emissions on roads with speed limits of < 80 km/hr (urban roads);
and total HDVs dominated particle number and PM1 on higher speed roads with speed limits of ≥ 80 km/hr (urban-major roads).
Greater efforts are needed to reduce on-road LDV and HDV VKT. These results were influenced by the fact that LDV VKT on urban roads was almost double HDV VKT; and the HDV emission factor for urban-major roads was almost 6 times that for LDVs and total HDV VKT was slightly higher than total LDV VKT on this Road Type.

467
RESEARCH COMPONENT AND PRINCIPAL FINDINGS
SIGNIFICANCE AND APPLICATION FOCUS
Validation of the developed inventory 26. The only inventory able to be compared to the particle number and particle mass inventories for urban South-East Queensland developed in this study related to a PM10 invnetory developed by the Queensland Environmental Protection Agency (QEPA) for SEQ, which was 2249 tonne per annum for 2000. The QEPA estimate compares well with the urban South-East Queensland quantification of 2614 tonne for PM10 found in this study.
The inventory quantified for PM10 for urban South-East Queensland derived in this study compares well with the Queensland Environmental Protection Agency PM10 inventory, and therefore confidence can be had in the total inventory for urban South-East Queensland developed in this study.
Scenario modelling using the urban South-East Queensland inventory data – findings and likely future emissions 27. Each 10% reduction in LDV VKT, where 70-100% of these passengers moved to new buses, was associated with reductions of 3-4% for particle number, 1-2% for PM2.5 and 1-6% for PM10, respectively.
Each 10% reduction in Work Trip LDV VKT (trips to and from work from home) where 50% of these passengers moved to new buses, was associated with reductions of 2% for particle number; 2-3% for PM2.5 and 3-4% for PM10 respectively.
Average vehicle occupancy rates for LDVs and buses in urban South-East Queensland could be increased to reduce particle emission levels, which were 1.5 passengers and 15.5 passengers respectively in 2004. Bus occupancy rates of around 35-45 passengers are possible with the SEQ bus fleet.
28. Emissions per passenger per km travelled were:-
LDVs emissions were 1-2 orders of magnitude higher than buses for particle number; PM2.5 emissions were similar for LDV and Diesel buses; LDV emissions for PM10 were almost 5 times those for Diesel buses and several orders of
magnitude higher than Compressed Natural Gas buses.
Even greater reductions in particle emissions rates could be achieved by increasing bus occupancy rates (Refer 28 above).
29. Particle emissions predicted for urban SEQ in 2026 indicate an 100-fold increase in
particle number; and reductions of 38% for PM1, 36% for PM2.5 and 31% for PM10.
More action is needed to reduce HDV particle number and submicrometre emissions, and limit population exposure to HDVs and identify environmentally-sustainable lower polluting options for moving freight.
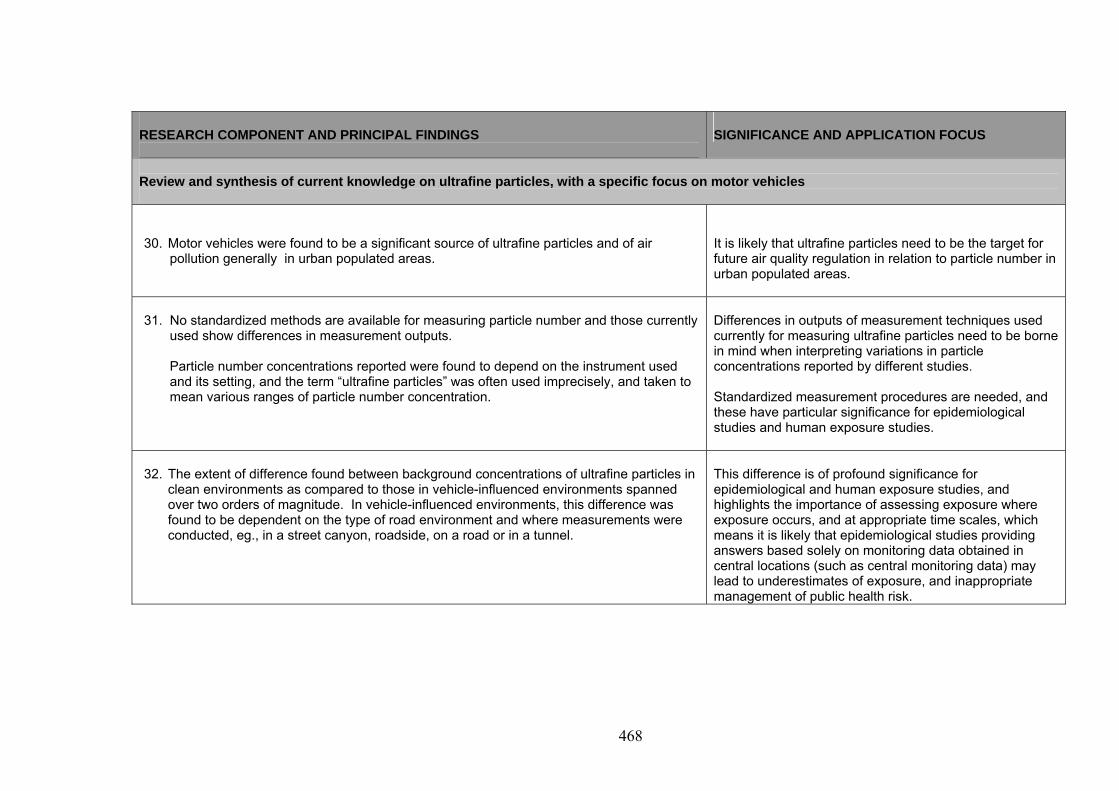
468
RESEARCH COMPONENT AND PRINCIPAL FINDINGS
SIGNIFICANCE AND APPLICATION FOCUS
Review and synthesis of current knowledge on ultrafine particles, with a specific focus on motor vehicles 30. Motor vehicles were found to be a significant source of ultrafine particles and of air pollution generally in urban populated areas.
It is likely that ultrafine particles need to be the target for future air quality regulation in relation to particle number in urban populated areas.
31. No standardized methods are available for measuring particle number and those currently used show differences in measurement outputs. Particle number concentrations reported were found to depend on the instrument used and its setting, and the term “ultrafine particles” was often used imprecisely, and taken to mean various ranges of particle number concentration.
Differences in outputs of measurement techniques used currently for measuring ultrafine particles need to be borne in mind when interpreting variations in particle concentrations reported by different studies. Standardized measurement procedures are needed, and these have particular significance for epidemiological studies and human exposure studies.
32. The extent of difference found between background concentrations of ultrafine particles in
clean environments as compared to those in vehicle-influenced environments spanned over two orders of magnitude. In vehicle-influenced environments, this difference was found to be dependent on the type of road environment and where measurements were conducted, eg., in a street canyon, roadside, on a road or in a tunnel.
This difference is of profound significance for epidemiological and human exposure studies, and highlights the importance of assessing exposure where exposure occurs, and at appropriate time scales, which means it is likely that epidemiological studies providing answers based solely on monitoring data obtained in central locations (such as central monitoring data) may lead to underestimates of exposure, and inappropriate management of public health risk.
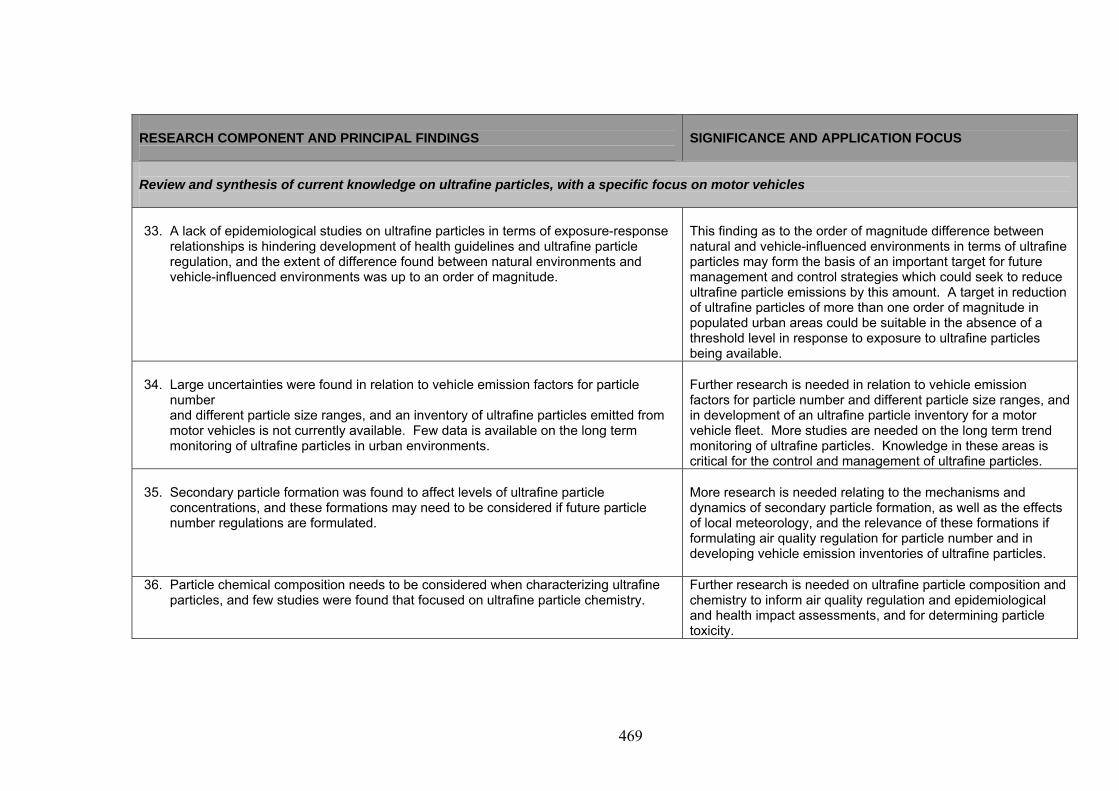
469
RESEARCH COMPONENT AND PRINCIPAL FINDINGS
SIGNIFICANCE AND APPLICATION FOCUS
Review and synthesis of current knowledge on ultrafine particles, with a specific focus on motor vehicles 33. A lack of epidemiological studies on ultrafine particles in terms of exposure-response
relationships is hindering development of health guidelines and ultrafine particle regulation, and the extent of difference found between natural environments and vehicle-influenced environments was up to an order of magnitude.
This finding as to the order of magnitude difference between natural and vehicle-influenced environments in terms of ultrafine particles may form the basis of an important target for future management and control strategies which could seek to reduce ultrafine particle emissions by this amount. A target in reduction of ultrafine particles of more than one order of magnitude in populated urban areas could be suitable in the absence of a threshold level in response to exposure to ultrafine particles being available.
34. Large uncertainties were found in relation to vehicle emission factors for particle
number and different particle size ranges, and an inventory of ultrafine particles emitted from motor vehicles is not currently available. Few data is available on the long term monitoring of ultrafine particles in urban environments.
Further research is needed in relation to vehicle emission factors for particle number and different particle size ranges, and in development of an ultrafine particle inventory for a motor vehicle fleet. More studies are needed on the long term trend monitoring of ultrafine particles. Knowledge in these areas is critical for the control and management of ultrafine particles.
35. Secondary particle formation was found to affect levels of ultrafine particle
concentrations, and these formations may need to be considered if future particle number regulations are formulated.
More research is needed relating to the mechanisms and dynamics of secondary particle formation, as well as the effects of local meteorology, and the relevance of these formations if formulating air quality regulation for particle number and in developing vehicle emission inventories of ultrafine particles.
36. Particle chemical composition needs to be considered when characterizing ultrafine particles, and few studies were found that focused on ultrafine particle chemistry.
Further research is needed on ultrafine particle composition and chemistry to inform air quality regulation and epidemiological and health impact assessments, and for determining particle toxicity.

470
8.4. GENERAL CONCLUSIONS FROM THIS STUDY
The general conclusions from this PhD study related to:-
8.4.1. Modality in ambient particle size distributions
Examination of the modes in particle size distributions was found to have
potential as a basis for developing air quality standards and guidelines, as modes
provided extremely valuable information about contributions from different
pollution sources and particle mechanisms.
The research found that a clear and distinct separation occurred at around 1 µm in
600 modal location values examined for particle number, surface area, volume
and mass size distributions in a wide range of environments worldwide; and a
similar separation was also found in all urban South-East Queensland
environments examined between the accumulation and coarse modes for particle
volume and number size distributions at around 1µm.
8.4.2. A new mass air quality standard for PM1, and its combination with
PM10
Based on the results of the urban South-East Queensland study and the other
studies conducted around the world, it is concluded that PM1 and PM10 offer
greater potential as a combination of particle mass standards than the current mass
standards of PM2.5 and PM10 for combustion sources, such as motor vehicles, for
discriminating between combustion and mechanically-generated particles.
Although presently few data exist on PM1 concentrations, measurement
technologies are available which are similar to those used for PM2.5 monitoring.

471
The analysis revealed that:-
(i) PM10 measurements provided information almost entirely on particles
generated from mechanical processes and belonging to the coarse mode
(eg., mechanical wear and tear or tyres, particles resuspended by vehicle
traffic);
(ii) PM2.5 measurements (coarse mode) provided information mainly on
mechanically-generated particles, but for some environments
contributions from combustion process modes (nucleation and
accumulation modes) was significant. This finding led to the conclusion
that interpreting PM2.5 data and distinguishing contributions from
different sources could become complex, and suggests that PM2.5, as a
basis for a standard, may be inadequate for controlling particle emissions
and concentrations; and
(iii) PM1 measurements (nucleation and accumulation modes) provided very
good information about combustion-generated processes and enabled a
clear discrimination to be made between combustion and mechanically-
generated aerosols.

472
More discussion and research is needed on the best combination of particle
number and mass concentration ambient air quality standards to control motor
vehicle emissions, including consideration of standards for submicrometre and
smaller particle size ranges, such as ultrafine particles; and substantial progress is
currently being made in development of monitoring technologies suitable to
measure particle number concentration.
8.4.3. A comprehensive set of particle emission factors for motor vehicles
The research was successful in deriving a set of average particle emission factors
for different Vehicle and Road Type combinations which can be used in transport
modelling and air quality assessments to model urban fleet emissions in the
developed world. These emission factors enable estimation of comprehensive,
size-resolved inventories covering the full size range of particles emitted by motor
vehicles, including particle number and particle mass.
The emission factors were derived from statistical models developed from a
review of more than 600 particle emission factors in the international published
literature and explain 86%, 93%, 87%, 65% and 47% of the variation in published
emission factor values for particle number, particle volume, PM1, PM2.5 and PM10
respectively. These emission factors are particularly suitable to use in regions
which do not have measurement data, or funding to undertake measurements, or
where experimental data is of insufficient scope; and can be used to develop road
link-based inventories and quantification of the spatial distribution of particle
concentrations in urban regions.

473
Inventories provide useful benchmark information on current pollution levels and
can inform the development of air quality guidelines and regulations to control
particle emissions, and modelling of transport planning scenarios which evaluate
the air quality implications of future transport and land use strategies, and
initiatives such as the introduction of new vehicle standards, new fuels and
technologies.
The comprehensive set of particle emission factors derived in this study provide
land use and transport planners with a straightforward method for evaluating the
air quality implications of a wide range of urban forms - from high density living
areas to areas with increased urban sprawl - and for evaluating the impact of new
busway and transport infrastructure developments. Without such a method and set
of emission factors their ability to minimize the important and potentially severe
health effects of particulate matter exposure in their planning and decision-making
would be severely limited.
In addition, the very high values of average emission factors derived for HDVs
emphasize that HDV movement requires very careful consideration in land use
and transport planning, and special attention in the setting of air quality standards
and regulations. HDV movement on roads situated close to populations requires
careful monitoring to minimize exposure to these gross emitters.
474
8.4.4. The first published comprehensive particle emissions inventory
for a motor vehicle fleet
This study presents the first published comprehensive inventory of motor vehicle
particle emissions covering the full size range of particles emitted by motor
vehicles and including particle number and particle mass. Conclusions from its
development and from analyses which modelled the air quality implications of
different future passenger and freight vehicle scenarios are as follows:-
• It was found that HDVs contributed only around 6% of regional VKT, but
contributed more than 50% of particle number and PM1 emissions which
means that urgent action is needed to reduce HDV diesel vehicle
emissions. Similar findings would be expected in other areas with high
HDV diesel VKT and, as urban South-East Queensland is not highly
industrialized region and is more service and tourism oriented, this means
that even larger HDV particle emissions could be expected in areas with
higher levels of industrialization. HDV particle emissions are a global
problem which requires reduction strategies such as mandatory fitting of
particle filters, regular emissions testing, and identification of freight
options and freight routes that produce lower emissions per tonne-
kilometre and result in lower exposures for populations in close proximity
to truck routes.

475
• This study demonstrated the value of examining and modelling changes in
average vehicle occupancy rates of LDVs and buses, which can be useful to
identify the extent to which small changes in travel mode choice and
occupancy rates can achieve reductions in particle emission levels.
• It was found that modelling future scenarios, such as modelled for 2026 for
urban South-East Queensland, which predicted an 100-fold increase in particle
number and 31-36% reduction in particle mass, offer opportunities to design
mitigation efforts tailored to expected changes in travel demand and vehicle
technologies.
• To adequately control particle emissions emitted by motor vehicles, guidelines
and standards need to be introduced for both particle number and PM1 to
complement existing mass-based standards.
• Another conclusion of this study is that developing regular particle inventories
will help identify hotspots, roads, busways and tunnels that pose a significant
health risk to exposed populations. Inventories are also needed to evaluate the
particle emission implications of new transport infrastructure developments
both pre and post-construction and initiatives such as high density living and
transit oriented developments.

476
• Urban congestion is a global problem which affects travel time and has
environmental implications. It contributes to pollution levels and climate
change effects. Specific speed-related emission factors need to be derived
to enable the modelling of traffic congestion and vehicles travelling at
lower speeds in urban areas.
• It is considered important that the work in this inventory be extended to
quantify the spatial distribution of particle concentrations, and that an
understanding be gained of the socioeconomic characteristics of
populations affected by hot-spots and their corresponding land use
classifications.
• This study also provides new knowledge that can be used in climate
models to assess the impact of motor vehicle particle emissions on the
global airshed, including particle concentrations reaching into the
troposphere and stratosphere, and their potential contribution to effects
such as the cooling and dimming of the planet, and climate change effects.
477
8.4.5. Synthesis of current knowledge on ultrafine particles in
relation to motor vehicles
The review and synthesis found that ultrafine particles are likely to be the target
for development of future air quality standards for particle number in relation to
motor vehicles in populated urban areas, and that a better understanding of
ultrafine particles is needed in terms of their temporal and spatial distribution,
long term trend monitoring and particle composition and chemistry. In addition,
it found that a motor vehicle emissions inventory is not currently available for
particle number or ultrafine particles in the published literature.
Standardized methods need to be developed for measuring particle number, and
discrepancies were found in terms of the outcomes of measurement techniques
currently used to measure ultrafine particles. This has implications for reviewing
variations in particle concentrations reported in different studies, and for
epidemiological studies and human exposure assessments.
The work provides direction for future management and control of ultrafine
particles and suggests a general target for reducing ultrafine particles generated by
motor vehicles in populated urban areas. It highlights the importance of
investigating the relevance of secondary particle formations in the formulation of
future particle number air quality regulation.

478
8.5. SCIENTIFIC CHALLENGES AND THE NOVEL
CONTRIBUTION OF THIS PHD STUDY
It is very important to quantify the extent of particle emissions emitted from
motor vehicle fleets because they are a major source of pollution and there are
known adverse health effects associated with exposure. To control this ever-
growing pollution source air quality regulations and development of regular
inventories are needed to quantify the extent and distribution of this pollution.
This PhD study contributes new knowledge and understanding to the field by:-
• Firstly, developing a new method for deriving inventories of motor
vehicle particle emissions covering the full size range of particles
emitted, and including particle number and particle mass emissions. This
method involves combining knowledge from two different disciplines -
from aerosol science and transport modelling, which is a novel approach
because it has never been attempted before.
• Secondly, devising new concepts for identifying suitable emission
factors to use in developing inventories. These included analysing a very
large set of emission factor data from Australia and overseas and
developing statistical models to derive average emission factors for
different vehicle and road type combinations for different particle sizes
and metrics, which have never been developed before.

479
• Thirdly, designing a new approach and new concepts for examining
modality within particle size distributions that is novel and has
never been done before, which deepened our understanding about
the fraction of mass contributed to different particle size ranges by
different sources and identified a new particle mass standard, PM1,
which was found to be suitable for the majority of worldwide
environments.
• Fourthly, providing evidence that a combination of PM1 and PM10
standards provide a more suitable combination of ambient particle
mass emission standards for discriminating between mechanical
and combustion-generated sources, such as emitted by motor
vehicles, than the present mass standards of PM2.5 and PM10.
• Fifthly, this study presents the first published comprehensive
inventory for a motor vehicle fleet which covers the entire size
range of particles emitted and includes particle number and size
fractions of particle mass for different vehicle and road type
combinations.
• Sixthly, developing new approaches for modelling future scenarios of
travel demand and their particle emission implications.

480
• Seventhly, current knowledge on ultrafine particles as it relates to
motor vehicles has been extensively reviewed and synthesized, and
this analysis provides clear guidelines on future directions needed in
research to ensure accurate epidemiological studies and human
exposure assessment and quantification of particle number and
ultrafine particles in populated urban areas.
8.6 COMPARISON OF EMISSION FACTORS DERIVED IN THIS PHD
STUDY WITH A SELECTION OF CANADIAN, EUROPEAN, UK
AND USA EMISSION FACTORS
Table 8.2 compares a selection of emission factors recommended for use in the
Australian National Pollutant Inventory (NPI) and from Australian Diesel
NEPM preparatory work, Canadian, European, UK, and USA studies, to those
derived in this PhD study. Particle volume and fleet emission factors were not
included in this comparison as they are not considered relevant for developing
inventories. At the time of this study, the majority of LDVs were petrol-fuelled
and HDVs diesel-fuelled.
When reviewing the analysis presented in Table 8.2, it should be borne in mind
that the emission factors derived in this PhD study using advanced statistical
analysis were found to explain 86%, 87%, 65% and 47% of the variation in
published emission factors for particle number, PM1, PM2.5 and PM10
respectively.

481
Table 8.2 Comparison of Australian National Pollutant Inventory (NPI), Australian Diesel NEPM Preparatory Work, and a selection of Canadian, European, UK and USA particle emission factors, with emission factors derived in this PhD study Particle metric
Researchers Method HDV emission factor (diesel-
fuelled)
LDV (petrol-fuelled)
Bus (Diesel-fuelled) b
emission factor emission factor emission factor Particle number
1014 particles per km
This study Keogh et al. 2009 Derived using advanced statistical analysis of measurement data sourced from an extensive worldwide literature review
65 (60.19-69.81) 3.63 (a-9.85) 3.08 (a-9.30)
Australia Jamriska et al. 2004 Tunnel measurements n/a n/a 2.27, 3.11
Australia Morawska et al. 2001
Dynamometer measurements 5.9 n/a n/a
Australia Ristovski et al. 2002
Dynamometer measurements n/a n/a 3.87
Australia Morawska et al. 2005
On-road measurements 1.53 to 7.17 2.18 to 6.08 n/a
Austria Imhof et al. 2005a
Tunnel measurements 3.94 0.59 n/a
European drive cycles
CONCAWE 1998 Dynamometer measurements n/a 0.362 to 1.59 n/a
Sweden Gidhagen et al. 2003
Tunnel measurements 73.3 10.1 n/a

482
Particle metric
Researchers
Method
HDV emission factor (diesel-
fuelled)
LDV (petrol-
fuelled)
Bus (Diesel-
fuelled) b
emission factor
emission factor emission factor
Particle number (c’td)
1014 particles per km
Germany Imhof et al. 2005c On-road measurements 7.79 1.22 n/a
Sweden Gidhagen et al. 2004 On-road measurements 52 1.4 n/a
Switzerland Imhof et al. 2005a On-road measurements 55, 73 3.2, 6.9 n/a
UK Jones and Harrison 2006 On-road measurements 6.36 7.05 n/a
UK Imhof et al. 2005a Tunnel measurements 6.84 0.59 n/a
USA Cadle et al. 2001 Dynamometer measurements n/a 0.04 to 2.36 n/a
PM1 mg per km This study Keogh et al. 2009 Derived using advanced statistical analysis of
measurement data sourced from an extensive worldwide literature review
287 (257-317)
16 (a-50)
n/a
Australia Department of Environment & Heritage (DOEH 2003)
Dynamometer, composite urban drive cycle 257 to 364
n/a n/a
Switzerland Imhof et al. 2005b On-road measurements 187 to 413 4, 29 n/a

483
Particle metric
Researchers Method HDV emission factor (diesel-
fuelled)
LDV (petrol-fuelled)
Bus (Diesel-fuelled) b
emission factor emission factor emission factor PM2.5
mg per km
This study Keogh et al. 2009 Derived using advanced statistical analysis of measurement data sourced from an extensive worldwide literature review
302 (236-367) 33 (a-80) 299b (205-394)
Australia NEPC (2000) - Diesel preparatory project
Dynamometer testing on composite urban drive cycle
397 to 672 n/a 695, 1068
Australia National Pollutant Inventory (NPI 2008)
Calculated using a US PM profile from the California Emission Inventory and Reporting System (CEIDARS 2000)
n/a
7.45, 9.11
n/a
Australia
Jamriska et al. 2004
Tunnel measurements
n/a
n/a
201-583
Australia
Tran et al. 2003 Tunnel measurements d
526
7
n/a
UK Imhof et al. 2005a Tunnel measurements
381 19 n/a
USA
Abu-Allaban et al. 2003
On-road measurements on different Road Types
57 to 480
7 to 90
105 to 260
USA Gertler et al. 2002 Tunnel measurements
135 14 n/a
USA
Wayne et al. 2004
Dynamometer measurements
n/a
n/a
42-124

484
Particle metric
Researchers Method HDV emission factor (diesel-
fuelled)
LDV (petrol-fuelled)
Bus (Diesel-fuelled) b
emission factor emission factor emission factor
PM10
mg per km
PM10 for different Road Types
Australia National Pollutant Inventory (NPI 2008)
Based on UK 2000 g/L data from UK Emissions Inventory Database (NAEI 2007)
n/a
9.82 n/a
Australia National Pollutant
Inventory (NPI 2008) Sourced from UK Emissions Inventory Database (NAEI 2007), based on g/L, petrol density 739 kg/kL.
n/a
8.03 n/a
This study
Keogh et al. 2009
Boulevard c
4815 (3459-6171)
454 (a-1413)
4130 (2774-5486)
USA Abu-Allaban et al. 2003 Boulevard c 530 to 9100 90 to 850 460, 650, 7800 This study
Keogh et al. 2009
Freeway
2500 (1144-3856)
285 (a-1244)
n/a
USA Abu-Allaban et al. 2003 Freeway 1300, 3700 100, 260, 680 n/a
This study
Keogh et al. 2009
Highway
840 (a-1947)
141 (a-924)
n/a
Australia NSW EPA 2003 cited in Hibberd 2005 Highway (arterial road)
186-311
17 n/a
Switzerland Gehrig et al. 2004 Highway 344 33
n/a
Switzerland Imhof et al. 2005b Highway 275 26
n/a USA
Abu-Allaban et al. 2003
Highway
1900, 9100 90, 215 n/a

485
Particle metric
Researchers Method HDV emission factor (diesel-
fuelled)
LDV (petrol-fuelled)
Bus (Diesel-fuelled) b
emission factor emission factor emission factor PM10 (c’td) mg per km PM10 for different Road Types
This study Keogh et al. 2009 Motorway 213 (a-1568) 63 (a-1419) n/a
Switzerland Imhof et al. 2005b Motorway 158 63 n/a
Switzerland Gehrig et al. 2004 Motorway 267 63 n/a This study
Keogh et al. 2009
Rural Area
394 (a-2312)
46 (a-1964) n/a
Switzerland Gehrig et al. 2004 Rural area 394 46 n/a This study
Keogh et al. 2009
Tunnel
1019 (236-1802)
14 (a-797) n/a
Australia Tran et al. 2003 Tunnel measurements d 615 9 n/a
Australia Hibberd 2005 Tunnel measurements 2000 5, 10, 22 n/a
Austria Imhof et al. 2005a Tunnel measurements 944 n/a n/a
Austria Schmid et al. 2001 Tunnel measurements 394 30 n/a
USA Gertler et al. 2002 Tunnel measurements 181 10 n/a

486
Particle metric
Researchers Method HDV emission factor (diesel-
fuelled)
LDV (petrol-fuelled)
Bus (Diesel-fuelled) b
emission factor emission factor emission factor
PM10 (c’td)
mg per km
PM10 for different Road Types
This study
Keogh et al. 2009
Urban e
538 (a-1145)
156 (a-635)
1089 (306-1872)
Australia NEPC (2000) - Diesel preparatory project
Urban - dynamometer composite urban drive cycle classed as Urban Road Type e n/a n/a 698, 1100
Canada
Environment Canada cited in Lowell et al. 2003
Urban - dynamometer urban drive cycles, classed as Urban Road Type e n/a n/a
149, 230, 863, 1224, 3416,
Switzerland Gehrig et al. 2004 Urban - on-road measurements 496, 703, 1268 30, 49, 104 n/a
Switzerland Imhof et al. 2005b Urban - on-road measurements 652 51 n/a
USA Abu-Allaban et al. 2003 Urban - on-road measurements c 750 100, 180 650
USA Cadle et al 1997 Urban - dynamometer urban drive cycles classed as Urban Road Type e n/a 3.9 n/a
USA Cadle et al 2001 Urban - dynamometer urban drive cycles classed as Urban Road Type e n/a 32 n/a
This study
Keogh et al. 2009
Dynamometer
n/a
n/a
313 (a-753)
UK
Romilly 1999
Dynamometer measurements
n/a
n/a
347 to 668

487
a The lower bound 95% confidence interval value calculated to be negative and therefore is not valid. These values, although physically uninterpretable, can be obtained as a
consequence of the normal assumptions underlying the models, and hence are not reported. b Buses – principally diesel-fuelled buses. Some studies did not specify fuel used, and
due to the timing and location of studies, these can be assumed to be diesel-fuelled. c These on-road Boulevard and Urban Road Type studies were reported to be affected by very
high levels of resuspended road dust and the influence of variation in acceleration and speed (Abu-Allaban et al. 2003). d In-stack pollution monitoring data and hourly vehicle
counts. e Due to the small sample size of emission factors derived from measuremens on urban roads, dynamometer measurements of urban and Central Business District (CBD)
drive cycles were classed as Urban Road Type. (NAEI) UK National Atmospheric Emissions Inventory “Emissions Factor Database” retrieved August 2007 from the NAEI
website (www.naei.org.uk/emissions/index.php) (CEIDARS) California Emission Inventory and Reporting System (2002), Particulate Matter (PM) Speciation Profiles,
26/09/2002.
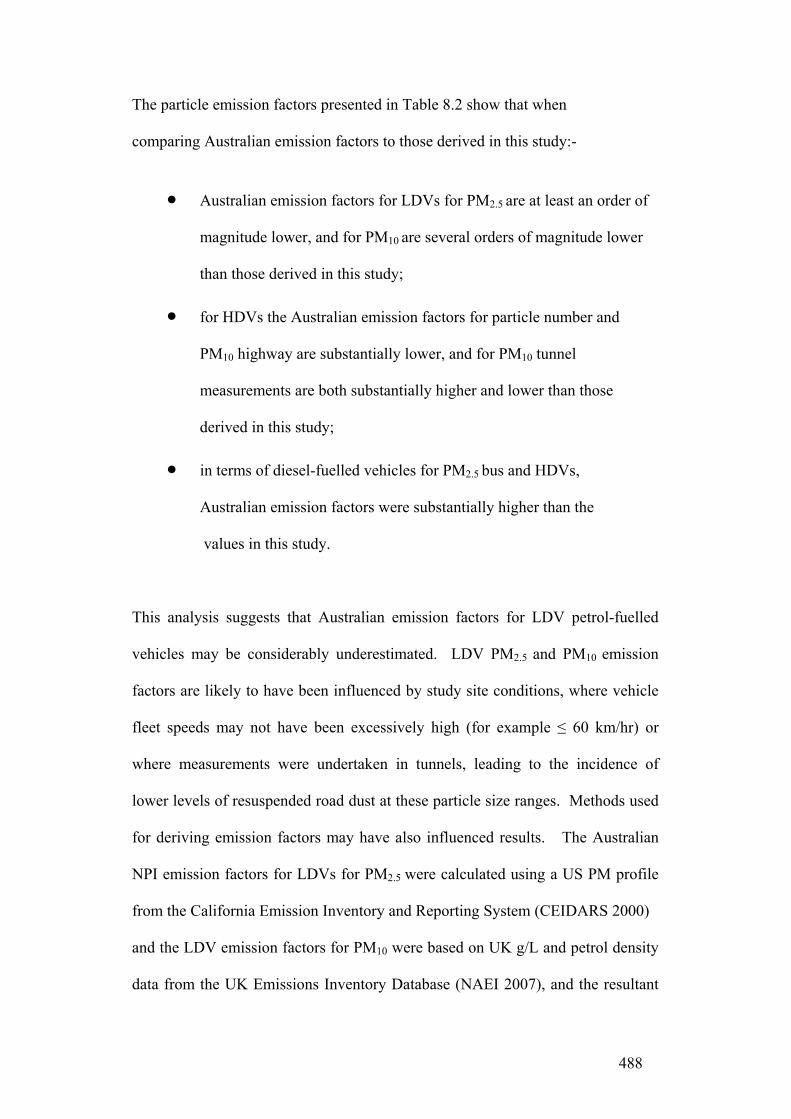
488
The particle emission factors presented in Table 8.2 show that when
comparing Australian emission factors to those derived in this study:-
• Australian emission factors for LDVs for PM2.5 are at least an order of
magnitude lower, and for PM10 are several orders of magnitude lower
than those derived in this study;
• for HDVs the Australian emission factors for particle number and
PM10 highway are substantially lower, and for PM10 tunnel
measurements are both substantially higher and lower than those
derived in this study;
• in terms of diesel-fuelled vehicles for PM2.5 bus and HDVs,
Australian emission factors were substantially higher than the
values in this study.
This analysis suggests that Australian emission factors for LDV petrol-fuelled
vehicles may be considerably underestimated. LDV PM2.5 and PM10 emission
factors are likely to have been influenced by study site conditions, where vehicle
fleet speeds may not have been excessively high (for example ≤ 60 km/hr) or
where measurements were undertaken in tunnels, leading to the incidence of
lower levels of resuspended road dust at these particle size ranges. Methods used
for deriving emission factors may have also influenced results. The Australian
NPI emission factors for LDVs for PM2.5 were calculated using a US PM profile
from the California Emission Inventory and Reporting System (CEIDARS 2000)
and the LDV emission factors for PM10 were based on UK g/L and petrol density
data from the UK Emissions Inventory Database (NAEI 2007), and the resultant

489
Australian NPI emission factors are up to one order of magnitude lower than most
other worldwide emission factor values derived for LDVs cited in Table 8.2. This
highlights a major discrepancy in the values presented for LDVs in the Australian
NPI emission inventory manuals.
For PM2.5 diesel-fuelled HDVs and buses, differences may relate to the nature of
the composite driving cycle used for dynamometer testing for the Australian
emission factors, which included six different CUEDC cycles developed to
represent driving in a range of urban traffic conditions, from congested to
highway/freeway (NEPC 2000).
In the case of particle number emission factors, these lower value emission factors
may be due to the choice of instrumentation used and the size range measured,
particularly in cases where the lower size range of the nucleation mode has not
been measured (< 10 nm).
The particle emission factors presented in Table 8.2 demonstrate that when
comparing Canadian, European, UK and USA emission factors with those derived
in this study for:-
• Particle number: Considerable variation was found. HDV particle
emission factors derived in Austria, Germany and the UK were an
order of magnitude lower than those derived in this study. LDV
emission factors from Austria were an order of magnitude lower;
European drive cycle, German and USA studies were lower; and
UK emission factors were both higher and lower than this study.
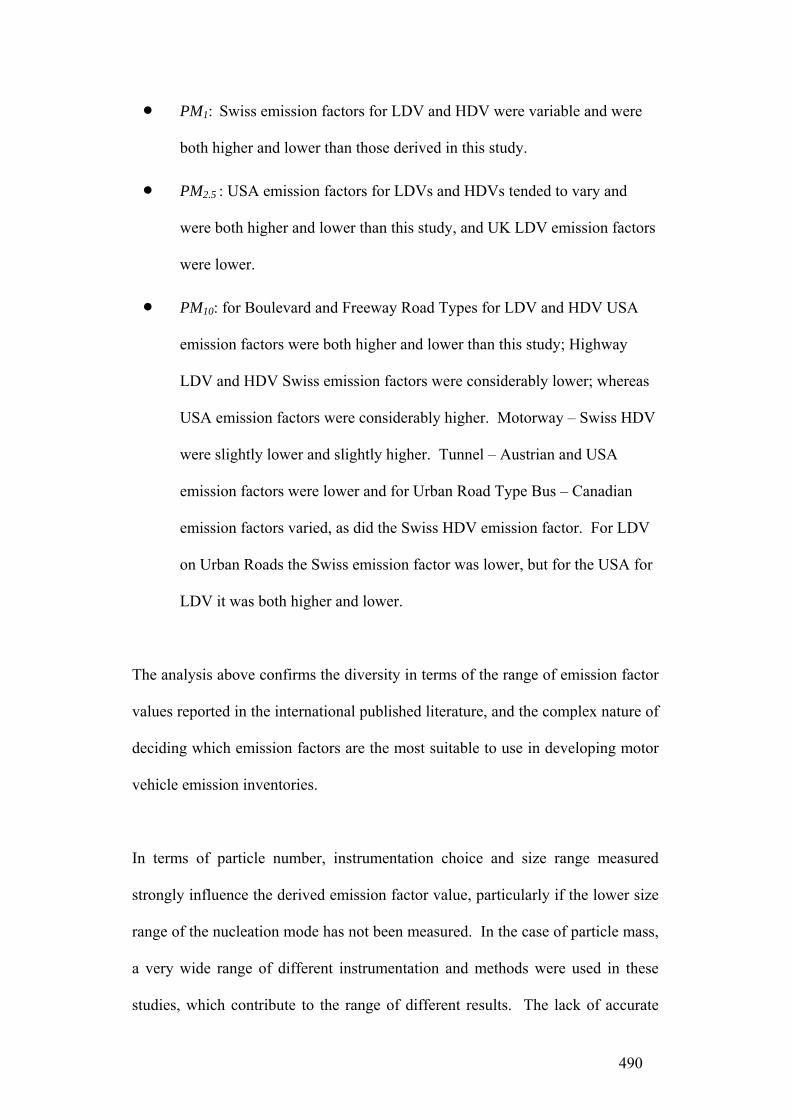
490
• PM1: Swiss emission factors for LDV and HDV were variable and were
both higher and lower than those derived in this study.
• PM2.5 : USA emission factors for LDVs and HDVs tended to vary and
were both higher and lower than this study, and UK LDV emission factors
were lower.
• PM10: for Boulevard and Freeway Road Types for LDV and HDV USA
emission factors were both higher and lower than this study; Highway
LDV and HDV Swiss emission factors were considerably lower; whereas
USA emission factors were considerably higher. Motorway – Swiss HDV
were slightly lower and slightly higher. Tunnel – Austrian and USA
emission factors were lower and for Urban Road Type Bus – Canadian
emission factors varied, as did the Swiss HDV emission factor. For LDV
on Urban Roads the Swiss emission factor was lower, but for the USA for
LDV it was both higher and lower.
The analysis above confirms the diversity in terms of the range of emission factor
values reported in the international published literature, and the complex nature of
deciding which emission factors are the most suitable to use in developing motor
vehicle emission inventories.
In terms of particle number, instrumentation choice and size range measured
strongly influence the derived emission factor value, particularly if the lower size
range of the nucleation mode has not been measured. In the case of particle mass,
a very wide range of different instrumentation and methods were used in these
studies, which contribute to the range of different results. The lack of accurate

491
methods available, at this time, for discriminating motor vehicle tailpipe particle
emissions from resuspended road dust, particularly at the PM2.5 and PM10 size
range, further add to the complexity of interpreting on-road measurements,
particularly under high-speed scenarios where high levels of road dust may be
resuspended.
8.7. FUTURE RESEARCH FOCUS
A number of recommendations are made for future studies which could be based
on the data, knowledge and methods developed in this PhD research project, and
on gaps in existing knowledge identified in this study in terms of ultrafine
particles as they relate to motor vehicles. These studies could relate to
quantifying particulate matter pollution; developing air quality monitoring tools,
guidelines, standards and policies; undertaking scenario modelling of particle
emissions; and freight and fleet-related studies; and the conduct of further
research related to ultrafine particles. The recommended studies are outlined in
Table 8.2 and also discussed below.
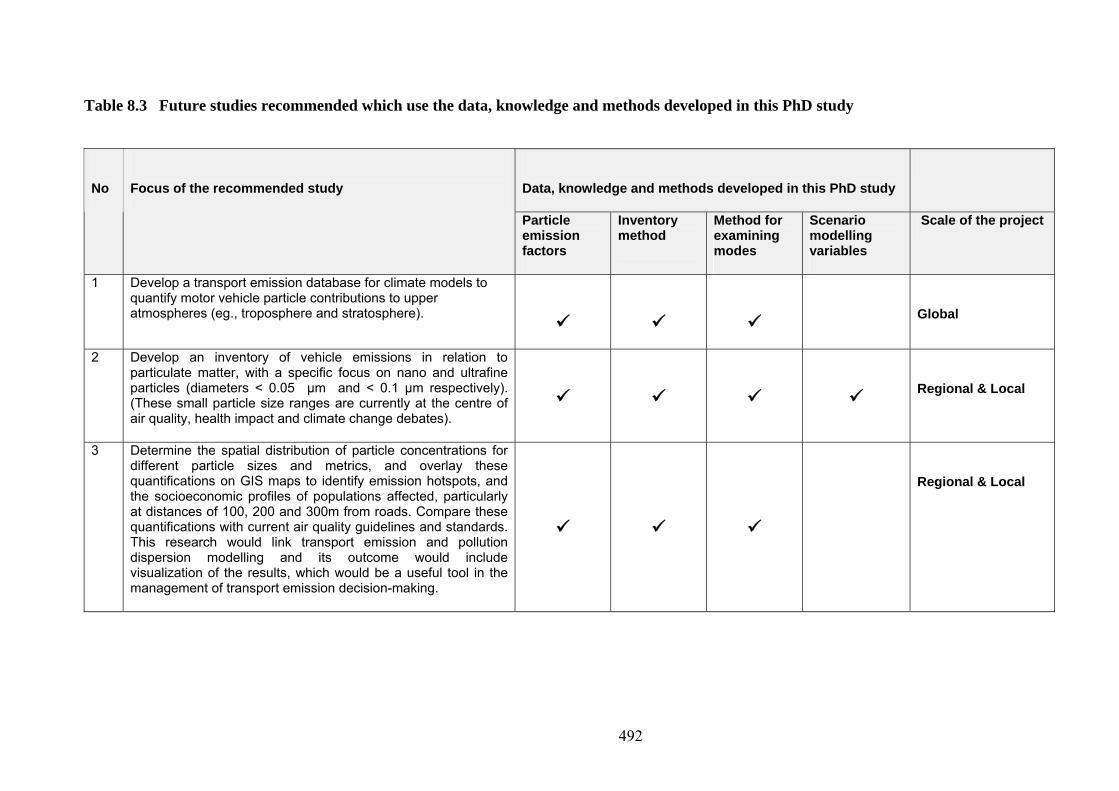
492
Table 8.3 Future studies recommended which use the data, knowledge and methods developed in this PhD study
Data, knowledge and methods developed in this PhD study
No
Focus of the recommended study
Particle emission factors
Inventory method
Method for examining modes
Scenario modelling variables
Scale of the project
1 Develop a transport emission database for climate models to quantify motor vehicle particle contributions to upper atmospheres (eg., troposphere and stratosphere).
Global
2 Develop an inventory of vehicle emissions in relation to particulate matter, with a specific focus on nano and ultrafine particles (diameters < 0.05 µm and < 0.1 µm respectively). (These small particle size ranges are currently at the centre of air quality, health impact and climate change debates).
Regional & Local
3 Determine the spatial distribution of particle concentrations for different particle sizes and metrics, and overlay these quantifications on GIS maps to identify emission hotspots, and the socioeconomic profiles of populations affected, particularly at distances of 100, 200 and 300m from roads. Compare these quantifications with current air quality guidelines and standards. This research would link transport emission and pollution dispersion modelling and its outcome would include visualization of the results, which would be a useful tool in the management of transport emission decision-making.
Regional & Local

493
No
Focus of the recommended study
Data, knowledge and methods developed in this PhD study
Particle emission factors
Inventory method
Method for examining modes
Scenario modelling variables
Scale of the project
4 Design an air quality alert system which automatically calculates, on a daily basis, the particle contributions from LDVs and HDVs on selected roads using traffic data.
Vehicle-based
5 Predictive modelling of particle and gaseous emissions for different scenarios of pre and post-construction of busways, tunnels and major transport infrastructure to determine their air quality implications. This would include research into the components of the transport system which are the most sensitive in terms of effecting changes in regional particle emission levels (eg., vehicle occupancy rates).
Local airshed
Road-link based
Vehicle-based
6 Quantify HDV VKT and average freight loads to determine particle emissions per tonne of freight carried per km, and identify other low polluting options for transport (eg., rail, intermodal options, B-triples etc)
HDV Vehicle-based
7
Research into, and develop recommendations for the most appropriate air quality guidelines and standards, in terms of both particle number and particle mass, to control motor vehicle particle emissions, with a special focus on the smallest particles, in the nano and ultrafine size ranges.
Vehicle-based

494
No
Focus of the recommended study
Data, knowledge and methods developed in this PhD study
Particle emission factors
Inventory method
Method for examining modes
Scenario modelling variables
Scale of the project
8
Ultrafine particles are a likely target for future air quality regulation in terms of particle number in populated urban areas.
Local airshed
Road-link based
Vehicle-based
9
Standardized methods need to be devised to measure particle number, and these have particular significance for epidemiological and health exposure assessments.
Local airshed
Road-link based
Vehicle-based
10
Develop a target to reduce ultrafine particle concentrations generated by motor vehicles in urban areas by more than one order of magnitude.
Local airshed
Road-link based
Vehicle-based
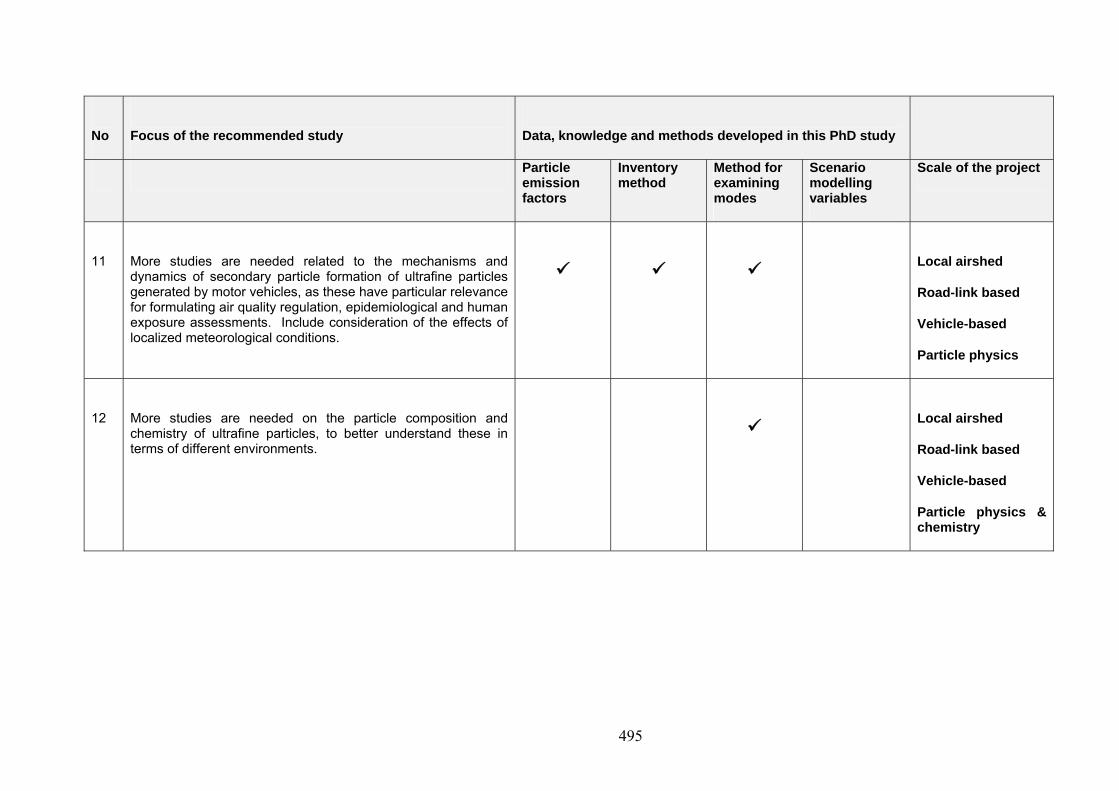
495
No
Focus of the recommended study
Data, knowledge and methods developed in this PhD study
Particle emission factors
Inventory method
Method for examining modes
Scenario modelling variables
Scale of the project
11
More studies are needed related to the mechanisms and dynamics of secondary particle formation of ultrafine particles generated by motor vehicles, as these have particular relevance for formulating air quality regulation, epidemiological and human exposure assessments. Include consideration of the effects of localized meteorological conditions.
Local airshed
Road-link based
Vehicle-based
Particle physics
12
More studies are needed on the particle composition and chemistry of ultrafine particles, to better understand these in terms of different environments.
Local airshed
Road-link based
Vehicle-based
Particle physics & chemistry

496
National and state policies and programs which could be considered for
development include:-
• Implementing the requirement for development of regular particle number
emission inventories for motor vehicles; and investigating the extent of
gross emitters in motor vehicle fleets.
• Evaluating the feasibility of introducing low emission zones to limit
HDVs not fitted with particulate filters or aftertreatment devices which
have high emission rates.
• Developing a communication strategy which raises the awareness of the
public, policymakers and health professionals of the implications of
individual transport choices, eg., how much particulate matter is emitted
per passenger per km for different transport modes.
• Developing national policies and regulations which specifically focus on
reducing HDV emissions, particularly with respect to particle number and
PM1 emissions, eg., providing financial incentives, mandatory fitting of
particulate filters etc.

497
8.8. REFERENCES
ABS., 2004. Population by Age and Sex. Australian Bureau of Statistics, Canberra.
ABS., 2004. Survey of Motor Vehicle Use Australia. Australian Bureau of
Statistics, Canberra.
Abu-Allaban, M., Gillies, J.A., Gertler, A.W., 2003. Application of a multi-lag
regression approach to determine on-road PM10 and PM2.5 emission rates.
Atmospheric Environment 37(37), 5157-5164.
AQEG., 2005. Particulate Matter in the UK. Department for Environment, Food
and Rural Affairs, London.
Cadle, S.H., Mulawa, P., Groblicki, P., Laroo, C., Ragazzi, R. A., Nelson, K.,
Gallagher, G., Zielinska, B., 2001. In-use light-duty gasoline vehicle particulate
matter emissions on three driving cycles. Environmental Science & Technology
35(1), 26-32.
Cadle, S.H., Mulawa, P.A., Ball, J., Donase, C., Weibel, A., Sagebiel, J. C.,
Knapp, K. T., Snow, R., 1997. Particulate emission rates from in use high
emitting vehicles recruited in Orange County, California. Environmental Science
& Technology 31(12), 3405-3412.

498
CONCAWE., 1998. A study of the number, size & mass of exhaust particles
emitted from european diesel and gasoline vehicles under steady-state and
european driving cycle conditions.
CONCAWE, Brussels Report no. 98/51. Diesel Vehicles in Australia, Department
of the Environment and Heritage, Canberra.
DOEH., 2003. Technical Report No. 1: Toxic Emissions from Diesel Vehicles in
Australia, Department of the Environment and Heritage, Canberra.
Dora, C., 1999. A different route to health: implications of transport policies
British Medical Journal 318(7199), 1686-1689.
EPA., 2004. Air Emissions Inventory South-east Queensland Region. Brisbane,
Environmental Protection Agency.
Gehrig, R., Hill, M., Buchmann, B., Imhof, D., Weingartner, E., Baltensperger,
U., 2004. Separate determination of PM10 emission factors of road traffic for
tailpipe emissions and emissions from abrasion and resuspension processes.
International Journal of Environment & Pollution 22(3), 312-325.
Gertler, A.W., Gillies, J.A., Pierson, W.R., Rogers, C.F., Sagebiel, J. C., Abu-
Allaban, M., Coulombe, W., Tarnay, L., Cahill, T.A., 2002. Real-World
Particulate Matter and Gaseous Emissions from Motor Vehicles in a Highway
Tunnel. Health Effects Institute Research Report 107.

499
Gidhagen, L., Johansson, C., Strom, J., Kristensson, A., Swietlicki, E., Pirjola, L.,
Hansson, H.C., 2003. Model simulation of ultrafine particles inside a road tunnel.
Atmospheric Environment 37(15), 2023-2036.
Gidhagen, L., Johansson, C., Omstedt, G., Langner, J., Olivares, G., 2004. Model
simulations of NOx and ultrafine particles close to a Swedish highway.
Environmental Science & Technology 38(24), 6730-6740.
Goodwin, J.W.L., Salway, A.G., Murrells, T. P., Dore, C. J., Passant, N.R.,
Eggleston, H.S., 2000. UK emissions of air pollutants 1970-1998. A Report of the
National Atmospheric Emissions Inventory. London, Department of the
Environment, Transport and the Regions.
Group, 1999. Source Apportionment of Airborne Particulate Matter in the United
Kingdom. Report for the Department of the Environment, Transport and the
Regions, the Welsh Office, the Scottish Office and the Department of the
Environment (Northern Ireland).
Hibberd, M.F., 2005. Vehicle NOx and PM10 Emission Factors from Sydney's
M5-East Tunnel. 17th International Clean Air & Environment Conference
proceedings, Hobart. Clean Air Society of Australia and New Zealand.
500
Imhof, D., Weingartner, E., Prevot, A., Ordonez, C., Kurtenbach, R., Wiesen, P.,
Rodler, J., Sturm, P., McCrae, I., Sjodin, A., Baltersperger, U., 2005a. Aerosol
and NOx Emission Factors and Submicron Particle Number Size Distributions in
Two Road Tunnels with Different Traffic Regimes. Atmospheric Chemistry and
Physics Discussions 55127-55166.
Imhof, D., Weingartner, E., Ordonez, C., Gehrigt, R., Hill, N., Buchmann, B.,
Baltensperger, U., 2005b. Real-world emission factors of fine and ultrafine
aerosol particles for different traffic situations in Switzerland. Environmental
Science & Technology 39(21), 8341-8350.
Imhof, D., Weingartner, E., Vogt, U., Drei seidler, A., Rosenbohm, E., Scheer, V.,
Vogt, R., Nielsen, O.J., Kurtenbach, R., Corsmeier, U., Kohler, M.,
Baltensperger, U., 2005c. Vertical distribution of aerosol particles and NOx close
to a motorway. Atmospheric Environment 39(31), 5710-5721.
Jamriska, M., Morawska, L., Thomas, S., Congrong, H., 2004. Diesel Bus
Emissions Measured in a Tunnel Study. Environmental Science & Technology
38(24), 6701-6709.
Jones, A.M., Harrison, R.M. 2006. Estimation of the emission factors of particle
number and mass fractions from traffic at a site where mean vehicle speeds vary
over short distances. Atmospheric Environment 40(37), 7125-7137.

501
Keogh, D.U., Kelly, J., Mengersen, K., Jayaratne, R., Ferreira, L., Morawska, L.,
2009. Derivation of motor vehicle tailpipe particle emission factors suitable for
modelling urban fleet emissions and air quality assessments. Environmental
Science and Pollution Research – International. Published online, doi
0.1007/s11356-009-0210-9.
Lowell, D.M., Parsley, W., Bush, C., Zupo, D., 2003. Comparison of Clean
Diesel buses to CNG Buses. 9th Diesel Engine Emissions
Reduction (DEER) Workshop, Newport, RI, USA, 24-28 August.
Macharis, C., Mierlo, J. van., Bossche, P. van. den., 2007. Transportation
Planning and Technology. Combining Intermodal Transport With Electric
Vehicles: Towards More Sustainable Solutions 30(2-3), 311-323.
Morawska, L., Ristovski, Z., Jayaratne, E.R., Keogh, D. U., Ling, X., 2008.
Ambient nano and ultrafine particles from motor vehicle emissions:
characteristics, ambient processing and implications on human exposure.
Accepted for publication in Atmospheric Environment.
Morawska, L., Jamriska, M., Thomas, S., Ferreira, L., Mengersen, K., Wraith, D.,
McGregor, F., 2005. Quantification of particle number emission factors for motor
vehicles from on-road measurements. Environmental Science & Technology
39(23), 9130-9139.

502
Morawska, L., Moore, M. R., Ristovski, Z.D., 2004. Health Impacts of Ultrafine
Particles - Desktop Literature Review and Analysis, Department of the
Environment and Heritage, September, Canberra.
Morawska, L., Ristovski, Z., Ayoko, G.A., Jayaratne, E.R., Lim, M., 2001. Report
of a short investigation of emissions from diesel vehicles operating on low and
ultralow sulphur content fuel. Prepared for BP Australia by Queensland
University of Technology, Brisbane.
NEPC, 2000, Proposed Diesel Vehicle Emissions National Environment
Protection Measure Preparatory Work, In-Service Emissions Performance - Phase
2: Vehicle Testing, NEPC, Adelaide, November.
NPI (National Pollutant Inventory), Department of the Environment, Water,
Heritage and the Arts, Australian Government, http://www.npi.gov.au/index.html.
verified 1 July 2008.
Pope, C. A., Burnett, R. T., Thun, M. J., Calle, E. E., Krewski, D., Ito, K.,
Thurston, G.D., 2002. Lung cancer, cardiopulmonary mortality, and long-term
exposure to fine particulate air pollution. Journal of the American Medical
Association 287(9), 1132 1141.
Ristovski, Z.D., Morawska, L., Ayoko, G.A., Jayaratne, E.R., Lim, M., 2002.
Final report of a comparative investigation of particle and gaseous emissions from
twelve in-service B.C.C. buses operating on 50 and 500 ppm sulphur diesel fuel.
Queensland University of Technology, Brisbane.

503
Romilly, P., 1999. Substitution of bus for car travel in urban Britain: an economic
evaluation of bus and car exhaust emission and other costs. Transportation
Research Part D-Transport and Environment 4(2), 109-125.
Schmid, H., Pucher, E., Ellinger, R., Biebl, P., Puxbaum, H., 2001. Decadal
reductions of traffic emissions on a transit route in Austria - results of the
Tauerntunnel experiment 1997. Atmospheric Environment 35(21), 3585-3593.
SKM (Sinclair Knight Merz), 2006. Twice the Task: A review of Australia's
freight transport tasks Melbourne, Victoria, National Transport Commission.
Tran, T. V., Ng, Y. L., Denison, L., 2003. Emission Factors for In-Service
Vehicles Using Citylink Tunnel. Proceedings of the National Clean Air
Conference, Newcastle.
Translink, 2007. Bus patronage and bus fleet statistics. Queensland Transport,
Brisbane.
Wayne, W.S., Clark, N.N., Nine, R.D., Elefante, D., 2004. A comparison of
emissions and fuel economy from hybrid-electric and conventional-drive transit
buses. Energy & Fuels 18(1), 257-270.
WHO., 2005. Guidelines for Air Quality. World Health Organization, Geneva.
Recommended