Development and comparison of processing maps of Mg-3Sn-1Ca alloy from data obtained intension versus compression
Rao, K. P.; Suresh, K.; Prasad, Y.V.R.K.; Hort, N.
Published in:IOP Conference Series: Materials Science and Engineering
Published: 01/01/2018
Document Version:Final Published version, also known as Publisher’s PDF, Publisher’s Final version or Version of Record
License:CC BY
Publication record in CityU Scholars:Go to record
Published version (DOI):10.1088/1757-899X/297/1/012014
Publication details:Rao, K. P., Suresh, K., Prasad, Y. V. R. K., & Hort, N. (2018). Development and comparison of processing mapsof Mg-3Sn-1Ca alloy from data obtained in tension versus compression. IOP Conference Series: MaterialsScience and Engineering, 297, [012014]. https://doi.org/10.1088/1757-899X/297/1/012014
Citing this paperPlease note that where the full-text provided on CityU Scholars is the Post-print version (also known as Accepted AuthorManuscript, Peer-reviewed or Author Final version), it may differ from the Final Published version. When citing, ensure thatyou check and use the publisher's definitive version for pagination and other details.
General rightsCopyright for the publications made accessible via the CityU Scholars portal is retained by the author(s) and/or othercopyright owners and it is a condition of accessing these publications that users recognise and abide by the legalrequirements associated with these rights. Users may not further distribute the material or use it for any profit-making activityor commercial gain.Publisher permissionPermission for previously published items are in accordance with publisher's copyright policies sourced from the SHERPARoMEO database. Links to full text versions (either Published or Post-print) are only available if corresponding publishersallow open access.
Take down policyContact [email protected] if you believe that this document breaches copyright and provide us with details. We willremove access to the work immediately and investigate your claim.
Download date: 21/10/2021

IOP Conference Series: Materials Science and Engineering
PAPER • OPEN ACCESS
Development and comparison of processing maps of Mg-3Sn-1Ca alloyfrom data obtained in tension versus compressionTo cite this article: K.P. Rao et al 2018 IOP Conf. Ser.: Mater. Sci. Eng. 297 012014
View the article online for updates and enhancements.
This content was downloaded from IP address 144.214.124.122 on 05/03/2019 at 01:20

1
Content from this work may be used under the terms of the Creative Commons Attribution 3.0 licence. Any further distributionof this work must maintain attribution to the author(s) and the title of the work, journal citation and DOI.
Published under licence by IOP Publishing Ltd
1234567890‘’“”
8th TSME-International Conference on Mechanical Engineering (TSME-ICoME 2017) IOP Publishing
IOP Conf. Series: Materials Science and Engineering 297 (2018) 012014 doi:10.1088/1757-899X/297/1/012014
Development and comparison of processing maps of Mg-3Sn-1Ca
alloy from data obtained in tension versus compression
K.P. Rao1,*, K. Suresh2, Y.V.R.K. Prasad3 and N. Hort4
1 Department of Mechanical and Biomedical Engineering, City University of Hong
Kong, Tat Chee Avenue, Kowloon, Hong Kong
2 Department of Physics, Bharathiar University, Coimbatore 641046, Tamilnadu,
India (formerly with City University of Hong Kong)
3 processingmaps.com, No. 2/B, Vinayaka Nagar, Hebbal, Bengaluru 560024, India
(formerly with City University of Hong Kong)
4 Helmholtz-Zentrum Geesthacht, Institute of Materials Research, Magnesium
Innovation Centre, Max-Planck-Straße 1, Geesthacht 21502, Germany
* Corresponding Author: [email protected], +852 3442 8409, +852 3442 0172
Abstract. The hot workability of extruded Mg-3Sn-1Ca alloy has been evaluated by developing
processing maps with flow stress data from compression and tensile tests with a view to find the
effect of the applied state-of-stress. The processing maps developed at a strain of 0.2 are
essentially similar irrespective of the mode of deformation – compression or tension, and exhibit
three domains in the temperature ranges: (1) 350 – 425 oC, and (2) 450 – 550 oC and (3) 400 –
500 oC, the first two occurring at lower strain rates and the third occurring at higher strain rates.
In all the three domains, dynamic recrystallization occurs and is caused by non-basal slip and
controlled by lattice self-diffusion in the first and second domains and grain boundary self-
diffusion in the third domain. The state-of-stress imposed on the specimen (compression or
tension) does not have any significant effect on the processing maps.
1. Introduction
Magnesium alloys have assumed technological importance in recent years due to their light weight and are
being used for several applications in automobiles and aerospace. Two important limitations for use of these
alloys are their lower corrosion resistance and creep strength. In recent years, newer alloys are being
developed to combat these limitations and Mg-Sn-Ca system has been explored for this purpose. It has
been observed that addition of Sn in magnesium improves the latter’s corrosion resistance [1] and tensile
properties [2]. Ternary addition of Ca improves the higher temperature creep strength by forming stable
intermetallic CaMgSn particles in Mg-Sn matrix [3, 4]. It is observed that the ratio of Sn to Ca is important
for microstructural control to optimize the strength and corrosion properties [5]. A ratio of 3:1 binds entire
Ca in forming CaMgSn particles while the remaining Sn stays in solid solution. On the other hand, higher
calcium content promotes the formation of Mg2Ca particles [2], the presence of which is detrimental to the
corrosion properties. Thus, Mg-3Sn-1Ca composition gives acceptable combination of corrosion resistance
and creep strength. The hot workability of the as-cast alloy has been evaluated using processing map [6],
which revealed that the alloy may be extruded at a much higher temperature (500 oC) than other
conventional Mg alloys (300 oC). This processing map, the principles of which were discussed earlier [7-
9], was developed on the basis of the temperature and strain rate dependence of flow stress obtained in
constant strain rate isothermal compression tests. Uniaxial compression testing is preferred for this purpose

2
1234567890‘’“”
8th TSME-International Conference on Mechanical Engineering (TSME-ICoME 2017) IOP Publishing
IOP Conf. Series: Materials Science and Engineering 297 (2018) 012014 doi:10.1088/1757-899X/297/1/012014
since large strains may be imposed on the sample without the onset of complications like necking as in
tension or a large non-uniformity of strain from center to surface as in a torsion bar.
It is useful to examine whether the state-of-stress in these testing techniques has any effect on the
characterization of hot deformation by processing maps. In this direction, the processing maps developed
on AISI 403L stainless steel on the basis of compression versus torsion data [10], have been compared and
the results indicated that either techniques may be used to predict the workability domain but the instability
regime is wider in the map made with torsion data than that made with compression data. This is
understandable since shear stresses accentuate flow instability by adiabatic shear bands or flow localization.
The aim of the present investigation is to compare the characteristics of hot deformation of high temperature
extruded TX31 alloy as evaluated by processing maps developed from uniaxial tensile versus compression
test data.
A processing map depicts the conditions of temperature and strain rate or speed that are best suited for
performing industrial metal working operations, without resorting to trial and error attempts on shop-floor.
The relevance of such a map is particularly important for successful conversion of cast alloys into their
wrought form so to improve their mechanical properties through appropriate control of the evolution of
microstructure during thermomechanical or hot working processes. The principles and procedures for
developing processing maps [7-9] are briefly summarized here. Briefly, the work-piece undergoing hot
deformation is considered to be a dissipator of power and the strain rate sensitivity (m) of flow stress is the
factor that partitions power between deformation heat and microstructural changes. The efficiency of power
dissipation compared to an ideal linear dissipator, occurring through microstructural changes during
deformation as a function of temperature and strain rate is given by:
η = 2m/(m+1) (1)
The variation of efficiency of power dissipation with temperature and strain rate represents a power
dissipation map which is generally viewed as an iso-efficiency contour map. Further, the extremum
principles of irreversible thermodynamics as applied to continuum mechanics of large plastic flow [11] are
explored to define a criterion for the onset of flow instability given by the equation for the instability
parameter ξ:
0
ln
)]1/(ln[)(
m
mm
(2)
The variation of the instability parameter as a function of temperature and strain rate represents an
instability map which delineates regimes of instability where ξ is negative. A superimposition of the
instability map on the power dissipation map gives a processing map which reveals domains (efficiency
contours converging towards a peak efficiency) where individual microstructural processes occur and the
limiting conditions for the regimes (bounded by a contour for = 0) of flow instability. Processing maps
help in identifying temperature – strain rate windows for hot working where the intrinsic workability of the
material is maximum (e.g. dynamic recrystallization (DRX) or superplasticity) and also in avoiding the
regimes of flow instabilities (e.g. adiabatic shear bands or flow localization).
2. Experimental
The nominal composition (wt.%) of the starting material Mg-3Sn-1Ca was extruded at 500 oC at a ram
speed of 3 mm s-1 using a round shear die of 12 mm diameter with an extrusion ratio of 17:1. The average
grain diameter was about 9 µm. For compression testing, cylindrical specimens with 10 mm diameter and
15 mm height were machined with the compression axis parallel to the extrusion direction. Uniaxial
compression tests were conducted in the temperature range of 300 – 500 oC and true strain rate range of
0.0003 – 1 s-1. Constant true strain rates were achieved by an exponential decay of actuator speed in the
servo-hydraulic machine. Details of the test set-up and experimental procedure are given earlier [12]. For
high temperature tensile tests, cylindrical specimens with a gage length of 30 mm and gage diameter of 6
mm were used and constant true strain rate had been achieved by ramping up the speed of the actuator
exponentially. The load – stroke data were converted into true stress – true strain curves using standard
equations. Processing maps were developed using the procedure described earlier using the flow stress
data and different temperatures and strain rates at a constant strain. The deformed specimens were sectioned
parallel to the compression or tensile axis as the case may be, polished and etched with an aqueous solution

3
1234567890‘’“”
8th TSME-International Conference on Mechanical Engineering (TSME-ICoME 2017) IOP Publishing
IOP Conf. Series: Materials Science and Engineering 297 (2018) 012014 doi:10.1088/1757-899X/297/1/012014
containing 10% picric acid. The microstructures were recorded close to the fracture end in the case of tensile
specimens while in compression specimens they were examined in the middle of the specimen.
3. Results and Discussion
3.1. Stress-strain behavior
The true stress – true strain curves obtained on TX31 deformed in compression and tension at a temperature
of 300 oC and at different strain rates are shown in figure 1. The compression curves were showing flow
softening at higher strain rates and lower temperatures and a near steady state flow at lower strain rates and
higher temperatures. The tensile curves on the other hand showed steady state flow only for the strain rate
of 0.0003 s-1 and exhibited normal shapes for higher strain rates, namely reaching an ultimate tensile stress
before dropping towards fracture when necking occurs.
The curves at higher temperatures are shown in figure 2 with 500 oC as an example, for compression
and tension. The compression curves are of flow softening type at higher strain rates and steady-state type
at lower strain rates similar to those obtained at 300 oC (figure 1). The tensile curves (figure 2) exhibited
nearly steady state flow for all the strain rates except that for a strain rate of 1 s-1, which started to neck at
strains higher than about 0.2. From the stress – strain curves given in figures 1 and 2, it is clear that for the
purpose of comparison, the flow stress data up to a strain of 0.2 at different temperature and strain rates
may be valid for developing processing maps for compression versus tension. At higher strains, the data
will acquire complications due to the three-dimensional state-of-stress in necked region in tension rendering
it unacceptable for comparison with compression.
Figure 1. Stress-strain curves of TX31 alloy
obtained at a temperature of 300 oC in
compression versus tension at different strain
rates.
Figure 2. Stress-strain curves of TX31 alloy
obtained at a temperature of 500 oC in
compression versus tension at different strain
rates.
3.2. Processing maps
The processing maps obtained at a strain of 0.2 from flow stress obtained from compression and tension
tests are shown in figure 3 and figure 4, respectively. The numbers on the contours represent efficiency of
power dissipation in percent. The maps exhibit three domains in each case – two in the lower strain rate
range and the third at higher strain rate range. For compression map (figure 3), the lower strain rate domain
(#1) occurs over a wide range of temperature of 340 – 420 oC and extend over the strain rate range of 0.0003
– 0.002 s-1 with a high peak efficiency of power dissipation at 28%. The higher temperature domain (#2),
however, occurs in temperature and strain rate ranges given by 450 – 500 oC and 0.0003 – 0.01 s-1 with a
peak efficiency of about 29%. In comparison, the map for tension shown in figure 4 also exhibited three domains
in a similar temperature range although the upper strain rates have moved to higher values in the case of Domain #1
and Domain #2. The peak efficiency values were also higher in these two domains. It is possible that the true strain
4
1234567890‘’“”
8th TSME-International Conference on Mechanical Engineering (TSME-ICoME 2017) IOP Publishing
IOP Conf. Series: Materials Science and Engineering 297 (2018) 012014 doi:10.1088/1757-899X/297/1/012014
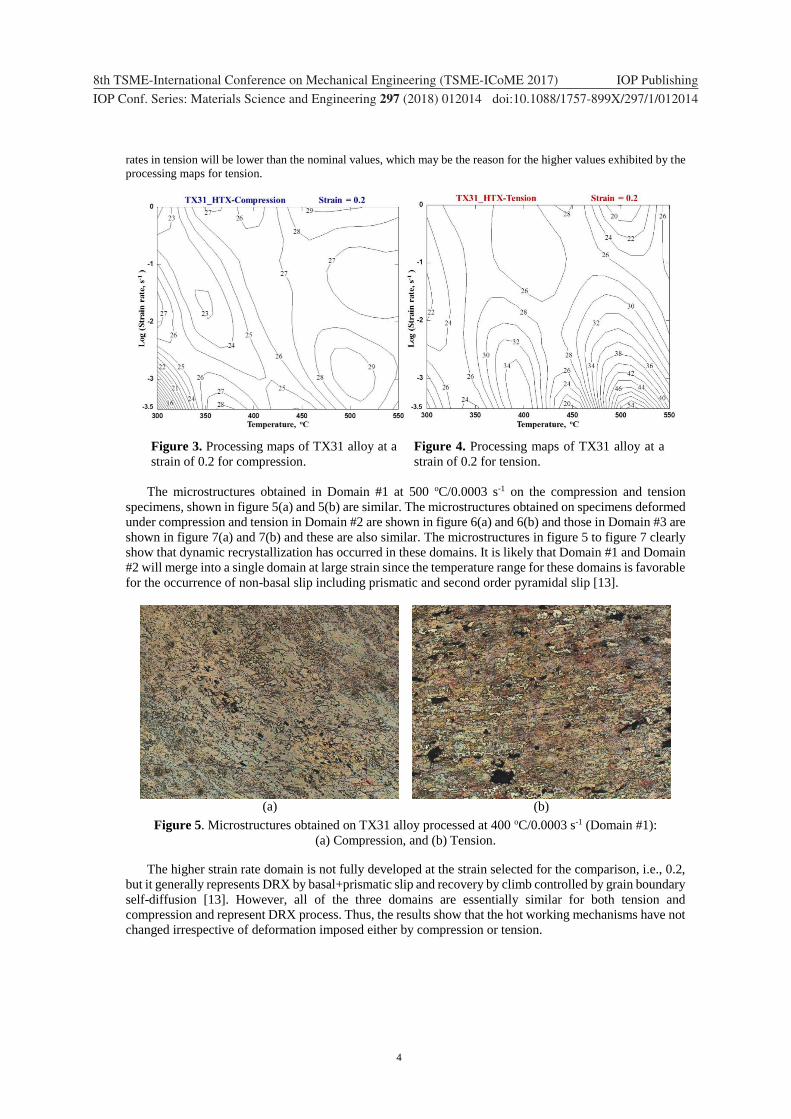
rates in tension will be lower than the nominal values, which may be the reason for the higher values exhibited by the
processing maps for tension.
Figure 3. Processing maps of TX31 alloy at a
strain of 0.2 for compression.
Figure 4. Processing maps of TX31 alloy at a
strain of 0.2 for tension.
The microstructures obtained in Domain #1 at 500 oC/0.0003 s-1 on the compression and tension
specimens, shown in figure 5(a) and 5(b) are similar. The microstructures obtained on specimens deformed
under compression and tension in Domain #2 are shown in figure 6(a) and 6(b) and those in Domain #3 are
shown in figure 7(a) and 7(b) and these are also similar. The microstructures in figure 5 to figure 7 clearly
show that dynamic recrystallization has occurred in these domains. It is likely that Domain #1 and Domain
#2 will merge into a single domain at large strain since the temperature range for these domains is favorable
for the occurrence of non-basal slip including prismatic and second order pyramidal slip [13].
(a)
(b)
Figure 5. Microstructures obtained on TX31 alloy processed at 400 oC/0.0003 s-1 (Domain #1):
(a) Compression, and (b) Tension.
The higher strain rate domain is not fully developed at the strain selected for the comparison, i.e., 0.2,
but it generally represents DRX by basal+prismatic slip and recovery by climb controlled by grain boundary
self-diffusion [13]. However, all of the three domains are essentially similar for both tension and
compression and represent DRX process. Thus, the results show that the hot working mechanisms have not
changed irrespective of deformation imposed either by compression or tension.

5
1234567890‘’“”
8th TSME-International Conference on Mechanical Engineering (TSME-ICoME 2017) IOP Publishing
IOP Conf. Series: Materials Science and Engineering 297 (2018) 012014 doi:10.1088/1757-899X/297/1/012014
(a)
(b)
Figure 6. Microstructures obtained on TX31 alloy processed at 500 oC/0.0003 s-1 (Domain #2):
(a) Compression, and (b) Tension.
(a)
(b)
Figure 7. Microstructures obtained on TX31_HTX alloy processed at 450 oC/1.0 s-1 (Domain #3):
(a) Compression, and (b) Tension.
4. Conclusions
The hot working characteristics of high temperature extruded TX31 alloy deformed in compression has
been compared with those evaluated on the basis of tensile data. The following conclusions are drawn:
(1) The shapes of true stress – true strain curves are similar and exhibited a steady state flow in both modes
of deformation until a strain of about 0.2, beyond which the occurrence of necking in tension has restricted
the comparison.
(2) The processing maps developed at a strain of 0.2 with flow stress data at different temperatures and
strain rates, are essentially similar irrespective of the mode of deformation – compression or tension.
(3) The processing maps exhibit three domains in the temperature ranges: (1) 350 – 425 oC, and (2) 450 –
550 oC and (3) 400 – 500 oC, the first two occurring at lower strain rates and the third occurring at higher
strain rates.
(4) All the three domains represent dynamic recrystallization process caused by non-basal slip and
controlled by lattice self-diffusion in the first and second domains and grain boundary self-diffusion in the
third domain (higher strain rates).
(5) The state-of-stress imposed on the specimen (compression or tension) does not have any significant
effect on the processing maps.

6
1234567890‘’“”
8th TSME-International Conference on Mechanical Engineering (TSME-ICoME 2017) IOP Publishing
IOP Conf. Series: Materials Science and Engineering 297 (2018) 012014 doi:10.1088/1757-899X/297/1/012014
Acknowledgement
The work presented in this paper has been supported by a strategic research grant from the City University
of Hong Kong (Project #7002013).
References [1] Abu Leil T, Rao K P, Hort N, Blawert C and Kainer K U 2006 Magnesium Technology 2006 ed Luo A A,
Neelameggham N R and Beals R S (TMS: Warrendale) p 281
[2] Liu H, Chen Y, Tang Y, Wei S and Niu G 2007 J. Alloys and Compounds 440 p 122
[3] Hort N, Huang Y, Abu Leil T, Maier P and Kainer K U 2006 Advanced Eng. Mater. 8 p 359
[4] Abu Leil T, Huang Y, Dieringa H, Hort N, Kainer K U, Bursik J, Jiraskova Y and Rao K P 2007 Mater. Sci.
Forum 546-549 69
[5] Abi Leil T, Hort N, Dieringa H, Blawert C, Huang Y, Kainer K U and Rao K P 2006 Magnesium Technology
in the Global Age ed Pekguleryuz M O and Mackenzie L W F (CIM: Montreal) p 739
[6] Rao K P, Prasad Y V R K, Hort N and Kainer K U 2008 J. Mater. Processing Technol. 201 p 359
[7] Prasad Y V R K, Rao K P and Sasidhara S 2015 Hot working guide – A compendium of processing maps,
(ASM International: Materials Park)
[8] Prasad Y V R K and Seshacharyulu T 1998 Int. Mater. Reviews 43 p 243
[9] Prasad Y V R K 2003 J. Mater. Eng. and Performance 12 p 638
[10] Venugopal S, Prasad Y V R K and Mannan S L 1996 Mater. Letters 26 p 161
[11] Ziegler H 1965 Some extremum principles in irreversible thermodynamics with applications to continuum
mechanics Progress in Solid Mechanics (vol 4) ed Sneddon I N and Hill R (New York: Wiley) p 91
[12] Prasad Y V R K and Rao K P 2005 Mater. Sci. and Eng. A391 p 141
[13] Prasad Y V R K, Rao K P, Hort N and Kainer K U 2009 Mater. Sci. and Eng. A502 p 25
Recommended