Solving Efeso © 2014
Closure – Summary Presentation
Cairo, February 2014
Developing Export Strategyfor
Egypt’s Engineering Industries
- 2 -EEC-EG Report Phase 5 Solving Efeso © 2014
Contents
Project OverviewProject Overview
Phase 1 – Thrust ProductsPhase 1 – Thrust Products
Phase 3 – Export Strategy DevelopmentPhase 3 – Export Strategy Development
Phase 2 – Thrust MarketsPhase 2 – Thrust Markets
Phase 4 – Implementation / Action PlanPhase 4 – Implementation / Action Plan
ConclusionConclusion

- 3 -EEC-EG Report Phase 5 Solving Efeso © 2014
Project Overview(Implemented Approach)
- 4 -EEC-EG Report Phase 5 Solving Efeso © 2014
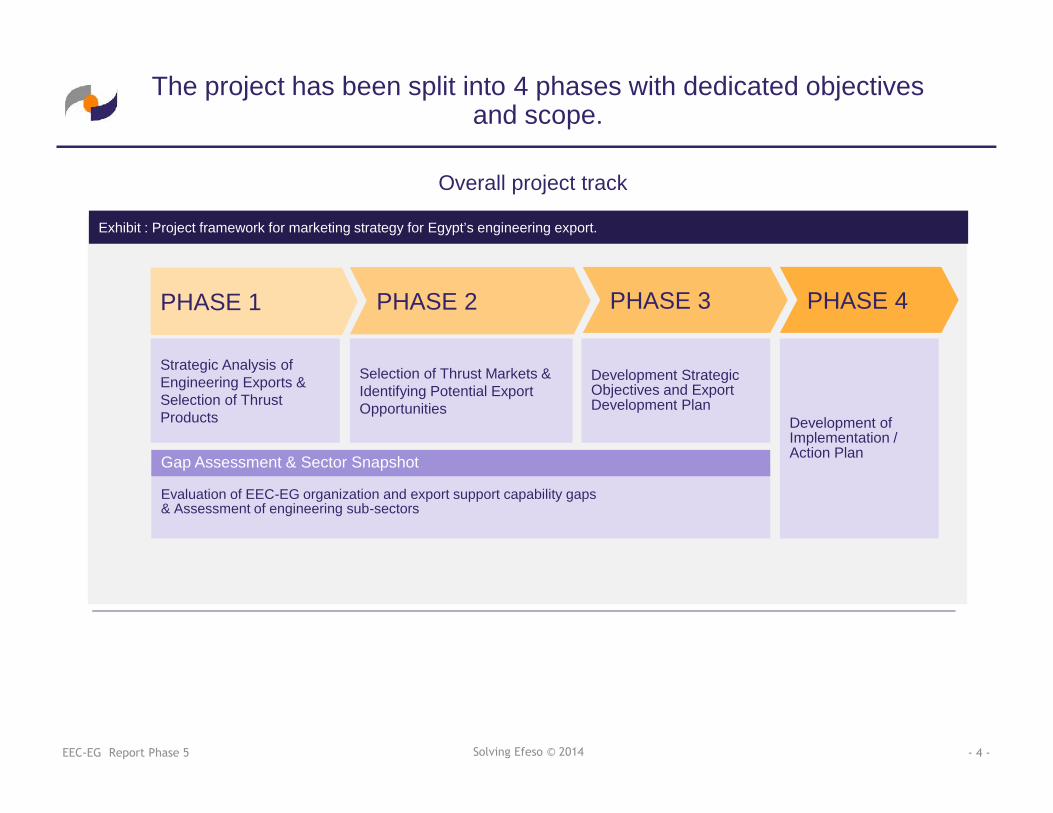
Exhibit : Project framework for marketing strategy for Egypt’s engineering export.
PHASE 1 PHASE 2 PHASE 3 PHASE 4
Strategic Analysis ofEngineering Exports &Selection of ThrustProducts
Selection of Thrust Markets &Identifying Potential ExportOpportunities
Development StrategicObjectives and ExportDevelopment Plan
Development ofImplementation /Action Plan
Overall project track
Evaluation of EEC-EG organization and export support capability gaps& Assessment of engineering sub-sectors
Gap Assessment & Sector Snapshot
The project has been split into 4 phases with dedicated objectivesand scope.
- 5 -EEC-EG Report Phase 4 Solving Efeso © 2013
PHASE 1 PHASE 2 PHASE 3 PHASE 4
Strategic Analysis ofEngineering Exports &
Selection of ThrustProducts
Selection of Thrust Markets &Identifying Potential Export
Opportunities
Development StrategicObjectives and Export
Development PlanDevelopment ofImplementation /
Action Plan
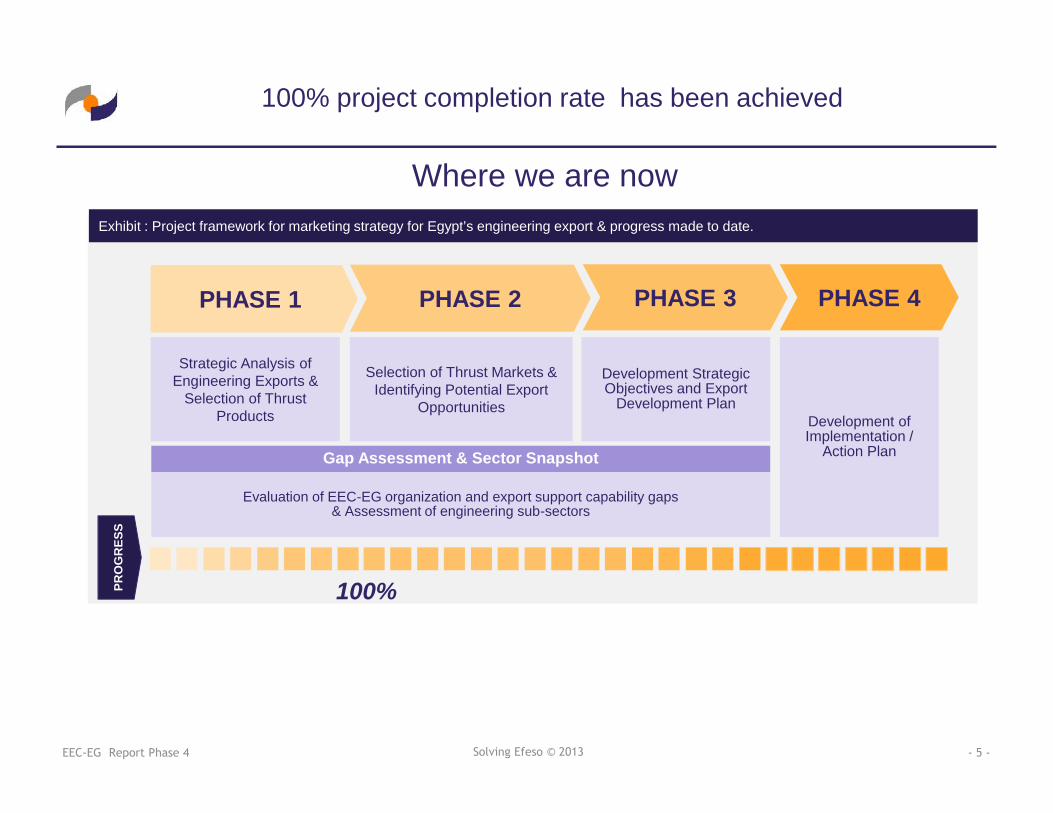
Where we are now
Evaluation of EEC-EG organization and export support capability gaps& Assessment of engineering sub-sectors
Gap Assessment & Sector Snapshot
PRO
GR
ESS
100%
Exhibit : Project framework for marketing strategy for Egypt’s engineering export & progress made to date.
100% project completion rate has been achieved
- 6 -EEC-EG Report Phase 5 Solving Efeso © 2014
Phase 1: Thrust Products
- 7 -EEC-EG Report Phase 2 Solving Efeso © 2013
Objective of the Phase 1
The objective of the Phase 1 is to identify so-calledThrust Products - most competitive product groups
with the high potential to drive the Egypt’sengineering export in the near term and that will
form the base for export strategy.
Phase 1: Objective statement
- 8 -EEC-EG Report Phase 1 Solving Efeso © 2013
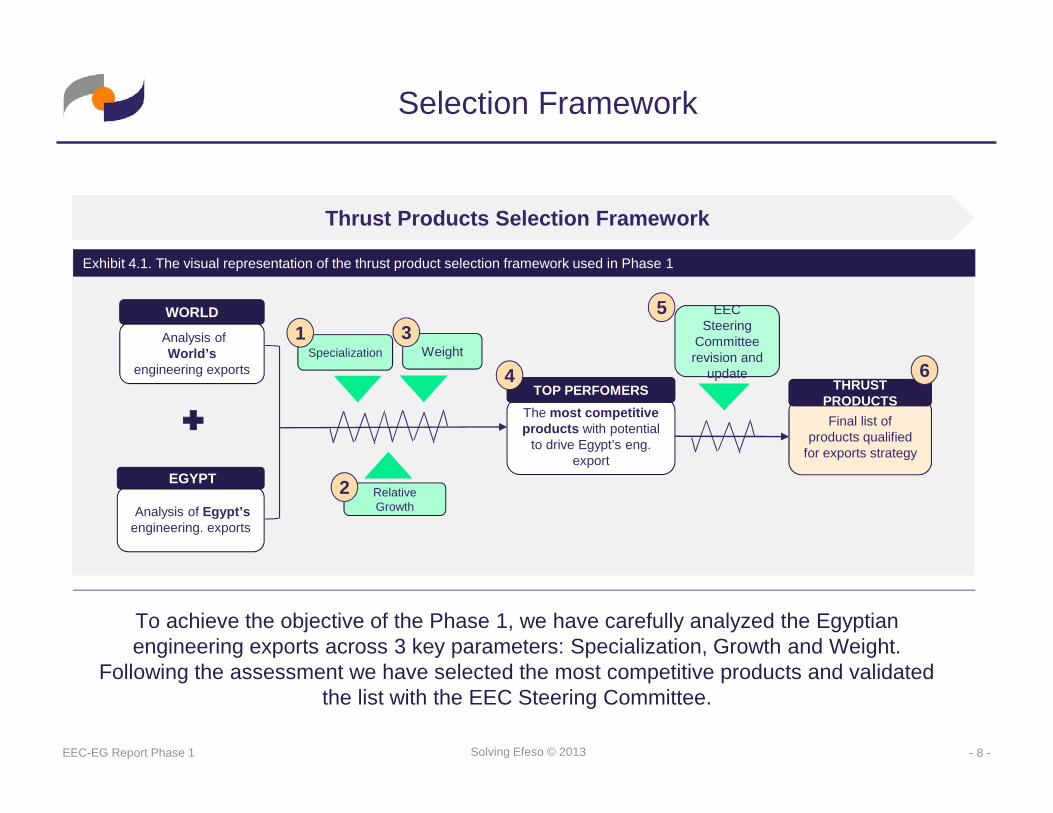
Thrust Products Selection Framework
Selection Framework
Analysis of Egypt’sengineering. exports
Analysis ofWorld’s
engineering exports
The most competitiveproducts with potential
to drive Egypt’s eng.export
Final list ofproducts qualified
for exports strategy
EGYPT
WORLD
TOP PERFOMERS THRUSTPRODUCTS
EECSteering
Committeerevision and
update
Exhibit 4.1. The visual representation of the thrust product selection framework used in Phase 1
4
5
Specialization
RelativeGrowth
Weight1
2
3
6
To achieve the objective of the Phase 1, we have carefully analyzed the Egyptianengineering exports across 3 key parameters: Specialization, Growth and Weight.
Following the assessment we have selected the most competitive products and validatedthe list with the EEC Steering Committee.
- 9 -EEC-EG Report Phase 1 Solving Efeso © 2013
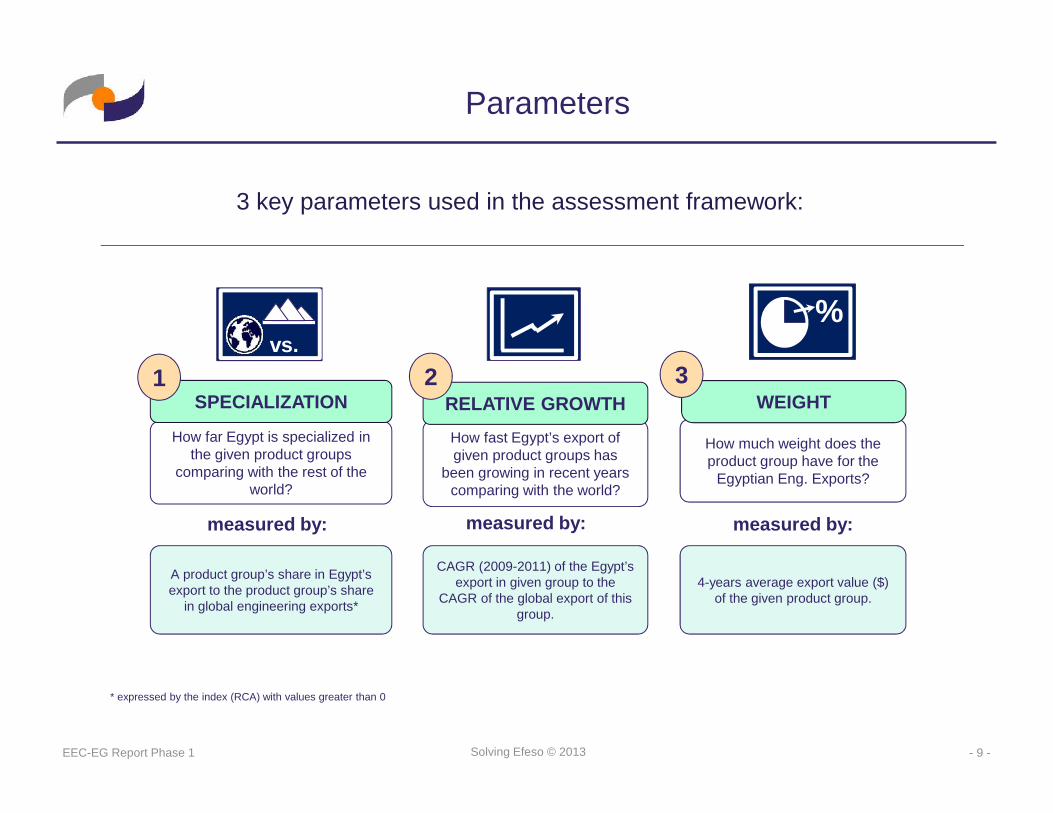
How much weight does theproduct group have for the
Egyptian Eng. Exports?
3 key parameters used in the assessment framework:
Parameters
WEIGHT
%vs.
3
How far Egypt is specialized inthe given product groups
comparing with the rest of theworld?
How fast Egypt’s export ofgiven product groups has
been growing in recent yearscomparing with the world?
measured by:
4-years average export value ($)of the given product group.
A product group’s share in Egypt’sexport to the product group’s share
in global engineering exports*
CAGR (2009-2011) of the Egypt’sexport in given group to the
CAGR of the global export of thisgroup.
measured by: measured by:
* expressed by the index (RCA) with values greater than 0
RELATIVE GROWTHSPECIALIZATION1 2
- 10 -EEC-EG Report Phase 1 Solving Efeso © 2013
Thrust Products - Final
ASPIRING
GLOBAL
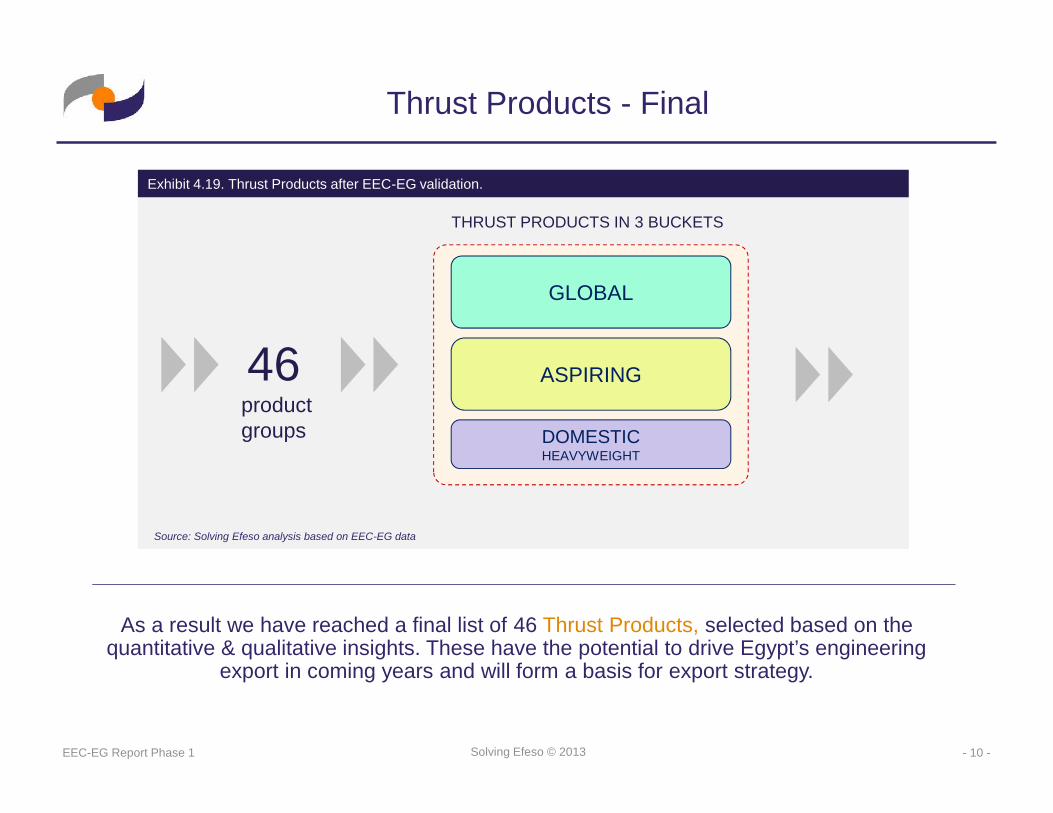
THRUST PRODUCTS IN 3 BUCKETS
Source: Solving Efeso analysis based on EEC-EG data
46productgroups
Exhibit 4.19. Thrust Products after EEC-EG validation.
DOMESTICHEAVYWEIGHT
As a result we have reached a final list of 46 Thrust Products, selected based on thequantitative & qualitative insights. These have the potential to drive Egypt’s engineering
export in coming years and will form a basis for export strategy.
- 11 -EEC-EG Report Phase 1 Solving Efeso © 2013
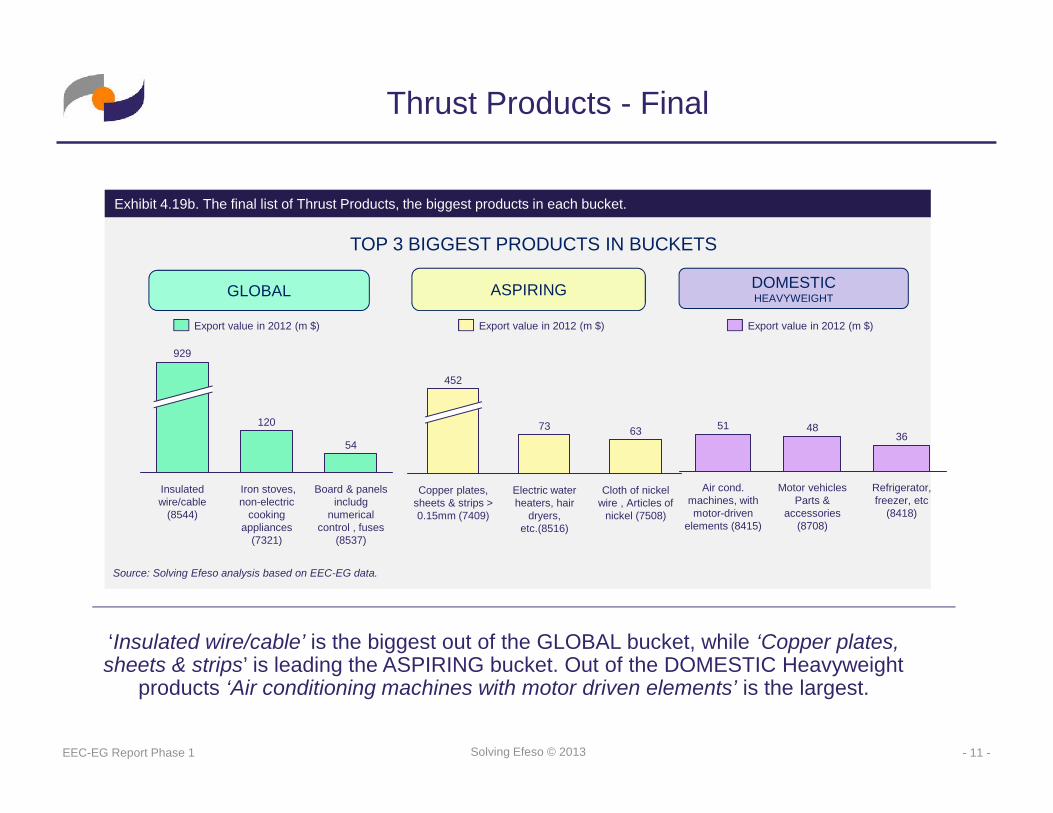
Exhibit 4.19b. The final list of Thrust Products, the biggest products in each bucket.
Source: Solving Efeso analysis based on EEC-EG data.
Board & panelsincludg
numericalcontrol , fuses
(8537)
54
Iron stoves,non-electric
cookingappliances
(7321)
120
Insulatedwire/cable
(8544)
929
Cloth of nickelwire , Articles of
nickel (7508)
63
Electric waterheaters, hair
dryers,etc.(8516)
73
Copper plates,sheets & strips >0.15mm (7409)
452
Refrigerator,freezer, etc
(8418)
36
Motor vehiclesParts &
accessories(8708)
48
Air cond.machines, withmotor-driven
elements (8415)
51
ASPIRINGGLOBAL DOMESTICHEAVYWEIGHT
TOP 3 BIGGEST PRODUCTS IN BUCKETS
Export value in 2012 (m $) Export value in 2012 (m $)Export value in 2012 (m $)
Thrust Products - Final
‘Insulated wire/cable’ is the biggest out of the GLOBAL bucket, while ‘Copper plates,sheets & strips’ is leading the ASPIRING bucket. Out of the DOMESTIC Heavyweight
products ‘Air conditioning machines with motor driven elements’ is the largest.
- 12 -EEC-EG Report Phase 1 Solving Efeso © 2013
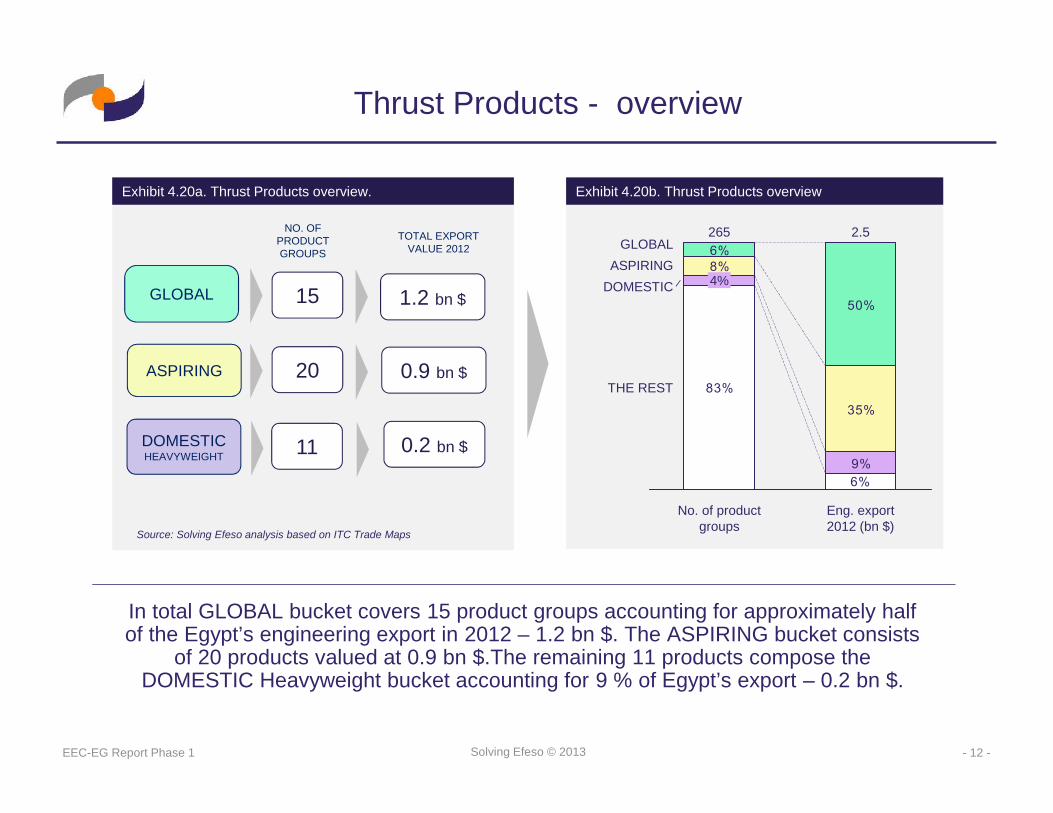
In total GLOBAL bucket covers 15 product groups accounting for approximately halfof the Egypt’s engineering export in 2012 – 1.2 bn $. The ASPIRING bucket consists
of 20 products valued at 0.9 bn $.The remaining 11 products compose theDOMESTIC Heavyweight bucket accounting for 9 % of Egypt’s export – 0.2 bn $.
Thrust Products - overview
ASPIRING
GLOBAL
DOMESTICHEAVYWEIGHT
Source: Solving Efeso analysis based on ITC Trade Maps
Exhibit 4.20a. Thrust Products overview.
NO. OFPRODUCTGROUPS
TOTAL EXPORTVALUE 2012
15
20
11
1.2 bn $
0.9 bn $
0.2 bn $
Exhibit 4.20b. Thrust Products overview
83%
8%
35%
6%
50%
6%9%
THE REST
DOMESTICASPIRING
GLOBAL
Eng. export2012 (bn $)
2.5
No. of productgroups
265
4%
- 13 -EEC-EG Report Phase 3 Solving Efeso © 2013
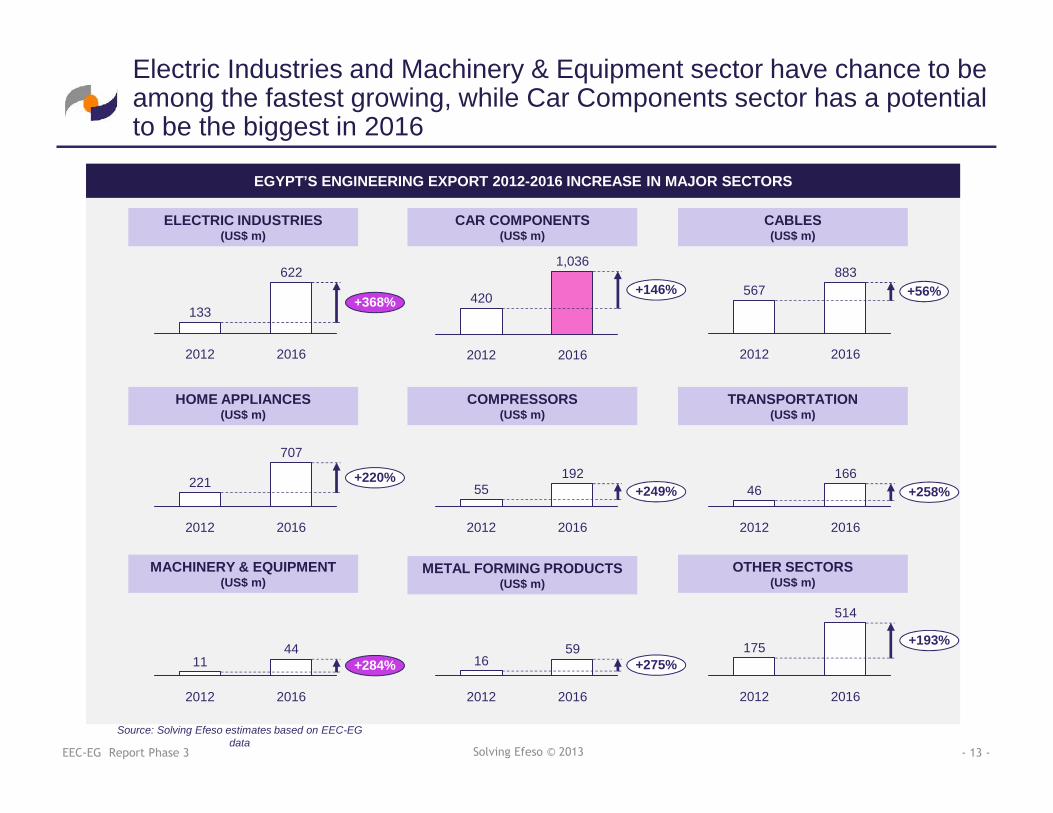
Electric Industries and Machinery & Equipment sector have chance to beamong the fastest growing, while Car Components sector has a potentialto be the biggest in 2016
EGYPT’S ENGINEERING EXPORT 2012-2016 INCREASE IN MAJOR SECTORS
Source: Solving Efeso estimates based on EEC-EGdata
622
+368%
20162012
133
ELECTRIC INDUSTRIES(US$ m)
1,036
+146%
20162012
420
CAR COMPONENTS(US$ m)
883+56%
20162012
567
CABLES(US$ m)
707
+220%
20162012
221
HOME APPLIANCES(US$ m)
192+249%
20162012
55
COMPRESSORS(US$ m)
166+258%
20162012
46
TRANSPORTATION(US$ m)
44+284%
20162012
11
MACHINERY & EQUIPMENT(US$ m)
59+275%
20162012
16
METAL FORMING PRODUCTS(US$ m)
514
+193%
20162012
175
OTHER SECTORS(US$ m)
- 14 -EEC-EG Report Phase 3 Solving Efeso © 2013
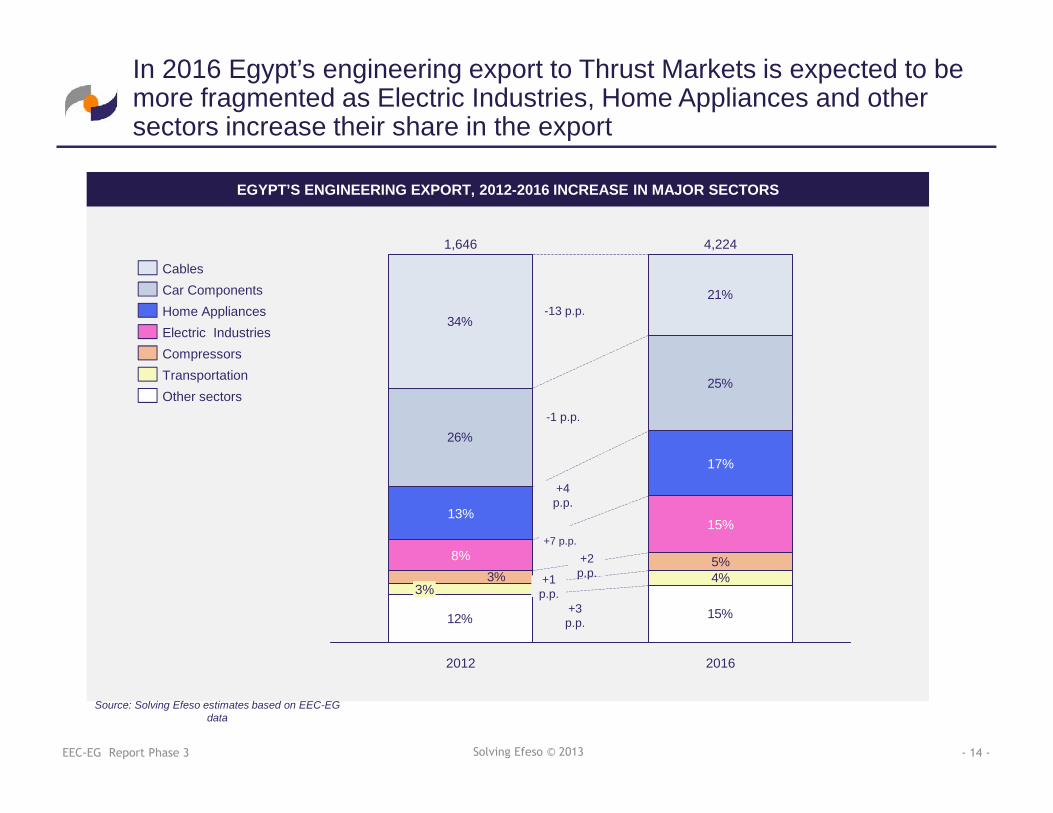
In 2016 Egypt’s engineering export to Thrust Markets is expected to bemore fragmented as Electric Industries, Home Appliances and othersectors increase their share in the export
EGYPT’S ENGINEERING EXPORT, 2012-2016 INCREASE IN MAJOR SECTORS
Source: Solving Efeso estimates based on EEC-EGdata
12% 15%
5%
26%
25%
34%
21%
4%3%
2012 2016
4,224
15%
17%
1,646
3%
8%
13%
Other sectorsTransportation
Home AppliancesElectric Industries
Car Components
Compressors
Cables
-13 p.p.
-1 p.p.
+4p.p.
+7 p.p.
+3p.p.
+2p.p.+1
p.p.
- 15 -EEC-EG Report Phase 5 Solving Efeso © 2014
Phase 2: Thrust Markets
- 16 -EEC-EG Report Phase 2 Solving Efeso © 2013
Objective of the Phase 2
The main objective of Phase 2 is to identify ThrustMarkets - the most attractive markets for selected
Thrust Products that will form the basis for astrategy for Egypt’s engineering export.
Phase 2 Objective statement
- 17 -EEC-EG Report Phase 2 Solving Efeso © 2013
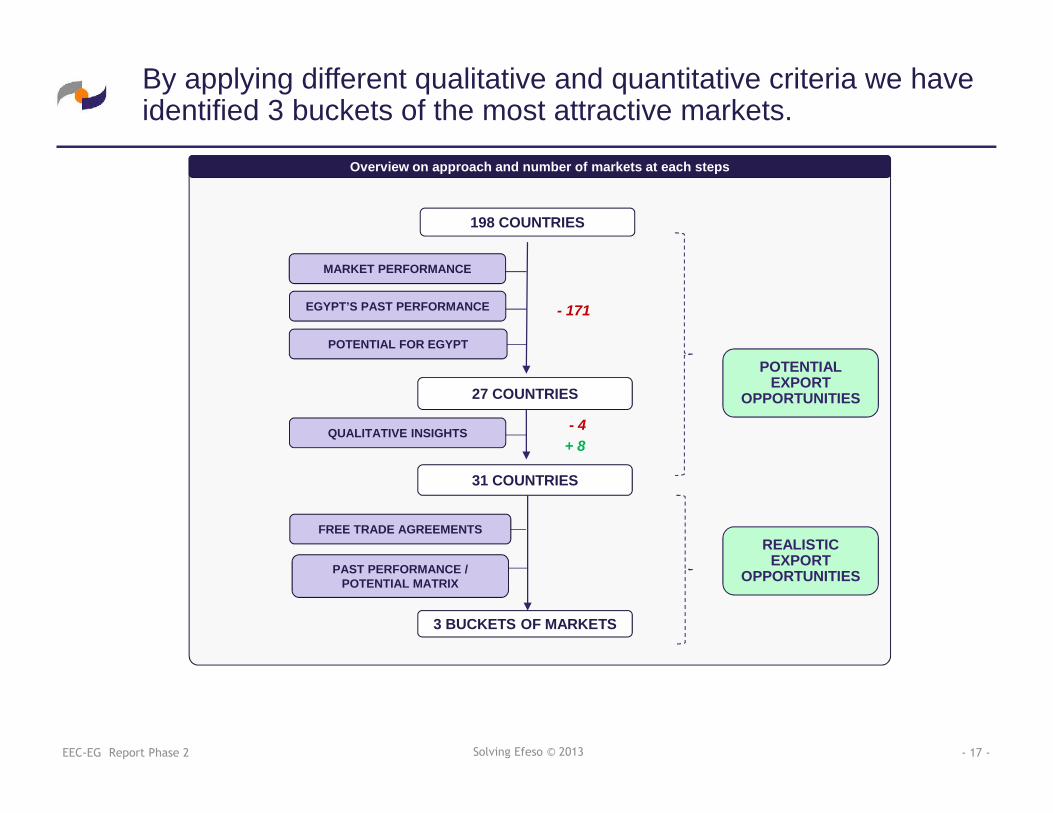
198 COUNTRIES
31 COUNTRIES
Overview on approach and number of markets at each steps
EGYPT’S PAST PERFORMANCE
POTENTIAL FOR EGYPT
QUALITATIVE INSIGHTS
FREE TRADE AGREEMENTS
27 COUNTRIES
- 171
- 4+ 8
3 BUCKETS OF MARKETS
POTENTIALEXPORT
OPPORTUNITIES
REALISTICEXPORT
OPPORTUNITIES
MARKET PERFORMANCE
PAST PERFORMANCE /POTENTIAL MATRIX
By applying different qualitative and quantitative criteria we haveidentified 3 buckets of the most attractive markets.
- 18 -EEC-EG Report Phase 2 Solving Efeso © 2013
0.3
0.4
0.5
0.6
0.7
0.8
0.9
1.0
1.1
1.2
1.3EPP
Slovakia
Poland
Kenya
Ghana
Spain Kuwait
GreeceSouth Africa
Lebanon
Belgium
Yemen
Sudan
Iraq
France
United Kingdom
Algeria
Tunisia
TurkeyGermany
Italy
Morocco
Saudi Arabia
Jordan
0.650.600.550.50
EthiopiaUkraine
Zambia
Nigeria
Kazakhstan
Mexico
Georgia
Serbia
PFE1.151.101.050.850.800.750.70
HIGH
HIGHLOW
LOW
POTENTIAL FOR EGYPT
EGYP
T’S
PAST
PER
FOR
MAN
CE
NON-FTA
FTA (EU / TURKEY PARTNERSHIP)
FTA (COMESA,GAFTA,AGADIR)
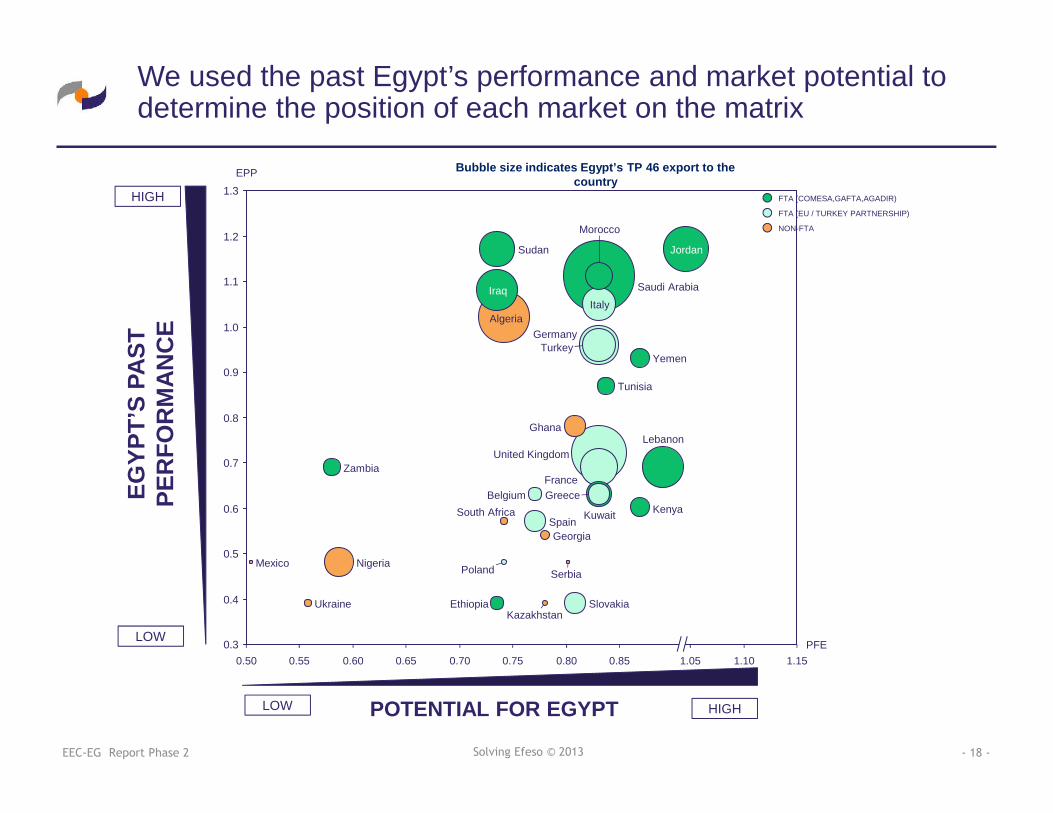
Bubble size indicates Egypt’s TP 46 export to thecountry
We used the past Egypt’s performance and market potential todetermine the position of each market on the matrix
- 19 -EEC-EG Report Phase 2 Solving Efeso © 2013
HIGH
HIGHLOW
LOW
POTENTIAL FOR EGYPT
EGYP
T’S
PAST
PER
FOR
MAN
CE
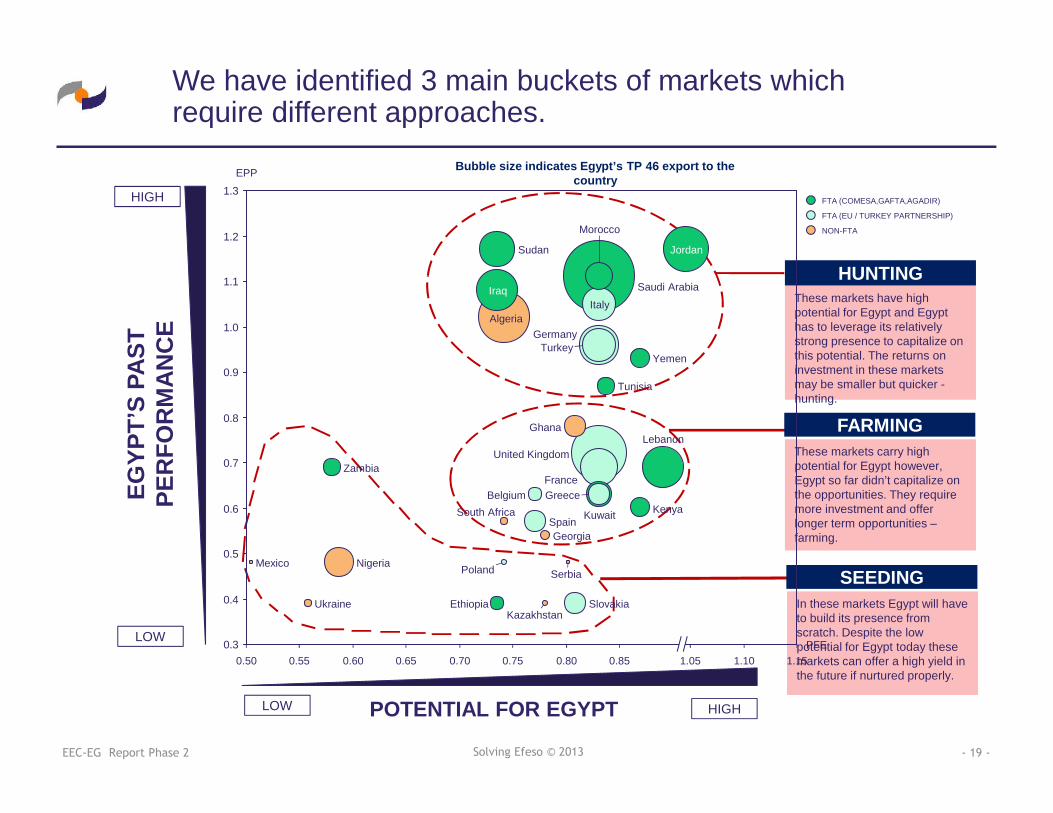
Bubble size indicates Egypt’s TP 46 export to thecountry
We have identified 3 main buckets of markets whichrequire different approaches.
These markets have highpotential for Egypt and Egypthas to leverage its relativelystrong presence to capitalize onthis potential. The returns oninvestment in these marketsmay be smaller but quicker -hunting.
These markets carry highpotential for Egypt however,Egypt so far didn’t capitalize onthe opportunities. They requiremore investment and offerlonger term opportunities –farming.
FARMING
HUNTING
In these markets Egypt will haveto build its presence fromscratch. Despite the lowpotential for Egypt today thesemarkets can offer a high yield inthe future if nurtured properly.
SEEDING
0.3
0.4
0.5
0.6
0.7
0.8
0.9
1.0
1.1
1.2
1.3
1.151.101.050.850.800.700.650.60 0.750.550.50
EthiopiaUkraine
Zambia
Nigeria
Kazakhstan
Mexico
Georgia
Serbia
Slovakia
Poland
Kenya
Ghana
Spain Kuwait
GreeceSouth Africa
EPP
Belgium
Yemen
Sudan
Iraq
France
United Kingdom
Algeria
Lebanon
TurkeyGermany
Italy
Morocco
Saudi Arabia
Jordan
PFE
Tunisia
NON-FTA
FTA (EU / TURKEY PARTNERSHIP)
FTA (COMESA,GAFTA,AGADIR)
- 20 -EEC-EG Report Phase 2 Solving Efeso © 2013
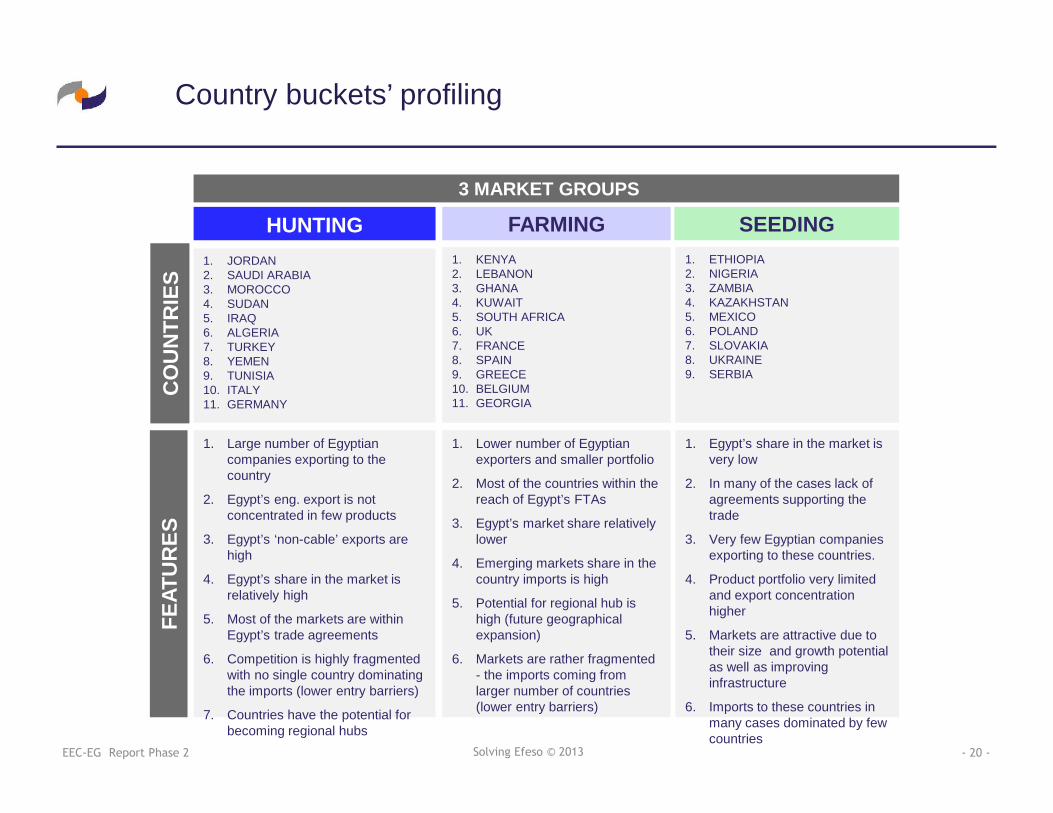
Country buckets’ profiling
FARMINGHUNTING SEEDING
CO
UN
TRIE
SFE
ATU
RES
1. JORDAN2. SAUDI ARABIA3. MOROCCO4. SUDAN5. IRAQ6. ALGERIA7. TURKEY8. YEMEN9. TUNISIA10. ITALY11. GERMANY
1. KENYA2. LEBANON3. GHANA4. KUWAIT5. SOUTH AFRICA6. UK7. FRANCE8. SPAIN9. GREECE10. BELGIUM11. GEORGIA
1. ETHIOPIA2. NIGERIA3. ZAMBIA4. KAZAKHSTAN5. MEXICO6. POLAND7. SLOVAKIA8. UKRAINE9. SERBIA
1. Large number of Egyptiancompanies exporting to thecountry
2. Egypt’s eng. export is notconcentrated in few products
3. Egypt’s ‘non-cable’ exports arehigh
4. Egypt’s share in the market isrelatively high
5. Most of the markets are withinEgypt’s trade agreements
6. Competition is highly fragmentedwith no single country dominatingthe imports (lower entry barriers)
7. Countries have the potential forbecoming regional hubs
1. Lower number of Egyptianexporters and smaller portfolio
2. Most of the countries within thereach of Egypt’s FTAs
3. Egypt’s market share relativelylower
4. Emerging markets share in thecountry imports is high
5. Potential for regional hub ishigh (future geographicalexpansion)
6. Markets are rather fragmented- the imports coming fromlarger number of countries(lower entry barriers)
1. Egypt’s share in the market isvery low
2. In many of the cases lack ofagreements supporting thetrade
3. Very few Egyptian companiesexporting to these countries.
4. Product portfolio very limitedand export concentrationhigher
5. Markets are attractive due totheir size and growth potentialas well as improvinginfrastructure
6. Imports to these countries inmany cases dominated by fewcountries
3 MARKET GROUPS
- 21 -EEC-EG Report Phase 2 Solving Efeso © 2013
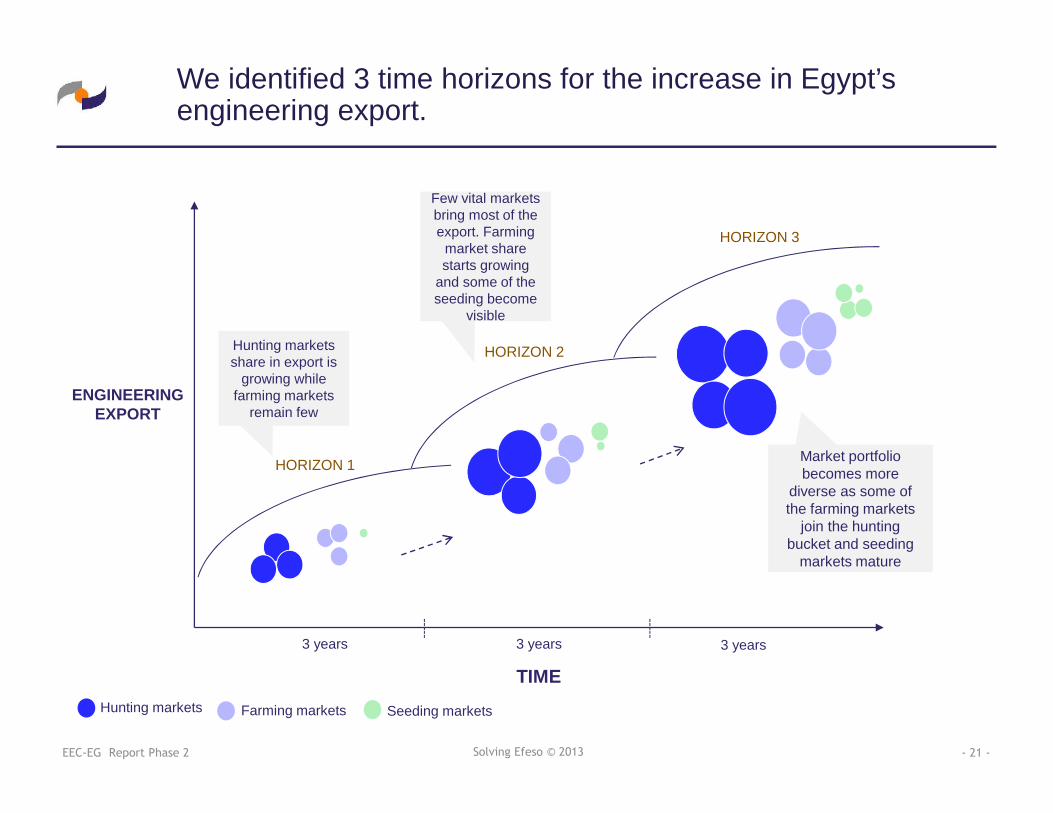
We identified 3 time horizons for the increase in Egypt’sengineering export.
TIME
ENGINEERINGEXPORT
3 years 3 years 3 years
HORIZON 1
HORIZON 2
HORIZON 3
Hunting markets Farming markets Seeding markets
Hunting marketsshare in export is
growing whilefarming markets
remain few
Few vital marketsbring most of theexport. Farming
market sharestarts growing
and some of theseeding become
visible
Market portfoliobecomes more
diverse as some ofthe farming markets
join the huntingbucket and seeding
markets mature
- 22 -EEC-EG Report Phase 2 Solving Efeso © 2013
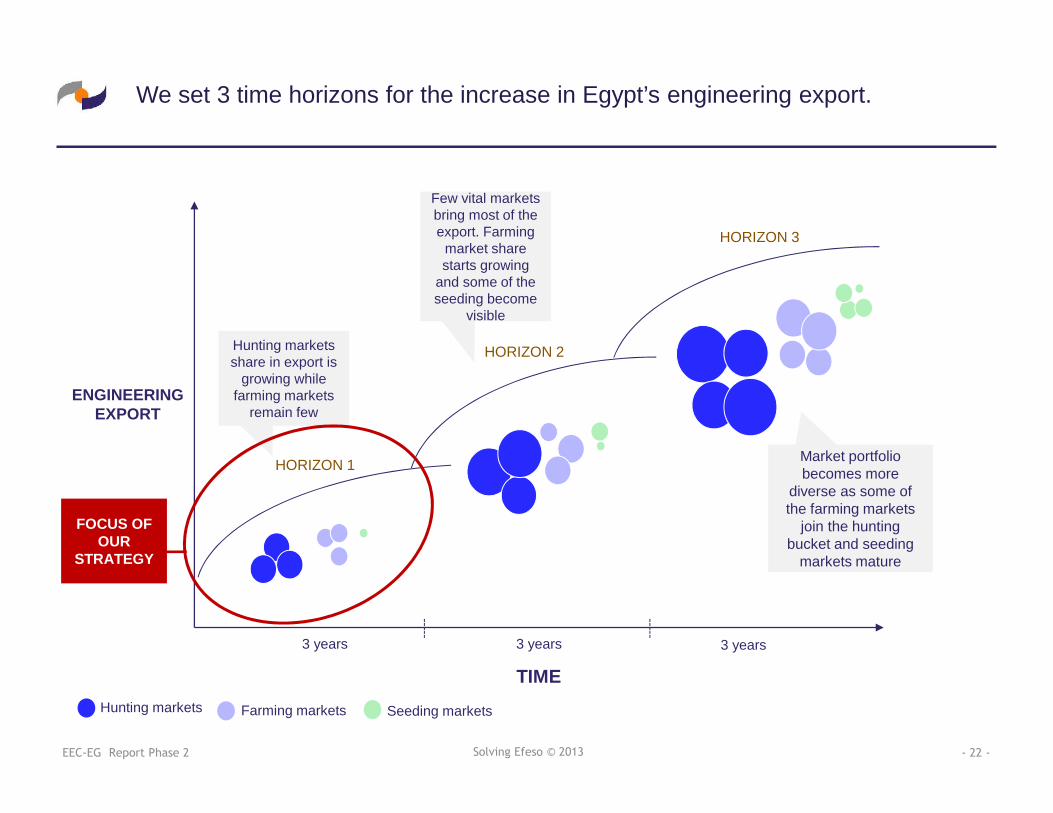
We set 3 time horizons for the increase in Egypt’s engineering export.
TIME
ENGINEERINGEXPORT
3 years 3 years 3 years
HORIZON 1
HORIZON 2
HORIZON 3
Hunting markets Farming markets Seeding markets
Hunting marketsshare in export is
growing whilefarming markets
remain few
Few vital marketsbring most of theexport. Farming
market sharestarts growing
and some of theseeding become
visible
Market portfoliobecomes more
diverse as some ofthe farming markets
join the huntingbucket and seeding
markets mature
FOCUS OFOUR
STRATEGY
- 23 -Solving Efeso © 2013
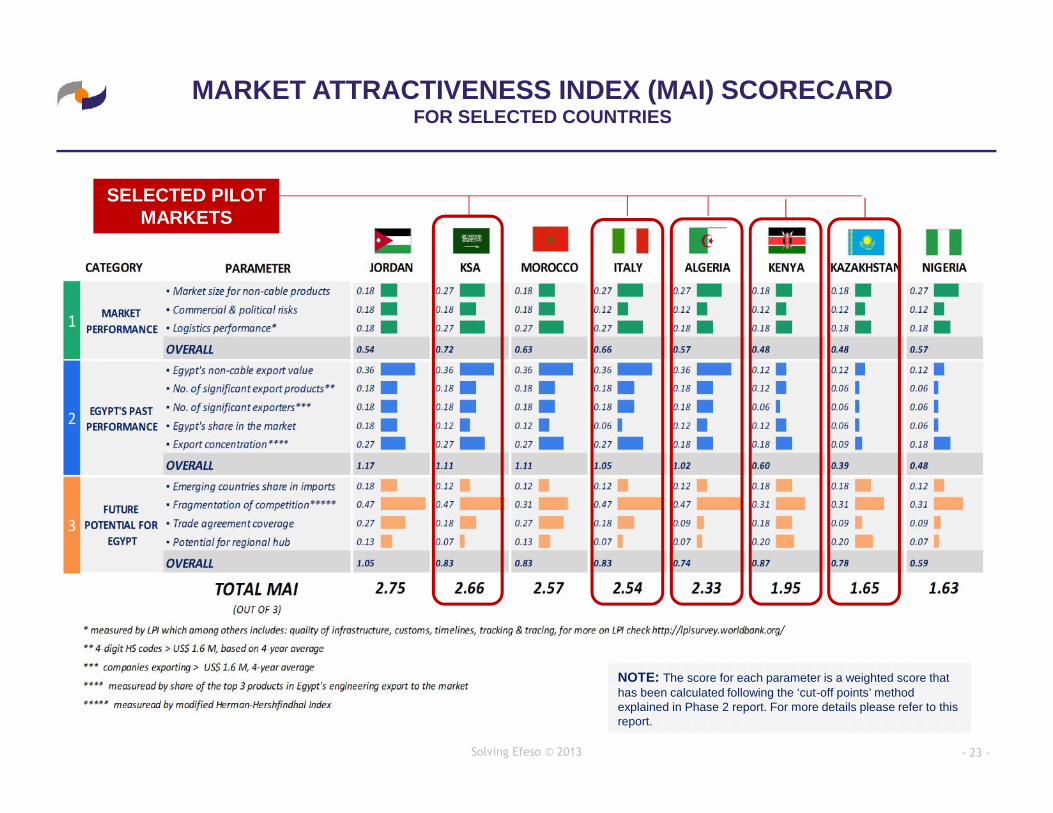
MARKET ATTRACTIVENESS INDEX (MAI) SCORECARDFOR SELECTED COUNTRIES
NOTE: The score for each parameter is a weighted score thathas been calculated following the ‘cut-off points’ methodexplained in Phase 2 report. For more details please refer to thisreport.
SELECTED PILOTMARKETS
- 24 -Solving Efeso © 2013
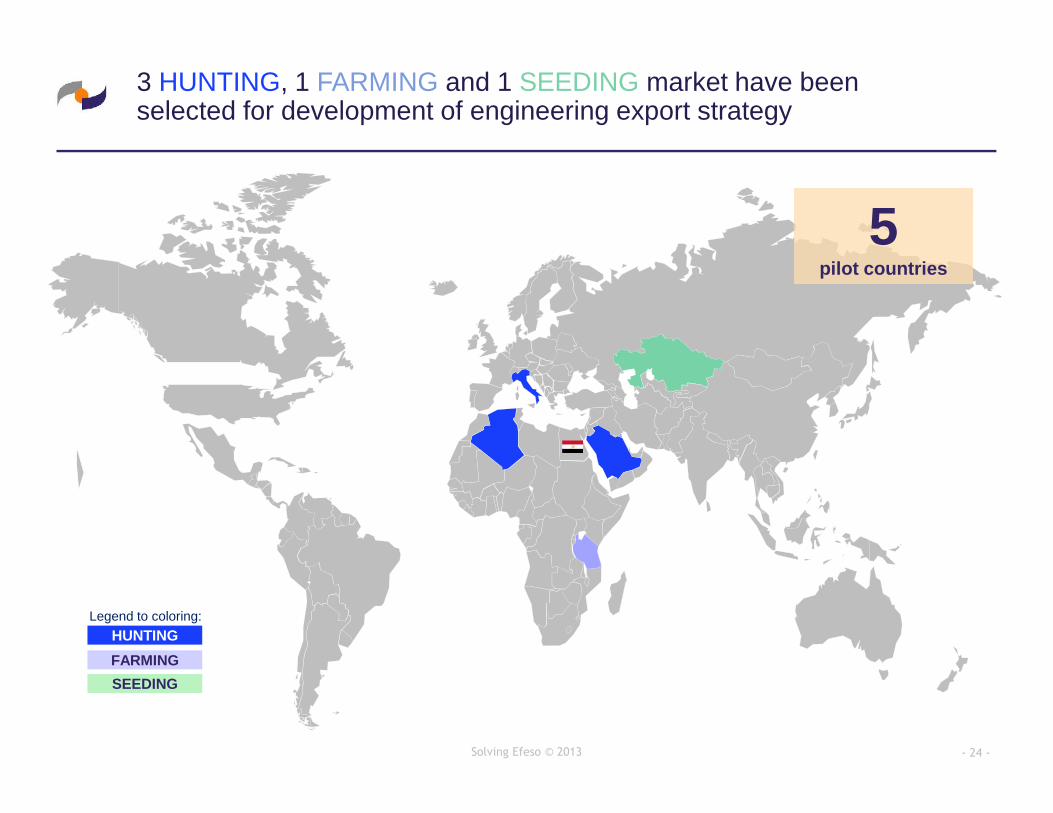
3 HUNTING, 1 FARMING and 1 SEEDING market have beenselected for development of engineering export strategy
FARMINGHUNTING
SEEDING
Legend to coloring:
5pilot countries
- 25 -Solving Efeso © 2013
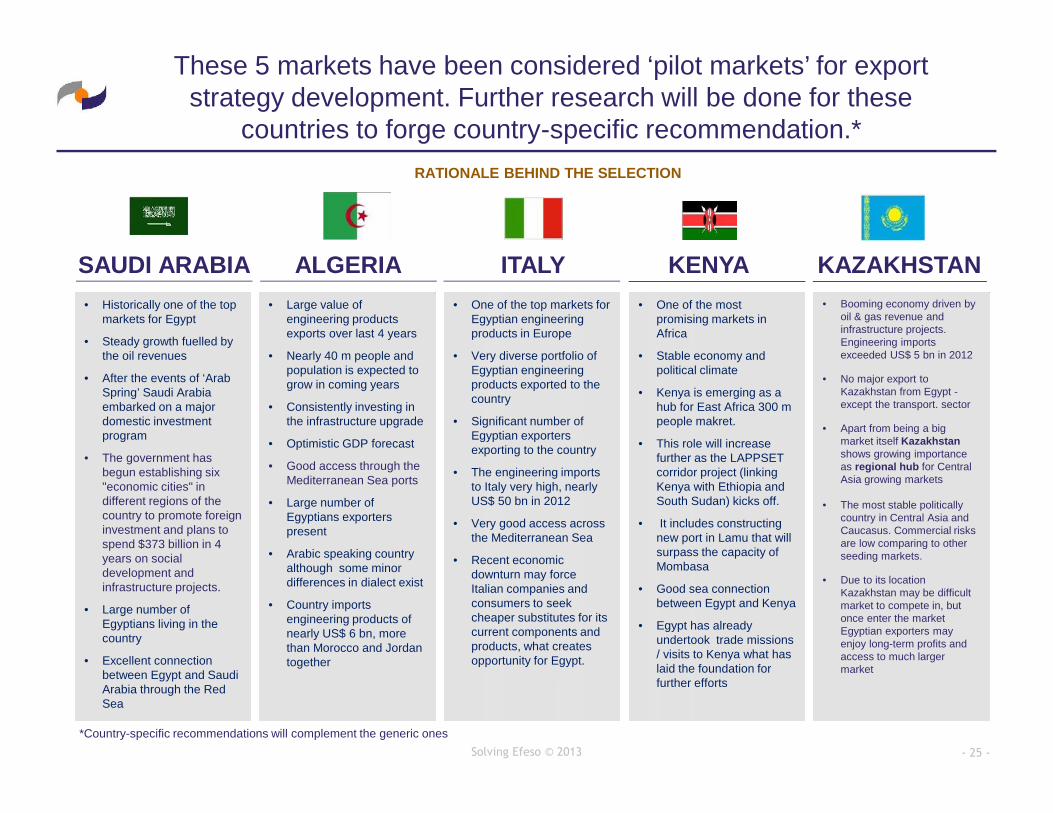
SAUDI ARABIA KENYA
RATIONALE BEHIND THE SELECTION
• Historically one of the topmarkets for Egypt
• Steady growth fuelled bythe oil revenues
• After the events of ‘ArabSpring’ Saudi Arabiaembarked on a majordomestic investmentprogram
• The government hasbegun establishing six"economic cities" indifferent regions of thecountry to promote foreigninvestment and plans tospend $373 billion in 4years on socialdevelopment andinfrastructure projects.
• Large number ofEgyptians living in thecountry
• Excellent connectionbetween Egypt and SaudiArabia through the RedSea
• One of the mostpromising markets inAfrica
• Stable economy andpolitical climate
• Kenya is emerging as ahub for East Africa 300 mpeople makret.
• This role will increasefurther as the LAPPSETcorridor project (linkingKenya with Ethiopia andSouth Sudan) kicks off.
• It includes constructingnew port in Lamu that willsurpass the capacity ofMombasa
• Good sea connectionbetween Egypt and Kenya
• Egypt has alreadyundertook trade missions/ visits to Kenya what haslaid the foundation forfurther efforts
These 5 markets have been considered ‘pilot markets’ for exportstrategy development. Further research will be done for these
countries to forge country-specific recommendation.*
ALGERIA• Large value of
engineering productsexports over last 4 years
• Nearly 40 m people andpopulation is expected togrow in coming years
• Consistently investing inthe infrastructure upgrade
• Optimistic GDP forecast
• Good access through theMediterranean Sea ports
• Large number ofEgyptians exporterspresent
• Arabic speaking countryalthough some minordifferences in dialect exist
• Country importsengineering products ofnearly US$ 6 bn, morethan Morocco and Jordantogether
ITALY• One of the top markets for
Egyptian engineeringproducts in Europe
• Very diverse portfolio ofEgyptian engineeringproducts exported to thecountry
• Significant number ofEgyptian exportersexporting to the country
• The engineering importsto Italy very high, nearlyUS$ 50 bn in 2012
• Very good access acrossthe Mediterranean Sea
• Recent economicdownturn may forceItalian companies andconsumers to seekcheaper substitutes for itscurrent components andproducts, what createsopportunity for Egypt.
KAZAKHSTAN• Booming economy driven by
oil & gas revenue andinfrastructure projects.Engineering importsexceeded US$ 5 bn in 2012
• No major export toKazakhstan from Egypt -except the transport. sector
• Apart from being a bigmarket itself Kazakhstanshows growing importanceas regional hub for CentralAsia growing markets
• The most stable politicallycountry in Central Asia andCaucasus. Commercial risksare low comparing to otherseeding markets.
• Due to its locationKazakhstan may be difficultmarket to compete in, butonce enter the marketEgyptian exporters mayenjoy long-term profits andaccess to much largermarket
*Country-specific recommendations will complement the generic ones
- 26 -EEC-EG Report Phase 5 Solving Efeso © 2014
Phase 3: Export Strategy
- 27 -EEC-EG Report Phase 2 Solving Efeso © 2013
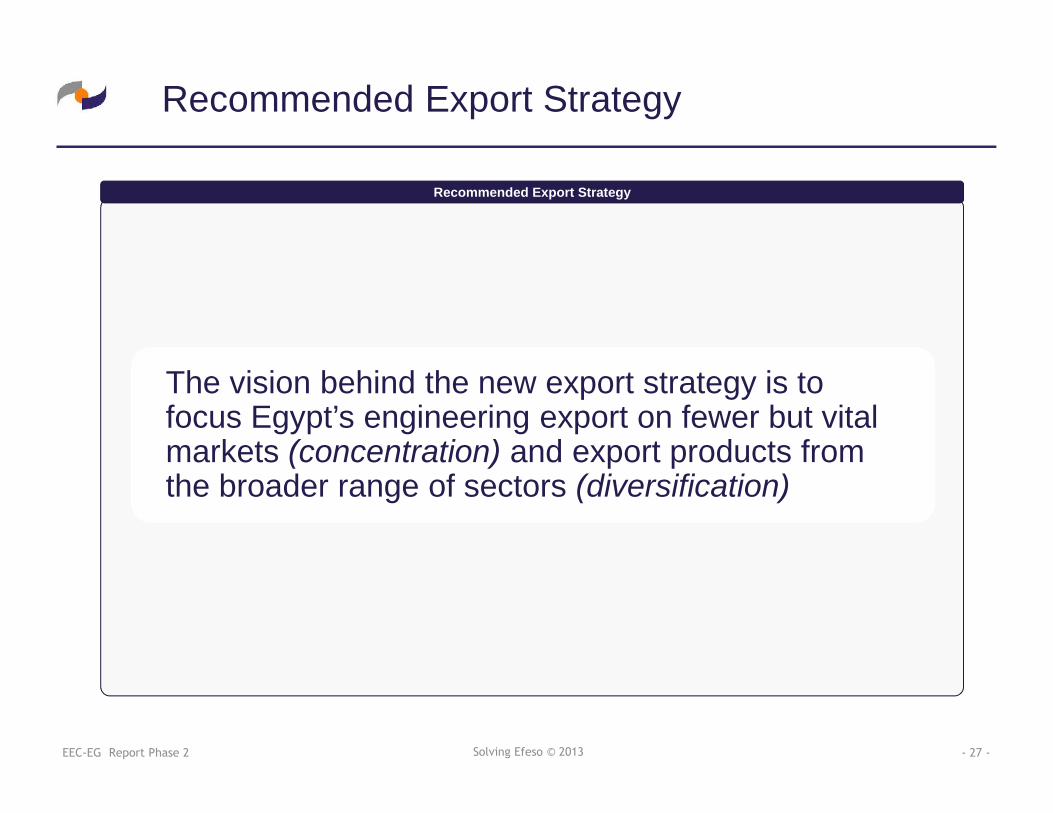
Recommended Export Strategy
The vision behind the new export strategy is tofocus Egypt’s engineering export on fewer but vitalmarkets (concentration) and export products fromthe broader range of sectors (diversification)
Recommended Export Strategy
- 28 -EEC-EG Report Phase 3 Solving Efeso © 2013
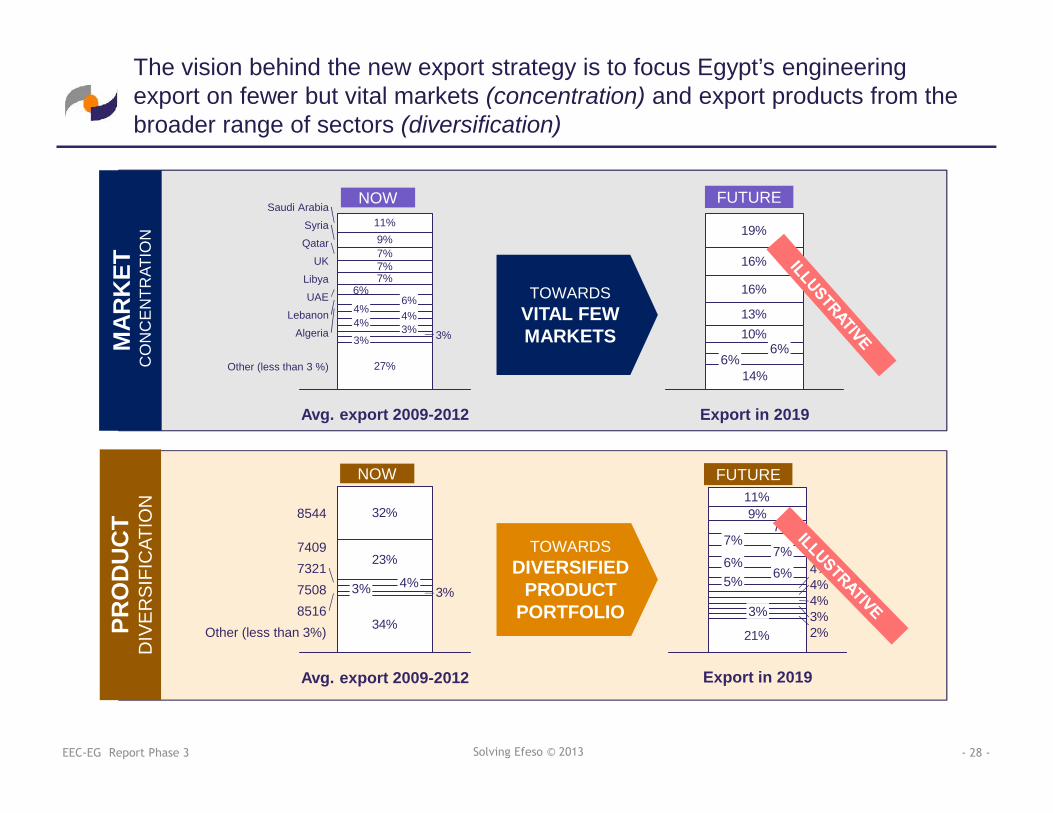
The vision behind the new export strategy is to focus Egypt’s engineeringexport on fewer but vital markets (concentration) and export products from thebroader range of sectors (diversification)
27%
3%
6%7%7%7%9%11%
Other (less than 3 %)
3%4% 4%4%6%
Algeria
Lebanon
UAE
Libya
UK
Qatar
Syria
Saudi Arabia
Avg. export 2009-2012
3%
14%
10%13%
16%
16%
19%
Export in 2019
6%6%
TOWARDSVITAL FEWMARKETS
34%
3%
23%
32%
Other (less than 3%)8516750873217409
8544
Avg. export 2009-2012
3% 4%
21% 2%3%4%4%4%
7%9%
11%
Export in 2019
3%
5% 6%6%
7%7%TOWARDS
DIVERSIFIEDPRODUCT
PORTFOLIOPRO
DU
CT
DIV
ER
SIF
ICAT
ION
MAR
KET
CO
NC
EN
TRAT
ION
NOW FUTURE
NOW FUTURE
- 29 -EEC-EG Report Phase 4 Solving Efeso © 2013
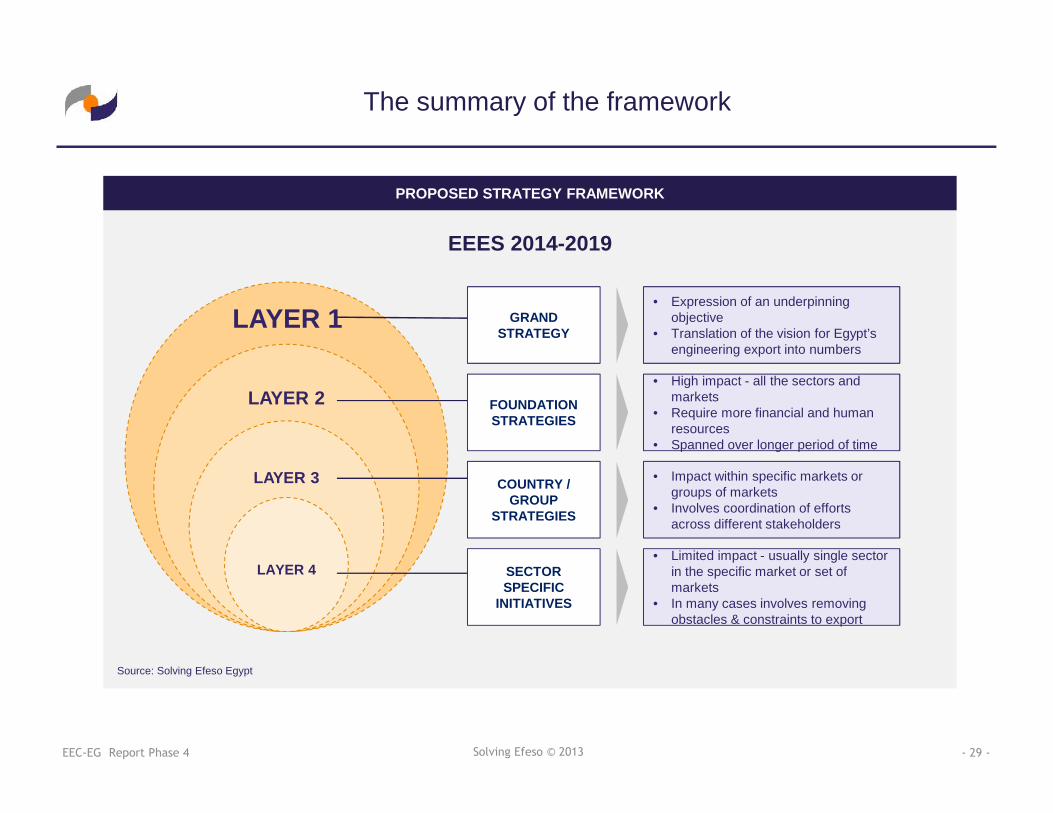
The summary of the framework
PROPOSED STRATEGY FRAMEWORK
LAYER 2
LAYER 3
LAYER 4
FOUNDATIONSTRATEGIES
COUNTRY /GROUP
STRATEGIES
SECTORSPECIFIC
INITIATIVES
• High impact - all the sectors andmarkets
• Require more financial and humanresources
• Spanned over longer period of time
• Impact within specific markets orgroups of markets
• Involves coordination of effortsacross different stakeholders
• Limited impact - usually single sectorin the specific market or set ofmarkets
• In many cases involves removingobstacles & constraints to export
EEES 2014-2019
Source: Solving Efeso Egypt
LAYER 1 GRANDSTRATEGY
• Expression of an underpinningobjective
• Translation of the vision for Egypt’sengineering export into numbers
- 30 -EEC-EG Report Phase 4 Solving Efeso © 2013
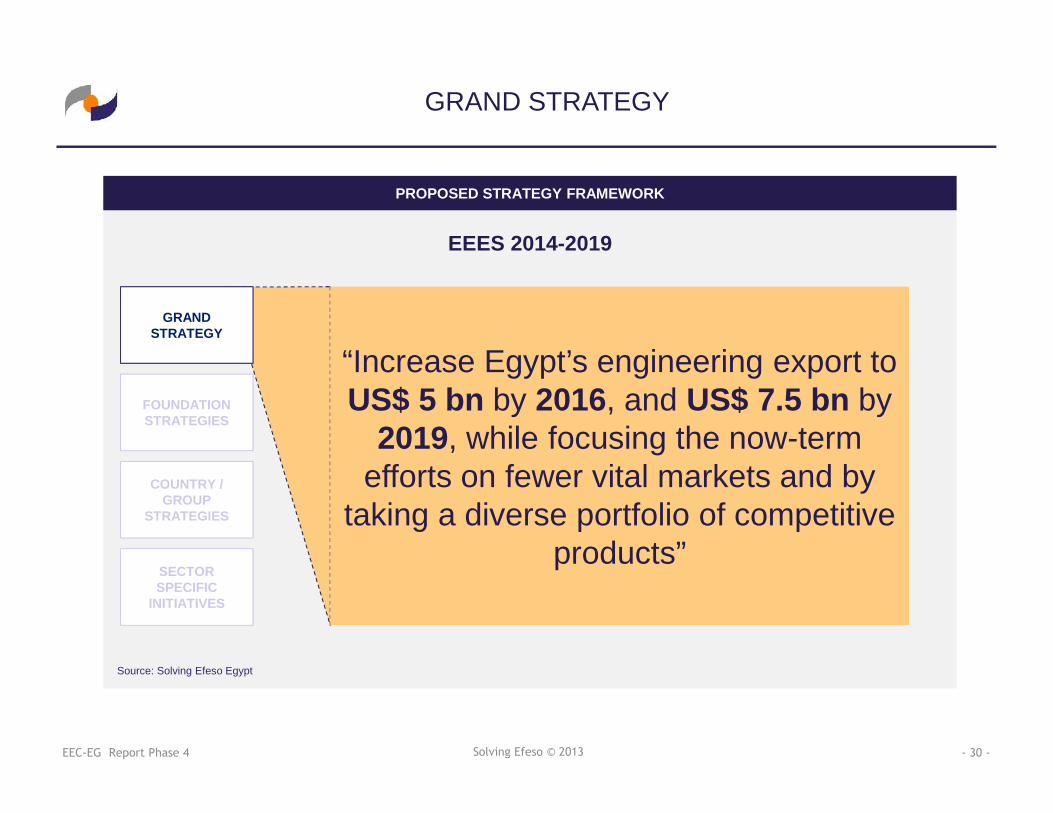
GRAND STRATEGY
PROPOSED STRATEGY FRAMEWORK
FOUNDATIONSTRATEGIES
COUNTRY /GROUP
STRATEGIES
SECTORSPECIFIC
INITIATIVES
Source: Solving Efeso Egypt
GRANDSTRATEGY
“Increase Egypt’s engineering export toUS$ 5 bn by 2016, and US$ 7.5 bn by
2019, while focusing the now-termefforts on fewer vital markets and by
taking a diverse portfolio of competitiveproducts”
EEES 2014-2019
- 31 -EEC-EG Report Phase 4 Solving Efeso © 2013
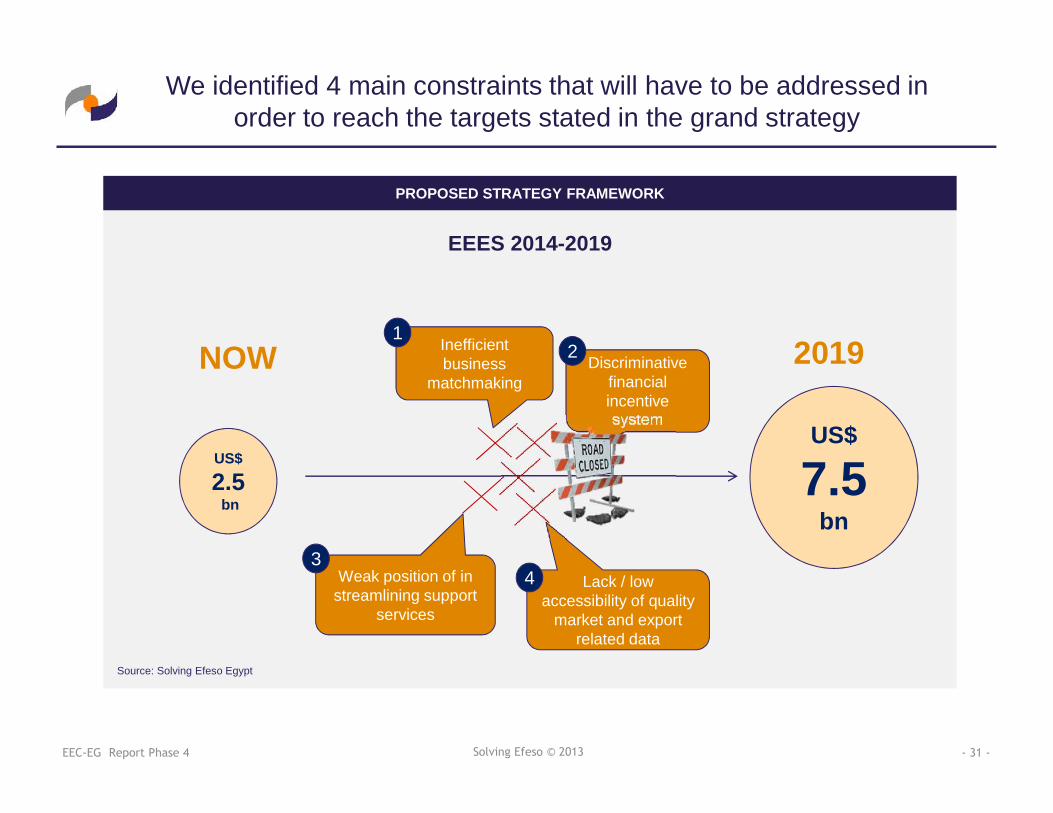
We identified 4 main constraints that will have to be addressed inorder to reach the targets stated in the grand strategy
PROPOSED STRATEGY FRAMEWORK
Source: Solving Efeso Egypt
EEES 2014-2019
US$
2.5bn
NOW 2019
US$
7.5bn
Inefficientbusiness
matchmaking
Lack / lowaccessibility of quality
market and exportrelated data
Discriminativefinancialincentivesystem
Weak position of instreamlining support
services
12
34
- 32 -EEC-EG Report Phase 5 Solving Efeso © 2014
Phase 4: Action Plan
- 33 -EEC-EG Report Phase 4 Solving Efeso © 2013
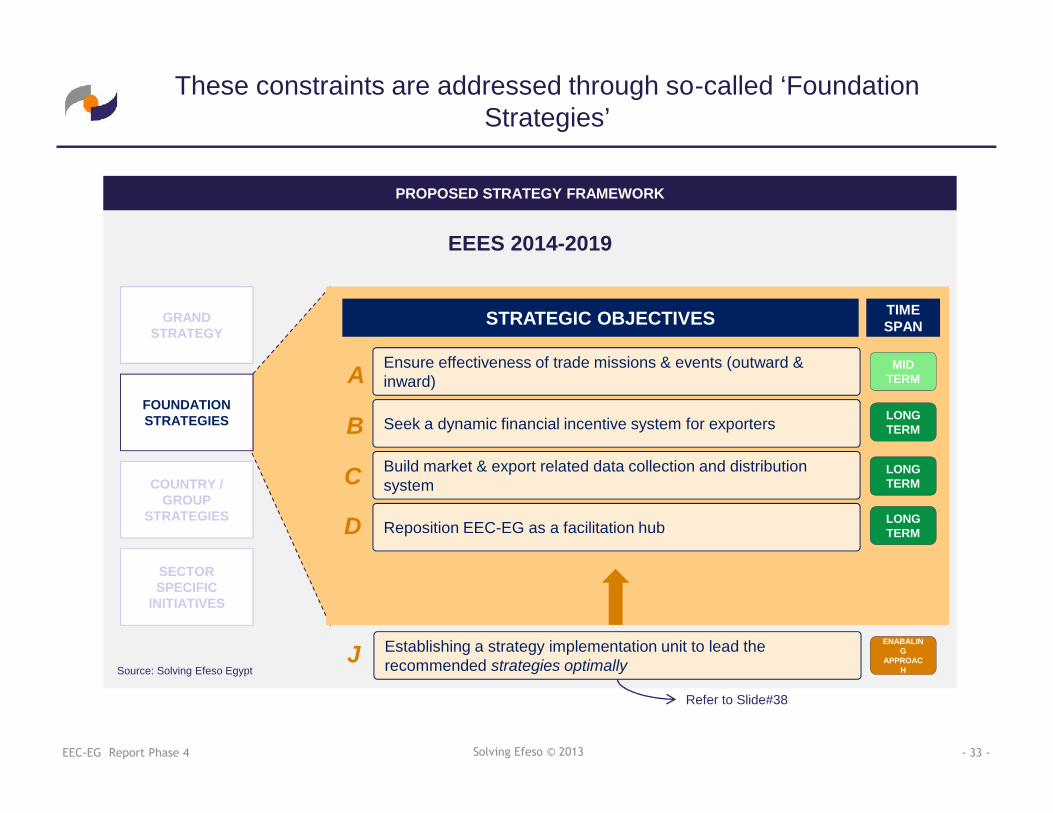
These constraints are addressed through so-called ‘FoundationStrategies’
PROPOSED STRATEGY FRAMEWORK
COUNTRY /GROUP
STRATEGIES
SECTORSPECIFIC
INITIATIVES
Source: Solving Efeso Egypt
GRANDSTRATEGY
FOUNDATIONSTRATEGIES
STRATEGIC OBJECTIVES
Ensure effectiveness of trade missions & events (outward &inward)
Build market & export related data collection and distributionsystem
Reposition EEC-EG as a facilitation hub
Seek a dynamic financial incentive system for exporters
A
B
C
D
LONGTERM
LONGTERM
TIMESPAN
LONGTERM
MIDTERM
EEES 2014-2019
Establishing a strategy implementation unit to lead therecommended strategies optimallyJ
ENABALING
APPROACH
Refer to Slide#38
- 34 -EEC-EG Report Phase 4 Solving Efeso © 2013
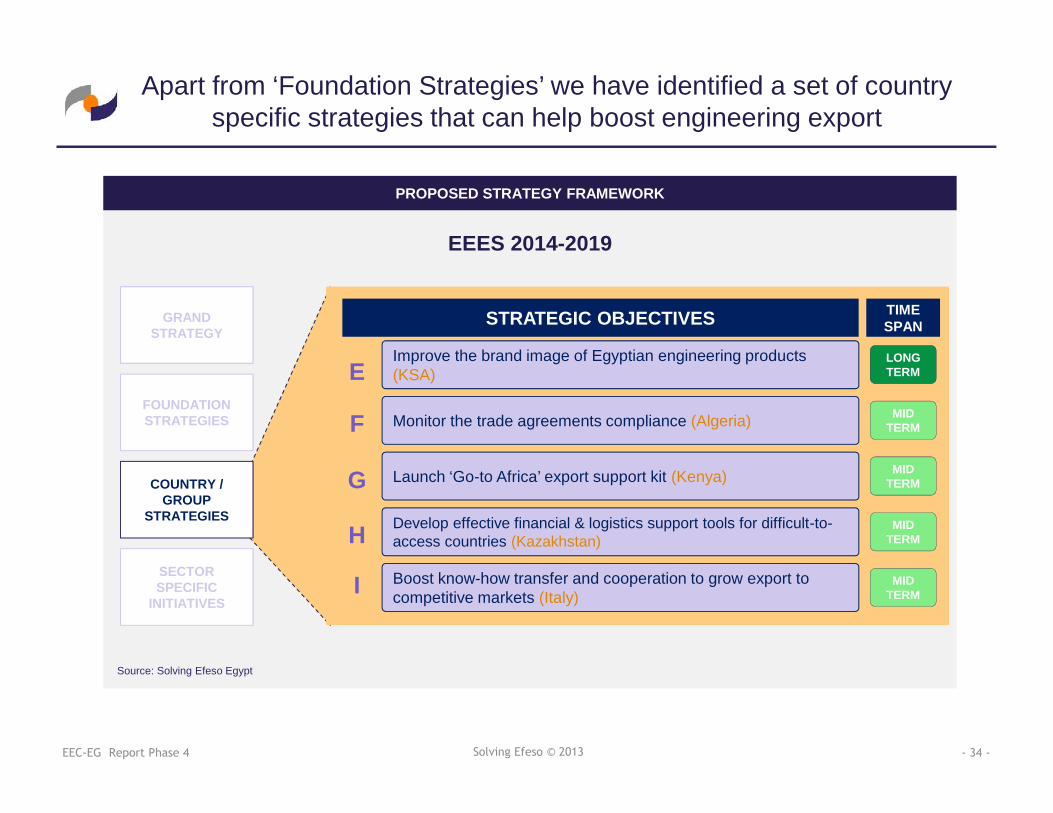
Apart from ‘Foundation Strategies’ we have identified a set of countryspecific strategies that can help boost engineering export
PROPOSED STRATEGY FRAMEWORK
COUNTRY /GROUP
STRATEGIES
SECTORSPECIFIC
INITIATIVES
Source: Solving Efeso Egypt
GRANDSTRATEGY
FOUNDATIONSTRATEGIES
STRATEGIC OBJECTIVES
Improve the brand image of Egyptian engineering products(KSA)
Monitor the trade agreements compliance (Algeria)
Boost know-how transfer and cooperation to grow export tocompetitive markets (Italy)
Launch ‘Go-to Africa’ export support kit (Kenya)
Develop effective financial & logistics support tools for difficult-to-access countries (Kazakhstan)
E
F
G
H
I
LONGTERM
MIDTERM
MIDTERM
MIDTERM
MIDTERM
TIMESPAN
EEES 2014-2019
- 35 -EEC-EG Report Phase 4 Solving Efeso © 2013
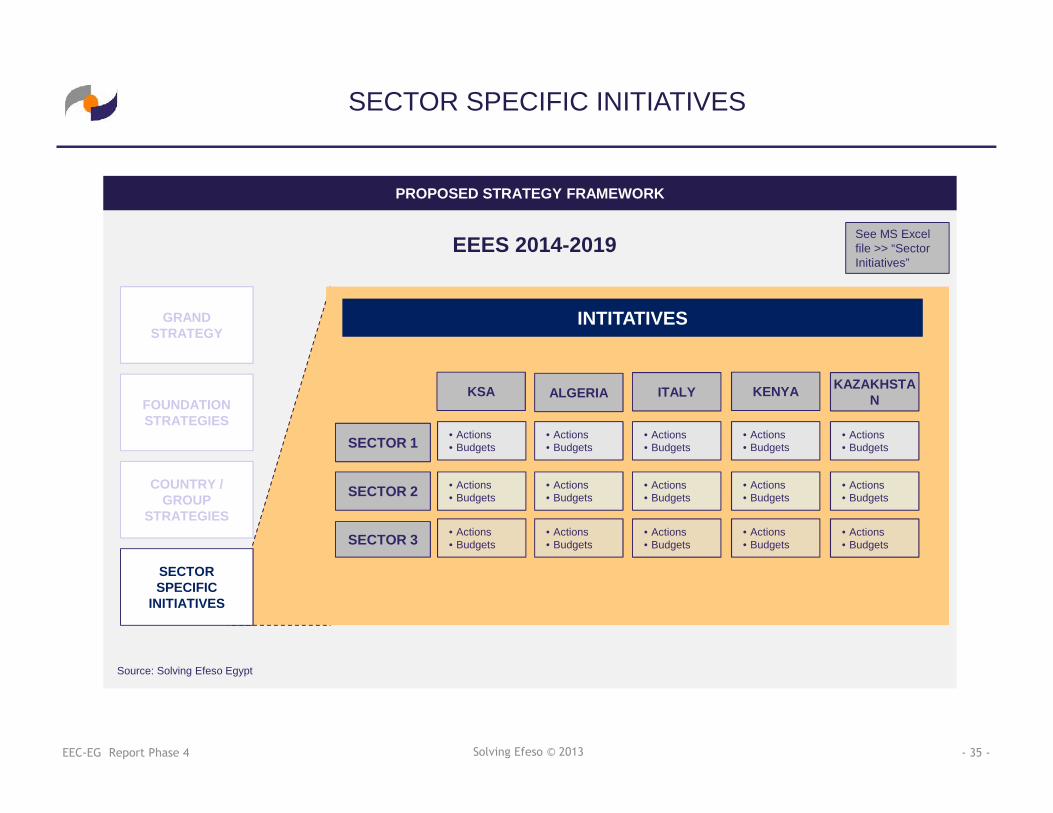
SECTOR SPECIFIC INITIATIVES
PROPOSED STRATEGY FRAMEWORK
COUNTRY /GROUP
STRATEGIES
SECTORSPECIFIC
INITIATIVES
Source: Solving Efeso Egypt
GRANDSTRATEGY
FOUNDATIONSTRATEGIES
INTITATIVES
KSA ALGERIA
SECTOR 1
SECTOR 2
SECTOR 3
ITALY KENYA KAZAKHSTAN
• Actions• Budgets
• Actions• Budgets
• Actions• Budgets
• Actions• Budgets
• Actions• Budgets
• Actions• Budgets
• Actions• Budgets
• Actions• Budgets
• Actions• Budgets
• Actions• Budgets
• Actions• Budgets
• Actions• Budgets
• Actions• Budgets
• Actions• Budgets
• Actions• Budgets
EEES 2014-2019 See MS Excelfile >> “SectorInitiatives”
- 36 -EEC-EG Report Phase 4 Solving Efeso © 2013
Key Performance Indicators(KPIs)
- 37 -EEC-EG Report Phase 4 Solving Efeso © 2013
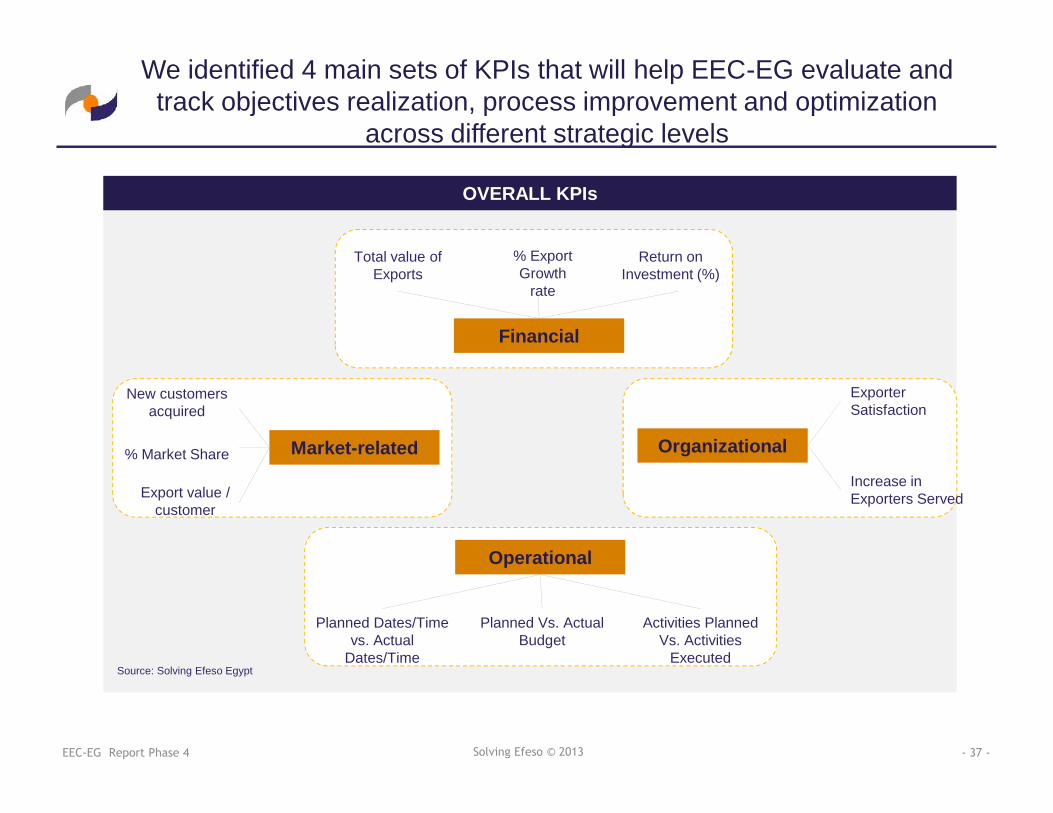
We identified 4 main sets of KPIs that will help EEC-EG evaluate andtrack objectives realization, process improvement and optimization
across different strategic levels
OVERALL KPIs
Source: Solving Efeso Egypt
% ExportGrowth
rate
Return onInvestment (%)
Total value ofExports
Financial
Operational
Planned Vs. ActualBudget
Activities PlannedVs. Activities
Executed
Planned Dates/Timevs. Actual
Dates/Time
Organizational
Increase inExporters Served
ExporterSatisfaction
Market-related
Export value /customer
% Market Share
New customersacquired
Recommended