Developing an Indicator for the Circular Economy
Draft Report
Niels Schoenaker
Roel Delahaye
*This is a draft report, this report contains preliminary results
project number
remarks
National Accounts
13 augustus 2015
The views expressed in this paper are those of the author(s) and do not necessarily reflect the
policies of Statistics Netherlands.
CBS Den Haag
Henri Faasdreef 312
2492 JP The Hague
P.O. Box 24500
2490 HA The Hague
+31 70 337 38 00
www.cbs.nl
Developing an Indicator for the Circular Economy 3
Index
1. Introduction 4
2. Methodology and data 6
2.1 Calculating the cyclical use rate: An example of the Czech Republic 6
2.2 Calculating the cyclical use rate indicator for the Netherlands 7
2.2.1 The ‘basic’ cyclical use rate indicator for the Netherlands ....................................... 7
2.2.2 Modifications ............................................................................................................ 8
2.2.3 The cyclical use rate indicator adjusted for the Netherlands ................................... 8
2.3 Building a time series 9
2.4 Data sources 9
2.5 Allocation of waste streams to material categories 10
2.6 Scope of material flows included 11
3. Results 13
3.1 Results for the Netherlands 13
3.2 Comparison of the results 14
3.2.1 Comparison with Japan and the Czech Republic .................................................... 14
3.2.2 Comparing the cyclical use rate indicator and the recycling rate .......................... 15
4. Discussion 16
5. Conclusion 21
6. References 22
Appendix 23
Developing an Indicator for the Circular Economy 4
1. Introduction
The circular economy is an economic system designed to maximize reusability of raw materials
and products and minimizing value destruction. It is about the transition from a linear economy,
characterized as ‘take, make and waste’, to a circular economy in which resources cycle in the
economy because of repair, reuse, remanufacturing, and recycling.
The circular economy is very popular among policymakers in the Netherlands and the EU as a
contribution to the solution of the raw material shortages that may arise in the near future by
increasing prosperity and population growth.
Several studies by the Ellen MacArthur Foundation (2012, 2013, 2014) show the many facets of
the circular economy. Encouraging maintenance, repair, reuse and recycling of products is key.
One of the ideas is that consumers no longer buy a product, but instead pay for the service to
use the product.
The circular economy is a comprehensive concept, and one could think of many indicators that
tell something about the circular economy (See ‘material flow monitor plus (MM+)’, which is
under production). The goal of this report is to develop an indicator for the Netherlands with
respect to the use of secondary materials, based on the developments at Eurostat (Task Force
on Material Flows, 2014) and the report by Kovanda (2014). A major advantage of such
indicator is the availability of potential useful source data.
Currently there is no indicator available in the Netherlands or the EU that measures the use of
secondary materials with respect to primary material input. For instance, the recycling rate
shows the share of waste that is recycled or reused. However, it focuses on the output of the
economy. A recycling rate of 100% implies that all waste is recycled and used as input in the
economy. However, it says nothing about the level of secondary material inputs as compared to
total material input. Furthermore, it says nothing about the value losses, and value creation of
such recycling activity.
The cyclical use rate indicator is developed for the Japanese Fundamental Plan for Establishing a
Sound Material-Cycle Society (2003), and measures the amount of secondary materials used in
the economy, relative to total material input. This indicator tells more about the input side of
the economy. The cyclical use rate indicator measures the cyclical use of materials (Uc)
relative to the total amount of material input into the economy (Uc+DMI1). So it shows the
share of cyclical use of materials in total use of materials.
A hypothetical cyclical use rate of 100% would imply that all material input into the economy is
secondary and no raw materials enter the economy. However, this indicator says nothing about
the waste streams from the economy to the environment. In an increasingly resource efficient
economy, there can still be waste as the total amount of inputs decreases. So the circular
economy is a broad concept and cannot be captured by a single indicator, a set of indicators
would be required to cover all aspects of the circular economy. This same conclusion is drawn
Geng et al. (2012), who developed an indicator system consisting of a set of circular economy
indicators.
The main aim of this paper is to explore the possibility to calculate the cyclical use rate indicator
for the Netherlands, and to evaluate whether it has the potential to be included as an official
statistic which may contribute to the mapping of the circular economy. This paper should be
seen as a discussion paper in which all bottlenecks and findings for calculating the indicator are
elaborated and open for discussion, rather than a final methodological report.
1 Direct Material Input
Developing an Indicator for the Circular Economy 5
The remainder of this paper is organized as follows. The following section describes how this
cyclical use rate indicator is calculated for the Czech Republic, based on the paper by Kovanda
(2014). Further, based on the work by Kovanda, it elaborates how the indicator is calculated
specifically for the Netherlands, and which data sources were used. The third section presents
the results of the cyclical use rate indicator for the Netherlands, and includes an international
comparison of these results. The fourth section comprises a discussion of the methodological
choices made and of the final results. In the last section conclusions are drawn.
Developing an Indicator for the Circular Economy 6
2. Methodology and data
2 . 1 C a l c u l a t i n g t h e c y c l i c a l u s e r a t e : A n e x a m p l e o f t h e C z e c h R e p u b l i c The cyclical use rate is an indicator that presents the ratio of cyclical use to total input of an
economy. It connects the topic of material consumption and waste management, and can be
calculated as follows (Ministry of the Environment – Government of Japan, 2003):
PUc =
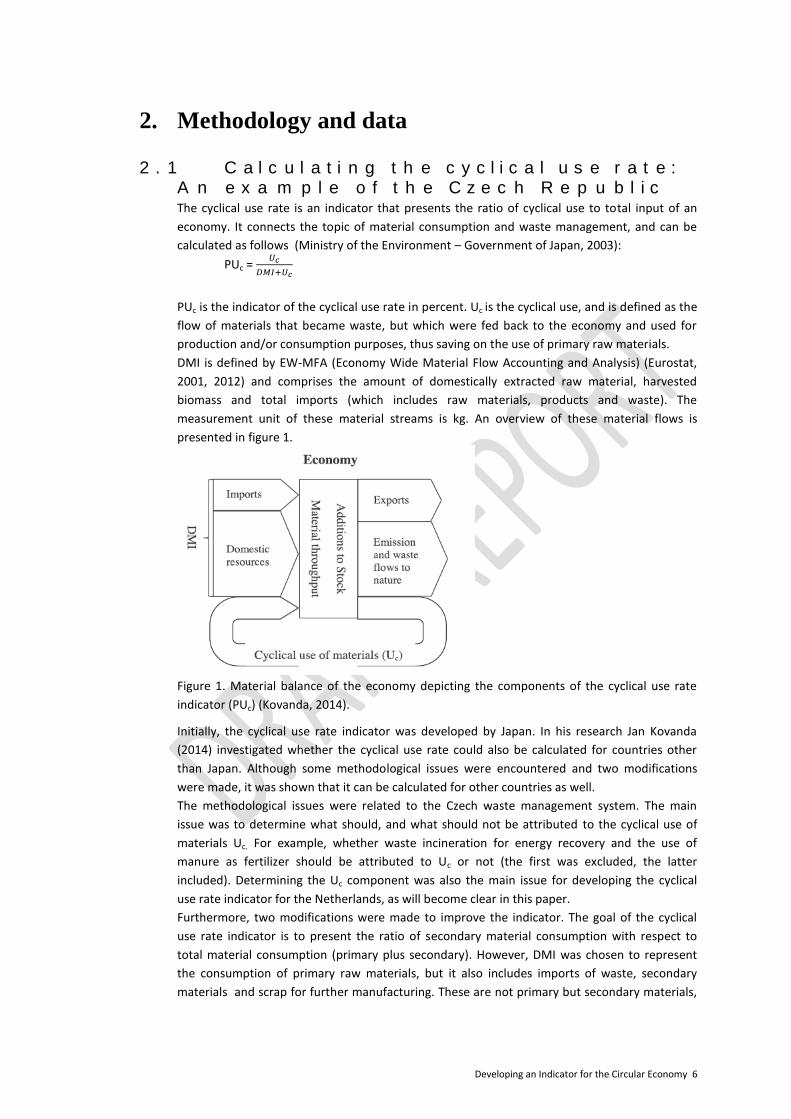
PUc is the indicator of the cyclical use rate in percent. Uc is the cyclical use, and is defined as the
flow of materials that became waste, but which were fed back to the economy and used for
production and/or consumption purposes, thus saving on the use of primary raw materials.
DMI is defined by EW-MFA (Economy Wide Material Flow Accounting and Analysis) (Eurostat,
2001, 2012) and comprises the amount of domestically extracted raw material, harvested
biomass and total imports (which includes raw materials, products and waste). The
measurement unit of these material streams is kg. An overview of these material flows is
presented in figure 1.
Figure 1. Material balance of the economy depicting the components of the cyclical use rate
indicator (PUc) (Kovanda, 2014).
Initially, the cyclical use rate indicator was developed by Japan. In his research Jan Kovanda
(2014) investigated whether the cyclical use rate could also be calculated for countries other
than Japan. Although some methodological issues were encountered and two modifications
were made, it was shown that it can be calculated for other countries as well.
The methodological issues were related to the Czech waste management system. The main
issue was to determine what should, and what should not be attributed to the cyclical use of
materials Uc. For example, whether waste incineration for energy recovery and the use of
manure as fertilizer should be attributed to Uc or not (the first was excluded, the latter
included). Determining the Uc component was also the main issue for developing the cyclical
use rate indicator for the Netherlands, as will become clear in this paper.
Furthermore, two modifications were made to improve the indicator. The goal of the cyclical
use rate indicator is to present the ratio of secondary material consumption with respect to
total material consumption (primary plus secondary). However, DMI was chosen to represent
the consumption of primary raw materials, but it also includes imports of waste, secondary
materials and scrap for further manufacturing. These are not primary but secondary materials,
Developing an Indicator for the Circular Economy 7
and should therefore be subtracted from DMI and added to Uc. The result is the first
modification as presented by formula 1.
1)
A second modification was made for the Czech Republic with respect to the use of domestically
produced secondary materials. ‘’These are materials which are of the nature of side products, by-products, and treated waste, which ceased to be waste the moment they became compliant with the conditions and criteria for materials obtained from products and which are subject of a retake.’’ (Kovanda, 2014, p.80)
These materials are not reported as waste in the Czech Republic waste statistics. However,
these materials are used for production and consumption purposes, and replace the use of
primary raw materials in production. So, these materials are included in the cyclical use of
materials component, Uc. The final result after including the second modification is presented
by formula 2.
2)
2 . 2 C a l c u l a t i n g t h e c y c l i c a l u s e r a t e i n d i c a t o r f o r t h e N e t h e r l a n d s
2.2.1 The ‘basic’ cyclical use rate indicator for the Netherlands2
For the calculation of the Dutch cyclical use rate indicator, the same approach was used as for
the Czech Republic. Firstly, the cyclical use rate indicator was calculated for the Netherlands as
a whole, without any further modifications. Secondly, further modifications were considered so
the indicator would best suit the specific situation of the Netherlands.
So, the two components (Uc and DMI) of the cyclical use rate indicator had to be determined.
Determination of DMI was straightforward, as DMI is very well defined by Eurostat (2001,
2012). However, determining the cyclical use component (Uc) turned out to be more difficult. As
described in chapter 2.1, Uc is defined as the flow of materials that became waste, but which
were fed back to the economy and used for production and/or consumption purposes, thus
saving on the use of primary raw materials. This definition is useful to identify whether material
flows should be included in Uc or not, however, some aspects remain disputable (e.g. should
waste incineration for energy recovery be included in the Uc component?). Choices had to be
made to compile the indicator, which leaves room for discussion. An overview of the choices
made for calculating the indicator are presented in chapter 2.5 and 2.6, and a more extensive
discussion of these choices can be found in chapter 4. Note that the of this paper is to explore
the possibilities to compile a cyclical use rate indicator for the Netherlands, and that the choices
made are not cast in stone.
As a starting point to determine Uc, all waste streams used in the Dutch economy were
included3, then several corrections were made. First, the waste used in the ‘materials recovery
services sector’ was replaced by actual recycling statistics4, because part of the input (waste)
into ‘materials recovery services sector’ will be released again as waste. Secondly, the total
2 I.e. the cyclical use rate indicator, without any (country-specific) modifications (as is done by Kovanda (2014) for the
Czech Republic before any modification was made). 3 Data obtained from PSUT (Physical Supply and Use Tables) of the Monitor Material Flows (Delahaye and Zult, 2013). 4 Data from the waste accounts
Developing an Indicator for the Circular Economy 8
amount of waste used was corrected by subtracting the waste used in the ‘sectors’ exports,
accumulation, electricity companies and waste disposal services, because the materials (waste)
used for these economic activities were not recycled, but were exported, landfilled or
incinerated. Furthermore, for calculating the final indicator some other adjustments were made
based on findings gained during the process of developing this indicator. An overview of all
other adjustments is presented in chapter 2.6, ‘scope of material flows included’.
With the Uc and DMI components determined, the ‘basic’ cyclical use rate indicator was
calculated.
2.2.2 Modifications
Then several modifications were made to optimize the indicator specifically for the
Netherlands. Re-exportation in the Netherlands has a significant impact on import and export
figures. Generally speaking these imports were included in DMI, even though they were not
consumed or used in the Netherlands. Therefore, the first modification was to exclude re-
exports from DMI. 1) Correct DMI for re-exportation (imports excluding re-exports)
Moreover, part of the import consists of waste rather than products. Just as in the case of the
Czech Republic (Kovanda, 2014), a modification was made to correct total import for the import
of waste. So, for the second modification the import of waste was subtracted from DMI5. Some
secondary materials were not labelled waste in the international trade statistic and can
therefore not be subtracted from DMI. 2) Subtract the imports of waste (secondary materials) from DMI.
Finally, Eurostat proposes (Task Force on Material Flows, 2014) to distinguish four material
categories, biomass, metals, non-metallic minerals and fossil fuels. Therefore, this distinction
was also made in this paper. This distinction was made for all material streams of both
components of the cyclical use rate indicator, ‘DMI’ and ‘Uc’. This way, four cyclical use rate
indicators were calculated, one for each of the material categories. This provided insights into
the differences in circularity between these different material categories. 3) Distinguish four material categories.
2.2.3 The cyclical use rate indicator adjusted for the Netherlands
After the inclusion of the modifications as proposed in section 2.2.2 the cyclical use rate
indicator for the Netherlands looks somewhat different than for the Czech Republic. Therefore,
figure 1 requires an update that includes the changes made for the Netherlands. An adjusted
overview of all material flows required for calculating the indicator for the Netherlands is
presented in figure 2.
The cyclical use component (Uc) now equals the sum of the domestic cyclical use of materials
and the import of secondary resources. DMI is adjusted for re-exportation and the import of
secondary resources, and is now called DMIa.
5 For the Czech Republic the import of secondary materials was subtracted from DMI and then added to Uc. However,
for the Netherlands the import of waste was already included in the Uc component, so it is subtracted from DMI but not
added to Uc.

Developing an Indicator for the Circular Economy 9
Figure 2. Material balance of the economy depicting the components of the cyclical use rate
indicator, including the modifications made for the Netherlands.
2 . 3 B u i l d i n g a t i m e s e r i e s The ‘basic’ cyclical use rate indicator, adapted by the three modifications as presented in the
previous paragraph, finally lead to the cyclical use rate indicator for the Netherlands. The
indicator was constructed for the whole economy, and for the four material categories
separately, for the years 2008, 2010 and 2012. This way a short time series was constructed
which provided some insight in the developments over time.
2 . 4 D a t a s o u r c e s The input used to estimate the cyclical use rate indicator is derived from the Monitor Material
Flows (MFM) (Delahaye and Zult, 2013). The MFM consists of physical (in kg) supply and use
tables that are in accordance with concepts and definition of the monetary supply and use
tables of the national accounts. In turn figures from the Material Flow Accounts (MFA) and the
waste accounts are also part of the MFM. Instead of using the Monitor Material Flows the
amount of recycled waste taken from the waste statistics can also be used as data source. In
addition secondary materials that are not part of the waste statistics need to be added.
The estimation of the DMIa was straight forward: data on imports and domestic extraction (as
provided by the MFA) were used to determine DMI, which was then corrected for re-
exportation and imports of secondary resources to determine DMIa. With regard to estimating
the cyclical use of materials (Uc) the amount of secondary materials used in production
processes was needed. In the MFM these figures were taken from different data sources that
vary in quality. One important data source is the waste accounts based on the RWS
(Rijkswaterstaat) data. The total amount of recycled waste in the Netherlands was taken from
the waste accounts. In addition secondary materials that were not covered in the RWS data
were added. These secondary materials are often by products or left overs in the food industry.
Data on these secondary materials was, among others, taken from CBS statistics on livestock
manure and the association on animal feed.

Developing an Indicator for the Circular Economy 10
Although the Monitor Material Flows was the primary data source used to develop the cyclical
use rate indicator for the Netherlands in this paper, it is not necessarily required to develop the
cyclical use rate indicator. Instead, data could be retrieved from other sources like the waste
statistics, and the Material Flow Accounts.
2 . 5 A l l o c a t i o n o f w a s t e s t r e a m s t o m a t e r i a l c a t e g o r i e s In order to calculate the indicator separately for the four material categories as proposed by
Eurostat, all waste has to be allocated to one of these four material categories. Sixteen waste
(and recycling) categories are distinguished in the Material Flow Monitor. Some of these waste
categories can directly be allocated to one of the material categories. However, this allocation is
not straightforward for all of the waste categories. Mixed waste for instance may consist of
many different materials, and is more difficult to allocate.
Table 1 provides an overview of the 16 waste categories distinguished in the Material Flow
Monitor, and the choices made with respect to their allocation to one of the four material
categories. Although some waste categories may include different type of materials, all of them
are allocated to one material category, except chemical and healthcare waste. Chemical waste
may include fossil fuels and heavy metals, which makes it difficult to allocate. So, some waste
categories are difficult to allocate to a single material category. Therefore, to determine the
cyclical use rate for each of the material categories more precise, more detailed information is
required about these waste categories. So that a distinction of type of materials could be made
within each waste category.
Table 1. Waste categories allocated to material category6
Code? Waste category Allocated to Remarks
W01-05 Chemical and healthcare waste Not allocated ?Fossil?
W061 Metallic waste ferro Metals
W062 Metallic waste non-ferro Metals
W063 Metallic mixed waste Metals
W071 Glass waste Mineral
W072 Paper waste Biomass
W073 Rubber waste Biomass Synthetic?
W074 Plastic waste Fossil fuels Bioplastic?
W075 Wood waste Biomass
W076 Textile waste Biomass Synthetic?
W077 Other non-metallic waste Mineral Only mineral?
W08A Discarded equipment Metals
W09 Animal and vegetal waste Biomass
W10 Mixed waste Biomass Could be anything
W11 Common sludge Biomass Mineral?
W12-13 Mineral waste Mineral
6 Codes from waste statistics Eurostat, see: http://appsso.eurostat.ec.europa.eu/nui/show.do

Developing an Indicator for the Circular Economy 11
2 . 6 S c o p e o f m a t e r i a l f l o w s i n c l u d e d Figure 2 provides a clear overview of the different material flows that should be taken into
account for calculating the cyclical use rate indicator. However, the composition of some of
these material flows is not that clear. Problems arise especially when it comes to determining
the cyclical use of materials, both for the domestic cyclical use and the imported secondary
material flows. Although in theory there is a clear definition about what is regarded as cyclical
use, ‘the flow of materials that became waste, but which were fed back to the economy and
used for production and/or consumption purposes, thus saving on the use of primary raw
materials’, this is not as straightforward in practice. Further, problems were encountered with
respect to data availability, and the allocation of material streams to the four material
categories as proposed by Eurostat.
Table 2 presents an overview of the encountered problems, the decisions made and the impact
of these decisions on the cyclical use rate indicator for the Netherlands. The second column
shows an overview of those components that were problematic for calculating the cyclical use
rate, and the first column shows whether this component affects DMIa or Uc.. The third column
shows whether this component was included in the calculation of the indicator. An extensive
discussion of the decisions made can be found in the discussion section (chapter 4). The final
column indicates the magnitude of the effect on the total cyclical use rate if another decision
(shown in column 5) was made.
Table 2. Overview scope of materials
DMIa
or Uc
Component Included Comment Other
options
Impact
Uc
Manure Yes In terms of dry
product
Excluded Low
Wet product High
Uc
Renewable energy
(Wind/solar/etc.)
No Cannot be
measured in kg
Uc
Energy recovery by
waste incineration
(biotic and non-biotic)
No Not regarded as
cyclical use
Included High
DMIa
Sand and gravel used for
land raising purposes
No Not regarded as
cyclical use
Included High
Uc
Demolition waste used
for land raising purposes
No Excluded from Uc Included High
Uc
Chemical waste No Difficult to allocate
to one of the four
material categories
Included Low
Uc
Mixed waste Yes,
allocated
to
‘biomass’
Difficult to allocate,
however, largest
part is incinerated
for energy recovery
Exclude, or
allocate
differently
Low
Uc
The import of secondary
resources not classified
as waste
No Data problem (e.g.
by-products)
Included ?

Developing an Indicator for the Circular Economy 12
Developing an Indicator for the Circular Economy 13
3. Results
3 . 1 R e s u l t s f o r t h e N e t h e r l a n d s The interim results of the ‘basic’ indicator and the first modifications will be skipped in this
section, and only the final results of the time series will be presented here. In order to build this
time series, the cyclical use rate indicator was constructed for the four material categories
separately and for the economy as a whole, for the years 2008, 2010 and 2012.
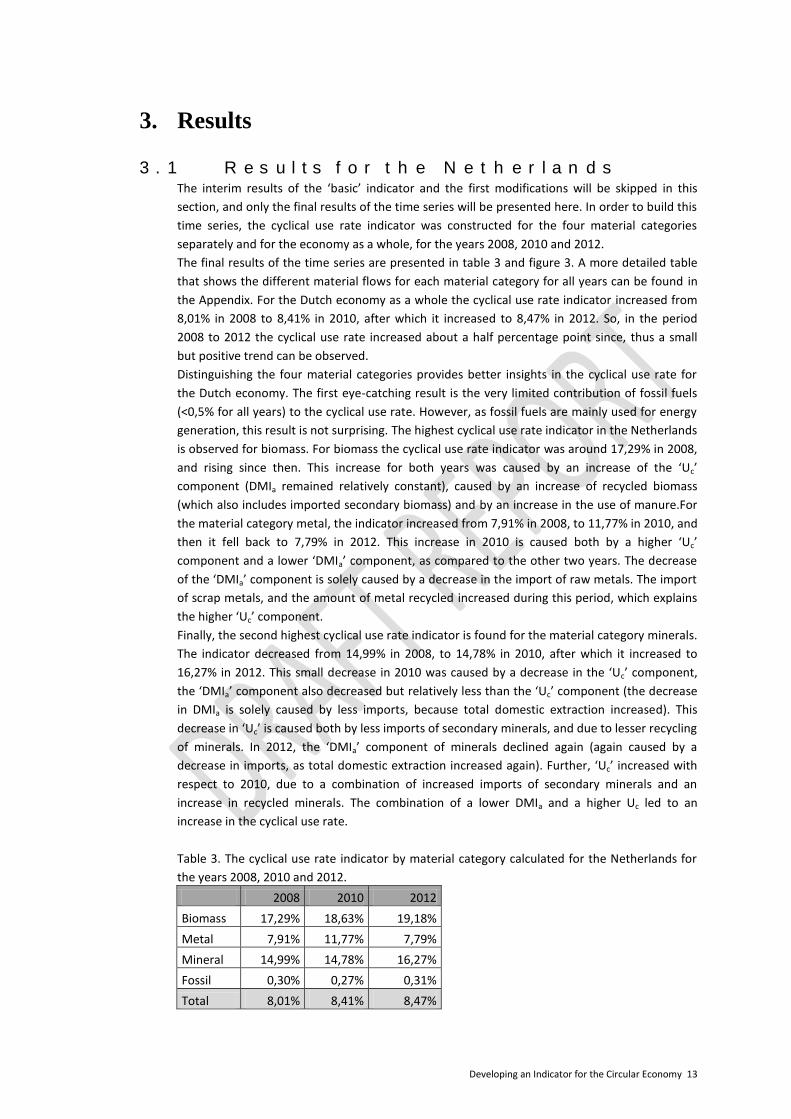
The final results of the time series are presented in table 3 and figure 3. A more detailed table
that shows the different material flows for each material category for all years can be found in
the Appendix. For the Dutch economy as a whole the cyclical use rate indicator increased from
8,01% in 2008 to 8,41% in 2010, after which it increased to 8,47% in 2012. So, in the period
2008 to 2012 the cyclical use rate increased about a half percentage point since, thus a small
but positive trend can be observed.
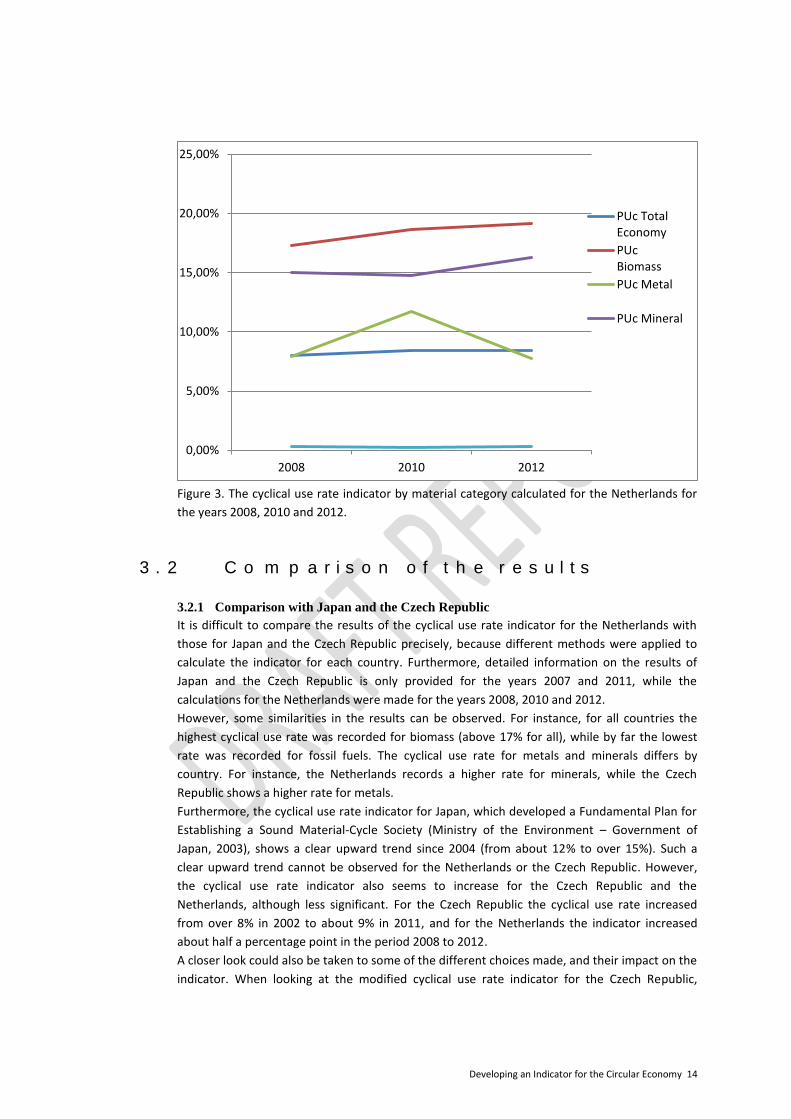
Distinguishing the four material categories provides better insights in the cyclical use rate for
the Dutch economy. The first eye-catching result is the very limited contribution of fossil fuels
(<0,5% for all years) to the cyclical use rate. However, as fossil fuels are mainly used for energy
generation, this result is not surprising. The highest cyclical use rate indicator in the Netherlands
is observed for biomass. For biomass the cyclical use rate indicator was around 17,29% in 2008,
and rising since then. This increase for both years was caused by an increase of the ‘Uc’
component (DMIa remained relatively constant), caused by an increase of recycled biomass
(which also includes imported secondary biomass) and by an increase in the use of manure.For
the material category metal, the indicator increased from 7,91% in 2008, to 11,77% in 2010, and
then it fell back to 7,79% in 2012. This increase in 2010 is caused both by a higher ‘Uc’
component and a lower ‘DMIa’ component, as compared to the other two years. The decrease
of the ‘DMIa’ component is solely caused by a decrease in the import of raw metals. The import
of scrap metals, and the amount of metal recycled increased during this period, which explains
the higher ‘Uc’ component.
Finally, the second highest cyclical use rate indicator is found for the material category minerals.
The indicator decreased from 14,99% in 2008, to 14,78% in 2010, after which it increased to
16,27% in 2012. This small decrease in 2010 was caused by a decrease in the ‘Uc’ component,
the ‘DMIa’ component also decreased but relatively less than the ‘Uc’ component (the decrease
in DMIa is solely caused by less imports, because total domestic extraction increased). This
decrease in ‘Uc’ is caused both by less imports of secondary minerals, and due to lesser recycling
of minerals. In 2012, the ‘DMIa’ component of minerals declined again (again caused by a
decrease in imports, as total domestic extraction increased again). Further, ‘Uc’ increased with
respect to 2010, due to a combination of increased imports of secondary minerals and an
increase in recycled minerals. The combination of a lower DMIa and a higher Uc led to an
increase in the cyclical use rate.
Table 3. The cyclical use rate indicator by material category calculated for the Netherlands for
the years 2008, 2010 and 2012.
2008 2010 2012
Biomass 17,29% 18,63% 19,18%
Metal 7,91% 11,77% 7,79%
Mineral 14,99% 14,78% 16,27%
Fossil 0,30% 0,27% 0,31%
Total 8,01% 8,41% 8,47%
Developing an Indicator for the Circular Economy 14
Figure 3. The cyclical use rate indicator by material category calculated for the Netherlands for
the years 2008, 2010 and 2012.
3 . 2 C o m p a r i s o n o f t h e r e s u l t s
3.2.1 Comparison with Japan and the Czech Republic
It is difficult to compare the results of the cyclical use rate indicator for the Netherlands with
those for Japan and the Czech Republic precisely, because different methods were applied to
calculate the indicator for each country. Furthermore, detailed information on the results of
Japan and the Czech Republic is only provided for the years 2007 and 2011, while the
calculations for the Netherlands were made for the years 2008, 2010 and 2012.
However, some similarities in the results can be observed. For instance, for all countries the
highest cyclical use rate was recorded for biomass (above 17% for all), while by far the lowest
rate was recorded for fossil fuels. The cyclical use rate for metals and minerals differs by
country. For instance, the Netherlands records a higher rate for minerals, while the Czech
Republic shows a higher rate for metals.
Furthermore, the cyclical use rate indicator for Japan, which developed a Fundamental Plan for
Establishing a Sound Material-Cycle Society (Ministry of the Environment – Government of
Japan, 2003), shows a clear upward trend since 2004 (from about 12% to over 15%). Such a
clear upward trend cannot be observed for the Netherlands or the Czech Republic. However,
the cyclical use rate indicator also seems to increase for the Czech Republic and the
Netherlands, although less significant. For the Czech Republic the cyclical use rate increased
from over 8% in 2002 to about 9% in 2011, and for the Netherlands the indicator increased
about half a percentage point in the period 2008 to 2012.
A closer look could also be taken to some of the different choices made, and their impact on the
indicator. When looking at the modified cyclical use rate indicator for the Czech Republic,
0,00%
5,00%
10,00%
15,00%
20,00%
25,00%
2008 2010 2012
PUc TotalEconomy
PUcBiomass
PUc Metal
PUc Mineral

Developing an Indicator for the Circular Economy 15
biomass has the highest value (24.54%), and fossil fuels has by far the lowest value (1.19%)7.
Firstly, this high biomass value is largely caused by the inclusion of manure in the cyclical use
component. When excluding manure, the biomass value would fall to 2.76%. A similar scenario
holds for the Netherlands, when including manure as wet product the indicator for biomass
increases from about 17% to over 27%8. Therefore, manure was included in terms of dry
product for the Netherlands.
Secondly, the cyclical use rate indicator for fossil fuels has a low value (<1,27%) for all three
countries. However, the second modification made by the Czech Republic has a significant
impact on the indicator with respect to the reuse of fossil fuels. The survey of domestically
produced secondary materials held in the Czech Republic increases the indicator for fossil fuels
to 13,58%. The explanation given by Kovanda (2014) is that more than half of the domestically
produced secondary materials consists of wastes from thermal processes such as fly ash and
slag from the combustion of fossil fuels, which are being used for production of cement,
concrete and other building materials and products. Fly ash and slag might be waste per se, but
never actually enter waste statistics and are reported separately under the heading of
secondary materials. In the Netherlands, this fly ash and slag is already included in the waste
statistics, but it has a much smaller effect on the indicator than for the Czech Republic.
3.2.2 Comparing the cyclical use rate indicator and the recycling rate
The Netherlands recycled about 81% of its total waste in 20129. This ratio is much higher than
the outcome of the circular use rate indicator (<9%), which clarifies the difference between the
two indicators as discussed in the introduction. Although increased recycling efforts positively
affect the circular use rate, recycling efforts alone are not sufficient for a fully circular economy.
7 The modified cyclical use rate, calculated for the Czech Republic for the year 2011 (Kovanda, 2014). 8 Calculated for the year 2008 9 Source: http://statline.cbs.nl/Statweb/publication/?VW=T&DM=SLNL&PA=83128NED&D1=0&D2=3-4&D3=10-
11&HD=150825-1356&HDR=T,G1&STB=G2 Total recycling as a share of total processing of producers: 53056 / 65327 = 81,22%.

Developing an Indicator for the Circular Economy 16
4. Discussion
While developing the cyclical use rate indicator for the Netherlands, several issues were
encountered. Especially the question what should and what should not be included in the Uc
component of the cyclical use rate is highly debatable. Different choices made with respect to
the determination of the Uc component may greatly affect the outcome of the cyclical use rate
indicator. The main issues encountered during this research are discussed in this chapter.
Furthermore, some methodological choices and options are discussed.
Manure used as fertilizer
Manure is a waste stream which can replace industrial fertilizers in agriculture, therefore it
could be considered as part of the circular economy. The material streams identified to
calculate the cyclical use rate are measured in kg. Therefore, whether taking into account wet
manure (about 17.252 mln kg) or dry manure (1.878 mln kg)10
, significantly affects the outcome
of the indicator. The same result was found for the Czech Republic (Kovanda, 2014, p82). To
compare these numbers, the total amount of industrial fertilizer (which can be replaced by
using manure) used in the Netherlands is about 3.452 mln kg11
. Another point one can make is
that, with regard to the replacement of manure by industrial fertilizer, one should not consider
weight but instead the phosphorous and nitrogen content. So, it probably makes more sense to
include dry manure rather than wet manure but it would even be better to look at the active
substances that are being replaced.
Energy generation
The use of renewable energy is also considered part of the circular economy (Ellen MacArthur
Foundation, 2014). However, some types of renewable energy such as wind and solar energy
cannot be expressed in physical terms, and are not included in the cyclical use rate (Uc).
However, increasing the generation of these types of renewable energy will lead to a reduction
in the use of primary resources such as oil, coal and gas. So, solar and wind energy have a
decreasing effect on DMI, no effect on Uc, thus positively influences the cyclical use rate to
some extent, even though they cannot be included in the cyclical use rate indicator.
Furthermore, waste incineration for energy recovery may also be part of the circular economy,
although, with respect to cascading the use of materials, it is regarded as the final, least good
option. Waste should only be incinerated for energy recovery when no other options remain,
such as recycling (Ellen MacArthur Foundation, 2014). However, energy recovery from waste
streams is preferred over using primary resources, such as energy carriers as oil, coal and gas,
because it reduces the input of raw materials. However, it is debatable whether waste
incineration for energy recovery should be included in Uc, the cyclical use of materials. Kovanda
(2014) decided not to include it for the Czech Republic.
One could argue to only include biotic waste incineration for energy recovery because biotic
waste is renewable, and the use of renewable resources is considered part of the circular
economy. However, in line with this argument also (non-waste) biomass used for energy
recovery should be included. In this case basically all biomass used in the economy could be
included in the cyclical indicator because it is renewable, but this is not desirable for this
indicator. Furthermore, biotic waste incineration for energy recovery reduces DMI because it
replaces fossil fuels, just as solar and wind energy. However, in contrast to wind and solar
energy biotic waste can be expressed in physical terms and can be included in Uc. Therefore,
10 Data from the year 2010 11 In total 8.164 mln kg is used, from which 4.712 mln kg is export or re-exportation.

Developing an Indicator for the Circular Economy 17
biotic waste incineration for energy recovery results in a lower DMI and a higher Uc component,
while wind and solar energy only result in a lower DMI component. So, if biotic waste
incineration for energy recovery is included in the cyclical use rate indicator, it has a larger
impact than the cleaner generation of wind and solar energy.
In this research, energy recovery from (biotic) waste incineration is excluded from the cyclical
use rate indicator, so it is not included in ‘DMI’ or in ‘Uc’. However, this waste stream is used for
energy generation, which implies that less ‘DMI’ (e.g. fossil fuels) is required to generate the
same amount of energy. So, even if energy recovery from incineration is excluded from ‘Uc’, it
still has a positive impact on the cyclical use rate indicator (just as solar and wind energy).
So, for calculating the cyclical use rate indicator it is important to make a clear distinction
between reuse of materials (included) and renewable resources (excluded), although both are
considered part of the circular economy. This energy generation example also shows the need
for a set of indicators to cover the circular economy as a whole, rather than a single indicator.
So, in this research energy recovery from (biotic) waste incineration is excluded from the
cyclical use rate indicator. But to cover this gap, supplementary information on energy
generation is available at the energy accounts.
Actual material flows, or material flows expressed in Raw Material Equivalents?
One of the issues that has not been addressed in this paper so far, but which received
significant attention during this research, is whether the actual material flows should be
converted into their raw material equivalents (RMEs), i.e. the amount of raw materials that are
needed to produce the good in question. The reason for this is that imports (a part of DMI)
include not only raw materials, but also semi-manufactured products and final products, while
domestic extraction (which includes domestically extracted raw materials and harvested
biomass) only includes raw materials. However, as is shown in a report by Eurostat (2014), there
can be large differences between the actual total weight of goods, and the weight of the same
goods expressed in raw material equivalents. These imported goods may have been processed,
and the total weight of raw material extraction required to produce manufactured goods is
higher than the weight of the goods themselves (Eurostat, 2014). So, a discrepancy exists
between the domestic extraction of material resources, which is measured in tonnes of gross
ore or gross harvest, and imports and exports that are measured in the weight of goods crossing
the border.
A solution for this could be to convert the traded goods into their raw material equivalents. By
definition, DMI comprises the amount of domestically extracted raw materials, harvested
biomass and total imports (imports of raw materials, products and waste). By converting the
actual imports into their RMEs, the so called Raw Material Input (RMI) is calculated. So, for
comparison purposes it seems that expressing both imports and domestically extracted
resources in equal terms, RMEs, makes most sense.
Further, in case of replacing DMI with RMI for calculating the cyclical use rate indicator, also the
secondary materials in the cyclical use component (Uc) should be converted into RMEs. If this
cannot be achieved, it is questionable whether it makes sense to convert the other streams to
RMEs. In this research, an attempt was made to convert all streams into their RMEs. For the
DMI component this was possible, although data was only available for the year 2010. However,
it turned out to be more difficult to convert the material streams of the Uc component into
RMEs. So no further results of this modification have been presented in this paper. However, it
might be an interesting option for further research.
Developing an Indicator for the Circular Economy 18
DMI versus Uc, comparing apples and oranges
The previous discussion point emphasized the need for RMEs, because material flows of DMI
and imports cannot be compared. It is also mentioned that the secondary materials in the
cyclical use component (Uc) should be converted into RMEs. This is required because it has
implications for the outcome of the cyclical use rate indicator, which will be shown by the
following example.
If the Netherlands imports 100kg iron ore, it can produce 20kg steel12
. The remaining 80kg
becomes a by-product of the production process, it is converted into CO2 or other gases, steam,
or slag. Some, but not all of these by-products can be reused. This steel can be used for a
variety of products, but eventually it will turn into waste. Now, recycling all steel (20kg) with
respect to material input (100kg) would imply that the cyclical use rate can impossibly reach the
100%. However, if the Netherlands decides to import steel instead of iron ore, then its material
input is only 20kg. In case all steel (20kg) is recycled, a cyclical use rate of 100% could be
reached.
This example shows that the structure of the economy is of crucial importance to the outcome
of the cyclical use indicator. This makes international comparison difficult. The cyclical use rate
will be relatively low for countries that import raw materials or extract them domestically, as
compared to countries that import semi-finished or finished goods. Therefore, comparing the
cyclical use of steel with respect to the raw material input of iron ore, is like comparing apples
and oranges. Converting all material flows, especially the Uc flow, into RMEs could solve this
problem.
Input indicator versus consumption indicator
Another point for discussion is whether the cyclical use rate should be calculated as an input
indicator (DMI) or as a consumption indicator (DMC, Domestic Material Consumption). The first
includes all materials used in the Dutch economy, i.e. total imports plus domestic extraction,
regardless of where the materials are actually consumed. The latter corrects this input indicator
by subtracting total exports, so it includes only those materials that are actually consumed in
the Netherlands.
The same issue holds when using material flows expressed in RMEs instead of actual material
flows. In this case, both exports and imports should be converted into RMEs. This way, DMI
becomes RMI (Raw Material Input), and DMC become RMC (Raw Material Consumption).
Both variants, the input- and consumption indicator, could be considered for calculating the
cyclical use rate indicator. However, a consumption indicator seems to fit best for international
implementation, because double counting takes place when the input indicator is used. For
example, part of Germany’s imports are the Netherlands’ exports. If both imports and exports
are included in the indicator, the same resources are counted twice.
Difficult to distinguish secondary materials in the international trade data.
Import of secondary materials which are clearly classified as (the reuse of) waste are taken into
account. However, it is difficult to distinguish imports of non-waste secondary materials in the
international trade data from ‘’regular’’ products. For instance, when a by-product of a
manufacturing process in Germany is exported to the Netherlands, it is regarded as an input for
the Dutch economy in the MFA. Such input is not labelled ‘secondary’, and therefore will be
added to DMI rather than the cyclical use component. Therefore imported secondary materials
will only be taken partly into account in the Uc. There is no easy solution for this mismatch.
12 The numbers presented are not realistic, but are only used to give an example.
Developing an Indicator for the Circular Economy 19
Sand and gravel use for construction purposes excluded
The domestic extraction of natural resources in the Netherlands (366 bn kg in 2011), consists for
90% of sand and gravel, which is used in infrastructural projects to raise roads and land for the
construction of buildings or to strengthen dikes and coastal defences (Environmental Accounts
of the Netherlands, 2012). In the period 2009-2011, 61% of this sand and gravel was needed for
the expansion of the port of Rotterdam, the so called ‘Tweede Maasvlakte’. The remainder is
used in the production of concrete and cement. The sand and gravel used to raise roads and
land for construction is left out of the DMI component. This is done because the use of sand and
gravel for construction purposes (i.e. land raising) is typically Dutch, and because of the large
volumes used it may greatly affect the outcome of the cyclical use rate indicator for the
Netherlands. Including sand and gravel use for this purpose would make international
comparison of the indicator more difficult, because it would show a distorted image.
Reuse of demolition waste for land raising purposes excluded
The previous paragraph explained why sand and gravel use for construction purposes (i.e.
raising roads and lands for the construction of buildings or to strengthen dikes and coastal
defences) was excluded for the Netherlands. However, if raw materials used for this purpose
are excluded from the indicator, then it makes no sense to include the use of secondary
materials for this same purpose. So, in case sand and gravel use for construction purposes (land
raising) are excluded from DMI, also the cyclical use streams used for this same purpose should
be excluded from the Uc component.
In practice, for the Netherlands this means that the reuse of demolition waste (e.g. from
buildings) used for land raising purposes should be excluded from the Uc component. This is
done by excluding the reuse of mineral waste for the construction sectors.
Chemical waste excluded
Chemical waste could not be assigned to one of the four material categories as proposed by
Eurostat. Therefore, it was not included in the cyclical use component (Uc) of the indicator. So, if
chemical waste would have been included the cyclical use rate indicator for the Dutch economy
would have been somewhat higher. It would be optional to create a fifth material category
‘remaining’, to include all waste streams which cannot clearly be assigned to one of the four
material categories.
Although only chemical waste was not assigned to one of the material categories, there were
other waste categories like mixed waste, other non-metallic waste, rubber waste and plastic
waste, for which the allocation to a material category was not that straightforward. This
allocation of waste to material categories requires more attention in order to further improve
the indicator.
Robustness of the cyclical use rate indicator
One final point that has to be made is that the outcome of the cyclical use rate indicator
fluctuates quite strongly for metal. From about 8% in 2008, it increases about 50% to almost
12% in 2010 and then back to about 8% in 2012. This raise questions about the robustness of
the cyclical use rate indicator. There is no problem if this fluctuation represents an actual
change in the economy, or maybe a special event, for instance caused by changes in policy.
However, if such large fluctuation is caused by a lack of reliable data, then this could be
problematic for the reliability of the indicator. Extending the timeline of the cyclical use rate
Developing an Indicator for the Circular Economy 20
indicator by calculating it also for the year 2000 and onwards could provide more information
about the robustness of the indicator.
Developing an Indicator for the Circular Economy 21
5. Conclusion
The cyclical use rate indicator is developed in order to tell something about the circular
economy. However, the circular economy, as described by the Ellen MacArthur Foundation
(2014), is a broad and comprehensive concept and it is hard, if not impossible, to measure it by
a single indicator. One issue faced in this research that clearly shows this, is energy recovery
from incineration. Renewable energy such as wind and solar energy is regarded as circular
because it is renewable, however it cannot be measured in kg because there is no physical flow.
Therefore, generating solar and wind energy is not included in the Uc component, while waste
incineration for energy recovery should be included in the Uc component if the definition of Uc
(Chapter 2.2) is applied. The result would be that energy generated from waste incineration is
regarded more circular than solar and wind energy. Therefore, it might be useful to develop
separate indicators for reuse (cyclical use rate) and renewables13
(e.g. renewable energy
indicator)14
, which both cover a part of the circular economy. A set of indicators would be
required to cover all aspects of the circular economy, as was also proposed by Geng et al.
(2012).
This research shows that the cyclical use rate indicator can be calculated for the Netherlands as
well, although some modifications had to be made to improve the indicator, and to adjust it for
the specific case of the Netherlands. First of all, DMI was corrected for re-exportation, and
secondly, the import of waste was subtracted from DMI and included in the Uc component. It is
likely that such country-specific modifications also have to be made for other countries.
The main issue encountered was the indistinctness about what should be included in the Uc
component. In order to develop an internationally comparable indicator it should be clearly
specified what material flows should be included, because different choices with respect to the
cyclical use component may greatly affect the outcomes.
Further, several methodological and data issues were encountered and discussed. The results of
the cyclical use rate indicator of the Netherlands were similar to those of the Czech Republic
and Japan. The highest cyclical use rate was recorded for biomass, and the lowest for fossil
fuels. The cyclical use rates for metal and minerals differed by country. A clear upward trend in
the cyclical use rate could only be observed for Japan. However, also the cyclical use rate for the
Netherlands and the Czech Republic increased slowly over time.
Although the cyclical use rate indicator was calculated successfully for the Netherlands, there
are still some issues open for discussion. Like whether to use an input- or consumption
indicator, and whether conversion of material streams into their RMEs would improve the
indicator. Furthermore, the outlier of metal for the Netherlands in 2010, raise questions about
the robustness of the cyclical use rate indicator. Extending the timeline of the cyclical use rate
indicator by calculating it also for the year 2000 and onwards could provide more information
about the robustness of the indicator.
13 A similar problem may for instance occur for plastics made from fossil fuels, and bio plastics which are regarded more
circular according to the Ellen MacArthur Foundation (2014). 14 Could also be an existing indicator
Developing an Indicator for the Circular Economy 22
6. References
Delahaye, R. & Zult. D. (2013). Monitor Materiaalstromen, Den Haag/Heerlen. Ellen MacArthur Foundation. (2012). Towards the Circular Economy, Economic and business rationale for an accelerated transition. Ellen MacArthur Foundation. (2013). Towards the Circular Economy, Opportunities for the Consumer Goods Sector.
Ellen MacArthur Foundation. (2014). Towards the Circular Economy, Accelerating the scale-up
across global supply chains. Prepared in collaboration with the World Economic Forum and
McKinsey & Company.
Eurostat. (2001). Economy-wide material flow accounts and derived indicators: a
methodological guide. Luxembourg
Eurostat. (2012) Economy-wide material flow accounts: compilation guide 2012. Luxembourg
Eurostat (2014). Material Flow Accounts – flow in raw material equivalents.
http://ec.europa.eu/eurostat/statistics-explained/index.php/Material_flow_accounts_-
_flows_in_raw_material_equivalents#Comparison_between_actual_material_flows_and_mater
ial_flows_in_RME
Geng, Y., Fu, J., Sarkis, J., & Xue, B. (2012). Towards a national circular economy indicator system
in China: an evaluation and critical analysis. Journal of Cleaner Production, 23(1), 216-224.
Kovanda, J. (2014). Incorporation of recycling flows into economy-wide material flow accounting
and analysis: A case study for the Czech Republic. Resources, Conservation and Recycling, 92,
78-84.
Ministry of the Environment – Government of Japan (2003). Establishing a sound material-cycle
society: milestone toward a sound material-cycle society through changes in business and life
styles. Tokyo.
Statistics Netherlands. (2013). Environmental Accounts of the Netherlands 2012. The Hague.
Related to material flow accounts and RMEs:
http://ec.europa.eu/eurostat/statistics-
explained/extensions/EurostatPDFGenerator/getfile.php?file=212.108.16.124_1434466795_1.p
df
http://ec.europa.eu/eurostat/documents/1798247/6191533/3-Economy-wide-material-flow-
accounts...-A-methodological-guide-2000-edition.pdf/9dfae42d-0831-4522-9fe5-571785f8fecf
Task Force on Material Flows (2014), Meeting 7-8 November 2014. Minutes (final, 19 December
2014).
Developing an Indicator for the Circular Economy 23
Appendix
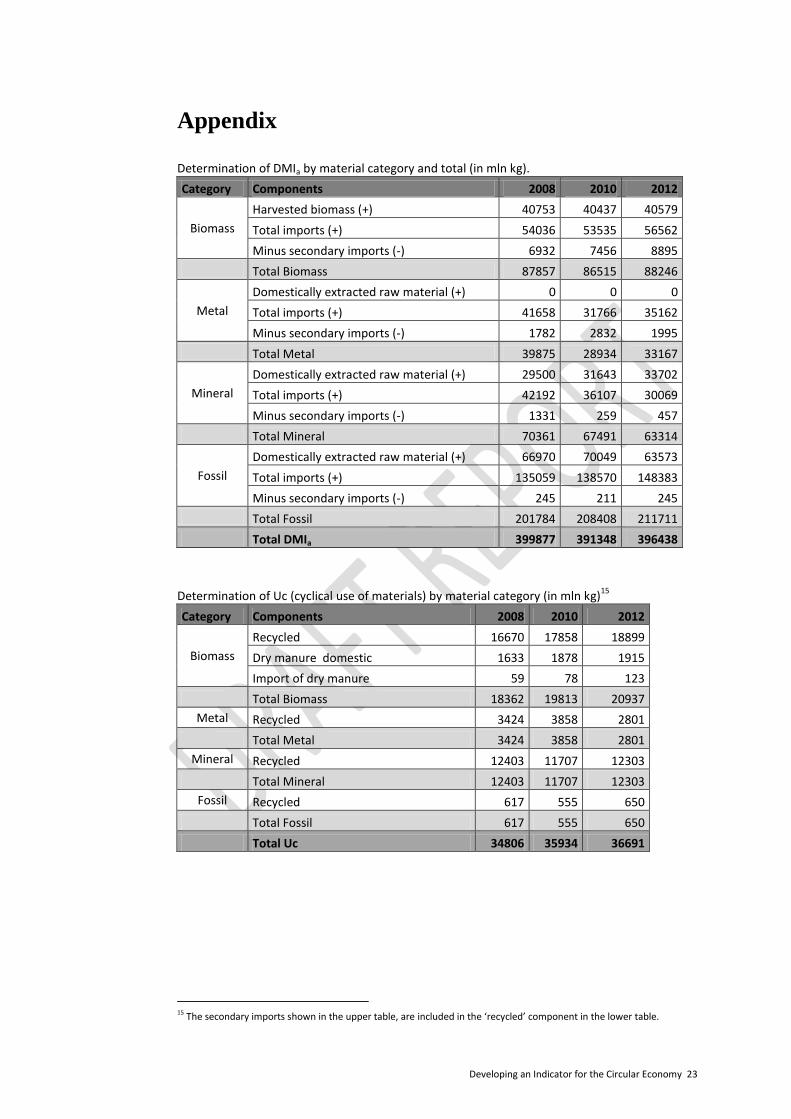
Determination of DMIa by material category and total (in mln kg).
Category Components 2008 2010 2012
Biomass
Harvested biomass (+) 40753 40437 40579
Total imports (+) 54036 53535 56562
Minus secondary imports (-) 6932 7456 8895
Total Biomass 87857 86515 88246
Metal
Domestically extracted raw material (+) 0 0 0
Total imports (+) 41658 31766 35162
Minus secondary imports (-) 1782 2832 1995
Total Metal 39875 28934 33167
Mineral
Domestically extracted raw material (+) 29500 31643 33702
Total imports (+) 42192 36107 30069
Minus secondary imports (-) 1331 259 457
Total Mineral 70361 67491 63314
Fossil
Domestically extracted raw material (+) 66970 70049 63573
Total imports (+) 135059 138570 148383
Minus secondary imports (-) 245 211 245
Total Fossil 201784 208408 211711
Total DMIa 399877 391348 396438
Determination of Uc (cyclical use of materials) by material category (in mln kg)15
Category Components 2008 2010 2012
Biomass
Recycled 16670 17858 18899
Dry manure domestic 1633 1878 1915
Import of dry manure 59 78 123
Total Biomass 18362 19813 20937
Metal Recycled 3424 3858 2801
Total Metal 3424 3858 2801
Mineral Recycled 12403 11707 12303
Total Mineral 12403 11707 12303
Fossil Recycled 617 555 650
Total Fossil 617 555 650
Total Uc 34806 35934 36691
15 The secondary imports shown in the upper table, are included in the ‘recycled’ component in the lower table.
Recommended