Sustainability 2010, 2, 2044-2069; doi:10.3390/su2072044
sustainability ISSN 2071-1050
www.mdpi.com/journal/sustainability
Article
Developing an Ecosystem Services Online Decision Support Tool
to Assess the Impacts of Climate Change and Urban Growth in
the Santa Cruz Watershed; Where We Live, Work, and Play
Laura Norman 1,
*, Nita Tallent-Halsell 2, William Labiosa
1, Matt Weber
3, Amy McCoy
4,
Katie Hirschboeck 5, James Callegary
1, Charles van Riper III
1 and Floyd Gray
1
1 U.S. Geological Survey, Western Geographic Science Center, 520 N. Park Avenue, Suite #102K,
Tucson, AZ 85719-5035, USA; E-Mails: [email protected] (W.L.); [email protected] (J.C.);
[email protected] (C.R.); [email protected] (F.G.) 2 Environmental Sciences Division, Landscape Ecology Branch, U.S. Environmental Protection
Agency, 944 East Harmon Ave., Las Vegas, NV 89119, USA;
E-Mail: [email protected] 3 Sustainabile Technology Division, U.S. Environmental Protection Agency, 200 SW 35th Street,
Corvallis, OR 97333, USA; E-Mail: [email protected] 4 Office of Arid Lands Studies, The University of Arizona, 1955 East Sixth St., Tucson, AZ 85741,
USA; E-Mail: [email protected] 5 Laboratory of Tree-Ring Research, The University of Arizona, 208/West Stadium, Tucson,
AZ 85719, USA; E-Mail: [email protected]
* Author to whom correspondence should be addressed; E-Mail: [email protected];
Tel.: +1-520-670-5510; Fax: +1-520-670-5113.
Received: 2 June 2010; in revised form: 25 June 2010 / Accepted: 29 June 2010 /
Published: 9 July 2010
Abstract: Using respective strengths of the biological, physical, and social sciences, we
are developing an online decision support tool, the Santa Cruz Watershed Ecosystem
Portfolio Model (SCWEPM), to help promote the use of information relevant to water
allocation and land management in a binational watershed along the U.S.-Mexico border.
The SCWEPM will include an ES valuation system within a suite of linked regional
driver-response models and will use a multicriteria scenario-evaluation framework that
builds on GIS analysis and spatially-explicit models that characterize important ecological,
economic, and societal endpoints and consequences that are sensitive to climate patterns,
regional water budgets, and regional LULC change in the SCW.
OPEN ACCESS
Sustainability 2010, 2
2045
Keywords: arid lands; climate change; decision support tool; drought; drylands; ecosystem
portfolio model; ecosystem services; environmental justice; socio-ecologic vulnerability
1. Introduction
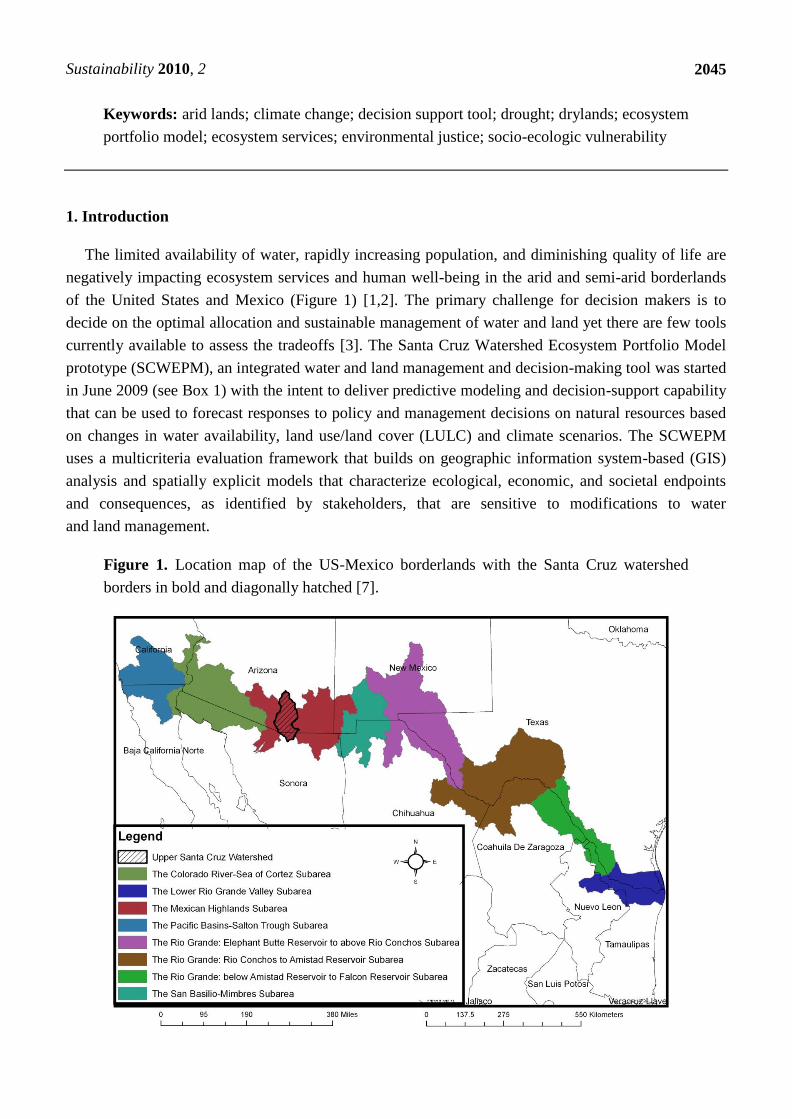
The limited availability of water, rapidly increasing population, and diminishing quality of life are
negatively impacting ecosystem services and human well-being in the arid and semi-arid borderlands
of the United States and Mexico (Figure 1) [1,2]. The primary challenge for decision makers is to
decide on the optimal allocation and sustainable management of water and land yet there are few tools
currently available to assess the tradeoffs [3]. The Santa Cruz Watershed Ecosystem Portfolio Model
prototype (SCWEPM), an integrated water and land management and decision-making tool was started
in June 2009 (see Box 1) with the intent to deliver predictive modeling and decision-support capability
that can be used to forecast responses to policy and management decisions on natural resources based
on changes in water availability, land use/land cover (LULC) and climate scenarios. The SCWEPM
uses a multicriteria evaluation framework that builds on geographic information system-based (GIS)
analysis and spatially explicit models that characterize ecological, economic, and societal endpoints
and consequences, as identified by stakeholders, that are sensitive to modifications to water
and land management.
Figure 1. Location map of the US-Mexico borderlands with the Santa Cruz watershed
borders in bold and diagonally hatched [7].

Sustainability 2010, 2
2046
Ultimately the SCWEPM will map changes in ecosystem services resulting from alternative water
availability and land use scenarios. Since the 1960s the concept of ecosystem services (ES; i.e., the
goods and benefits people obtain from ecosystems for which people can express preferences that
allow tradeoffs to be evaluated [4,5]) has been gaining momentum as a framework to integrate
ecological function and economics in a manner useful for evaluating tradeoffs in natural resource
management [1-6]. The goal of using ES is to balance competing interests when deciding how best to
manage and allocate natural resources [4,6]. The SCWEPM will enable the consideration of which
and in what ways ecosystem services will be impacted based on a suite of water availability and
land use scenarios.
The intent of this paper is to describe the SCWEPM. In the following sections we will (1) give a
brief description of the study area, (2) describe the SCWEPM; (3) identify the ES, alternative future
scenarios, and linkages with human well-being that will be considered in the first phase of the
prototype; (4) describe our approach and (5) summarize the challenges and opportunities for improving
the science and practical applications of the SCWEPM.
2. Study Area
The Santa Cruz watershed (SCW), located in Southern Arizona and Northern Sonora (Figure 2), is
approximately 910,300 ha (2,249,390 acres) and ranges in elevation from 668 to 2,846 m (2,192
to 9,337 feet (ft); average 1,240 m or 4,068 ft). The Santa Cruz River is an ephemeral tributary that
drains into the Gila River, which is a branch of the Colorado River [8]. The headwaters of the Santa
Cruz River are located in the San Rafael Valley of southeastern Arizona. The river flows southward
into Sonora, Mexico, turns westward and reenters the United States just to the east of Nogales, Arizona.
It then continues northward to converge with the Gila River. The administration and ownership of the
SCW is divided into four governing Nations: the Tohono O‘odham Nation, Pascua Yaqui Tribe,
Mexico, and United States.
Box 1. In a meeting held in June, 2009, an interdisciplinary, multi-agency team developed a
research question from which to focus our integrated intentions:
Question: What are the ecosystem services (ES) that contribute to physical, biological, and social
qualities and resilience of the Santa Cruz Watershed and how can these be interlinked to support
decision-making and management objectives,
-to create a support tool for management of urban development and respond to climate change,
-to assess and value the ES of the watershed and landscape,
-to visualize impacts of a range of scenarios on people‘s quality of life,
-to operationalize the decision-making process,
-to define transparent indicators of intangible issues, like sustainability and
environmental justices,
-that recognizes the complexity and unpredictability of the systems, and
-that considers tradeoffs relating to competing perspectives of stakeholders?
Sustainability 2010, 2
2047
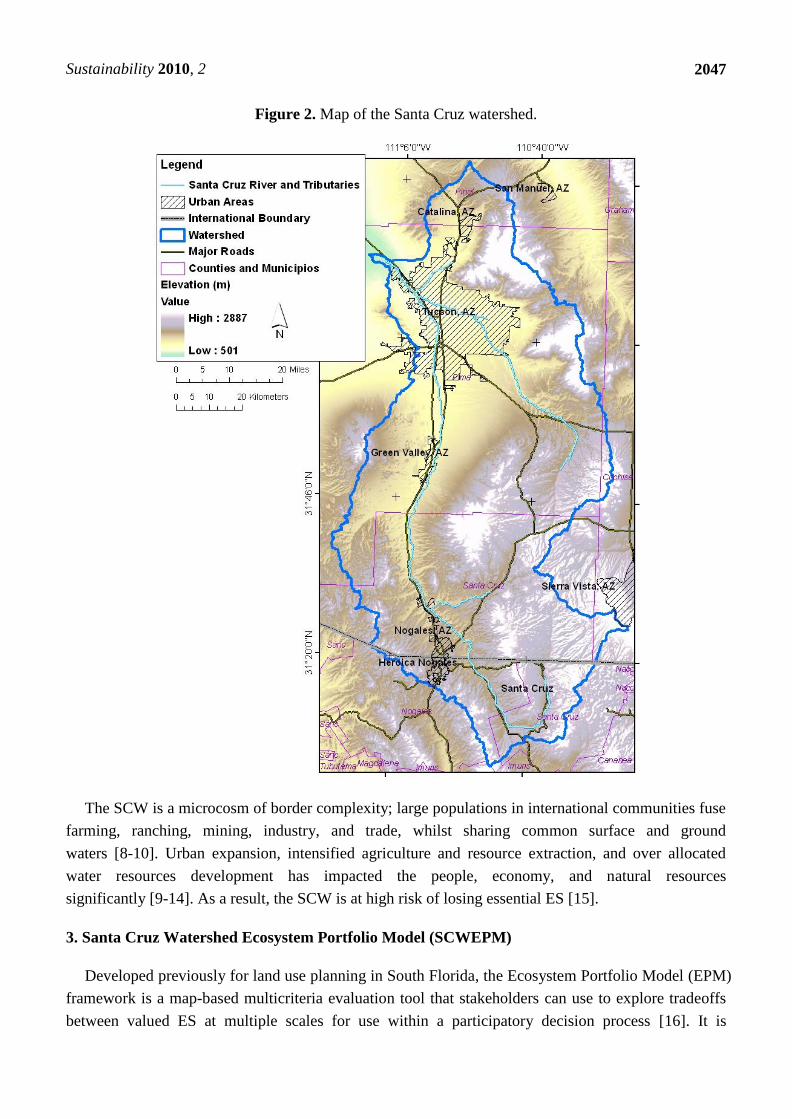
Figure 2. Map of the Santa Cruz watershed.
The SCW is a microcosm of border complexity; large populations in international communities fuse
farming, ranching, mining, industry, and trade, whilst sharing common surface and ground
waters [8-10]. Urban expansion, intensified agriculture and resource extraction, and over allocated
water resources development has impacted the people, economy, and natural resources
significantly [9-14]. As a result, the SCW is at high risk of losing essential ES [15].
3. Santa Cruz Watershed Ecosystem Portfolio Model (SCWEPM)
Developed previously for land use planning in South Florida, the Ecosystem Portfolio Model (EPM)
framework is a map-based multicriteria evaluation tool that stakeholders can use to explore tradeoffs
between valued ES at multiple scales for use within a participatory decision process [16]. It is
Sustainability 2010, 2
2048
integrated into a regional water management and land-use planning Web tool that models changes in
ES under various scenarios for important drivers including climate change, land cover change,
demographic changes, and regional economic changes [16]. For terrestrial ecosystems, land-cover
change is one of the most important direct drivers of changes in ES [17]. More specifically, the
fragmentation of habitat from expanding low-density development across landscapes appears to be a
major driver of terrestrial species decline and the impairment of terrestrial ecosystem integrity, in some
cases causing irreversible impairment from a land-use planning perspective [18-20]. The EPM is an
attempt to integrate important aspects of the coupled natural-system/human-system view from a
regional planning perspective.
There are several other GIS- and Web-based land-use planning tools (e.g., CITYgreen [21], Smart
Places [22]), ecosystem management tools (e.g., Ecosystem-Based Management Tools Network [23])
and regional ecosystem services assessment and valuation tools (e.g., Natural Capital Project
Integrated Valuation of Ecosystem Services and Tradeoffs (InVEST) [24]; ARIES [25]; Multiscale
Integrated Models of Ecosystem Services (MIMES) [26]). However, these tools have a different focus,
methodology, and/or intended use. They are designed to be general tools that must be customized with
local data and expert knowledge in a specific place and context.
In contrast, the EPM is designed to be used as a place-specific set of Web-accessed tools
implemented for a holistic ecosystem analysis. Also, the EPM is designed to enable an unbiased view
of the regional impacts and tradeoffs inherent in land-use changes. From this perspective, ecological,
economic, and societal or ―quality-of-life‖ endpoints get represented separately, allowing
decision-makers to consider ecological-economic-community value tradeoffs explicitly rather than
combining these categorically-distinct values. Based on direct input from stakeholders and potential
end-users (i.e., on-going meetings and interviews) the EPM focuses on three dimensions of
land-use/land-cover (LULC) related anthropocentric value (i) ecological-value (based on various
ecological criteria), (ii) market land-price, and (ii) indicators of (human) community quality-of-life or
human well-being [16]. Each of these dimensions is implemented as a submodel of the EPM that
generates ―value maps‖ for a given land-use pattern, where the value map reflects changes in land
attributes and patterns, as well as user preferences (the exception is the land-price model, which
reflects market prices outside of the influence of the individual user) [16].
These attributes are primarily related to LULC, including changes in habitat potential and landscape
fragmentation, human perceived amenities, community character, flooding risks, water-quality buffer
potential, and ecological restoration potential. Note that a model result considered ―desirable‖
(e.g., increased habitat potential as derived in the ecological-value model) may be considered
―undesirable‖ based on another criteria (e.g., increased travel time to retail establishments as derived in
the community quality-of-life model), generating conflicting scores for a given land-use pattern. The
advantage of the EPM is that it is designed to allow users to consider trade-offs between competing
values and also to consider synergies or bundles (positive relationships among ES). The value maps
can be disaggregated into underlying individual criteria values, as well as viewed as aggregated
value maps.
The EPM is designed to be used by various users specific to their missions and mandates, such as:
(a) Federal, State, tribal and local natural resource agency staff and managers that have land use and
development responsibilities; (b) stakeholders evaluating development applications, land-use plans and
Sustainability 2010, 2
2049
trends; (c) local and regional planning agencies considering the potential ecological impacts to
protected public lands and undeveloped private lands; and (d) resource agencies communicating with
land-use decision-makers and other stakeholders about the potential effects of land-use change. The
EPM Web interface allows users to select from a list of existing land-use plans or upload their own
land-use plans using a specified classification system, and, through the Web interface, to interactively
modify the land-use classifications of any cells or parcels within a loaded land-use plan.
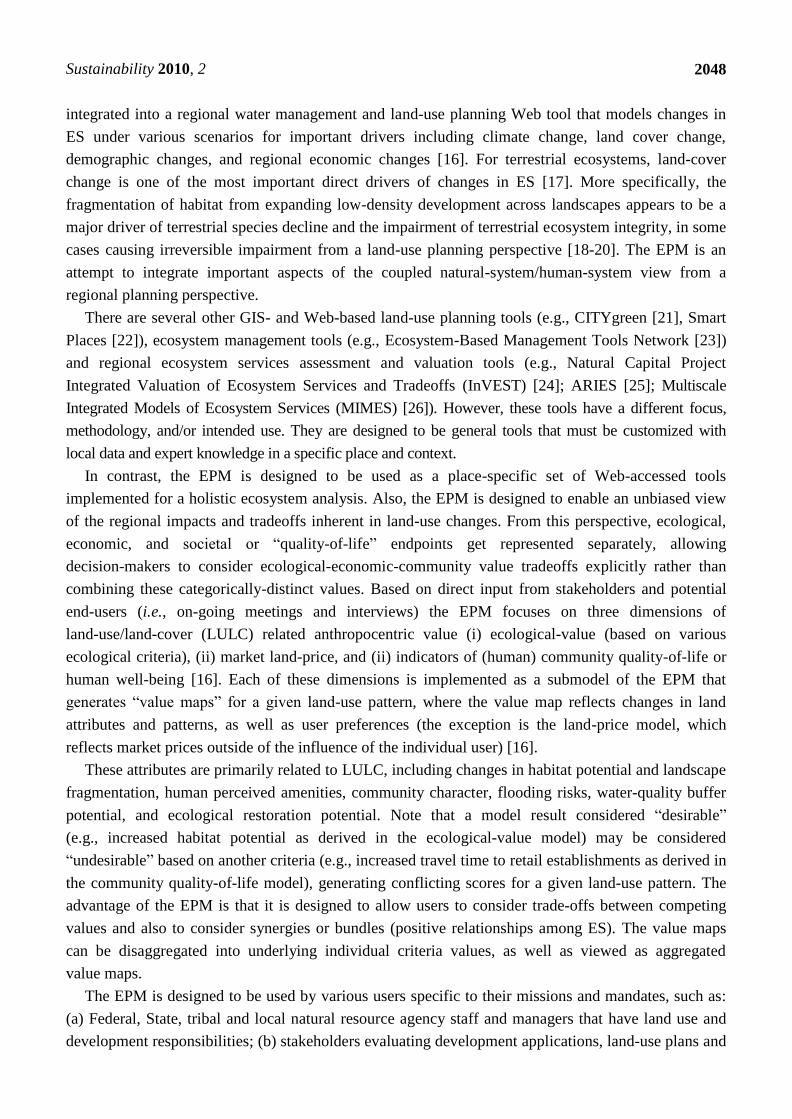
The EPM for the SCW will include an ES valuation system within a suite of linked regional
driver-response models. The SCWEPM will use a multicriteria scenario-evaluation framework that
builds on GIS analysis and spatially-explicit models that characterize important ecological, economic,
and societal endpoints and consequences that are sensitive to climate patterns, regional water budgets,
and regional LULC change in the SCW (Figure 3).
A multi-attribute utility preferences framework represents a methodological middle ground between
detailed economic analysis, that make many strong assumptions about the domain of application[27],
and public participatory methods that reflect the preferences of a single group of individuals, which
can be non-representative of the broader collection of stakeholders [28]. The use of standard economic
tools based on marginal analytic techniques applied to ES is limited to situations in which relatively
intact ecosystems are functioning within stationary patterns that are far away from sudden irreversible
changes [27]. Our approach is to combine these approaches and engage stakeholders to define a
collection of focal ES attributes.
The SCWEPM will use methods from decision sciences and economics to quantify public values
over time. There are many types of participants engaged in water management decision-making in the
SCW; local, regional, State, and Federal agencies, tribes and tribal agencies, environmental groups,
agricultural groups, and other stakeholders. The SCWEPM‘s multicriteria evaluation framework is
designed to cut across the objectives and knowledge bases of all of these participants. Environmental
and ecological models estimate criteria scores, that are weighted using user-defined weights (to reflect
preferences) and combined with other criteria. This approach places fundamental importance on social
equity and stakeholder participation, but makes no attempt to determine normative socially ―optimal‖
land-use plans. The SCWEPM is thus a map-based set of evaluation tools for planners and
stakeholders to use in their deliberations of what is ―most desirable‖, considering a balancing of
disparate interests within a regional perspective.
The SCWEPM is intended to provide transparent first-order indications of the direction of
ecological, economic, and community change, not to make detailed predictions of ecological,
economic, and social outcomes. In short, the SCWEPM will widen the perspectives of its users by
integrating natural and social scientific information in a framework that recognizes the diversity of
values at stake in water management and land-use decision-making. In this project we propose to
address many research and management questions using the proposed decision support tool under a
suite of climate and population change and impact scenarios. In the subsequent section we provide a
detailed synopsis and overview of ES in the study area, proposed scenarios, and ecological and societal
endpoints to be addressed. While each of the sub-models being applied can generate quantitative
results, the scale and combination increase associated error, and so, it is worthy to note that the models
being applied within the EPM will be used to evaluate relative change and can only provide qualitative
Sustainability 2010, 2
2050
estimates. Reliable quantitative estimates would require more intensive calibration and high-resolution
data. It is also subject to the assumptions and limitations of its component models.
Figure 3. Schematic of SCWEPM model inputs, outputs, and sub-model interactions.

Sustainability 2010, 2
2051
4. Ecosystem Services, Alternative Future Scenarios, and Human Well-Being
4.1. Ecosystem Services
Ecosystem services science is evolving. Since the release of the Millennium Ecosystem
Assessment [29] a substantial research effort has been deployed to understand and quantify how
ecosystems provide services, how to value ES, the use of ES in trade-off analysis and decision making,
and the use of ecosystem services in planning and management [3]. Society is dependent on the
long-term functions of ecosystems and their productive capacity for the supply of food and raw
materials. In turn, resources and services obtained from nature should be used efficiently within the
society. Social efficiency means that resources must be used where they are needed most, which leads
to the requirement of just distribution of resources among human societies and human beings [30]. The
usual goal in managing ES is to focus on aggregate levels of benefits, and distributional issues are lost
or deferred. We will be addressing both the questions related to ES services and the just distribution of
ES as we develop the SCWEPM. The services that we will focus on are water and habitat provisioning.
The project will expand its scope in terms of ES as things move forward.
4.1.1. Water provisioning
The Santa Cruz watershed is characterized by high temperatures (average annual
temperature is 66° Fahrenheit (~19° Celsius) [31] and limited rainfall (average annual precipitation
is 14 inches (~0.36 meters) [31]. Shallow aquifer formations are fed primarily by mountain-front
recharge from seasonal rain and snow. Groundwater quality is affected by the heavily mineralized and
hydrothermally altered rocks found in the adjoining mountains. In the portion of the Santa Cruz River
near Nogales, most water is derived from the floodplain aquifer, a series of shallow and undulating
micro-basins that are composed principally of unconsolidated sands and gravels which together are
called the Younger Alluvium [32]. These aquifers have high permeability and storage capacity and
therefore contain most of the locally accessible water in the Nogales area [33].
The health of the SCW riparian ecosystem is dependent on periodic flooding, followed by periods
of drought. Large flooding events redistribute nutrients and sediments and scour native trees (Family
Salicaceae), exposing sand bars and riverbanks that are suitable for establishing native and invasive
plant taxa. Implications of invasive species outside the riparian corridor, specifically upland range
grasses (considering fire, hydrologic regimes, etc.) are unknown. Annual precipitation patterns drive
the growth cycle of riparian trees. Trees rely on shallow water tables and stored reserves from winter
rains to endure the hot and dry months from April until July, when the monsoon rains begin. Monsoon
floods are critical to maintaining a healthy riparian system (recharge aquifers, disperse seeds, induce
seed germination and clear debris from forest floor) [34]. During periods of drought, the width of the
stream may decrease as riparian vegetation increased in the channel. Drought and floods resulting from
changes in climate alter the composition, structure, and function of riparian areas [35,36].
There is insufficient surface- and ground-water to meet all of the needs of the growing human
communities and ecological systems [13] on the Arizona-Sonora border placing a growing demand for
novel ways to augment water supplies. Groundwater is pumped from major well fields along the Santa
Cruz River, south of Nogales, Sonora in the Los Alisos Basin, and from well fields north and east of

Sustainability 2010, 2
2052
Nogales, Arizona. North of the confluence of Nogales Wash and the SCR, the horizontal extent of both
the Younger and Older Alluvium increases relative to the microbasins area [37]. Further north, in the
Tucson basin groundwater is augmented by Colorado River water through the Central Arizona Project
canal system (CAP). CAP waters are being imported into the SCW the maximum allocation at a rate of
over 140,000 acre-feet (ac-ft) per year [38]. If population growth continues as projected [39],
additional water may be required from outside the SCW. The Alisos Basin, south of Nogales, Sonora is
currently being constructed [40]. In the event that climate change (e.g., reduction in precipitation,
increase in air temperature) diminishes returns to water augmentation, many ES will need to be
sustained by active water management; there is growing interest and appreciation for the roles of
effluent and of rainwater harvesting as underutilized water resources.
Energy is needed to support water services (e.g., agricultural pumping, irrigation, and wastewater
treatment) in the SCW on both sides of the border, increasing the complexity of integrated water
management. Transferring waters in Sonora via the Los Alisos (Rio Magdalena-Nogales) aqueduct
entails significant energy [40] for pumping. The energy required to import CAP water will be even
greater. Incorporating water imports into the modelling platform will enable the comparison of energy
use and economic and ecological costs associated with importing water, and thus allowing decision
makers to discern the impacts on regional aquifers, agriculture, habitat biodiversity, flow regimes, and
human quality of life.
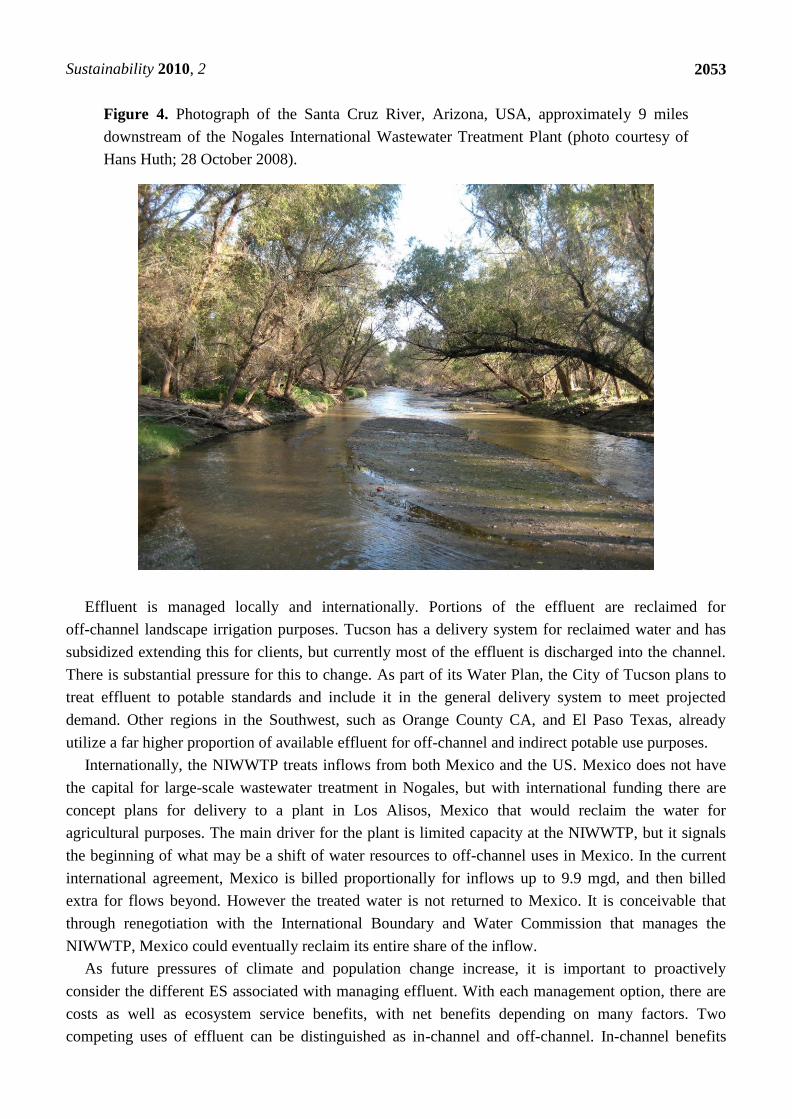
While surface flow in the river is now ephemeral and intermittent from the headwaters, through
Sonora, and back into Arizona, a perennial reach of the river runs for about 30 miles as a result of daily
effluent discharges from the Nogales International Wastewater Treatment Plant (NIWWTP). The
NIWWTP began operation in the 1970‘s and reached its current discharge rate in mid-1990. Due to
intensive groundwater pumping to support agricultural operations and growing municipalities the once
abundant and dense riparian forest along the river had been diminished by the 1970s. Daily inflows
of effluent from the NIWWTP now supply the riparian ecosystem (Figure 4) that many vertebrates
and invertebrates are dependent upon for either temporary or permanent habitat. A similar
effluent-dependent reach exists where the two main wastewater recharge plants in Tucson discharge
into the river.
Studies have been conducted on the role of effluent in the system and have shown that effluent
plays a significant role in supporting riparian and aquatic ecosystems [41-44]. However, uncertainties
remain, as it compromises ecological integrity due to poor water quality and emerging
contaminants [45]. Downstream of the treatment plants, augmentation of recharge and water to support
riparian vegetation rely on annual monsoon floods. These floods also remove the clogging algae layer
that develops as the result of high nutrient concentrations in effluent. In prolonged or intense drought
the clogging layer will persist thereby reducing infiltration and causing die-off of riparian
vegetation [46]. However, there has been little research comparing the health of natural systems to the
health of effluent-dominated systems. The primary perennial surface water source in the SCW is
treated effluent. Although atypical, the ES derived from wastewater provide waters and nutrients for
riparian and aquatic flora and fauna.
Sustainability 2010, 2
2053
Figure 4. Photograph of the Santa Cruz River, Arizona, USA, approximately 9 miles
downstream of the Nogales International Wastewater Treatment Plant (photo courtesy of
Hans Huth; 28 October 2008).
Effluent is managed locally and internationally. Portions of the effluent are reclaimed for
off-channel landscape irrigation purposes. Tucson has a delivery system for reclaimed water and has
subsidized extending this for clients, but currently most of the effluent is discharged into the channel.
There is substantial pressure for this to change. As part of its Water Plan, the City of Tucson plans to
treat effluent to potable standards and include it in the general delivery system to meet projected
demand. Other regions in the Southwest, such as Orange County CA, and El Paso Texas, already
utilize a far higher proportion of available effluent for off-channel and indirect potable use purposes.
Internationally, the NIWWTP treats inflows from both Mexico and the US. Mexico does not have
the capital for large-scale wastewater treatment in Nogales, but with international funding there are
concept plans for delivery to a plant in Los Alisos, Mexico that would reclaim the water for
agricultural purposes. The main driver for the plant is limited capacity at the NIWWTP, but it signals
the beginning of what may be a shift of water resources to off-channel uses in Mexico. In the current
international agreement, Mexico is billed proportionally for inflows up to 9.9 mgd, and then billed
extra for flows beyond. However the treated water is not returned to Mexico. It is conceivable that
through renegotiation with the International Boundary and Water Commission that manages the
NIWWTP, Mexico could eventually reclaim its entire share of the inflow.
As future pressures of climate and population change increase, it is important to proactively
consider the different ES associated with managing effluent. With each management option, there are
costs as well as ecosystem service benefits, with net benefits depending on many factors. Two
competing uses of effluent can be distinguished as in-channel and off-channel. In-channel benefits
Sustainability 2010, 2
2054
include the existence of riparian vegetation and wildlife, enhanced recreational potential, enhanced
property value potential, aquifer storage, and groundwater supply. In-channel costs include odor
problems, potential human contact health hazards, and ecological impacts. Off-channel benefits
include delivery for potable and non-potable purposes; while costs include delivery infrastructure.
These ES may have market prices to indicate their value, or may be nonmarket in nature. There may
also be externalities that bear on the issue. For example, residential water rates usually only include the
cost of treatment and delivery, but not the value of the water itself; an externality caused by
underpriced water is fewer water supplies for the future. The SCWEPM will provide a means to
consider the relative costs and benefits of managing effluent.
Rainwater harvesting is a traditional water collection technique that involves either active storage of
collected water in a receptacle (e.g., tank), or regrading surface topography to slow or capture runoff to
increase water storage in sediments. Although rainwater harvesting is less practiced at present,
presumably due to the convenience of modern water delivery infrastructure, retaining water onsite can
obviate the need for landscape irrigation, enhance groundwater recharge, and mitigate downstream
impacts. There is renewed interest in the net ecosystem benefits of traditional rainwater harvesting
being considered. For example, the City of Tucson requires commercial building constructed after
June 10, 2010 to augment at least 50% of their landscaping needs with harvested rainwater water [47].
Both rooftop or small-scale urban systems, and landscape-scale runoff capture systems will be
modeled. Potential ecosystem service benefits of increased rainwater harvesting are similar to those
listed above for effluent. Costs stem from project installation and maintenance. A complicating issue is
that rainwater harvesting efforts at the watershed scale are most effective when small, dispersed
projects are enacted high in the watershed and are continued to the mouth. These often occur on
private lands and hence the ability for regional agencies to rely on these projects is uncertain. This
leads to central, engineered solutions such as large detention basins low in a watershed, rather than
greener solutions throughout [48].
4.1.2. Habitat provisioning
The SCW is rich in riparian areas, unique desert habitats, diverse canyons, and extensive Sky
Island landscapes, providing habitat for wildlife and cultural services and amenities such as
aesthetically-pleasing landscape, recreation, cultural heritage, and spiritual and religious inspiration.
The riparian corridor of the Santa Cruz River and its tributaries provide an important migratory
corridor for millions of Neotropical migrants and large numbers of wintering and migrating waterfowl
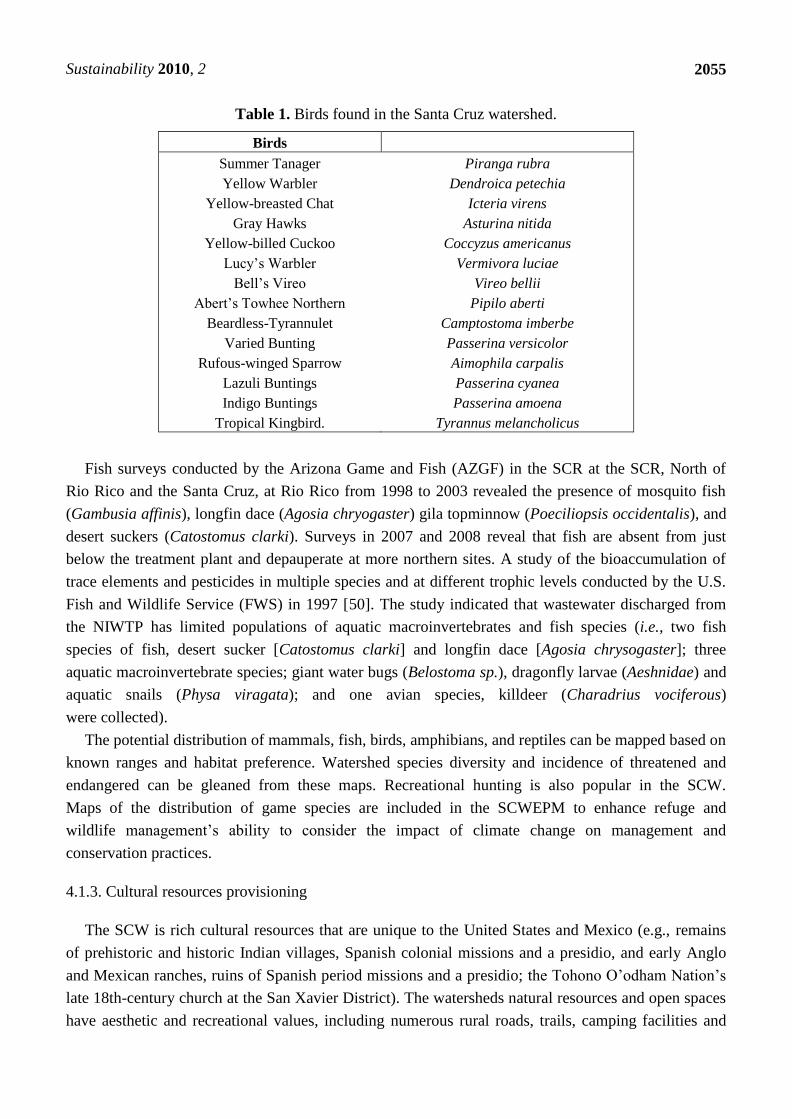
that regulate insects that feed on fields and native plants [49] (Table 1). Several upland, riparian and
aquatic avian species are hunted recreationally (e.g., turkey [Meleagris gallapavo merriami and
mexicana], scaled quail [Callipepla squamata], mearn‘s quail [Cytonyx montezuma], band-tailed
pigeon [Patagioenas fasciata] and mourning dove [Zenaida macroura]).
The SCW is also home to diverse reptiles and amphibians taxa due to the heterogeneous landscape.
Nine of 17 species of rattlesnake (genera Crotalus and Sisturus) that occur in Arizona are found in the
SCW. Half of the 26 native species of amphibians found in Arizona occur there (all of which are of
conservation concern), including three of Arizona‘s seven species of native frogs. This area is an
important hot-spot for native amphibian and reptile diversity preservation and conservation.
Sustainability 2010, 2
2055
Table 1. Birds found in the Santa Cruz watershed.
Birds
Summer Tanager
Yellow Warbler
Yellow-breasted Chat
Gray Hawks
Yellow-billed Cuckoo
Lucy‘s Warbler
Bell‘s Vireo
Abert‘s Towhee Northern
Beardless-Tyrannulet
Varied Bunting
Rufous-winged Sparrow
Lazuli Buntings
Indigo Buntings
Tropical Kingbird.
Piranga rubra
Dendroica petechia
Icteria virens
Asturina nitida
Coccyzus americanus
Vermivora luciae
Vireo bellii
Pipilo aberti
Camptostoma imberbe
Passerina versicolor
Aimophila carpalis
Passerina cyanea
Passerina amoena
Tyrannus melancholicus
Fish surveys conducted by the Arizona Game and Fish (AZGF) in the SCR at the SCR, North of
Rio Rico and the Santa Cruz, at Rio Rico from 1998 to 2003 revealed the presence of mosquito fish
(Gambusia affinis), longfin dace (Agosia chryogaster) gila topminnow (Poeciliopsis occidentalis), and
desert suckers (Catostomus clarki). Surveys in 2007 and 2008 reveal that fish are absent from just
below the treatment plant and depauperate at more northern sites. A study of the bioaccumulation of
trace elements and pesticides in multiple species and at different trophic levels conducted by the U.S.
Fish and Wildlife Service (FWS) in 1997 [50]. The study indicated that wastewater discharged from
the NIWTP has limited populations of aquatic macroinvertebrates and fish species (i.e., two fish
species of fish, desert sucker [Catostomus clarki] and longfin dace [Agosia chrysogaster]; three
aquatic macroinvertebrate species; giant water bugs (Belostoma sp.), dragonfly larvae (Aeshnidae) and
aquatic snails (Physa viragata); and one avian species, killdeer (Charadrius vociferous)
were collected).
The potential distribution of mammals, fish, birds, amphibians, and reptiles can be mapped based on
known ranges and habitat preference. Watershed species diversity and incidence of threatened and
endangered can be gleaned from these maps. Recreational hunting is also popular in the SCW.
Maps of the distribution of game species are included in the SCWEPM to enhance refuge and
wildlife management‘s ability to consider the impact of climate change on management and
conservation practices.
4.1.3. Cultural resources provisioning
The SCW is rich cultural resources that are unique to the United States and Mexico (e.g., remains
of prehistoric and historic Indian villages, Spanish colonial missions and a presidio, and early Anglo
and Mexican ranches, ruins of Spanish period missions and a presidio; the Tohono O‘odham Nation‘s
late 18th-century church at the San Xavier District). The watersheds natural resources and open spaces
have aesthetic and recreational values, including numerous rural roads, trails, camping facilities and

Sustainability 2010, 2
2056
fishing opportunities. SCW residents and visitors enjoy unobstructed views of scenic landscapes, as
well as clear night skies and the absence of lights in the desert for star gazing.
4.2. Alternative Scenarios
Scenario analysis is a strategic planning technique used to describe and evaluate a plausible
description of what might happen. They are not forecasted, but rather carefully constructed plots based
on probable drivers of future states and conditions. They are used to assist in decision-making, making
stakeholders aware of the ramifications and uncertainties of their actions.
4.2.1. Urban growth scenarios
Urban growth is a primary driver of land use change in rural and metropolitan areas in the SCW.
According to the 2000 U.S. Census, Arizona was the nation‘s second fastest growing state from 1990
to 2000. Tucson is the largest urban area in the watershed, with over a million people living in the
metropolitan area, half of which live within the Tucson city limits. Nogales, Sonora is second largest
with over 300,000 people.
Urban and non-urban land-use (i.e., population growth and shifts) will be modeled using the
SLEUTH Urban Growth Model, that simulates transition of land-use using cellular automata and
generates dynamic spatial patterns by applying growth rules to a grid of cells [51,52]. Each land-use
state is modeled from local factors (e.g., roads, existing urban areas, topography), as well as temporal
and random factors. Additionally, non-urban land use transitions, such as rangeland to agricultural land,
will be simulated. The output maps of annual forecasted change can be animated to show change over
time as well as integrated into GIS databases to allow for further spatial analyses.
The outputs of the SLEUTH simulations will be fed back into the SCWEPM to determine predicted
impervious surfaces impacts on water quantity and habitats downstream. Additionally, the SLEUTH
output will be used to assess demographic responses to climate impact scenarios, including forced
migration, and overcrowding, and to demonstrate the impact population movement might have on
cultural resources.
4.2.2. Climate change scenarios
The SCW climate is characterized as arid to semi-arid, with heavy summer monsoon rains
accounting for the majority of precipitation and winter cyclonic events accounting for a smaller
amount [53]. Evapotranspiration demands are highest in June, prior to the start of the summer
―monsoon‖ rainy season. The watershed is located in a transition zone between temperate and tropical
latitudes and between regions with summer-dominated rainfall to the east and south and
winter-precipitation dominance to the west and north. Superimposed on this is a vertical climatic
transition due to elevation changes, with cooler temperatures and greater precipitation at higher
elevations. This positioning with respect to climate transitions governs the watershed‘s bimodal
rainfall, leads to fluctuating streamflow regimes, enhances the basin‘s sensitivity to climatic variations,
and exacerbates the watershed‘s vulnerability to climatic change.

Sustainability 2010, 2
2057
Processes which deliver moisture to the region vary seasonally. Winter precipitation is dependent
on the southern reaches of large, synoptic-scale cyclonic storms arising in the North Pacific Ocean,
while during the summer rainy season (late June through September), convective thunderstorms
dominate. Periodically, additional moisture is entrained into the region during the warm season from
remnants of eastern North Pacific tropical storms [54,55]. The atmospheric dynamics associated with
these mechanisms lead to an important distinction regarding the seasonal nature of precipitation. Due
to variations in large-scale synoptic circulation patterns that dictate the trajectories of extratropical
cyclonic storm tracks, precipitation exhibits greater interannual variability at a given station during
winter than summer, even though summer convective rainfall is more spatially variable [56].
Nevertheless, summer and fall station rainfall totals can fluctuate widely during years affected by
tropical cyclone-related moisture influxes.
A watershed-centered approach of process-sensitive upscaling built upon the basin‘s streamflow
hydrology and using the river‘s response to known weather and climate processes, will be the basis for
future climate change scenarios compared in the SCW [57]. The interaction between storm properties
and drainage basin properties (e.g., area, slope, elevation) plays an important role in the occurrence
and magnitude of floods and droughts both regionally and seasonally. A watershed‘s streamflow may
be a better indicator of overall climate variability than gauged precipitation because it assimilates
weather input over space and time and is dictated by basin-wide runoff processes that are dependent on
temperature and evapotranspiration as well as precipitation. Discharge variability therefore reflects a
suite of integrated hydroclimatic processes that might be difficult to detect in other measurements of
the climate system. Discharge is the phenomenon most directly associated with water supply, water
quality, riparian ecosystem health, and hence an understanding of how climate change and streamflow
interrelate through process-sensitive upscaling can provide an important foundation for an integrated
assessment of watershed-based ES.
Variations in the magnitudes, frequencies, and seasonal characteristics of the streamflow events can
be reevaluated in terms of the meteorological causes and large-scale circulation patterns [58]. Analyses
have demonstrated that the time series of peak flow events at stations throughout the SCW reflect a
combination of floods caused by seasonal differences in precipitation as previously noted, i.e., winter
synoptic storm floods, summer convective storm floods, and floods associated with moisture from
remnants of tropical cyclones [58,59]. Summer convective storms are the most frequent source of
flooding, but six of the seven largest annual floods at the Tucson gage (all of which occurred in the
second half of the record) were associated with either tropical or extratropical cyclones (Figure 5).
For example, GCM projections of a poleward shift in the position of the westerly extratropical
storm track indicate a scenario with a diminished influence of the winter synoptic flood type in the
SCW, whereas model projections of a more active tropical storm regime specify a scenario of
enhanced tropical-storm related flooding. Clearly, any shift toward a stronger or weaker summer
monsoon thunderstorm season in Arizona would have a profound influence on the dominant source of
flooding, recharge, and overall flow regime in the watershed. Moreover, timing of floods and flow
greatly affects ecosystem dynamics [34].

Sustainability 2010, 2
2058
Figure 5. Annual flood peak discharge in thousands of cubic feet per second for the SCR
classified according to hydroclimatic cause of flood. Period of record is 1915–1999. Data
are for the Santa Cruz at Tucson (USGS gage No. 09482500).
0
5
10
15
20
25
30
35
40
45
50
1915 1920 1925 1930 1935 1940 1945 1950 1955 1960 1965 1970 1975 1980 1985 1990 1995 2000
Dis
ch
arg
e (
cfs
x 1
00
0)
Water Year
52,700 cfs
Summer Convective
Tropical Storm
Winter Synoptic
Our upscaling approach will use high resolution climate modeling information and derivative
products to produce impact-relevant information needed to forecast ecological and population response
at regional levels. Using that, we will assess the vulnerability and risk of species and habitats to
climate change. An assessment of climate change impacts in the water resources of the San Pedro
River basin, just east of the SCR, was done by Sustainability of Semi-Arid Regions and Riparian
Hydrology (SAHRA), who presented results from 17 global circulation models (GCMs) and four
different climate change scenarios from the Intergovernmental Panel on Climate Change (IPCC) [60].
Drawing from these results, we will downscale precipitation data to use as input of representative
climate scenarios into the basin‘s existing decision support system model.
Climate scenarios 30–50+ years in the future that are generated by the IPCC and the North
American Regional Climate Change Assessment Program (NARCCAP) will be the bases for analysis,
impacts studies, and further downscaling. These scenarios will be interpolated into Parameter-elevation
Regressions on Independent Slopes Model (PRISM) geospatial climate mapping system of the
watershed to generate and visualize GIS-scenarios of watershed predictions from regional climate
models (RCMs) that are driven by a set of atmosphere-ocean general circulation models (AOGCMs)
and downscaled using high-resolution digital elevation models and local stream gage information.
These forecasts will be criterion available for scenario building and be used as input to the
hydrological modeling described in the SCWEPM.

Sustainability 2010, 2
2059
4.3. Linkages with Human Well-Being
4.3.1. Human health
Understanding environmental and ecological health is a prerequisite to protecting public health. Our
goal is to use document local health information through the USGS Border Environmental Health
Initiative (BEHI) and identify relationships among potential disease and environmental degradation.
The BEHI project is committed to investigating linkages between the condition of the physical
environment and environmental and health issues and in the west, researchers are currently studying
contaminants in the SCW [61]. For example, we propose to investigate the association between
temperature increases and heat stress and cardiorespiratory failure in humans; air pollution and
aeroallergens with respiratory diseases (e.g., asthma), changes in water resources and vector-borne
diseases (e.g., malaria, dengue, encephalitis, hantavirus, Rift Valley Fever) food shortages and human
physical and mental health (e.g., malnutrition, diarrhea) [62].
4.3.2. Environmental justice
The U.S.-Mexico border is one of the poorest regions of the state of Arizona, with the average per
capita incomes in the border counties being only 75% of the state average, and house prices at 65% of
the median for the state [63]. The economic disparity between southern Arizona and the rest of the
state widened over time. The 2000 Census reveals that in the rural border counties of Arizona, nearly
one of five families lived in poverty, compared to one in ten throughout the nation and the state.
Median family incomes in Arizona‘s border counties were $34,907 in 1999, trailing the state average
by more than $11,000 and the nation by more than $15,000. The highest levels of deprivation
(e.g., housing, health care) are mostly confined to border and farmworker communities within 62 miles
of the Mexican border [64]. Urbanization has contributed to this phenomenon, as fast-growing
bi-national cities cannot meet demands for safe and affordable housing [65].
Colonias, a Spanish word for neighborhood, are predominantly Hispanic, poor, unplanned
neighborhoods in the U.S.-Mexico borderlands that typically lack sewer, clean water, safe and sanitary
housing, and other essential services, such as electricity and paved roads [66]. Colonias in the SCW
demonstrate infrastructure deficiencies, poor quality housing, high levels of poverty, and a
disproportionate concentration of Hispanics [63,64]. In the census tracts covering the SCW, the
majority of the population is white, while 10% is Hispanic; Tucson and Nogales have higher levels of
Hispanic populations (>20%) [63]. The foreign-born presence in colonias of southern Arizona
exacerbates the disconnect between people living in borderland communities and benefits from
government programs, policies, and reforms [67]. Norman and others [68] identified many new
colonia boundaries around Ambos Nogales, but many more exist today in the SCW and within the
borderlands defined by the Cranston-Gonzales Act, in which 100 mi. radius is considered.
One of the distinguishing features of the SCWEPM is explicit consideration of the distribution of
impacts in ES management. This corresponds with the Executive Order 12989, Federal Actions to
Address Environmental Justice Order in Minority Populations and Low-Income Populations (1994) to
investigate the environmental justice implications of environmental management. The Order directs
federal agencies to develop EJ strategies and identify and address disproportionately high and adverse

Sustainability 2010, 2
2060
human health or environmental effects of their programs, policies, and activities on minority and
low-income populations. The Order is also intended to promote nondiscrimination in federal programs
substantially affecting human health and the environment. Government institutions have been reluctant
to direct resources to specific borderland communities because they have no means to rank or rate
communities by need [69].
Nonmarket valuation studies are a part of environmental economics, which estimate values for ES
that have no clear prices, such as the value of increased biodiversity. Providing information to address
overall economic inefficiency is important, and looking beyond aggregate figures can lead to more
practically relevant solutions for a community. Less obvious is how environmental choices affect one
group more than another. Although society could be better off as a whole, frequently some groups lose
and others gain. Redistribution of wealth to make everyone better off in the new state is more stringent
criteria. This is related to the well-known ―pareto improvement‖ concept in economics, defined as any
change that makes someone better off without making anyone else worse off. Relatively few
environmental economists explore distribution of wealth and equity issues (for exceptions see [70]).
However, decision makers care about how outcomes affect certain groups, and citizens typically care
not only about their own welfare but also the welfare of those surrounding them. A more equitable
approach can lead to a community with fewer class tensions and a higher quality of life. For these
reasons we have decided to include EJ as explicit criteria in the SCWEPM.
The dividing influence of the International borders is especially relevant in regard to the
environment [11]. Differential exposure of some populations to harmful chemicals, pesticides, and
other toxins in the home, school, neighborhood, and work place are important human health factors.
One goal is to identify the EJ neighborhoods in this watershed as defined by Moda [71], where 25% or
more of the population lack English language proficiency, 25% or more of the population is foreign
born, 25% or more of the population is minority, and/or median annual income of the population is at
or below 65% of the state median income based on Census data and compare the distribution of
environmental hazards (e.g., contaminated drinking water, decreasing water yields, etc.) in EJ
communities along the border. Another goal is to generate a standardized economic valuation that
incorporates spatial distribution of EJ neighborhoods with environmental hazards to provide
nation-wide understanding of the ecosystem for decision-makers and potentially identify communities
in need of assistance, with metrics to support them.
4.3.3. Quality of life
The ES related to surface water resources in this region made the river a natural focal point for
residents throughout history. In the initial stages of the SCWEPM public focus groups will be held to
investigate how select segments of the river are is important to the public. Ultimately the goal is to
delineate the physical, social and economic attributes related to the river that are the most important to
the public to be used as ‗indicators‘ of the river resource. These attributes are by definition ES that
contribute to public benefits. The SCWEPM will all draw from a riparian ecosystem ‗health
assessment‘ that is being developed for the Santa Cruz River by the Sonoran Institute as part of an
EPA ‗targeted watershed grant‘ [72].

Sustainability 2010, 2
2061
5. Approach
The SCWEPM prototype will focus on a high-resolution analysis in the upper Santa Cruz watershed,
where local water managers and city planners on both sides of the US-Mexico border are considering
various water augmentation activities to circumvent social and environmental catastrophe in the face of
climate change. The Ecological-Value Submodel (EVM) is the first of three components to be included
in the SCWEPM and will consider the tradeoffs associated with water provisioning with models to
predict impacts on habitat provisioning. Several models and data sources are being dynamically
coupled in the SCWEPM prototype.
Seasonal vegetation cover and land use maps of the SCW (US-Mexico) derived from a series of
three Landsat (MSS-TM) scenes (i.e., two seasons each from1976, 1987, 1996, 2006 and 2009/2010)
will be compared for temporal and spatial changes in vegetation and land use. These multi-temporal
land cover and land use data layers will serve as the input data layers for the Soil and Water
Assessment Tool (SWAT) sub-model to predict the impacts of land use and management on water,
sediment and chemical yields through time [73]. Data from rainfall gauges in the SCW will provide
current and historical measurements of precipitation as input to SWAT and local stream gauge data
will be used for calibration purposes.
Predicted climate change information for the SCW, derived from Intergovernmental Panel on
Climate Change projections, will also be used as input to the SWAT model to examine possible
changes in the watershed channel discharge, evapotranspiration, percolation, surface runoff,
transmission losses, water yield, and sediment yield. In addition, future urban development and land
use change maps generated by the SLEUTH model will be substituted in SWAT to identify impacts in
the watershed. The Modular three-dimensional finite-difference ground-water flow model
(MODFLOW) will ultimately be coupled to the SLEUTH/SWAT outputs to estimate potential future
water supply based on changes in predicted infiltration rates. This will allow binational managers to
identify problem areas where management activities can be focused, or to anticipate sensitive areas in
association with planning efforts.
The wildlife and bird habitat for a suite of species within the SCW will be identified using the
historical and current LULC maps and alternative future scenarios in relationship with the Southwest
Regional Gap Analysis Project (SWReGAP) animal-models. These models are based on Wildlife
Habitat Relationships (WHRs) describing resources and conditions present in areas where a species
persists and reproduces or otherwise occurs [74]. Mapping alternative LULC scenarios into these
models will provide estimates of habitat gained and lost for native wildlife. Preservation or
conservation of cultural resources are also subject to change in climate or land use change scenarios.
An important feature of the SCWEPM is the ability to identify the location of cultural resources,
places of importance to past human inhabitation and development, scenic attractions, geologic
features, and natural areas when considering the ramifications of natural phenomena, management
practices, or both.

Sustainability 2010, 2
2062
Figure 6. Riparian Restoration Project site irrigated by CAP water on the SCR located at
the San Xavier District of the Tohono O‘odham Nation on June 26, 2009 (photo by Matt
Weber with permission by TON).
Our next step is to quantify the ecosystem services in a spatially explicit manner based on
derived ecological variables and demonstrate how different scenarios will affect them. The
Human-Well-Being Submodel (HWB) and the Market Land-Price Submodel (MLP) are also being
developed to help identify and map the socio-cultural and economic values of goods and services
provided by ecosystems.
The HWB submodel uses data and models to evaluate a set of human well-being indicators and
metrics of interest to the public, land-use planners, and stakeholders. We are using information
describing the political and economic history of the borderlands, documented environmental health
risks, and understanding of industrialization to ascertain a quality of life. Public surveys in
neighborhoods and colonias will help determine perceived quality of life, environmental health
indicators, and in the future, feedback effects. A well-known deprivation index is being applied to
evaluate the effects of industrialization and development on quality-of-life at the neighborhood scale,
based on U.S. Census data and AGEBs (Mexican geostatistical districts) [64,75,76], and identify areas
of greatest housing, social and poverty stress. We will develop a pliable layer that can demonstrate
how land use change will impact people, providing an estimate of the social complexion. Those most
vulnerable to changes can then be recognized and considered in community-based decision-making, in
support of environmental justice.
The MLP evaluates land-price as a function of LULC patterns and other predictor variables. The
MLP is based on hedonic-pricing functions, which describe each land parcel‘s price in terms of its
particular characteristics (for example, parcel size and zoning), as well as amenities and disamenities
related to location. Studies have been performed within the SCW to examine hedonics [77-79]; we will
Sustainability 2010, 2
2063
map such data into a geospatial layer representing relative property values that can be flexible as well
to mimic impacts of land use changes.
6. Conclusions
There are challenges when developing a tool of this kind, especially in this International study area.
Firstly, the aggregation of biophysical data across administrative boundaries is especially difficult
when there are multiple resolutions and classification schemes, not to mention, languages. And
secondly, approaching cultural differences without understanding can lead to miscommunication and
misunderstanding. The exploration of ecological, economic, and societal affects on human well being
through the ecosystem-services lens will foster cross-culture collaboration.
The identification and characterization of ecosystem services of the SCW using decades of spatial
data will enable an illustrative integrated analysis of how a changing climate and land use will impact
human well-being. Characterizations include the use of within-scenario predictions of ecosystem,
hydrologic, and social responses. Environmental models will report results of these drivers numerically.
Valuations include economic survey methods and multi-criteria decision science techniques.
Combinations of results and associated values can be ranked based on relative priorities of the user.
Potential users can access the SCWEPM via the World Wide Web to explore spatially explicit
changes in ecological, economic, and human well-being/quality-of-life indicator scores and attribute
valuations. Users can compare alternative water management and land-use plans, evaluate proposed
changes, evaluate historical trends in water management/land-use changes, and evaluate
simulated/projected future changes in water supply and demand, land use, regional precipitation
patterns, and other drivers. Collective information can be relayed to decision-makers to promote
sustainable-resource use in consideration of a suite of ecosystem services and to allocate funding if and
when necessary. The SCWEPM web interface will allow the user to explore individual value maps for
each unique criterion or, after applying user-chosen multi-criteria weights, as an aggregated value map
to holistically compare potential land use patterns.
Our goal is for the SCWEPM to evolve in response to management problems that surface
throughout its development. It will assess the impacts of climate and land use change on the people
and ecosystems of the SCW, focusing attention on those that are vulnerable to policy or management
decisions. This is necessary because instream flows, stream-corridor habitat, riparian vegetation,
species diversity, ground water-surface water interactions, land-use effects, climate variability, and
Public Laws (e.g., the Endangered Species Act, National Historic Preservation Act), are now
intertwined with water availability.
Acknowledgements
Agencies and partners who have contributed to this research agenda include the US EPA ES
Research Program in the Office of Research and Development (William Kepner, Caroline Erickson,
John Lin, Michael Jackson, and Don Ebert), the Sonoran Institute (Joe Marlow and Emily Brott);
Arizona Department of Environmental Quality (Hans Huth and Craig Tinney); the National Park
Service, Tumacacori National Historical Park (Jeremy Moss); The San Xavier District of the Tohono
O‘Odham Nation (Austin Nunez and Scott Rogers); Friends of the SCR (Ben Lomeli and Sherry Sass);

Sustainability 2010, 2
2064
Arizona State University (Francisco Lara-Valencia); The University of Arizona (Felipe Caldeira, Jill
de Zapien, Mary Kay O‘Rourke, Cecilia Rosales, Laura López-Hoffman, Phil Guertin, Chris Scott,
Matt Skroch, Jon Cline, Angela Donelson, Adrian Esparza, and Joanna Nadeau); The Nature
Conservancy (Brooke Gebow and JB Miller); and USGS colleagues (David Strong, Mark Feller, Jean
Parcher, Mark Bultman, Cynthia Wallace, Kathryn Thomas, Miguel Villarreal, Ken Nussear, Rose
McAndrew, Nicholas Paretti, and Diana Papoulias).
Special thanks go to Kristin Byrd and Carl Shapiro (USGS), Christopher Scott (University of
Arizona), and Deborah Chaloud (U.S. EPA) and James Wickham (U.S. EPA) for their helpful reviews
of this manuscript. The U.S. Environmental Protection Agency through its Office of Research and
Development collaborated in the research. This manuscript has been subject to Agency peer review
and approved for publication. Mention of trade names or commercial products does not constitute an
endorsement or recommendation for use.
References and Notes
1. Anderson, M.T.; Woosley, L.H. Water Availability for the Western United States—Key Scientific
Challenges; U.S. Geological Survey Circular 1261; USGS: Reston, VA, USA, 2005.
2. Barnett, T.; Malone, R.; Pennell, W.; Stammer, D.; Semtner, B.; Washington, W. The effects of
climate change on water resources in the west: Introduction and overview. Climatic Change 2004,
62, 1–11.
3. de Groot, R.S.; Anlkemade, R.L.; Braat, L.; Hein L.; Willemen, L. Challenges in integrating the
concept of ecosystem services and values in landscape planning, management and decision
making. Ecol. Complex. 2009, doi:10.1016/j.ecocom.2009.10.006.
4. Wainger, L.A.; King, D.M.; Mack, R.N.; Price, E.P.; Maslin, T. Can the concept of ecosystem
services be practically applied to improve natural resource management decisions? Ecol. Econ.
2010, 69, 978–987.
5. Wainger, L.A.; Price, E.W. Evaluating quality of life, economic vulnerabilities and drivers of
ecosystem change. Environ. Monit. Assess. 2004, 94, 69–84.
6. Fisher, B.; Turner, R.K.; Morling, P. Defining and classifying ecosystem services for decision
making. Ecol. Econ. 2009, 68, 643–653.
7. Woodard, D.; Durall, R. United States-Mexico Border Area, as Delineated by a Shared Water
Resources Perspective; U.S. Department of the Interior, Field Coordinating Committee:
Washington, DC, USA, 1996; Fact Sheet 1.
8. Shamir, E.; Meko, D.M.; Graham, N.E.; Georgakakos, K.P. Hydrologic model framework for
water resources planning in the Santa Cruz River, Southern Arizona. J. Am. Water Resour. Assoc.
2007, 43, 1155–1170.
9. Scott, C.A.; Varady, R.G.; Browning-Aiken, A.; Sprouse, T.W. Linking water and energy along
the Arizona-Sonora Border. Southwest Hydrol. 2007, 6, 26–31.

Sustainability 2010, 2
2065
10. Norman, L.M.; Hirsch, D.D.; Ward, A.W. Monitoring, modeling, and forecasting change within
the Arizona-Sonora transboundary watersheds. In Proceedings of a USGS Workshop on Facing
Tomorrow’s Challenges along the U.S.-Mexico Border, Tucson, AZ, USA, 2 April 2008; U.S.
Geological Survey Circular 1322; USGS: Reston, VA, USA, 2008; Available online:
http://pubs.usgs.gov/circ/1322/ (accessed on 6 July 2010).
11. Ingram, H.; Varady, R.G. Empowering grassroots linkages. Arid Land. 1996, Spring/Summer,
No. 39; Available online: http://ag.arizona.edu/OALS/ALN/aln39/ing%26var.html (accessed on
6 July 2010).
12. Norman, L.M. United States-Mexican border watershed assessment: Modeling nonpoint source
pollution in Ambos Nogales. J. Borderl. Stud. 2007, 22, 20.
13. Morehouse, B.J.; Ferguson, D.B.; Owen, G.; Browning-Aiken, A.; Wong-Gonzalez, P.;
Pineda, N.; Varady, R. Science and socio-ecological resilience: Examples from the
Arizona-Sonora Border. Environ. Sci. Policy 2008, 11, 272–284.
14. Norman, L. Urbanization and environmental degradation in Arizona Colonias. In The Colonias
Reader; Esparza, A.X., Czneriak, R., Donelson, A.J., Eds.; University of Arizona Press: Tucson,
AZ, USA, 2010, in press.
15. López-Hoffman, L.; Varady, R.G.; Flessa, K.W.; Balvanera, P. Ecosystem services across borders:
A framework for transboundary conservation policy. Front. Ecol. Environ. 2010, 8, 84–91.
16. Labiosa, W.B.; Bernknopf, R.; Hearn, P.; Hogan, D.; Strong, D.; Pearlstine, L.; Mathie, A.M.;
Wein, A.M.; Gillen, K.; Wachter, S. The South Florida Ecosystem Portfolio Model—A
Map-Based Multicriteria Ecological, Economic, and Community Land-Use Planning Tool; U.S.
Geological Survey Scientific Investigations Report 2009–5181; USGS: Reston, VA, USA, 2009.
17. Hassan, R.M.; Scholes, R.; Ash, N. Ecosystems and human well-being—Current state and
trends—Findings of the condition and trends working group of the millennium ecosystem
assessment. In The Millennium Ecosystem Assessment Series; Island Press: Washington, DC, USA,
2005; Volume 1.
18. Brody, S.D. Ecosystem Planning in Florida—Solving Regional Problems through Local
Decision-Making; Ashgate: Burlington, VT, USA, 2008.
19. Peck, S. Planning for Biodiversity—Issues and Examples; Island Press: Washington, DC,
USA, 1998.
20. Marsh, L.L.; Lallas, P.L. Focused, special-area conservation planning—An approach to
reconciling development and environmental protection, in collaborative planning for wetlands and
wildlife. In Issues and Examples; Porter, D.R., Salvesen, D.A., Eds.; Island Press: Washington,
DC, USA, 1995; pp. 7–34.
21. CITYgreen; Available online: http://www.americanforests.org/productsandpubs/citygreen/
(accessed on 6 July 2010).
22. Johnson, P.; Lachman, B. Rapid Scan of Decision Support System Tools for Land-Use Related
Decision Making; NatureServe: Arlington, VA, USA, 2001, unpublished; Available online:
http://www.ncseonline.org/NCSSF/DSS/Documents/NatureServe/SmartPlace.doc (accessed on 6
July 2010).
23. Ecosystem-Based Management Tools Database; Available online: http://www.smartgrowthtools.
org/ebmtools/index.php (accessed on 6 July 2010).

Sustainability 2010, 2
2066
24. Natural Capital Project Toolbox; Available online: http://www.naturalcapitalproject.org/
toolbox.html (accessed on 6 July 2010).
25. ARIES; Available online: http://esd.uvm.edu/home/introduction.html (accessed on 6 July 2010).
26. Multi-scale Integrated Models of Ecosystem Services (MIMES); Available online: http://www.
uvm.edu/giee/mimes/ (accessed on 6 July 2010).
27. Muradian, R.; Kumar, P. Payment for ES and valuation—Challenges and research gaps.
In Payment for ES; Kumar, P., Muradian, R., Eds.; Oxford University Press: New Delhi,
India, 2009; pp. 1–16.
28. Wilson, M.A; Howarth, R.B. Discourse-based valuation of ES—Establishing fair outcomes
through group deliberation. Ecol. Econ. 2002, 41, 431–443.
29. Millennium Ecosystem Assessment. Ecosystems and Human Well-being: Desertification
Synthesis; World Resources Institute: Washington, DC, USA, 2005.
30. Azar, C.; Holmberg, J.; Lindgren, K. Methodological and ideological options; socio-ecological
indicators for sustainability. Ecol. Econ. 1996, 18, 89–112.
31. Uhlman, K.; Guertin, D.P.; Levick, L.R.; Sprouse, T.; Westfall, E.; Holmgren, C.; Fisher, A.
NEMO Watershed-Based Plan, Santa Cruz Watershed; University of Arizona: Tucson, AZ,
USA, 2008.
32. Erwin, G. Groundwater Flow Model of the Santa Cruz Active Management Area Microbasins
International Boundary to Nogales International Wastewater Treatment Plant Santa Cruz County,
Arizona; Arizona Department of Water Resources Modeling Report No. 15; Arizona Department
of Water Resources: Phoenix, AZ, USA, 2007.
33. Third Management Plan for the Santa Cruz Active Management Area, 2000–2010; Arizona
Department of Water Resources: Phoenix, AZ, USA, 2000.
34. Leenhouts, J.M.; Stromberg, J.C.; Scott, R.L. Hydrologic Requirements of and Consumptive
Ground-Water Use by Riparian Vegetation along the San Pedro River, Arizona; U.S. Geological
Survey Scientific Investigations Report 2005–5163; U.S. Geological Survey: Reston, VA,
USA, 2006.
35. Zaimes, G.; Maloney, M.L.; Rupprecht, C. Riparian areas of Arizona: Climate driven ecosystem
changes, in recharge. Recharge 2007, 2, 3–7.
36. Bagstad, K.J.; Stromberg, J.C.; Lite, S.J. Response of herbaceous riparian plants to rain and
flooding on the San Pedro River, Arizona, USA. Wetlands 2005, 25, 210–223.
37. Nelson, K. Groundwater Flow Model of The Santa Cruz Active Management Area along the
Effluent-Dominated Santa Cruz River Santa Cruz and Pima Counties, Arizona; Arizona
Department of Water Resources Modeling Report No. 14; Arizona Department of Water
Resources: Phoenix, AZ, USA, 2007.
38. Central Arizona Project Homepage. http://www.cap-az.com/operations/allocations/ (accessed on
20 September 2009).
39. Peach, J.; Williams, J. Population Dynamics of the U.S.-Mexican Border Region. In SCERP
Monograph; SCERP/SDSU Press: San Diego, CA, USA, 2003, unpublished; Available online:
http://www.scerp.org/population.htm (accessed on 6 July 2010).

Sustainability 2010, 2
2067
40. Scott, C.A.; Megdal, S.; Oroz, L.A.; Callegary, J.; Vandervoet, P. Assessment of united
States–México transboundary aquifers facing climate change and growth in urban water demand.
Climate Res. 2010, submitted.
41. Stromberg, J.C. Fremont cottonwood-goodding willow riparian forests: A review of their ecology,
threats, and recovery potential. J. Ariz.-Nev. Acad. Sci. 1993, 26, 97–110.
42. Scott, M.L.; Shafroth, P.B.; Auble, G.T. Responses of riparian cottonwoods to alluvial water table
declines. Environ. Manage. 1999, 23, 347–358.
43. Patten, D.T.; Marler, R.J.; Stromberg, J.C. Assessment of the Role of Effluent-Dominated Rivers in
Supporting Riparian Functions; Arizona Water Protection Fund Final Report #95–010WP;
Arizona State University: Tempe, AZ, USA, 1998.
44. Marler, R.J.; Stromberg, J.C.; Patten, D.T. Growth response of Populus fremontii, Salix
gooddingii, and Tamarix ramosissima seedlings under different nitrogen and phosphorus
concentrations. J. Arid Environ. 2001, 49, 133–146.
45. Brooks, B.W.; Riley, T.M.; Taylor, R.D. Water quality of effluent-dominated ecosystems:
Ecotoxicological, hydrological, and management considerations. Hydrobiologia 2006, 556,
365–379.
46. Treese, S.; Meixner, T.; Hogan, J.F. Clogging of an effluent dominated semiarid river:
A conceptual model of stream-aquifer interactions. JAWRA 2009, 45, 1047–1062.
47. City of Tucson; Available online: http://www.ci.tucson.az.us/agdocs/20081014/oct14-08-564a.pdf
(accessed on 6 July 2010).
48. City of Portland Bureau of Planning and Sustainability. Rainwater Harvesting; Available online:
http://www.portlandonline.com/bps/index.cfm?c=ecbbd&a=bbehfa (accessed on 6 July 2010).
49. Fontaine, J.J.; van Riper, C., III. A Neotropical Migrant Bird‘S Dilemma—Where to Stop for a
Good Meal; U.S. Geological Survey Factsheet 2009; Available online: http://pubs.usgs.gov/fs/
2009/30xx/ (accessed on 6 July 2010).
50. King, K.A.; Zaun, B.J.; Velasco, A.L. Contaminants as a Limiting Factor of Fish and Wildlife
Populations in the Santa Cruz River, Arizona; U.S. Fish and Wildlife Service, Region 2
Contaminants Program; U.S. Fish and Wildlife Service: Phoenix, AZ, USA, 1999.
51. Norman, L.M.; Guertin, D.P.; Feller, M. A coupled-model approach to reduce nonpoint source
pollution resulting from predicted urban growth: A case study in the ambos nogales watershed.
J. Urban Geogr. 2008, 29, 496–516.
52. Norman, L.M.; Feller, M.; Guertin, D.P. Forecasts of Cross-border Urban Growth Using the
SLEUTH Model; Ambos Nogales Watershed, United States-Mexican Border. Comput. Environ.
Urban Syst. 2009, 33, 150–159.
53. Brown, C. Binational Watershed Councils as Instruments for Conflict Resolution in the Upper
Santa Cruz Watershed; Udall Center Publications: Tucson, AZ, USA, 2002.
54. Smith, W. The Effects of Eastern North Pacific Tropical Cyclones on the Southwestern United
States; NOAA Technical Memorandum NWS-WR-197; National Weather: Tucson, AZ,
USA, 1986.
55. Hirschboeck, K.K. Climate and Floods. National Water Summary 1988–1989—Hydrologic
Events and Floods and Droughts; U.S. Geological Survey Water Supply Paper 2375; USGS:
Reston, VA, USA, 1991; pp. 67–88.
Sustainability 2010, 2
2068
56. McDonald, J.E. Variability of Precipitation in an Arid Region: A Survey of Characteristics for
Arizona; Technical Reports on the Meteorology and Climatology of Arid Regions No. 1; Institute
of Atmospheric Physics, University of Arizona: Tucson, AZ, USA, 1956.
57. Hirschboeck, K.K. Respecting the Drainage Divide; Water Resources Update #126; UCOWR:
Carbondale, IL, USA, 2003; Available online: http://www.ucowr.siu.edu/updates/126/index.html
(accessed on 6 July 2010).
58. Hirschboeck, K.K. Flood hydroclimatology. In Flood Geomorphology; Baker, V.R., Kochel, R.C.,
Patton, P.C., Eds.; John Wiley & Sons: New York, NY, USA, 1988; pp. 27–49.
59. Webb, R.H.; Betancourt, J.L. Climatic Variability and Flood Frequency of the Santa Cruz River,
Pima County, Arizona; U.S. Geological Survey Open-File Report 90–553; U.S. Geological
Survey: Denver, CO, USA, 1990.
60. Serrat-Capdevila, A.; Valdes, J.B.; Gonxalez, Baird, K.; Mata, L.J.; Maddock, T. Modeling
climate change impacts—And uncertainty—On the hydrology of a riparian system: The San
Pedro basin (Arizona/Sonora). J. Hydrol. 2007, 347, 48–66.
61. The Border Environmental Health Initiative: Investigation of the Transboundary Upper Santa
Cruz Basin; Available online: http://borderhealth.cr.usgs.gov/PDFs/WR-website.pdf (accessed on
6 July 2010).
62. Patz, J.A.; Balbus, J.M. Methods for assessing public health vulnerability to climate change.
Climate Res. 1996, 6, 113–125.
63. Liverman, D.; Merideth, R.; Holdsworth, A.; Cervera, L.; Lara, F. An Assessment of the Water
Resources in the San Pedro River and SCR Basins, Arizona and Sonora; A Report to the
Commission on Environmental Cooperation, Montreal, Quebec; Latin American Area Center and
Udall Center for Studies in Public Policy, the University of Arizona: Tucson, AZ, USA , 1997.
64. Donelson, A.J. Social Networks, Poverty and Development: An Analysis of Capacity Building in
Arizona and New Mexico Colonias; Ph.D. Thesis; Department of Geography and Regional
Development, University of Arizona: Tucson, AZ, USA, 2005.
65. U.S. Department of Housing and Urban Development. Delivering Results to Colonias and
Farmworkers, 2005; Available online: http://www.HUD.gov (accessed on 6 July 2010).
66. Norman, L.M.; Parcher, J.W.; Lam, A.H. Monitoring Colonias along the U.S.-Mexico Border;
U.S. Geological Survey Fact Sheet 2004–3070; USGS: Reston, VA, USA, 2004; Available online:
http://erg.usgs.gov/isb/pubs/factsheets/fs307004.html (accessed on 6 July 2010).
67. Herzog, L. Where North Meets South: Cities, Space and Politics on the U.S. Mexico Border;
Center for Mexican-American Studies: Austin, TX, USA, 1990.
68. Norman, L.M.; Donelson, A.; Pfeifer, E.; Lam, A.H. Colonia Development and Land Use Change
in Ambos Nogales, United States-Mexican Border; U.S. Geological Survey Open File Report
2006–1112; USGS: Reston, VA, USA, 2006; Available online: http://pubs.usgs.gov/of/2006/1112
(accessed on 6 July 2010).
69. Presidential Documents. Federal Register 1994, 59, No. 32; Available online:
http://www.dotcr.ost.dot.gov/documents/ycr/eo12898.pdf (accessed on 6 July 2010).
70. Real People, Real Environments, and Realistic Economics; Available online:
http://www.e3network.org (accessed on 6 July 2010).

Sustainability 2010, 2
2069
71. Moda, M.A. A Critical Review of Current EJ Research: Where Do We Go from Here;
Master Thesis; Clark University: Worcester, MA, USA, 2007, submitted; Available online:
https://www.clarku.edu/departments/idce/docs/Moda_2007.pdf (accessed on 6 July 2010).
72. U.S. Environmental Protection Agency. Region 9: Water Program, Watershed Priorities;
Available online: http://www.epa.gov/region09/water/watershed/santacruz.html (accessed on 6
July 2010).
73. Arnold, J.; Williams, A.; Srinivasan, R.; King, B.; Griggs A. SWAT, Soil and Water Assessment
Tool; USDA-ARS: Temple, TX, USA, 1994.
74. USGS. Digital Animal-Habitat models for the Southwestern United States, Version 1.0.; National
Gap Analysis Program; Center for Applied Spatial Ecology, New Mexico Cooperative Fish and
Wildlife Research Unit, New Mexico State University: Las Cruces, NM, 2007.
75. Esparza, A.; Waldorf, B.; Chavez, J. Localized effects of globalization: The case of Ciudad Juárez,
Chihuahua, Mexico. Urban Geogr. 2004, 25, 120–138.
76. Lara-Valencia, F.; Declet-Barreto, J.; Keys, E. Spatial equity and transportation hazard along
cross-border trade corridors: The case of Ambos Nogales. J. Borderl. Stud. 2008, 23, 1–18.
77. Bark-Hodgins R.H.; Colby, B.G. An Economic Assessment of the Sonoran Desert Conservation
Plan. Natur. Resour. J. 2006, 46, 709–725.
78. Bark-Hodgins, R.; Osgood, D.; Colby, B. Remotely sensed proxies for environmental amenities in
hedonic analysis: What does green mean? In Environmental Valuation: Intraregional and
Interregional Perspectives; Carruthers, J.I., Mundy, B., Eds.; Ashgate: Surrey, UK, 2008.
79. Bourne, K.L. The Effect of the Santa Cruz Riparian Corridor on Single Family Home Prices
Using the Hedonic Pricing Method; Master Thesis; The University of Arizona: Tucson, AZ,
USA, 2007.
© 2010 by the authors; licensee MDPI, Basel, Switzerland. This article is an Open Access article
distributed under the terms and conditions of the Creative Commons Attribution license
(http://creativecommons.org/licenses/by/3.0/).
Recommended