ORIGINAL RESEARCH
Detection of intraneural needle-placement with multiplefrequency bioimpedance monitoring: a novel method
Havard Kalvøy1 • Axel R. Sauter2
Received: 1 November 2014 / Accepted: 17 April 2015 / Published online: 23 April 2015
� The Author(s) 2015. This article is published with open access at Springerlink.com
Abstract Electrical impedance measurements have been
used to detect intraneural needle placement, but there is
still a lack of precision with this method. The purpose of
the study was to develop a method for the discrimination of
nerve tissue from other tissue types based on multiple
frequency impedance measurements. Impedance measure-
ments with 25 different frequencies between 1.26 and
398 kHz were obtained in eight pigs while placing the tip
of a stimulation needle within the sciatic nerve and in other
tissues. Various impedance variables and measurement
frequencies were tested for tissue discrimination. Best tis-
sue discrimination was obtained by using three different
impedance parameters with optimal measurement fre-
quencies: Modulus (126 kHz), Phase angle (40 kHz) and
the Delta of the phase angle (between 126 and 158 kHz).
These variables were combined in a Compound variable C.
The area under the curve in a receiver operating charac-
teristic was consecutively increased for the Modulus
(78 %), Phase angle (86 %), Delta of the phase angle
(94 %), and the Compound variable C (97 %), indicating
highest specificity and sensitivity for C. An algorithm
based on C was implemented in a real-time feasibility test
and used in an additional test animal to demonstrate our
new method. Discrimination between nerve tissue and
other tissue types was improved by combining several
impedance variables at multiple measurement frequencies.
Keywords Bioimpedance � Monitoring � Needle � Nerve �Nerve stimulation � Regional anaesthesia
1 Introduction
Nerve injuries related to peripheral nerve blocks can be
caused by toxicity of the injected solution or by mechanical
nerve damage. In the worst cases, nerve damage can lead to
persistent motor or sensory impairment and debilitating
neuropathic pain [1, 2]. Thus, it is highly important to avoid
such iatrogenic injuries. Penetration of a nerve alone does
not necessarily lead to lasting damage unless local anaes-
thetic is injected within the nerve fascicle [3]. Hence, if
intraneural needle placement is identified in time, the needle
could be withdrawn and nerve injury can be avoided. Ul-
trasound guidance [4], electrical nerve stimulation [5–7],
and injection pressure measurements [8, 9] are used to re-
duce the risk of intraneural needle placement and injection.
A combination of these methods is recommended to reduce
the risk of intraneural needle placement and injection when
peripheral nerve blocks are performed [10]. However, the
reliability of these methods to reduce the incidence of nerve
injuries has not been demonstrated [11].
Impedance is a measure of the opposition of the flow of
alternating current (AC) similar to the resistance of a
conductor to direct current (DC). Impedance is given as a
complex number that can be described as a vector in a
complex plane defined by the Modulus and the Phase
Angle, unlike resistance in a DC circuit that has only a
magnitude which is expressed by a single value [12]. The
Electronic supplementary material The online version of thisarticle (doi:10.1007/s10877-015-9698-3) contains supplementarymaterial, which is available to authorized users.
& Axel R. Sauter
1 Department of Clinical and Biomedical Engineering,
Oslo University Hospital Rikshospitalet, Oslo, Norway
2 Division of Emergencies and Critical Care, Department of
Anaesthesiology, Oslo University Hospital Rikshospitalet,
Oslo, Norway
123
J Clin Monit Comput (2016) 30:185–192
DOI 10.1007/s10877-015-9698-3
Modulus is the ratio of the voltage amplitude to the current
amplitude and is given in ohms. The Modulus defines the
length of a vector in the complex impedance plane. The
Phase Angle reflects the phase shift by which the current
delays behind the applied voltage and is given in degrees.
The Phase angle defines the direction of the vector in the
impedance plane. All biological impedance variables de-
pend on the frequency of the applied measurement signal.
Electrical bioimpedance in a needle-electrode circuit has
been measured in an animal model and in clinical studies to
detect placement of the block needle within a nerve [13,
14]. The bioimpedance was measured as an absolute value
obtained with a square pulse from an electrical nerve
stimulator. Advancing the needle through tissue types with
different electrical conductivity can give a rise or fall in the
measured impedance. Until now, sufficient discrimination
of a nerve from other tissue types has not been obtained
using such absolute impedance measurements.
In the present study, bioimpedance measurements were
made with multiple frequencies as described in a previous
publication [15]. The complex impedance data set was
examined for tissue specific patterns. Our hypothesis was
that the specific curve shapes obtained by plotting the
impedance variables as a function of the frequencies could
be used as a specific ‘‘fingerprint’’ to reliably identify and
discriminate nerve tissue from other tissue types.
2 Materials and methods
After institutional animal care committee approval
(ID 5143) nine pigs were supplied for this study by the
Center for Comparative Medicine (Oslo University
Hospital, Rikshospitalet, Oslo, Norway). General anesthe-
sia with endotracheal intubation was administered with
fentanyl and isoflurane after premedication with ketamin,
azaperone, and atropin.
We used an ATL HDI 5000 ultrasound unit with a L12-5
transducer (ATL, Bothell, Washington, USA) to visualize
the left sciatic nerve in an oblique axis below the biceps
femoris muscle. The unilateral setup was due to a con-
secutive study that was scheduled for the same test animals
after bioimpedance measurements were performed. A
100 mm, 21-gauge insulated needle with a 30� bevel
(Stimuplex� A; B. Braun, Melsungen, Germany) was used
without fluid priming. The needle was advanced from an-
terolateral to posteromedial under in-plane ultrasound
guidance until the needle-tip was positioned within the
epineurium of the sciatic nerve.
A nerve stimulator (Stimuplex� HNS 12; B. Braun,
Melsungen, Germany) was connected to the needle and a
gel reference electrode (Blue Sensor, Q-00-A, Ag/AgCl,
Ambu Medicotest A/S, Denmark) on the skin. The current
threshold needed to obtain a neuromuscular response was
established starting at 0 mA and gradually increasing the
current (2 Hz frequency, 0.1 ms impulse width). The nerve
stimulator was removed and a Solartron complex impe-
dance measurement system (SI 1260 and SI 1294, So-
lartron Group PLC, Hampshire, UK) was connected for
3-electrode impedance measurements. The needle was
connected as the measuring electrode and two skin elec-
trodes were attached to the skin of the lower abdomen for
use as indifferent electrodes. A 50 mV excitation signal
was driven by the Solartron 1294 between the needle and
one of the skin electrodes, and the resultant potential was
measured between the needle and the other skin electrode.
This 3-electrode setup, and the large differences in elec-
trode area between the needle and the skin electrodes,
ensured a unipolar impedance measurement totally
dominated by the needle and the tissue adjacent to its tip
[16]. Impedance as function of frequency was obtained by
sweeping the excitation frequency in 25 logarithmically
distributed steps from 1.26 to 398 kHz.
The needle-tip was then placed in a second, third and
fourth position within the epineurium of the nerve and
bioimpedance measurements were repeated. The needle
was withdrawn from the nerve and placed in four different
paraneural positions, defined by visualisation of the needle-
tip between the hypoechoic tissue of the biceps femoris
muscle and the hyperechoic sciatic nerve and surrounding
connective tissue layers. Thereafter the needle was placed
in four positions within the biceps femoris muscle and in
four positions within the subcutaneous fat. Impedance as
function of frequency was measured for each needle po-
sition. Figure 1 gives an illustration of the study setup.
2.1 Processing of data and statistics
All the statistical analyses were conducted in R (Team
2010) for MAC [17]. The impedance values (Modulus and
Phase angle) were plotted graphically for visual interpre-
tation to assemble characteristic properties from the mea-
sured data set for defined frequency ranges. Descriptive
statistics including principal component analysis (PCA)
were used to illustrate variances and compare the mea-
surements in order to identify tissue specific differences.
The information in the PCA plots was used to derive two
new variables: The Delta of the phase angle was defined as
the difference in measured phase angles between two
consecutive measurement frequencies; The Compound
variable C was derived by manual identification of tissue
specific patterns in the PCA plots. One-Way ANOVA was
used to evaluate the mean differences between tissue types
versus intraneural (Holm–Sidak for assumed normal dis-
tribution, and Kruskal–Walis if normal distribution could
not be assumed from a Shapiro–Wilk normality test).
186 J Clin Monit Comput (2016) 30:185–192
123

A receiver operating characteristic curve (ROC) was a
final test and comparison of the tissue discrimination
variables, where the area under the curve (AUC) was used
as an indicator of how well a variable can distinguish be-
tween nerve tissue and other tissue types. For the Modulus,
Phase angle, and Delta we defined the mean value in in-
traneural tissue as the starting point with zero positive
classification (‘‘true positive’’ = 0 and ‘‘false posi-
tive’’ = 0, in the plot). The cut off range was then extended
by moving the upper and lower cut off values in steps of
5 %, until all the values in the total data set were included
at 100 %. C was normalized to zero at the intraneural mean
value. Hence, zero was used as the starting point for C. The
cut of range for C was extended by increasing the value by
adding 5 %.
To demonstrate the feasibility of the method in a real-
time clinical device an algorithm based on the best vari-
ables was used in a generic impedance measurement (PXI
platform, National Instruments Corportion, Austin, TX and
Solartron SI 1294). The feasibility test was performed in
the ninth test animal.
3 Results
The sciatic nerve and surrounding anatomy was identified
unilaterally in eight 3 months old pigs (24–30 kg, 4 female
and 4 male). Current thresholds for a distal muscle re-
sponse ranged from 0.04 to 0.28 mA when the needle was
placed within the sciatic nerve. 128 datasets from
bioimpedance measurements in a frequency range from
1.26 to 398 kHz were obtained when the needle-tips were
either placed intraepineurally, paraneurally, within muscle
tissue, or in subcutaneous fat. 17 of these datasets were
excluded as missing data because of contact failure in the
needle connection lead or disturbance of the measurement
setup.
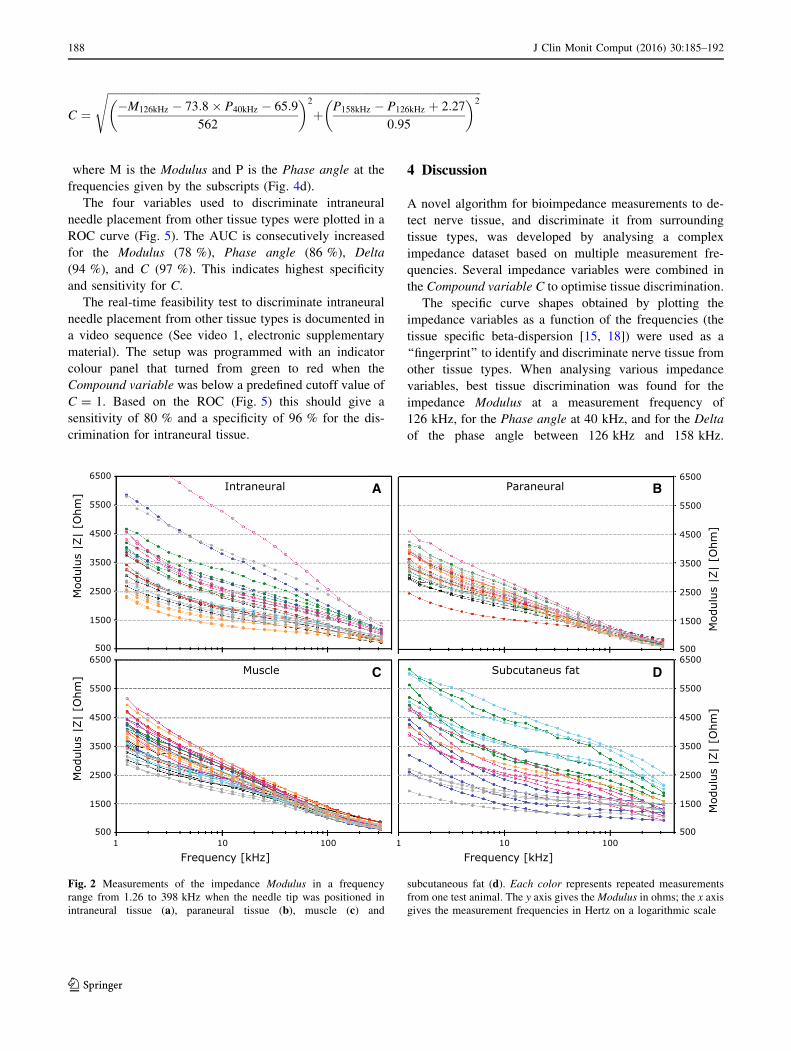
Figures 2 and 3 show how the measured bioimpedance
changes as a function of the applied frequencies. With
visual assessment, a noticeable decrease in the modulus
above 20 kHz can be seen for muscle and paraneural tissue
in Fig. 2b, c. This corresponds to a distinct increase in the
phase angle in Fig. 3b, c that reaches its peak value be-
tween 100 and 200 kHz. A similar pattern was found for
the intraneural measurement, but in a higher frequency
range. The decease in the modulus and the corresponding
increase in phase angle are found above 60 kHz (Figs. 2a,
3a).
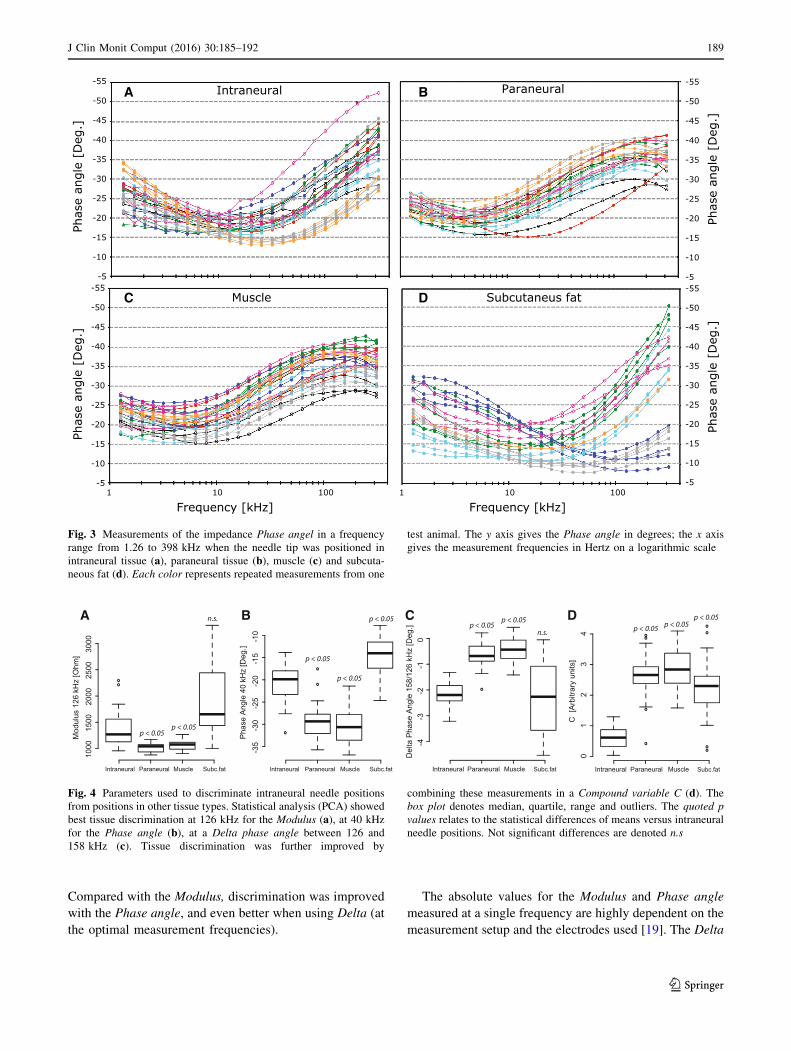
PCA plots of the data obtained with each of the 25
measurement frequencies showed best discrimination be-
tween intraneural tissue and the other tissue types at
126 kHz for the modulus (Fig. 4a) and at 40 kHz for the
phase angle (Fig. 4b). For the Delta phase angle (defined as
the difference in measured phase angles between two
consecutive measurement frequencies) best results were
obtained between 126 and 158 kHz (Fig. 4c). The tissue
discrimination could further be improved when combining
Modulus, Phase angel and Delta (at the given frequencies)
in a Compound variable C, according to the following
equation:
Fig. 1 Study setup: The tip of a stimulation needle was placed under
ultrasound guidance within the sciatic nerve and other tissue types
(a and b). An impedance measurement system (Solartron 1260 and SI
1294) was connected for 3-electrode impedance measurements (c).
Impedance as function of frequency was obtained by sweeping the
excitation frequency in 25 logarithmically distributed steps from 1.26
to 398 kHz
J Clin Monit Comput (2016) 30:185–192 187
123
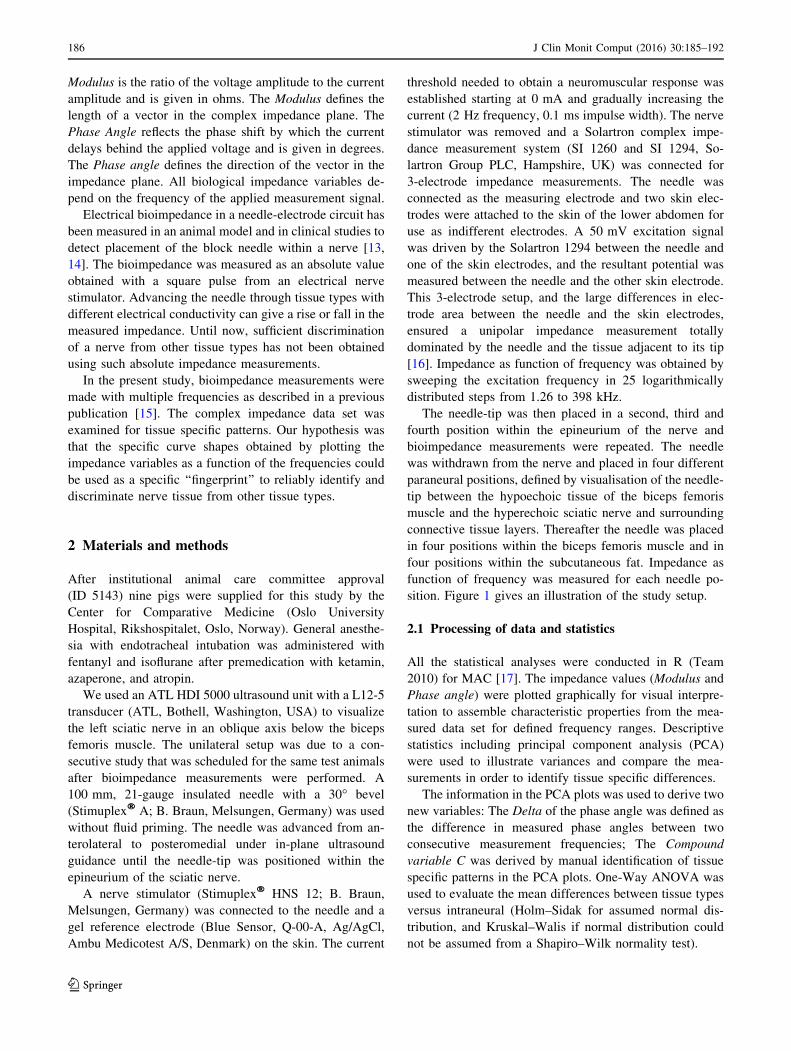
where M is the Modulus and P is the Phase angle at the
frequencies given by the subscripts (Fig. 4d).
The four variables used to discriminate intraneural
needle placement from other tissue types were plotted in a
ROC curve (Fig. 5). The AUC is consecutively increased
for the Modulus (78 %), Phase angle (86 %), Delta
(94 %), and C (97 %). This indicates highest specificity
and sensitivity for C.
The real-time feasibility test to discriminate intraneural
needle placement from other tissue types is documented in
a video sequence (See video 1, electronic supplementary
material). The setup was programmed with an indicator
colour panel that turned from green to red when the
Compound variable was below a predefined cutoff value of
C = 1. Based on the ROC (Fig. 5) this should give a
sensitivity of 80 % and a specificity of 96 % for the dis-
crimination for intraneural tissue.
4 Discussion
A novel algorithm for bioimpedance measurements to de-
tect nerve tissue, and discriminate it from surrounding
tissue types, was developed by analysing a complex
impedance dataset based on multiple measurement fre-
quencies. Several impedance variables were combined in
the Compound variable C to optimise tissue discrimination.
The specific curve shapes obtained by plotting the
impedance variables as a function of the frequencies (the
tissue specific beta-dispersion [15, 18]) were used as a
‘‘fingerprint’’ to identify and discriminate nerve tissue from
other tissue types. When analysing various impedance
variables, best tissue discrimination was found for the
impedance Modulus at a measurement frequency of
126 kHz, for the Phase angle at 40 kHz, and for the Delta
of the phase angle between 126 kHz and 158 kHz.
500
1500
2500
3500
4500
5500
6500 Intraneural Paraneural
500
1500
2500
3500
4500
5500
6500 Muscle Subcutaneus fat
Mod
ulus
|Z|
[Ohm
] D
B
C
A
Mod
ulus
|Z|
[Ohm
]
Mod
ulus
|Z|
[Ohm
]
500
1500
2500
3500
4500
5500
6500
500
1500
2500
3500
4500
5500
6500
Mod
ulus
|Z|
[Ohm
]
100101 100101
Frequency [kHz]Frequency [kHz]
Fig. 2 Measurements of the impedance Modulus in a frequency
range from 1.26 to 398 kHz when the needle tip was positioned in
intraneural tissue (a), paraneural tissue (b), muscle (c) and
subcutaneous fat (d). Each color represents repeated measurements
from one test animal. The y axis gives theModulus in ohms; the x axis
gives the measurement frequencies in Hertz on a logarithmic scale
C ¼
ffiffiffiffiffiffiffiffiffiffiffiffiffiffiffiffiffiffiffiffiffiffiffiffiffiffiffiffiffiffiffiffiffiffiffiffiffiffiffiffiffiffiffiffiffiffiffiffiffiffiffiffiffiffiffiffiffiffiffiffiffiffiffiffiffiffiffiffiffiffiffiffiffiffiffiffiffiffiffiffiffiffiffiffiffiffiffiffiffiffiffiffiffiffiffiffiffiffiffiffiffiffiffiffiffiffiffiffiffiffiffiffiffiffiffiffiffiffiffiffiffiffiffiffiffiffiffiffiffiffiffiffiffiffiffi
�M126kHz � 73:8� P40kHz � 65:9
562
� �2
þ P158kHz � P126kHz þ 2:27
0:95
� �2s
188 J Clin Monit Comput (2016) 30:185–192
123
Compared with the Modulus, discrimination was improved
with the Phase angle, and even better when using Delta (at
the optimal measurement frequencies).
The absolute values for the Modulus and Phase angle
measured at a single frequency are highly dependent on the
measurement setup and the electrodes used [19]. The Delta
-55
-50
-45
-40
-35
-30
-25
-20
-15
-10
-5 100101
-55
-50
-45
-40
-35
-30
-25
-20
-15
-10
-5
Phas
e an
gle
[Deg
.]
100101
Frequency [kHz]
-55
-50
-45
-40
-35
-30
-25
-20
-15
-10
-5
Phas
e an
gle
[Deg
.]
-55
-50
-45
-40
-35
-30
-25
-20
-15
-10
-5
Phas
e an
gle
[Deg
.]
Phas
e an
gle
[Deg
.]
Frequency [kHz]
Intraneural Paraneural
Subcutaneus fatMuscle D
B
C
A
Fig. 3 Measurements of the impedance Phase angel in a frequency
range from 1.26 to 398 kHz when the needle tip was positioned in
intraneural tissue (a), paraneural tissue (b), muscle (c) and subcuta-
neous fat (d). Each color represents repeated measurements from one
test animal. The y axis gives the Phase angle in degrees; the x axis
gives the measurement frequencies in Hertz on a logarithmic scale
Subc.fatIntraneural MuscleParaneural
-35
-30
-25
-20
-15
-10
Pha
se A
ngle
40
kHz
[Deg
.]
C [
Arb
itrar
y un
its]
Subc.fatIntraneural MuscleParaneural
1000
1500
2000
2500
3000
Mod
ulus
126
kH
z [O
hm]
CBA
Subc.fatIntraneural MuscleParaneural
-4-3
-2-1
0D
elta
Pha
se A
ngle
158
/126
kH
z [D
eg.]
D
Subc.fatIntraneural MuscleParaneural
01
23
4
n.s.
n.s.
p < 0.05
p < 0.05
p < 0.05
p < 0.05p < 0.05
p < 0.05p < 0.05
p < 0.05 p < 0.05p < 0.05
Fig. 4 Parameters used to discriminate intraneural needle positions
from positions in other tissue types. Statistical analysis (PCA) showed
best tissue discrimination at 126 kHz for the Modulus (a), at 40 kHz
for the Phase angle (b), at a Delta phase angle between 126 and
158 kHz (c). Tissue discrimination was further improved by
combining these measurements in a Compound variable C (d). Thebox plot denotes median, quartile, range and outliers. The quoted p
values relates to the statistical differences of means versus intraneural
needle positions. Not significant differences are denoted n.s
J Clin Monit Comput (2016) 30:185–192 189
123

is mainly based on the specific curve shape and is less
vulnerable to inconstancies. Combining these measure-
ments in the variable C made the discrimination even more
robust.
Our study has several limitations. First, our measure-
ments were obtained in an exploratory animal study and
refer only to the sciatic nerve in pigs. Comparisons by
Gabriel (28) shows that the impedance properties of animal
tissues are comparable to human tissues, and that the var-
iations within a species may well exceed variations be-
tween species. The differences they found between human
and animal species were not systematic. At the present
time, comparable data for peripheral nerves are not
available.
Different peripheral nerves might have different con-
ductive properties. It must be emphasised that the sciatic
nerve is formed by to independent nerve structures, a tibial
and a peroneal component that are surrounded by a distinct
connective tissue layer [20]. Marked differences in neural
architecture and the size of surrounding adipose tissue
compartments have been demonstrated between proximal
and distal parts of peripheral nerves in humans [21]. The
proportion of connective tissue in the course of a peripheral
nerve may range from 30 to 75 % [22]. Thus altered fre-
quency dependent impedance patterns might not only be
found between different nerves, but also within the dif-
ferent measurement positions in a single nerve. It might
therefore be necessary to modify our present algorithm
when data from humans and from other nerves are avail-
able. Another possibility would be to use multiple specific
algorithms depending on the anatomical site. Further,
clinical studies must confirm that our results are applicable
in humans.
The stimulation needle was placed in multiple positions
within the sciatic nerve. Repeated needle advancements
might change the conductive properties of the nerve. This
was not the case in our study. No statistical correlation for
repeated measurements was found in our data.
In our study the needles were not primed with fluid. For
the Stimuplex� A needles, most of the electrical contact
between tissue and the needle is obtained on the bevel
surface. When the needle is filled with conductive solutions
the distal part of the needle cavity will contribute to current
conduction. However, body fluids will also pass into the
needle during block procedures. This can alter the impe-
dance in the cavity for both primed and unprimed needles.
Ideally, block needles could be optimized for impedance
measurements by isolating its cavity surface (in addition to
the outer surface) to reduce variations in the electrode area
caused by different fluid contents.
Ultrasound is known as an observer-dependent method;
the identification of anatomical structures and estimation of
the position of the needle-tip have a subjective component.
To insure true intraneural needle positions we chose a large
nerve that was easy to identify and to access. With an in-
plane needle approach we aimed for a central position of
the needle-tip in the middle of the nerve. When placing the
needle in the paraneural tissue, indentation of the nerve
wall was avoided. Intraneural injections to confirm needle
positions by a typical spread of the injectate [23] were not
performed because we did not want to affect the native
electrical properties of the tissue or alter impedance in
consecutive measurements by performing injections.
Hence, we cannot exclude errors despite subjectively
adequate ultrasound visualisation and the low current
thresholds that were found for the intraneural needle
positions.
Even though highly clinically relevant, we could not
specify whether the needle was placed within the neural
fascicles or in the surrounding perineurium. Neither did we
investigate needle positions in transition from the extra- to
the intra-epineural space. To identify needle position
within smaller structures or compartments in our porcine
model, nerves might have to be surgically exposed. How-
ever, we don’t expect reliable and representative bioim-
pedance patterns after removing the paraneural tissue from
the nerve as the current path and the electrical field would
be changed or impeded [12]. The lack of differentiation
between intraneural structures is a major limitation of our
study.
0
10
20
30
40
50
60
70
80
90
100%
0 10 20 30 40 50 60 70 80 90 100%
Modulus 126 kHzPhase Angle 40 kHzDelta Phase Angle 158/126 kHzC
100 % – Specificity
1
Fig. 5 Receiver operating characteristic curve (ROC) for the four
parameters used to discriminate intraneural needle placement from
other tissue types. True positive values (sensitivity) and False positive
values (100 %� specificity) are plotted while increasing cutoff in
steps of 5 % from the lowest to the highest values. The area under the
curve (AUC) is consecutively increasing for the Modulus (78 %),
Phase angle (86 %), Delta (94 %) and the Compound variable C
(97 %). Best specificity and sensitivity can be obtained by using the
compound parameter C. The predefined cutoff value C equals 1 that
was used for our prototype (See video 1, electronic supplementary
material) is labeled with (1)
190 J Clin Monit Comput (2016) 30:185–192
123

Our measurements show distinct patterns for subcuta-
neous fat, muscle, and intraneural tissue. The results ob-
tained from the paraneural needle positions were almost
identical to the measurements in muscle, as can be seen in
Figs. 2, 3 and 4. This is probably caused by the conductive
properties from muscle tissue surrounding the sciatic nerve,
that dominate the bioimpedance measurements in the
paraneural positions. In our porcine study, it was difficult
to distinguish between epineurium and surrounding con-
nective tissue layers. Hence, our porcine model is not ap-
propriate to investigate close needle-to-nerve contact.
Detection of nerve contact at an early stage before the
needle is penetrating the epineurium is clinically important
and must be addressed in future studies.
Temperature and fluid status in the tissue can be con-
founding variables in bioimpedance measurements. Tem-
perature coefficients for body tissues are unlikely to exceed
1–2 % per �C, and are most significant at low frequencies
[24]. Fluid changes of 1.5 L in healthy volunteers are
shown to give 4–5 % alteration in single frequency
bioimpedance measurements [25]. These changes are
relatively low compared to the natural variation of impe-
dance in biological tissue types. Hence, within a clinical
range of temperature and fluid status, we expect these
factors to have minimal confounding for our multiple fre-
quency algorithm.
In the present study, a controlled potential of 50 mV
was used to ensure a low current density. This should give
a linear relationship between current and potential. High
current density, on the other hand, could lead to a nonlinear
behaviour of the measurement setup and irreproducible
results [12, 26].
Whereas our measurements were based on defined sine
wave frequencies, others have used a square pulse signal
(obtained from an electrical nerve stimulator) for bioim-
pedance measurements. Tsui et al. [14] performed bioim-
pedance measurements in pigs and found a higher
impedance intraneurally compared with the extraneural
muscle tissue. Bardou et al. [13] measured bioimpedance in
140 peripheral nerve blocks. When nerve puncture was
suspected in 21 of these cases, a relative increase of
impedance was typically found. However, an alteration of
absolute impedance might also be found when the needle
tip is moved into other tissue types with a low electrical
conductivity. When comparing needle positions in muscle
tissue with a needle placement in fat or connective tissue in
a previous study, a 50 % increment of the measured
impedance was found [27].
According to Fourier’s theory, a square pulse represents
multiple frequencies. [12, 28] Impulses with a short dura-
tion can mainly be derived from high frequent sine waves;
in this case the electrical current can relatively easily pass
through the capacitive tissue membranes. Impulses, with a
long duration, as used for electrical nerve stimulation,
imply more low-frequency components; this causes biolo-
gical membranes to act like a fully charged capacitor that
will oppose the current flow and cause an increase in the
measured bioimpedance [18]. To obtain reproducible re-
sults, both the electrical current and impulse duration must
be kept constant when bioimpedance measurements are
performed with square pulse signals as in the study by
Bardou et al. [13]. However, our present study showed that
the AUC of 67 % obtained by Bardou et al. could be im-
proved to 97 % by introducing controlled frequency
measurement.
The method seems feasible for use in clinical practice to
perform continuous bioimpedance monitoring during pe-
ripheral nerve block performance. An algorithm based on
C was implemented in a generic impedance measurement
device and used in an additional animal test to confirm our
findings (See video 1, electronic supplementary material).
We anticipate that our method for tissue discrimination
might be implemented in a nerve stimulator. Multiple
frequency bioimpedance measurements could be made in
the pauses between stimulation pulses. Previous studies
have shown specific bioimpedance patterns for a variety of
organs and tissue types [29]. Bioimpedance has also been
used for the localization of blood vessels [30]. A clinical
measurement device could combine multiple algorithms;
not only to indicate an accidental intraepineural needle
position, but also to display other tissue types, or for in-
stance needle-placement within a blood vessel. A clinical
device for the identification of nerve tissue on the other
hand might not only be used for PNB. The field of appli-
cation could as well include procedures like radio- and
cryoablation to obtain a reliable identification of the target
nerves.
Electrical impedance measurements are used in numer-
ous clinical devices [12]. The measurement potential in our
study is only 0.05 V, which is very small compared to
commercially available nerve stimulators, that are capable
to deliver pulses up to 90 V. Hence, an impedance mea-
surement device based on our algorithm could pass ap-
proval formalities for clinical use in human subjects as long
as the equipment is manufactured according to electrical
safety regulations.
5 Conclusion
We have developed a novel algorithm based on complex
impedance measurements at multiple frequencies, and de-
fined sine wave excitation, which is able to discriminate
needle positions in nerve tissue from other tissue types.
Clinical studies in humans are needed to confirm our
results.
J Clin Monit Comput (2016) 30:185–192 191
123

Acknowledgments The authors would like to thank Professor
Ansgar O. Aasen and his staff at the Institute for Surgical Research,
Oslo University Hospital Rikshospitalet for laboratory facilitation and
support, and Professor Leiv Sandvik, Department of Biostatistics and
Epidemiology, Oslo University Hospital Ulleval, Norway for his as-
sistance with the statistical analyses.
Conflict of interest Havard Kalvøy and Axel R. Sauter have a
pending patent for a multiple frequency impedance method to de-
termine biological tissue type and to detect intraneural needle-
placement.
Ethical approval All applicable international, national, and/or in-
stitutional guidelines for the care and use of animals were followed.
All procedures performed in studies involving animals were in ac-
cordance with the ethical standards of the institution or practice at
which the studies were conducted.
Open Access This article is distributed under the terms of the
Creative Commons Attribution 4.0 International License (http://
creativecommons.org/licenses/by/4.0/), which permits unrestricted
use, distribution, and reproduction in any medium, provided you give
appropriate credit to the original author(s) and the source, provide a
link to the Creative Commons license, and indicate if changes were
made.
References
1. Borgeat A, Blumenthal S. Nerve injury and regional anaesthesia.
Curr Opin Anaesthesiol. 2004;17(5):417–21.
2. Borgeat A, Ekatodramis G, Kalberer F, Benz C. Acute and
nonacute complications associated with interscalene block and
shoulder surgery: a prospective study. Anesthesiology. 2001;
95(4):875–80.
3. Hogan QH. Pathophysiology of peripheral nerve injury during
regional anesthesia. Reg Anesth Pain Med. 2008;33(5):435–41.
4. Klaastad O, Sauter AR, Dodgson MS. Brachial plexus block with
or without ultrasound guidance. Curr Opin Anaesthesiol.
2009;22(5):655–60.
5. Voelckel WG, Klima G, Krismer AC, Haslinger C, Stadlbauer
KH, Wenzel V, von Goedecke A. Signs of inflammation after
sciatic nerve block in pigs. Anesth Analg. 2005;101(6):1844–6.
6. Chan VW, Brull R, McCartney CJ, Xu D, Abbas S, Shannon P.
An ultrasonographic and histological study of intraneural injec-
tion and electrical stimulation in pigs. Anesth Analg. 2007;
104(5):1281–4.
7. Bigeleisen PE, Moayeri N, Groen GJ. Extraneural versus intra-
neural stimulation thresholds during ultrasound-guided
supraclavicular block. Anesthesiology. 2009;110(6):1235–43.
8. Hadzic A, Dilberovic F, Shah S, Kulenovic A, Kapur E, Zaciragic
A, Cosovic E, Vuckovic I, Divanovic KA, Mornjakovic Z, Thys
DM, Santos AC. Combination of intraneural injection and high
injection pressure leads to fascicular injury and neurologic defi-
cits in dogs. Reg Anesth Pain Med. 2004;29(5):417–23.
9. Kapur E, Vuckovic I, Dilberovic F, Zaciragic A, Cosovic E,
Divanovic KA, Mornjakovic Z, Babic M, Borgeat A, Thys DM,
Hadzic A. Neurologic and histologic outcome after intraneural
injections of lidocaine in canine sciatic nerves. Acta Anaesthesiol
Scand. 2007;51(1):101–7.
10. Gadsden J, McCally C, Hadzic A. Monitoring during peripheral
nerve blockade. Curr Opin Anaesthesiol. 2010;23(5):656–61.
11. Wiesmann T, Borntrager A, Vassiliou T, Hadzic A, Wulf H,
Muller HH, Steinfeldt T. Minimal current intensity to elicit an
evoked motor response cannot discern between needle-nerve
contact and intraneural needle insertion. Anesth Analg. 2014;
118(3):681–6.
12. Grimnes S, Martinsen OG. Bioimpedance and bioelectricity ba-
sics. 2nd ed. San Diego: Academic Press; 2008.
13. Bardou P, Merle JC, Woillard JB, Nathan-Denizot N, Beaulieu P.
Electrical impedance to detect accidental nerve puncture during
ultrasound-guided peripheral nerve blocks. Can J Anaesth.
2012;60(3):253–8.
14. Tsui BC, Pillay JJ, Chu KT, Dillane D. Electrical impedance to
distinguish intraneural from extraneural needle placement in
porcine nerves during direct exposure and ultrasound guidance.
Anesthesiology. 2008;109(3):479–83.
15. Kalvøy H, Frich L, Grimnes S, Martinsen ØG, Hol PK, Stubhaug
A. Impedance-based tissue discrimination for needle guidance.
Physiol Meas. 2009;30(2):129.
16. Høyum P, Kalvøy H, Martinsen ØG, Grimnes S. A finite element
model of needle electrode spatial sensitivity. Physiol Meas.
2010;31(10):1369–79.
17. R Development Core Team. R: a language and environment for
statistical computing. Vienna: R Foundation for Statistical
Computing; 2010. http://www.R-project.org/.
18. Foster KR, Schwan HP. Dielectric properties of tissues and bio-
logical materials: a critical review. Crit Rev Biomed Eng.
1989;17(1):25–104.
19. Kalvøy H, Tronstad C, Nordbotten B, Grimnes S, Martinsen ØG.
Electrical impedance of stainless steel needle electrodes. Ann
Biomed Eng. 2010;38(7):2371–82.
20. Franco CD. Connective tissues associated with peripheral nerves.
Reg Anesth Pain Med. 2012;37(4):363–5.
21. Moayeri N, Bigeleisen PE, Groen GJ. Quantitative architecture of
the brachial plexus and surrounding compartments, and their
possible significance for plexus blocks. Anesthesiology. 2008;
108(2):299–304.
22. Sunderland S. The connective tissues of peripheral nerves. Brain.
1965;88(4):841–54.
23. Morau D, Levy F, Bringuier S, Biboulet P, Choquet O, Kassim
M, Bernard N, Capdevila X. Ultrasound-guided evaluation of the
local anesthetic spread parameters required for a rapid surgical
popliteal sciatic nerve block. Reg Anesth Pain Med. 2010;35(6):
559–64.
24. Gabriel C, Gabriel S, Corthout E. The dielectric properties of
biological tissues: I. Literature survey. Phys Med Biol.
1996;41(11):2231–49.
25. Gatterer H, Schenk K, Laninschegg L, Schlemmer P, Lukaski H,
Burtscher M. Bioimpedance identifies body fluid loss after ex-
ercise in the heat: a pilot study with body cooling. PLoS One.
2014;9(10):e109729.
26. Geddes LA, Da Costa CP, Wise G. The impedance of stainless-
steel electrodes. Med Biol Eng. 1971;9(5):511–21.
27. Sauter AR, Dodgson MS, Kalvøy H, Grimnes S, Stubhaug A,
Klaastad Ø. Current threshold for nerve stimulation depends on
electrical impedance of the tissue: a study of ultrasound-guided
electrical nerve stimulation of the median nerve. Anesth Analg.
2009;108(4):1338–43.
28. Kuo FF. Network analysis and synthesis. New York: Wiley;
1966.
29. Gabriel S, Lau R, Gabriel C. The dielectric properties of biolo-
gical tissues: II. Measurements in the frequency range 10 Hz to
20 GHz. Phys Med Biol. 1996;41(11):2251.
30. Martinsen ØG, Kalvøy H, Grimnes S, Nordbotten B, Hol PK,
Fosse E, Myklebust H, Becker LB. Invasive electrical impedance
tomography for blood vessel detection. Open Biomed Eng J.
2010;4:135–7.
192 J Clin Monit Comput (2016) 30:185–192
123
Recommended