DESIGN OF THE PRIMARY LIQUID-METAL PUMP OF THEMYRRHA RESEARCH REACTOR
L. Mueller - T. Verstraete - T. Arts
Turbomachinery and Propulsion Department, von Karman Institute for Fluid DynamicsSint-Genesius-Rode, Belgium
[email protected], [email protected], [email protected]
ABSTRACTThis paper presents the design of a liquid-metal pump for the primary cooling system of
the advanced nuclear reactor MYRRHA conceived by the Belgian research center (SCK·CEN).The focus of this report is on the rotor design of the pump, as the most crucial component of theentire machine especially regarding erosion.
The single stage axial-flow pump has been designed with the optimization algorithm devel-oped at the von Karman Institute for Fluid Dynamics (VKI) based on evolutionary methods.Two sequential optimization cycles have been applied to meet the required total head rise atdesign flow rate, while limiting the maximum velocity in the rotor tip section due to erosion.
In the preliminary design phase, the meridional flow path and rotational speed have beenassessed by a 1D-model in the hub, mid, and tip section of the rotor. The outcome of thisrather simple but very fast approach is a moderate specific speed, high hub-to-tip ratio rotor ofNs = 70 and Rhub/Rtip = 0.88, respectively. In the second design step, accurate 3D-Navier-Stokes computations have been performed to design and automatically optimize the entire pumpcomprising the inlet section, the rotor and stator blade rows, and the diffuser. The high fidelityCFD analysis has been assisted by an Artificial Neural Network (ANN) to accelerate the opti-mization and to reduce the computational cost.
NOMENCLATURELatinc chord β,βm relative flow angle, blade metal angleCp pressure coefficient ∆ delta/differenceD diameter η efficiencyg acceleration due to gravity θ circumferential componenth enthalpy µ dynamic viscosityH head ν hub-to-tip ratioN number of blades ρ densityNs specific speed σ solidityp pitch ω angular rotational speedP pressure φ flow coefficient (Eqn.16)Q flow rate ψ head coefficient (Eqn.14)R radius Subscripts and SuperscriptsReinlet inlet Reynolds number (Eqn.7) 0, ref reference quantitys meridional length 1 quantity upstream of the rotorU peripheral speed 2 quantity downstream of the rotorV absolute velocity hub,tip hub section, tip sectionW relative velocity hyd hydraulicGreek tot total quantityα absolute flow angle x, m axial, meridional
1
Proceedings of
10th European Conference on Turbomachinery Fluid dynamics & Thermodynamics
ETC10, April 15-19, 2013, Lappeenranta, Finland
OPEN ACCESS
Downloaded from www.euroturbo.eu Copyright © by the Authors

ANN Artificial Neural NetworkDE Differential EvolutionDOE Design Of ExperimentsMYRRHA Multi-purpose, HYbrid Research Reactor for High-technology ApplicationsObj ObjectivePS, SS Pressure Side, Suction SideRPM Revolutions Per Minute
INTRODUCTIONThe MYRRHA project initiated by the Belgian nuclear research center (SCK·CEN) is aimed at
constructing and operating a flexible fast spectrum experimental facility. It is conceived as an accel-erator driven system (ADS), able to operate in sub-critical and critical modes (SCKCEN, 2012) andwill allow the demonstration and performance assessment of the transmutation concept and associatedtechnologies starting in 2023.
The primary system of the MYRRHA research reactor is a pool-type design, as illustrated inFig. 1. All components of the primary loop, i.e. the pumps, heat exchangers, fuel handling tools,experimental rigs, etc., are inserted from the top and immerged in the reactor vessel, which is filledwith lead-bismuth eutectic (LBE) as primary coolant. The relatively high boiling temperature of LBEof 1670◦C leads to a passively safe design regarding a loss of coolant accident (LOCA), as it allowsthe operation without pressurizing the reactor even at high temperatures. However, the high densityof LBE of 10,000 kg/m3 adds additional restrictions to the primary pump. To avoid excessive erosioninside the pump, especially in the rotor tip section, the maximum relative velocity is limited to ratherlow values, e.g. pumps OKBM (2012) has developed for reactors using LBE operate at maximumvelocities of Wmax = 25 - 30 m/s.
Reducing the maximum velocity to limit erosion is an essential objective within the design taskof the pump. This will be accomplished using advanced evolutionary optimization methods.
Spallation loop
Primary pump (x2)
Heat exchanger (x4)
Diaphragm
Core plate
Fuel storage
Inner vessel
In-vessel fuel handling
Outer vessel
Rotor
Inlet
Stator
Outlet
Primary Pump
Figure 1: Schematic Assembly of the MYRRHA Reactor (SCKCEN, 2012) With a Close Up onthe Primary Pump (Dimensions Not to Scale)
2

Axial FlowMixed FlowFrancis VaneRadial Vane
Values of Specific Speeds
4020 60 80 100 200150
Figure 2: Specific Speed Chart
DESIGN PROCEDUREThe choice of the machine type (axial flow, mixed flow, or radial flow) is related to the design
requirements of the pump, i.e. to the flow rate Q and the total head ∆H. A classical parameter in theselection of hydraulic machinery is the specific speed
Ns =RPM
√Q
∆H3/4. (1)
Based on the design requirements of the MYRRHA pump provided by SCK·CEN the specificspeed is in the range of mixed to axial-flow pumps Ns ≈ 156 (see Fig. 2). Although towards lowerRPM a mixed-flow configuration might provide higher efficiency, an axial-flow pump is regarded asthe best trade-off solution due its lower mechanical complexity and simplified manufacturing.
The use of preliminary design tools in the design process is recommended as it allows evaluatingrapidly various design choices. Especially with regard to the erosion induced requirement of lowrelative velocity, it was decided to analyze various design options in this preliminary design phase.For that reason a simple one-dimensional model has been applied in the hub, mid, and tip section ofthe rotor to assess the meridional flow path and its rotational speed (Fig. 3, left). This rather simplemodel based on velocity triangles up- and downstream of the rotor blade allows a rapid screening ofseveral design parameters, such as blade angles, rotational speed (RPM), and hub and tip radii, Rhub
and Rtip, respectively. Although it does not include complex flow features, e.g. flow deviation or evenflow separation, it provides a good estimation of the initial rotor design as an input for the following3D-optimization.
Input parameters to the 3D-optimization are the hub and tip radii (Rhub and Rtip) and the RPMof the rotor as illustrated in Fig. 3, (right). These parameters were unchanged in the subsequent highfidelity 3D-optimization, in which the three dimensional design of the pump comprising the inletsection, the rotor and stator rows, and the diffuser has been performed.
Rotor
Hub
Mid
Tip
Rtip
Rhub
1D-Optimization 3D-Optimization
RPM
Rtip
RhubR
X
w
v
u1
1
1
u2
v2
w2
θ
X
Inlet
Rotor StatorDiffuser
Outlet
Figure 3: Design Procedure
3

1D OPTIMIZATION
Computational Model
Choice of Rtip and Rhub
Vx = Q
π (Rtip - Rhub)2 2
2 2
Choice of RPM
ω = RPM 2π
60Umid = Rmid ω
Determination of W1, β1
W1 = Vx + U1
β1 = atan U1
Vx
Determination of V2, α2, W2, β2
Δhtot = g ΔH
V2θ = Δhtot
U2
2 2V2 = Vx + V2θ
α2 = atan V2θ
Vx
2W2 = (U2 - V2θ) + Vx
2
β2 = atan U2 - V2θ
Vx
Figure 4: 1D Computational Model
The 1D computational model is illustrated inFig. 4. Input parameters are the hub and tip radii,Rhub and Rtip, and the RPM, next to the pump re-quirements (∆H and Q). The axial velocity Vx isderived from the hub and tip radius for the spec-ified flow rate Q. It is assumed at this stage thatthe axial velocity upstream of the rotor is con-stant from hub to tip although the pump will havea radial inlet bend (see Fig.1).
The peripheral speed U is computed at threesections (hub, mid and tip) from the rotationalspeed and the respective radii. The mid sectionis positioned in the middle of the hub and tip ra-dius: Rmid = 0.5 · (Rhub + Rtip).
The inlet absolute velocity V1 is assumed tobe axial (no pre-rotation), which allows to com-pute the relative velocity W1 and the relativeflow angle β1.
The quantities downstream of the rotor (in-dex 2) are computed based on the required totalhead ∆H and assuming no losses (ηhyd = 1.0)using the Euler-equation for pure axial inlet flow(V1θ = 0)
g ·∆Hηhyd
= U2V2θ − U1V1θ = U2V2θ . (2)
and assuming the axial velocity Vx to maintainconstant through the rotor (i.e. free vortex de-sign). The absolute velocity downstream of therotor V2, the absolute flow angle α2, the relativevelocity W2, and the relative flow angle β2 arecomputed as illustrated in Fig. 4.
Objectives and ConstraintsThree design parameters (hub radius Rhub, tip radius Rtip, and RPM) can be chosen to obtain the
required total head ∆H and flow rate Q. However, additional requirements need to be imposed:
• The turning of the flow in the rotor (β2 - β1) needs to be limited to reduce the losses, notaccounted for in this preliminary design phase. According to Stepanoff (1957) the turning islimited to 30◦ to 25◦.
• The diffusion in the rotor (W2/W1) needs to remain feasible. A limit of 0.72 is often used,known as the de Haller number (Saravanamuttoo et al., 2001).
• The maximum relative velocity in the rotor Wmax needs to remain at low values (10 - 20 m/s)to limit erosion.
• The absolute exit flow angle (α2) needs to be small (from axial direction) to perform a feasiblediffusion in the subsequent stator (Stepanoff, 1957).
4

The corresponding optimization problem is formulated as:
Minimize: Obj1 = W tip1 (3)
Obj2 = −W hub2 /W hub
1 (4)
Subject to: Constr1 = abs(βhub2 − βhub1 ) ≤ ∆βmax (5)
Constr2 = Vx ≤ Vx,max (6)
The first objective Obj1 (Eqn. 3) reduces the maximum relative velocity in the rotor, which is in thetip section at the inlet. A value in the range of Wtip
1 = 10 to 20 m/s is considered as feasible, althoughlower values are preferred, as they would increase the lifetime with respect to erosion. The secondobjective Obj2 (Eqn. 4) maximizes the diffusion ratio near the hub to prevent an excessive diffusion.For a free vortex design the highest diffusion occurs in the hub section. The first constraint Eqn. 5restricts the turning at the hub, where the largest relative flow turning will take place, while the secondconstraint (Eqn. 6) puts an additional limitation on the axial velocity to limit the erosion risk in themeridional passage.
Methodology
DE
1D Model
Rhub RPMtipR Δβ /W 2 W 1 Wmaxα
ΔH Q
2
Figure 5: 1D Optimization Flowchart
Three different design variables are allowed tobe changed during the preliminary design phase,i.e. the hub and tip radii (Rhub and Rtip) and therotational speed RPM. Each design variable is al-lowed to change within a specified range. For eachchoice of the hub radius Rhub, tip radius Rtip, andRPM, the velocity triangles can be computed bythe 1D model and the requirements can be evalu-ated. In order to find the three design parametersthat give a suitable compromise for the diffusionW2/W1, turning ∆β, and maximum velocity Wmax
requirements, a Differential Evolutionary (DE) al-gorithm (Storn and Price, 1997) has been used.Figure 5 illustrates schematically the optimizationflowchart.
ResultsThe results of the 1D optimization are illustrated in Fig. 6, showing both the diffusion in the
hub section Whub2 /Whub
1 (left) and the flow turning βhub2 - βhub2 (right) with respect to the relativevelocity in the rotor tip section Wtip
1 . A Pareto front is found instead of one single optimal de-sign, which is typical of multi-objective optimization. This is a set of so called non-dominateddesigns, in which one objective cannot be improved without worsening the other. In Fig. 6, (left),a clear Pareto front (towards the upper left hand corner) is visible indicating that a lower maxi-mum velocity Wtip
1 comes at the expense of a larger diffusion near the hub (lower Whub2 /Whub
1 ).This evidently results also in a higher flow turning near the hub, as can be seen in Fig. 6, (right).The resulting Pareto front allows the designer to select designs depending on the weight given toeach objective. In the present case, it was decided to select the design with a hub diffusion ra-tio (Whub
2 /Whub1 ) close to the minimum limit as indicated in Fig. 6, (left). This design has a spe-
cific speed of Ns ≈ 70 with a high hub-to-tip ratio of ν = Rhub/Rtip = 0.88, which is larger thancommonly used for axial (propeller-like) pumps in the range of ν = 0.3 - 0.7 (Stepanoff, 1957).
5

0.1
Selected Design
Min. Limit
5.0
Wh
ub
2W
hu
b
1[-
]
Wtip
1 [m/s] Wtip
1 [m/s]
5.0
Selected Design5.0
β
h
ub
2
hu
b
1[
]β
Figure 6: Diffusion in the Hub vs. Relative Velocity in the Tip Section (left), Turning in theHub Section vs. Relative Velocity in the Tip Section (right)
Figure 7: NASA Axial Pump Rotorfor Liquid Rocket Application (hub-to-tip ratio ν = 0.9) (Urasek, 1971)
However, this is due to the very low velocity require-ment (i.e. low Vx and Wtip
1 ) and high diffusion (i.e. lowWhub
2 /Whub1 ) for a single stage pump. Similar conclusions
were drawn within a design study of axial pump rotors forliquid rocket application (Crouse and Sondercock, 1964;Miller and Crouse, 1965; Urasek, 1971). Several rotors(see Fig. 7) were designed and tested with hub-to-tip ra-tios between ν = 0.4 - 0.9 for a specified diffusion, whichconfirms the results obtained from this preliminary designoptimization.
3D OPTIMIZATION
MethodologyThe 3D design of the primary pump is performed with
the optimization algorithm developed at the von KarmanInstitute (VKI) with special focus on turbomachinery ap-plications. The system (Fig. 8) makes use of a DifferentialEvolution algorithm (DE), a metamodel based on an Arti-ficial Neural Network (ANN), a database, and high fidelitysimulation tools for the flow analysis (CFD).
The basic approach of this method is that the ArtificialNeural Network substitutes the computational expensive tools for the CFD in the Generation Loop(see Fig. 8) and provides less accurate but very fast performance predictions to evaluate the largenumber of geometries necessary by the DE during its search for the optimum. However, the meta-model requires a validation which is then performed in the Iteration Loop according to Fig. 8. Aftera specified number of generations, the optimum geometries according to the ANN predictions areanalyzed by the more accurate but much more computationally expensive CFD calculations to verifythe accuracy of the metamodel. The results of the accurate performance analysis are added to thedatabase and a new Generation Loop is started after a new training of the metamodel on the enlargeddatabase. In this way the whole system is self-learning, resulting in a more accurate ANN.
6

Learning
Design Vector
ANN
CFD
Database
PredictionFineTurbo
Design Vector
Performance- estimation -
DE
Generation Loop
Iteration Loop
Performance- accurate -
Start
Stop
Figure 8: VKI Optimization Algorithm
The Differential Evolution algorithmused was developed by Storn and Price(1997). In present optimization, 1000 gen-erations are created with a constant pop-ulation size of 40 individuals. To vali-date the ANN predictions in each IterationLoop eight individuals were selected andreassessed by the high fidelity tools.
The initial sampling of the database wasperformed by means of a Design of Exper-iments (DOE) (Montgomery, 2006). TheDOE is based on statistical methods andconsiders, that k design variables can taketwo values fixed at a specified position inthe design space (here: 20% and 80% plusone central case = 50%). Further, to reducethe number of required evaluations, thefractional factorial design approach (Mont-gomery, 2006) is used: 2(k−p) with (k−p) =6, thus resulting in 64 experiments plus the central case, which are the initial sampling of the database.
ParameterizationThe 3D model of the rotor of the pump (cf. Fig. 1) is based on Bezier and B-spline curves and
surfaces and is defined by:1. the meridional contour,
2. the blade camber line at hub and tip,
3. the thickness distribution, which is added normal to the camber line at hub and tip, and
4. the number of blades.The definition of the meridional contour is shown in Fig. 9. The meridional flow path is subdivided
into different patches: an inlet patch (90◦-bend and swan neck), a blade patch, and an outlet patch. Theblade patch corresponds to where the rotor blade is located in the meridional plane. The coordinates ofthe control points are the geometrical parameters which can be modified by the optimization programand the possible variation in axial and radial direction is indicated by arrows. In order to have a goodcontrol about the geometry and to avoid undesirable shapes, lengths and angles are used (e.g. L1 toL10, Hinlet, αhub and αshroud). In total 15 parameters define the meridional flow path.
The rotor blade is defined by the blade camber line of the hub and tip section, each separatelydefined by the blade angle βm-distribution with respect to the meridional plane. The βm-distributionis parameterized by a Bezier curve with three control points, one at the leading and trailing edge andone intermediate control point. This results in a total of 6 degrees of freedom.
The final blade with the pressure and suction side surfaces is created by adding a thickness dis-tribution normal to the camber line at hub and tip. In the present optimization study, a NACA 65thickness distribution at hub and tip has been chosen, which shape is kept constant during the opti-mization process.
The number of blades, which defines the full rotor, is introduced as an optimization parameterwithin this design study. This parameter has a major effect on solidity, i.e. on the blade loading andon the blockage of the flow in case of accidents with no pump rotation, in which cooling needs to beguaranteed by natural convection in the reactor.
In total 22 parameters define the geometry of the pump and will be subject to optimization.
7

Optimization parameter
Dependent parameter
Rotor
Hinlet
αshroud
αhub
L10
L5
L9L8
L7
L6
L3 L4
L2
L1
r
z
Figure 9: Meridional Parameterization of the Inlet Section and the Rotor
Flow AnalysisEvery geometry in the Iteration Loop according to Fig. 8 has been analyzed at the design oper-
ating point using the commercial flow solver fineTurboTM. The incompressible Reynolds-AveragedNavier-Stokes (RANS) equations are solved using a Runge-Kutta scheme in conjunction with accel-erating techniques such as variable-coefficient implicit residual smoothing and a multi-grid scheme.Discretization is based on finite volumes with a cell-centered scheme stabilized by artificial dissipa-tion. For the turbulence closure the one equation model of Spalart and Allmaras (Wilcox, 1993) isused with the assumption of fully turbulent flow with an inlet Reynolds number of
Reinlet =VinletRinletρ
µ= 6.5 · 105 (7)
where Vinlet and Rinlet are the absolute inlet velocity and the inlet radius, respectively. The flowproperties of lead-bismuth eutectic (LBE) according to NEA (2008) have been used for the CFDsimulations.
Objectives and ConstraintsThe optimization of the inlet section and the rotor has two objectives:
1. Maximizing the hydraulic efficiency
Obj1 = ηhyd =∆Ptot
ρ ·∆(VθU)(8)
where ρ is the density of LBE, ∆Ptot the mass-flow averaged absolute total pressure rise, and∆(VθU) the difference of the mass flow averaged angular momentum between inlet and outlet.
2. Reducing the maximum isentropic velocity (W/W0)max,SS on the blade suction side at 90%span. The isentropic velocity objective aims at reducing the maximum relative velocity in thetip section (90%-span) as shown in Fig. 10 and is computed as follows:
Obj2 = (W/W0)max,SS =√
1− Cp|min,SS (9)
with the pressure coefficient Cp:
CP =P − Pref
0.5 · ρ ·W 2ref
(10)
8

The two objectives are subject to two constraints:
Constr1 = ∆H ≥ ∆Hmin (11)
and
Constr2 =[(W/W0)max,ps − (W/W0)max,ss
]≤ 0 . (12)
The first constraint (Eqn. 11) ensures that the designs generated by the optimization programsupply the required total head for the design flow rate. The second constraint (Eqn. 12) preventsthat the isentropic velocity objective Obj2 is not improved at the expense of a higher velocity on thepressure side at the leading edge due to negative incidence, i.e. if the flow impinges on the suctionside, which results in a velocity peak on the pressure side (Fig. 10).
Figure 10: Illustration of negative incidence resulting in a velocity peak on the pressure side
ResultsThe results of the optimization are presented in Fig. 11, showing both the total head ∆H (left)
and the maximum isentropic velocity on the suction side (W/W0)max,SS (right) with respect to thehydraulic efficiency ηhyd. Each symbol in Fig. 11 represents one design that has been analyzed byCFD. The square symbols represent the geometries analyzed for the initial database (DOE) prior tothe optimization to train the metamodel. The designs generated during the optimization process arethe diamond shape symbols. From the initial scattered distribution of the DOE (Fig. 11, left), the opti-mizer generated a large number of designs with high hydraulic efficiency ηhyd and minimum requiredtotal head (indicated with the horizontal line in Fig. 11). The selected design of this optimizationsupplies a total Head, which is above the minimum required value, with high hydraulic efficiency.The reason why this particular design has been chosen is more obvious from Fig. 11, (right) show-ing the two-dimensional objective space, i.e. the maximum isentropic velocity on the suction side(W/W0)max,SS with respect to the hydraulic efficiency ηhyd.
In this plot only designs which satisfy the constraints according to Eqns. 11 and 12 are presentedsuch that the apparent front of designs towards the lower right hand corner is the Pareto front compris-ing non dominated designs, i.e. no other designs outperform the Pareto optimal designs with respectto both higher efficiency and lower relative velocity. Higher hydraulic efficiency comes at the expenseof higher relative velocity due to positive incidence resulting in a velocity peak on the suction sideleading edge. In this optimization reducing the isentropic velocity on the suction side, i.e. the relativevelocity to limit erosion had a higher priority than improving the efficiency, resulting in the selecteddesign, which is considered as the best trade-off solution of both objectives.
9

ηhyd
[-]
SelectedDesign
Selected Design
Required Head
S/S0 [-]
W/W
0[-]
0 0.2 0.4 0.6 0.8 10
0.2
0.4
0.6
0.8
1
1.2
1.4
Positive Incidence
0.5
0.02 0.01
0.1
Hydraulic Efficiency ηhyd
[-]Hydraulic Efficiency
Tota
l H
ead
ΔH
[m
]DOE
Optimization
(W/W
) [-
] m
ax,s
s0
Figure 11: Total Head vs. Hydraulic Efficiency (left), 2D Objective Space: (W/W0)max,SS vs.Hydraulic Efficiency (right)
The selected design, which is presented in Fig. 12, (left) is a high staggered, low aspect ratiorotor (h/ctip ≈ 0.36) with a solidity in the tip section of (c/p)tip ≈ 1.26. It is a mid-loaded bladewith an equal loading in the hub and tip section and with a smooth diffusion on the suction side asillustrated in Fig. 12, (middle) showing the isentropic velocity distribution at 10% and 90% span.Additionally, as illustrated already in the 2-dimensional objective space in Fig. 11, (right), this designhas a rather low velocity on the suction side which limits the erosion risk. Figure 12, (right) illustratesthe mass-flow averaged span-wise distribution of the rotor Diffusion Factor (DF) at design operatingconditions. Although the Diffusion Factor introduced by Lieblein et al. (1953)
DF = 1− W2
W1
+∆Wθ
2σW1
(13)
using the relative velocities up- and downstream of the rotor and the solidity σ is strictly valid fortwo-dimensional flows, it is a suitable parameter to estimate off-design tendencies. Except close tothe side walls where the flow is overturned due to secondary flows (i.e. due to the hub and shroudpassage vertices), the computed rotor Diffusion Factor is below DF≤ 0.5, which indicates a sufficientmargin towards lower flow rates.
0 0.2 0.4 0.6 0.8 10.2
0.4
0.6
0.8
1
1.2
10% Span90% Span
0 0.2 0.4 0.6 0.80
0.1
0.2
0.3
0.4
0.5
0.6
0.7
0.8
0.9
1
Diffusion Factor DF
Rel
ati
ve S
pan
[-]
DF= 1 - +WW1
2 ΔW2σ
θ
W1
Rotor 21
S/S [-]0
W/W
[-
]0
Overturning due to hub passage vertex
Overturning due to shroud passage vertex
Figure 12: Selected Design Indicated in Fig. 11 with a Close Up on the Rotor (left), IsentropicVelocity Distribution at 10% and 90% Span (middle), Span-wise Distribution of Rotor DiffusionFactor (right)
10
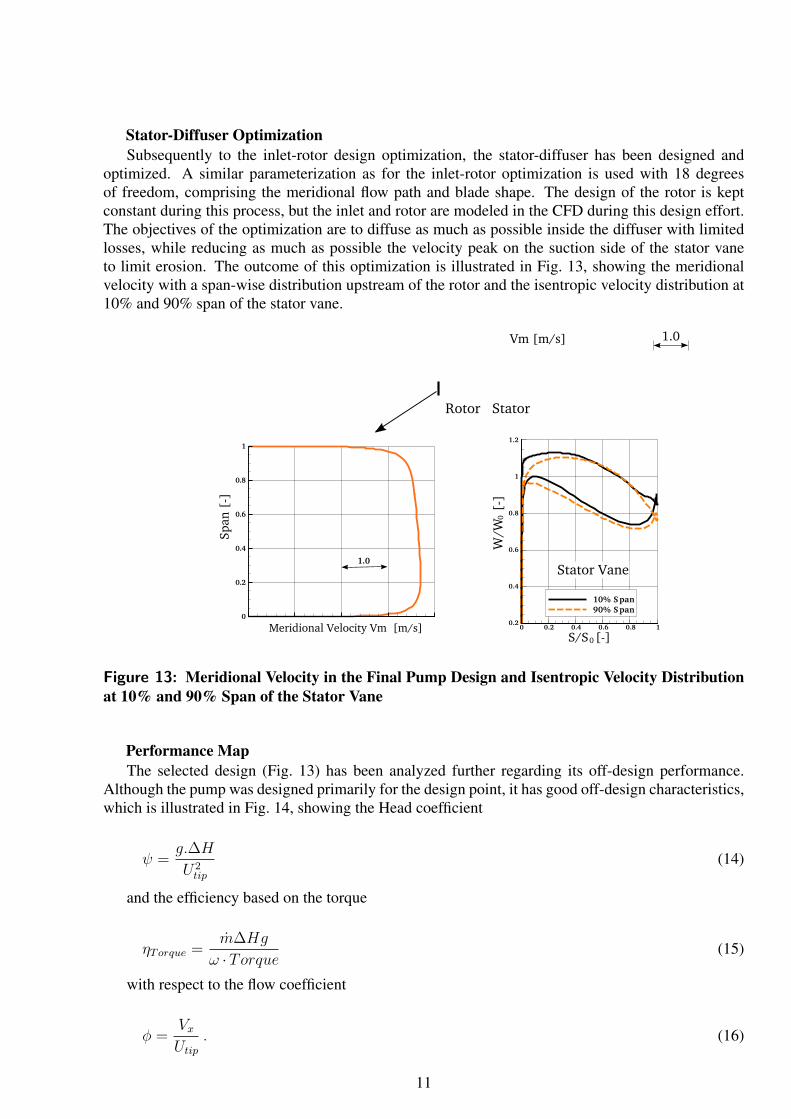
Stator-Diffuser OptimizationSubsequently to the inlet-rotor design optimization, the stator-diffuser has been designed and
optimized. A similar parameterization as for the inlet-rotor optimization is used with 18 degreesof freedom, comprising the meridional flow path and blade shape. The design of the rotor is keptconstant during this process, but the inlet and rotor are modeled in the CFD during this design effort.The objectives of the optimization are to diffuse as much as possible inside the diffuser with limitedlosses, while reducing as much as possible the velocity peak on the suction side of the stator vaneto limit erosion. The outcome of this optimization is illustrated in Fig. 13, showing the meridionalvelocity with a span-wise distribution upstream of the rotor and the isentropic velocity distribution at10% and 90% span of the stator vane.
10% Span90% Span
0 0.2 0.4 0.6 0.8 1
S/S [-]0
0.2
0.4
0.6
0.8
1
1.2
W/W
[-
]0
1.0
0
0.2
0.4
0.6
0.8
1
Meridional Velocity Vm [m/s]
Span
[-]
Stator Vane
1.0Vm [m/s]
Rotor Stator
Figure 13: Meridional Velocity in the Final Pump Design and Isentropic Velocity Distributionat 10% and 90% Span of the Stator Vane
Performance MapThe selected design (Fig. 13) has been analyzed further regarding its off-design performance.
Although the pump was designed primarily for the design point, it has good off-design characteristics,which is illustrated in Fig. 14, showing the Head coefficient
ψ =g.∆H
U2tip
(14)
and the efficiency based on the torque
ηTorque =m∆Hg
ω ·Torque(15)
with respect to the flow coefficient
φ =VxUtip
. (16)
11
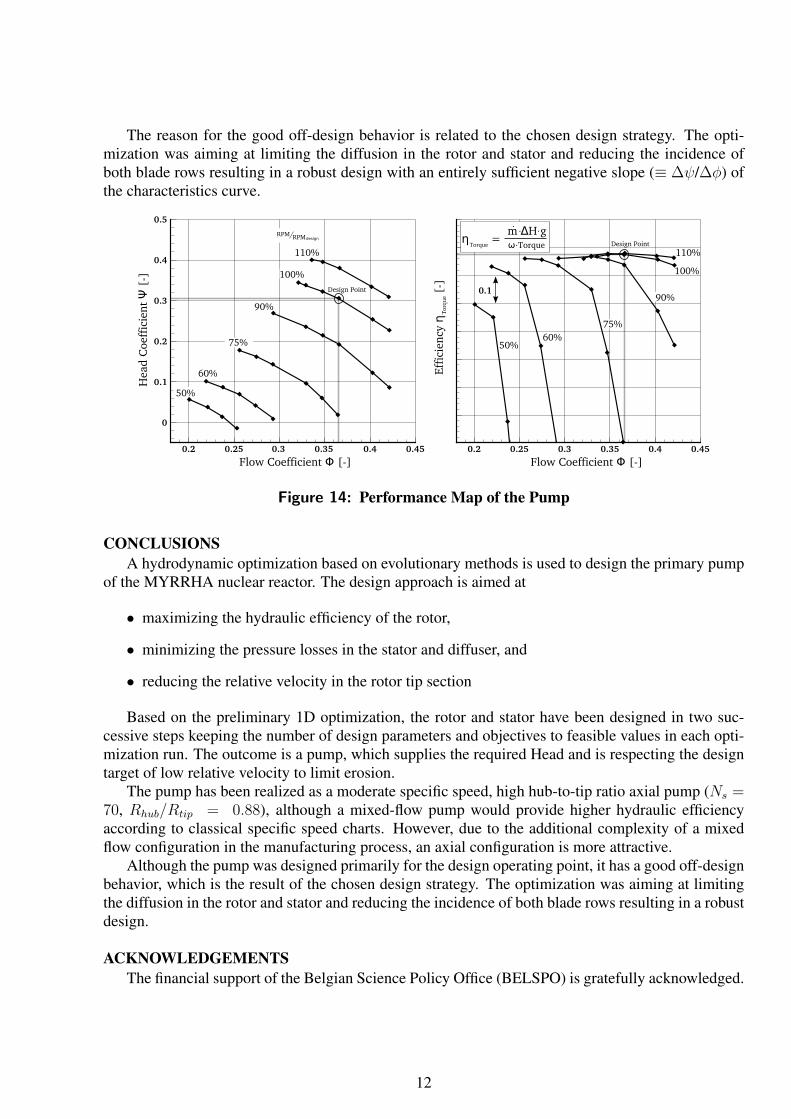
The reason for the good off-design behavior is related to the chosen design strategy. The opti-mization was aiming at limiting the diffusion in the rotor and stator and reducing the incidence ofboth blade rows resulting in a robust design with an entirely sufficient negative slope (≡ ∆ψ/∆φ) ofthe characteristics curve.
60%
0.2 0.25 0.3 0.4 0.45
0
0.1
0.2
0.3
0.4
0.5
0.35
100%
110%
90%
75%
50%
RPM RPM design
Flow Coefficient Φ [-]
Hea
d C
oef
fici
ent Ψ
[-]
Design Point
Flow Coefficient Φ [-]
50%60%
0.2 0.25 0.3 0.35 0.4 0.45
0.1
75%
90%
100%
110%Design Point
Eff
icie
ncy
η
[-]
Torq
ue
η = Torque
m ΔH g.
ω Torque
. .
.
Figure 14: Performance Map of the Pump
CONCLUSIONSA hydrodynamic optimization based on evolutionary methods is used to design the primary pump
of the MYRRHA nuclear reactor. The design approach is aimed at
• maximizing the hydraulic efficiency of the rotor,
• minimizing the pressure losses in the stator and diffuser, and
• reducing the relative velocity in the rotor tip section
Based on the preliminary 1D optimization, the rotor and stator have been designed in two suc-cessive steps keeping the number of design parameters and objectives to feasible values in each opti-mization run. The outcome is a pump, which supplies the required Head and is respecting the designtarget of low relative velocity to limit erosion.
The pump has been realized as a moderate specific speed, high hub-to-tip ratio axial pump (Ns =70, Rhub/Rtip = 0.88), although a mixed-flow pump would provide higher hydraulic efficiencyaccording to classical specific speed charts. However, due to the additional complexity of a mixedflow configuration in the manufacturing process, an axial configuration is more attractive.
Although the pump was designed primarily for the design operating point, it has a good off-designbehavior, which is the result of the chosen design strategy. The optimization was aiming at limitingthe diffusion in the rotor and stator and reducing the incidence of both blade rows resulting in a robustdesign.
ACKNOWLEDGEMENTSThe financial support of the Belgian Science Policy Office (BELSPO) is gratefully acknowledged.
12

ReferencesCrouse, J. and Sondercock, D. (1964). Blade-Element Performance of 0.7 Hub-Tip Radius Ratio
Axial-Flow Pump rotor with Tip Diffusion Factor of 0.43. Technical Report NASA TN D-2481,Lewis Resarch Center, Cleveland Ohio.
Lieblein, S., Schwenk, F. C., and Broderick, R. (1953). Diffusion Factor for Estimating Losses andLimiting Blade Loadings in Axial-Flow-Compressor Blade Elements. Technical Report NACARM E53D01, Lewis Flight Propulsion Laboratory, Cleveland Ohio.
Miller, M. and Crouse, J. (1965). Design and Overall Performance of an Axial-Flow Pump Rotorwith a Blade-Tip Diffusion of 0.66. Technical Report NASA TN D-3024, Lewis Resarch Center,Cleveland Ohio.
Montgomery, D. (2006). Design and Analysis of Experiments. John Wiley & Sons, Inc.
NEA (2008). Handbook on Lead-bismuth Eutectic Alloy and Lead Properties, Ma-terials Compatibility, Thermal-hydraulics and Technologies. http://www.oecd-nea.org/science/reports/2007/nea6195-handbook.html.
OKBM (2012). Experimental Designing Bureau of Machine Building. http://www.okbm.nnov.ru/.
Saravanamuttoo, H., Rogers, G., Cohen, H., and P.V., S. (2001). Gas Turbine Theory. PearsonPrentice Hall., 5 edition.
SCKCEN (2012). Myrrha: Multi-purpose hybrid research reactor for high-tech applications.http://myrrha.sckcen.be/.
Stepanoff, A. (1957). Centrifugal and Axial Flow Pumps. John Wiley & Sons, Inc.
Storn, R. and Price, K. (1997). Differential Evolution - A Simple and Efficient Heuristic for GlobalOptimization over Continuous Spaces. Journal of Global Optimization, 11:341–359.
Urasek, D. (1971). Design and Performance of a 0.9 Hub-Tip-Ratio Axial-Flow Pump Rotor with aBlade-Tip Diffusion Factor of 0.63. Technical Report NASA TM X-2235, Lewis Resarch Center,Cleveland Ohio.
Wilcox, D. (1993). Turbulence Modelling for CFD. DCW. Industries, Inc.
13
Recommended