(1) President, Group Delta Consultants, Inc., 92 Argonaut, Suite 120, Aliso Viejo, CA 92656 [email protected]
DESIGN & INSTALLATION OF LARGE DIAMETER PIPE PILES FOR LAXT WHARF
Kul Bhushan, Ph.D., G. E., Member, ASCE (1)
ABSTRACT: A total of 193, 1.37-m (54-in.) diameter and 25-mm (1-in.) wall, open-ended, pipe piles with lengths of 33.5 to 41.5 m (110 to 136 ft) were used to support the free-standing Los Angeles Export Terminal (LAXT) wharf in up to 22 m (72 ft) of water in the Port of Los Angeles. The piles were designed for maximum compressive loads of 4.45 MN (1,000 kip). The paper discusses the results of an indicator pile program with Dynamic Pile Driving Analyzer (PDA) measurements, comparisons of the calculated pile capacities with those predicted by PDA measurements, and “set-up” (increase in skin friction) with time. The indicator pile program consisted of driving nine 1.37-m (54-in.) diameter piles with an IHC S-500 hammer and PDA monitoring. For the first three piles, the capacities at the end of initial driving predicted by PDA were about 50% of the design capacities. Alternatives to achieve the design capacity included: use longer piles, wait and re-strike to utilize set-up, and weld shoes at the pile tips to increase the end area. The last option was used and 50- and 100-mm (2- and 4-in.) thick shoes were welded to four of the indicator piles. The PDA results for the piles with shoes indicated an increase of 1.3 MN to 2.6 MN (290 to 580 kip) in the pile capacity. A number of indicator piles were retapped after periods of 1 to 75 days and showed a set-up factor of 1.1 for 1-day to about 2 for 75-day set-up. The degradation of the capacity during driving and subsequent set-up was attributed to slow pore pressure dissipation in the soil plug within the pile. The 193 production piles were successfully driven with the shoes to achieve design capacity resulting in significant savings in cost and time compared to other options. The wharf has been in operation since 1998.
INTRODUCTION Large diameter pipe piles are generally used for construction of offshore oil platforms throughout the world (McClelland et al., 1974). Prestressed concrete piles (450- to 600- mm (18- to 24-in.) octagonal) have generally been used for supporting container and other wharves in Los Angeles area ports in water depths of up to 15 m (50 feet).
Downloaded from http://www.groupdelta.com/papers.html

2
The construction of the first deep water bulk terminal at the Port of Los Angeles (POLA) required the terminal to be constructed in 22 m (72 ft) water depth to accommodate up to 250,000 DWT future vessels. The facility is designed to handle coal, petroleum coke, copper concentrates, and other dry bulk commodities at an ultimate throughput capacity of about 20 million tons per year. The berthing facility involved the design of structural piles, decks, platforms, berthing and mooring structures, fendering systems, shiploader crane rails, berthside dredging, and a new 27-m (88-ft) high 2.5:1 submerged slope. Prestressed concrete piles could not be used due to the large free-standing length and high moment demand. Therefore, 1.37-m (54-in.) diam. steel pipe piles were selected to support the 329-m (1080-ft) long wharf. Steel pipe piles with a diameter of 0.91 m (36 in.) were used to support the approach ramp and mooring dolphins. Details of the pile design, soil conditions, the indicator program, theoretical vs CAPWAP capacities, potential reasons for low end-of-driving capacity and large set-up are discussed in this paper. PILE FOUNDATIONS A total of 193, 1.37-m (54-in.), 25-mm (1-in.) wall, open end, pipe piles support the main free-standing wharf structure in a water depth of 22 meters (72 feet). The connecting ramp to land and each mooring dolphin are supported on 12 and 10 piles respectively, 0.91-m (36-in.) diam. pipe piles with a wall thickness of 16 mm (0.625 inch). The Wharf Plan and a Typical Cross-section are shown in Figs. 1 and 2.

3
The design penetration below the seafloor for the 1.37-m (54-in.) piles ranged between 17m (55 ft) and 21 m (68 feet). The corresponding lengths of the piles range between about 29 m (110 ft) and 41.5 m (136 feet). The piles were originally designed for maximum tensile loads of about 1,780 kN (400 kip) and maximum compressive loads of about 4.45 MN (1,000 kip). The original design was based on a uniform deck loading of 38 kPa (800 psf). The design penetration for the 0.91 m (36 in.) piles ranged between 14 m (45 ft) and 20 m (65 feet). The actual length of the 0.91 m (36-in.) piles ranged between 32 and 35 m (105 and 115 ft) for the ramp piles and between 33 and 44 m (107 and 144 ft) for the Dolphin piles. The maximum tensile loads ranged between 625 and 1682 kN (140 and 378 kip) and the maximum compressive loads ranged between 710 and 1600 kN (160 and 359 kip). SUBSURFACE CONDITIONS Boring locations are shown in Fig.1 and the generalized profile along the berthing facility is shown in cross-section A-A', Fig. 3. Strata 1, 2, and portions of Strata 3 and 4 were dredged out in the pile driving area. The data indicate that the offshore subsurface profile consists of the following generalized strata. Stratum 1 This stratum consisted of very soft clayey silt, with sand layers and extends from the seafloor to depths of 1 to 2 meters (3 to 6 feet). This material had a liquid limit of 48 and a plasticity index (PI) of 18. The natural moisture content was 58 percent, which is higher than the liquid limit.

4
Stratum 2 This stratum consisted of sand to sand with silt (SP, SP-SM). The percent passing a No. 200 sieve was generally less than 10 percent. Equivalent standard penetration test blow counts ranged between 10 and 50. The cone penetration tip resistance ranged between 7.2 and 19 MPa (150 and 400 ksf) and the cone sleeve friction ranged between 50 and 100 kPa (1 and 2 ksf). These materials are medium dense to dense. Natural moisture content ranges between 20 and 30 percent. Friction angles ranged between 36 and 46 degrees.
Stratum 3 This stratum consists of clayey silt and sandy silt with silty sand layers. The percent passing a No. 200 sieve ranges between 60 and 97 %. The natural moisture content ranges between 25 and 42 %. The material is stiff to very stiff with undrained shear strength of 60 kPa (1.3 ksf) to over 96 kPa (2 ksf). The cone penetration tip resistance ranges between 720 and 1,435 kPa (15 and 30 ksf). The liquid limits range between 31 and 57 and the plasticity index ranges between 5 and 29. Stratum 4 This stratum extends from El. -26 m (-85 ft) on the west end and El. -21 m (-70 ft) on the east end to the bottom of the borings at El. –44 m (-145 feet). The material consists of dense to very dense sand with silt and silty sand (SP-SM, SM). The cone tip resistance in this material ranges between 19 to 33 MPa (400 to 700 ksf) and the

5
cone sleeve friction is generally about 100 kPa (2 ksf). Friction angles based on direct shear test results are greater than 45 degrees. Percent passing a No. 200 sieve ranges between 5 and 15 percent. Data from land borings indicate that the soils below about El. -21 m to El. –56 m (El. -70 ft to El. –183 ft) are very dense with blow counts ranging from 50 to 150+ blows per 0.3 m (1 foot). Isolated layers of sandy clay are present within this stratum between El. -33 and El. –34.5 m (-107 to –113 ft) and El. –43 m and El. –47m (-140 and –155 feet). INDICATOR PILE DRIVING All indicator piles were 3 m (10 ft) longer than the production piles. The indicator pile program was to be completed well in advance of the production pile driving so that pile lengths could be changed before placing the order for the production piles. However, due to the high cost of separate mobilization of the barge and pile driving equipment, the indicator pile program was performed just before the start of the production pile driving. Due to lead time required for ordering the 1.37-m (54-in.) and 0.91-m. (36-in.) pipe, this option reduced the flexibility of changing pile lengths based on the results of the indicator pile program. An indicator pile program was performed before the installation of 1.37-m (54-in.) and 0.91-m (36-in.) pipe piles to assess the driveability of the large diameter piles for which there was no precedence in the local port area. These piles were driven with a IHC S-500 hydraulic hammer with a rated energy of 500 m-kN (369 ft-kip) for 1.37-m (54-in.) piles and Delmag D80-23 diesel hammer with a rated energy of 267 m-kN (197 ft-kips) for the 0.91-m (36-in.) piles, respectively. A vibratory hammer ICE 1412 B was used to stab the piles and drive them initial about 10 m (33 feet). The original indicator pile program included six 1.37-m (54-in.) and three 0.91-m (36-in.) piles. Three additional 1.37-m (54-in.) piles were added to the original program after the results of first three indicator piles indicated surprisingly low capacity at the end of driving. Five of the indicator piles were driven with 50 to 100 mm (2 to 3 in.) shoes welded to the pile tips to increase the pile end area and the capacity. Pile Driving Hammers and Equipment On the basis of the analyses in the driveability study (Geofon, 1995), it was concluded that there was a potential for encountering hard driving in dense sands. Consequently, IHC S-500 hydraulic hammer with a rated energy of 500 m-kN (369 ft-kip) was selected for driving 1.37-m (54-in.) piles. Subsequent driving using this hammer indicated that the actual pile capacity at the end of driving was less than 50% of the estimated design ultimate capacity and that a much smaller hammer could be used to drive the piles. The large hammer was used at a lower setting and drove the piles easily and at a lower blow count. The 0.91-m (36-in.) pipe piles were driven with a Delmag D80-23 diesel hammer with a rated energy of 267 m-kN (197 ft-kip). A vibratory hammer ICE 1412 B was used to stab the piles and drive them initial 9 to 12 m (30 to 40 feet).

6
The pile driving was performed from the barge KAJIMA that was equipped with a crane to handle the 57-ton hydraulic hammer. The piles were carried on a separate pile barge. The Delmag D80-23 hammer was carried on the pile barge while the ICE 1412-B vibratory hammer and the IHC S-500 hammers were carried on the KAJIMA.

7
Wave Equation Analysis We performed wave equation analyses for the IHC S-500 hydraulic hammer and Delmag D80-32 diesel hammer to develop ultimate dynamic resistance vs blow count. The blow count vs ultimate dynamic resistance for the IHC S-500 driving 1.37-m (54-in.) piles and Delmag D80-32 driving 0.9-m (36-in.) pipe piles are shown in Fig. 4.
Indicator Pile Testing The 1.37-m (54-in.) pipe piles were stabbed with a ICE 1412 B vibratory hammer to within about 9 m (30 ft) of the final tip elevation and then driven with the IHC S-500 hydraulic hammer. The 0.91-m (36-in.) piles were stabbed with the ICE 1412 B vibratory hammer and driven with the Delmag D80-32 hammer. A summary of pertinent pile data and results of CAPWAP analyses are presented in Table 1.

Tab
le 1
. Sum
mar
y of
CA
PWA
P R
esul
ts
‘ Pi
le N
o.
Test
Sta
tus
Toe
Te
st
Blo
w
Pile
Tip
Pi
le
Ener
gy
Blo
w
CA
PWA
P C
apac
ity
Soil
Dam
ping
So
il Q
uake
s
A
rea
Dat
e N
o.
Elev
. Pe
n.
kip-
ft C
ount
To
t. Sk
in
Toe
Skin
To
e Sk
in
Toe
sq ft
ft
ft
ki
ps
kips
ki
ps
Sec/
ft Se
c/ft
inch
In
ch
54
Inch
OD
X 1
.0 in
ch W
all P
ipes
– D
rive
n W
ith IH
C S
500
Ham
mer
1-
D44
EO
D
1.16
05
/23/
96
489
-107
64
10
8 23
11
90
900
290
0.09
0.
19
0.08
0.
36
1-D
44
BO
R2
1.16
05
/29/
96
3 -1
11
68
116
60
1685
13
90
295
0.26
0.
34
0.05
0.
37
2-C
44
EOD
1.
16
05/2
8/96
11
36
-104
58
11
6 16
10
90
832
258
0.07
0.
15
0.08
0.
52
2-C
44
BO
R
1.16
05
/29/
96
2 -1
04
58
144
24
1186
92
9 25
7 0.
10
0.27
0.
06
0.60
2-
C44
EO
R
1.16
05
/29/
96
210
-114
68
11
3 25
11
90
948
242
0.09
0.
22
0.06
0.
50
75 D
ay R
estr
ike
2-C
44
BO
R2
1.16
08
/13/
96
12
-116
70
11
7 50
19
00
1544
35
6 0.
20
0.22
0.
09
0.33
3-
B44
EO
D
1.16
05
/29/
96
501
-126
65
12
5 17
10
13
770
243
0.09
0.
23
0.12
0.
52
3-B
44
BO
R
1.16
08
/13/
96
3 -1
31
70
124
50
2020
16
40
380
0.24
0.
29
0.05
0.
15
4-D
4 EO
D
1.16
06
/04/
96
393
-103
69
11
0 29
11
14
785
329
0.11
0.
19
0.09
0.
38
4-D
4 B
OR
1.
16
06/0
6/96
2
-103
69
12
0 24
12
48
1011
23
7 0.
19
0.19
0.
08
0.33
5-
C4
EOD
3.
34
06/0
4/96
70
0 -1
10
67
109
25
1307
80
4 50
3 0.
12
0.08
0.
05
0.55
5-
C4
BO
R
3.34
06
/06/
96
2 -1
10
67
121
39
1579
10
29
550
0.19
0.
10
0.06
0.
50
6-B4
EO
D
4.36
06
/05/
96
868
-123
67
93
38
15
63
877
686
0.13
0.
04
0.07
0.
45
6-B4
B
OR
4.
36
06/0
6/96
2
-123
67
13
0 48
17
79
1098
69
0 0.
18
0.11
0.
05
0.43
9-
23A
EO
D
5.35
07
/01/
96
278
-129
60
12
8 21
12
80
660
620
0.16
0.
03
0.05
0.
60
10-2
4A
EOD
4.
36
07/0
1/96
21
7 -1
29
60
117
17
1080
66
6 41
4 0.
13
0.05
0.
05
0.70
11
-C31
B
OR
4.
36
07/2
6/96
1
-109
65
13
8 30
16
50
1393
25
7 0.
28
0.08
0.
05
0.44
11
-C31
EO
R
4.36
07
/26/
96
104
-112
68
12
2 33
16
00
1080
52
0 0.
18
0.08
0.
06
0.40
36
Inch
OD
X 0
.825
inch
Wal
l Pip
es- D
rive
n W
ith D
elm
ag D
80
Ham
mer
7-
G26
EO
D
1.91
06
/01/
96
1007
-9
9 85
82
.2
34
1074
88
8 18
6 0.
12
0.11
0.
11
0.34
8-
F26
EOD
0.
86
06/1
1/96
64
5 -9
9 77
72
25
80
8 69
7 11
1 0.
10
0.14
0.
13
0.36
12
-MD
1
EOD
1 0.
86
09/0
3/96
91
0 -1
30
76
94
41
1100
80
8 29
1 0.
11
0.08
0.
08
0.29
12
-MD
1
BO
R
0.86
09
/07/
96
7 -1
30
76
86
58
1350
10
00
350
0.18
0.
15
0.08
0.
11
12-M
D 1
EO
R1
0.86
09
/07/
96
670
-140
86
86
76
14
50
1084
36
6 0.
13
0.06
0.
08
0.28
12
-MD
1
EOR
0.
86
01/2
4/96
63
-1
40
86
118
REF
. 19
35
1579
35
6 0.
17
0.23
0.
10
0.12
1
in. =
25.
4 m
m
EOD
= E
nd o
f Driv
ing
1 ft.
= 0
.305
m
BO
R =
Beg
inni
ng o
f Res
trike
1
kip
= 4.
45 k
N
EOR
= E
nd o
f Res
trike

9
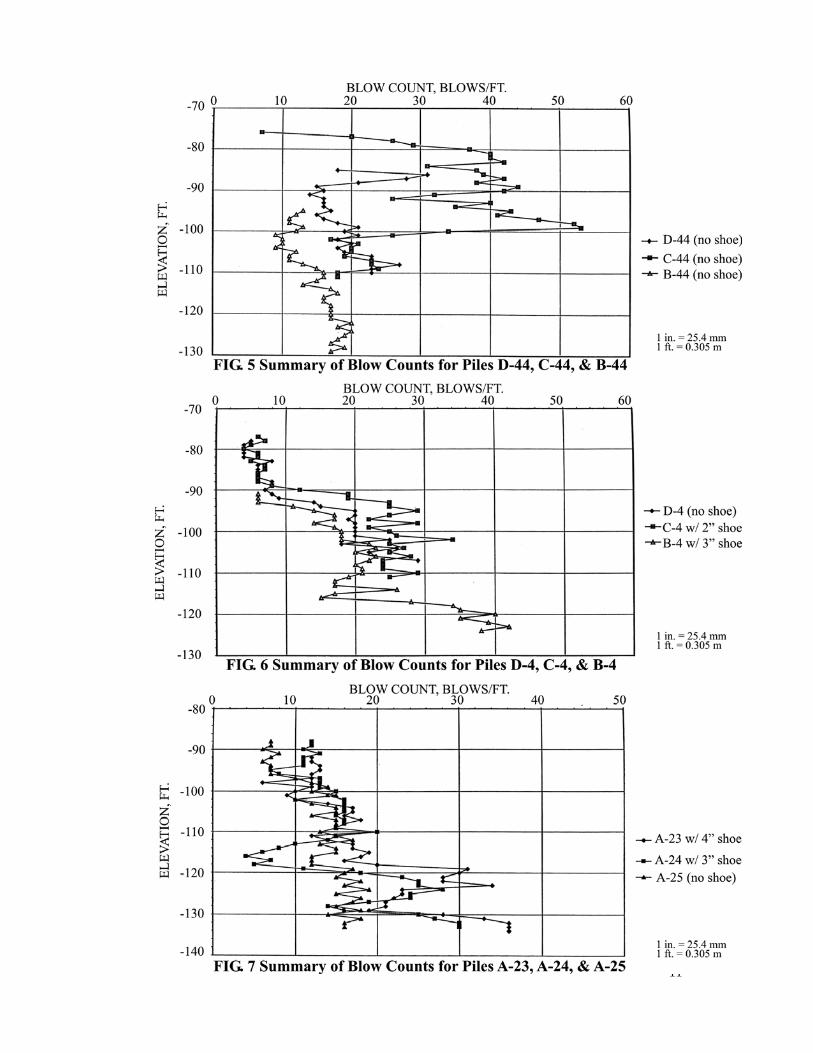
Piles D-44, C-44, B-44 The pile driving started with Pile D-44 on May 22, 1996. The pile penetrated about 0.6 m (2 ft) under its own weight. The pile was driven by the vibratory hammer to about El. –24 m (El.-80 ft) and then driven with the IHC S-500 hammer. The hammer was operated at an energy setting of between 136 and 163 m-kN (100 and 120 ft-kip). The blow counts ranged between 15 and 30 blows per 0.3 m (1 foot). The pile was driven to the final penetration to El. –32.6 m (El. –107 ft) (19.5 m (64 ft) below seafloor) at a final blow count of 23 blows / 0.3 m (1 ft) with the IHC S-500 hammer delivering an energy of 147 m-kN (108 ft-kip). The pile driving blow count vs penetration are plotted in Fig. 5. The CAPWAP results (Table 1) indicated an ultimate capacity of 5.3 MN (1,190 kip) at the end of initial driving and 7.5 MN (1,685 kip) on retap after 6 day set-up. Similar data on Piles C-44 and B-44 are presented in Table 1 and Fig. 5. The CAPWAP results (Table 1) indicated a capacity of 4.9 MN (1,090 kip) at the end of initial driving, 1,190 kip after one day, and 8.45 MN (1,900 kip) after 75 day set-up for pile C-44. Corresponding values for Pile B-44 were 4.5 MN (1,013 kip) at the end of initial driving and 9 MN (2,020 kip) after 75 day set-up. Use of Shoes to Increase Pile End Bearing The initial results of indicator piles D-44, C-44, and B-44 indicated that the piles had capacities between 4.45 and 5.34 MN (1,000 and 1,200 kip) at the end of initial driving. One to 6 day set-up indicated ultimate capacities of 5.34 to 7.5 MN (1,200 to 1,685 kip). These capacities were significantly smaller than the required design capacities with a factor of safety of 2.0. Consequently, piles C-4 and B-4 were fitted with 50- and 75-mm (2- and 3-in.) thick shoes with a length of about 230 mm (9 in.) welded inside the end of the pipe. The purpose of the shoes was to increase the end area so higher end bearing could be achieved in the dense sands below the pile tips.

10
1.37-m (54-inch) Pipe Piles with welded shoes
Pipe Pile Supports for LAXT Wharf
11

12
Piles D-4, C-4, B-4 Pile D-4 had no shoe and was driven by the vibratory hammer to about El. –22.6 m (-74 ft) and then driven with the IHC S-500 hammer. The pile was driven to the final penetration to El. –31 m (-103 ft) (21 m (69 ft) below seafloor) at a final blow count of 29 blows / 0.3 m ( 1 ft) with the IHC S-500 hammer delivering an energy of 149 m-kN (110 ft-kip). The pile driving blow count vs penetration are plotted in Fig. 6. The CAPWAP results (Table 1) indicated a capacity of 5 MN (1,114 kip) at the end of initial driving, 5.5 MN (1,241 kip) after two days set-up. Pile C-4 was driven with a 50-mm (2-in.) shoe and Pile B-4 had a 75-mm (3-in.) shoe. Results of the piles C-4 and B-4 are summarized in Table 1 and Fig. 6. The CAPWAP results (Table 1) indicated a capacity of 1,307 kip at the end of initial driving, 1,579 kip after two days set-up for Pile C-4. The corresponding values for Pile B-4 are 6.95 MN (1,563 kip) at the end of initial driving 7.9 MN (1,779 kip) after one day set-up. Piles 7G-26 and 8F-26 Based on an analysis of the low friction values obtained in the 1.37-m indicator piles B-44, C-44, and D-44, the length of the indicator piles G-26 and F-26 for the ramp was increased to 35 meters. Pile 7G-26 was 0.91-m (36-in.) in diameter, 16-mm (0.625-in.) wall, and 35-m (115-ft) long pile with a 50-mm (2-in.) thick shoe and was driven by the vibratory hammer to about El. –15.9 m (52 feet). Then it was driven with the Delmag D-80-32 diesel hammer. The pile was driven to El. –30.2 m (-99 ft), the PDA gages were removed and the final penetration to El. -31 m (102 ft) (27 m (89 ft) below seafloor) at a final blow count of 38 blows / 0.3 m (1 ft) with the diesel hammer delivering an energy of 111 m-kN (82 ft-kip). The CAPWAP results (Table 1) indicated a capacity of 4.8 MN (1,074 kip) at the penetration of 26 m (85 ft) before the gages were removed. Pile F-26.4 was 0.91-m (36-in.) diam., 16-mm (0.625-in.) wall, 35-m (115-ft) long pile with a 12-mm (0.5-in.) shoe. The pile was driven to El. –30.3 m (El. –99.5 ft) (23.5 m (77 ft) below seafloor), the PDA gages were removed. The CAPWAP results (Table 1) indicated a capacity of 3.6 MN (808 kip) at the penetration of 23.5 m (77 ft) before the gages were removed. The pile was driven again without PDA and had a blow count of 50 blows per 0.3 m (1 ft) or a capacity of about 5.7 MN (1,280 kips). Piles A-23, A-24, and C-31 Piles A-23, A-24, and C-31 were added to the original indicator program. Pile A-23 was 44-m (145-ft) long, had a 100-mm (4-in.) shoe and was driven to the final penetration to El. –39.3. m (-129 ft) (18.3 m (60 ft) below seafloor) at a final blow count of 21 blows / 0.3 m (1 ft) with the IHC S-500 hammer delivering an energy of 174 m-kN (128 ft-kip). The pile driving blow count vs penetration are plotted in Fig. 7. Pile A-24 was 44-m (145-ft) long, had a 75-mm (3-in.) shoe and was driven to El. –39.3 m (-129 ft) (18.3 m (60 ft) below seafloor) at a final blow count of 17 blows /

13
0.3 m (1 ft) with the IHC S-500 hammer delivering an energy of 159 m-kN (117 ft-kip). The pile driving blow count vs penetration are plotted in Fig. 7. The CAPWAP results (Table 1) indicated a capacity of 5.7 and 4.8 MN (1,280 and 1,080 kip) at the penetration of 18.3 m (60 ft) for A-23 and A-24, respectively. Pile A-25 was driven without a shoe and PDA measurements. Pile C-31 had a low blow count of 17 blows / 0.3 m (1 ft) at the end of driving (requirement of 21 blows / 0.3 m (1 ft)). The PDA instrumentation was attached on this pile after a 3 m (10 ft) add on was installed. The PDA monitoring was done after 14 days after the initial pile driving. The pile had a 75 mm (3 in.) shoe. The pile was driven to a final penetration of 20.7 m (68 ft) (El. –34 m (-112 ft)) with the hammer delivering an energy of 166 m-kN (122 ft-kip) and a blow count of 33. The CAPWAP results (Table 1) indicate a capacity of 7.3 and 7.1 MN (1,650 and 1,600 kip) at the beginning of restrike and end or restrike. Pile MD1 This was the indicator pile for west Mooring Dolphin, MD-1 and was 48-m (157.5-ft) long, 0.91-m (36-in.) diam. pile. Seafloor was at El. –16.5 m (-54 ft). The pile was vibrated to a tip El. –28 m (-92 feet). The pile was finally driven with D80-23 hammer to 26 m (86 ft) penetration (El. –42.7 m (-140 ft)) and the blow counts at start of restrike and end of driving were 58 and 76 blows per 0.3 m (1 ft) with the hammer delivering an energy of about 117 m-kN (86 ft-kip). The CAPWAP results (Table 1) indicate capacities of 4.9 MN (1,100 kip), 6 MN (1,350 kip) and 6.5 MN (1,450 kip) at the end of initial driving, beginning of restrike and end or restrike, respectively. This pile was retapped again after 139 days and had a capacity of 8.6 MN (1,935 kip). ANALYSES AND DISCUSSION 1.37-m (54-in.) Diameter Piles The initial results of indicator piles D-44, C-44, and B-44 showed that the piles had ultimate capacities between 4.45 MN (1,000 kip) and 5.3 MN (1,200 kip) at the end of initial driving. After set-up of one to six days, the ultimate capacities increased to 5.3 MN (1,200 kip) to 7.5 MN (1,685 kip). The ultimate end bearing for these piles ranged from 1070 to 1290 kN (240 to 290 kip). These capacities were significantly smaller than the required ultimate capacities. Piles C-4 and B-4 were fitted with 50- and 75-mm (2- and 3-in.) thick shoes providing total end area of 0.31 and 0.4 m2 (3.34 and 4.36 ft2) as compared to the normal 25-mm (1-in.) wall pile with an end area of 0.11 m2 (1.16 ft2). The purpose of the shoes was to increase the end area so that higher end bearing could be achieved in the dense sands near the pile tips. The CAPWAP results for Pile C-4 with a 50-mm (2-in.) shoe indicate a capacity of 5.8 MN (1,307 kip) at the end of initial driving and 7 MN (1,579 kip) after two days set-up. The CAPWAP results for Pile B-4 with a 75-mm (3-in.) shoe indicate a capacity of 6.96 MN (1,563 kip) at the end of initial

14
driving, and 7.92 MN (1,779 kip) after a one day set-up. The end bearing on the Pile C-4 with a 50-mm (2-in.) shoe was about 2.22 MN (500 kip) and for Pile B-4 with a 75-mm (3-in.) shoe was 3 MN (680 kip). These data indicated significant increase in end bearing capacity for the piles by the addition of the shoes where the tips were located in dense sand. Piles A-23, A-24, and C-31 were added to the original indicator program. The CAPWAP results indicated a capacity of 5.7 and 4.8 MN (1,280 and 1,080 kip) at the penetration of 18.3 m (60 ft) for A-23 and A-24, respectively. Pile A-23 had a 100-mm (4-in.) shoe and an end bearing capacity of 2.76 MN (620 kip). Pile A-24 had a 75-mm (3-in.) shoe and an end bearing of 1.84 MN (414 kip). The CAPWAP results and blow count data in Fig. 7 clearly show the effects of the shoe size. A comparison of the ultimate capacities at the end of initial driving (4 to 4.9 MN (900 kip to 1,100 kip)) and the design ultimate values (7.3 to 8.9 MN (1,642 to 2,006 kip)) indicated that unless significant set-up occurred, some additional measures will be required to achieve the design capacities. The limited data for 1 to 8 days set-up indicated increase in friction of about 50 % or about 1.56 MN (350 kip) may occur due to set-up. With the measured set-up, the capacity was not adequate to meet the ultimate design capacity. Although it was anticipated that some additional long-term set-up would occur, reliable estimate of long-term set-up could not be made without an extensive retap program extending over months to verify the increase in capacity. A lengthy retap program would be very expensive due to the standby of the barge and driving equipment. The options available for achieving the capacity assuming only the measured increase in friction after set-up, were: • increase the length of the piles by 4.6 to 6.1 m (15-20 feet) • wait for 30 days or longer and retap piles B-44 and C-44 to assess long-term set-
up • add shoes and increase length of selected piles in the heavy lift section Based on economics and lead time of ordering additional pile length from Japan (about 6 m per pile) or waiting for 30 days to verify additional set-up, or adding shoes which could be installed locally, shoes were incorporated in most piles. Some additional length was added to piles in the heavy lift section and selected A-row piles. Load Transfer in Friction and End Bearing When an open ended pipe pile is driven into the ground, the soil enters the pile in form of a plug. As long as the end bearing at the bottom of the plug is greater than the friction on the inside, the plug keeps moving up into the pile. In cases where the end bearing on the bottom of the plug is less than the inside friction, the plug no longer moves into the pile, the pile acts as a closed end pile and moves the soil ahead of the plug by bearing failure. This condition generally occurs in soft clay where the end bearing is low. For the POLA site where the soils are sands and stiff silts and clays, the plug moves into the pile and the length of the plug is generally a few feet shorter than the pile penetration. The ultimate capacity of the open ended pipe piles

15
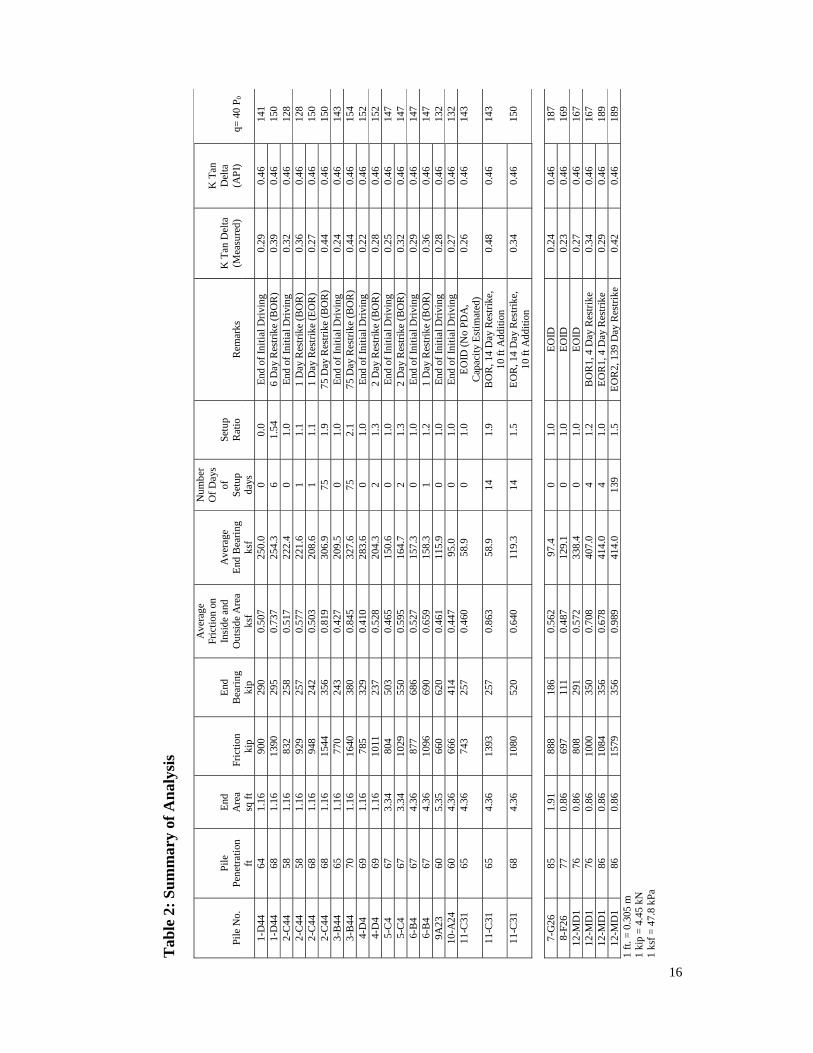
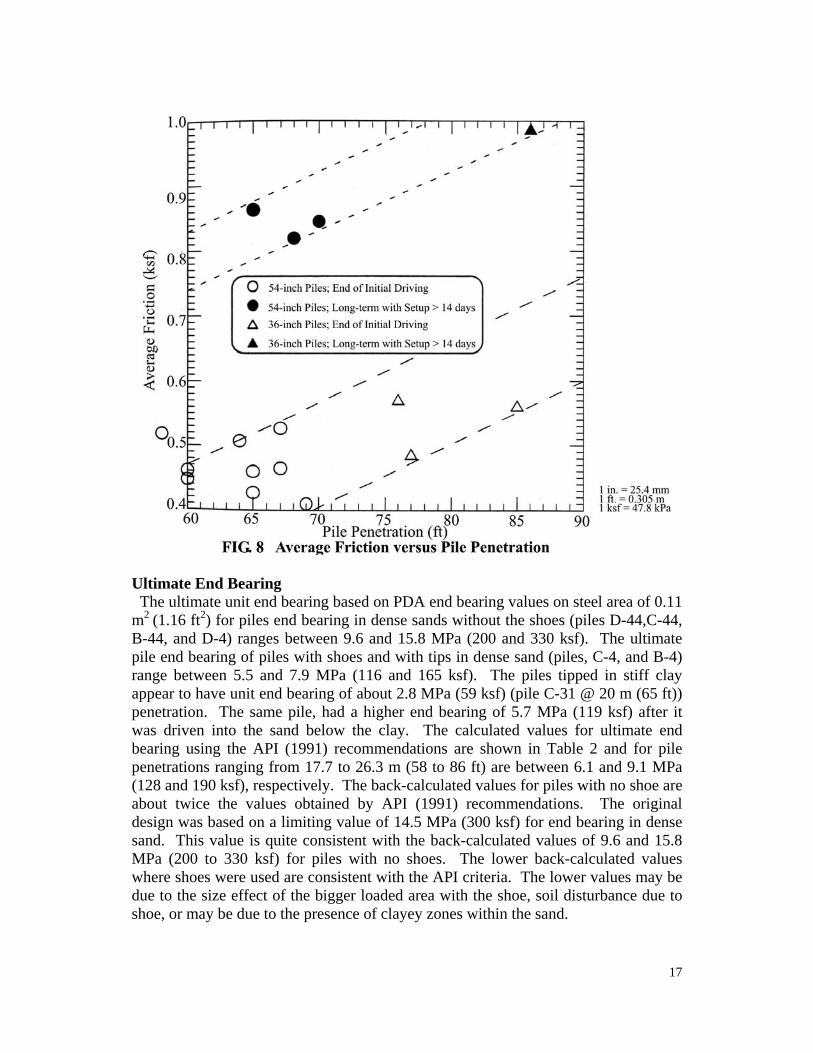
consists of outside and inside friction plus end bearing on the steel area or outside friction plus end bearing on the gross area of the pile, whichever is smaller. When the piles are end bearing in dense sands, as was the case at this site, the end bearing on the plug is much greater than the inside friction for the pile penetrations used in this project. The total capacity consists of inside and outside friction plus end bearing on the steel area. Ultimate Friction The results of our analysis of the data on the indicator piles are summarized in Table 2. The average friction was calculated by assuming that the total estimated friction is distributed between the friction on the outside and inside plug. For piles with shoes, the height of the plug was estimated by multiplying the penetration by (Di/Do)2, where Di is the inside diameter of the shoe and Do is the outside diameter of the pile or 1.37 m (54 inch). Observations for piles D-4, C-4, and B-4 indicated that for pile penetration of about 22.6 m (74 ft), the plug depths ranged between 22.3 m (73 ft) for no shoe to 20.4 m (67 ft) for 75 mm (3 in.) shoe and were very close to the theoretical values. The average unit friction for the piles vs pile penetration are plotted in Fig. 8. These data indicate that at the end of initial driving, the average unit friction ranges from 20 to 24 kPa (0.4 to 0.5 ksf) for about 18.3 m (60 ft) penetration and 25 to 32 kPa (0.5 to 0.67 ksf) for about 26.5 m (87 ft) penetration. After set-up ranging from 14 to over 120 days, the average unit friction ranges from 38 kPa to 48 kPa (0.8 to 1 ksf). Pile capacity for the offshore piles may be estimated by using the formula (API, 1991): f average = k p0 tan (δ) where: f average = average friction on the pile (both outside and inside) k = coefficient of lateral earth pressure p0 = effective overburden pressure δ = friction angle between pile wall and soil e also calculated the average {ktan(δ)} for the piles based on the PDA friction capacity. The {ktan(δ)} ranges between 0.22 and 0.32 for the end of initial driving condition and between 0.42 and 0.48 for long-term condition (after set-up). For open end pipe piles driven in dense sand, k may be taken as 0.8 and δ as 30 degrees. This results in a value of k tan (δ) of 0.46. Since a portion of the piles (15 to 30%) is driven in dense silt, the weighted average of {ktan(δ)} is about 0.4. The data in Table 2 indicate that long-term value of {ktan(δ)} ranges between 0.42 and 0.46 which correlates well with the theoretical values of 0.4 to 0.46 as recommended by API (1991). However, the {ktan(δ)} values at the end of initial driving of 0.22 to 0.32 are 50 to 60 % of the theoretical values as recommended by API.
16
Tab
le 2
: Sum
mar
y of
Ana
lysi
s
Pi
le N
o.
Pi
le
Pene
tratio
n
En
d A
rea
Fr
ictio
n
En
d B
earin
g
Ave
rage
Fr
ictio
n on
In
side
and
O
utsid
e A
rea
A
vera
ge
End
Bea
ring
Num
ber
Of D
ays
of
Setu
p
Se
tup
Rat
io
R
emar
ks
K
Tan
Del
ta
(Mea
sure
d)
K
Tan
D
elta
(A
PI)
q=
40
P 0
ft
sq ft
ki
p ki
p ks
f ks
f da
ys
1-
D44
64
1.
16
900
290
0.50
7 25
0.0
0 0.
0 En
d of
Initi
al D
rivin
g 0.
29
0.46
14
1 1-
D44
68
1.
16
1390
29
5 0.
737
254.
3 6
1.54
6
Day
Res
trike
(BO
R)
0.39
0.
46
150
2-C4
4 58
1.
16
832
258
0.51
7 22
2.4
0 1.
0 En
d of
Initi
al D
rivin
g 0.
32
0.46
12
8 2-
C44
58
1.16
92
9 25
7 0.
577
221.
6 1
1.1
1 D
ay R
estri
ke (B
OR
) 0.
36
0.46
12
8 2-
C44
68
1.16
94
8 24
2 0.
503
208.
6 1
1.1
1 D
ay R
estri
ke (E
OR
) 0.
27
0.46
15
0 2-
C44
68
1.16
15
44
356
0.81
9 30
6.9
75
1.9
75 D
ay R
estri
ke (B
OR
) 0.
44
0.46
15
0 3-
B44
65
1.16
77
0 24
3 0.
427
209.
5 0
1.0
End
of In
itial
Driv
ing
0.24
0.
46
143
3-B4
4 70
1.
16
1640
38
0 0.
845
327.
6 75
2.
1 75
Day
Res
trike
(BO
R)
0.44
0.
46
154
4-D
4 69
1.
16
785
329
0.41
0 28
3.6
0 1.
0 En
d of
Initi
al D
rivin
g 0.
22
0.46
15
2 4-
D4
69
1.16
10
11
237
0.52
8 20
4.3
2 1.
3 2
Day
Res
trike
(BO
R)
0.28
0.
46
152
5-C
4 67
3.
34
804
503
0.46
5 15
0.6
0 1.
0 En
d of
Initi
al D
rivin
g 0.
25
0.46
14
7 5-
C4
67
3.34
10
29
550
0.59
5 16
4.7
2 1.
3 2
Day
Res
trike
(BO
R)
0.32
0.
46
147
6-B
4 67
4.
36
877
686
0.52
7 15
7.3
0 1.
0 En
d of
Initi
al D
rivin
g 0.
29
0.46
14
7 6-
B4
67
4.36
10
96
690
0.65
9 15
8.3
1 1.
2 1
Day
Res
trike
(BO
R)
0.36
0.
46
147
9A23
60
5.
35
660
620
0.46
1 11
5.9
0 1.
0 En
d of
Initi
al D
rivin
g 0.
28
0.46
13
2 10
-A24
60
4.
36
666
414
0.44
7 95
.0
0 1.
0 En
d of
Initi
al D
rivin
g 0.
27
0.46
13
2 11
-C31
65
4.
36
743
257
0.46
0 58
.9
0 1.
0 EO
ID (N
o PD
A,
Cap
acity
Est
imat
ed)
0.26
0.
46
143
11-C
31
65
4.36
13
93
257
0.86
3 58
.9
14
1.9
BO
R, 1
4 D
ay R
estri
ke,
10 ft
Add
ition
0.
48
0.46
14
3
11-C
31
68
4.36
10
80
520
0.64
0 11
9.3
14
1.5
EOR
, 14
Day
Res
trike
, 10
ft A
dditi
on
0.34
0.
46
150
7-
G26
85
1.
91
888
186
0.56
2 97
.4
0 1.
0 EO
ID
0.24
0.
46
187
8-F2
6 77
0.
86
697
111
0.48
7 12
9.1
0 1.
0 EO
ID
0.23
0.
46
169
12-M
D1
76
0.86
80
8 29
1 0.
572
338.
4 0
1.0
EOID
0.
27
0.46
16
7 12
-MD
1 76
0.
86
1000
35
0 0.
708
407.
0 4
1.2
BO
R1, 4
Day
Res
trike
0.
34
0.46
16
7 12
-MD
1 86
0.
86
1084
35
6 0.
678
414.
0 4
1.0
EOR
1, 4
Day
Res
trike
0.
29
0.46
18
9 12
-MD
1 86
0.
86
1579
35
6 0.
989
414.
0 13
9 1.
5 EO
R2,
139
Day
Res
trike
0.
42
0.46
18
9 1
ft. =
0.3
05 m
1
kip
= 4.
45 k
N
1 ks
f = 4
7.8
kPa
17
Ultimate End Bearing The ultimate unit end bearing based on PDA end bearing values on steel area of 0.11 m2 (1.16 ft2) for piles end bearing in dense sands without the shoes (piles D-44,C-44, B-44, and D-4) ranges between 9.6 and 15.8 MPa (200 and 330 ksf). The ultimate pile end bearing of piles with shoes and with tips in dense sand (piles, C-4, and B-4) range between 5.5 and 7.9 MPa (116 and 165 ksf). The piles tipped in stiff clay appear to have unit end bearing of about 2.8 MPa (59 ksf) (pile C-31 @ 20 m (65 ft)) penetration. The same pile, had a higher end bearing of 5.7 MPa (119 ksf) after it was driven into the sand below the clay. The calculated values for ultimate end bearing using the API (1991) recommendations are shown in Table 2 and for pile penetrations ranging from 17.7 to 26.3 m (58 to 86 ft) are between 6.1 and 9.1 MPa (128 and 190 ksf), respectively. The back-calculated values for piles with no shoe are about twice the values obtained by API (1991) recommendations. The original design was based on a limiting value of 14.5 MPa (300 ksf) for end bearing in dense sand. This value is quite consistent with the back-calculated values of 9.6 and 15.8 MPa (200 to 330 ksf) for piles with no shoes. The lower back-calculated values where shoes were used are consistent with the API criteria. The lower values may be due to the size effect of the bigger loaded area with the shoe, soil disturbance due to shoe, or may be due to the presence of clayey zones within the sand.

18
Set-up The back-calculated {ktan(δ)} at the end of initial driving was about 50 to 60 % of the values estimated by using API(1991) criteria. The piles were retapped after waiting for periods of 1 to 139 days. The ratio of the friction after a specified number of days vs the friction at end of initial driving is plotted in Fig. 9. These data indicate a set-up of 1.2 to 1.5 for periods of 1 to 10 days and a set-up of 1.6 to 2 for periods ranging from 14 days to 139 days. Based on these data it appears that long-term friction capacity of the piles is expected to be on the order of about twice the capacity at the end of initial driving. The reduction of the pile capacity during driving occurs due to increase in pore pressures and reduction of effective stress. Since more than 60 to 70 percent of the pile lengths were embedded in dense sand, the high amount of set-up (or degradation of the friction capacity during driving) was not anticipated.
Reasons for High Set-up It was generally believed that high set-up occurs in clays and for piles driven in primarily in sand, the pore pressures are dissipated quickly and set-up is small and occurs quickly. Recent data (Axelsson, 2002) indicate that significant set-up (average of about 40% increase per log cycle of time between 1st and 2nd test) can occur in large displacement piles driven in sands. This set-up is attributed by Axelsson (2002) to soil aging and stress relaxation (creep) with time. The frictional capacity of the open-ended pipe piles consists of both the outside friction and inside friction of the plug. In these piles, the pore pressures on the inside

19
dissipate more slowly since for the middle of the pile, the pore water must travel half the pile length for the pore pressure to be dissipated. If the sand is interspersed with clay or silt (as is the case in LAXT site), the dissipation of pore pressures and therefore the development of full frictional capacity on the soil plug is very slow since the pore pressures must dissipate through the low permeability clay/silt layers to the end of the pile. This could increase the amount of set-up and slow the rate at which it occurs even more than the rate for closed end piles, such as concrete piles, tested by Axelsson (2002). The mechanism of increase in friction with time for large displacement piles proposed by Axelsson (2002) may not be directly applicable to open-ended pipe piles. For the open-ended pipe piles it is likely that the observed set-up is from a combination of increase in outside friction due to aging and creep and the slow pore pressure dissipation in the soil plug. The observed set-up factor of about 2 after 75 to 139 days for the LAXT piles is close to the high end of the data presented by Axelsson (2002). CONCLUSIONS The following conclusions can be made from this case history. 1. The estimated capacity by using API method provided a reasonable long-term
capacity of pipe piles driven into primarily sandy soils. 2. The actual capacities as measured by PDA and CAPWAP at the end of initial
driving were 50% or less than the long-term capacities. 3. The calculation of ultimate pile capacity using optimistic friction and end
bearing values based on CPT data and use of this value in pile driveability analyses indicated a much bigger hammer may be needed than was actually required.
4. The bigger hammer, when operated at a lower energy setting, drove the piles easily and faster without damage.
5. High set-up factors, on the order of up to two, may occur even in primarily sandy soils inter-layered with clay and silt layers due to the slow pore pressure dissipation and mobilization of friction in the soil plug and creep and stress relaxation on the outside friction.
6. For piles end bearing in dense sand, provision of shoes at the tip can be a more efficient and economical way to increase the capacity than increasing the pile length.
7. Based on a comparison of frictional capacity estimated by CAPWAP at the end of initial driving, no significant difference could be observed between piles with or without the shoes.
REFERENCES API RP2A (1991). "Recommended Practice for Planning, Designing and Constructing Fixed Offshore Platforms," American Petroleum Institute, p. 61. Axelsson, Gary (2002). “A Conceptual Model of Pile Set-up for Driven Piles in Non-cohesive Soil,” Deep Foundations 2002, Proceedings of the International Deep
20
Foundations Congress 2002, ASCE Geotechnical Special Publication No. 116, Vol. 1, pp. 64-79. Fugro-McClelland (1991). “Final Soils Report, 2020 Plan Geotechnical Investigation, Port of Los Angeles”. GEOFON, INC. (1993). "Geotechnical Analysis Report, Los Angeles Export Terminal's Berth and Site Preparation Project, Port of Los Angeles," a report prepared for The Ralph M. Parsons Company. GEOFON, INC. (1995). "Pile Foundation Installation, Offshore Berthing Area, Los Angeles Export Terminal's Berth and Site Preparation Project, Port of Los Angeles," a report prepared for The Ralph M. Parsons Company. McClelland, Bramlette (1974). “Design of Deep Penetration Piles for Ocean Structures,” Journal of Geotechnical Engineering Division, Proceedings of the American Society of Civil Engineers, Vol. 100, No. GT7, 709-747.
Recommended