Walden UniversityScholarWorks
Walden Dissertations and Doctoral Studies Walden Dissertations and Doctoral StudiesCollection
2017
Demographic Factors Associated with ConsistentHand Hygiene Adherence Among ICU NursesSharon Lea KurtzWalden University
Follow this and additional works at: https://scholarworks.waldenu.edu/dissertations
Part of the Epidemiology Commons, and the Nursing Commons
This Dissertation is brought to you for free and open access by the Walden Dissertations and Doctoral Studies Collection at ScholarWorks. It has beenaccepted for inclusion in Walden Dissertations and Doctoral Studies by an authorized administrator of ScholarWorks. For more information, pleasecontact [email protected].

Walden University
College of Health Sciences
This is to certify that the doctoral dissertation by
Sharon Kurtz
has been found to be complete and satisfactory in all respects, and that any and all revisions required by the review committee have been made.
Review Committee Dr. Richard Jimenez, Committee Chairperson, Public Health Faculty
Dr. Carla Riemersma, Committee Member, Public Health Faculty Dr. Patrick Tschida, University Reviewer, Public Health Faculty
Chief Academic Officer Eric Riedel, Ph.D.
Walden University 2017

Abstract
Demographic Factors Associated with Consistent Hand
Hygiene Adherence Among ICU Nurses
by
Sharon L. Kurtz
MPH, Capella University
BSN, Baylor University
BA, Pittsburg State University
Dissertation Submitted in Partial Fulfillment
of the Requirements for the Degree of
Doctor of Philosophy
Public Health
Walden University
February 2017

Abstract
Healthcare associated infections cause 75,000 to 80,000 deaths a year. Many are
preventable with proper hand hygiene adherence (HHA). Worldwide, HHA range is
between 40-60%, far below the 100% recommended. The purpose of this quantitative,
cross-sectional, prospective study was to investigate any association between 15
demographic variables and HHA of ICU nurses. A convenience sample of 613 hand
hygiene opportunities was collected by direct observation at each of 5ICUs (4 hospitals)
in Texas for 8 consecutive hours each day for 3-5 days. The theoretical foundation
guiding this study was the healthcare environment theory. The Statistical Package for
Social Sciences software was used for descriptive and inferential analysis of data. An
aggregated overall HHA rate of 64.09% was identified among all nurses, 66.88% among
male nurses and 62.27% among female nurses. Number of children, age of the nurse,
number of years of living in the U.S., and the number of years of active nursing practice
were significantly associated with HHA (p = .000) using paired sample t-test. The
potential social change impact of this study is identifying variables associated with HHA,
identification and measurement of 4 barriers to HHA, measuring the Hawthorne Effect,
identification of Low Gelers, High Gelers, and Super Gelers, average rate may not be
indicative of what is happening in hospital, and call for standardization of surveillance
methodology. Findings may lead to specific interventions to increase HHA among nurses
with certain demographic characteristics.

Demographic Factors Associated with Consistent Hand
Hygiene Adherence Among ICU Nurses
by
Sharon L. Kurtz
MPH, Capella University
BSN, Baylor University
BA, Pittsburg State University
Dissertation Submitted in Partial Fulfillment
of the Requirements for the Degree of
Doctor of Philosophy
Public Health
Walden University
February 2016

Dedication
This dissertation is dedicated to the Infection Control/Prevention professionals
(ICPs) who strive so relentlessly to increase the hand hygiene rates in their facilities. The
ICP community graciously and wholeheartedly supports ‘newbies’ or seasoned fellow
ICPs alike. There is a collective desire to ‘pay back for all of the help each of us received
when we were the ‘newbie’. I am hoping that the results obtained in this study will help
ICPs to better understand hand hygiene and to use this information to effect meaningful
changes in their interventions to increase hand hygiene with the ultimate goal of
decreasing healthcare associated infections (HAIs). This is my humble attempt to say
thank you to the infection prevention community and to give back a small part of their
generosity for all they have given to me throughout my infection prevention career. It
seems to be a common theme among ICPs that we have never had another job that has
frustrated us more, has overwhelmed us more, has challenged us more, or that we have
loved more. The challenges are monumental; the rewards are little to none. But there is a
passion that lives in our hearts that insanely makes it all worth it.

Acknowledgments
I also dedicate this dissertation to my family and particularly to my grandchildren,
Makayla, Quinten, Natalie, Preston, and Grant so they can understand the importance of
education and that it is never too late to increase your knowledge base. My family has
offered encouragement, support, and understood when I was not there for them because I
had to be in school. For all of them; my beloved sons, Kevin, Richard, and Brett and my
beautiful daughters-in-law; Christi, Helen, and Suzanne, thank you. And to the love of
my life, Richard, my husband for 37 years, I hope I have made you proud. You saw
potential in me that no one else saw. I wish you were here to share this with me. I am
hoping that my studies have helped to give our family a legacy, one of education,
learning, and achieving.
Although I cannot mention them by name since I am trying to protect the
confidentially of each of my data sites, I want to thank the four ICPs at each of my
hospitals that participated. I am humble and proud to call each of you, friend and
colleague.
I also would like to thank several special friends, Kathy Bianca, PhD; Mariana
Torchia, PhD; and Irene Campbell, PhD for being there to listen to the frustration, the
anguish, and to share the joys. Each of these remarkable women were on their own paths
to their PhDs in public health and have bolstered me in my journey because of their
unique understanding and shared experiences of this quest.
I also want to thank a very special friend, Elizabeth Ruth, whom I was blessed to
meet at breakfast in a small bed and breakfast in Grignon, France in 2001. As Lisa has

said, two ladies met at breakfast and discovered they were sisters, in heart and in the
French way, in the stomach. Lisa has listened to my joys and frustrations and has given
me wise advice and support when all others doubted the wisdom of my choices. Her
understanding of life is unparalleled. Sharing this life with her has indeed been a God
thing.
I would like to thank Patrick A. Tschida, Dr.PH, for serving as my University
Research Reviewer. He has been very kind and helpful with all of his suggestions to
move my dissertation forward to a better place.
I also want to thank Carla Riemersma, PhD, co chair of my dissertation
committee. She has always been encouraging and supporting towards my study, not only
for my dissertation, but when she was my course classroom mentor. I would like to think
of her also as a dear friend of whom I am dearly fond.
Most of all, I want to thank Dr. Richard Jimenez, Dr. P. H., FTPHA, the chair of
my dissertation committee. Never, anywhere could there be a better chair than Dr. J has
been. He has a true compassion for his students that was so clear in his mentoring,
support, and in his almost immediate responses when I asked him a question or sent in
work to be graded. He told me once that he always remembers what it was like when he
was working on his dissertation and how important it is to keep students working.
Dr. J., how can I possibly say the right words to let you know how indebted I am
to you for your support and help all of these months? Through your guidance, you have
made possible the rest of my life as someone far better than I was when I started this
journey. You have been the wind under my wings as you have taught me not only to fly

but also to soar, how to be a researcher, how to maneuver through the maze called
obtaining permission to come into the hospital and do research, and to broaden my
horizons and my mind to all of the possibilities. You have listened to my frustrations, my
anguish, shared my joys, and supported me with wise counsel always. Merci de tout mon
cœur, Dr. J.

i
Table of Contents
List of Tables ...................................................................................................................... v
List of Figures ................................................................................................................... vii
Chapter 1: Introduction to the Study ................................................................................... 1
Background of the Study .............................................................................................. 7
Problem Statement ........................................................................................................ 9
Purpose of this Study .................................................................................................. 13
Research Questions and Hypotheses .......................................................................... 14
Theoretical Foundation ............................................................................................... 21
Nature of the Study ..................................................................................................... 25
Definitions ................................................................................................................... 27
Assumptions ................................................................................................................ 30
Scope and Delimitations ............................................................................................. 30
Limitations .................................................................................................................. 31
Significance of the Study ............................................................................................ 33
Summary and Transition ............................................................................................. 36
Chapter 2: Literature Review ............................................................................................ 37
Problem and Purpose .................................................................................................. 37
Synopsis of Current Literature .................................................................................... 38
Preview of Major Sections of Chapter Two ............................................................... 39
Literature Review Strategies ....................................................................................... 40
Theoretical Foundation ............................................................................................... 43

ii
Expectations ................................................................................................................ 53
Literature Review: Overview of Hand Hygiene ......................................................... 63
Literature Review: Historical Background ................................................................. 70
Risk Factors Associated with Nonadherence of Hand Hygiene ................................. 80
Impact of HAIs in Relationship to Infection Rates ..................................................... 95
Impact of Increasing Hand Hygiene in Relationship to Decreasing HAIs ................. 99
Methodology and Methods Consistent with the Scope of the Study ........................ 100
Rationale for Selection of Variables ......................................................................... 107
Previously Studied Demographic Variables ............................................................. 108
Demographic Factors Not Previously Studied .......................................................... 111
Positive Social Change ............................................................................................. 124
What is Controversial ............................................................................................... 126
What Remains to be Studied ..................................................................................... 128
Major Themes in the Literature ................................................................................ 128
Chapter 3: Research Method ........................................................................................... 131
Introduction ............................................................................................................... 131
Research Design and Rationale ................................................................................ 131
Methodology: Population .......................................................................................... 137
Sampling and Sampling Procedures ......................................................................... 138
Procedures for Recruitment, Participation, and Data Collection .............................. 151
Information on a Pilot Study ..................................................................................... 154
Researcher Instruments ............................................................................................. 155

iii
Operationalization for Each Variable ....................................................................... 158
Data Analysis Plan .................................................................................................... 168
Research Questions and Hypotheses ........................................................................ 169
Threats to Validity .................................................................................................... 178
Ethical Procedures .................................................................................................... 185
Summary of Design and Methodology of the Method of Inquiry ............................ 188
Chapter 4: Results ........................................................................................................... 191
Review of Purpose, Research Questions, and Hypotheses ....................................... 191
Data Collection Methodology ................................................................................... 193
Discrepancies of Data Collection .............................................................................. 195
Results of Hand Hygiene Surveillance ..................................................................... 198
Descriptive Analysis ........................................................................................... 198
Results of Data Collection for Hand Hygiene Surveillance ..................................... 208
The Hawthorne Effect ......................................................................................... 210
Results of Variables Analysis ................................................................................... 229
Effect Size and Power ......................................................................................... 229
Summary ................................................................................................................... 243
Chapter 5: Discussion, Recommendations, and Conclusions ......................................... 245
Purpose and Nature of the Study .............................................................................. 245
Summarization and Interpretation of Key Findings .................................................. 246
Observation Technique ............................................................................................. 252
Identification of Super Gelers, High Gelers, and Low Gelers .................................. 254

iv
The Hawthorne Effect ............................................................................................... 258
Barriers to Hand Hygiene Adherence ....................................................................... 265
Analysis and Interpretation of the Findings in the Context of Healthcare ............... 269
Limitations of the Study ............................................................................................ 275
Recommendations: Gaps Still Existing .................................................................... 278
Recommendations for Practice ................................................................................. 279
Implication for Positive Social Change .................................................................... 281
Conclusion ................................................................................................................ 282
References ................................................................................................................. 284
v
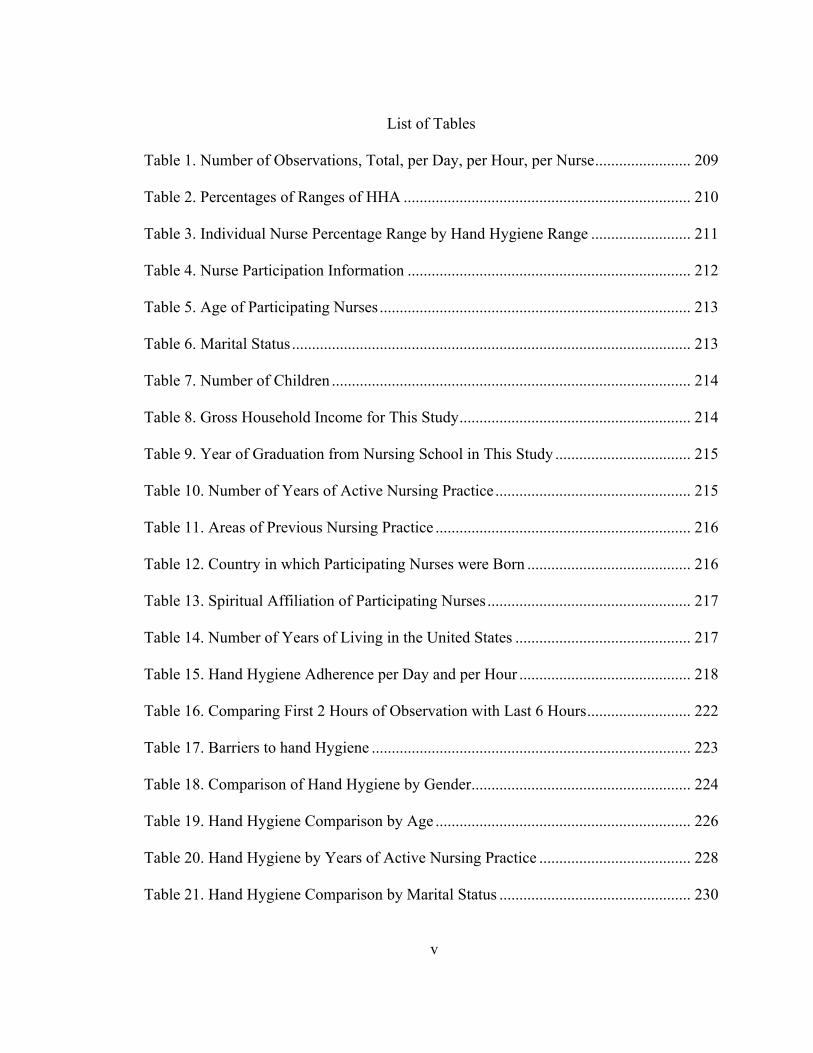
List of Tables
Table 1. Number of Observations, Total, per Day, per Hour, per Nurse ........................ 209
Table 2. Percentages of Ranges of HHA ........................................................................ 210
Table 3. Individual Nurse Percentage Range by Hand Hygiene Range ......................... 211
Table 4. Nurse Participation Information ....................................................................... 212
Table 5. Age of Participating Nurses .............................................................................. 213
Table 6. Marital Status .................................................................................................... 213
Table 7. Number of Children .......................................................................................... 214
Table 8. Gross Household Income for This Study .......................................................... 214
Table 9. Year of Graduation from Nursing School in This Study .................................. 215
Table 10. Number of Years of Active Nursing Practice ................................................. 215
Table 11. Areas of Previous Nursing Practice ................................................................ 216
Table 12. Country in which Participating Nurses were Born ......................................... 216
Table 13. Spiritual Affiliation of Participating Nurses ................................................... 217
Table 14. Number of Years of Living in the United States ............................................ 217
Table 15. Hand Hygiene Adherence per Day and per Hour ........................................... 218
Table 16. Comparing First 2 Hours of Observation with Last 6 Hours .......................... 222
Table 17. Barriers to hand Hygiene ................................................................................ 223
Table 18. Comparison of Hand Hygiene by Gender ....................................................... 224
Table 19. Hand Hygiene Comparison by Age ................................................................ 226
Table 20. Hand Hygiene by Years of Active Nursing Practice ...................................... 228
Table 21. Hand Hygiene Comparison by Marital Status ................................................ 230

vi
Table 22. Hand Hygiene Comparison by Number of Children ...................................... 231
Table 23. Hand Hygiene Comparison by Gross Household Income .............................. 232
Table 24. Comparison of Hand Hygiene by Degree Program ........................................ 232
Table 25. Comparison of hand Hygiene in Regards Where the Nurse Born ................. 234
Table 26. Comparison of Hand Hygiene with Ancestry of Nurse .................................. 236
Table 27. Comparison of Hand Hygiene with Spiritual Affiliation ................................ 238
Table 28. Model Summary ............................................................................................. 244
Table 29. Coefficient Table ............................................................................................ 245
Table 30. Comparison of HHA with Two Dependent Variables using Chi Square ....... 247
Table 31. Significant Relationships of IV using the Paired Samples t-Test ................... 248
Table 32. Significant Relationships of IV using the Paired Sample t-Test.……………249

vii
List of Figures
Figure 1. Proposed healthcare environment theory .......................................................... 55
Figure 2. HHA rate per hour of observation (aggregate data all five ICUS) ................. 219
Figure 3. HHA – Yes/No observations (aggregate data all 5 ICUs) ............................... 220
Figure 4. Comparison of hand hygiene by age ............................................................... 227 Figure 5. Hand hygiene by years of active nursing practice ........................................... 229 Figure 6. Comparison of hand hygiene by degree program ............................................ 233 Figure 7. Comparison of hand hygiene based on country in which nurse was born ...... 235 Figure 8. Comparison of hand hygiene by ancestry ....................................................... 237 Figure 9. Comparison of hand hygiene by spiritual affiliation ....................................... 239

1
Chapter 1: Introduction to the Study
Everyone participates in hand hygiene from the time they are very young
continuing throughout their lifetime. As long as individuals are exposed only to their own
bacteria, either bodily or environmentally, there is usually no problem, unless the
immune system fails and a common bacteria becomes pathogenic (Arabestani, Fazzeli,
& Esfahani, 2014). The problem arises when there is exposure to another person’s
bacteria. The most common way bacteria are transferred from one person to another is by
the hands (WHO, First Global Patient Safety Challenge, 2009). People sneeze or cough
into their hands and, without cleansing or sanitizing the hands; they shake hands, touch
each other, or touch surfaces. This becomes especially problematic when the person
without the clean hands is a nurse and the other person is a vulnerable patient who is in a
weakened or immunocompromised state. Because of the multiple tasks involved in caring
for a patient, there are many touch opportunities. Organisms may be transferred from a
nurse to a patient, from a patient to a nurse, from a patient to another patient via the
healthcare worker’s (HCW) hands, from a nurse or a patient to a family member or
visitor, from a family member or visitor to a patient or nurse, or to the nurse’s coworkers
or to his/her own family.
A study in Iran showed that 51% of the environment in patient rooms was
contaminated and 34.5% of the samples taken from HCWs were contaminated with
organisms (Tajeddin et al., 2016). HCW’s hands were contaminated with organisms
between 26.9% and 46.9% of the time (Tajeddin et al., 2016). Patient files were
contaminated 32% of the time (Tajeddin et al., 2016). While this means that two-thirds of

2
the patient files were not contaminated, with bacteria being invisible, it is impossible to
identify a contaminated file (chart). Organisms identified on the hands of the HCWs were
Acinetobacter baumannii, Staphylococcus aureus, Staphylococcus epidermidis, and
Enterococcus spp, imipenem resistant Acinetobacter, MRSA, and VRE (Tajeddin et al.,
2016). The most commonly contaminated sites identified were the patients’ oxygen
masks (81.8%), ventilators (82.9%), and bed linens (67.7%) (Tajeddin et al., 2016). Thus,
the necessity of treating all objects as contaminated becomes apparent.
The single most effective way to prevent the transfer of organisms is to participate
in hand hygiene before and after being with a patient (Association for Professionals in
Infection Control and Epidemiology [APIC], Guide to Hand Hygiene, 2015; Azim,
Juergens, & McLaws, 2016; Eveillard et al., 2011; Jansson et al., 2016; Kingston,
O’Connell, & Dunne, 2016; Pittet, 2001; Pittet et al., 2006; Sax et al., 2009; Taneja &
Mishra, 2015; Thu et al, 2015). One study cited 38% of infections are estimated to occur
because of cross-transmission (Sickbert-Bennett et al., 2016a). Since 1847 when
Semmelweis implored his fellow physicians and residents to wash their hands, the
message has been there (Semmelweis, 2009a). In order to lower infection rates and
protect patients, HCWs need to participate in hand hygiene. But despite this proven
advice being around since 1847, adherence with hand hygiene ranges from 40-60%
average with rates as low as single digits and as high as the 90th percentile (Erasmus et
al., 2010). Despite being well educated, physicians, as a group, only marginally
participate in hand hygiene (Azim et al., 2016; Johnson et al., 2014; Medeiros et al.,
2015; Randle, Arthur, & Vaughan, 2010; Su et al., 2015; Wetzker et al., 2016).

3
With multiple organisms, many being multidrug resistant, being based in hospitals
today, the answer as to why HCWs ignore the pleas of the Infection Control Professional
(ICPs) to wash their hands is unknown. What triggers the automatic response of wanting
to wash one’s hands in elective hand hygiene is unknown. Putting up posters encouraging
hand hygiene or doing a single educational intervention has proven to be ineffective with
rates quickly returning to baseline levels once the intervention is completed (Rodak,
2013). Studies currently being done are showing some success with a multidisciplinary
approach (Castro-Sánchez, Chang, Vila-Candel, Escobedo, & Holmes, 2016; Kingston et
al., 2016; Sadatsafavi, Niknejad, Zadeh, & Sadatsafavi, 2016; Taneja & Mishra, 2015;
Watson, 2016). Qualitative studies are starting to appear in the literature in which the
nurses are being asked why they are not adherent (Erasmus et al., 2009; Erasmus et al.,
2010). Behavioral reasons are beginning to be investigated instead of making
interventions without understanding the reasons for nonadherence (Erasmus et al., 2009).
But to date, no study has been able to identify an intervention to move hand hygiene
among HCWs to a sustainable 100% adherence. The seemingly simple physical task of
washing one’s hands is actually a very complex behavioral act but the motivation to
move this act to a 100% inherent and elective adherence behavior has not been fully
identified.
Healthcare associated infections (HAIs) are expensive to the patient, the hospital,
and the community (Zimlichman et al., 2013). They increase length of stay, increase
hospital costs, push antibiotic resistance because of the increased need for additional
antibiotics, and increase mortality (Geffers, Sohr, & Gastmeier, 2008). The number one

4
way to prevent HAIs is through the simple act of hand hygiene (APIC Guide to Hand
Hygiene, 2015; Azim et al., 2016; Eveillard et al., 2011; Jansson et al., 2016; Kingston et
al., 2016; Sax et al., 2009; Sunkesula et al., 2015; Taneja & Mishra, 2015; Thu et al.,
2015; Watson, 2016).
The purpose of this study was to investigate if there was an association between
15 demographic variables and hand hygiene adherence (HHA) in ICU nurses. Very little
research has been done on demographic variables with the exception of gender and job
description. Several studies have been done on age as a variable. One study by Al-
Hussami, Darawad, Almhairat (2011) looked at these predictors (age, gender, marital
status, educational level, years of experience, unit of experience, and yearly income)
related to self-reported handwashing and found significant positive association only with
age and years of experience. Diller et al. (2014) found age to be a significant predictor of
hand hygiene but not gender. But no studies have been identified in which the following
variables were studied as a possible influence on hand hygiene; (a)number of children,
(b) family income, (c) year of graduation from nursing school, (d) number of years of
active nursing practice, (e) hospital employee or agency nurse, (f) areas of previous
nursing practice, (g) degree program (associate nursing degree, diploma degree, BSN,
masters of nursing or masters in another field, PhD, or DNP), (h) country in which the
nurse was born, (i) country from which nurse graduated nursing school, (j) ancestry, (k)
spiritual affiliation, and (l) the number of years living in the United States. Nor has an
association been looked at in regards to individual nurses own hand hygiene adherence
rates in regards to these variables. If any of these factors prove to be associated with hand

5
hygiene adherence rates, interventions incorporating these factors can be directed at the
HCW population.
Social change in this study will involve generating a better understanding of the
behavior associated with hand hygiene. Adding to the general knowledge base of hand
hygiene adherence will eventually assist in the development of strategies and
interventions to drive hand hygiene adherence to sustainable 100% compliance. The
short- and long- term impact on social change may be the prevention of nosocomial or
HAIs and bettering the health and welfare of patients. A possible social change potential
may be an influence on the hiring practices at hospitals, changing the nursing curriculum
in nursing schools to emphasis additional hand hygiene education and its importance, and
the infection control departments and public health departments might possibly alter
techniques to facilitate the teaching of certain groups shown to be more adherent or
nonadherent with hand hygiene. Different age groups and different cultural groups may
need specific teaching on the importance of hand hygiene. If certain variables are found
to be associated with hand hygiene, then educators and program developers can design
interventions to have a greater impact with sustainability on certain target populations.
With almost three million registered nurses in the United States (The Registered Nurse
Population, 2010), the total population this study could affect is large. It is assumed that
any knowledge gained from this study will help to increase the safely environment in the
hospital for the patients and the HCWs. If variables can be identified that are associated
with increased hand hygiene adherence, then meaningful and sustainable interventions
can be designed for those groups less adherent. With education to targeted populations,

6
increased hand hygiene adherence would bring about a reduction in HAIs. This will
affect an increase in the safety of the patient, reduce length of stay, reduce costs to the
hospital and the patient, reduce antibiotic prescribing which will affect a decrease in
antibiotic resistance, and improve mortality (Hessels & Larson 2016). With a reduction of
HAIs and multidrug resistant organism infections in the hospital, the community to which
the patient will be returning will be a healthier community. If hand hygiene adherence
can be increased in the hospitals, then there will also be a corresponding increase in hand
hygiene in the community, which will affect a decrease in the spread of infection diseases
worldwide (Whitby, McLaws, & Ross, 2006). With a reduction of disease burden in
communities, business productivity and school attendance should improve.
Chapter 1 includes an introduction to this study and the positive social change
implications. It will also include a short background to summarize the current literature
about hand hygiene adherence plus a discussion of an identified gap in the knowledge
base this study will address along with a rational for this study. The research problem will
be stated with significance to the adherence of hand hygiene. The next section will
contain the purpose of this study, the intent, and discussion of the variables. The research
questions and hypothesis, the association being tested, and how the variables will be
measured are also included in this chapter. The following section will discuss the
theoretical foundation for this study and explore the conceptual framework of the
healthcare environment theory by Bronfenbrenner (1994). A section dealing with
definitions of variables, definition of terms, and operational definitions will follow. The
scope, limitations, and delimitations as well as the generalizability of this study are

7
presented. I conclude the chapter with a discussion on the limitations to this study’s
significance and potential contributions.
Background of the Study
HAIs in the U.S. are causing approximately 75,000 to 80,000 deaths a year
(Hessels & Larson, 2016; Pfoh, Dy, & Engineer, 2013; Pyrek, 2014) at an annual cost
between $28.4 to $33.8 billion (Scott, 2009) and $96-$147 billion (Marchetti & Rossiter,
2013). The annual attributable direct costs of HAIs are $9.8 billion in the United States
and €7 billion in Europe (Hessels & Larson, 2016). In one Swedish study, patients with
an HAI were more likely to be readmitted to the hospital than patients with no HAIs
(29.0% vs 16.5%) with the excess length of stay (LOS) comprising 11.4% of the total
costs (Rahmqvist, Samuelsson, Bastami, & Rutberg, 2016). In Australia, approximately
200,000 HAIs are reported annually in the acute health care setting (Jain et al., 2015). In
the European Union, an estimated 4,544,100 HAIs are occurring annually with a resultant
mortality rate of 37,000 deaths and 16 million extra hospital days (Zingg et al., 2015).
The most cost effective way to reduce HAIs is through the increase of hand hygiene
adherence (APIC Guide to Hand Hygiene, 2015; Azim et al., 2016; Eveillard et al., 2011;
Jain et al., 2015; Jansson et al., 2016; Kapil, Bhavsar, & Madan, 2015; Kingston et al.,
2016; McGuckin & Govednik, 2015; Pittet, 2001; Pittet et al., 2006; Sax et al., 2009;
Taneja & Mishra, 2015; Thu et al, 2015; White et al., 2015; World Health Organization,
2009). Unfortunately current hand hygiene adherence rates fall within the range of 40-
60% (Erasmus et al., 2010). A study conducted at 35 different hospitals in the U.S.
reported an overall rate of 38% with 13,772,022 hand hygiene opportunities complied
8
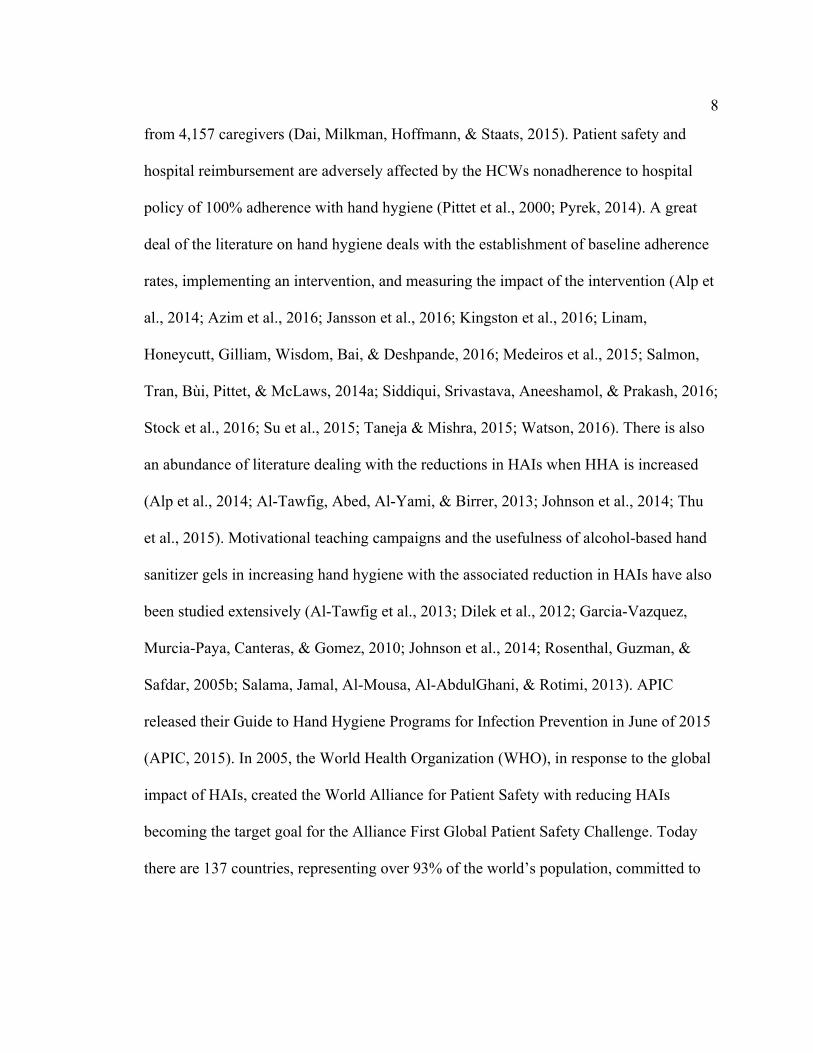
from 4,157 caregivers (Dai, Milkman, Hoffmann, & Staats, 2015). Patient safety and
hospital reimbursement are adversely affected by the HCWs nonadherence to hospital
policy of 100% adherence with hand hygiene (Pittet et al., 2000; Pyrek, 2014). A great
deal of the literature on hand hygiene deals with the establishment of baseline adherence
rates, implementing an intervention, and measuring the impact of the intervention (Alp et
al., 2014; Azim et al., 2016; Jansson et al., 2016; Kingston et al., 2016; Linam,
Honeycutt, Gilliam, Wisdom, Bai, & Deshpande, 2016; Medeiros et al., 2015; Salmon,
Tran, Bùi, Pittet, & McLaws, 2014a; Siddiqui, Srivastava, Aneeshamol, & Prakash, 2016;
Stock et al., 2016; Su et al., 2015; Taneja & Mishra, 2015; Watson, 2016). There is also
an abundance of literature dealing with the reductions in HAIs when HHA is increased
(Alp et al., 2014; Al-Tawfig, Abed, Al-Yami, & Birrer, 2013; Johnson et al., 2014; Thu
et al., 2015). Motivational teaching campaigns and the usefulness of alcohol-based hand
sanitizer gels in increasing hand hygiene with the associated reduction in HAIs have also
been studied extensively (Al-Tawfig et al., 2013; Dilek et al., 2012; Garcia-Vazquez,
Murcia-Paya, Canteras, & Gomez, 2010; Johnson et al., 2014; Rosenthal, Guzman, &
Safdar, 2005b; Salama, Jamal, Al-Mousa, Al-AbdulGhani, & Rotimi, 2013). APIC
released their Guide to Hand Hygiene Programs for Infection Prevention in June of 2015
(APIC, 2015). In 2005, the World Health Organization (WHO), in response to the global
impact of HAIs, created the World Alliance for Patient Safety with reducing HAIs
becoming the target goal for the Alliance First Global Patient Safety Challenge. Today
there are 137 countries, representing over 93% of the world’s population, committed to

9
the Clean Care is Safer Care global campaign in the universal effort to reduce HAIs
(WHO webinar, May 05, 2015a).
A gap in knowledge exists as the reasons why nurses are not 100% adherent with
hand hygiene guidelines are unknown, even though it is self-protective. There is little
research on demographic variables other than gender, job description of HCW, and age.
This study is needed because if variables can be identified which are associated with hand
hygiene adherence rates, then meaningful and sustainable interventions can be designed
to impact groups with the lowest rates in an effort to increase adherence. Increased
adherence will affect a reduction in HAIs which will lead to increased patient safety and
lower mortality rates for the patient, shortened length of stay, reduction of costs for the
patient, reduction in multidrug resistant organisms because less antibiotics will be
prescribed, improved reimbursement for the hospitals, and a healthier community
(Rahmqvist et al., 2016; Schweizer et al., 2014).
Problem Statement
The problem statement for this study is as follows: Hand hygiene adherence rates
among HCWs worldwide vary between 40-60% (Dai et al., 2015; Erasmus et al., 2010)
while guidelines and recommendations in hand hygiene advocate 100% adherence in
order to reduce HAIs. Reasons for nonadherence are not completely understood. Because
little research has been conducted regarding the role of demographic variables on hand
hygiene adherence, this research has been undertaken to investigate if there is an
association between hand hygiene adherence and the 15 demographic variables being
reviewed.

10
With world travel bringing emerging organisms from all parts of the globe to
unexposed regions, with the problem of multidrug resistant organisms, the increased
populations of immunocompromised individuals, and the burden of healthcare costs,
hand hygiene adherence remains a current, relevant, and significant problem (Schweizer
et al., 2014) despite the 169 year effort to get HCWs to wash their hands before and after
treating patients (Pittet & Boyce, 2001). New products, such as the alcohol gel sanitizers,
have been developed to decrease the time required to participate in hand hygiene and to
increase the adherence rate (Boyce & Pittet, 2002). New technologies are being
developed such as badges that detect the presence of the alcohol gel on the nurse’s hands
indicating he/she has been adherent (Biovigil, 2013). The emergence of Middle East
Respiratory Syndrome coronavirus (MERS-CoV) in Saudi Arabia (Arabi et al., 2014) and
the Ebola epidemic in Africa (Isakov, Jamison, Miles, & Ribner, 2014) has highlighted
the importance of hand hygiene adherence in the transmission of dangerous
communicable diseases. The Centers for Disease Control and Prevention (CDC) has
emphasized the use of standard precautions, contact precautions, and droplet precautions
as protective measures (Siegel, Rhinehart, Jackson, Chiarello, and Healthcare Infection
Control Practices Advisory Committee, 2007). Also included in the preventive measures
are the development and implementations of appropriate administrative policies, work
practices, and environmental controls such as focused education, training, and
supervision (Isakov et al., 2014). It is difficult to get HCWs involved at this level of
protection when they are inconsistent with hand hygiene practices (Isakov et al., 2014).
11
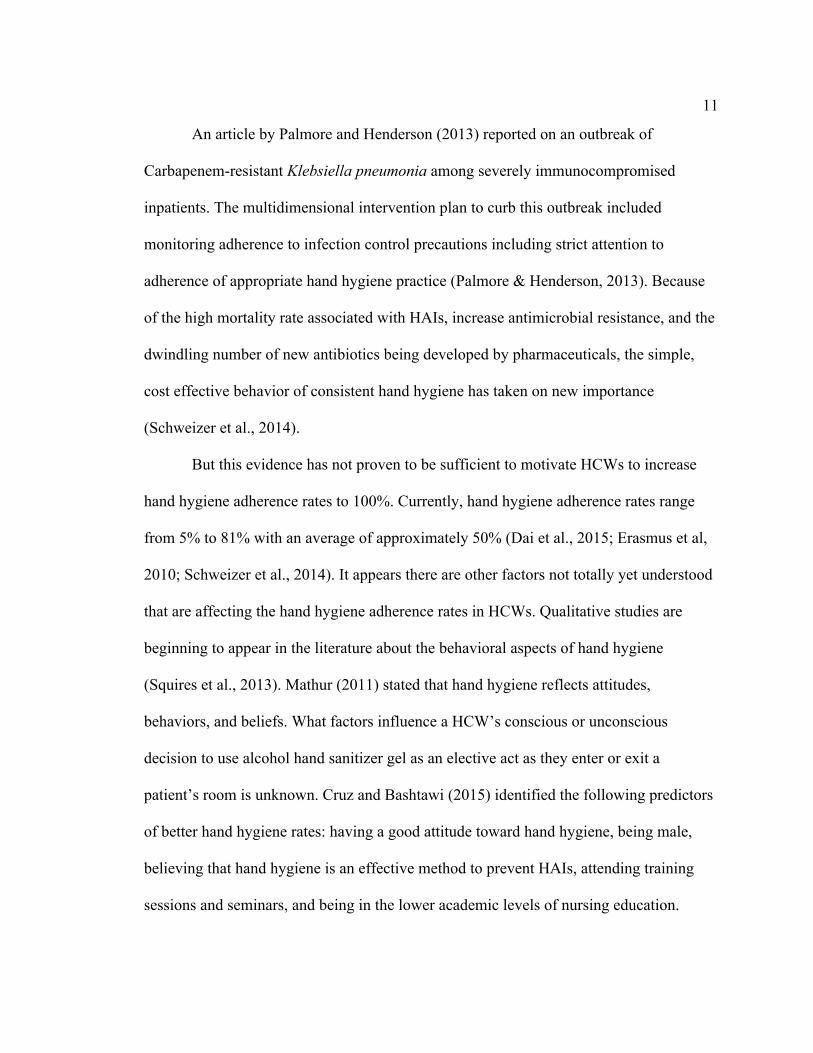
An article by Palmore and Henderson (2013) reported on an outbreak of
Carbapenem-resistant Klebsiella pneumonia among severely immunocompromised
inpatients. The multidimensional intervention plan to curb this outbreak included
monitoring adherence to infection control precautions including strict attention to
adherence of appropriate hand hygiene practice (Palmore & Henderson, 2013). Because
of the high mortality rate associated with HAIs, increase antimicrobial resistance, and the
dwindling number of new antibiotics being developed by pharmaceuticals, the simple,
cost effective behavior of consistent hand hygiene has taken on new importance
(Schweizer et al., 2014).
But this evidence has not proven to be sufficient to motivate HCWs to increase
hand hygiene adherence rates to 100%. Currently, hand hygiene adherence rates range
from 5% to 81% with an average of approximately 50% (Dai et al., 2015; Erasmus et al,
2010; Schweizer et al., 2014). It appears there are other factors not totally yet understood
that are affecting the hand hygiene adherence rates in HCWs. Qualitative studies are
beginning to appear in the literature about the behavioral aspects of hand hygiene
(Squires et al., 2013). Mathur (2011) stated that hand hygiene reflects attitudes,
behaviors, and beliefs. What factors influence a HCW’s conscious or unconscious
decision to use alcohol hand sanitizer gel as an elective act as they enter or exit a
patient’s room is unknown. Cruz and Bashtawi (2015) identified the following predictors
of better hand hygiene rates: having a good attitude toward hand hygiene, being male,
believing that hand hygiene is an effective method to prevent HAIs, attending training
sessions and seminars, and being in the lower academic levels of nursing education.
12
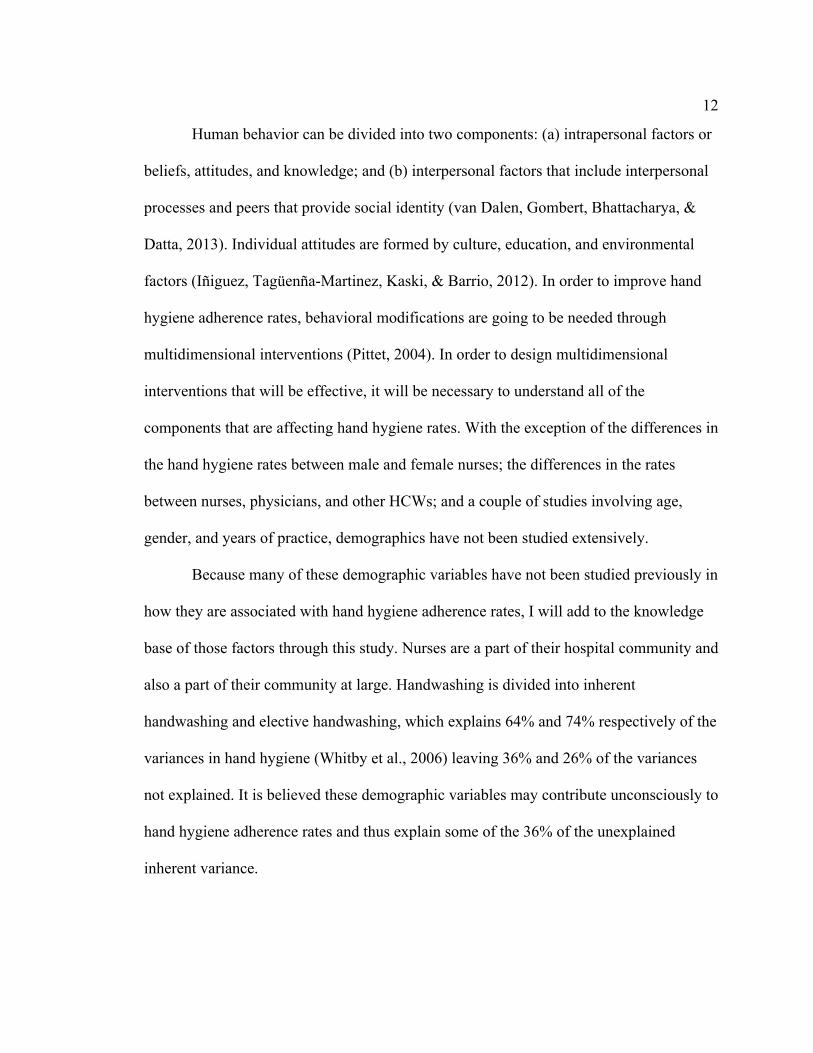
Human behavior can be divided into two components: (a) intrapersonal factors or
beliefs, attitudes, and knowledge; and (b) interpersonal factors that include interpersonal
processes and peers that provide social identity (van Dalen, Gombert, Bhattacharya, &
Datta, 2013). Individual attitudes are formed by culture, education, and environmental
factors (Iñiguez, Tagüenña-Martinez, Kaski, & Barrio, 2012). In order to improve hand
hygiene adherence rates, behavioral modifications are going to be needed through
multidimensional interventions (Pittet, 2004). In order to design multidimensional
interventions that will be effective, it will be necessary to understand all of the
components that are affecting hand hygiene rates. With the exception of the differences in
the hand hygiene rates between male and female nurses; the differences in the rates
between nurses, physicians, and other HCWs; and a couple of studies involving age,
gender, and years of practice, demographics have not been studied extensively.
Because many of these demographic variables have not been studied previously in
how they are associated with hand hygiene adherence rates, I will add to the knowledge
base of those factors through this study. Nurses are a part of their hospital community and
also a part of their community at large. Handwashing is divided into inherent
handwashing and elective handwashing, which explains 64% and 74% respectively of the
variances in hand hygiene (Whitby et al., 2006) leaving 36% and 26% of the variances
not explained. It is believed these demographic variables may contribute unconsciously to
hand hygiene adherence rates and thus explain some of the 36% of the unexplained
inherent variance.

13
I will also be adding to the knowledge base because of the methodology of the
surveillance done in this study on individual hand hygiene rates by the ICU nurses. Due
to the multiple tasks required of the infection prevention departments, surveillance
periods for hand hygiene are usually under an hour or the task is passed to individuals
outside of the infection prevention department who may be required to collect only 10-30
observations per month in 10-20 minute sessions (Pittet et al., 2000; WHO, 2009). Audits
tend to be randomly chosen for the convenience of the observer (Larson, Aiello, &
Cimiotti, 2004; Linam et al., 2016). However, due to the high expectations of the hospital
administration and regulatory agencies, these rates are frequently reported to be in the 95-
100% range of adherence (The Joint Commission, 2009). Hand hygiene adherence
averaged 9% higher for observers who were observing their own units compared to when
they were observing other units (Linam et al., 2016). Observers tend to watch HCWs who
are adherent rather than all HCWs. Chapter 4 includes a description of the surveillance
method used in this study.
Purpose of this Study
The purpose of this study is to investigate, through quantitative analysis, if an
association exits between any of these following 15 independent demographic variables:
(1) date of birth (age), (2) gender, (3) marital status, (4) number of children, (5) family
income, (6) year of graduation from nursing school, (7) number of years of active nursing
practice, (8) hospital employee or agency nurse, (9) areas of previous nursing practice,
(10) degree program (associate nursing degree, diploma degree, BSN, masters of nursing
or master in another field, PhD, DNP, (11) country in which the nurse was born, (12)

14
country from which nurse graduated nursing school, (13) ancestry, (14) spiritual
affiliation, (15) and number of years living in the United States and the dependent
variable of hand hygiene adherence.
The research design for this study was a quantitative, cross-sectional, overt
observational study with a convenience sample of ICU nurses (Creswell, 2009). Through
overt observation, I investigated if an association existed between the 15 demographic
independent variables and the dependent variable of hand hygiene adherence in the ICU
nurses in an effort to contribute to the understanding of variables associated with
adherence of hand hygiene. No covariates were investigated.
Research Questions and Hypotheses
Currently, hand hygiene adherence rates worldwide run in the range of 40-60%
while guidelines and recommendations tout the necessity of 100% adherence to reduce
the number of HAIs (WHO, 2009). Reasons for nonadherence are not fully understood.
Because little research has been done regarding the role demographic variables may have
on adherence, my research has been undertaken to help answer the question of whether or
not an association exits between the 15 demographic variables being reviewed and hand
hygiene adherence.
The research questions and hypotheses are as follows:
1. What was the association between the hand hygiene adherence rates among
ICU nurses and the age of the ICU nurse?
H01 = There was no association between the hand hygiene adherence rates among
ICU nurses and his/her date of birth (age).

15
Ha1 = There was an association between the hand hygiene adherence rates among
ICU nurses and his/her date of birth (age).
2. What was the association between the hand hygiene adherence rates among
ICU nurses and gender?
H02 = There was no association between the hand hygiene adherence rates among
ICU nurses and gender.
Ha2 = There was an association between the hand hygiene adherence rates among
ICU nurses and gender.
3. What was the association between the hand hygiene adherence rates among
ICU nurses and their marital status?
H03 = There was no association between the hand hygiene adherence rates among
ICU nurses and their marital status.
Ha3 = There was an association between the hand hygiene adherence rates among
ICU nurses and their marital status.
4. What was the association between the hand hygiene adherence rates among
ICU nurses and the number of children they have?
H04 = There was no association between the hand hygiene adherence rates among
ICU nurses and the number of children he/she has.
Ha4 = There was an association between the hand hygiene adherence rates among
ICU nurses and the number of children he/she has.
5. What was the association between the hand hygiene adherence rates among
ICU nurses and the gross family income of a nurse?

16
H05 = There was no association between the hand hygiene adherence rates among
ICU nurses and the gross family income of his/her family.
Ha5 = There was an association between the hand hygiene adherence rates among
ICU nurses and the gross family income of his/her family.
6. What was the association between the hand hygiene adherence rates among
ICU nurses and the year of graduation from nursing school?
H06 = There was no association between the hand hygiene adherence rates among
ICU nurses and the year of graduation from nursing school.
Ha6 = There was an association between the hand hygiene adherence rates among
ICU nurses and the year of graduation from nursing school.
7. What was the association between the hand hygiene adherence rates among
ICU nurses and the number of years of active nursing practice?
H07 = There was no association between the hand hygiene adherence rates among
ICU nurses and the number of years of active nursing practice.
Ha7 = There was an association between the hand hygiene adherence rates among
ICU nurses and the number of years of active nursing practice.
8. What was the association between the hand hygiene adherence rates among
ICU nurses and being a hospital employed nurse or an agency nurse?
H08 = There was no association between the hand hygiene adherence rates and
being a hospital employed ICU nurse or an agency nurse.
Ha8 = There was an association between the hand hygiene adherence rates and
being a hospital employed ICU nurse.

17
Hb8 = There was an association between the hand hygiene adherence rates and
being an agency employed ICU nurse.
9. What was the association between the hand hygiene adherence rates among
ICU nurses and areas of previous nursing practice?
H09 = There was no association between the hand hygiene adherence rates among
ICU nurses and areas of previous nursing practice.
Ha9 = There was an association between the hand hygiene adherence rates among
ICU nurses and areas of previous nursing practice.
10. What was the association between the hand hygiene adherence rates among
ICU nurses and their degree program?
H010 = There was no association between the hand hygiene adherence rates
among ICU nurses and their degree program.
Ha10 = There was an association between the hand hygiene adherence rates
among ICU nurses and their degree program.
11. What was the association between the hand hygiene adherence rates among
ICU nurses and the country in which the nurse was born?
H011 = There was no association between the hand hygiene adherence rates
among ICU nurses and the country in which the nurse was born.
Ha11 = There was an association between the hand hygiene adherence rates
among ICU nurses and the country in which the nurse was born.
12. What was the association between the hand hygiene adherence rates among
ICU nurses and the country from which the nurse graduated?

18
H012 = There was no association between the hand hygiene adherence rates
among ICU nurses and the country from which the nurse graduated.
Ha12 = There was an association between the hand hygiene adherence rates
among ICU nurses and the country from which the nurse graduated.
13. What was the association between the hand hygiene adherence rates among
ICU nurses and the nurse’s ancestry?
H013 = There was no association between the hand hygiene adherence rates
among ICU nurses and the nurse’s ancestry.
Ha13 = There was an association between the hand hygiene adherence rates
among ICU nurses and the nurse’s ancestry.
14. What was the association between the hand hygiene adherence rates among
ICU nurses and the nurse’s spiritual affiliation?
H014 = There was no association between the hand hygiene adherence rates
among ICU nurses and the nurse’s spiritual affiliation.
Ha14 = There was an association between the hand hygiene adherence rates
among ICU nurses and the nurse’s spiritual affiliation.
15. What was the association between the hand hygiene adherence rates among
ICU nurses and the number of years a nurse has been living in the United States?
H015 = There was no association between the hand hygiene adherence rates
among ICU nurses and the number of years a nurse has been living in the United States.
Ha15 = There was an association between the hand hygiene adherence rates
among ICU nurses and the number of years a nurse has been living in the United States.

19
Since the 15 independent demographic variables were both continuous (4 were
continuous) and categorical (11 were 11 categorical) and the dependent variable could be
either continuous or set as a categorical binary (hand hygiene performed, yes or no), the
data analysis used was multiple regression plus binary logistic regression (Field, 2013;
Polit & Beck, 2012; Wuensch, 2014).
Each independent variable was measured in the following manner:
1. Date of birth (age) (used to calculate age): a continuous ratio variable with
possible answers from 01-01-1940 (age 75 years) to 12-31-1995 (20 years of age)
2. Gender: a categorical binary variable with female coded = 0; male coded as 1
3. Marital status: a categorical nominal variable with single coded as 1, single but
cohabitating as 2, currently married as 3, common law marriage as 4 , separated
as 5, divorced as 6, widowed as 7, and Prefer not to answer as 8
4. Number of children: a continuous ratio variable with 0-50 as possible answers
coded from 0 through 7 as the actual number of children, code 8 as the number
written in as the specific number if the number is more than 7, and 9 coded as
Prefer not to answer.
5. Total gross household income: a categorical ordinal variable coded as <$40K
as 1, $40K-$49K as 2, … $225K-$250K as 18, >$250K as 19, and Prefer not to
answer as 20
6. Year of graduation from nursing school: a continuous ratio variable with
possible answers of approximately 01-01-1955 to present (graduation at age 20,
this gives 60 years of nursing practice)

20
7. Number of years of active nursing practice: a continuous ratio variable from
zero to approximately 60 (if graduation from nursing school at 20, age would be
80 years old)
8. Agency nurse or hospital employed nurse: a categorical ordinal variable with
agency nurse coded as 1, hospital employed nurse as 2, and prefer not to answer
as 3
9. Areas of previous nursing practice: a categorical ordinal variable with different
nursing units coded from 1 to 24
10. Degree program: a categorical ordinal variable coded from 1 to 9
11. Country where nurse was born: a categorical ordinal variable coded from 1 to
14
12. Country in which graduated from nursing school: a categorical ordinal
variable coded from 1 to 14
13. Ancestry: a categorical ordinal variable coded from 1 to 42
14. Spiritual affiliation: a categorical ordinal variable coded from 1 to 46
15. Number of years living in the United States: a categorical ordinal variable
coded from 1 to 19 with “all my life (born in the U.S.)”as 1, “less than 12
months” as 2, “13 months – 23 months” as 3, “2 years” as 4, …, “10-14 years” as
12, “15-19” as 13, …, “35- 39 years” as 17, “more than 40 years” as 18, and
“Prefer not to answer” as 19
The dependent variable will be measured in the following manner:

21
Hand hygiene: Set as a numerical number of hand hygiene positive and negative
opportunities, set categorically into percentage ranges, and set as a binary categorical
variable with no being coded as 0 and yes being coded as 1.
Theoretical Foundation
Currently, no theoretical foundation exists for hand hygiene adherence or specific
for infection prevention. The theory I used to assist me in understanding and interpreting
the data was the self-developed healthcare environment theory (HET), a theory I
conceptualized from the ecological system theory developed by Bronfenbrenner
(Bronfenbrenner, 1994; Ecological systems perspective, n.d.; Lang, 2015; Mattaini &
Meyer, n.d.; Sincero, Ecological, 2012a) and supported by the systems thinking theory
developed by von Bertalanffy (Zborowsky & Kreitzer, 2009). Bronfenbrenner uses five
environmental systems that influence a person: the micro system, the mesosystem, the
exosystem, the macrosystem, and the chronosystem (Bronfenbrenner, 1994; Sincero,
2008). I have developed six environments, adapted to the hospital and infection control
arena, and have called it the healthcare environment system. The six environments are the
(a) family environment, (b) the church environment, (c) the administrative environment,
(d) the community environment, (e) the cultural environment, and (f) the work
environment, all influencing the HCW and their HHA rate. Each environment in turn
influences the other environments while the HCW interacts with each environment in a
multidirectional manner.
The relationship between hand hygiene adherence and the HET is the
interconnections that bind all of the different environments to the nurse and to his/her

22
behavior. The family environment will affect attitudes of caring for patients and not
wanting to carry organisms in the hospital setting back to children, spouse, and extended
family or to the community environment (Sincero, 2008). The family environment also
encompasses the work family or that group of individuals who work together on the same
unit at the same hospital.
The church environment may influence family values and the importance of
protecting the family and the patient from harm. The church environment may also
influence the culture environment of the hospital in regards to patient safety culture and
the overall hospital culture of values and mission statement. If the hospital is affiliated
with a particular church or faith, the hospital culture may be influenced as to the values it
holds and to its practices. The ethical aspects of healthcare are influenced by the religious
or church environment, the family environment, and the community environment (WHO,
Religious, 2009).
The administrative culture is a culture of authority to which all people are
subjected. A person’s boss, the administration of a company or a hospital, city laws and
regulations, state regulations and laws, and federal laws all dictate rules and regulations
that must be followed. In the hospital setting, the nurse is bound to the guidelines,
policies, and recommendations set forth by the infection control department in the area of
hand hygiene. The cultural environment of patient safety and the tolerance for low hand
hygiene rates are tied to the foresight and dedication of the administrative culture, which
influences the work culture (Jimmieson et al., 2016; Sincero, 2008).

23
The community culture will depend on the hospital culture and vice versa as
nurses are a part of their hospital work environment but are also a part of the community
in which they live (Sincero, 2008). So HHA rates in one culture will influence the rates in
the other (Whitby et al., 2006). Outbreaks in the community will affect the hospital
environment and outbreaks in the hospital will cause additional lengths of stay thus
affecting family environment and the community environment. Patients who develop a
multidrug resistance organism in the hospital may be discharged still colonized, thus
increasing the risk of transmission in the community (Donker, Wallinga, Slack, &
Grundmann, 2012).
The work environment will affect the family culture in the number of shifts
worked, the days worked, stress levels brought home from the ICU, and the need for
child care while the parent is at work which can influence the community environment.
These will all be influences within the cultural environment as well.
The framework relates to the study approach and the research questions in that the
demographic variables being investigated are directly tied to the family environment
(age, gender, marital status, number of children, and family income), to the church
environment (spiritual affiliation), to the administrative environment (total gross family
income and hospital employee or agency nurse), to the community environment (country
in which nurse was born, country in which nurse graduated from nursing school, number
of years of living in the United States), to the cultural environment (ancestry), and to the
work environment (year of graduation from nursing school, number of years of active
nursing practice, areas of previous nursing practice, and degree program). By looking at

24
these demographic questions, it can be determined how HHA is associated with each of
these environments and how each of the environments is affecting HHA. With all of
these influences interplaying with hand hygiene, it can be understood why it is necessary
to have multidimensional interventions and why one intervention alone does not engage
the full component of the nurse to permanently change behavior. Chapter 2 contains a
complete explanation of the HET with a review of the systems thinking theory as support
to this new theory.
The body of literature on HHA gives rates that are not 100% adherent (dos Santos
et al., 2013; Erasmus et al., 2010; Johnson et al., 2014; Lee et al., 2011; Medeiros et al.,
2015; Mertz et al., 2011; Moret, Tequi, & Lombrail, 2004; Saint et al., 2004b; Rosenthal
et al., 2013; Sahay, Panja, Ray, & Rao, 2016. After interventions, rates increase but never
reach 100% ( O’Connell, & Dunne, 2016; Linam et al., 2016; Taneja & Mishra, 2016).
Even when HCWs know their hand hygiene is being monitored, there is not 100%
adherence (Eckmanns et al., 2006). Although overt observation (yielding 45% adherence)
tends to yield higher rates than covert observation (29% HHA rates), the overt
observation still does not produce adherence of 100% (Eckmanns et al., 2006). Despite
the fact literature abounds with articles showing that as hand hygiene increases, HAIs
decrease, (Alp et al., 2014; García-Vázquez, Murcia-Paya, Canteras, & Gómez, 2010;
Pittet et al., 2000; Rosenthal, Guzman, & Safdar, 2005b; Famous doctors, 2009b; Shabot
et al., 2016; Stone et al., 2012; Thu et al., 2015), there are issues with adherence.
25
Nature of the Study
Because the demographic information of each individual nurse would be linked to
his/her individual HHA, it was necessary to do an observational study as only those
nurses who filled out the demographic questionnaire would be observed. Because of the
need to gain prior consent from the nurses to participate in this study, it was necessary to
provide them with an explanation of the study and give them an opportunity for
questions. A letter of informed consent was provided to each of the nurses for their own
record, but their signatures were not required to signify participation. Their consent to
participate was indicated by their filling out the demographic questionnaire and returning
it. This way, no identifying information was collected on any of the nurses. The linkage
between the questionnaire and the nurse was an assigned number on the questionnaire
and matching the numbered research badge the nurse was asked to wear.
Due to these activities, it was not possible to do a covert observation. None of the
facilities used as a data collection site had cameras in the hallways or patient rooms so
direct observation was the only design that was possible. A direct observational study is
considered to be the gold standard for obtaining HHA rates (WHO Guidelines on Hand
Hygiene in Health Care, 2009). Direct observation of hand hygiene on room entry and
room exit covers 87% of the WHO’s 5 Moments of Hand Hygiene (Sickbert-Bennett et
al., 2016a). Sunkesula et al. (2015) also reported a 72% rate of compliance with the room
entry/ exit method and 70% compliance for the My 5 Moments of Hand Hygiene method.
The methodology was a prospective, overt observational cross-sectional study of
the ICU nurses. Two hospitals withdrew approval for participation during the institutional

26
review board (IRB) application process and two additional sites were added, bringing the
total number of ICUs to five and the number of hospitals participating to four. The
Walden IRB was the IRB of Record for one hospital site and a letter of agreement was
arranged between the Walden IRB and the hospital. The other three hospitals used their
own hospital IRB as their IRB of Record. A letter of cooperation was not required from
these three facilities as the IRB approval signified their willingness to participate.
Hospitals were individually recruited. Chapter 2 contains a full disclosure of how each
facility was recruited.
An explanation of the study was provided to the ICU nurses with an opportunity
to ask questions. The nurses who agree to participate indicated their consent by filling out
the demographic questionnaire and returning it. A numbered badge was used to connect
the demographic questionnaire to the observation of the individual nurse’s HHA rate.
Data was collected during three to five observational periods (8-10 hours each) at each
ICU. Sample size for each ICU was a total of 613 observations of hand hygiene
opportunities. G*Power was used to determine sample size using alpha of 0.05, effect
size as 0.30, and power as 80%. Data was aggregated for analysis after linkage had been
made between the individual nurse’s responses to the demographic questionnaire and
his/her individual hand hygiene rate. A full explanation of how this sample size was
calculated is included in Chapter 3. A hand hygiene opportunity was counted as the nurse
entering the patient’s room and a second opportunity was the nurse exiting the patient’s
room. A dichotomous answer of yes, the nurse was adherent with hand hygiene or no, the
nurse was not adherent was recorded for each opportunity observed. Data was stored and

27
analyzed in the Statistical Package for Social Sciences [SPSS] (IBM Corp., 2013).
Multiple, logistic, and binary regression were considered for analysis. A Bonferroni
correction test was also considered because of the large number of independent variables.
Three forms were developed for this study; (a) the letter of informed consent
which was modified from the Walden University letter of consent template for adults
over the age of 18, (b) the demographic questionnaire, and (c) the observational tool. In
order to avert potential problems with recording HHA rates on a computer, such as loss
of electricity or lack of available outlets, a paper form was developed and used at all of
the ICUs. This also avoided the possibility of losing or having my computer
compromised at any time data collection was being done. A one-sheet form was used for
each day of observation.
The letter of informed consent and the questionnaire was sent to several friends;
seven of them at hospitals different from the data collection sites, one friend who is a
physicians’ assistant and a fellow PhD student, plus another PhD student friend. Based
upon their suggestions and recommendations, modifications were made to the forms
before presentation to the ICU nurses. This procedure was used to eliminate any
confusion about the language and formatting of the forms and in place of doing pilot
studies on the forms. The decision not to test the forms in a pilot study was based on
recommendations made by the Walden IRB.
Definitions
Ancestry: A group of people with whom a person would classify himself or herself; a
person from whom one is descended (Merriam-Webster dictionary, 2015). Ancestry was

28
the term used as a replacement word for race/ethnicity in an effort to defuse any sensitive
feelings about the terms race and ethnicity. This information helped to determine if there
was a difference in the association of hand hygiene and different ethnic groups.
Hand hygiene: The act of cleaning of the hands either with the alcohol hand sanitizer or
by washing the hands with soap and water (Boyce & Pitter, 2002; WHO Guidelines on
Hand Hygiene in Health Care, 2009). Definitions of hand hygiene are given in the WHO
2009 Guidelines on Hand Hygiene in Health Care, 2009 and by Pfoh, Dy, and Engineer
(2013).
High Geler: Nurses whose HHA rate was within a range of 80-89%.
Low Geler: Nurses whose HHA rate was within a range of <30%.
Super Geler: Nurses whose HHA rate was within a range of 90-100%.
Spiritual affiliation: The religious or nonreligious preference of the nurse. The term
spiritual affiliation was used instead of the term religious preference in an effort to defuse
any sensitive feeling one might have about the word religion or religious preference. This
information was used to determine if different spiritual affiliations had an association
with hand hygiene rates.
15. Number of years of living in the United States: The length of time that a
person has resided in the United States. This question will help to distinguish native-born
Americans from persons born in another country. The longer a person has been in the
United States, the more influence should have occurred in the areas of personal hygiene
and hand hygiene in particular. Someone who indicates their ancestry as something other

29
than American and indicates living in the United States since birth will identify
themselves as second or third generation immigrants into this country.
The operational definition of the dependent variable is as follows:
1. Hand hygiene: The act of cleaning of the hands either with the alcohol hand sanitizer
or by washing the hands with soap and water. Definitions of hand hygiene are given in
the WHO 2009 Guidelines on Hand Hygiene (WHO, Guidelines on Hand Hygiene in
Health Care, 2009) and by Pfoh, Dy, and Engineer (2013). Because the demographic
questionnaire responses were linked to the individual nurse’s HHA rate, it was necessary
to develop a coding system to protect the confidentiality of the nurses and the hospitals.
Each hospital was assigned a letter from the alphabet: A, B, C, or D. The letter of
informed consent was presented to the ICU nurses explaining the study as well as a
verbal explanation with an opportunity to ask questions. Their willingness to participate
in this study was signified by his/her filling out the demographic questionnaire and
returning it to me. The demographic questionnaire was marked with a random number
that matched the number on a clear plastic badge the nurse was asked to wear during the
observation periods. Hand hygiene opportunity observations were recorded for the
particular number that the nurse was wearing. After the observation periods were
finished, the data for HHA was linked to each individual nurse’s demographic
questionnaire through the use of the coding number. For example, if a nurse had a
number five on her demographic questionnaire, the badge she was asked to wear was
number five. Every time this nurse was involved in a hand hygiene opportunity, her
response was recorded for nurse number five. No names, addresses, phone numbers, or
30
social security numbers were involved. Data was entered into SPSS only by these
designated letters and numbers. Because the hospitals have been identified only as a letter
and the nurses’ identified only through a number, confidentiality has been maintained.
Hand hygiene is a term that can imply washing with the alcohol gel sanitizer or
with soap and water. For this study, hand hygiene was counted as yes, the nurse was
adherent if either the sanitizer gel was used or the hands were washed with soap and
water. The target population was the ICU nurses. Although other HCWs have been
mentioned in this paper, the HHA rates of only the ICU RNs were recorded.
Assumptions
With this observational study, the only assumption made was that an association
existed between the 15 independent demographic variables and the dependent variable of
HHA. There are no assumptions believed that cannot be demonstrated to be true.
Scope and Delimitations
Important issues in hand hygiene today revolve around the why nurses have not
adopted an inherent hand hygiene behavior of 100%. The role family members and
visitors have in the transmission of diseases to and from the patient is unknown at this
time. Although the role of administrative support and how it might be influential in
increasing hand hygiene rates has been studied (Jimmieson et al., 2016; Smiddy,
O’Connell, & Creedon, 2015), how this influence affects HAIs has not been studied.
Studies have compared products used in hand hygiene (Boyce & Pittet, 2002).
Investigations of interventions to increase hand hygiene rates have frequently been
published (Jansson et al., 2016; Kingston, et al, 2016; Linam et al., 2016; Mathur et al.,

31
2015; Midturi et al., 2015; Siddiqui et al., 2016; Stock et al., 2016; Watson, 2016).
However, very little literature exists that compares the interventions themselves and how
effective they have been in helping to affect a sustainable increase in rates. While all of
this lends importance in helping solve the problem of poor HHA, these issues are beyond
the scope of this study. In narrowing my study to demographic variables, if associations
are found with HHA, it may provide a key to the unconscious influence of our inherent
HHA and identify groups that should be targeted for special education.
It is also possible that the patient safety culture, supported by the CEO and
administration, is also a key element in increasing adherence. Nurses, administrations,
and the entire hospital culture do not operate as silo entities but are integrated into a
complex blend that triggers a gel in and gel out response of HCWs when caring for
patients (White, 2014). Administrative tolerance of low adherence rates affects the entire
hospital culture in regards to HHA (Pittet, 2001; White, 2014. The double standard of
HHA expectation of 100% for HCWs but not for physicians affects the patient safety
culture (White, 2014). With the rising costs associated with HAIs, hospital administration
must decide if they can afford a low adherence rate by nurses, physicians, and other
HCWs.
Limitations
One limitation was that only the ICU RNs’ HHA was recorded. Multiple HCWs
from multiple disciplines enter and exit patients’ rooms on a daily basis. The possibility
of one of these ancillary HCWs transmitting an organism from patient to patient or from
the patient to another person or to themselves is very real. But since this study was trying
32
to determine those demographic variables that might be associated with HHA, it was felt
the best place to start was to look at the ICU RNs only. Due to the low nurse to patient
ratio, more nurses are available to observe (Develop a research proposal, n.d.). Coupled
with this was the limitation that data was collected from only the ICU and did not include
other nursing units. The purpose of this study was not to collect just hand hygiene rates,
but to see if there was an association between demographic variables and the act of HHA.
A third limitation was that only hospitals in Texas were investigated. Other hospitals in
other states may have different views regarding the demographic questionnaire and their
HHA may be higher or lower. A fourth limitation was that this was a convenience sample
of nurses and may not represent the average nurse working in Texas either in terms of
their demographic information or their HHA rate.
Using four hospitals, each very different in location and size, can be both a
benefit and as a hindrance for my study. For internal validity, it was important to identify
how the sites might be similar. Since the total observation period of the five ICUs took 5
months, the internal validity should not be threatened by historical events or maturation
of the participants (Lærd, 2012). Selection bias of the population was also a threat to the
internal validity in that the target populations of ICU nurses were those nurses that
worked at the hospital sites designated as data collection sites. The hospitals were not
randomly chosen and the nurse population was a convenience sample (Lærd dissertation,
2012).
All four of the hospitals are in Texas, three being in a large metropolitan area and
one in a more rural setting. Nurses from many different cultures were represented at these

33
hospitals. But even though there was a great deal of diversity seen in the four different
hospitals, the target population was still a convenience sample, making it harder to
generalize this study.
There was a threat to the construct validity of this study in that the forms designed were
never tested before. But because of the simplicity of the demographic variable questions,
different interpretations did not seem likely, although it is always possible. No
confounder variables were investigated in this study although with the interconnectivity
of all of the variables, there is likelihood that they may all be covariates with each other.
Significance of the Study
Everyone washes his or her hands, perhaps not as frequently as recommended, but
it is a universal behavior. Nurses are a part of their hospital community and also a part of
their community at large. Nursing adherence with hand hygiene in the ICU will be
repeated when the nurse is off duty and in their community settings, such as church, the
bank, the grocery store, or at home. Good behavioral adherence rates in the ICU will
translate to good HHA in the community and vice versa (Whitby et al., 2006).
Significance to Theory
The significance to theory is that a new theory is being introduced in this study,
the Healthcare Environmental Theory (HET). Currently there are no theories designed
specifically for infection control/prevention or hand hygiene studies. This theory was
designed to specifically address this need. It will provide an easy to use theory that is
meaningful and helpful.

34
Significance to Practice
Potential contributions this study made in advancing knowledge in hand hygiene
was by investigating if there was an association between demographic variables and
HHA. This study also helped to provide knowledge in the area of unconscious motivation
to participate in hand hygiene. Inherent hand hygiene behavior was acquired as a child.
Elective hand hygiene behavior was influenced in nursing school. Knowing there was or
was not an association can help generate the design of interventions aimed at increasing
the adherence rate and also identified certain groups with a low adherence rate and could
be targeted for special education.
If associations can be found between culture, country where nurse was born,
country where the nurse graduated from nursing school, or degree program; nursing
curriculum in nursing schools may be examined to booster the level of education
provided about the importance of hand hygiene.
Significance to Social Change
If the factors associated with hand hygiene can be identified, meaningful and
sustainable interventions can be designed to drive the increase in HHA to 100%. If HHA
rates can be increased, there will be an associated decrease in HAIs (Pittet, 2001; Pittet et
al., 2006; Sax et al., 2009). A decrease in HAIs will result in decreased length of stay for
the patient, decreased cost to the patient, less pressure on antibiotics thus reducing
antibiotic resistance, decreased mortality due to HAIs, increased reimbursement to the
hospitals, and a reduction in national healthcare costs (Pennsylvania Patient Safety
Advisory, 2010; Scott, 2009). If the number of HAIs in the hospital can be reduced, then

35
patients being discharged back into the community will be infection free. This will
provide for a healthier community. When nurses in the hospital increase their hand
hygiene, there will be a tendency for them to have increased hand hygiene in their own
homes and in the community as well. With increased hand hygiene in the community,
there should be a corresponding decrease in the community and global spread of
communicable diseases, many of which are spread by contact or touching. Increased hand
hygiene may contribute to a reduction in rates of influenza, colds, hepatitis A, and
foodborne outbreaks (Jumaa, 2005). In one study it was shown that improvements in
hand hygiene resulted in a reduction of 31% in gastrointestinal illness and a reduction of
21% in respiratory illness (Aiello, Coulborn, Perez, & Larson, 2008). It is unclear how
immediate or broad the impact will be, but the results from this study should help
hospitals and ICPs to better understand what is happening with hand hygiene surveillance
rates and variables affecting the HCWs.
A second potential contribution of this study became apparent only after the data
collection phase was completed. Due to the multitude of tasks and responsibilities of the
Infection Prevention Departments, hand hygiene surveillance is being done either in short
observation periods of less than one hour on random days and random times of the day
when it is convenient for the ICP or the task of hand hygiene surveillance is being
assigned to HCWs throughout the hospital. Many times surveillance is done by HCWs
working in different departments (Health Research & Educational Trust, 2010; Mathur,
2011; WHO hand hygiene monitoring and feedback, 2009. They are assigned to complete
10 to 30 hand hygiene observations in a month’s time and pass in the information to the

36
infection prevention department (Linam et al., 2016). Observations done in my study
have identified that surveillance rates depend on the time of day observation is made, the
acuity of the patient, the number of patients assigned to each nurse, and most importantly,
which nurse is being observed. None of this information is being conveyed to the
Infection Prevention Department through the current hand hygiene surveillance programs
being conducted in hospitals today. An overall compliance rate (an average) is calculated.
But it fails to identify the percentage of nurses who are observing HHA over 50% of the
time and the percentage of nurses whose HHA rates fall below 50%. My study shows that
an accurate picture of HHA in the hospitals is not being identified using the current
surveillance system of 10-20 minutes and observing random HCWs. This study could
affect social change by altering surveillance methodology.
Summary and Transition
The introduction points out the importance of HHA. Literature introduced in
Chapter 1 hints of the more extensive literature search that is presented in Chapter 2. The
research problem, research questions, and hypotheses are presented. The new HET was
introduced in Chapter 2 with an extensive explanation. The general methodology was
presented in Chapter 1 but is fully explored in Chapter 3. The 15 independent
demographic variables were presented along with the dependent variable of HHA.
Limitations and delimitations were discussed, as was the generalizability of this study.
Social significance of this study was also explored. Chapter 2 will expand on the
literature search and Chapter 3 will present the methodology of this study, the design,
statistical measures to be done, and sampling.

37
Chapter 2: Literature Review
Problem and Purpose
Because of the breath of literature available on hand hygiene, the literature review
presented here is certainly not an exhaustive study but articles were pulled that supported
the premise for the study and also showed a wide range of studies across countries and
years. Articles selected were also listed from multiple reference lists or met a specific
niche.
Despite the proven effectiveness of using hand hygiene as a way to reduce HAIs,
HCWs are adherent only 40-60% of the time (Erasmus et al., 2010). Dai et al. (2015)
looked at 35 hospitals in the United States with 13,722,022 observations of hand hygiene
opportunities yielding a mean rate of 38.7% of adherence (a range of 34.8% to 42.6%).
The full array of motivating factors, which can be used to design sustainable and
effective interventions to increase adherence, is unknown. Although hand hygiene is a
simple physical act, it is a highly complex behavioral issue that is not fully understood
(Pittet et al., 2000; Pittet et al., 2004b). Interventions are being designed without
comprehension as to what truly will cause an effective change in a HCW’s attitude
toward being adherent 100% of the time (Jansson et al., 2016; Kingston et al., 2016;
Linam et al., 2016; Mathur et al., 2015; Midturi et al., 2015; Siddiqui et al., 2016; Stock
et al., 2016).
The purpose of this study was to investigate if an association existed between 15
independent demographic variables and the dependent variable of hand hygiene. The
independent variables were the following(1) date of birth (age), (2) gender, (3) marital
38
status, (4) number of children, (5) family income, (6) year of graduation from nursing
school, (7) number of years of active nursing practice, (8) hospital employee or agency
nurse, (9) areas of previous nursing practice, (10) degree program (associate nursing
degree, diploma degree, BSN, masters of nursing or master in another field, PhD, DNP,
(11) country in which the nurse was born, (12) country from which nurse graduated
nursing school, (13) ancestry, (14) spiritual affiliation, (15) and number of years living in
the United States.
Synopsis of Current Literature
Hand hygiene has been studied since 1847 when Semmelweis initiated his now
famous antiseptic chlorine solution hand wash outside of the autopsy rooms (Markel,
2015; Semmelweis biography, 2009a). A great deal of existing literature consists of
establishing baseline rates of HHA along with educational interventions in the hopes of
increasing the rates. With the magnitude of the problem of HAIs being brought to
awareness by the WHO, HAIs are now recognized as a worldwide problem (WHO, 2011;
WHO, 2014). Not only is there the understanding that HAI rates must be reduced but also
that the most cost effective method of doing this is to increase the HHA rates (Jain et al.,
2015; Kapil, Bhavsar, & Madan, 2015; McGuckin & Govednik, 2015; Pittet, 2001; Pittet
et al., 2006; Sax et al., 2009; White et al., 2015; WHO, 2009).
There has been a shift from only quantitative studies being published to also
looking at behavioral factors and behavioral modification (Erasmus et al., 2009; Erasmus
et al., 2010; Mathur, 2011; Squires et al. 2013. Nurses are being interviewed, focus
groups are being conducted, and surveys are being gathered, all with the goal of
39
identifying why nurses are not 100% adherent with hand hygiene (Smiddy et al., 2015).
To date, no theory specific to increasing HHA has emerged. But as more and more
researchers in hand hygiene are beginning to understand the reasoning behind
nonadherence, theory has increased in importance and studies are beginning to be based
on thoughtful theory rather than relying on the theories of planned behavior or the health
belief model. Dearing (2009) used the diffusion of innovation theory while other theories
cited have been the theory of conceptual framework (Mao & Yang, 2012), Herzberg’s
motivation-hygiene theory (Sachau, 2007), and the theoretical domains framework (Cane,
O’Connor, & Michie, 2012; French et al., 2012; Fuller et al., 2014). Also seen in current
literature is the stressing of the importance of a multidimensional approach rather than a
single intervention (Khan et al, 2016; Pittet, 2001; Pittet, 2004; Pittet et al., 2000). Each
time a nurse or other HCW fails to participate in hand hygiene at the appropriate time, the
patient, the nurse, other HCWs, families, visitors, and the nurse’s family are at increased
risk for the development of an infection that was given to them by the carriage of germs
on the hands of a nurse (Midturi et al., 2015; Pittet et al., 2006; Sax et al., 2009; Watson,
2016).
Preview of Major Sections of Chapter 2
This section is a listing of the subtitle sections included in Chapter 2. The problem
and purpose of this study, along with a section on the synopsis of the current literature,
are found in Chapter 2. I explain the literature review techniques used to identify articles,
the theoretical framework of this study, and a new healthcare environment theory
conceptualized from the ecological system theory (Bronfenbrenner, 1994) and a college

40
professor’s teachings in sociology and criminology. This is followed by an extensive
literature review and a historical background review. In order to assist the reader in
understanding the importance of this investigation, the following sections were included
to build a comprehensive picture of the benefits of increasing hand hygiene: a section on
the risk factors associated with nonadherence; a section illustrating the impact of HAIs in
regards to infection rates, costs, and mortality; and the impact of increasing hand hygiene
in regards to decreasing HAIs. A brief methodology section is followed by a section on
the rational for the selection of the chosen independent demographic variables. Chapter 2
also includes a discussion of independent variables that previously have and have not
been studied. Implications of how this study might affect social change are presented
followed by sections on controversial areas and what remains to be studied. A conclusion
to Chapter 2 identifies major themes in infection prevention and hand hygiene appearing
in literature today.
Literature Review Strategies
The literature review was conducted using the Walden University library and
Safari Google. Additional articles were obtained from my personal library of the
American Journal of Infection Control (AJIC) journals from 2005 to present. AJIC is the
official journal of the Association for Professionals in Infection Control and
Epidemiology (APIC) and articles on hand hygiene are frequently published in this peer-
reviewed journal.
Using the Walden University library, databases that were searched included
Thoreau, Academic Search Complete, ProQuest Central, ScienceDirect, and CINAHL

41
Plus with Full Text through the Nursing database. Retrieval words included hand
washing, hand hygiene, variables, disparities, behavior, theory, demographics, and rates.
I also searched using date of birth (age), gender, marital status, number of children,
family income, year of graduation from nursing school, number of years of active nursing
practice, hospital employee or agency nurse, areas of previous nursing practice, degree
program (associate nursing degree, diploma degree, BSN, masters of nursing or masters
in another field, PhD, DNP), country in which the nurse was born, country from which
nurse graduated nursing school, ancestry, race/ethnicity, spiritual affiliation, religious
preference, and the number of years living in the United States.
Combinations of hand hygiene/variables, hand hygiene/age, hand
hygiene/gender, hand hygiene/marital status of nurses, hand hygiene/number of children,
hand hygiene/variables affecting, hand washing/variables affecting, hand hygiene or
hand washing/factors affecting, hand hygiene or hand washing/demographic variables or
demographic factors, hand hygiene or hand washing/race, hand hygiene or hand
washing/ethnicity, hand hygiene or hand washing/religion, and hygiene or hand
washing/barriers were also used. As the need for additional information and verification
arose, either the Walden University library and/or Safari Google were searched.
I found articles about the ecological systems theory through the Walden
University library using the databases Thoreau, Academic Search Complete, ProQuest,
and Science Direct using the keywords of ecological systems theory, Bronfenbrenner,
ecological perspective, ecological systems theory with hand hygiene, with healthcare,
and with hospitals. I also searched through Safari Google using key words of ecological

42
systems theory, ecological perspective theory, and Bronfenbrenner. Articles about the
systems thinking theory were found through the Walden University library using the
CINAHL Plus with Full Text database and through Google Search.
Because the importance and history of hand hygiene goes back to Oliver Wendell
Holmes (1843) and Semmelweis (1847), the literature reviewed spans from 1843 to the
present. Establishing the historical background was important in order to understand
where the infection prevention community and HHA are now, how it got to this point,
and why adherence is more important today than ever before. Because HHA rates and
HAIs are not a problem just within the United States but worldwide, it was necessary to
show that this is indeed a global problem and that countries around the world are actively
working with the WHO to increase HHA rates and reduce HAIs.
Works by Holmes and Semmelweis are considered to be seminal literature by the
infection prevention community (Famous doctors, 2009b); Markel, 2015; Semmelweis
biography, 2009a). As a result of his work in the field of epidemiology, Semmelweis has
become known as the father of hand hygiene (Historical prospective on hand hygiene,
2009). The Study on the Efficacy of Nosocomial Infection Control (SENIC Project) is
also considered to be a seminal article because it changed the course of infection
prevention (Haley et al., 1985b).
The WHO established their Clean Care is Safer Care campaign with their annual
call to action for HCWs to increase HHA rates in 2009. (Allegranzi et al., 2007; WHO,
Clean Care, 2014). As a result, there are many studies now being published from
countries around the world so the volume of literature available on hand hygiene has

43
grown exponentially. Much of the literature from the late 1990s and the early 2000s has
been the building blocks to how hand hygiene is viewed today. Studies by Pittet,
Allegranzi, Rosenthal, Boyce, McLaws, and Larson have been directional studies since
the 1970s.
One of the problems encountered with this subject has been the magnitude of the
available literature. A search on Safari Google for hand hygiene produced 3,750,000
results while the term hand washing yielded 12,200,000 results. However, a refinement
and exploration of the search term to demographic variables affecting hand hygiene
adherence reduced available articles to 552,000. Searching for specific demographic
variables still yields between 200,000-300,000 available articles, but these tended to only
mention hand hygiene or the demographic rather than a research study that was
conducted on this variable in connection to hand hygiene. The difficult part was to
narrow down this massive volume of literature to a workable quantity that had relevance
to this study. Some articles were identified which addressed the variables of age (Diller et
al., 2014), gender (Cruz & Bashtawi, 2015; Hanna, Davies, & Dempster, 2009), and
marital status (Al-Hussami, Darawad, & Almhairat, 2011).
Theoretical Foundation
Researchers exploring hand hygiene frequently use the health belief model
(HBM) and the theory of planned behavior (TPB). Growing out of the stimulus response
theory (S-R) and the cognitive theory, Skinner and Champion theorized that the
correlation between behavior and an immediate reward was sufficient to generate a
change in a person’s behavior leading to repeated behavior (Champion & Skinner, 2008;
44
White et al., 2015). A problem identified with the use of this theory in hand hygiene is
the concept of immediate reward. Hand hygiene does not generate a perceived immediate
reward response because nurses do not ‘see’ the patient get an infection if they are
nonadherent or the patient not get an infection if they are adherent. Likewise, there is
usually no consequence to the nurse if he/she is not participating in hand hygiene (Pittet,
2004). They have remained uninfected through countless episodes of nonadherence.
The estimated annual occupational death rate for HCWs is 17-57 per 1 million
HCWs with 6 million HCWs having potential patient exposure (Sepkowitz & Eisenberg,
2005). In the United States, from the beginning of the HIV epidemic through December
of 2001, only 57 documented cases of HIV acquired though occupational exposure have
been reported. There have been no confirmed cases since 1999 (CDC, Occupational HIV,
2011b). Dulon, Peters, Schablon, and Nienhaus (2014) reported in a systematic review
study of 31 articles that the pooled MRSA colonization of HCWs was 1.8%. This rate
increased to 4.4% when one study from the Netherlands was excluded. The nursing staff
had the highest pooled rate at 6.9% (Dulon et al., 2014). Seven studies were assessed to
be of high quality and the pooled Methicillin Resistant Staphylococcus aureus (MRSA)
prevalence rate in these seven studies was 1.1% or 5.4% if the study from the
Netherlands was again excluded (Dulon et al., 2014). The pooled prevalence of studies of
moderate quality was 4.0% (Dulon et al., 2014). The risk of developing occupational
hepatitis B has been reduced by >90% with the introduction of the hepatitis B vaccine
and standard precautions. However, despite the vaccine being offered free by the

45
hospitals, approximately 400 HCW become infected with hepatitis B each year due to the
more than 30% of HCWs who refuse to be vaccinated (Sepkowitz & Eisenberg, 2005).
A few hospitals have adopted a three strike policy. The third time a HCW is
caught being nonadherent with hand hygiene could possibly cost him/her their job (Blum,
2010; Reckless and blatant, n.d.). But due to the shortage of nurses, this is not the usual
policy language adopted by hospitals. The Bureau of Labor Statistic Employment
Projections for 2012 – 2022 (released in December 2013) predicts a need for 525,000
replacement nurse to the workforce plus growth in the field to bring the number of job
openings for RNs to be 1.05 million by 2022 (American Association of Colleges of
Nursing, 2014). The usual hand hygiene policy will state the HCW should be 100%
adherent with hand hygiene, sometimes listing the opportunities, but no mention is made
of consequences if this behavior is not carried out (S. L. Kurtz, personal experience,
2004, 2010). Usually hand hygiene surveillance is done as an aggregate rate rather than
individual hand hygiene rates thus providing anonymity to the individual HCW (The
Joint Commission, 2009). Therefore it is impossible to tie individual HHA rates to
bonuses, promotion, or a merit raise in an effort to motivate adherence. Individual
monitoring devices are changing this (Sahud et al., 2010).
Champion and Skinner (2008) perceived that a person must feel he/she is
susceptible or his/her patient is susceptible to acquiring an infection in order to modify
behavior. But the low rates of adherence found among nurses around the world seems to
suggest there is no fear of being susceptible or if fear exists, it is ignored. The HHA rates
were presented in the following studies: 36.9% in Brazil (Marra et al., 2013), 45% in
46
Canada (Lebovic, Siddiqui, & Muller, 2013), 56% in Germany (Graf et al., 2013), 23.1%
in India (Biswal et al., 2013), 43.5% in Turkey (Alp et al., 2014), 47% in Vietnam
(Salmon, Tran, Bùi, Pittet, & McLaws, 2014a), 51.5% in China (Su et al., 2015), and a
mean rate of 38.7% for the United States (Dai et al., 2015).
The theory upon which this study was based is a new self-developed theory, the
healthcare environment theory (HET). It was designed specifically for healthcare, the
hospital setting, and for infection prevention. The HET was conceptualized from the
ecological system theory, also known as the human ecology theory, developed in 1979 by
Bronfenbrenner, the co-founder of Head Start for Children (Bronfenbrenner, 1994; Lang,
2015; Sincero, 2012a). The ecological systems perspective or theory places emphasis on
the interrelationships across levels of activity, and includes not only the impact the
individual has on his/her environment, but also the impact the environment has on the
individual. Mattaini & Meyer (n.d.) calls this “the inseparable web of relationships” or
“the web of life”.
A second influence in the development of the healthcare environment theory was
the teachings of a college professor, Dusty Troyer. In both his sociology and criminology
courses, he taught there were four environments, all acting in a multi-directional manner
with each other and with an individual. The four environments were family, work,
church, and government. He represented this by a square, each corner being represented
by an environment with the individual at the center. He taught how each of these
environments influenced an individual, how the individual influenced all of the

47
environments, and how each environment was interconnected to the other environments.
Pulling from both sources, the HET came into being.
For the HET, I proposed the interplay of six environments affecting the behavior
of the nurse in regards to adherence to hand hygiene: family environment, church
environment, administration environment, community environment, cultural
environment, and work environment. If the administrative environment is changed to
government environment or to upper management of a business corporation, then this
theory can be applied to all persons, not just HCWs. Each of these environments interacts
in conjunction with one another and with the HCW or individual person in a
multidirectional manner. See Figure 1 for a schematic of the proposed healthcare
environment theory.
Family Environ
Church Environ
HCW
Work Environ
Cultural Environ
Comm Environ
Admin Environ
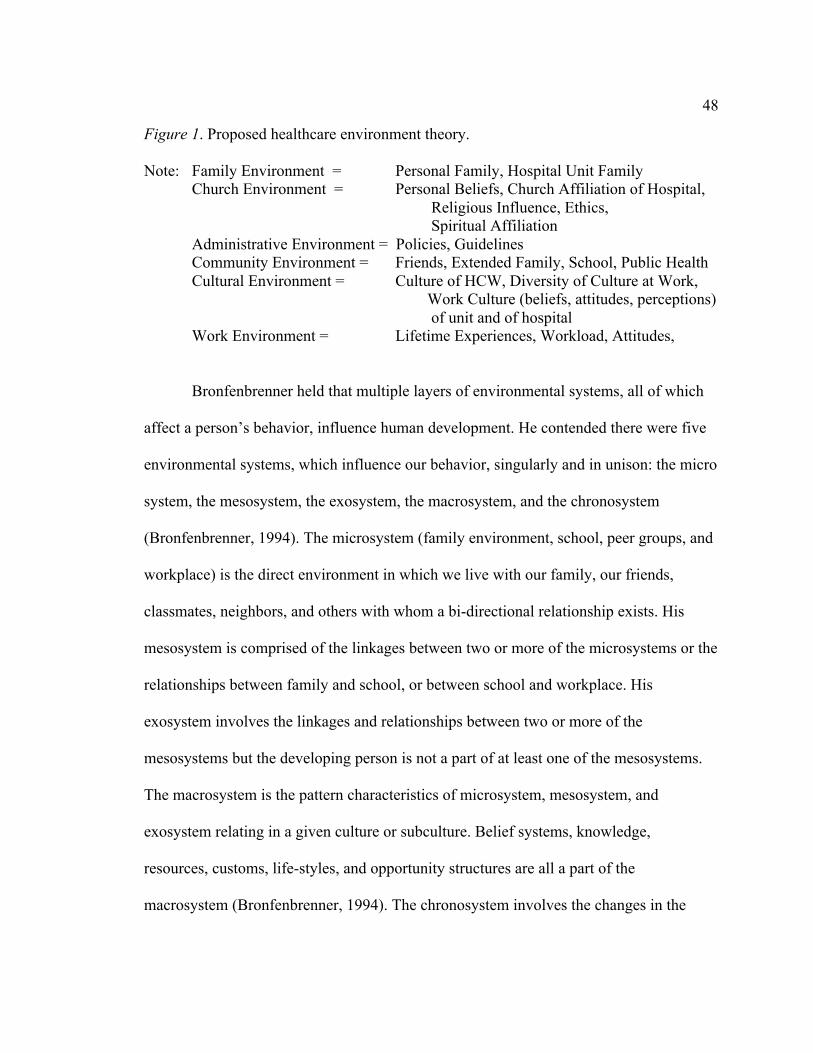
48
Figure 1. Proposed healthcare environment theory. Note: Family Environment = Personal Family, Hospital Unit Family
Church Environment = Personal Beliefs, Church Affiliation of Hospital, Religious Influence, Ethics, Spiritual Affiliation
Administrative Environment = Policies, Guidelines Community Environment = Friends, Extended Family, School, Public Health Cultural Environment = Culture of HCW, Diversity of Culture at Work,
Work Culture (beliefs, attitudes, perceptions) of unit and of hospital
Work Environment = Lifetime Experiences, Workload, Attitudes,
Bronfenbrenner held that multiple layers of environmental systems, all of which
affect a person’s behavior, influence human development. He contended there were five
environmental systems, which influence our behavior, singularly and in unison: the micro
system, the mesosystem, the exosystem, the macrosystem, and the chronosystem
(Bronfenbrenner, 1994). The microsystem (family environment, school, peer groups, and
workplace) is the direct environment in which we live with our family, our friends,
classmates, neighbors, and others with whom a bi-directional relationship exists. His
mesosystem is comprised of the linkages between two or more of the microsystems or the
relationships between family and school, or between school and workplace. His
exosystem involves the linkages and relationships between two or more of the
mesosystems but the developing person is not a part of at least one of the mesosystems.
The macrosystem is the pattern characteristics of microsystem, mesosystem, and
exosystem relating in a given culture or subculture. Belief systems, knowledge,
resources, customs, life-styles, and opportunity structures are all a part of the
macrosystem (Bronfenbrenner, 1994). The chronosystem involves the changes in the

49
person over his/her lifetime in regards to family structure, socioeconomic status,
employment, and the stressors identified in everyday life (Bronfenbrenner, 1994).
Whitby et al. (2007) contend that human behavior in regards to health education
can be influenced due to the individual (intrapersonal) or the microsystem according to
Bronfenbrenner; interactions between individuals (interpersonal) or the mesosystem; and
the community or the macro system (Sincero, 2012a). Intrapersonal factors are individual
qualities concerning intellect, attitudes, beliefs, and personality traits. In interpersonal
roles, social identity, a support network, and role definition of family, friends, and peers
are fabricated (Whitby et al., 2007). Whitby et al. (2006) held that biological
characteristics, environment, education, and culture all result in multiple influences over
human behavior.
The healthcare environment theory (HET) can be applied to hand hygiene in that
the different environments surrounding the nurse all influence behavior of the individual.
In hand hygiene, the organization infrastructure becomes the hospital, the unit where the
nurse is employed as well as the shift being worked (day shift or night shift), and the
individual shift being worked (as each shift is different from the last shift). In some
aspects the unit where a nurse works becomes his/her extended family and the nurses
help each other respond to stressful situations and expectations, supportive both in the
work environment and the home environment (Mattaini & Meyers, n.d.). Service
systems, network linkages established by the nurses, political forces and policies of the
hospital, the unit worked, cultural forces (hospitals now hire nurses from multiple
cultures, the unit work culture, and the culture of patient safety of the hospital), social

50
forces, social work values, roles played by the nurses, and professional issues such as
position held (staff nurse, charge nurse, or supervisor) all play a role (Ecological systems
perspective, n.d.; Mattaini & Meyer, n.d.).
In looking at similarities between the ecological systems theory and the HET for
hospital settings and especially how it affects hand hygiene, the microsystem of
Bronfenbrenner resembles the family environment of the HET. It involves a person’s
fellow nurses, his/her supervisor, and other departments within the hospital with which
there is daily interaction such as with doctors, physical therapists, respiratory therapists,
housekeeping, and laboratory personnel, plus patients. The community environment of
the HET resembles the mesosystem of Bronfenbrenner. The work environment of the
HET now includes how doctors interact with the patient and the nurse in a treatment plan,
how respiratory therapy and the nurse will coordinate their schedules so the patient is
suctioned every two hours, and how the housekeeping staff works with the nurses to
insure rooms are terminally cleaned when a patient is discharged. It is at the work
environment level that the nurses’ family and community also interact to influence the
behavior at the hospital. If a nurse is worried about a sick child at home, it can certainly
influence his/her thought processes at work. Interactions of different departments will
also have an impact on the nurse. For example, what time central supply delivers supplies
to the unit may affect the time schedule of the nurse and thus the care of the patient; for
example, the time the central line dressing is changed (Roundy, 2015). It will be under
the work environment (the mesosystem in Bronfenbrenner’s theory) in which a unit
director’s attitude toward infection prevention and hand hygiene will be influential. Peer

51
attitude and support toward hand hygiene will develop into a unit culture of HHA.
Administrative support of hand hygiene and infection prevention also works in the
nurse’s perception of the importance of adherence (Jimmieson et al., 2016; Smiddy et al.,
2015).
The administrative or government environment (the ecosystem according to
Bronfenbrenner) is the setting where the person does not have an active role, but at the
same time, is actively participating. This would involve the administrative department
who sets policy and guidelines. The nurses usually have no say in the establishment of
policy but are required to participate. This is particularly true in the area of hand hygiene.
Infection Prevention, the quality department, and administration set policy that nurses be
100% adherent with hand hygiene. Nurses have no say as to whether or not they wish to
participate in this activity or modify the policy in some way (Roundy, 2015). There will
also be bi-directional influence and interaction between administration and the individual
unit. Certain units are considered revenue producing and others are not. There is usually a
great deal of administrative support given to surgery, radiology, pharmacy, cath lab, and
laboratory or those departments that produce revenue for the hospital. Departments such
as infection prevention, quality, risk, plant operations, admitting, education, medical
records, and housekeeping are not considered to be money generating departments so
monitoring devices for hand hygiene are not funded and extra personnel for surveillance
is not granted (Jantarasri et al., 2005; Vere-Jones, 2007). Administration usually fails to
recognize they are also a nonrevenue producing department and that while infection
prevention may not be included as a revenue producing department, it is the one

52
department with the ability to save the hospital millions of dollars a year if nosocomial
infections can be prevented. The actual culture of the HCW or nurse, the cultural
environment (macrosystem of Bronfenbrenner) entails the diversity of the cultures of the
nurses working together and how they are intertwined and influence each other. Coupled
with this will be the culture of the unit itself, its work ethics, the willingness to help each
other, in the accuracy and detail of their reporting, and in their attitude toward pain
management and HHA.
A nurse’s religious beliefs and church affiliation will also resonate under the
cultural environment of the HET and the macrosystem of Bronfenbrenner’s ecological
perspective (Ecological perspective, n.d.). Whether the hospital is church afflicted or for
profit will contribute an important factor in determining the culture of the hospital and the
unit culture. There may be a positive or a negative effect on the person’s development
and participation in hand hygiene (Roundy, 2015; Sincero, 2012a).
The chronosytem or lifespan environment of Bronfenbrenner includes the
transitions and shifts one makes throughout their lifetime (Sincero, 2012a). Under the
HET, nurses’ experiences in dealing with patients will affect change in their behavior
from the first year of practice over the span of a lifetime of practice. During the first year
out of school, a patient experience will elicit a different response from that of a nurse
who has been in practice for 20 years. This system also includes the community influence
on the nurse. Whitby et al. (2007) point out that hand hygiene behavior has been show to
vary on different hospital units and among different groups of HCWs. This suggests to
them there are both individual and community influences in determining the hand

53
hygiene rates. They also identified that patterns are likely to have been established in
children by the time they are nine or ten years old, probably starting at the time of toilet
training. The emotional concept of dirtiness and cleanliness seem to be the underlying
component to practice hand hygiene in the healthcare setting and in the community
(Whitby et al., 2007).
Expectations
Although there has been a tremendous amount of literature generated in the field
of hand hygiene, little has been done in the development of a theory specific to
healthcare, to infection prevention, and to hand hygiene. There is limited research using
the ecological systems theory in the field of healthcare. Pittet (2004) commented there
were only a few studies using the theory of ecological systems in the field of infection
control. Most of the work with this theory was in the field of environmental education or
social work. Carel Germain introduced this theory in the field of social work to augment
systems theory and incorporated the environment as a dynamic part of life with all parts
intertwined and interacting (Ecological perspective, n.d.). He introduced several
constructs, which included: adaptation, goodness-of-fit, niche, and habitat (Ecological
perspective, n.d.; Petrona, 2015). This theory was also used in the field of environmental
psychology (Winkel, Saegert, & Evans, 2009) and one study used the ecological system
approach in community health centers (Boutin-Foster et al., 2013).
Pittet (2004) provided the rational for beginning with the ecological system theory
in his article, The Lowbury lecture: Behavior in infection control. Pittet has previously
commented on the importance of using a multidimensional approach to increase HHA

54
rates (Pittet, 2001). He commented that behavior was affected by multiple layers of
influence, that behavior was bi-directionally modified by social environments and in turn,
that the ecological system theory held promise to explain behavior modification (Pittet,
2004). Barry and Honoré (2009) stated that the ecological systems theory stresses how
multiple factors were interlinked with public health issues. They comment further that
behaviors simultaneously cause and were the result of multiple levels of influence.
Although Bronfenbrenner’s theory had limited use in the area of infection prevention or
hand hygiene, it was felt that the healthcare environment theory better matched what was
needed. And what was needed was a multidimensional intervention based on a
multidimensional theory, making the HET the optimal choice for this study
Just as Carel Germain introduced the theory of ecological perspective or
ecological systems in the field of social work to augment his use of the systems theory
and incorporated the environment as a dynamic part of life with all parts intertwined and
interacting (Ecological perspective, n.d.), I will use the systems thinking theory to
support the healthcare environment theory.
The systems theory was developed in the 1940s by von Bertalanffy as a reaction
against reductionism. He believed that real systems were open to and interacted with their
environments. Applied to such disciplines as physics, biology, and sociology, systems
thinking theory was focused on the relationships and arrangements of the parts that bind
them into a whole and how the different parts related to each other. In the HET, each of
the environments (the parts) had a multidirectional influence on the HCW and on each of
the other environments while the HCW influenced all of the environments. In looking at

55
the optimal healing environment under systems thinking theory, an important component
was the area of interaction between people (the HCW) and place (the environments).
Systems thinking theory helped to identify the intertwined relationships between all of
the environments and the HCW (Zborowsky & Kreitzer, 2009).
Systems thinking theory can also be used to create a systems approach to improve
patient safety through effective teamwork. The healthcare team consists of the doctors,
the nurses, biomedical equipment technicians, and pharmacists (Powell, 2006). Also part
of the healthcare teams will be the nurses’ aides, housekeeping staff, radiologists,
respiratory therapists, physical therapists, dieticians, and even plant operations that keep
the physical environment regulated and repaired. All of the people involved in the care of
the patient are to be considered a part of the healthcare team. Systems thinking theory had
all teams depending on and influencing other teams to improve care. Again, under the
family environment or the hospital unit in the HET, nurses work with respiratory
therapists to ensure a patient is suctioned every two hours or with the physical therapist to
ensure the patient has been helped out of bed and walked in the hallway. According to the
systems thinking theory, the ‘organization’ provides the infrastructure in which the care
teams function (Powell, 2006). In the HET, the organization is the administrative
department of the hospital. It is the task of the administrative department to create the
cultural climate of patient safety to reduce medical errors and adverse events from
occurring. Looking at patient safety through the lens of the systems thinking theory, low
hand hygiene rates, which put patients’ at risk for HAIs, can certainly be counted as a
medical error or adverse event, especially if the patient dies from the HAI.

56
Peter Pronovost (2015) has stated that no single discipline or single theory will be
sufficient to improve patient safety. He also contended there was a need for
multidimensional interventions based on theory or logic models. Not only is it important
to evaluate the impact of the intervention, it is also important to evaluate the intervention
itself (Pronovost, 2015). This is being done through the pre-intervention baseline hand
hygiene rates being collected and the HHA rates post intervention. In hand hygiene
surveillance, it is also important to evaluate the sustainability of the intervention.
Fisher and Zink (2012) commented that a systems approach must recognize the
interrelationships and the interdependencies of the surrounding environments. This
concept was also supported by Trochim, Cabrera, Milstein, Gallagher, & Leischow
(2006) when they discussed how a healthcare system was connected and interdependent
on its parts (which I called the HCW and the environments). In the HET, there were true
relationships developed between all six environments and the HCW as multidirectional
influences.
Patient safety can be defined as the absence of patient harm. Initially, researchers
focused on the incidences of medical errors and adverse events. The systems approach
was used to link patient safety and multiple disciplines of the HCW (Infante, 2006). The
person (the HCW), the team (the family environment), the task (the work environment),
the workplace (again the work environment), and the institution (the administration) are
all targets for the systems approach utilizing a broad model of patient safety (Infante,
2006).

57
I proposed that this broad model was the HET. All environments must be aligned
and work in harmony in order for optimal care to be delivered to the patient, to provide a
safer environment for the patient, and to reduce the risk of HAIs. By recognizing the
complexity of HHA, multidimensional behavioral interventions can be aimed at the
HCWs by focusing on the effects the different environments have on the HCWs and
providing interventions to counterbalance these effects (Burke, Smith, Sveinsdottir, &
Willman, 2010).
Kaufman and McCaughan (2013) linked the organizational culture (the
administration environment in the HET) and patient safety. It has been shown in multiple
studies that as HHA rates increase (thus providing a cultural environment of increased
patient safety), there was a corresponding decrease in HAIs. Emphasis has shifted from
the concept of individual error and individual blame to the concept of systems and safety
culture. It has become clear that if a process is flawed in design, eventually the process
will fail due to human error. Or the lack of HHA will result in a HAI. In order to establish
a broader concept of patient safety, the healthcare industry needs to move from a silo
environment to the interactive environments of the HET.
According to Zborowsky and Kreitzer (2009), a person’s (the HCW) surrounding
environment is comprised of the physical, mental, emotional, and spiritual environments
and it is this systems thinking that provides the framework for providing optimal patient
care. Systems thinking focuses on the relationships and the interaction of the parts
(environments of the HET) on the whole. Understanding the interactions and
relationships between each of the environments and the HCW is as important as

58
understanding the different environments themselves. Systems thinking is useful in
identifying these relationships and interactions (Zborowsky and Kreitzer, 2009).
Likewise, using the HET, it is important to understand how the family environment
interacts with the church environment, the administrative environment, the community
environment, the cultural environment, and the work environment and in turn how each
of these environments interact with each other and the HCW in regards to the patient
safety culture and especially in regards to HHA rates.
Kaufman and McCaughan (2013) write there are invisible and unconscious
aspects of culture (the inherent habits of HHA) such as attitudes, values, beliefs, and
norms of behavior. This can be linked to the culture environment presented in the HET.
The culture of not only the individual nurse, but the diversity of all of the cultures of the
nurses working together, creates a work culture unique to that particular nursing unit.
And all of the unit cultures plus the influence of the administrative culture combine to
form the hospital patient safety culture (Gifford, Zammuto, & Goodman, 2002; Sammer
& James, 2011). An atmosphere of effective teamwork (the family environment or the
hospital unit) plus all of the environments working in unison will contribute to quality
patient care.
Carayon (2012) and Carayon et al. (2012) applied the Systems Engineering
Initiative for Patient Safety (SEIPS) model of work system and patient safety. They
presented a schematic in which the external environment is laid out as a square with the
person (HCW) in the middle. The four corners are technology and tools, organization,
physical environment, and tasks. It is felt that this square can be compared to Mr.

59
Troyer’s square of environments and aligns with the HET. The technology and tools are
the work environment, the organization is the administration of the hospital or the
government according to Mr. Troyer, physical environment or the cultural environment
of the hospital, and the tasks, which is equivalent to the work environment.
One of the major components of infection prevention has been education. But the
degree of knowledge, both by nurses and by physicians, about the transmission of
organisms does not necessarily predict appropriate behavior (McLaws, Farahangiz,
Palenik, & Askarian, 2015; Pittet, 2004). Multiple guidelines and policies exist from
WHO, CDC, APIC, and the Society for Healthcare Epidemiology of America (SHEA),
which direct HCWs what they should do, but still rates remain in the 40-60% range
(Erasmus et al, 2010) A study conducted in 2013-2014 showed that HCWs have
sufficient knowledge levels and proper attitudes toward hand hygiene practices, but still
have low adherence rates (Hosseinialhashemi, Kermani, Palenik, Pourasghari, &
Askarian, 2015). Pittet comments that few social cognitive models have been used to
evaluate HCW’s perceptions toward infection prevention practices and none have been
successfully applied to change behavior (Pittet, 2004). Pittet (2004) proposed that not
only will multidimensional interventions be required for successful strategy to improve
HHA, but that these interventions must also come from several levels of cognitive
determinants. Using the intrapersonal level of the HET, educational interventions can be
aimed at the knowledge base, attitudes, behaviors, and other characteristics of the
individual nurse (Barry & Honoré, 2009). By understanding which of the demographic
variables are associated with positive hand hygiene rates, education can be modified to fit

60
those receptive demographics. The demographics may influence not only how the
message is delivered but also how the message is received.
The interpersonal level (the family environment and the work environment) will
Involve peer groups and role models. Demographic variables may help identify peer
groups and who the role models should be, the younger or older nurse, the nurses with the
more experience or those newly graduated (Barry & Honoré, 2009), or perhaps the role
models will be identified as belonging to a particular religion or a particular culture.
At the community level, or at the hospital level, there has to be administrative
support for any HHA interventions to be successful and there has to be prevalent a
culture of patient safety. And this support from administration has to be real and action
based. In the WHO Hand Hygiene Self-Assessment Framework Global Survey Summary
Report (2015), 73% of the Chief Executive Officers made a clear commitment to the
improvement of hand hygiene. The question remains, however, as to why this is not
100% support. But it is easy to say you are committed to improving hand hygiene
adherence rates but the words are hollow rhetoric when there is only a 53% establishment
of a hand hygiene team (WHO hand hygiene self-assessment, 2015). In a recent report,
less than 20% of the ICPs who had access to electronic health records were involved in
the design, selection, or implementation of the system (Hebden, 2015). There must be a
level of cooperation between departments and between units. At the community level in
which nurses are actually a part, the community attitudes and culture will affect the
adherence rates of hand hygiene of the nurses in the hospital and vice versa (Whitby et
al., 2006). At the hospital level, there are potential interactions between individual nurses,

61
units, departments, and the hospital. Hand hygiene guidelines and hospital policy can also
be focused on at this level (Barry & Honoré, 2009).
The HET relates to the present study in a circumflex manner. By identifying those
social determinants that have an association with HHA better interventions can be
designed to move the behavior of nurses toward a higher rate of adherence. HHA is not
driven by a single variable. In order to understand hand hygiene, studies need to be done
at multiple levels, on multiple variables. Because culture is an important part of the
environment of patient safety, it is important to determine if there is a relationship
between this demographic variable and hand hygiene. The demographic factors of age,
gender, number of years since graduation, number of years of nursing practice, number of
children, and marital status might be associated with either the family, work, or church
environments or a combination of these. The research questions pertain to whether or not
these demographic variables are associated with higher HHA. Intrapersonal factors such
as knowledge, attitudes, beliefs, and personality may be associated with these
demographic variables. Likewise, interpersonal factors include family, friends, and peers
providing social identity, support, and role definition. All of these factors come into play
in the work environment, in this case, the nursing unit and then extended to the hospital.
Interpersonal relationships might be influenced by the demographic factors of spiritual
affiliation, areas of previous nursing practice, and whether the nurse is a hospital
employee or works as an agency nurse (Pittet, 2004).
The overall hospital culture as well as the nursing unit culture also comes into
play. Each hospital and each unit has its own culture, with its own social beliefs, norms,

62
ideologies, policies, with informal laws at the unit level and enforceable policy at the
hospital level. All of the staff on a particular unit share in a common identity, values, and
history (Onwuegbuzie, Collins, & Frels, 2013). In a qualitative study on HCWs’
perspective on hand hygiene, McLaws et al. (2015) found that participants in their study
believed that interpreting and/or adhering to hand hygiene was a personal decision
influenced by individual behavioral factors. It may be possible that some of these
individual behavioral factors are influenced by the demographic variables being studied.
It is believed that the healthcare environment theory can be used to coordinate
multiple interventions all aimed at the HCW during the same time period in order to have
maximum influence on increasing HHA. It is recognized that to move HHA higher with
the goal of reducing HAIs, multidimensional interventions need to be undertaken such as
the introduction of bundles to help reduce HAIs (Khan et al., 2016; Pan A. et al., 2013).
In a study in which the use of VAP bundles was increased from 90.7% to 94.2%, the
number of VAP events decreased from 144 [2008-2010] to 14 [2011-2013] (Khan et al.,
2016).
An educational intervention aimed to increase awareness of the nurses of the
importance of hand hygiene in preventing HAIs, to protect themselves, and to the number
of germs on their hands can be tied to the work environment. By perhaps working with
the children in the schools, the family environment is affected for those nurses who are
parents. Assignments can be made for the children requiring parental help to bring
awareness to the parent nurse and to the child.

63
Administration is a huge component of any intervention that is going to be
undertaken. Administrative support has to be honest and true and the administrators have
to be on board with their own intervention to increase hand hygiene. Working with the
health department, campaigns in the community for better hand hygiene can be aligned
with the timing in the hospital so the nurse is hearing the same message at work and in
the community. The culture of the work environment has to be taken into consideration
as well as consideration for religious influences that might occur. Recognition that certain
cultural groups, age groups, or gender groups may have specific teaching needs must also
be acknowledged and incorporated into any interventions aimed at increasing hand
hygiene adherence.
I believe that the HET is natural progression of systems thinking theory in
combination with Bronfenbrenner’s ecological systems theory and the teachings of Mr.
Dusty Troyer. The idea of influencing factors affecting the HCW, the HCW affecting the
influencing factors, and those factors influencing each other in a multidirectional manner,
is the concept linking all three of these theoretical models into the HET.
Literature Review: Overview of Hand Hygiene
Hand hygiene may be referred to as hand washing (washing hands with non
antimicrobial soap and water), hand antisepsis (antiseptic handwash or antiseptic hand
rub), or hand hygiene being a general term applying to hand washing, antiseptic hand
washing, using the alcohol based sanitizer gels, or surgical hand antisepsis (Boyce &
Pittet, 2002; CDC, 2013c). In 1985 formal guidelines were written for handwashing by
the Centers for Disease Control and Prevention [CDC] (Garner, Favero, & Hospital
64
Infection Program, 1985). These were followed by hand hygiene guidelines written in
1988 and 1995 by the Association for Professionals in Infection Control [APIC] (Boyce
& Pittet, 2002) with the CDC updating their guidelines on hand hygiene in 2002 (Boyce
& Pittet, 2002). The WHO 2009 guidelines on hand hygiene list hand hygiene practices
as antiseptic handwashing, antiseptic handrubbing (or handrubbing), hand
antiseptic/decontamination/ degerming, hand care, handwashing, hand cleansing, hand
disinfection, hygienic hand antisepsis, hygienic handrub, hygienic handwash, and
surgical hand antisepsis/surgical hand preparation/presurgical hand preparation (WHO
guidelines, 2009). APIC released their new Guide to Hand Hygiene Programs for
Infection Prevention in June of 2015 (APIC, 2015).
A better definition of hand hygiene is given by Pfoh et al., (2013) as a general
term for removing microorganisms with a disinfecting agent such as soap and water or
the use of the alcohol sanitizer maintaining that hand hygiene should be conducted at
certain opportunities of patient care such as before seeing patients, after contact with
bodily fluids, before invasive procedures, before and after donning gloves, and after
contact with a patient. The WHO has established My Five Moments of Hand Hygiene:
before patient contact, before an aseptic task, after exposure to bodily fluid, after patient
contact, and after contact with the patient’s environment (Pfoh et al., 2013; Steed et al.,
2011).
In 1938, the bacteria on hands were divided into transient and resident flora.
Transient bacteria were defined as those organisms acquired by direct contact with a
patient or a contaminated surface. They are the most amenable for removal by hand

65
hygiene and most likely to cause a hospital acquired or nosocomial infection (Boyce &
Pittet, 2002). Common bacteria causing nosocomial or hospital acquired infections today
are E. coli, Pseudomonas aeruginosa, Staphylococcus aureus, MRSA, Clostridium
difficile, Streptococcus pyogenes, Vancomycin resistant Enterococcus (VRE), and
Acintobacter (CDC, Gram-negative bacteria, 2011a). Staphylococcus aureus is the
organism responsible for 30.9% of primary bloodstream infections and 19.9% of central
line associated bloodstream infections (Davis, 2014).
Common bacteria found on the hands of HCWs include Acintobacter baumannii
and Klebsiella pneumoniae (Kapil, Bhavsar, & Madan, 2015; Salmon, Truong, Nguyen,
Pittet, & McLaws, 2014b; Tajeddin et al., 2016). In a recent study, it was shown that
Staphylococcus aureus presented viability at greater than 70 days in all conditions tested.
Enterococcus faecalis survived for 21 days, and Klebsiella pneumoniae was still present
at 14 days (Esteves et al., 2016). With bacteria viable on surfaces for such long periods, it
is easy to see how bacteria can be picked up by a HCW from the environment and spread
to a patient.
Environmental surfaces have been shown to be contaminated with organisms. In a
2016 study by Tajeddin et al., 51% of the environment was found to be contaminated.
Oxygen masks (81.8%), ventilators (82.9%), and bed linens (67.7%) were the most
contaminated environment objects (Tajeddin et al., 2016). In a study at the Cleveland
Veterans Affairs Medical Center, 42% of the privacy curtains were found to be
contaminated with Vancomycin Resistant Enterococci (VRE), 22% were contaminated
with MRSA, and 4% were contaminated with C. difficile (Trillis, Eckstein, Budavich,
66
Pultz, & Donskey, 2008). Another study showed that cotton fabric was the most
favorable surface for growth of bacteria especially when it was contaminated with blood
Esteves et al., 2016). With hospital scrubs being made of cotton, with nurses frequently
having their uniforms stained with body fluids, and with nurses’ uniforms up against bed
sheets, it is easy to see how the transfer of organisms can take place. Without the benefit
of a protective gown to cover their uniform, once contaminated, organisms can be
transferred to the bed sheets of many other patients. In a 2004 article by Bala Hota it is
questioned whether the organisms found on the surface are ‘innocent bystanders’ or the
actual source of contamination and infection. Hota states that a possible contamination
should be measured by four factors: 1) the degree of the contamination, 2) if the surface
was contaminated before or after the patient’s colonization, 3) confounders that might be
influencing the rates, and 4) if improved cleaning reduces the risk of cross contamination
(Hota, 2004, p. 1182).
Much of the equipment used by nurses and HCWs in hospitals is shared
equipment, such as portable x-ray machines, themometers, portable blood pressure cuffs,
workstations on wheels (WOWs), phones, computer key boards, and computer screens.
All of these items are high touch surfaces and can serve as a contaminated environmental
object for the transfer of organisms. E. coli was isolated on 12% of the hospital computer
touch screens (Gerba, Wuollet, Raisanen, & Lopez, 2016).
To compound the problem, multidrug resistant organisms are increasingly being
seen. Carbapenem-resistant or Carbapenemase-producing Enterobacteriaceae had been
confirmed by the CDC in 33 states as of 2011 (CDC, Gram-negative bacteria, 2011a).
67
Based on the National Healthcare Safety Network (NHSN) data from 2008, 13% of E.
coli, 13% of Klebsiella, 17% of P. aeruginosa, and 74% of Acintobacter baumannii
appearing in intensive care units (ICUs) were multidrug resistant (CDC, Gram-negative
bacteria 2011a). An OXA-48-producing K. pneumoniae was persistent in the same
hospital room for over 20 months (Pantel, Richaud-Morel, Cazaban, Sotto, & Lavigne,
2016). All of these organisms have the potential to be transferred by a nurse to a patient,
from a patient to a nurse, from one patient to another patient via the carriage on a nurse’s
hands, from one nurse to another nurse, from a nurse to a non-healthcare worker such as a
patient’s family member, a visitor, or to a member of the nurse’s own family. The best
and most cost effective method to prevent this transmission is the reduction or removal of
these organisms by proper hand hygiene (Kapil, Bhavsar, & Madan, 2015; Kendall,
Landers, Kirk, & Young, 2012; Pittet et al., 2000; Shah & Singhal, 2013; Son et al.,
2011). Hand hygiene has been recognized not only as the most effective method of
reducing HAIs in terms of cost and efficiency, but it also controls antimicrobial resistance
(Rosenthal, Guzman, & Safdar, 2005b).
With two million to ten million bacteria being found from the fingertips to the
elbow on a person (APIC Guide to Hand Hygiene, 2015) and with at least 50 bacteria
having the potential of being pathogenic, even normal skin bacteria of the patient or the
nurse can become opportunistic and cause infection in a weakened, immunocompromised
patient (Weston, 2010). In a 2015 study, 70% (42 out of 60 HCWs) had bacterial counts
up to 100 colonies or more on both hands before hand hygiene was done with the alcohol
gel. Eight HCWs had S. aureus on their hands with three carrying MRSA. Five HCWs

68
had Klebsiella species or E. coli with three of these organisms being extended spectrum
beta lactamase (ESBL) producers. Eight HCWs were carrying Acinetobacter species and
three of these were Carbapenem resistant (Kapil et al., 2015). Fifteen percent (15%) of
these HCWs were carrying pathogenic bacteria on their hands before hand hygiene was
done. If hand hygiene is not done before touching a patient, these organisms can be
transferred to another person or to another environment.
Transfer of an organism from a patient’s skin, the hands of the nurse, a
contaminated surface, or a device biofilm may result in an asymptomatic colonization, a
mild infection, a life threatening infection, or death (Weston, 2010). Infection may be
defined as the process of microbial invasion by an organism resulting in tissue damage
such as redness, drainage, swelling, or increased temperature of the tissue and/or death of
the patient (Weston, 2010). If the patient has an indwelling device placed such as a
central line, a urinary Foley catheter, a peripheral intravenous line, or has been placed on
a mechanical ventilator, their risk of developing an HAI increases significantly.
Approximately 200 million peripheral intravenous catheters are placed in patients each
year. It has been demonstrated that peripheral intravenous device blood stream infection
rate related to Staphylococcus aureus may be as high as 23.5% (Davis, 2014). Duration
of hospital stay, morbidity, and hospital bed occupancy rate also increase the risk to
patients becoming colonized with MRSA and C difficile (Weston, 2010).
Biofilm, a collection of microbial cells, can adhere to the surface of a wide variety
of surfaces such as living tissue, indwelling medical devices, the water pipes within a
hospital or nursing unit, natural aquatic systems, or an artificial aquatic system such as

69
fountains or water walls (Donlan, 2002). Once established, a biofilm becomes attached to
the surface, is enclosed in a matrix of primarily polysaccharide material, and becomes
highly resistant to treatment by antibiotics. Biofilms may be composed of gram-positive
or gram-negative bacteria or yeast, be composed of a single species or multiple species of
bacteria, and colonize essentially 100% of all-indwelling central venous catheters. Access
is by migration externally from the skin or the hands along the outside of the catheter
surface or internally from the catheter hub or port, which may be assessed multiple times
a day to administer medication or nutrition. If the hub or port is not cleared of bacteria
before a needle is inserted, organisms can be pushed inside the line, providing the
opportunity for the development of a biofilm on the inside of the line. Colonization can
occur within 24 hours of placement (Donlan, 2001; Donlan, 2002). Internal colonization
can also be caused during the insertion of the line if the skin is not cleansed properly and
full barrier precautions are not carried out during insertion.
The bare hands or the gloved hands of a nurse can pick up biofilm. Unless the
hands are decontaminated between touching different surfaces of the patient (touching a
Foley catheter and then touching a central line), a transfer of organisms may result
causing infection at multiple sites. Or if the hands are not decontaminated upon exiting
the patient’s room and another room is entered without decontamination, transfer of
organisms may occur from one patient to another.
Multiple outbreaks of infections and adverse events have occurred in hospitals as
a result of the transfer of organisms from one patient to another when there was no HHA.
An estimated 48-million foodborne outbreaks occur in the United States every year

70
(CDC, 2015f). The CDC Epidemic Intelligence Service conducted 531 outbreak
investigations between 1946-2005 in facilities in the United States and abroad (Archibald
& Jarvis, 2011). During the two years of 2014 and 2015, investigators from the CDC
were sent out over 750 times in response to health threats (CDC, 2015a).
Investigations independent of the CDC have frequently been reported in the
literature: outbreak of Enterobacter cloacae in a neonatal ICU was associated with
overcrowding, understaffing in the unit, and poor hygiene habits in a hospital in Geneva,
Switzerland (Harbarth, Sudre, Dharan, Cadenas, & Pittet, 1999); an outbreak of
extended-spectrum-beta-lactamase (ESBL) Enterobacter cloacae in a cardiothoracic ICU
in Barcelona, Spain (Manzur et al., 2007); a two-year outbreak of MRSA [sequence type
239] in an ICU in the UK (Edgeworth et al., 2007); outbreak of Pseudomonas aeruginosa
in an ICU in the Netherlands (Knoester et al., 2014); an outbreak of Norovirus in
Colorado (Magill-Collins et al., 2015); a mumps outbreak in France (Maillet et al.,
2015); a Serratia marcescens outbreak in a neonatal ICU (Montagnani et al., 2015); and
the investigation of the rapid spread of the Zika virus in the Americas in preparation for
the 2016 Brazil Olympic games (Petersen et al., 2016).
As a result of the work done by Ignaz Semmelweis and Oliver Wendell Holmes,
hand hygiene has become accepted as one of the most important ways to prevent the
transmission of healthcare HAIs (Boyce & Pittet, 2001; Mathur, 2011).
Literature Review: Historical Background
In 1795, Dr. Alexander Gordon of Aberdeen, Scotland, wrote his treatise on the
Epidemic of Puerperal Fever in which he contends that midwives and physicians who
71
had previously cared for women with puerperal fever were spreading the miasma or
disease to other women (Markel, 2015). But it was not until Semmelweis that proof was
provided.
The first epidemiological study that connected increasing hand hygiene to that of
decreasing infections was the study on puerperal fever (childbed fever) done by Ignaz
Philipp Semmelweis (1818-1865). Caused by Streptococcus pyogenes (Pittet, 2004),
puerperal fever was a serious form of septicemia or blood poisoning in mothers following
the birth of their baby (Famous doctors, 2009b).
Having graduated in 1844 from the University of Vienna with his MD degree, in
1846 Semmelweis was appointed assistant to Johannes Klein as a lecturer in the
maternity department of the University of Vienna’s Allegemeines Krankenhaus
(Vienna’s General Hospital), in Vienna, Austria (Lane, Blum, & Fee, 2010). Semmelweis
observed there was a difference between the mortality rate at the Lying-In Women
Hospital’s First Clinic, where doctors and medical students provided the care to the
laboring mothers, and the Second Clinic, where the midwives provided the care.
Admissions were alternated between the two clinics every 24 hours. Prior to June 1847,
the peripartum mortality rate for the First Clinic had reached 16% compared to the 7% in
the Second Clinic (Pittet & Boyce, 2001). Another study by Cork, Maxwell, and Yeo
(2011) quotes the maternal mortality rate of the First Clinic as greater than 10% and that
of the Second Clinic as less than 4%. A third article stated that in April 1847 the
mortality rate was 18.3% and once washing in the chlorinated lime solution was
instituted, the mortality rate dropped to 2.2% by June, 1.2% in July, and 1.9% in August

72
(Famous doctors, 2009b). It should be noted the germ theory would not be developed
until the 1860s-1870s by Louis Pasteur, Robert Kock, and Joseph Lister (Joseph Lister
and antiseptic surgery, 2015; Louis Pasteur, 2015; Robert Kock, n.d.). Rubber gloves
were not invented until the winter of 1889-1890 (Lathan, 2010). So during the time
Semmelweis was at the Vienna General Hospital, the doctors examining laboring mothers
did not wear gloves and did not wash their hands after coming from the autopsy room or
between patients.
Theoretically, because of the increased level of education of the physicians and
medical students, the First Clinic should have had the lower mortality rate. Semmelweis
was perplexed at the discrepancies in the mortality rates of the two clinics, but it was only
when a friend and colleague, Professor Jakob Kolletschka, died with symptoms similar to
childbed or puerperal fever (Famous doctors, 2009b; Lane et al., 2010), that he was able
to identify the missing piece to his puzzle. Professor Kolletschka had sustained a cut to
his hand during an autopsy on a woman who had died of puerperal fever. The difference
between the First Clinic and the Second Clinic were the autopsies, which were performed
only by the physicians and medical students, not the midwives. Semmelweis concluded
that “cadaverous particles” were being transferred inadvertently from the autopsy rooms
to the mothers he and his colleagues were examining (Famous doctors, 2009b; Lane et
al., 2010). In May 1847 Semmelweis instituted the practice that all residents and
physicians must scrub their hands in an antiseptic chlorinated lime solution after coming
out of an autopsy room and before entering the maternity clinic (Famous doctors, 2009b;
Lane et al., 2010). This chlorine-based bleach solution had been discovered by Claude
73
Louis Comte Berthollet in 1784 while studying the properties of the newly discovered
chlorine gas (Claude-Louis Berthollet, n.d.; Mauskopf, n.d.). Dr. LeConte defined this
solution as the ‘perfect surgical germicide’ (Griffith, 1918, p. 23). Earlier in 1822,
Antoine Germain Labarraque, a French pharmacist, demonstrated that foul odors
emanating from human corpses could be eradicated with a solution of chlorides of lime or
soda and that this solution could also be used as a disinfectant and antiseptic. In a paper
in 1825, he suggested that physicians attending patients with a contagious disease might
benefit from “moistening their hands with a liquid chloride solution” (Hand
hygiene,2015, para. 1).
The maternal mortality rate of the First Clinic quickly fell to 3.06%, matching the
Second Clinic and remained low for many years (Pittet & Boyce, 2001). But as is often
the case with trying to change inherent behavior, Semmelweis’s hypothesis was met with
skepticism and rejection despite the proof of lower infection rates. Ostracized by his
medical community, Semmelweis returned to St. Rochus Hospital in Budapest, Hungary.
During the next six years, he reduced the maternal mortality rate from puerperal fever to
0.85% (Cork et al., 2011; Lane et al., 2010; Pittet & Boyce, 2001). In 1861 Semmelweis
published his findings, Die Ätiologie, der Begriff und die Prophylaxis des Kindbettfiebers
or The Etiology, Concept, and Prophylaxis of Childbed Fever (Lane et al., 2010). When
his work was again ignored, ridiculed, and rejected, he became depressed and began
drinking, resulting in behavior that was an embarrassment to his family and professional
colleagues. It is also speculated that his erratic behavior may also have been caused by
syphilis, a condition many obstetricians contacted from their patients in the coarse of

74
doing deliveries; by early Alzheimer’s; or just a mental breakdown due to the many years
of stress and rejection (Markel, 2015). On July 30, 1865, he was deceived by family and
colleagues into entering an insane asylum. During an attempt to escape, he was beaten by
guards and sustained a wound to his hand. Two weeks later, August 13, 1865, at the age
of 47, he died with symptoms resembling septicemia or childbed fever (Cork et al., 2011;
Lane et al., 2010; Markel, 2015; Semmelweis, 2009a).
At the same time Semmelweis was fighting his battle in Hungary to increase
HHA to decrease infections, Oliver Wendell Holmes (1809-1894) was fighting the same
battle in the United States. Because of his other achievements in literature, poetry, and
lecturing, his medical reputation did not suffer the same ravages, as did Semmelweis. Just
as Semmelweis recognized the symptoms of a colleague’s death being similar to
puerperal fever, Holmes heard of a physician who died one week after performing a
postmortem exam on a woman who had died of puerperal fever. Holmes began
investigating and in 1843, published his paper on ‘The Contagiousness of Puerperal
Fever’ (Holmes, 1843). His premise was that puerperal fever was being passed from one
mother to another via the hands of the obstetricians who were caring for them. When he
presented his paper before the Boston Society of Medical Improvement, Holmes’
inflammatory view brought about a verbal attack by the leading Philadelphia obstetrician,
Charles D. Meigs. Dr. Meigs declared that any physician was ‘simply unlucky’ if he had
cases of puerperal fever in his practice (Lane et al., 2010; Pittet & Boyce, 2001).
Continuing the battle against infectious diseases, during World War II, a group of
physicians lead by Dr. Joseph W. Mountin established the Malaria Control in War Areas

75
in Atlanta, Georgia and worked to keep the southern United States free of malaria and
endemic typhus fever. Atlanta was chosen as the site rather than Washington, D.C.
because Atlanta was the center of the malaria problem. On July 1, 1946, this organization
was renamed The Communicable Disease Center (CDC) as a branch of the Public Health
Service, expanding its goals to include lowering the infection rates of all communicable
diseases. In 1949 Dr. Alexander Langmuir was appointed the head of the epidemiology
branch and the first disease surveillance program was launched.
As the years progressed, various departments were added to the CDC, such as the
venereal disease program in 1957, the tuberculosis program in 1960, immunization
practices and the Morbidity and Mortality Weekly Review (MMWR) in 1961, and The
Foreign Quarantine Service in 1967. In 1970 the name was again changed to the Center
for Disease Control. Because of an increasing emphasis on prevention, the Centers for
Disease Control and Prevention (CDC, Historical perspectives, 1996) came into being in
October 1992. Today, the CDC along with the World Health Organization (WHO) serves
as a world premier leader of health promotion, disease prevention, and emergency
preparedness (CDC, Our history, 2013b).
In 1974, the CDC undertook its most expensive study to date, The Study on the
Efficacy of Nosocomial Infection Control or the SENIC project. A preliminary article was
published in 1980 announcing the purpose of the study, that data collection had been
completed, and that the analysis was underway (Haley, Quade, Freeman, & Bennett,
1980). In 1985 the results were published showing that the establishment of an infection
control department participating in surveillance and control programs was strongly

76
associated with reductions in nosocomial infections of ventilator associated pneumonia
(VAPs), central line associated bloodstream infections (CLABSIs), surgical site
infections (SSIs), and catheter associated urinary tract infections (CAUTIs) between 1970
and 1975-1976. An effective program was defined as having an active infection control
physician, an infection control nurse for every 250 beds, and a system for reporting
infection rates back to practicing surgeons. The establishment of an effective infection
control program could reduce hospital infection rates by 32% (APIC, Infection
surveillance, n.d.b; Haley et al., 1985b). The SENIC study became a pivotal point in
infection prevention as did the research and leadership of Elaine Larson, PhD, who
advocated hand hygiene from the 1970s (Larson & Lusk, 2006). If Semmelweis is
considered the father of hand washing, Dr. Larson should be considered the mother of
hand washing.
In the 1960s in parallel with the development of the CDC, hospital surveillance
and the establishment of infection control departments came into being for the purpose of
reducing hospital acquired infections or nosocomial infections. Infections acquired in the
home were called nosohusial infections. Later it was realized that infections in patients
were also being acquired in places other than hospitals, such as in nursing homes,
surgical centers, and dialysis centers so the more generic term of healthcare associated
infections (HAIs) came into being.
In 1969, a group of infection control professionals (ICPs) met at the CDC training
program for nurse epidemiologists. In 1972, this group of ICPs from New England, who
became known as the “Dirty Dozen”, was instrumental in founding the Association for

77
Professionals in Infection Control and Epidemiology (APIC) with New England
becoming the first chapter of APIC. Currently there are 114 chapters in the United States
plus three international chapters. In 1980, the APIC Certification Association (APICCA)
was established for the purpose of recognizing the professional qualifications and
expertise of a person specializing in infection control and prevention. Nurses who
qualified could now be Certified in Infection Control with the designation of CIC behind
their name with recertification required every five years (APIC, New England, n.d.c). In
1982, the name was changed to CBIC, the Certification Board of Infection Control
(CBIC, 2015). Today the APIC organization is represented in 48 countries with a
membership of 15,000 (APIC, History, n.d.a; APIC, Number of chapters, n.d.d.). It is this
group that spearheads hand hygiene as the number one way to prevent the spread of
diseases.
CDC’s major focus is now on five strategic areas: supporting state and local
health departments, improving global health, implementing measures to decrease leading
causes of death, strengthening surveillance and epidemiology, and reforming health
policies (CDC, Our history, 2013b). As part of the surveillance strategy, in 1970, the
National Nosocomial Infection Surveillance system (NNIS) was established with 62
participating hospitals in 31 states, specifically chosen for size, location, and being a
teaching or non-teaching hospital. Identities of the hospitals were kept strictly
confidential. By 1999, data was being collected from 285 hospitals in 42 states (CDC,
Monitoring, 2000). The purpose of NNIS was to collect information on nosocomial
infections, aggregate the data, and report the findings to the infection control community.

78
For the first time, hospitals could now compare their own infection rates against a
national benchmark (CDC, NNIS, 2004; CDC, Nosocomial infection, 1986; Dudeck et
al., 2013; Horan, Andrus, & Dudeck, 2008).
A second benefit was the establishment in January 1988 (Garner, Jarvis, Emori,
Horan, & Hughes, 1988) of standardized definitions for different kinds of nosocomial
infections with the definitions being updated for January 2015 and modified in April
2015 (CDC, CDC/NHSN, 2014b). Now a bloodstream infection in a hospital in
California would be classified the same as a bloodstream infection in Florida or in
Massachusetts. With standardized definitions and with HAIs being reported by individual
hospitals to a central database, the stage was now set for The Centers for Medicare and
Medicaid Services (CMS) to establish a reimbursement payment system based on the
infection rates in each individual hospital, although this would not take effect until
October 1, 2008 (Centers for Medicare & Medicaid Services, HAC, 2014b; Deficit
reduction act, 2005).
In 2004 the NNIS system evolved into the National Healthcare Safety Network
(NHSN) and today it is the most widely used healthcare-associated infection tracking
system in the nation with over 13,000 medical facilities tracking HAIs (CDC, About
NHSN, 2014a). Legislation had already been passed in 27 states making mandatory
reporting of HAIs to NHSN when on January 1, 2011, the CMS final rules made it
mandatory for all hospitals to report central line-associated bloodstream infections
(CLABSIs) to NHSN (Committee to reduce infection deaths, 2013). Requirements were
added in 2014 in which mandatory reporting of all CLABSIs, surgical site infections

79
(SSIs), catheter associate urinary tract infections (CAUTIs), influenza vaccination rates
of hospital employees, inpatient Methicillin Resistant Staphylococcus aureus (MRSA)
specimens, and Clostridium difficile infections would be made to NHSN beginning on
January 1, 2015 (CDC, Operational guidance, 2014c). The ICP or another person
designated by the hospital (usually someone from the quality department) would enter all
of the identified HAIs for the preceding month into designated programs set up in NSHS.
Quarterly, CMS pulls data from NHSN to calculate reimbursement rates to hospitals.
Before October 1, 2008, because of the way the Centers for Medicare and
Medicaid ICD-9 payment program was structured, many hospital administrations
believed that payment to the hospital was higher if a patient developed an infection and
their stay was prolonged. There was little financial incentive for hospitals to improve the
quality of their care and to aggressively work toward reducing HAIs (Conway, 2013, p.
2.11). The stated job description of the ICP in trying to reduce HAIs was in direct
opposition to the hospital’s incentive to generate revenue. After the passage of the Deficit
Reduction Act in 2005, starting on October 1, 2008, hospitals would now be penalized if
a patient developed an HAI so the push to reduce hospital infections began in earnest in
the United States.
Hands can be contaminated by touching the skin of another person or by touching
contaminated surfaces. If a single contaminated surface is touched, the pathogen or
organism picked up can be transferred to the next seven touched surfaces (McLaughlin &
Walsh, 2011). If the organism is picked up by the hands of a healthcare worker and if one
of those seven surfaces is a patient and the patient develops an infection from the passed

80
organism, then this infection becomes known as a healthcare associated infection (HAI).
An increase in HHA has been shown to decrease HAIs (Alp et al., 2014; García-Vázquez
et al., 2010; Pittet et al., 2000; Rosenthal et al., 2005b; Famous doctors, 2009b; Shabot et
al., 2016; Stone et al., 2012; Thu et al., 2015). An increase in the adherence rates in the
hospitals will affect the community infectious disease rates as well. An increase in the
community hand hygiene rates would reduce diarrheal disease by 31%. Respiratory
illnesses such as colds and influenza, strains N1H1 and H5N1, could be reduced in the
general population by 21% if proper hand hygiene was done consistently by the
populous. Diarrheal disease could be reduced in the immunocompromised population by
58% (Aiello, Coulborn, Vanessa-Perez, & Larson, 2008; CDC, handwashing, 2013a).
Gastrointestinal diseases such as Norovirus, hepatitis A, C difficile, and Helicobacter
pylori could also be reduced (Bloomfield, Aiello, Cookson, & O’Boyle, & Larson, 2007).
Risk Factors Associated with Nonadherence of Hand Hygiene
Since May 1847, behavioral change in the hand hygiene practice of HCWs has
been sought. Hospital infection prevention policies, as a measure to meet the National
Patient Safety Goals of The Joint Commission (Hospital National Patient Safety Goals,
2015), CMS, and state health departments, mandate 100% adherence with hand hygiene
whenever a HCW enters and exists a patient’s room. But even when observations of hand
hygiene were announced in advance, along with information about what the observer
would be monitoring, the adherence rate rose from an overall baseline adherence rate of
29% to only 45% (Eckmanns, Bessert, Behnke, Gastmeier, & Rüden, 2006). In Germany,
in a study by Scheithauer et al. (2009) where direct observation was measured against the

81
utilization of a hand disinfectant, HHA rates in the Surgical Intensive Care Unit (SICU)
was only 39% as compared to 16% of hand disinfectant usage, 72% in the Medical ICU
(MICU) as opposed to the 21% of hand disinfectant usage, and 73% in the Neonatal ICU
(NICU) as compared to 25% of hand disinfectant usage. Knowing the importance of hand
hygiene in reducing infections and preventing the transfer of organisms, knowing they
are being watched as part of the hand hygiene surveillance programs, knowing hand
hygiene is self-protective, and knowing hospital policies mandate 100% adherence with
hand hygiene, it remains a mystery as to why nurses, doctors, and other healthcare
associated personnel are still so resistance to the inherent adoption of 100% hand
hygiene. Lack of time or attitude are reported to be responsible for non-adherence by
Kapil, Bhavsar, & Madan (2015).
Since hand hygiene is a behavioral action, identifying the prevalence of risk
factors or reasons for nonadherence should be the first step toward the development of
meaningful and effective interventions (Mathur, 2011). Reasons for nonadherence have
been given such as the disinfectant agent causes irritation or dryness to hands, lack of
hand sanitizer and supplies, lack of habit, lack of knowledge, lack of role models,
laziness, high workload, understaffing, intensity of job-related activity, and glove use
instead of hand hygiene (Allegranzi & Pittet, 2009; Allegranzi, Sax, & Pittet, 2013;
Cusini, Nydegger, Kaspar, Schweiger, Kuhn, & Marschall, 2015; Graf et al., 2013; Haley
& Bregman, 1982; Katherason et al., 2010; McLaughlin & Walsh, 2012; McLaws et al.,
2015; Pittet, 2001; Pittet & Boyce, 2001; Roberts, Upton, Morris, & Woodhouse, 2005;
Sharma, Sharma, Puri, & Whig, 2011; Smiddy et al., 2015; Zdrowothne, 2007). Lack of
82
sinks has also been mentioned as a barrier to hand hygiene. One study found that the
addition of two easily visible sinks in a surgical transplant unit was associated with an
improvement in hand washing (Zellmer, Blakney, Van Hoof, & Safdar, 2015). A second
study concluded that increasing the number of sinks (old hospital vs new hospital) did not
increase the HHA (Lankford et al., 2003).
Additional reasons for nonadherence include HCW job title (physicians being
more at risk for nonadherence), allied health professionals being more at risk, working
the a.m. shift, working in a pediatric ICU, and the demanding ICU workload (Alsubaie et
al., 2013; Pittet, 2001). Other studies cite skin irritation, inaccessible handwashing
supplies (lack of soap or lack of towels), wearing gloves, being too busy, and forgetting
to use hand rubs (Kalata, Kamange, & Muula, 2013; Mathur et al. 2011; Pittet et al.,
2000; Squires et al., 2013). Looking at the HHA in an ICU in Saudi Arabia, high intensity
of patient care, frequency of contracts between HCW and ICU patients, and the
performance of procedures with a of high risk of cross-contamination (Mahfouz, El-
Gamal, & Al-Azraqi, 2013; Pittet, 2001; Pittet et al., 2000) were indicators of poor hand
hygiene rates. Adherence was also shown to be lower during the summer days (first
trimester of the year in Brazil), increased during March and April and then slowly
declined through the remaining months of the year (dos Santos et al., 2013). Researchers
also identified as possible reasons for nonadherence as heavy workload, laziness,
disregard of its general preventive abilities, and glove use (Cusini et al., 2015; Fuller et
al., 2011; Graf et al., 2013; Pittet, 2001; Randle, Clarke, & Storr, 2006). Barriers
identified in developing countries have been listed as lack of infrastructure, lack of sinks

83
and clean water, lack of trained personnel, lack of surveillance systems (this includes lack
of computers and lack of electricity), poor sanitation, overcrowding such as some
countries still have two patients in one bed (Mathur, 2011; Salmon, Pittet, Sax, &
McLaws, 2015; Salmon, Tran, Bùi, Pittet, & McLaws, 2014a), understaffing in hospitals,
and a general attitude of nonadherence toward infection control practices (Mathur, 2011).
Three additional reasons for nonadherence were carrying something in their hands, code
blue (cardiac arrest) situations, bed alarms going off, and the sinks being full of towels
(S. L. Kurtz, personal experience, 2011).
There are three classes of barriers identified: environmental, attitudinal, and
process. When sinks are inconvenient to use, it increases the time to preform hand
hygiene and becomes a barrier. Many times nurses are distracted on their way to perform
hand hygiene and a new task is begun without prior hand sanitizing. Adherence after
glove removal is poor (Fuller et al., 2011). Gloves are difficult to don when the hands are
wet which discourages the use of sanitizing gel before donning gloves. Processes set up
in many hospitals are not conducive to HHA because of the physical lay out of rooms,
sinks being inconvenient, or location of sanitizer dispensers not conducive to use.
Inefficient design of nursing units require extra steps for nurses and consume time that
could be used for hand hygiene. Attitude and process barriers are many times reinforced
by environmental barriers (Chagpar, Banez, Lopez, & Cafazzo, 2010).
Additional barriers to hand hygiene have been identified as wearing rings,
bangles, dhagas (religious threads), or wristwatches (Biswal, 2013), and having long
artificial varnished nails (Silva, Andrade, & Silva, 2014); all of which have been

84
identified as interfering with proper hand hygiene cleaning technique. In a hospital study
in Vietnam, barriers were identified as a lack of basic equipment such as dysfunctional
sinks or lack of sinks, lack of soap, and a lack of alcohol-based products because of the
high cost associated with these products (Salmon et al., 2014b). In a study in four
countries in North Africa, barriers were identified as insufficient sinks and hand sanitizer
products, a lack of awareness among staff, and not a priority of management (Borg et al.,
2009). Global constraints to hand hygiene have been reported as insufficient financial
resources especially in developing countries, failure to use proven prevention strategies,
and inadequate education and training for HCWs (Lynch, Pittet, Borg, & Mehtar, 2007).
In a rural setting in Indonesia, barriers were listed as longstanding water scarcity,
tolerance of dirtiness by the community due to scarcity of water, and healthcare
organizational culture (Marjadi & McLaws, 2010). In 2007, only 57 of 192 countries had
national infection control societies (Lynch et al., 2007).
Being a member of certain HCW groups increases the risk that a person will not
be adherent with hand hygiene. The rate can vary depending on gender, professional
status, and the type and intensity of the care given (Moret, Tequi, & Lombrail, 2004). The
group most aligned with nonadherence is physicians (Al-Naggar & Al-Jashamy, 2013).
Multiple studies have compared hand hygiene rates of nurses and physicians as well as
allied HCWs. The physician adherence rate before doing clinical examinations was only
20% in one study (Moret et al., 2004). Multiple studies have shown the HHA rate of the
nurses to be higher than the rate of the physicians (dos Santos et al., 2013; Erasmus et al.,
2010; Johnson et al., 2014; Lee et al., 2011; Medeiros et al., 2015; Mertz et al., 2011;

85
Moret, Tequi, & Lombrail 2004; Saint et al., 2004b; Rosenthal et al., 2013; Sahay, Panja,
Ray, & Rao, 2016). There is also a large variance in the percentage of hand hygiene
performed on different units in the hospital. In a study from Italy, physicians showed the
following rates of adherence: 6.4% on the cardiology unit, 7.7% in the emergency
department, 12.8% in the geriatrics unit, 25.2% in the infectious disease department, and
66.1% in the ophthalmology department (Saint et al., 2009). Pittet et al. (2004b) looked at
the adherence rate of physicians at the University of Geneva Hospital. While overall
adherence was 57%, it varied depending on specialty (internists were adherent 87% while
anesthesiologists were adherent only 23% of the time), and whether or not they perceived
they were being observed (61% when observed and 44% when they were not aware of
being observed). Using direct observation, one study showed the following hand hygiene
compliance rates: ICU, 70.7%; step down unit, 75.4%, and in the hematology-oncology
unit, 73.3% (Magnus et al., 2015). Looking at different ward types, the following HHA
rates were recorded for the following wards in Australia: dental, 90.0%; long-term care,
89.5%; radiology, 88.9%, peri-operative, 78.6%, and the ER, 74.6% (National Data
Period Two, 2015).
Predictors of nonadherence with hand hygiene have included the professional
group a person belongs to, glove use, isolation status, and the type of unit or type of ICU
(Lebovic, Siddiqui, & Muller, 2013). Heavy workload has been associated with
nonadherence (Haley & Bregman, 1982; Silva et al., 2014). Also predictive have been
gender and age (Pittet et al., 2004b). But while Pittet et al., (2004b) found a gradual

86
decline in HHA as age increased, Silva et al., (2014) found that older participants (> 41
years) had the highest percentage with 66.7% adherence at the appropriate times.
In one study conducted in Egypt in 2015, focus groups in adult ICUs, neonatal
ICUs, and surgical wards were held to help determine the motivations of HCWs to use
hand hygiene. Four major themes emerged. Hand hygiene was not considered an
important practice by the majority of respondents and they did not believe that hand
hygiene could prevent cross-infection (Lohiniva et al., 2015). Hand hygiene was
participated in when the HCWs felt their hands to be dirty such as after touching blood,
stool, urine, or caring for ‘unclean patients who either had open wounds or smelled badly,
or patients the nurse considered to be unfriendly, bad-mannered, or those who exhibited
abnormal behavior (Lohiniva et al., 2015). The majority of the HCWs were confused
about the choices and effects of the different hand hygiene products. A lack of supplies
and a lack of role models also hindered hand hygiene. In these focus groups, hand
hygiene was motivated more by the desire of the HCW to have clean hands than to
protect the patient (Lohiniva et al., 2015; Whitby et al., 2006).
In 1985, in a second article spun off of the SENIC Study, the nationwide
nosocomial infection rate was reported as 2 million occurring in a 12-month period in the
6,449 acute-care U.S. hospitals in 1975-1976 or 57 nosocomial infections per 1,000
admissions (Haley, Culver, White, Morgan, & Emori, 1985a). In 2003, Burke reported
the incidence of nosocomial infections as 7.2 per 1,000 patient days in 1975 and 9.8 per
1,000 patient days in 1995. By 2005, mortality rates (as a result of nosocomial infections)
were being reported as 44,000 to 98,000 deaths a year in the U.S. representing a cost of

87
$17-29 billion a year and worldwide as 1.4 million HAIs a year (Lynch et al., 2007; Pittet
& Donaldson, 2005). In 2009, Stone reported the annual hospital costs of HAIs in the
USA to be between US$28 and $45 billion per year. In Europe, HAIs were responsible
for an additional length of stay of 16 million days with 37,000 attributable deaths and
were a contributing factor to another 110,000 deaths (WHO, 2010). Using only direct
costs, the financial burden was €7 billion [In U.S dollars, $7,968,100,000 with the euro
being valued at 1.1383 on August 22, 2015] (Foreign exchange service, 2015; WHO,
2010). In 2009, Scott put the estimated overall annual direct medical costs to the U.S.
hospitals as ranging from $28.4 to $33.8 billion. Marchetti and Rossiter (2013) have set
the direct and indirect costs of HAIs in the United States to between $96 -147 billion with
the average infection costing between $16,359 - $25,903. With 80,000 deaths per year in
the United States (Pfoh et al., 2013), the incidence of HAIs worldwide was identified as
17 to 236 HAIs per 1,000 patients (Scott, 2009). In 2013, a study in Jordan reported an
increase in the length of stay from 8.3 days for an uninfected case to 12.1 days for an
infected case. The average range of increased length of stay for patients with HAIs was
8.9 to 10.2 days (Marchetti & Rossiter, 2013). The total adjusted mean for an infected
case was $7,252 compared to $4, 209 for an uninfected case (Al-Rawajfah, Cheema,
Hewitt, Hweidi, & Musallam, 2013).
As part of their NHSN surveillance, hospitals ICPs use the standardized CDC
definitions of HAIs: An infection that occurs within a healthcare facility that was not
present or incubating at the time of admission and is the result of an adverse event in
88
which the patient acquired an infectious organism or toxin (Allegranzi et al., 2007; Horan
et al., 2008).
While an HAI is defined as any infection occurring in the patient during their
hospitalization, they are usually associated with ventilator associated pneumonias
(VAPs), CLABSIs, SSIs, and CAUTIs. While the number of CAUTIs is usually the
largest percentage of the HAIs, it is usually the least expensive and causes the least
mortality while VAPS and CLABSIs cause more than two-thirds of the deaths resulting
from HAIs and are the most expensive. Using U.S. dollars, VAPS were reported to cost
$23,000 each; the reported cost of CLABSIs has a wide range from $21,400 to $110,800;
and the cost of a surgical site infection ranged from $5,600 to $12,900. If VAP, CLABSI,
SSI, and CAUTI infections could be reduced, the number of lives saved annually would
range from 23,545 to 53,483 with cost avoidance of $2.3 to $5.34 billion (Umscheid et
al., 2011). In a study based on 69 million discharges from hospitals in 40 states between
1998 and 2006, in cases having invasive surgery, there was an extra mean length of stay
of 10.9 days, an attributable cost of $32,900, and a mortality rate for sepsis of 19.5%. The
attributable length of stay for pneumonia was 14.0 days, $46,400 in costs, and 11.4% in
mortality. This is in comparison to control cases, which were not associated with invasive
surgery: mean length of stay was 1.9 to 6.0 days, $5,800 to $12,700, and 11.7 to 16.0%
mortality. In cases in which pneumonia was not associated with invasive surgery, the
mean length of stay was 3.7 to 9.7 days, costs of $11,000 to $22,300, and a mortality rate
of 4.6% to 10.3% (Eber, Laxminarayan, Perencevich, & Malani, 2010). Another study
89
showed an increased length of stay of 14 days if an HAI was involved (García-Vázquez
et al., 2010).
Patients and healthcare workers are exposed to a wide array of organisms and
potential infections in hospitals today. Bacteriuria or a urinary tract infection may
develop if poor insertion technique is done, if the patient is older, debilitated or
dehydrated. The problem in most hospitals today is that a Foley catheter is inserted for
the nurse’s convenience, not because of a need by the patient. With greater demands on a
nurse’s time, it is a way to eliminate 15-30 minutes taking a patient to the bathroom (S. L.
Kurtz, personal experience, 2010).
The most common cause of diarrhea in the hospital today is the transfer of C
difficile. Hepatitis B, Hepatitis C, and HIV are blood borne organisms that can be
transferred from patient to nurse or from nurse to patient if proper preventive measures
are not taken. Viral respiratory infections, including Severe Acute Respiratory Syndrome
(SARS) and influenza can be spread. Norovirus gastroenteritis has also been transmitted
(Breathnach, 2013) as well as the transfer of multidrug resistant organisms such as
MRSA and VRE (Bearman, n.d.; Creamer et al., 2010).
HAIs are recognized as a major patient safety issue not just in the United States
but globally as well. In industrialized countries such as Britain and the Irish hospitals,
between 5 and 10% of admissions to hospitals result in an HAI (Breathnach, 2013;
Marchetti & Rossiter, 2013), while in developing countries this risk is two to twenty
times higher with HAI infection rates frequently exceeding 25% (Pittet et al., 2008). In a
comparison between the U.S. NNIS rates (1992 - 2004) and the International Nosocomial

90
Infection Control Consortium (INICC) (2002 - 2005), rates for VAPs per 1,000 ventilator
days was 5.4 (range of 1.2 - 7.2) for the U.S. and 24.1 (range 10.0 - 52.7) for the 46
hospitals in Argentina, Brazil, Colombia, India, Mexico, Morocco, Peru, and Turkey.
Rates of CLABSIs per 1,000 central line days were 4.0 (range 1.7 - 7.6) in U.S. to 12.5
(range 7.8 - 18.5) in INICC countries. CAUTIs per 1,000 Foley days were recorded as 3.9
(range 1.3 - 7.5) in the U.S. and 8.9 (range 1.7 - 12.8) in the INICC countries (Rosenthal
et al., 2006). Despite the valiant battles fought by Semmelweis and Holmes, one study by
Kalata et al. (2013) reported a nosocomial infection rate of 17.8% in obstetrics and
gynecologic patients at a referral hospital in North West Ethiopia in 2013.
Because of the global impact of HAIs, the WHO created the World Alliance for
Patient Safety with reducing HAIs becoming the target for the Alliance First Global
Patient Safety Challenge, which was launched in October of 2005. By 2007, 72 ministries
of health had pledged their support to develop interventions to reduce HAIs. Of these first
72 countries, 30 were developing countries. By the end of 2008, the number of
participating developing countries had grown and represented more than three-quarters of
the world’s population (Allegranzi & Pittet, 2007; Pittet & Donaldson, 2005; Pittet et al.,
2008). Today there are 137 countries committed to addressing health care associated
infections. With Sierra Leone becoming the 137 country, greater than 93% of the world’s
population is now included in the “Clean Care is Safer Care” global campaign (WHO
webinar, May 05, 2015). For some countries, solving the problem of reducing HAIs also
means solving the problems of providing clean water and proper sanitation (WHO
webinar, May 05, 2015).

91
Pittet and Donaldson in 2005 and Lynch et al. in 2007 reported 1.4 million HAIs
were acquired each year with 90,000 to 98,000 deaths (AHRQ, 2011; Iowa Department
of Public Health, 2010; Korniewicz & El-Masri, 2010; Marchetti & Rossiter, 2013).
Using the CDC Multistate Point-Prevalence Survey of Health Care-Associated Infections
with 183 U.S. hospitals as the sample size, there were 721,800 nosocomial infections
occurring in 2011, with about 75,000 deaths as a result of these infections. Every day
approximately one patient out of every 25 had at least one HAI. Pneumonia and surgical
site infections were the most common HAI at 21.8% each. Urinary tract infections
accounted for 12.9% of the total number of HAIs, and primary bloodstream infections
were responsible for 9.9% of the infections (Magill et al., 2014). In order to understand
the magnitude of 721,800 HAIs acquired each year and 75,000 associated deaths,
imagine filling up each of 1,544 jumbo 747-81 jets with 467 patients (Davies, 2012) all
of whom have a HAI. The healthcare industry is then downing 161 jets with all 467
patients dying, or one plane going down every two days and six hours. Every day in our
hospitals, 1,975 patients have an HAI and 205 patients die as a result of an infection they
acquired in a hospital (Wachter, 2004).
Despite an increased knowledge of the transmission of organisms and multiple
studies showing the efficacy of increased hand hygiene in terms of patient safety and
costs, hand hygiene remains in the range of 40 - 60% worldwide (Erasmus, 2010); 34%
in a U.S./Canadian study (Korniewicz & El-Masri, 2010); 84% in a self reported study in
Belgium (DeWandel, Maes, Labeau, Vereecken, & Blot, 2010); 31% in a Canadian study
(Mertz et al., 2011); 25 - 60% adherence in a London study (FitzGerald, Moore, &

92
Wilson, 2013); 41% in Saudi Arabia (Mahfouz et al., 2013); 7.3% to 66.2% documented
in a study in India (Biswal et al, 2014); 63.8% in Turkey (Alp et al., 2014); Vietnam
overall rate of 47% with a range of 5 - 69% (Salmon, Tran, Bùi, Pittet, & McLaws,
2014a); a study in China reports an adherence rate of 81% (Su et al., 2015), in the United
States, Dai et al. (2015) report an overall compliance rate of 38%; in Finland, an overall
rate of 72% after intervention was reported (Jansson et al., 2016); Germany reported an
overall rate of 79.2% after intervention (Stock et al., 2016); and India reported a rate of
63% after intervention (Siddiqui, Srivastava, Aneeshamol, & Prakash, 2016).
Protecting patients from nosocomial infection does not appear to be a motivating
factor for adherence to hand hygiene since multiple studies show HHA to be higher after
patient contract than before, demonstrating a greater concern for protecting themselves
than their patients. Hand hygiene was carried out 12.8% before an activity and 25.6%
after an activity in a Spanish teaching hospital (Novoa, Pi-Sunyer, Sala, Molins, &
Castells, 2007). A study in Saudi Arabia yielded rates of 40.7% before patient contact
and 83.1% after patient contact (Mahfouz et al., 2013). Lee et al. (2011) quoted rates of
HHA before contact with a patient as 31% versus 46% after patient contact. Scheithauer
& Lemmen (2013) recorded rates of 21% before patient contact and 47% after patient
contact. It has also been shown that as the risk of the procedure increases, the rate of hand
hygiene decreases (Pittet et al., 2004b). HHA was 31.8% in situations in which there was
an intermediate risk of infection and 14% in the situations, which were considered high
risk (Novoa et al., 2007).

93
Healthcare workers may honestly believe they are immune and cannot be infected
or there is also the possibility that because the HCW is working in a very dangerous
environment, being exposed to such pathogens as Hepatitis B, Hepatitis C, HIV, plus a
number of multidrug resistant organisms, that this failure to participate in adherence is
the mind’s coping mechanism for denying the potential harm that exists on a daily basis.
There is also the explanation that as the HCW’s shift progresses, they simply become
tired due to the hard physical work of nursing, the mental strain and stress, and the
emotional toil on HCWs. As they become progressively more tired, the instinct to
prioritize takes over and the need to take care of patients supersedes their hand hygiene
participation (Dai et al., 2015). Also, many of the touch opportunities concerning patient
care are considered social behavior, such as patting a person’s arm or fluffing a pillow.
A huge problem for infection preventionists is that while it is relatively easy to
identify an HAI, it is difficult to impossible to prove that an HAI did not occur because of
an intervention such as hand hygiene. Likewise, it is almost impossible to tie an HAI to
an individual HCW because of the multiple people who interact with a patient each day.
This makes it easy for a HCW to evade the ownership of a possible infection to a patient:
“It could not have been me, it had to be the doctor, or the respiratory therapist, or the
chaplain, or anyone other than me”.
Part of the problem is to get HCW to take ownership of the infections that occur
within their hospital and to accept the possibility they may be the cause of an infection as
a result of their failure to participate in hand hygiene. Physicians in Semmelweis’s time
resented being told their hands were unclean. After all, these people were professionals

94
and did not labor with their hands as a farmer would, so their hands could not be dirty as
Semmelweis was implying. That same attitude of “You are not going to tell me what to
do” resonates today especially among physicians and ER personnel (S. L. Kurtz, personal
communications, 2011).
Despite the fact that HCWs are exposed to multiple diseases on a daily basis, over
and over their own experiences have shown they can care for these sick patients while not
wasting their time doing hand hygiene between patients, and still not become infected
themselves. So the threat to participate in hand hygiene or “you will come down with an
infection” carries a meaningless threat. With the exception of a few diseases, diseases are
not readily spread person to person. The transfer of organisms does not guarantee an
infection or disease process because of people’s own immune systems. Prolonged
multiple exposures are required. And if a patient does acquire an infection, because of the
multiplicity of HCWs taking care of the patient, plus family and visitors who have
touched this patient, a particular individual’s responsibility becomes diluted.
Another problem is the large number of hand hygiene opportunities presented
each hour to the HCW. The number of opportunities may average 60 times an hour
generating only a 40% average adherence with hand hygiene (WHO webinar, May 05,
2015). This presents the nurse with 720 hand hygiene opportunities per a 12-hour shift. If
the WHO 20-second recommended time is used for each opportunity, during each 12
hour shift, a total of four hours will be spent in hand hygiene.

95
Impact of HAIs in Relationship to Infection Rates
The first edict in healthcare is ‘primum non nocere’ or ‘first, do no harm’ (Gill,
2015: Sokol 2013). When the healthcare industry causes HAIs, harm is done, not only
morally and ethically in regards to patient safety, but economically as well. Costs
attributable to an HAI are due to an extended length of stay, more intensive care,
increased use of antibiotics, higher risk of readmission, prolonged recovery time, and an
increased mortality (Marchetti & Rossiter, 2013).
Using 2012 U.S. dollars, the total cost of the five major infections were $9.8
billion with the following breakdown of cost per case; VAP at $40,144 per case, CLABSI
at a cost of $45,814 per case, SSI at $20,785, C difficile at a cost of $11,285, and CAUTI
at $896 per case. SSIs were found to be the most common HAI at 36.0% followed by C
difficile at 30.3%, CAUTI at 17.4%, CLABSI at 9.2%, and VAP at 7.1% (Zimlichman et
al., 2013). Because of the reductions in Medicare and Medicaid reimbursement payments,
because of the reward- penalty aspects of the payment system today, hospitals have seen
operating margins shrink to 2.2% in 2013 (average operating margin for the 138 systems
in the S&Ps analysis) down from 2.9% in both 2012 and 2011 (Kutscher, 2014). During
2006 and 2007, hospitals were paid approximately 27% of what they billed (Pyrek,
2014). Starting in 2015, all hospitals would be grouped according to their HAIs. Under
the Healthcare Associated Conditions (HAC) Reduction Program (section 3008 of the
Affordable Care Act, 2005), hospitals in the lowest-performing quartile with regards to
the overall rate of certain HACs, would be penalized with a 1% reduction in their
payments as an incentive to decrease HACs (Conway, 2013). Hospitals are losing money

96
two ways with HAIs: reimbursement payments are less for the patient with the HAI and
because of the increased length of stay associated with the HAIs, new revenue cannot be
generated by another patient using the bed. These same problems are appearing not just
in the United States, but also worldwide.
In the United Kingdom, an estimated 5 – 10% of the patients in British and Irish
hospitals annually acquire a nosocomial infection with at least 5,000 contributable deaths
at a cost of £1 billion a year (Lynch et al., 2007) or U.S. $1,451,191 billion using an
exchange rate of 1.45191 per one US dollar (XE Currency Converter, assessed 06-03-
2016). A study by Zingg et al. (2015) reported that in the European Union, annually there
was an estimated 4,544,100 HAIs, leading to around 37,000 deaths, and 16 millions extra
days of hospital stay. The reduction of MRSA bacteremia was targeted as the first
national reduction programme in England and Wales in 2004 (Breathnach, 2013). The
original goal of decreasing MRSA CLABSI by 50% was a goal many considered
unobtainable, but has been surpassed and is now at 80% reduction with MRSA rates still
declining (Duerden, Fry, Johnson, & Wilcox, 2014; Stone et al., 2012b). Nosocomial
infections account for approximately 457 deaths a year in Scotland with HAIs
contributing to a further 1372 deaths. The financial burden is an estimated £186 million
(Stout, Ritchie, & Macpherson, 2007) or U.S.$290.16 million with the pound being
calculated as U.S.$1.56 (Market Watch, currency tools, May 12, 2015).
Approximately 25% to 33% of cases of nosocomial bacteremia arise from an
intravenous device (Davis, 2014). The following contribute to the development of a
CLABSI infection: a break in the skin is made allowing a portal of entry for bacteria,

97
biofilm development, the risk of infection is increased by having multiple ports and an
increasing length of time the line is in place, poor insertion technique, poor line care, not
cleaning the hub or port before accessing, and pre-existing colonization with MRSA
(Breathnach, 2013). Because of the high bacterial load in the groin, femoral lines have a
greater chance of infection than those placed in the jugular or subclavian area
(Breathnach, 2013).
A neglected component is the bacterial load on the skin of the patient. Patients in
ICU are unable to care for themselves and nurses are responsible for their body hygiene.
Years ago, it was expected that patients were to be bathed every day they were in the
hospital and their bed linens changed each day. This practice seemed to have gone by the
wayside several years ago and infection rates increased. Baths are again being instituted
using the chlorhexidine cloths to bath each patient instead of the traditional soap and
water in the basin as a measure to help reduce HAIs (S. L. Kurtz, personal experience,
2011). A recent study showed a significant reduction of HAIs in the intervention group
(29 vs 56, p = .01) that used the chlorhexidine daily bathing (Cassir et al., 2015). The
cleansing of the skin before insertion of an indwelling device has not been given the
importance it deserves. With the skin having a heavy bacterial load, bacteria are pushed
into the subcutaneous layers of the skin when a needle is inserted for a peripheral
intravenous line or a central line. The skin surface bacteria can completely re-
colonization within 18 hours of an antiseptic application, lending itself to the formation
of a biofilm (M. Ryder, PhD, lecture at APIC Dallas Chapter meeting, May 07, 2015).

98
In 2003, using the National Inpatient Sample, a study estimated that among adults
(18 years and older), there were 21.6 cases of CLABSIs per 1,000 admissions with an
estimated fatality rate of 20.6%. The weighted average length of stay for patients with a
CLABSI was 16.0 days compared to 7.5 days for patients without a CLABSI. The cost
associated with CLABSIs for 2003 was estimated to be $37.24 billion (2003 dollars) or
$110,183 billion in 2010 U.S. dollars (Al-Rawajfah et al, 2012). Being in ICU is a risk
factor associated with acquiring an HAI with approximately 30% of the patients in ICUs
being affected by at least one HAI (WHO, 2011, summary). In 2009, Stone commented
that HAIs were the fifth leading cause of death in U.S. acute-care hospitals with annual
hospital costs of HAIs to be between US $28 billion and $45 billion a year (Stone, 2009).
Length of stay was reported to have increased by 8.95 days for nosocomial
pneumonia in a study in Argentina in 2005, $996 as the mean extra antibiotic cost, $2,255
as the mean extra total cost, and an extra mortality of 3.3% (Rosenthal, Guzman, Migone,
& Safdar, 2005a). An extra length of stay of 3.30 days was reported from New Jersey in
2004 with an increased cost of $10,375 (Hassan, Tuckerman, Patrick, Kountz, & Kohn,
2010). Extra length of stay for patients in a study in China was 20.5 days for a patient
who developed a VAP, 15 days for patients with a CLABSI, and 27 extra days for a
patient who developed a CAUTI. The crude extra mortality rate was 22% for patients
with a VAP, 14% for patients who developed a CLABSI, and 43% for patients who
developed a CAUTI (Hu et al., 2013).
In a study from January 1, 2010 through June 30, 2012, HAIs were identified
from a retrospective cohort study using surveillance data from hospitals participating in

99
the Duke Infection Control Outreach Network. A total of 2,345 HAIs were identified:
38% SSIs, 26% CAUTIs, C difficile infection (CDI) at 22%, 12% CLABSIs, and 2%
VAPs (ventilator associated pneumonia). These HAIs would be reported as 1.1 VAP per
1,000 ventilator-days, 1.1 CLABSI per 1,000 central line days, and 1.6 CAUTI per 1,000
urinary catheter-days (Lewis, Moehring, Chen, Sexton, & Anderson, 2013). A study in
Mexico reported VAP rates as 21.8 per 1,000 ventilator days, CLABSI rate as 23.1 per
1,000 central line days, and the CAUTI rate as 13.4 per 1,000 Foley days (Barba et al.,
2005). A study published in 2014, compares HAI rates of 2012 data of NHSN and the
International Nosocomial Infection Control Consortium (INICC). NHSN or rates from
the United States showed VAPs as being 1.1 per 1,000 ventilator days (INICC rate 16.8
per 1,000 ventilator days); NHSN rate of CLABSI as 0.9 per 1,000 central line days
(INICC as 4.9 per 1,000 central line days); and NHSN rate of CAUTI as 1.3 per 1,000
Foley days (INICC rate of 5.5 per 1,000 Foley days) (Rosenthal et al., 2014).
A Swedish study concluded that patients with an HAI had a greater proportion of
readmissions (29.0%) than patients with no HAIs (16.5%). In looking at total bed days,
9.3% were considered to be excess days attributable to an HAI. This extra length of stay
comprised 11.4% of the total hospital costs. There was also a 1.75% increased mortality
for patients who had experienced an HAI (Rahmqvist et al., 2016).
Impact of Increasing Hand Hygiene in Relationship to Decreasing HAIs
Researchers have demonstrated through multiple studies that the most cost
effective way to reduce hospital HAIs is to increase hand hygiene (Allegranzi & Pittet,
2009; Al-Tawfig, Abed, Al-Yami, & Birrer, 2013; Mathur, 2011; Pittet et al., 2008; Thu
100
et al., 2015). If HHA rates can be increased and a hand hygiene program properly
implemented, hand hygiene alone is sufficient to significantly reduce the risk of cross
contamination in healthcare facilities and reduce the incidence of HAIs (Boyce & Pittet,
2002; Mathur, 2011; WHO guidelines, 2009). But historically HHA rates have been low,
ranging from 40-60% (Al-Tawfig et al, 2013; Dai et al., 2015; Erasmus et al., 2010;
Garcia-Vazquez et al, 2010; Korniewicz, & El-Masri, 2010; Mertz et al., 2011; Salama,
Jamal, Al-Mousa, Al-AbdulGhani, & Rotimi, 2013). There is also a huge disconnect
between the perceived rate of adherence by nurses and physicians and their actual
observed rate. In a study in India, the nurses perceived their rate to be 88% and the
physicians 85% while in actuality; their observed rates were 47% by nurses and 51% by
physicians (van Dalen, Gombert, Bhattacharya, & Datta, 2013). A 2013 study showed the
observed rate of adherence to be 23.2% and the self-reported rate to be 82.4%
(Eiamsitrakoon, Apisarnthanarak, Nuallaong, Khawcharoenporn, & Mundy, 2013).
Nonadherence has been shown to occur despite exposure to blood, urine, saliva, sweat,
and feces (Korniewicz & El-Masri, 2010). Studies being done in other countries reveal
that low adherence with hand hygiene is a problem in multiple countries around the
world: India, 52% (Taneja & Mishra, 2016); Ireland, 56.98% after intervention (Kingston
et al., 2016); U. S. Arkansas, 95% after intervention (Linam et al., 2016).
Methodology and Methods Consistent with the Scope of the Study
The method chosen to carry out this study was a quantitative, cross-sectional,
prospective, direct observational study with a convenience sample of ICU nurses
(Creswell, 2009). Descriptive analysis (presented as percentages) as well as multiple,

101
logistic regression and binary regression will be used for the analysis of the demographic
independent factors against the dependent factor of HHA. T-square and Chi-Square were
also used.
Studies reviewed used descriptive analysis with percentages including odds ratio
and p values, ratios, Chi Square contingency tests, and logistic regression. Rates were
expressed as the number of infections over 1,000 patient days or the number of infections
over 1,000 device days with a device meaning a ventilator, a central line, or a Foley
catheter. Surgical site infections are given as the number of infections over 100
procedures done and are reported as a true percentage. Direct observation was the most
common method of gathering hand hygiene surveillance data using either an overt or
covert method.
A direct observational study was appropriate in this study as the direct
observation of HCWs by trained personnel is considered by the WHO to be the gold
standard method of collecting information on HHA rates (WHO, Guidelines on Hand
Hygiene in Health Care, 2009). Direct observation is the only method currently available
which can provide information on the WHO’s My Five Moments for Hand Hygiene
model, evaluate if appropriate hand hygiene has been done, and determine adherence
rates before and after glove use (WHO, Guidelines on hand Hygiene in Health Care,
2009). In this study, hand hygiene rates were calculated only on patient room entry and
patient room exit. However, these two moments represented 87% of the five moments
(Sickbert-Bennett et al., 2016a). An overall compliance between the two methods showed

102
a similarity of 72% (room entry/exit) and 70% (My 5 Moments of Hand Hygiene)
(Sunkesula et al., 2015).
The 2002 CDC hand hygiene guidelines (Boyce & Pittet, 2002) plus the 2015
APIC hand hygiene program (Landers et al., 2015) for infection prevention recommend
monitoring of HCWs adherence, along with providing feedback to the personnel
regarding their performance. In the recent Self-Assessment Framework Global Survey
Summary Report, 59% of the reporting facilities measured HHA by direct observation
and hand sanitizer gel consumption was regularly monitored in 53% (WHO hand
hygiene, 2015). The WHO believes ‘My Five Moments of Hand Hygiene’ captures the
true adherence of hand hygiene, but many facilities choose to include only the entry and
exit of the nurse from a patient’s room in their surveillance monitoring. This facilitates
the observer not entering the patient’s room thus protecting the privacy of the patient
(Allegranzi, Conway, Larson, & Pittet, 2014).
The standard expectation and requirements of the majority of acute care hospitals
in the United States are that monitoring adherence will be done on a weekly or a monthly
bases and that the results will be routinely reported to infection control committees,
quality committees, administration, and to corporate administration (Larson, 2013). The
Joint Commission has established guidelines regarding the National Patient Safety Goals
(The Joint Commission, 2015) and since January 01, 2003 the primary monitoring system
being promoted has been room entry-room exit (Kendall, Landers, & Kirk, 2012). In a
study by Gould, Chudleigh, Drey, & Moralejo (2007), of the 21 articles reviewed, all but
two used the direct observational method for monitoring HHA.

103
One strength of the direct observation method is that it is the only way to monitor
My Five Moments of Hand Hygiene. For my study, it was the only way to collect
individual HHA rates that could be linked to each individual’s own demographic
information. It is possible that camera surveillance or a monitoring device could be used
if the data were collected specific to each individual nurse, but none of the participating
facilities used camera surveillance in the ICUs or used the new monitoring device
surveillance techniques.
There are several disadvantages of the direct observation study in monitoring
adherence. It is possible that while watching a busy ICU, nurses entering and exiting a
patient’s room may be missed, so 100% of the opportunities may not be captured, thus
affecting the true rate of adherence. Observer bias and the Hawthorne Effect are two
additional disadvantages (McGuckin & Govednik, 2015). This problem could be solved
by the use of monitor badges that count the number of successful opportunities and the
number of missed opportunities (Biovigil, 2013; Boyce, 2011; Mastrandrea, Soto-Aladro,
Brouqui, & Barrat, 2015; McGuckin & Govednik, 2015). However, these monitoring
systems are new to the market and are expensive so not many hospitals have adopted this
technology. A recent finding showed that only 23-56% of surveyed facilities were using
automated surveillance systems (Hebden, 2015). Additional ways to monitor HHA is by
the use of hand sanitizer or soap consumption (Gould et al., 2007). However, this method
will measure total consumption, which includes the use by visitors and family members
in addition to the HCW’s usage so accurate data of HCW or just of nurse usage is not

104
available. Another disadvantage of my study was that only the ICU nurses were
monitored so again the true adherence rate of the whole hospital was not captured.
Even if the observation were covert, there is a possibility of factors affecting the
observed rates of the HCWs such as the Hawthorne Effect, the training provided to the
observers, and the length of time of the observation period (Boyce, 2013). It has been
suggested that the Hawthorne Effect can be reduced by using multiple observers at
random varying times (Al-Tawfig et al., 2013). Gould et al. (2007) found that in half of
the articles reviewed, the Hawthorne Effect was acknowledged with some authors feeling
that because hand hygiene is such an ingrained inherent behavior, it is not possible for the
HCW to sustain any changes in their usual behavior throughout the observation period.
Adherence rates using both overt and covert observations are presented in several studies
(Almaguer-Leyva et al., 2014; Dai et al., 2015; Eckmanns, Bessert, Behnke, Gastmeier,
& Rüden, 2006; Kohli et al., 2009; Kovacs-Litman et al., 2016; Pan et al., 2013). This
observational effect was also evident in physicians’ adherence rates. In a study by Pittet
et al. (2004b), adherence rate for physicians aware of being observed was 61% and 44%
when they were not aware they were being observed.
The Hawthorne Effect was cited in many articles as influencing the observation
rates. Sickbert-Bennett et al. (2016a) comment that sampling bias might occur if the
location of the observation and the time of the observation were not selected at random.
They also commented that they believed that individuals behaved differently when they
were aware of being observed. Filho et al. (2014) felt that just the presence of another
person may impact behavior as did Gould, Chudleigh, Drey, & Moralejo (2007). Not

105
being an employee of the hospital and not recognized by the staff, my presence was
obviously noticeable. But being a fellow RN was a huge advantage, as I know how to
speak nurse. Being well versed in infection prevention and hand hygiene was also an
advantage as the staff was interested in my study and supportive of what I was doing. In a
study done in Australia, their methodology was to do 24-hour surveillance for 7 days.
They felt that since the daily rate of the 7 days was similar, the Hawthorne Effect did not
abate (Azim et al., 2016) but no criteria has been established to measure any effect from a
Hawthorne Effect.
Doing surveillance in which all nurses are observed for a short period may
perhaps alter their behavioral patterns, as it is easy to maintain an artificial behavior over
a short period of time. WHO reports a 45% HHA with overt observations and a 29%
HHA with covert observations (WHO, Guidelines on Hand Hygiene in Health Care,
Hand Hygiene as a performance indicator, 2009). Larson, Aiello, & Cimiotti (2004)
commented that it might be possible that a short observation period such as an hour’s
time done during the day shift, was perhaps not sufficient to represent the entire time
period being studied.
With hand hygiene being influenced by community from an early age (Whitby et
al., 2006; Wilson, Jacob, & Powell, 2011), it was felt that any modifications seen in the
hand hygiene rates at the beginning of the observation period would not be sustainable.
Consideration was also given to the low rates of adherence when nurses were aware they
were being observed. In the study by Eckmanns et al. (2006), the observation period was
announced to the ICU personnel in advance and information on what the observer would

106
monitor was provided. Observations were conducted for two hours daily during the
morning shift for a 10-day period. Even with the nurses being aware they were being
observed, their rate only reached 45% with overt observation from a 29% covert
observation rate. Knowledge of their being observed generated a raise of only 16
percentage points.
Because of the design nature of this study, it was impossible to do a covert study.
Flyers were sent to the ICU units to announce that a research study would be taking place
on the designated days, that this was a voluntary study, and that nurses would be asked to
participate. If agreement for participation was given, then their hand hygiene rates would
be collected during the scheduled data collection period. Many studies list the Hawthorne
Effect as a limitation. Some studies have shown there to be a difference between HHA
using overt and covert methodology and have used the difference in rates to declare a
Hawthorne Effect was present. Some studies reported in 2016 have suggested that
observers move their location after 10 minutes to avert a Hawthorne Effect (Chang et al.,
2016; Chen et al., 2013). In my study, because the nurse was asked to participate, because
he/she was asked to fill out a questionnaire, and the data collector was quite visible sitting
in the hallway, it was decided to tackle the Hawthorne Effect instead of just listing it as a
limitation.
For my study, an eight-hour observational period per day for three to five days
was used. The positive HHA rate for the average of the first two hours of each
observational period was compared to the average rate of the combined last six hours. If
the positive hand hygiene rate during the first two hours of observation were 20% higher

107
than the positive hygiene adherence rate for the last six hours, then the first two hours
were to be dropped and an additional two hours would be added to the end of the shift.
This method to my knowledge has not been used before and is based upon my
professional experience as an Infection Prevention Practitioner. This was done in an
effort to help alleviate any effects from a Hawthorne Effect. Please see chapter four for
the results.
Rationale for Selection of Variables
Other than age, gender, and professional title, little literature has been identified
that has studied demographic variables and hand hygiene. One article was found which
included age, gender, nursing tenure, occupation, ward type, state/territory, and hand
hygiene training attendance (Jimmieson et al., 2016). A second article was identified that
included the demographic variables of age, gender, marital status, educational level, years
of experience, unit of experience, and yearly income (Al-Hussami, Darawad, &
Almhairat, 2011). Ahmed, Memish, Allegranzi, & Pittet (2006) stressed the potential
importance of religion and how it has the potential to affect adherence rates but to date
they have done no studies on religion as a variable in regards to HHA. It is suspected a
large impact may be found from certain demographic factors such as ancestry
(race/ethnicity), spiritual affiliation (religion), areas of previous nursing practice, and if
the nurse is an agency nurse or a hospital employee. Although several of these variables
may not be open to intervention to increase adherence, it is important to understand if an
associations exists and what, if any, countermeasures can be used to increase adherence.
Wilson et al. (2011) comment that additional research to help discover variations in the

108
effectiveness of interventions based on gender, ethnicity, and environment would be
beneficial. But before the effect of an intervention can be measured, meaningful
interventions must be designed, and before meaningful interventions can be designed,
there must be an understanding of what influences adherence.
Previously Studied Demographic Variables
Multiple variables have been shown to influence hand hygiene rates. Morning
shift had lower HHA rates (de Almeida e Borges, Rocha, Nunes, & Filho, 2012; Alsubaie
et al., 2013; Duggan, Hensley, Khuder, Papadimos, & Jacobs, 2008; Silva et al., 2014).
Rosenthal et al. (2013) found that lower HHA rates were recorded in the morning and
afternoon shifts in comparison to the night shift. This may be contributed to the morning
shifts being filled with more activities. During morning shift, patients are having labs
drawn, baths are supposed to be given, dressing changes are scheduled, physician visits
are made, treatments given, x-rays and physical therapy are all planned. Also two meals
are served during this shift, which may mean getting patients ready for their meal and/or
feeding them if not ventilated. Also the once a day medications are usually given in the
morning. However, two studies showed the morning shift to be the most adherent with
hand hygiene being 78% and the night shift being the least adherent with 70% (Barahona-
Guzmán et al., 2014). The second study listed adherence for the morning shift as 48%,
the afternoon shift as 36%, and the evening shift as being 39% adherent (Medeiros et al.,
2015). In one study, a comparison of day and night shifts (08:00 to 20:00 hours and 20:00
to 08:00) identified a drop in HHA in doctors from 81% to 46%, nurses from 64% to
55%, and paramedical staff from 44% to 31% (Sahay, Panja, Ray, & Rao, 2016).

109
Seasonal differences were shown in a Brazilian study in which HHA was lower in
the first three months of the year. In Brazil, this was the summer vacation period and the
staff’s workload and the number of less well-trained personnel was higher. Untrained
residents begin in February (dos Santos et al., 2013), while in the United States residency
programs begin July 01. These figures casts doubt on whether the lower rates were due to
the season or to the increased workload.
Hand hygiene rates were also found to be better during the first part of the week
(Monday, Tuesday, and Wednesday) than the latter part of the week (Thursday and
Friday) (Duggan et al., 2008). Alsubaie et al. (2013) found no significant difference in the
HHA between the weekday and weekend shifts.
HHA rate comparisons between nurses and physicians have been studied many
times (dos Santos et al., 2013; Erasmus et al., 2010; Johnson et al., 2014; Lee et al., 2011;
Medeiros et al., 2015; Mertz et al., 2011; Moret, Tequi, & Lombrail 2004; Saint et al.,
2004b; Rosenthal et al., 2013; Sahay, Panja, Ray, & Rao, 2016). In each of the identified
studies, nurses’ HHA rates were higher than physicians in all studies except for two
studies. One study was done in Brazil with rates of 48% for nurses and 55% for
physicians (Medeiros et al., 2015). A second study showed an overall adherence rate for
physicians as 66.1% and for nurses as 60.7% (Sahay et al., 2016). Low adherence rates in
physicians is a worldwide problem making being a physician a risk factor for
nonadherence.
In looking at studies that compare hand hygiene rates among male and female
nurses, female nurses had higher adherence rates than male nurses (Mertz et al., 2011;

110
Pittet, 2001; van de Mortel, Bourke, McLoughlin, Nonu, & Reis, 2001). In a recent study,
however, the adherence rate among males was 49% compared to the female adherence
rate of 38% (Medeiros et al., 2015). Because this variable has been previously
investigated, this study was a confirmatory study for how gender affects HHA.
In four studies, researchers demonstrated a difference in adherence with age as a
variable. One study showed a difference in HHA in participants 41 years or older (Silva
et al., 2014). A second study found adherence to be 40.4% in the 21-30 year group and
65.1% in the 31-40 age group (Sharma et al., 2011). Pittet et al. (2004b) demonstrated a
difference in adherence rates among three age groups; in the 21-30 years group, there was
a 62.3% adherence rate; in the 31-40 year age group, there was a 56.9% adherence; and
in the > 41-50 years group, a 51.4% adherence. One study provided the mean age of staff
members as 30 years + 6.47 (Katherason et al., 2010).
Because age of the nurse can be deceptive in regards to the number of years of
practice, both age and number of years since graduation from nursing school were used
as variables. People are now entering nursing as a second career or because they have
raised their families and this is a career path that was denied them earlier in their lives. So
an older nurse may have been in practice for only a few months or for decades. Thus age,
plus the number of years since graduation, may yield more information about whether the
influence in HHA is from being an older person or whether it has to do with the number
of years of nursing practice.

111
Demographic Factors Not Previously Studied
Because the reasons for nonadherence have not been fully explained, it is hoped
that looking at the targeted demographic factors may contribute a small portion of
knowledge that will be helpful in suggesting further research to explore the motivation
for HCWs and eventually be helpful in designing sustainable interventions to increase
hand hygiene. Jumaa (2005) stated that in order to effect meaningful and sustainable
interventions, it would be necessary to make adjustments for different cultural and social
needs of the HCWs.
Although age, gender, and type of HCW have been studied previously, certain
demographic factors have not been investigated in their correlation to adherence. I have
not identified any studies in which the following variables were studied in conjunction
with HHA and it is in this area where an original contribution will be made. Factors being
investigated will be: (1) date of birth (age), (2) gender, (3) marital status, (4) number of
children, (5) family income, (6) year of graduation from nursing school, (7) number of
years of active nursing practice, (8) hospital employee or agency nurse, (9) areas of
previous nursing practice, (10) degree program (associate nursing degree, diploma
degree, BSN, masters of nursing or master in another field, PhD, DNP, (11) country in
which the nurse was born, (12) country from which nurse graduated nursing school, (13)
ancestry, (14) spiritual affiliation, (15) and number of years living in the United States.
An original contribution will also be made in that individual demographic information
will be matched to that nurse’s individual adherence rate.
An additional contribution was realized after data collection was completed. Only

112
one study was identified in which surveillance had been conducted for eight
continuous hours but this study was assessing the Hawthorne Effect by comparing direct
observation with an automated hand hygiene monitoring device (Hagel et al., 2015). The
usual observation period is for twenty minutes to half an hour. One-hour observation
periods have also been used (Fries et al., 2012; Larson, Aiello, & Cimiotti, 2004).
Although the design of this observation period was originally set up to collect the
sample size in the least amount of time, once observation was started, it was realized that
unique patterns were emerging not previously identified thus yielding an original
contribution. It is believed that these patterns cannot be identified if shorter observation
periods are used or if random nurses are observed. The methodology set up to investigate
any possible Hawthorne Effect was also an original contribution as this technique has not
been identified in literature.
By determining the association between age and hand hygiene, appropriate
interventions can be tailored for specific age groupings. It was felt more accurate
information could be obtained if date of birth rather than exact age was requested
(Forthofer, Lee, & Hernandez, 2007). Also by asking date of birth, current age could be
calculated. One study found that their results suggest that age and experience were
positively correlated with HHA. However, the hand hygiene rate used was a self-reported
rate of 63.8% rather than an observed rate (Al-Hussami, Darawad, & Almhairat, 2011).
If a certain age group shows a higher adherence, this group could be targeted
for use as peer champions or as role models. In 2008, the median age of RNs was 46
years of age (range <25 years to >75 years). Of registered nurses over 75 years, 25.1%
113
were still employed full time (The registered nurse population, 2010) representing a wide
range of ages, each with different teaching needs. Specific education may need to be
directed to younger or older nurses or to those nurses who have been in practice many
years or to nurses who have just graduated. If older nurses who have practiced for many
years have a low adherence, new teaching strategies may need to be designed to increase
adherence since they may have a jaded attitude from all of the prior interventional
strategies that have failed or not come to fruition. Interactive interventions may need to
be implemented for younger nurses in order to retain their attention span. Hand hygiene
posters were proven ineffective in increasing adherence (Rodak, 2013) and different
strategies need to be devised.
The variables of ancestry, country where the nurse was born, and country in
which nursing school was attended were collected to distinguish American Whites
from European Whites and American Blacks from African Blacks. If individual culture
rates can be identified, then cultures more at risk for low HHA can be targeted for
additional education. If the nurse is foreign borne and attended nursing school in a
country other than the United States, then the number of years they have been in the
United States may also affect their HHA rates. There may be a difference in hygiene
habits in their native country and in the United States, both in expectation and in actual
practice. The longer a person would be in the United States, the more influence would be
exerted on the habits of someone not native to the United States, due to the readily
available use of soap and water. The term ancestry was used instead of race/ethnicity
in an effort to defuse any negative sensitivity issues associated with the words of race

114
and ethnicity.
In a study using direct overt observation (Kurtz, unpublished thesis, 2011), I
recorded the HHA rates of the ICU nurses in a Dallas community, acute care, non-
teaching hospital. Although results from this thesis work did not reach statistical
significance due to the sample size being too small (n = 270), I believe the results were
clinically significant because a more accurate picture of what was actually happening
with HHA was provided. An overall rate of 50% may actually represent some people
who are being adherence 90-100% during their shift and others who are being adherent
10-20% during their shift. A rate of 50% is not adequately describing the risk patients are
being exposed to. A rate of 50% does not mean that HCWs are all doing hand hygiene
one out of two opportunities.
In my thesis work, the overall HHA rate was 43.33% for all HCWs, with nurses
47.31% adherent and physicians being 34.38% adherent. But the overall rate of the nurses
was misleading, as was the overall rate of 43.33% for all HCWs. When the rates were
calculated by culture of the nurse, a difference in rates emerged. Nurses categorized as
White had an adherence rate of 47.4%, Black nurses had a rate of 43.0%, Hispanic nurses
had a rate of 33.3%, and Asian nurses had a rate of 32.6% (Kurtz, unpublished thesis,
2011). It was hoped this doctoral study could help to confirm if this was an anomaly
found in the one hospital studied or if this was a common occurrence. Only two studies
were found which investigated how race affected hand hygiene. In one study that looked
at hand hygiene in public restrooms in a large university setting, no difference in rates
was shown (Monk-Turner et al., 2005). The second study, also at a large regional
115
university, showed adherence by White subjects to be 76% of the time and other race as
87% of the time (Edwards et al., 2002). Many times race/ethnicity has been left out of
healthcare studies because authors wished to avoid what they considered to be a sensitive
subject (Long, Bamba, Ling, & Shea, 2006).
Ancestry is an important variable to investigate because of the cultural norms and
physical barriers to hand hygiene found in many countries around the world. If rates of
adherence can be associated with culture, there may be an incentive for nursing schools
in those countries with low rates to enhance education concerning the importance of hand
hygiene thus driving social change. Infection prevention departments in hospitals might
be able to design interventional teaching directed at certain age groups, gender groups, or
cultural groups.
Because of the worldwide shortages of nurses (American Association of Colleges
of Nursing, 2014), countries that are financially able to do so are recruiting nurses from
other countries. Internationally educated nurses have been a part of the United States RN
workforce since the early 1900s. Prior to WWII, these nurses came primarily from
Canada and western European English-speaking countries. They are now being recruited
from the Caribbean, Asia, South America, and Africa as well as from Canada and
Europe. In 2008, the largest group of nurses from abroad was from the Philippines (50%)
followed by nurses from Canada (12%), India (9.6%), United Kingdom (6%), Korea
(2.6%), and 2.1% from Nigeria (The registered nurse population, 2010). Approximately
25% of internationally trained nurses live in California, with 10-12% each residing in
Florida, New York, or Texas (The registered nurse population, 2010).
116
It is traditionally held that nurses have equivalent training and that any patient
under their care will receive the same caring, compassionate nursing care. But it may be
argued that nurses are not receiving the same level of education in regards to hand
hygiene. If a future nurse grows up in a country where clean water and soap is not always
available, this child is not learning the same inherent hand hygiene habits as a child in a
country where clean water and sanitation is always available. If hospitals alter their
practice of hiring nurses from other countries, this may be construed as negative social
change and possibility discrimination, but it must be remember that by removing nurses
from the bedside who are poor in hand hygiene, it increases patient safety and this would
be positive social change. Hospitals may decide to invest the extra money spent on
traveling nurses into nursing scholarship programs within their own country with the
graduating nurse agreeing to work at the benefactor hospital for a certain number of years
in exchange for the hospital paying for their tuition (May, Bazzoli, & Gerland, 2006).
The year of graduation from nursing school and the number of years of nursing
practice will be combined to determine if hand hygiene rates are affected by age or by
number of years of practice. Since many nurses put their nursing careers on hold in order
to raise their children, the number of years since graduation may not equate to the number
of years of nursing practice. This investigation facilitated identifying if older or younger
nurses, those in longer or shorter practices were more adherent. Again, if one group over
another was found to be more adherent, these members could be targeted as peer
champions and those less adherent could be targeted for additional education. Katherason
117
et al. (2010) identified the mean post-graduation time to be five years, but this was not
tied to HHA rates.
It may be proposed that the more educated a nurse is, the more adherent with hand
hygiene they would be. There are three different nursing programs a person may attend in
order to qualify to write for their registered nurse license. A person may attain the
associate nursing degree, which requires two years of schooling. A diploma degree is a
program requiring three years and is mostly hospital, hands on learning. Diploma degrees
have seen a steady decline since the 1970s and only 3.1% of RNs who recently graduated
reported a diploma degree as initial nursing education (The registered nurse population,
2010). A bachelor degree in nursing may be earned with the first two years dedicated to
providing the same basic college education as all students and the last two years
dedicated to specializing in nursing. In 2008, 20.4% of the registered nurses (RNs)
working force were diploma trained, 45.4% were associate degreed, and 34.2% held a
BSN or bachelor of nursing (The registered nurse population, 2010). Based on the 2008
National Sample Survey of Registered Nurses, 49.9% of male nurses held a bachelor
degree or higher in nursing or in a nursing-related field and 62.2% of the males nurses
held a bachelor degree or higher in a non-nursing field. A bachelor degree or higher in a
nursing or nursing-related field was held by 50.3% of the female nurses and 55.1% held a
bachelor degree or higher in a non-nursing related field (The registered nurse population,
2010).
For the 2008 to 2010 time period, there was an estimated 2,824,641 RNs (U.S.
nursing workforce, 2013). In 2011, more than 24,000 masters degrees in nursing were
118
awarded and nearly 2,200 nursing doctoral degrees resulting in a 67% increase in
graduate degrees from 2007 to 2011 (The U.S. nursing workforce, 2013). As of May 22,
2015, there were 5,815 ICPs who held their certification in infection control/ prevention
(CIC). Of these CICs, 22 hold a MA (0.004%), 210 hold an MSN (0.036%), and 21 hold
their PhD [0.004%] (S. L. Nichols, Administrative Coordinator, CBIC, personal
communication, May 22, 2015). Currently, it is unknown how the educational level of
nurses affects their HHA rate. If adherence is low in a particular program, perhaps school
curriculum should be examined for ways to increase emphasis on hand hygiene.
Marital status and the number of children a nurse has may affect his/her HHA
rates but to date only one article was found. In a study using self reported hand hygiene
rates, marital status was not significant, with 68% of nurses reporting being married (Al-
Hussami et al., 2011). In 2008, nearly 74% of RNs workforce was married or in a
relationship with a domestic partner. Married nurses were twice as likely to have
dependent children living in their household as unmarried nurses (The registered nurse
population, 2010). If a nurse is a parent and responsible for teaching health habits to their
children both by example and by teaching, it is unknown if this increase in awareness to
hand hygiene for their children translates into a higher adherence rate by the nurse in the
hospital. It is also unknown if this increased nurturing might be transferred to their
patient and the desire to protect would generate an increased HHA. If good hand hygiene
sanitation can be taught to the children, an increase in their hand hygiene rates might
indication a future positive social change in the community or in the hospital. This effect
would not be seen until those children have grown, but once the cycle has commenced,

119
hand hygiene rates in the hospitals and in the communities should increase and be
sustained even without intervention, as hand hygiene has now become part of their
inherent behavior.
The variable of spiritual affiliation highlighting the importance of cleanliness is
demonstrated in the Christian consecration of the bread and wine, with the prior washing
of the priest’s hands or the sprinkling of water. In Islam, there is strict observation of
hand hygiene with freely running water at specified times of the day. The Jewish religion
observes hand hygiene upon waking in the morning. In the Hindu faith, there is a
harmonious association between hand hygiene as a mechanism to prevent the
transmission of disease and the fundamental value of non-injury to others (ahimsa) and
caring for their own well being or self-protection (daya) (Mishra et al., 2013; WHO,
Guidelines on Hand Hygiene in Health Care: First Global, 2009). In the Sikh culture,
hand hygiene is not only a holy act but is also an essential element of daily life (Mishra et
al, 2013). There are no specific indications regarding hand hygiene in the Buddhist faith
(Mishra et al., 2013). Cultural and religious factors may greatly influence both inherent
and elective hand hygiene practices (Mishra et al., 2013). With religious practices being a
part of the daily lives of many nurses, it is a natural transition to bring these practices into
the nursing work environment.
A discussion that culture and religious factors strongly influence adherence with
hand hygiene, both in the community and in the hospital setting, has been identified in
several articles (Allegranzi, Memish, Donaldson, & Pittet, 2009; Mahfouz et al., 2013;
Mishra et al., 2013; WHO 2009 Guidelines on Hand Hygiene in Heath Care, 2009). The

120
WHO Task Force on Religious and Cultural Aspects of Hand Hygiene was created to
explore potential impact of religion and culture on the attitudes of HCWs in regards to
HHA (WHO Guidelines on Hand Hygiene in Health Care: First Global, 2009). Religion
is the variable that has been mentioned in literature by prominent investigators in HHA as
having a suspected influence, but no study was found that has investigated this
correlation. There may be an effect on hand hygiene by some religions because of the
required practice of hand hygiene during certain times of the day (Ahmed et al., 2006).
Some religious practices may generate higher HHA rates than others. Looking at the
variable religion regarding HHA rates will help to fill a knowledge gap currently existing
but it may be the one variable that while it fills a knowledge deficit, that knowledge itself
may not lead to social change. It would be unethical for interventions to be initiated in
which the goal was to switch a HCW from a faith of low HHA to a faith of high
adherence. It would be hoped that if certain religions were identified as being low in
adherence, the religion itself would try and influence their members to be more aware of
the importance of hand hygiene. There is also the possibility that a difference may exit in
the religious versus nonreligious HCW but again while this knowledge is interesting, it
may not move social change except to increase knowledge of variables that influence
hand hygiene rates. The term religious preference was switched to spiritual affiliation to
help defuse any negative sensitivity issues regarding the word religion.
The total gross family income (family social economic status) of a nurse may be
influenced by the income of the spouse, placing him/her into a higher social economic
bracket than self achieved. How this variable will affect the HHA of the nurse was
121
unknown at this time. The study by Al-Hussami et al. (2011) found no statistical
significance between yearly income and HHA. Among full-time staff nurses, 33.8%
reported an annual household income of at least $100,000. RNs in managerial and
administrative positions tended to report higher income with 54.9% reporting incomes of
$100,000 or more (The registered nurse population, 2010). However, there may be an
indirect effect with hand hygiene. If higher income is made, the neighborhood where the
nurse lives may be upgraded, exercise facilities may now be affordable, and more fruits
and vegetables may be purchased. If a person is able to afford all of these things,
contributing to enhancing the self-esteem of the person he/she may now be more
interested in his/her appearance and acknowledge the importance of hand hygiene as a
way to be healthier and enhance personal hygiene. It might be presumed that a higher
family income would contribute to higher hand hygiene rates because soap or hand
disinfectant could be purchased for the home, affecting higher adherence by all members
of the family who then interact with their community creating a healthier community
environment.
Areas of previous nursing practice may be an important predictor of future HHA.
HHA rates vary according to hospital department (Alsubaie et al., 2013; Barahona-
Guzmán et al., 2014; de Almeida e Borges et al., 2012; National Data Period Two, 2015;
Pittet et al., 2000; Scheithauer et al., 2011; Scheithauer et al., 2013; Shah & Singhal,
2013). If working in an area where hand hygiene is traditionally low such as an ER
(McGuckin, Waterman, & Govednik, 2009; National Data Period Two, 2015), those
habits will be brought forward to an ICU unit if the nurse transfers. ICU directors can use

122
this awareness to monitor new nurses transferring into their unit. It may also help to
explain why ICU HHA rates are low despite the increased need for greater adherence due
to the higher acuity of the patients and the increased number of invasive device lines.
Because of the nursing shortage, hospitals many times use agency nurses to fill in
gaps in staffing as a short-term solution. However, many hospitals are reducing their
reliance on agency nurses due to the increased cost and quality concerns (May, Bazzoli,
& Gerland, 2006; Zingg et al., 2015). There is a long standing assumption among hospital
nurses that agency nurses do not follow policy as well as nurses employed by the hospital
or that they care for their patients with the same level of intensity as hospital employed
nurses. However, I found no studies to support or disprove this perception. If it can be
shown that agency nurses are not as adherent as hospital employees in HHA, human
resources may favor the hiring of more nurse employees or establishing an internal nurse
pool rather than bringing in agency nurses which are more expensive. Agency nurses
typically can earn $5,000 more per year than the average hospital based nurse, making
more in two 12-hour shifts than a hospital employed nurse can earn in one week (Agency
nursing, 2013). If less agency nurses were used because of poor hand hygiene habits, then
positive social change would come about through increased patient safety and decreased
HAIs.
Positive social change will be generated from a domino effect. If reasons for
nonadherence with hand hygiene can be identified, then sustainable, effective
interventions can be designed which will increase adherence rates. This increase in hand
hygiene will bring about a reduction of HAIs. This will benefit the patients because of a

123
reduction in the length of stay, a reduction in the amount of antibiotics given for
treatment, and a reduction in mortality, which will generate a reduction in the financial
burden of HAIs. Because more patients will be discharged back into the community free
of a HAI, the community to which the patient returns will be a healthier community.
Nurses return to their community having higher adherence rates, which helps to prevent
the spread of communicable diseases such as influenza, C difficile, Ebola, chickenpox,
the common cold, conjunctivitis or pink eye, hepatitis A, hepatitis B, herpes simplex,
measles, mononucleosis, Fifth disease, pertussis, and Neisseria meningitides (Delaware
Health and Social Services, 2011).
Whitby et al. (2006) contend that the predominant driver of all handwashing, both
inherent and elective, is the transition of community hand hygiene behavior to the
healthcare setting. McLaws et al. (2012) found that community-based hand hygiene
behavior had the strongest influence on hospital-based behavior. Therefore, any
educational interventions in the community in regards to hand hygiene will affect nurses
as well as the average citizen. Not only should there be a reduction seen in the
community illness rates but also in the nosocomial infection rates in the hospital. Because
of a reduction of infection in the community, there should be a corresponding increase in
productivity in business because of the decrease in sick days and an increase in school
attendance. Increasing hand hygiene in the community and hence increasing hand
hygiene in the hospital setting should realize a positive social change through enhanced
patient safety, reductions in costs to hospitals (Dick et al., 2015; Pyrek, 2014), a healthier
community, and reducing microbial resistance generated by an overuse of antibiotics.

124
Investigation of how these variables affect social change will have an indirect
effect on increasing HHA in nurses because special targeted interventions can be aimed
at the nurses. By increasing adherence, a positive social change will increase patient
safety and just as the community hand hygiene rates influence the nurses (Whitby et al,
2006), so there will now be a backflow in which the nurse influences the community,
their family, and their friends in regards to increasing their HHA rates. HAIs in
developing countries are 3-4 times higher than in developed countries (Rosenthal et al.,
2006) so it may be surmised hand hygiene rates in developing countries are lower than
average. But when HHA rates are increased though adequate training, there is a
corresponding decrease in the number of nosocomial infections (Rosenthal, Guzman, &
Sadfar, 2005). If there is a difference in hand hygiene rates by culture, then interventional
education can be directed at these groups.
This study also provided a benefit in that this was the first time an individual
nurse’s demographic variables were tied to his/her own HHA rate. Previously only
aggregated data had been used with hand hygiene rates and this had been tied to
aggregated variable results. Of the 15 demographic factors being investigated, only age,
gender, years of experience, and yearly income have been investigated previously but
were linked to aggregate rates.
Positive Social Change
Examining the relationship between hand hygiene and demographic variables that
had previously not been researched will help to fill the knowledge gap that currently
exists. However, in looking at these 15 variables, there was more social significance

125
attached than positive social change on a large scale. There was the potential impact of
influencing hiring practices at hospitals, changing nursing curriculum in nursing schools,
and changing teaching techniques by the infection prevention departments to target
certain groups of nurses who may have low adherence rates. Because there will be a
better understanding of what is happening in the hospital as far as certain demographic
variables, there will be a better understanding of what is happening in the community as
well. This should aid the health departments as well in targeting their interventions to
certain age groups or certain cultural groups.
By adding to the knowledge base of variables that may or may not affect hand
hygiene, it leads to positive social change implication because it alerts other investigators
to include or bypass looking at these variables a second time. It may also be helpful for
program developers and educators in the development of their interventions and
approaches to their target population.
With 2,824,641 licensed registered nurses in the United States (2008 to 2010) and
84.8% being employed in a nursing position as of March 2008 (The Registered Nurse
Population, 2008; U.S. nursing workforce, 2013), the population to be affected by
knowledge of hand hygiene is large. The implications for social change from this
research study may be small with social change being affected more on an individual
basis than as a huge communal change. There may be more of a ripple effect from the
knowledge gained from this study than a large direct impact. Each of the variables
investigated have their own individual potential for positive social change, some more so
than others.
126
An unexpected contribution to social change was the knowledge gained during
the hand hygiene surveillance of this study. Because of the prolonged surveillance period,
certain patterns and observations were made that could not be made with a shorter
observation period. It is hoped that this knowledge will help the infection control
practitioner in the hospitals to make recommendations to increase hand hygiene rates.
Making nurses aware of their behavior in regards to hand hygiene may help them to alter
behavior. Reports on the individual hospital’s hand hygiene surveillance results were
given to each of the ICUs where data was collected but data collected from other ICUs
was not shared.
It was hoped that any knowledge gained would help to increase the safety
environment of the patient and that of the HCWs by reducing HAIs. This would help to
reduce the direct and indirect financial burden on hospitals. If hospitals have more money
in their budget, then additional equipment and products can be purchased also increasing
patient and HCW safety.
What is Controversial
One controversy found was a difference in whether high-risk procedures give rise
to a higher or lower rate of adherence. Korniewicz & El-Masri (2010) found that hand
hygiene was higher in high-risk procedures and when HCWs were exposed to blood but
that being female and exposure to sweat lead to lower adherence. Pittet et al. (2004b)
reported that as the risk of the procedure increased, the rate of hand hygiene decreased.
Novoa et al. (2007) also showed there to be 31.8% adherence in situations with
intermediate risk of infection and 14% in situations considered to be high risk.
127
A second controversy was Pittet et al. (2004b) showing a gradual decline in hand
hygiene as age increased while another study found that nurses older than 41 years of age
had a higher percentage (66.7%) of adherence at appropriate times (Silva et al., 2014).
These differences in rates can be explained by different HCW populations in
different locations. Each hospital has its own culture and adherence to policy tolerance.
Pittet and other researchers have used the Geneva Hospital in Switzerland repeatedly over
many years so personnel there are familiar with being observed and with interventions
being made to increase HHA.
In actuality, there are no big controversies found in hand hygiene with one
researcher advocating one method of increasing adherence while another adamantly touts
the benefits of another and the twain shall not meet. The infection prevention community
is a very close-knit cooperative group and the lack of controversy in research is a
reflection of this. In looking at the authorship of articles on hand hygiene, many of the
researchers co-author each other’s articles so one gets a sense of teamwork toward the
same goal. Each ICP remembers the help he/she received when first starting in the field
and feels obligated to pass on any learned lessons, policies, guidelines, or advice to a
newbie. Guidelines and ideas are freely shared to create better patient care. Everyone
(ICPs and researchers) participates in the goal of increasing hand hygiene in order to
decrease HAIs, creating a joint benefit. ICPs utilize what the researchers find and the
researchers use the information gathered by the ICPs. It truly is a synergistic relationship.

128
What Remains to be Studied
What remains to be investigated are studies in which additional specific
independent variables can be identified with interventions designed to determine how
these variables are associated with hand hygiene and how effective the interventions are
in driving adherence. Allegranzi & Pittet (2009) comment that the efficacy of each
strategy component needs to be evaluated with the most successful interventions made
know. Studies, which increase administrative support of the ICP and the infection control
program, need to be identified. Additional studies are needed in which reasons for
nonadherence by physicians can be identified. It is felt that motivational factors for
increasing hand hygiene in physicians will be much different than motivational factors to
increase hand hygiene in nurses.
Major Themes in the Literature
Major themes appearing in the literature are low HHA rates around the world,
HAI rates can be lowered by increasing hand hygiene, and the high cost of HAIs not only
in terms of financial reimbursement to the hospitals but also in terms of patient safety.
There is a great deal of research being conducted in regards to why HCWs are not
adherent. Qualitative behavioral studies concerning hand hygiene are beginning to
appear. Instead of using the autocratic method that Semmelweis used of dictating hand
hygiene behavior to his colleagues, researchers are involving the HCW to determine why
they are not adherent and how to generate interventions to help move them to changing
behavior towards 100% adherence. Theoretical approaches to the improvement of hand
hygiene are also beginning to appear in literature.

129
What is known in the discipline of hand hygiene is that adherence rates
worldwide are low and that HAIs are directly affected by HHA rates. What is unknown
are those behavioral triggers that cause the physical act of hand hygiene to become an
inherent sustainable behavior that drives 100% adherence.
Also unknown is the affect individual demographic factors have on individual
adherence rates. Multiple studies exist about the affect gender has on hand hygiene, both
in the hospital (Pittet, 2001; van de Mortel et al., 2001) and in the community with rates
recorded lower for males than for females. However, demographic variables have not
been matched to gender. This study helped to show if culture was associated with
adherence rates of males more than females or vice versa? It was beneficial to identify if
marital status and having children were associated with male nurses more so than female
nurses or vice versa.
Although age as a variable has been found in several articles (Pittet et al., 2004b;
Sharma et al., 2011; Silva et al., 2014), it was not tied to individual adherence rates, nor
were age groups past 50 investigated. There is a broad range of ages of nurses now
practicing who likewise have a broad range of years of nursing practice. This certainly
brings a challenge to educational interventions as many interventions have proven to be
unsuccessful, such as poster display (Rodak, 2013).
If the problem of increasing hand hygiene can be solved, then the problems of HAI rates,
cost, and mortality become solved as well. Reasons for nonadherence in regards to risk
factors and barriers have been investigated extensively. Discovery that physician
nonadherence has different motivational drivers than nurses is beginning to appear in the

130
literature. Effects of overt and covert observational studies have been presented in
multiple studies. Understanding hand hygiene in the HCW has become a worldwide
phenomenon with researchers such as Didier Pittet, Benedetta Allegranzi, John Boyce,
Stephanie Hugonnet, Elaine Larson, Marie-Louise McLaws, Hugo Sax, Victor Rosenthal,
Simone Scheithauer, Patricia Stone, and Robert Haley conducing multiple studies on
hand hygiene over many years, all working in unison toward the goal of better HHA.
In Chapter 3, the methodology of this novel study was explored with explanations
as to how the demographic variables were to be matched to the individual nurses plus
coding used for confidentiality. Direct observation was performed at four hospitals using
five ICUs (both ICUs in one hospital were observed) with adherence recorded for entry
and exit of patient rooms by the participating ICU nurses. A questionnaire about
individual demographics was designed along with an informed consent form for the
nurses. The Statistical Package for the Social Sciences (SPSS) was used as the data
collection and analysis tool. In Chapter 3 the research design, the target population, the
sampling strategy, procedures to be followed for recruitment of participants, the data
collection questionnaire, the consent form for the nurses, and a plan for data collection
was discussed.
131
Chapter 3: Research Method
Introduction
The purpose of this study was to investigate if an association exists between 15
demographic independent variables of the ICU nurses and the dependent variable of
HHA in the same ICU nurses of four hospitals (five ICUs were studied).
The major sections to be included in Chapter 3 are the introduction, the research
design and rational, the population to be studied, sampling and sampling procedures,
procedures for recruitment, procedures for participation, procedures for data collection,
procedures for coding, instrumentation, operationalization of constructs,
operationalization of each of the variables, the data analysis plan, threats to validity,
ethical procedures, and a summary.
Research Design and Rationale
The independent or predictor demographic variables to be researched were the
following: (1) date of birth (age), (2) gender, (3) marital status, (4) number of children,
(5) family income, (6) year of graduation from nursing school, (7) number of years of
active nursing practice, (8) hospital employee or agency nurse, (9) areas of previous
nursing practice, (10) degree program (associate nursing degree, diploma degree, BSN,
masters of nursing or master in another field, PhD, DNP, (11) country in which the nurse
was born, (12) country from which nurse graduated nursing school, (13) ancestry, (14)
spiritual affiliation, (15) and number of years living in the United States
The dependent or outcome variable was adherence to hand hygiene. Hand hygiene is
defined as using the alcohol hand sanitizer or washing the hands with soap and water

132
upon entry and exit of a patient’s room. Because there is supposed to be 100% adherence
to hand hygiene regardless of the workload, whether it is day or night shift, or regardless
of the day of the week, none of these will be used as a covariate.
A variable is said to function as a mediator when it reduces the size and/or
direction of the relationship between the independent variable and the dependent variable
and is statistically associated with both (Field, 2013). Mediators explain the how and why
such effects take place (Neuendorf, n.d.; Polit & Beck, 2012). Mediators in this study
were the country where the nurse was borne and the country where they attended nursing
school as these two variables could influence their inherent hand hygiene habits they
learned as a child and are bringing forward to their nursing practice.
Moderator variables affect the direction and strength of the relationship between
the independent and dependent variable and functions as a third variable (Field, 2013;
Mediator versus moderator variables, 1999; Neuendorf, n.d.). Moderators to this study in
some ways could be considered all of the independent variables because age, gender, the
country where a person was borne, the country where they attended nursing school, and
the number of years of nursing practice could all be interacting on each other and on a
nurse’s inherent plus his/her learned or elective HHA practices.
There is the possibility that multiple moderators are all influencing the hand
hygiene rate of HCWs. Possible moderators might be workload, placement of sinks or gel
dispensers, and hospital culture. However, investigating these moderators is beyond the
scope of this study but should be considered as future research topics.

133
Attitude of the administration may be a silent and powerful contributing
moderator toward infection prevention practices and will set the cultural tone of the
hospital as to whether hand hygiene and patient safety is an active or a passive culture.
Employees are acutely aware of the existing culture and adherence rates seek the level
that is tolerated. There needs to be not only a culture of safety, but also a culture of
accountability (Greising, 2010). Many hospitals fail to take a strong stand against making
HCWs accountable for their actions. One standard of behavior exists for the physicians
and one standard exists for the rest of the staff as is evidenced by the differences in hand
hygiene rates between physicians and nurses. Many administrations fear offending
physicians who bring in large revenues to the hospital (Terry, 2010) and who threaten to
move their practice to another hospital if they are not given special privileges (Berenson,
Ginsburg, & May, 2007). Interventions to increase HHA and letters to physicians who are
nonadherent are ineffective if top management, including the CEO and the board of
directors, are not fully supporting a patient safety culture (Terry, 2010). This potential
moderator will not be investigated in this study since what is being sought is the
association between the demographic variables and HHA, not the reasons for low
compliance of physicians within a particular hospital or the amount of administrative
support.
The research design for this study was a quantitative, cross-sectional, prospective,
direct observational study with a convenience sample of ICU nurses (Creswell, 2009).
Because the design of this study was for the demographic variables of individual nurses
to be linked to their individual HHA, it was necessary to do a direct observational study

134
in order to establish individual rates. Because an explanation of the study and filling out
of the demographic variable questionnaire had to be done prior to the study, it was not
possible to do a covert blinded observational study. The objective of this study was to
investigate demographic factors associated with HHA and not to increase hand hygiene
rates; therefore, no intervention was initiated during this study. Since there was no
intervention involved, the requirements for randomization were not pertinent. However,
randomization was done in the mix of the nurses working in ICU during the observation
periods (Machin & Campbell, 2005). A descriptive analysis of the aggregate rates of
adherence was presented as percentages for the combined data of the five ICUs. Multiple,
logistic regression, and binary logistic regression was used in the data analysis. The
research questions seek to identify if there was an association between the 15
demographic variables and the dependent variable of HHA. The only way to identify if a
particular nurse had participated in HHA was to do direct observation, which is
considered to be the gold standard of observation by the WHO (WHO Guidelines on
Hand Hygiene in Health Care, 2009). Therefore, in order to answer the research
questions, it was necessary to conduct this study with this particular design.
The only time constraint identified with this study was the observational period of
4 days. In order to try and eliminate effects of the Hawthorne Effect, if the positive hand
hygiene rates during the average of the first 2 hours of observation were 20% higher than
the positive hygiene adherence rates for the average of the last 6 hours, then the first 2
hours would be dropped and an additional 2 hours of observation would be added to the

135
end of the shift. This would allow for an hourly comparison of hand hygiene rates for the
days during the observation periods.
One study was identified in which the first 2 hours of observation was compared
to the last six hours of observation. But in this study, the HHA rate between direct
observation and an automated hand hygiene monitoring device was the goal (Hagel et al.,
2015). No percentage point was set as a cutoff for measuring the rates of the first 2 hours
against the rate of the last 6 hours. Using this method, they concluded there was a marked
influence of the Hawthorne Effect (Hagel et al., 2015).
Resource constraints were monetary in that it was not economically possible to
hire an additional person to do observations at the same time or to hire observers to do all
five ICU sites at the same time. Since I will be responsible for all travel expense, printing
of all forms (questionnaires and consent forms) for presentation to the nurses, and all
medical expenses to satisfy hospital requirements for immunizations, out of pocket
expenses had to be closely monitored. Constraints may also be identified as the lack of
available help from the ICP other than to help me get the study approved. Because of
their overwhelming workload, having the ICPs help me with the observation periods was
not realistic.
This research design was consistent with research designs being described in
published literature on HHA rates with the exception of the length of the surveillance
period for gathering the hand hygiene rates. In most hospitals, doing direct observation is
the only method available to measure the HHA rate. In some hospitals, the use of a

136
product such as soap or alcohol sanitizing gel is measured as a gauge of how much hand
hygiene is being done and correlates the usage amount to the hand hygiene utilization rate
(McGuckin, Waterman, & Govednik, 2009). This method however, records not only the
adherence by nurses, but also by physicians, visitors, family members, and other HCWs
in the hospital. The five moments of hand hygiene by the WHO cannot be recorded using
product utilization rates.
Products are beginning to be available in which individual nurse’s adherence can
be recorded every time the nurse enters or exits a patient’s room (McGuckin &
Govednik, 2015). A badge worn by the nurse is activated upon entry or exit from a
patient’s room. A light flashes red until the nurse places his/her hand up to the badge and
the alcohol on the hand is detected. The light will then flash green alerting the patient and
the rest of the staff that this nurse has been adherent. When the nurse passes a computer,
the information on the badge is automatically downloaded to the computer (McGuckin &
Govednik, 2015). This data can then be retrieved and a record of the successful and failed
hand hygiene opportunities can be calculated and reported back to the nurse, the unit, and
administration (Biovigil, 2013). However, with the high cost associated with this type of
product, the badges are being used in only a few hospitals. It was reported in a recent
study that only 23-56% of the surveyed facilities use automated surveillance systems
(Hebden, 2015). None of the hospital data collection sites used this technology or had
surveillance cameras in their ICUs.

137
Methodology: Population
Total population will be the 3,129,452 registered nurses (RN) in the United States
(The Registered Nurse Population, 2010; U.S. nursing workforce, 2013; State health
facts, 2015; State health facts, 2016) with a subpopulation of Texas RNs of 233,763 as of
April 2016 (State health facts, 2016), up from 219,701as of March 2015 (State health
facts, 2015). A further subpopulation is a Texas county with a RN population of about
22,500 plus a county in another part of the state with a nursing population of less than
5,000 (Texas DSHS, 2014).
The hospital data collection sites were four hospitals located in Texas with a
combined licensed bed count of 1,575 with approximately 140 ICU beds. The target
population of this study was the ICU nurses in each of the four data collection hospitals
(5 ICUs). Since only nurses on the day shift were asked to participate, there were
approximately 175 eligible participants. The actual number of nurses working on the days
of observations was less than the total number of nurses employed by the ICUs as some
nurses were on leave, absent due to illness, or the observation days were their normal
days off.
Three hospitals used their own IRBs as the IRB of Record and letters of
cooperation were not required. The Walden IRB and the legal department of the fourth
site hospital worked out a letter of agreement. One hospital in California and one hospital
in Texas withdrew as data collection sites during the IRB process. Multiple sites were
selected so that when data was aggregated, no individual hospital could be identified as
being the hospital investigated or have their hand hygiene rates exposed.

138
Sampling and Sampling Procedures
The sampling technique used in this study was a convenience sample both for the
hospitals selected for data collection and for the nurse participants. The sampling strategy
was to identify hospitals willing to allow data collection in their ICU. Being a member of
the infection control/prevention community in Dallas facilitated my approaching ICPs
from multiple hospitals during APIC meetings. The ICPs of the hospitals were
approached first because (a) they are interested in learning about their hand hygiene rates,
(b) they are frequently high achievers in their hospitals and get projects accomplished,
and (c) it provided an inside person working on my behalf to gain approval. Seven ICPs
expressed interest and were willing to work toward approval. Two hospitals were from
this group. The ICP of a third hospital and I have been personal friends since 2004. I had
spoken to her about my study and she expressed interest so we began a formal process of
gaining approval from this hospital. I sent each of the ICPs an initial packet of
information, which consisted of a letter of introduction, my prospectus, my curriculum
vitae, and a letter of cooperation. Each of the ICPs passed this information packet to their
supervisor or to their chief nursing officer (CNO).
At Hospital A, my study request was passed from the ICP to the nursing educator
who coordinated the necessary steps for approval. Requirements for approval included
sending immunization records for Hepatitis B, MMR (measles, mumps, and rubella),
Varicella, Tdap (tetanus, diphtheria, and pertussis), having a drug screen, having a
current PPD (skin test for tuberculosis), having a current flu vaccination, and having a
background check. Titers were required for Hepatitis B, MMR, and Varicella. An

139
orientation session was also required. Notification was sent by the nursing educator that
final approval of the study had been granted. However, before the Walden IRB approval,
the ICP of the hospital left and a new CNO was named. The new CNO decided not to
continue being a data collection site and withdrew approval.
At Hospital B, the initial packet of information was sent followed up with a
personal presentation made to the Infection Prevention Department. A request for HIPAA
Waiver of Authorization through their IRB was filled out and sent to Hospital B’s
director of clinical research institute. Hospital B also required certification for the
National Institute of Health (NIH) training program Protecting Human Research
Participants as well as approval from their internal IRB. The letter of informed consent
and the demographic questionnaire were then sent to Hospital B for review. Contact
information was provided to the Walden’s Office of Research Ethics and Compliance, to
see if an amiable solution can be worked out regarding a letter of waiver and IRB
justification. A letter of cooperation was signed and IRB approval from the hospital’s
IRB was received. Walden’s approval number: 03-09-16-0327877
After initial contact with the ICP at Hospital C, an information packet was sent.
This was passed by the ICP to her boss, the CNO, who presented the initial packet of
information to the vice president of research and development who took over the
approval process. Contact information for hospital C was also provided to the Research
Ethics Support Specialist at Walden University in regards of approval. Presentation was
made to the hospital’s IRB committee, which granted approval. Immunization
information was then submitted to the educational department and a background check

140
was done. Approval of the study was granted by the Walden IRB with approval number
03-09-16-0327877.
The initial information packet was sent to the ICP at Hospital D. She forwarded
the packet to her CNO who gave approval. The following forms were filled out and sent
back to Hospital D: Clinical Education Observation Agreement; Observer Code of
Conduct; Reporting of Child, Elder, and Dependent Adult Abuse Acknowledge Form;
Observer Health Clearance Form; Annual TB Clearance Questionnaire; and Business
Associate Agreement. These forms, plus the original information packet, were then sent
to the hospital’s legal department for review. The ICP sent me an email stating that legal
had approved the usage of their facility as a data collection site. The CEO of their facility
signed their Letter of Cooperation on the same day. However, the ICP of this hospital left
for another position before IRB approval and the hospital decided to withdraw their
participation as a data collection site.
Hospitals E and F were added to replace the withdrawn sites. The ICPs of each
hospital, the directors of the ICUs, and the CNOs were contacted to see if there was any
objection in their hospital becoming a data collection site. Each of these hospitals had
their own IRBs who approved the study. Walden University’s IRB approved study with
number 03-09-16-0327877.
The nurses used in this convenience sample were the nurses who worked in the
ICUs of these four hospitals. Nurses were recruited when they listened to the explanation
of the study and agreed to be participants in the study.
141
The specific procedures for how the sample was drawn was that all of the nurses
working in the ICU of the designated data collection sites were eligible to be included in
the study, unless they opted out per their request or by not filling out the questionnaire.
There was somewhat of a randomization of the nurses based on which nurses were
scheduled to work on the days selected for the observation period. Due to scheduling, it
was possible that a particular nurse was observed every day during the total observation
period or he/she were observed one, two, or three days. Observations were made during
four, 8 to 10 hour shifts during 7:00am and 3:30pm. I chose to observe only the day shift
because (a) there are more nurses available to observe during the day shift, (b) it
facilitated more hand hygiene opportunities per nurse than if multiple shifts and a broader
nurse base was used, (c) I was the only observer and there was concern about the physical
demands to myself due to observing the day and night shifts, and (d) if any of the
hospitals required direct monitoring of the observer during the observation period, I did
not want to cause undue stress and inconvenience on the infection prevention department
by observing during the night shift, and (e) two of the facilities involved travel and
overnight accommodations so the objective was to get observations done in as little time
as necessary. Therefore, although there were less individual sets of matching
demographic variables and hand hygiene rates, it was felt that since an association was
being sought, having more hand hygiene opportunities per each set of variables would
yield a more accurate association. It was unknown whether observing the same nurses or
multiple nurses would yield the better data results since the demographic variables were
linked to the nurses’ own individual adherence to hand hygiene.
142
Prior studies have usually used 20 minutes to 1 hour as the observation time
(Filho et al., 2014; Lankford et al., 2003; Stock et al., 2016) although this is beginning to
be questioned (Dai et al., 2015; Diller et al., 2014; Randle, Arthur, & Vaughan, 2010;
Stone, Fuller, Michle, McAteer, & Charlett, 2012a). Lankford et al. (2003) used a
random1-hour observation time between 8:00am to 5:00pm for a 25-week session and
then a second session of 24 weeks. Eckmanns et al. (2006) used a method of observation
of 2 hours daily for 10 days during the am shift measuring an overt and covert
observation technique. A 2010 study used a 24 hour surveillance period but it was broken
up into two 20 minute sessions each hour with two different wards being observed each
hour (Randle, Arthur, & Vaughan, 2010). Doing observations of a complete 24-hour
period and capturing the rate of all HCWs were suggested in a meta-analysis study
(Gould, Chudleigh, Drey, & Moralejo, 2007). Observing for eight continuous hours for
four consecutive days contributes to this study being unique.
A study in which hand hygiene opportunities for both day and night shifts were
observed, found a significant diurnal variation in doctors (80.85% adherence during the
day to 45.99% during the night shift) and in nurses (63.81% adherence during the day to
55.34% during the night shift) (Sahay, Panja, Ray, & Rao, 2016). It was shown that
HCWs were less likely to be adherent with hand hygiene while working during the am
shift compared to the pm shift in a study in Saudi Arabia (Alsubaie et al., 2013).
The ICPs were approached first in regards to obtaining permission to do data
collection in their hospitals because they understood what I was attempting to do. With
their support and help, it facilitated the process of acquiring approval. Because almost all

143
hospitals have a hand hygiene surveillance program (Cusini et al., 2015) and because
manual surveillance methods are labor intensive (Cato, Cohen, & Larson, 2015), the
opportunity to have an unbiased, trained observer come in and collect this data for them
was a huge benefit. In exchange for permission to do my data collection, I promised each
hospital an aggregate report on their HHA rates in their ICUs.
ICU nurses were chosen for the sample because more nurses are available for
observation in the ICU due to the 1:1 or 1:2 ratio of nurse to patient and because the
physical architectural layout of the ICU lends to easier observation. Being assigned to
only one or two patients, more rooms and thus more nurses could be observed than if
each nurse were assigned four to six patients. In many ICUs, the walls facing the hallway
are sliding glass panels for easy visibility of the patient, but it also affords easier visibility
of the nurses. Patient rooms tend to be clustered around the nurses’ station, rather than
down long halls, which also aids observation.
Because the support and cooperation of the ICU director was so important to the
observation environment, the ICU director were also approached and asked for their
permission to come into their ICUs and do data collection. They were offered an
explanation of the study, what I wanted to accomplish, the consent process, the
questionnaire process, and the procedure for the observation periods in an effort to gain
their support. All ICU directors were approached and they gave their consent for data
collection in their ICUs. Flyers were sent to each of the ICUs announcing the research
study and the times of the observation periods.

144
Each packet given to participating nurses contained the letter of (a) informed
consent explaining the study and providing contact information, (b) the demographic
questionnaire, and (c) a number research badge matching the number on the
questionnaire. The nurses were requested to fill out the questionnaire and return to me by
the end of the shift or by the next morning signifying their willingness to participate in
the study.
I knew which numbers were participating because of the matching number on the
filled out questionnaires. If the nurse with badge #7 turned in a blank questionnaire #7,
then I would not record hand hygiene opportunities for nurse #7. It was important that the
nurses understand that none of their identifying demographic information such as name,
address, social security number, or phone numbers was to be collected and that all of the
data would be linked using a number randomly assigned to him or her. Those nurses who
were present during the designated observation period would become the target sample
population for that specific observation period. Since there were five observation periods
encompassing 3 to 5 different days, the target sample changed each observation period
due to nurses being off or being sick.
Although the ICU nurses work 12-hour shifts, the observation periods were 8-10
hours long. The shorter observation period was embraced in order to avoid observer
fatigue. Since a 2 hour period could be added to the end of the shift, it was felt the 8-10
hour shift would function better than a 12-14 hour shift. There was also the possibility
that additional days would have to be added to the observation period due to a low census

145
in the ICU making fewer nurses available for observation or due to the sample size not
being obtained.
Inclusion criteria were all of the ICU nurses working during the 8 to 10 hour
observation period on each of the observation days. During the explanation of the study,
it was important to emphasis to the nurses that this study was voluntary and that they
might opt out of the study with no negative consequences even though their hospital had
agreed to be a data collection site. As the principal investigator explaining the study, I
had to be careful not to coerce or give the appearance of coercion to influence the nurses’
decision to participate regardless of the approval of their hospitals for this study. A letter
of informed consent was included in their packet for their own knowledge and for my
contact information. It is not necessary that the ICU nurses sign the letter of informed
consent since their filling out and returning the questionnaire signified their willingness
to participate. Exclusion criteria were all HCWs other than the ICU registered nurses.
G*Power, version 3.1.9.2 for MacOSX, March 28, 2014, downloaded from the
Heinrich Universtät Düsseldorf website was used to do the power analysis (Faul,
Erdfelder, Lang, & Buchner, 2007; Faul, Erdfelder, Buchner, & Lang, 2009; IBM Corp.,
2013). Using the “Protocol of Power Analysis’ tab, test family as z tests, statistical test as
logistic regression, and type of power analysis as a priori (since this analysis was run
before the data was collected): compute required sample size given alpha, power, and
effect size; the following values were entered into the calculator: two tails, odds ratio as
1.3, effect size as 0.10 (a small effect) (Newton & Rudestam, 2013), alpha as 0.05, and
power as 95%. This yielded a total sample size of 2075 observations that needed to be
146
made (G*Power: Statistical power, 2014). Adding a 10% margin for missing data, this
brought the total sample size to 2283 or 457 observations per ICU site (5 ICUs).
Dropping the power to 80%, alpha at 0.05, and raising the effect size to a medium effect
at 0.30, the total sample size became 557 plus the 10% margin for missing data bringing
the total number of observations needed to 613. Each hospital would require only 123
observations using these criteria. But by using this figure (613) for each of the hospitals,
each of the hospitals could be used as a stand-alone study, which would be beneficial for
each of the hospital study sites. By combining the five sites, it yielded a total sample size
of 3,065 (613 X 5). Using a power calculator, with a sample size at each hospital of 613,
a total sample size of 3,065, an effect size of 0.1, and an alpha level of 0.05, the statistical
power for this study became 0.9923656. This way each study (each ICU) could stand on
its own merits. By combining the data from all five of the ICUs, even if the desired
sample size of 3,065 observations was not obtained or even the total sample size
originally calculated for the study (2075) was used, this would still be a strong study with
power being 0.9500524. Therefore, the targeted sample size for each data collection site
was 613 observations and the targeted total sample size was 3,065. If nurses have an
average of 720 hygiene opportunities per 12-hour shift (WHO webinar, May 05, 2015),
obtaining 613 observations per hospital over 3-4 days was considered a doable task.
A sample size calculation was recommended in a paper by Mahfouz, El Gamal, &
Al-Azraqi (2013). Based on the WHO manual for sample size, a 95% confidence level
with an anticipated population proportion of adherence of 42%, an alpha level of .05, the
minimum sample size calculated was 375 with 500 observations was planned to avoid

147
possible non-responses. It was anticipated the HHA rates at the data collection sites for
this study would be in the range of 40-60% (Erasmus et al., 2010). In one observational
study, hand hygiene was observed during 612 procedures that were performed by 67
HCWs (Korniewicz & El-Masri, 2010). In a study in Saudi Arabia, 3,940 observations
were made among 242 HWCs (Alsubaie et al., 2013). Medeiros et al. (2015) reported a
sample size of 4,837 opportunities for hand hygiene. In a study in a hospital in Bern,
Switzerland, 426 observations were made before intervention and 492 observations were
made post intervention with a total sample size of 2,245 hand hygiene observations
(sample and control) pre-intervention and 2,661 hand hygiene observations post
intervention (Cusini et al., 2015).
An effect size will distinguish how much of a difference exists between the
variables being studied (Spatz, 2011) and refers to the strength of a relationship (Newton
& Rudestam, 2013). Using the Cohen’s D, the effect sizes considered were d = 0.2 (small
effect), d = 0.5 (medium effect), and d = 0.8 (large effect) (Field, 2013; Newton &
Rudestam, 2013). Cohen later reduced these values to 0.1, 0.3, and 0. 5 because he felt
the original values were too high (Newton & Rudestam, 2013) and it is these values that I
used in the calculations. A small effect size (0.1) was chosen for the aggregated sample
because with the demographic variables not being studied previously with the exception
of gender and age, I wanted to verify if there was an actual association between hand
hygiene and these variables.
Alpha level of 0.05 was chosen simply because convention suggests either a value
of .05, .01, or .001 be used. A value of .05 is stringent enough to safeguard against

148
accepting too many false positive results as significant while not being extremely difficult
to achieve (Newton & Rudestam, 2013). Perhaps the more important emphasis should be
placed on clinical significance rather than on statistical significance since the strength of
statistical association was not measured by significance levels but the probability of the
results given the validity of the null hypothesis (Newton & Rudestam, 2013).
A power level is a direct function of the alpha level, the sample size, the effect
size, and the type of statistical test that will be used for analysis (Newton & Rudestam,
2013). Statistical power refers to the ability of a statistical test to detect relationships
between the independent and dependent variables (Newton & Rudestam, 2013). The
power level chosen was .95, again by convention. I wanted my study to be able to detect
relationships between the 15 independent variables and the dependent variable but did not
want the sample size to be too big by choosing the power as 99%. A power level of .95
provided a sample size that was comfortable and doable.
Calculating the number of hours of observation needed was based on a rate of 20
hand hygiene opportunities per hour, a number generated from hand hygiene surveillance
done for my thesis study (Kurtz, S. L., 2011, unpublished thesis). The rate of hand
hygiene opportunities per hour used in this study was supported by rates found in
literature: 28.84 hand hygiene opportunities per hour at the old hospital and 17.38 hand
hygiene opportunities per hour at the new hospital (Lankford et al., 2003), 10 hand
hygiene opportunities per hour (Lee et al., 2016), 17.15 hand hygiene opportunities per
hour (Randle, Arthur, & Vaughan, 2010), 15.40 hand hygiene opportunities per hour
(Taneja, & Mishra, 2015), and 15.2 hand hygiene opportunities per hour (WHO

149
guidelines on hand hygiene, 2009). The average number of hand hygiene opportunities
per hour using these six studies was 17.33 hand hygiene opportunities per hour.
Since a total of 613 hand hygiene opportunities was needed, if 20 hand hygiene
opportunities could be done per hour, then 8 hours of continuous observation would
produce 160 hand hygiene opportunities per day times 4 days would be 640 hand hygiene
opportunities. Planning on observing for five days also allowed extra days for
observation in case the desired sample size of 613 was not obtained in the first 4 days.
Monday, Tuesday, Wednesday, and Thursday were chosen as observation days as these
days were perceived to be the busiest days of the week thus increasing the chances of
obtaining the desired sample size (Duggan et al., 2008). Day shift was also perceived as
being busier than the night shift, again providing more hand hygiene opportunities. By
using the same observation days for each of the ICUs, it facilitated comparison of the five
ICUs. A study by Diller et al. (2014) stated there was no significant differences in hand
hygiene opportunities on weekdays or on weekends. This finding was confirmed in a
study in Saudi Arabia when they also observed no significant differences between
weekday and weekend HHA (Alsubaie et al., 2013).
The surveillance technique used in this study was to observe ICU nurses from
7:00am to 3:30pm with a lunch break taken from 12:00 noon to 12:30pm. Hand hygiene
opportunities were recorded per hour only on those nurses who agreed to participate in
the study and who filled out the demographic questionnaire. Only two ICUs required
surveillance on Thursday and Friday in order to obtain the required sample size of 613
hand hygiene opportunities. Most surveillance programs tend to collect data on all of the

150
nurses or HCWs on the unit as an aggregate rate. In this study, only after linkage was
made in the SPSS program between the individual answers on the questionnaire and that
nurse’s hand hygiene rate was the data aggregated.
Fifteen demographic variables were considered for this study. The question rose
several times if perhaps there were an excessive number of variables to investigate. What
constitutes a reasonable number of variables might be asked. In answering this question,
the sample size, the alpha level, the potential effect size, and the desired power must all
be considered as well as the correlations among the proposed independent variables.
There can be a substantial loss of power when the ratio of the number of the subjects to
the number of variables is smaller than 15. In this study, with the individual data
collection site observation sample being 613 divided by the 15 independent variables, the
ration is 40.87 (Newton & Rudestam, 2013). A rule of thumb formula for approximating
the number of subjects for testing the multiple correlation is N > 50 + 8k, where k is the
number of independent variables. This yields 50 + (8 X 15) or 50 + 120 or 170. N at 613
is greater than 170. In testing individual predictors, N > 104 + k or 104 + 15 = 119, again
613 as a sample size for each data collection site is greater than the 119 (Newton &
Rudestam, 2013). Therefore, it was considered to be appropriate to investigate the 15
independent demographic variables being considered. A Bonferroni adjustment was also
planned to be conducted at time of analysis due to the large number of variables. It was
felt that the interconnectedness of these variables necessitated the inclusion of them all.
Several of these variables were used in conjunction with other variables to answer

151
specific questions such as was age or actual number of years of active nursing practice
(plus the year of graduation from nursing school) associated with HHA rates.
Procedures for Recruitment, Participation, and Data Collection
The procedure for recruitment of the nurses was to recruit the hospitals for
permission to have access to their ICU nurses rather than approach individual ICU
nurses. The ICPs of the hospitals were first approached with the purpose and goals of the
study to incorporate their help in advancing my request toward the approval process.
Because a hand hygiene study would be beneficial to them, the ICPs were cooperative
and helpful. Meetings and phone conversations were held with potential ICPs. An
information packet containing (a) a letter of introduction, (b) the prospectus of this study,
(c) a letter of cooperation, and (d) my curriculum vitae, was sent to each ICP that
expressed interest in pursuing their hospital being a data collection site.
Gaining approval from multiple data sites was pursued for three reasons: if
approval was not granted by one facility, there would be backup facilities where data
could be collected. Using multiple sites strengthened the study and increased the
generalization of the study. Losing the hospital in California did hurt the generalization of
this study. Also, having multiple sites prevented identification of data from any one site.
Once the Walden University IRB granted approval for this study, contact was
made with the liaison person of each hospital and arrangements made for data collection.
Contact also was made with the directors of the ICUs to facilitate the process. It was
hoped that incorporating the help of the ICU directors would facilitate getting the ICU
nurses together to explain the study to them. It was hoped a staff meeting could be held

152
the afternoon before the first observation period began. At this staff meeting, the study
would be presented, the purpose, the goals, and a question and answer session. Packets
would be distributed to the nurses. They would be asked to fill out the questionnaire after
the meeting and to return them to me by the end of the shift or the next morning. A filled
out questionnaire would indicate their willingness to participate. Any ICU nurse that
appeared on the unit during the observation periods that were not at this initial meeting
would be approached privately, provided information about the study, and offered the
opportunity to participate. If meetings could not be arranged with the ICU nurses the
afternoon before the observation period began the entire explanation procedure would
have to be done the morning of the first observation period.
Data collection was by overt direct observation of the ICU nurses by the principal
investigator during four designated observation periods with a possibility of additional
observation days. Observation time was from 7:00am to 3:30pm with a possible
extension to 5:30pm depending on the rates of the first two hours of observation.
Adherence with hand hygiene upon entry (each entry will provide one opportunity) and
upon exit (each exit will provide one opportunity) of the patient’s room by the nurse was
considered opportunities for HHA. Because multiple nurses may be entering and exiting
patient rooms at the same time, there may not be an equal number of hand hygiene
opportunities at entry and at exit. Each opportunity was recorded as a binominal response
of ‘yes, the nurse was adherent with hand hygiene’ or ‘no, the nurse was not adherent’.
Each opportunity was linked to the individual nurse and not recorded as an aggregate
number except during final analysis. HHA of each nurse was linked to that individual

153
nurse’s demographic variables in the SPSS (IBM Corp., 2013). Observations were
recorded on a paper worksheet. This data and the answers to the questionnaire were then
transcribed to the SPSS software for data storage and analysis.
Nurses exited the study by not being on the work schedule, being ill and not
fulfilling their scheduled work day, by not filling out the questionnaire, or by requesting
that data collection be stopped on them even if they had previously filled out the
demographic questionnaire. There was no debriefing session at the end of each
observations period or at the end of the total observation period of the study. Once
analysis of the data was made, the information for each individual hospital was shared
with that individual hospital. Aggregate data was presented back to the hospital but not
individual’s hand hygiene rates. This process might be considered a debriefing. My
contact information was provided to each of the nurses if they desired to know their own
individual hand hygiene rate, which would be provided as requested. If the nurse lost my
contact information, each of the ICPs in the five hospitals would be able to supply my
contact information to the nurse. Individual nurses could request their own hand hygiene
rate by the number on their badges but not by their names as this information was not
collected.
Follow-up consisted of my sharing the aggregate data collected at each hospital
with that particular hospital. For example, data collected at hospital A was not shared
with hospital B, etc. There was no follow-up interviews with the ICU nurses.
A coding system was decided upon that provided a high level of confidentiality to
the nurses who wished to participate. Instead of linking the demographic information and

154
the nurses’ adherence rates to their name, numbers were used to link these two
components. Each nurse was provided a packet at the time of initial introduction of the
study. There was a (a) cover letter; (b) a letter of informed consent for them to keep, (c)
the questionnaire, and (d) a business card with my contact information. Each of the
questionnaires were marked with a number from 1 – 75 (the total n equaled 64 nurses). A
clear plain plastic badge with a number matching the questionnaire’s number was
provided. The nurses were asked to wear the numbered badge in addition to their hospital
badge on the days of observation. Since the numbered packets were passed out randomly,
linking the number to an alphabetical letter to trigger a name was not possible. Filling out
the questionnaire and returning it signified the nurses’ willingness to participate.
Information on a Pilot Study
A pilot test is a simplified version of the study in order to facilitate a larger, more
encompassing study (Arain, Campbell, Cooper, & Lancaster, 2010). The overall purpose
of a pilot study or pilot test is to evaluate recruitment techniques, if the randomization
process produces the samples sought, if retention of participants will be a problem, to
assess procedures, new methods, to test instruments newly developed, and the
introduction of a new intervention (Leon, Davis, & Kraemer, 2011). In this study, a pilot
study was not required for the letter of informed consent or the demographic
questionnaire according to Ms. Libby Munson, Research Ethics Support Specialist
([email protected], August 18, 2015). Per Ms. Munson’s suggestion, these forms were
presented to two fellow doctoral students (one of whom is a physician’s assistant). They
offered suggestions to clarify pronoun use and to modify the number of selections on the
155
spiritual affiliation question. The forms were corrected and given to 8 ICPs at the Dallas/
Fort Worth APIC membership on September 03, 2015 for their review. Additional
modifications were made based on their feedback. My dissertation chair, committee
member, and the URR also reviewed these two forms. Utilizing this process, it was hoped
there would be no confusion or misunderstanding of the purpose and goals of this study
when presented to the ICU nurses. It was also hoped that the demographic questions
asked would be clearly understood with everyone deriving the same information from
each question to facilitate accurate data was collected.
Researcher Instruments
Three instruments were used for this study (a) the letter of informed consent form
for the ICU nurses, (b) the demographic variables questionnaire, and (c) the data
collection tool onto which the hand hygiene observations were recorded. Consent form
format was taken from the Walden University Research Center, consent form for adults
above the age of 18 years. Modifications were made to satisfy requirements for this study
(Walden University, Research Center, IRB, sample documents, sample consent form for
adults for participants over 18).
No list of demographic questions met all of the requirements I had for my list of
questions so an original document containing 15 demographic questions was designed
(Christian denominations, 2015; DeMaio & Bates, 2012; Demographic questions, n.d.;
Featured religions and beliefs, 2014; General demographic questions for any survey,
2009; How many major races are there in the world, 2011; Largest Christian
denominations (35) in the United States, 2015; Mahoney, 2009; Race and ethnicity
156
classifications, n.d.; Religious landscape study, 2015; Sincero, 2012b; Top ten organized
religions of the world, 2015). Another source pointed out common mistakes in asking
survey questions (Smith, 2013). The most difficulty was encountered in developing
questions regarding ancestry (race/ethnicity) and spiritual affiliation (religion). The data
collection tool itself was originally designed to meet the requirements for collecting the
data that I wanted to capture.
Internal consistency reliability defines how consistent the results are from a test
that is given with different questions measuring the same construct delivering the same
results. Reliability can be measured by applying the test-retest technique or by including
two versions of the same instrument within the same test (Field, 2013; Shuttleworth,
2009). There are three main techniques for measuring internal consistency reliability: the
split-halves which involves dividing the test into two halves; the Kuder-Richardson test
which is a more, advanced and complex form of the split-halves test; and the Cronbach’s
Alpha test which averages the correlation between all possible combinations of split-
halves and also allows for multi-level responses. Cronbach’s Alpha yields a score
between zero and one with 0.7 generally being accepted as a sign of acceptable reliability
(Field, 2013; Shuttleworth, 2009). By assuring the reliability of my instrument or survey
tool, then validity can be assured. Validity refers to whether or not an instrument will
measure what it is intended to measure and is accurate. Reliability is the ability to
produce the same results under the same conditions (Assessing the methodology of the
study, 2000; Field, 2013). Four different hospitals with five ICUs were used as data
collection sites so the reliability of my form was tested in this manner.

157
Because the demographic questionnaire delivered to the ICU nurses would
be collecting only demographic variables, there was no formal plan to check the internal
consistency of the questionnaire. A test-retest would be impractical and not useful. A
question that might be used for result reliability would be question #2: What is your
gender? The results from the survey could be checked against the information given by
the Director of ICU regarding the separation of the ICU nurses by gender. This number
could be used as a percentage of males and females who work in the ICU and this figure
could be compared against the aggregate results recorded on the demographic
questionnaire. Question 11 (In what country were you born), question 12 (From what
country did you graduate nursing school), question 13 (How would you classify your
ancestry), and question 15 (How many years have you been in the United States) can all
be compared against each other to test the reliability of the nurse’s answers. SPSS was
also used to test reliability once all data had been entered. Click on the ‘Variable view’,
click on ‘Analysis’, ‘Scale’, and finally on ‘Reliability analysis (IBM Corp, 2013) for
checking validity.
I realize that part of the validity and reliability of this questionnaire is the
trustworthiness of the ICU nurses. It is possible that they may lie in answering questions
on the questionnaire, especially about their age. However, in the annual Gallup polls
measuring trustworthiness of different professions, since 1999 when nurses were first
included, they have topped the list every year with the exception of 2001 when it was
firefighters (Xie, 2014). In 2013, 82% of Americans ranked nurses as most trustworthy,
ranking their honestly and ethical standards as high or very high. Physicians ranked 69%

158
and members of congress ranked 8% (Gallup poll, 2013). Based upon these trustworthy
scores, I expected honest and truthful answers were given by the ICU nurses on the
questionnaire making the test instrument valid and reliable.
Because these are associational questions tied to demographic information rather
than questions connected to causality, the design of the questionnaire does seem to have
sufficiency to answer the research questions. These questions were not designed to elicit
feeling responses nor could they be used in a reversed manner for testing reliability.
Operationalization for Each Variable
The operational definition of each independent demographic variable is as
follows:
1. Date of birth (used to calculate age): The date upon which a person was born.
2. Gender: The state of being male or female (Merriam-Webster dictionary,
2015).
3. Marital status: A person’s state of being single, cohabitating, married, married
by common law, separated, divorced, or widowed (Oxford dictionaries, 2015).
4. How many children living in your household: The number of children living in
the nurse’s household at the time of this survey. No age limit is placed on the age
of the children. This information will help determine if there is a difference in
hand hygiene rates between parents and non-parents based on a theory that
because they should be involved in teaching their children hand hygiene habits,
they will be more aware of their own habits in the hospital thus increasing their
159
own rates. It will also be observed if the number of children a nurse has is an
associate factor in hand hygiene.
5. What was your total gross household income in U.S. dollars for 2015: The total
of all revenue (before taxes and other deductions) in U.S. dollars that the nurse’s
family made in 2015 (Merriam-Webster dictionary, 2015).
6. Year of graduation from nursing school: The year a nurse graduated from
nursing school. This information helped determine the possible number of years
of nursing practice. This information was used to help determine if HHA rates
were associated with age or with the number of years of active nursing practice.
7. Number of years of active nursing practice: The number of years of actively
working as a nurse. This information was used in conjunction with the year of
graduation from nursing school and age to help determine if hand hygiene rates
were associated with age alone or with the actual number of years of practice.
8. Are you a hospital employed nurse or an agency nurse: The nurse was
employed either as a permanent hospital employee or was employed by a nursing
agency and working for the hospital on a temporary basis.
9. Areas of previous nursing practice where you have actually worked on a
nursing unit dedicated to this specialty: The identification of all nursing units that
the nurse has worked other than ICU.
10. What is your degree program: Degree program (associated nursing degree,
diploma degree, BSN, masters of nursing or masters in another field, PhD, DNP):
The number of years of nursing education this person has received. There is a

160
question as to whether an inverse ratio of HHA in regards to educational level
exists among nurses as it appears to with doctors.
11. In what country were you born: The country in which a person’s birth is
recorded. This helped to establish ethnicity and racial origin of the nurse.
12. From what country did you graduate nursing school: The country where the
nurse attended nursing school. This provided information on where the nurse
received the bulk of his/her training in HHA.
13. How would you classify your ancestry: A group of people with whom a
person would classify himself or herself; A group of people in your family who
preceded you and with whom you are genetically linked; A person from whom
you are descended (Merriam-Webster dictionary, 2015). The term ancestry was
used in place of race/ethnicity.
14. What is your spiritual affiliation: The religious or non-religious preference of
the nurse. Into what religion or non-religion does this particular nurse classify
himself or herself. The term spiritual affiliation was used in place of religious
preference.
15. How many years have you been living in the United States: The number of
years a person has been living in the United States. This question will help to
distinguish native-born Americans from persons born in another country. The
longer a person has been in the United States, the more influence should have
occurred in the areas of personal hygiene and hand hygiene in particular.
The operational definition of the dependent variable is as follows:

161
1. Hand hygiene: The act of cleaning of the hands either with the alcohol hand
sanitizer or by washing the hands with soap and water.
2. Hand hygiene adherence: The act of cleaning of the hands upon entry or exit of
the patient’s room.
Each entry into a patient’s room was considered one hand hygiene opportunity
and each exit from the patient’s room was considered a separate hand hygiene
opportunity. A nurse’s entry and subsequent exit from a patient ‘s room would be
considered two hand hygiene opportunities. If a nurse was observed entering a patient’s
room, a second nurse was exiting a patient’s room, and the first nurse entered another
patient’ room (no exit observed from first room), three hand hygiene opportunity
observations would be recorded Adherence was measured dichotomously, ‘yes they were
adherent and participated in hand hygiene’ or ‘no, they were not adherent and did not
participate in hand hygiene’. Adherence had to be immediately upon entry or exit of the
patient’s room or evidence was presented that the nurse was walking to a sink and
participated in hand hygiene with soap and water.
Each independent variable was measured in the following manner:
1. Date of birth (age) (used to calculate age): a continuous ratio variable with
possible answers from 01-01-1940 (age 75 years) to 12-31-1995 (20 years of age).
2. Gender: a categorical binary variable: female coded as 0 and male coded as 1.
3. Marital status: a categorical nominal variable with single coded as 1, single but
cohabitating as 2, currently married as 3, common law marriage as 4 , separated
as 5, divorced as 6, widowed as 7, and prefer not to answer as 8.

162
4. Number of children: a continuous ratio variable with 0-50 as possible answers
coded from 0 through 7 as the actual number of children, code 8 as the specific
number of children if the number is more than 7, and 8 coded as prefer not to
answer.
5. Total household income: a categorical ordinal variable coded as <$39K as 1,
$40K- $49K as 2, … $225K-$249K as 18, >$250K as 19, and prefer not to
answer as 20.
6. Year of graduation from nursing school: a continuous ratio variable with
possible answers of approximately 01-01-1955 to present (graduation at age 20,
this gives 60 years of nursing practice).
7. Number of years of active nursing practice: a continuous ratio variable from
zero to approximately 60 (if graduation from nursing school at 20, age would be
80 years old).
8. Agency nurse or hospital employed nurse: a categorical ordinal variable with
agency nurse coded as 1, hospital employed nurse as 2, and prefer not to answer
as 3.
9. Areas of previous nursing practice: a categorical ordinal variable coded from 1
to 24.
10. Degree program: a categorical ordinal variable coded from 1 to 7.
11. Country where nurse born: a categorical ordinal variable coded from 1 to 14.
12. Country in which graduated from nursing school: a categorical ordinal
variable coded from 1 to 14.

163
13. Ancestry: a categorical ordinal variable coded from 1 to 42.
14. Spiritual affiliation: a categorical ordinal variable coded from 1 to 44.
15. Number of years living in the United States: a categorical ordinal variable
coded from 1 to 19 with all my life (born in the U.S.) as 1, less than 12 months as
2, 13 months to 23 months as 3, 2 years as 4, 3 years as 5 , …, 10-14 years as 12,
15-19 years as 13, …, 35-39 years as 17, more than 40 years as 18, and prefer not
to answer as 19.
The 1 dependent variable was measured in the following manner:
Hand hygiene: a binary categorical variable with no coded as 0 and yes coded as 1.
When data was being entered into SPSS, each variable was also assigned a code
to indicate ‘missing data’. For example, if question 3 were skipped altogether, a code of
#9 was assigned to ‘missing data’. This code was assigned after the questionnaire was
returned as not to confuse the nurse or to indicate that it was okay for him/her to skip a
particular question.
All variable data was categorical with the exception of (1) Date of birth (age), (4)
Number of children, (6) Year of graduation from nursing school, and (7) Number of years
of active practice. These four variables were collected as a continuous ratio measurement
but once data was collected, they could be broken into categories so all variables could be
measured as categorical.
An explanation of how the variable /scale score was calculated for each of the
variables is presented in the following paragraphs along with what the score represents
and an example item.

164
Variable 1. Date of birth (age): The date of birth was used to calculate the age of
the nurse. This was manually calculated and entered into the data view tab of SPSS. The
score represents the number of years old a nurse is, for example, a nurse could be in
his/her early 20s or may be 45years old, or 55 years old. This number was used along
with variable (6) Year of graduation from nursing school and variable (7) Number of
years of active nursing practice to help determine if the association between HHA was
with age or the number of years of nursing practice. In the literature, adherence has been
linked to age, but the distinction has not been made as to whether it is actually age or the
number of years of nursing practice. A nurse who is 50 years of age may have been
practicing for three decades or have graduated just six months before. With many older
nurses just graduating, the variable of age has different connotations.
Variable 2. Gender: The variable of gender was used to calculate the percentage
of male and female nurses working in the ICU and also to identify if there was a
difference in the rates between male nurses and female nurses. Literature has shown
HHA to be higher in the female nurse population than in the male nurse population. The
score was the HHA in the female and male nurses. An example was a study in Columbia
in 2014 in which the female rate was 77% while the HHA rate for males was 67%
(Barahona-Guzmán et al., 2014). A study in China in 2015 resulted in similar figures of
female nurses’ HHA rate of 64% while male nurses had a rate of 55% (Su et al., 2015).
However, the results of a study in Brazil did not confirm that female nurses had higher
rates than male nurses and yielded results of HHA rates for female nurses as 38% and
165
male nurses as 49% (Medeiros et al., 2015). My study became a confirmatory study that
gave support to the new study from Brazil in 2015.
Variable 3. Marital status. This helped to determine the marital status of the nurse.
The results from the questionnaire were placed into the data view tab of SPSS for
statistical analysis to see if an association existed between marital status and HHA. The
resulting score indicated if there was an association between hand hygiene and one of the
groups making up this variable. It can be theorized that a person who is married would
exhibit higher adherence rates due to a more mature awareness for the safety of others.
Variable 4. Number of children: This variable was also placed into the data view
tab of SPSS and helped to establish if higher HHA was associated with being a parent. It
was surmised that being married and having children would contribute to a more mature
understanding of the importance of hand hygiene along with increased hand hygiene
habits in the parent because of “setting a good example” and this behavior would be
carried over to their work environment.
Variable 5. Total gross household income: Consideration must be given that
higher income may contribute to increased rates of HHA. A higher income would
indicate more disposable income for soap and cleansing products. Clean water is usually
not an issue in the United States with 99% of the households having access to clean water
while Mozambique has only 49% access; figures are for 2012 (Improved water source,
2015).
Variable 6. Year of graduation from nursing school: This variable was collected
as the numeric year that the nurse graduated. This was used to help determine the number

166
of years of possible nursing practice. This variable was scored as a continuous ratio
variable but once data was collected, it could be divided into categories to convert it to a
categorical variable. Variable 7. Number of years of active nursing practice: The answers
to this question helped to establish if the nurse had been in active practice since
graduation or that other career duties had interfered in a continuous nursing career. Did
the nurse work in nursing until marriage and the nursing career was placed on hold while
children were raised or was work continuous. It was also scored as a continuous ratio
variable but may be converted to a categorical variable.
Variable 8. An agency nurse or hospital employed nurse: It was hoped the
answers to this variable would help to establish if there was a difference in the hand
hygiene rate of nurses who work as an agency nurse and the rates of nurses who were
employed by the hospital. Hospital employed nurses should be more influenced by
hospital policy and by the safety culture of the hospital while the agency nurse should be
more influenced by his/her own inherent hand hygiene habits. Although the answers
sought were a categorical response, the addition of ‘Prefer not to answer’ and ‘Missing
data’ made this variable categorical ordinal and it was scored as such.
Variable 9. Areas of previous nursing practice: Because the nurse was asked to
check all units he/she may have worked on, this question could have multiple responses.
Nurses tend to move from one department to another instead of moving from job to job.
This variable could be scored multiple times as a variable rather than just as one entry if
multiple previous areas of nursing were marked. This happened when data was entered
into the SPSS data view and was dependent on the number of different units marked.

167
There was the possibility that some nursing units were not serving as preparatory units
for work in an ICU.
Variable 10. Degree program: This was scored as a categorical ordinal variable.
By asking them to check all that apply, it provided information as to the progression of
their education as well as the entry level of their nursing career. For example, many
entry-level associate or diploma nurses returned to school to earn their BSN degrees.
Bachelor degrees in fields other than nursing may have been earned if nursing was a
second career choice that was entered upon later in life. During the data entry into SPSS,
this information was sorted, categorized, and entered as deemed appropriate. For
example, if a nurse had his/her associate degree only, it was coded as 1. If however, the
nurse began as an associate degree nurse, earned a BSN, and then earned a master’s
degree in nursing, this response was coded as 5.
Variable 11. Country in which nurse was born: This was a categorical ordinal
variable that was coded as such. For example, if the nurse were born in England, the code
was entered into SPSS data view as 3.
Variable 12: Country from where nursing school was graduated: This variable
helped to establish where the nurse received his/her nursing education. Certain countries
may exhibit higher HHA rates than others due to availability of clean water and soap.
Reported HHA rates from other countries have traditionally been low, but the influence
of working in the United States and the expected behavior of hand hygiene may increase
that particular individual’s adherence rates.

168
Variable 13. Ancestry: This variable was scored as a categorical ordinal variable
and the nurse was instructed to check only one response. It was hoped that the responses
would help to differentiate ethnicity of the nurses. This helped to distinguish if there were
different adherence rates among different cultural groups of people. For example, in my
thesis work, results showed approximately the same adherence rate between Whites and
Blacks. But Asian and Hispanics had lower rates of adherence (S. L. Kurtz, unpublished
thesis, 2011). The hope was to confirm or refute this prior study with the results of this
study.
Variable 14: Spiritual affiliation: This was a categorical ordinal variable in which
the coded responses were entered into the Data View of the SPSS program. For instance,
Baptist was coded as ‘8’ while Islam was coded as ‘22’.
Variable 15: Number of years living in the United States: This variable was a
categorical ordinal variable and was used with Variable 1 to help establish if living in the
United States contributed to a shorter time or a longer time in terms of influences on hand
hygiene habits.
Data Analysis Plan
The software used for the data storage and analysis of this study was the
Statistical Package for Social Sciences licensed by IBM, version 21 released in 2013,
IBM SPSS Statistics for Macintosh version 22.0 (IBM Corp., 2013).
Data cleaning or data scrubbing was the process in which the entries of the data
set were examined for incorrect, incomplete, duplicated, or improperly formatted data
entries (Rouse, 2015). SPSS was used to identify duplicate cases that were entered and to

169
identify if unusual entries had been made (for example, age entered in as 199 years). This
was done by accessing SPSS, going to Variable View, clicking on Data, clicking on
Identify duplicate cases or on Identify unusual cases. Missing value analysis was
accomplished by going to Variable View, clicking on Analysis, and clicking on Missing
value analysis. As data was entered into SPSS data view, this also gave an opportunity to
check data for errors made on the questionnaire. This was also the time when missing
data was accounted for. Data screening was also done using the SPSS system. It helped to
ensure enough data had been collected, to check the amount and type of missing data, and
to help to identify outliers (Loxton, 2008).
SPSS was used to store data and to generate the analysis. Multiple regression, Chi
Square, and t-test were done as well as a Bonferroni correction was planned.
Research Questions and Hypotheses
The purpose statement: The purpose of this study was to investigate if an association
exited between any of these following 15 independent demographic variables: (1) date of
birth (age), (2) gender, (3) marital status, (4) number of children, (5) family income, (6)
year of graduation from nursing school, (7) number of years of active nursing practice,
(8) hospital employee or agency nurse, (9) areas of previous nursing practice, (10) degree
program (associate nursing degree, diploma degree, BSN, masters of nursing or master in
another field, PhD, DNP, (11) country in which the nurse was born, (12) country from
which nurse graduated nursing school, (13) ancestry, (14) spiritual affiliation, (15) and
number of years living in the United States and the dependent variable of HHA.

170
The problem statement: Currently, HHA rates worldwide are in the range of 40-
60% while guidelines and recommendations tout the necessity of 100% adherence to
reduce the number of HAIs. Reasons for nonadherence are not fully understood. Because
little research has been done regarding the role demographic variables may have on
adherence, this research was undertaken to help answer the question of whether or not an
association exited between HHA and the 15 demographic variables reviewed.
The research questions and hypotheses were as follows:
1. What was the association between hand hygiene adherence rates among ICU
nurses and his/her date of birth (age)?
Ho1 = There was no association between the hand hygiene adherence rates among
ICU nurses and his/her date of birth (age).
Ha1 = There was an association between the hand hygiene adherence rates among
ICU nurses and his/her date of birth (age).
2. What was the association between the hand hygiene adherence rates among
ICU nurses and gender?
Ho2 = There was no association between the hand hygiene adherence rates among
ICU nurses and gender.
Ha2 = There was an association between the hand hygiene rates among ICU
nurses and gender.
3. What was the association between the hand hygiene adherence rates among
ICU nurses and marital status?

171
Ho3 = There was no association between the hand hygiene adherence rates among
ICU nurses and marital status.
Ha3 = There was an association between the hand hygiene rates among ICU
nurses and marital status.
4. What was the association between the hand hygiene adherence rates among
ICU nurses and number of children?
Ho4 = There was no association between the hand hygiene adherence rates among
ICU nurses and the number of children.
Ha4 = There was an association between the hand hygiene rates among ICU
nurses and the number of children. .
5. What was the association between the hand hygiene adherence rates among
ICU nurses and the gross family income of a nurse?
Ho5 = There was no association between the hand hygiene adherence rates among
ICU nurses and the gross family income of a nurse.
Ha5 = There was an association between the hand hygiene rates among ICU
nurses and the gross family income of a nurse.
6. What was the association between the hand hygiene adherence rates among
ICU nurses and year of graduation from nursing school?
Ho6 = There was no association between the hand hygiene adherence rates among
ICU nurses and year of graduation from nursing school.
Ha6 = There was an association between the hand hygiene rates among ICU
nurses and year of graduation from nursing school.

172
7. What was the association between the hand hygiene adherence rates among
ICU nurses and number of years of active nursing practice?
Ho7 = There was no association between the hand hygiene adherence rates among
ICU nurses and number of years of active nursing practice.
Ha7 = There was an association between the hand hygiene rates among ICU
nurses and number of years of active nursing practice.
8. What was the association between the hand hygiene adherence rates among
ICU nurses and hospital employee or agency nurse?
Ho8 = There was no association between the hand hygiene adherence rates among
ICU nurses and hospital employee or agency nurse.
Ha8 = There was an association between the hand hygiene rates among ICU
nurses and hospital employee or agency nurse.
9. What was the association between the hand hygiene adherence rates among
ICU nurses and areas of previous nursing practice?
Ho9 = There was no association between the hand hygiene adherence rates among
ICU nurses and areas of previous nursing practice.
Ha9 = There was an association between the hand hygiene rates among ICU
nurses and areas of previous nursing practice.
10. What was the association between the hand hygiene adherence rates among
ICU nurses and their degree program?
Ho10 = There was no association between the hand hygiene adherence rates
among ICU nurses and their degree program.

173
Ha10 = There was an association between the hand hygiene rates among ICU
nurses and their degree program.
11. What was the association between the hand hygiene adherence rates among
ICU nurses and country in which nurse born?
Ho11 = There was no association between the hand hygiene adherence rates
among ICU nurses and country in which nurse born.
Ha11 = There was an association between the hand hygiene rates among ICU
nurses and country in which nurse born.
12. What was the association between the hand hygiene adherence rates among
ICU nurses and country from which nurse gradated nursing school?
Ho12 = There was no association between the hand hygiene adherence rates
among ICU nurses and country from which nurse graduated nursing school.
Ha12 = There was an association between the hand hygiene rates among ICU
nurses and country from which nurse graduated nursing school.
13. What was the association between the hand hygiene adherence rates among
ICU nurses and ancestry?
Ho13 = There was no association between the hand hygiene adherence rates
among ICU nurses and ancestry.
Ha13 = There was an association between the hand hygiene rates among ICU
nurses and ancestry.
14. What was the association between the hand hygiene adherence rates among
ICU nurses and spiritual affiliation?

174
Ho14 = There was no association between the hand hygiene adherence rates
among ICU nurses and spiritual affiliation.
Ha14 = There was an association between the hand hygiene rates among ICU
nurses and spiritual affiliation.
15. What was the association between the hand hygiene adherence rates among
ICU nurses and number of years of living in the United States?
Ho15 = There was no association between the hand hygiene adherence rates
among ICU nurses and number of years of living in the United States.
Ha15 = There was an association between the hand hygiene rates among ICU
nurses and number of years of living in the United States.
(Field, 2013; Polit & Beck, 2012).
Since the 15 independent demographic variables were both continuous (four were
continuous) and categorical (11 were categorical) and the dependent variable was
categorical binary (hand hygiene performed yes or no), the data analysis plan was to use
multiple logistic regression plus binary logistic regression (Field, 2013; Polit & Beck,
2012; Wuensch, 2014). In addition stepwise regression was planned using the ‘backward
elimination’ method (Newton & Rudestam, 2013). Because the inclusion of the effect
size is now asked for in studies, confidence intervals were also included (Newton &
Rudestam, 2013). It was anticipated Bonferroni correction would also be conducted
because of the large number of independent variables being used.
Because this study was set up as an observational study, descriptive statistics were
used to demonstrate percentages identified. Descriptive statistics (frequencies and

175
measures of central tendency) were used to observe, describe, and document different
aspects of the situation as it occurred (Polit & Beck, 2012). For example, the percentages
of nurses participating in the study were shown with the numerator being the number of
nurses who were actually observed and the denominator being the total number of nurses
who were employed by the ICUs. Percentages of female and male nurses represented in
the study were presented. How many nurses were married and had children as opposed to
the number of nurses who were unmarried and had no children was shown. Each variable
was represented as to the number of nurses participating and the percentages of their
responses. Aggregate overall HHA rates were presented as well as for female and male
nurses. Inferential statistics were also calculated and presented using logistic, multiple,
binary regression, and a Bonferroni correction was planned.
Because several of the independent variables were designed to work in
conjunction with one another, multiplicity testing was required. Date of birth with a
nurse’s age calculated from it was paired with the number of years of active nursing
practice to determine if hand hygiene rates was determined by age (as reported in the
literature) or by the number of years of active practice. A second pairing was the marital
status and number of children. A person married with children might be considered more
mature and have a greater understanding of the importance of adherence to hand hygiene
(because of parental responsibilities toward their children) than someone who is single
with no children. Gender and the type of degree program the nurse graduated from were
also paired. Each variable was tested separately with an alpha level of 0.05. When testing

176
the 15 demographic variables, the probability of observing at least one significant result
was as follows:
P (at least one significant result) = 1 – P (no significant results)
= 1 – (1 - 0.05)15
= 1 - (0.95)15
= 1 - 0.463
= 0.537
= 54% chance of observing at least one
significant result, even if all of the tests are not significant (Goldman, 2008; Schochet,
2008). If the pairings are computed, then
P (at least one significant result) = 1 – 0.857
= 0.143
= 14% chance of observing at least one
significant result, even if all of the tests are not significant (Goldman, 2008; Schochet,
2008).
With the Bonferroni correction test or the Dunn multiple comparison test, if the
correction sets the significance cut off at alpha/n, then with 15 variables and an alpha of
0.05, the null hypothesis would be rejected only if the p-value was less than 0.0033
(Goldman, 2008; Newton & Rudestam, 2013; Schochet, 2008).
Cross validation of the study was accomplished with the data collection sites
being four different facilities (5 separate ICUs), each able to stand on its own as an

177
independent study. This assisted in the generalizability of the overall study, as each of the
5 ICUs presented a different sample of nurses to test (Field, 2013).
Reliability testing of the questionnaire did not take place in a pilot study, as the
questions are all demographic questions. The validity of the questionnaire was tested
using friends at Walden University and the Dallas/ Fort Worth APIC membership to
proofread and suggest revisions.
All of the 15 demographic variables could be considered as potential covariables.
But it was felt that the inclusion of each of these variables was important to the overall
understanding of the association of demographic variables to the adherence of hand
hygiene. None of these demographic variables can truly work alone as human being are
complex creatures being influenced by age, marital status, children, our ancestry, and our
spiritual affiliation. Although each variable was tested individually, in reality, all of them
are combined into a ‘variable concoction’ in which the levels of influence of each of the
variables will vary person to person and from situation to situation.
Results were interpreted using descriptive analysis with frequency tables,
percentages of participants, percentages of the responses of the different variables, odds
ratio, p-values, and effect size. Missing data was also reported. This information was
presented using tables and bar graphs. Inferential statistics were interpreted using
multiple regression. Case processing summary tables, the variables in the equation and
not in the equation tables, the omnibus tests of model coefficients, the Wald Chi-Square,
significance levels, and the model summary table were utilized for data analysis (idre,
2015; Wuensch, 2014).

178
Threats to Validity
External validity refers to being able to apply the results of this study to other
populations of nurses such as nurses on a cardiovascular unit, on a surgical unit, or
another ICU. The question arises as to whether the results of this study can be applied
only to the ICU nurses or can these results be generalized to a broader group of nurses. It
was of concern if generalizations concerning the variations in the nurses, the hospitals,
different months of the year, and different ICU cultures could be made based on the
sample of nurses and hospitals that were used in the study (Bieger & Gerlack, 2012;
External validity, 2012; Polit & Beck, 2012). Generalization of some knowledge gained
from this study can be used for all nurses across the U.S. Using multisite hospitals to pull
the total sample size was a powerful asset as the results were duplicated at several ICUs.
Since the location of the hospitals are different, the number of ICU beds different,
the total number of beds being different, and the potential of the nursing population being
weighted as to a particular ethnic group, there was additional confidence in the
generalization of this study. Since the ICU nurses were observed during their actual shift
work, this also added to the real world circumstance (Polit & Beck, 2012). Confidence
was also gained in that all data collection hospitals participate in guidelines that
recommend 100% HHA and have hand hygiene surveillance programs in place.
A large threat to the external validity of this study was the possible influences or
interactions each of the independent demographic variables might have had on each
other. Family income may be dependent on the number of years of active nursing practice
with a higher salary being paid to a nurse who has worked longer or is working in a
179
managerial position. This also correlates to the year of graduation from nursing school.
The number of children and age may be correlated with the number of years of active
nursing practice. Spiritual affiliation may permeate a nurse’s attitudes, goals, or being
receptive to working on certain nursing units. The need for family income may drive
whether a nurse works as a hospital-employed nurse or as an agency nurse (Polit & Beck,
2012).
A second threat to this study was the different safety cultures of the hospitals in
the study. The tolerance of HHA rates by the administration of the hospital would have
been a factor that influences the safety culture of all units and the hospital in general. A
third threat was population-related threats or the extent to which the sample was
representative or not representative of the population from which it was selected (Bieger
& Gerlack, 2012). With using four different hospitals, it was felt this sample would be
representative of the population. However, the results still need to be interpreted with
caution, as this was a convenience sample of ICU nurses rather than a random sample of
U.S. registered nurses.
An ecology-related threat was possible in this study because hospitals in all states
were not represented (Bieger & Gerlack, 2012, slide 37). All four hospitals are located in
Texas. No hospitals are located in the eastern or western United States. It may be possible
that because of the different demographic makeup of the eastern or western states (more
urban, less rural, and greater concentration of the population), there may be a different
patient safety culture and thus different HHA rates based on the same 15 independent
180
demographic variables. In this study, this issue was not addressed. However, this may be
a potential for future research.
The threat of effect of testing to external validity was not valid here (Bieger &
Gerlack, 2012). The nurses received an explanation of the study, were given a letter of
informed consent to read, were given a demographic questionnaire to fill out, and were
told their HHA would be monitored. So they were certainly aware that their hand hygiene
adherence was to be observed. The Hawthorne Effect was monitored during the
observation periods. The Hawthorne Effect is related to the effect of experimental
arrangements in which participants alter their responses or performance when they are
aware they are being involved in a study (Bieger & Gerlack, 2012). It was believed,
however, that the nurses could not sustain an altered hand hygiene rate and would revert
back to their inherent hand hygiene habits within a couple of hours.
A threat to external validity was also observer bias. I was very careful with how I
worded my explanation. I wanted the nurses to participate but needed to word the
explanation in such a way that they did not feel pressured to participate and did not feel
obligated to change their hand hygiene behavior. Wanting the ICUs to be successful with
high hand hygiene rates, I also had to be careful not to observe just positive behavior or
only those nurses who exhibit higher rates of adherence.
Internal validity refers to the extent to which the results of the analysis were a
function of the demographic variables that were measured or observed in this study. With
internal validity, it was necessary to look at the samples from each of the five ICUs and
determine where they might differ. Threats to the internal validity could be due to the

181
occurrence of a historical event that would alter the outcome or the results of the study
(Bieger & Gerlack, 2012). There were no historical events that occurred during the
observation period of the 5 ICUs. It was possible that a major event at a particular
collection site might affect the score and the results of that particular hospital, but since
these hospitals were so widely dispersed, it was unlikely that an event in one would affect
the others. No major events occurred within any of the collection sites during the data
collection period. Previous history could affect the study such as an intervention on
increasing hand hygiene within the month prior to data collection but there was no such
interventions made prior to data collection.
Maturation is also considered an internal threat but since the observational period
for each hospital site was less than a week, it was not felt that this would present as a
problem (Bieger & Gerlach, 2012). Presentation of the questionnaire and the consent
form might be considered an internal threat since it alerts the nurses that an observational
study was to be done and thus they could alter their behavior to what they thought was
more advantageous to themselves (Bieger & Gerlach, 2012). Another threat to internal
validity was the demographic questionnaire and the consent form. But since the consent
form was information only for the nurses (along with contact information) and only
demographic information was being gathered, this was not a concern (Bieger & Gerlach,
2012). Nurses could have decided they do not want to be observed due to fear of
repercussion from their supervisor or the hospital administration and this would have
affected the number of nurses being observed and thus the sample size of the
observations (Bieger & Gerlach, 2012) which could affect internal validity.

182
Threats or things that reduce the impact, credibility, or generalization of the study
results can also be called bias (Ayers, 2008). Selection bias has also been listed as an
internal threat in which age, ability, gender, or ancestry composition may alter the results.
Since hand hygiene adherence is supposed to be 100% regardless of age, gender, ability,
or ancestry composition, it was felt this particular potential threat was not valid in this
study. Standardizing the processes in all five of the ICUs could minimize threats to
internal validity. A large number of demographic variables were collected and this should
help to minimize internal threats from people dropping out of the study and selection
bias. By having the observation periods scattered out over several months, the threats to
internal validity from history and instrumentation were minimized. By choosing an
appropriate study design, this also helped to control internal validity threats (Bieger &
Gerlach, 2012). I feel this was done in the selection of multiple regression to analyze the
results. Selection bias should be at a minimum since all nurses are supposed to be 100%
adherent. Selection bias may exist if the director of ICU placed those nurses believed to
be more adherent in hand hygiene on the shifts of observation than if just a random
selection of nurses was assigned to work on the days of observation. Since all of the ICU
directors were highly interested in the rates of their ICUs, it is felt there was no
manipulation of the work schedules. Work schedules are usually set 2 to 4 weeks in
advance and the timing of the notification that observations would begin did not really
allow for a change in the work schedules.
Construct validity involved the validity of the inferences that can be made from
observing the nurses and linking their observed behavior to the healthcare environment

183
theory. If the results did show an association between the demographic variables and
HHA, this could then be supported by the concept that the six different environments
represented in the healthcare environment theory were all inserting an influence on the
HHA rates of the nurses. Further projection would be that in order for there to be a
meaningful and sustainable intervention to increase adherence rates, there needs to be
multimodal interventions in which the different environments will have to be addressed.
For example, in order for an intervention to work, the administrative environment will
have to support this initiative not only in words but also in their actions. The family
environment will be affected by age, gender, marital status, and number of children. The
work environment will be affected by the variables of age, gender, year of graduation
from nursing school, number of years of active practice, being a hospital employed nurse,
or an agency nurse, the degree program, country in which the nurse was born, country
from which the nurse graduated nursing school, and the number of years of living in the
United States. The church environment will be affected by the spiritual affiliation of the
nurse and perhaps by the marital status, the number of children, and family income. The
community environment will be affected by all of the things affecting the work
environment as a nurse flows back and forth from his/her community and the work
environment. The cultural environment may be affected by all of the other variables
being tested. Life is not a silo in which individual variables affect only a single
component of this person but is instead a complex, intertwined, interdependent mix of
variables affecting the outcome individually and in multiple, overlapping, and
intermeshed ways that can alter from situation to situation.

184
Threats to construct validity are poor study design, using new and untested
methods of measurement, and the person doing the measuring. Ways of controlling these
threats are to carefully design the study and have other students and committee members
critique the design. There is a formal review process for the dissertation in which
chapters are reviewed and approved before moving to the next part of the study thus
ensuing a good study design (Ayers, 2008).
Statistical conclusion validity is the degree to which any conclusions that are
drawn from the data are considered reasonable: Was there an association between HHA
and any of the demographic variables being tested. Threats to statistical conclusion
validity would be concluding there was an association when in fact there was not an
association or a Type I error. In conjunction, a threat would also be if a conclusion was
made there was no association when in fact, an association did exist or a Type II error.
Threats might also be a low statistical power, a violation of assumptions, and fishing for
results (Ayers, 2008). These threats can be corrected for by adjusting the error rate since
multiple hypotheses were tested, making sure data was correct and it was entered
correctly, increasing the power (currently set at 95%), using the most appropriate
statistical test, and making sure it was correctly performed (Ayers, 2008). Additional
threats might be that the instruments to be used are new and untested. Although my
instruments were new, they were tested by ICPs and friends for understanding and
clarity. The last threat might be observer inexperience. I did my own hand hygiene
observing. I am a registered nurse, have been an ICP for 18 years, and have been certified
in infection control three times. I have conducted overt hand hygiene surveillance on

185
multiple occasions as a function of my job as a hospital ICP as well as covert
observations. I also did covert hand hygiene surveillance in my hospital’s ICU for my
thesis study so I consider myself to be an experienced and reliable observer.
Ethical Procedures
Since I used hospitals as my data collection sites, I was in situations in which
patient information was overheard or seen although patient’s behavior and private health
information was not the focus of this study. Several hospitals asked for HIPAA
agreements to be signed as a protection for their patients and their employees and this
was done. Being in infection prevention for many years, it is fully understood the
importance of protecting patient and employee private information.
Human participants (nurses in the ICU units) of the 5 ICUs in this study were
asked to signify their willingness to participate by filling out their demographic
questionnaire and returning it to the principle investigator. By returning their filled out
questionnaire, it signified agreement that they granted permission for the answers on their
questionnaire to be linked to their HHA rate. Only aggregate data was reported to the
hospitals and for the dissertation results. Nurses were not subjected to any stress other
than what they encountered in their routine jobs. No additional responsibilities or tasks
were asked of them.
The target population was an educated adult population and was not considered
vulnerable in any way. Since this study was investigating the association of demographic
variables and HHA in the ICU nurse population, any nurse who was over 65 years of age
(a vulnerable population) or any nurse who might be pregnant (a vulnerable population)
186
were considered as a working ICU nurse and not as a member of a vulnerable population
group. Being able to fulfill the duties of an ICU nurse qualified them for this study as it
was not the pregnant nurse or the over 65 nurse that was being sought as the target
population. ICU nurses should be able to form an informed intelligent decision as to
whether or not they wish to participate in this study.
Information concerning the nurses’ names, his/her addresses, his/her social
security numbers, or phone numbers was not gathered. But because the demographic
questionnaire and the individual hand hygiene rates were linked to a particular number,
which identifies the nurse to his/her demographics and adherence rate, this study must be
considered confidential rather than anonymous.
Linking the data to a random number was a way of not using a person’s name or
other demographic identifying information in case of a breach of confidentially. All data
was entered onto my password-protected computer and entered into the SPSS program.
Because SPSS is not a common program, it is doubtful if many people would be able to
access the data. But if they should, the only information found would be connected to a
number and no other identifying demographics. ICUs were identified as Hospital A, B, C,
D, and E so the names of the hospitals were not mentioned in SPSS. If the data should be
breached, with no identifying links, the hand hygiene rates are simply a group of numbers
with no meaning and cannot be tied to a particular hospital or to a particular individual.
I have no ethical concerns related to recruitment materials or to processes. This
was a study in which nurses were observed in their daily duties just as they are observed
by their own hospital hand hygiene surveillance programs. Nurses have been observed

187
for many years and their rates recorded. The only requirements for this study was for the
nurses to listen to an explanation of the study, decide if they were willing to participate,
and to fill out and return the questionnaire on demographic variables. The questions were
considered non- sensitive since common information was being sought and nothing that
should cause them discomfort was included. There was also an option under each
question for the nurse to answer prefer not to answer should they consider any question
intrusive.
There were no ethical concerns related to data collection, as I was the only one
doing the data collection. It would have strengthen the study if an additional observer was
used to validate my data, but the agreement with the ICPs was that no additional
assistance would be needed from them during the data collection periods. With the
workload carried by the ICP and their department, it would be a hardship for them to
dedicate 8 hours a day for four days, possibly more. Hiring someone to assist me was not
economically possible since two of the hospitals are not located close by and the expense
of transportation, hotel accommodations, and meals for a second person would be cost
prohibitive. If a large number of nurses had not agreed to participate, this would have
affected selection bias, but ethical concerns were not an issue.
Data collected was HHA rates on individual nurses. However, when data was
disseminated to the hospital, it was aggregate information only. In Chapters 4 and 5 of
the dissertation, only aggregate data was reported although it was based on individual
rates. Any material submitted for publication will only be in the aggregate form. The
individual nurse had access to their individual HHA rate should they request but no

188
requests were made. Contact information was provided in the consent form. A copy of
the consent form was distributed for each nurse to keep. The only other sources of data
distribution were to the participating hospitals, in Chapters 4 and 5 of the dissertation,
and in a future published article(s) on this study. This data will be stored on my personal
computer in my home, which is password protected and accessible to only myself. Data
will be kept for a minimum of five years according to Walden University. At the end of
the five-year period, which will be defined as five years from the approval of the
dissertation by the Chief Academic Officer of Walden University, this data will be
deleted from my computer and from the SPSS database.
There were no additional ethical issues because I have no affiliations with any of
the data collection sites other than friendships with the ICPs. I have no financial interests
in any of the hospitals being used as the data collection sites. No monetary rewards or
incentives were given to me by any of the data collection site hospitals and there were no
monetary reward or incentives given to the hospitals in exchange for letting me use their
facilities as a data collection site. I do not work for any healthcare company making
and/or selling products that would be used in hand hygiene. Because I am not working at
any of these hospitals, there were no power differentials so the ICU nurses were not
pressured in any way to participate.
Summary of Design and Methodology of the Method of Inquiry
In Chapter 3, the independent demographic variables and the dependent variable
of HHA were presented along with a discussion of possible mediators and moderators.
The research design for this study was a quantitative, cross-sectional, prospective, direct

189
observational study with a convenience sample of ICU nurses (Creswell, 2009). Because
this was an overt observational study, descriptive and inferential statistics were presented
in the analysis.
The total population, subpopulations, and target population of the ICU nurses
were discussed. Under the section of Sampling and Sampling Procedures, each of the
four data collection hospitals were discussed as to how they were recruited and the
requirements set by the hospitals for approval.
G*Power was used to do the power analysis (IBM Corp., 2013). A priori sample
size of 613 observations (includes 10% expected missing data) was determined to be
appropriate for each hospital with a total sample of 3,065 sought for all 5 ICUs. The
rational for using the 15 demographic variables was also made, both mathematically and
because variables were used in conjunction with other variables to fully understand what
was happening with the dependent variable. An alpha level of 0.05, a power of 95%, and
a small effect size of 0.1 were chosen for analytical purposes.
Data collection was by overt direct observation of the ICU nurses as they entered
and exited patient rooms and if they were or were not adherence with hand hygiene.
Observational periods were defined and discussed under Data Collection. A coding
system of using numbers instead of the nurses’ names was discussed. The three
instruments used and how they were developed was explained under the Researcher
Instruments section.
Operationalization of the variables was elaborated upon with definitions of each
of the variables given, how they were measured and scored, and how missing data was

190
coded. The data analysis plan was to use SPSS for data storage, for descriptive analysis,
and for the multiple, logistic regression, and binary logistic regression analysis. Research
questions and hypotheses were presented in the section, Research Questions and
Hypotheses, as well as the purpose statement and the problem statement. Threats to
validity, both internal and external were explored as well as construct validity and
statistical conclusion validity. Because of the differences of the 5 ICUs, generalization of
this study should be facilitated. Multiplicity testing was discussed due to the coordination
of several of the variables.
Ethical concerns were discussed in the section entitled Ethical Procedures.
Application was made to the Walden University IRB for approval of this study.
Application was made and approval granted from the individual IRBs of three of the
hospitals as well as approval for the study by the Walden IRB. Approval from these IRBs
and the Walden IRB gave affirmation that this was an ethical study. It was the intent of
this study to identify which variables were associated with HHA in an effort to design
better interventions to increase hand hygiene.
During the writing of Chapters 4 and 5, the proposal (Chapters 1, 2, & 3) was
reviewed. Duplications were deleted, references were added for the second half of 2015
and for 2016. A few sentences and paragraphs were added for clarification.
Findings and results of the data analysis are reported in Chapter 4. Chapter 5 deals
with the interpretation of the data analysis and recommendations for further research.

191
Chapter 4: Results
Review of Purpose, Research Questions, and Hypotheses
Originally the sole purpose of this study was to investigate the association
between the 15 demographic independent variables and the consistency of HHA among
the ICU nurses, the dependent variable. But after completing the hand hygiene
surveillance, it became apparent that new information had been generated and the results
were as clinically significant as the results on the variables. Therefore, Chapter 4 was
divided into two sections of results: the findings from the hand hygiene surveillance and
the findings from the association of the variables with hand hygiene.
The research design for this study was a quantitative, cross-sectional, prospective,
direct overt observational study with a convenience sample of 64 ICU nurses (Creswell,
2009). Because the design of this study was for the demographic variables of individual
nurses to be linked to their individual HHA rate, it was necessary to conduct a direct
overt observational study in order to observe individual hand hygiene rates. Recording of
individual HHA rates of the ICU nurses with a direct linkage to their own demographics
is not the usual method of surveillance and was one of the unique features of this study.
The usual design does random sampling of all of the ICU nurses or other HCWs and then
aggregates data. Observing individual nurses to obtain HHA rates has been studied in the
literature (Cheng et al., 2011; Raboud et al., 2004).
The research questions and hypotheses were as follows:
1. What was the association between the HHA rates among ICU nurses and the
age of the ICU nurse? (Birth date was used to calculate age.)

192
H01 = There was no association between the hand hygiene adherence rates among
ICU nurses and his/her date of birth (age).
Ha1 = There was an association between the HHA rates among ICU nurses and
his/her date of birth (age). (Field, 2013; Polit & Beck, 2012).
This same format was followed for each of the independent demographic variables. The
15 variables investigated were (1) date of birth (age), (2) gender, (3) marital status, (4)
number of children, (5) family income, (6) year of graduation from nursing school, (7)
number of years of active nursing practice, (8) hospital employee or agency nurse, (9)
areas of previous nursing practice, (10) degree program (associate nursing degree,
diploma degree, BSN, masters of nursing or master in another field, PhD, DNP, (11)
country in which the nurse was born, (12) country from which nurse graduated nursing
school, (13) ancestry, (14) spiritual affiliation, (15) and number of years living in the
United States.
Chapter 4 includes a discussion of the data collection process. In trying to
moderate and adjust for any potential interference from the Hawthorne Effect, a specific
format was developed to deal with it. As a result, a measurement has been given to the
Hawthorne Effect. The Hawthorne Effect, the unique method used to adjust for it, and the
results found from this study are discussed under a separate heading.
The second section in Chapter 4 includes the results of the analysis of the
association of the variables and hand hygiene. Answers to the research questions will be
given in the section, Answers to the Research Questions.

193
Data Collection Methodology
Having received approval from the Walden IRB (approval number 03-09-16-
0327877) to begin data collection at the three hospitals that would be using their own
IRBs of Record, the contact person at each hospital was notified so amenable weeks
could be scheduled for the data collection. Data collection for the first three hospitals was
completed between March 21, 2016 and April 20, 2016. Data was collected at the fourth
hospital between August 01, 2016 and August 04, 2016. The goal for each ICU was to
gather a sample size of 557 hand hygiene opportunities (HHOs) plus adding a 10%
margin to adjust for any missing data, yielding a total sample size of 613 HHOs for each
facility. This sample size was generated from an alpha of 0.05, a medium effect size of
0.3, and a power of 95% using the G*Power 3.1 calculator. The sample size of 613 HHOs
times 5 ICUs yields a total theoretical sample size of 3,065 HHOs. In reality, there was a
total of 3,620 HHOs recorded for the 5 ICUs. A total of 64 nurses participated in the
study returning all 64 demographic questionnaires and their HHA rates recorded as they
entered and exited patient rooms.
The methodology of 8 hour continuous data collection per day for 4 days was chosen
because it was the quickest way to obtain the desired sample size of 613 HHOs. Past
personal experiences with hand hygiene observations have yielded approximately 20
opportunities per hour with the literature average yielding 18 observations per hour
(Cheng et al., 2011; Pittet, 2001; Rabound et al., 2004; WHO Guidelines: First Global
Patient Safety, 2009). Observing the 5 ICUs yielded 18 days of observation, multiplied

194
by 8 hours per day or 144 hours of observation for an average of 25.14 HHOs per hour
(range 17.22 – 37.13 HHOs per hour).
The observation period each day consisted of continual observation from 7:00am
to 12:00 noon, a half-hour break for lunch, with continual observation resumed
at12:30pm and ending at 3:30pm. Bathroom breaks were as needed and no more than 1-2
breaks were taken per day. Since the staff bathroom facilities on each ICU were made
available, this could be accomplished in about 5 minutes per break. Lunch was taken in
the nurses’ break rooms.
Prior to starting the surveillance week, a flyer that could be posed in the nurses’
break room or around the ICU was sent to each contact person announcing a research
study was going to be conducted in their ICU, on their designated week, and as a
voluntary study for the ICU nurses. A brief description of the study was given and
contact information of the PI was provided. This proved to be helpful as most nurses had
read the flyer and were aware someone was coming when the observation week actually
began.
Part of the original plan was to visit each of the ICUs on the Sunday afternoon
preceding the observation period, explain the study to the ICU nurses, distribute the
packets, ask them to fill out the demographic questionnaire if they wished to participate,
and return the packet to me in the provided envelope by the next morning. If they did not
wish to participate, I asked them to place the blank questionnaire in the envelope and
return to me. Because most of the nurses who worked the weekend did not work on
Monday, this strategy was not successful and was abandoned after the first attempt.

195
Discrepancies of Data Collection
Although an explanation of the study was provided to the nurses and the
opportunity was given for all nurses to participate, it was quickly apparent that if some
nurses taking care of patients on one hallway and some nurses working on another
hallway volunteered, it would not be physically possible to monitor nurses in different
locations. A cluster of patient rooms was needed.
An alternative strategy to the original plan was then adopted. A brief explanation
was given to the nurse individually or in small groups with an opportunity to ask
questions. All questions were answered and nurses were asked to participate. Packets
were then given to those nurses who chose to participate and it was these nurses who
wore the research badges. This allowed for a more controlled process. After one nurse
volunteered, nurses who were caring for patients in adjacent rooms were approached and
asked to participate. Of all of the nurses who were approached, only five declined to
participate and one of these self-volunteered 2 days later. One nurse asked that data not
be collected on their hand hygiene a second day but no request was made for data
collected on the first day to be withdrawn from the study.
Some participating nurses chose not to wear their badge but having checked the
numbered badge in their packet, I knew which number to assign to them and to record
their hand hygiene opportunities under that number. Most participants expressed pride
that they were participating in a research study and did not object to being identified as a
participant. One nurse requested she be allowed to keep her badge. Her patients had
inquired about the badge and she seemed pleased to share with them the badge identified

196
her as a participant in a research study. There also seemed to be a sense of pride
associated with the fact that their hospital was participating in a research study and they
could participate.
Patient/ nurse rosters were also made available by ICU management to facilitate
identification of possible recruitment candidates. The charge nurses, coordinators, and
management staff provided a great deal of support. It is felt that being a fellow RN
facilitated the relationship that was established between upper management, participating
nurses, and myself.
Obstacles to observations quickly became evident a few hours into the
surveillance. In some ICUs, gel dispensers were positioned not only outside the entrance
to the patients’ rooms, but also inside the rooms. One nurse told me she discovered she
tended to use the gel inside the room when she was entering the patient’s room and then
use the gel dispenser outside the room when she was exiting the room. With the container
inside the room, there was the possibility that positive HHA had been done even if the
nurse had not been observed to have gelled on the outside of the room when he/she
entered. But if it was not possible to determine if the nurse did gel or did not gel, this
opportunity was not counted.
It was possible to partially see inside some of the rooms. If the door was left
open, sometimes a reflection could be seen on the door and HHA could be confirmed.
However, if the nurse went into the room, shut the door, and then closed the blinds or
pulled the curtains, it became impossible to identify if hand hygiene had been done or
not, which again resulted in a missed opportunity. Although missed opportunities did
197
exist, they were not counted as part of the 613 HHOs that were recorded for the sample
size.
A second obstacle was people and equipment blocking the line of sight to the
patients’ rooms and to the nurses. This was particularly troublesome when rounds were
made and multiple HCWs occupied the hallways with rolling workstations.
Another obstacle was the reluctance of the nurses to volunteer when gathered
in a large group. They were much more receptive in small groups or individually.
An unexpected obstacle was people stopping to talk to me. Doctors, nurse,
visitors, and patients walking in the hallway were curious as to my presence. This was
particularly true the second and third day of observation. But while I was conversing with
someone, I was distracted and unable to record entrances and exits and the hand hygiene
behavior of the nurses again resulting in missed opportunities.
A fifth obstacle to data collecting was looking in the opposite direction when a
nurse was coming out or going into a patient’s room. The nurse would be outside of the
room and sometimes, it was not possible to discern if they had or had not done hand
hygiene, which resulted in a missed opportunity. Sometimes, hand hygiene could be
presumed if the nurse was drying hands with a paper towel, the hands looked wet or slick,
or if their back was to me and I saw the back of their arms moving, indicative of rubbing
their hands together.
Another unexpected obstacle was the acuity status of the patient. If the acuity was
extremely high, it would be a one-on-one situation. The nurse would go into the room
and stay for 30-45 minutes. This afforded only two to four hand hygiene opportunities
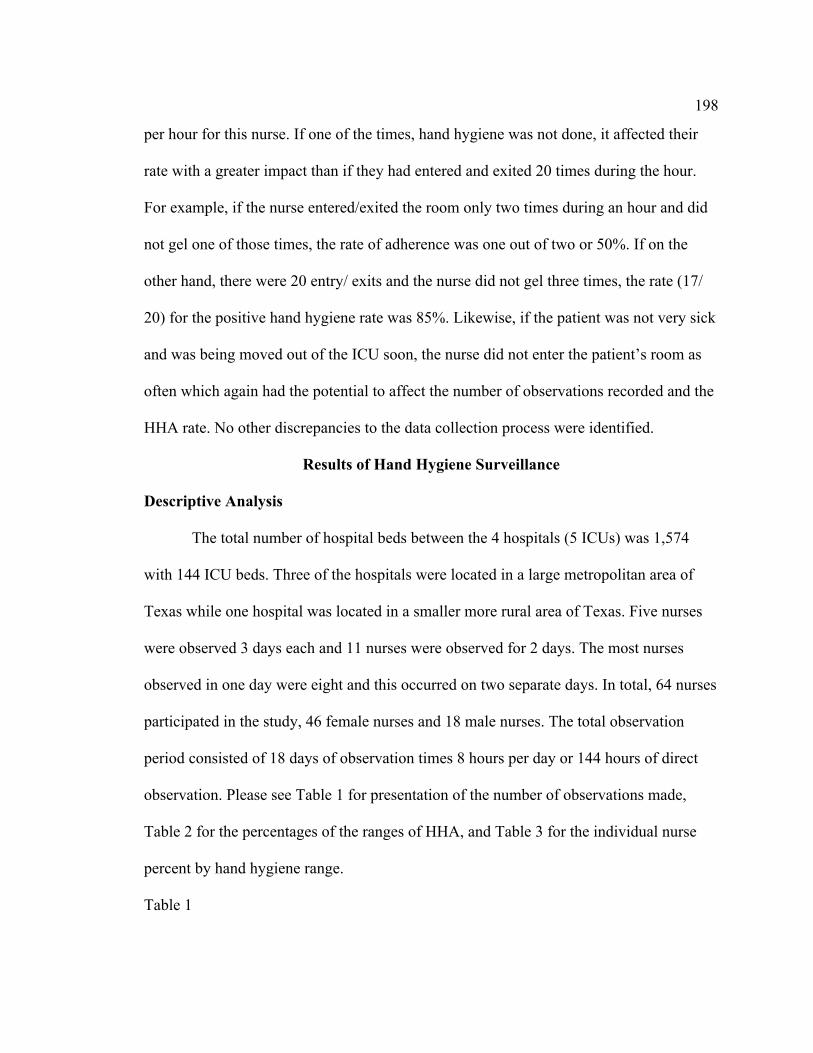
198
per hour for this nurse. If one of the times, hand hygiene was not done, it affected their
rate with a greater impact than if they had entered and exited 20 times during the hour.
For example, if the nurse entered/exited the room only two times during an hour and did
not gel one of those times, the rate of adherence was one out of two or 50%. If on the
other hand, there were 20 entry/ exits and the nurse did not gel three times, the rate (17/
20) for the positive hand hygiene rate was 85%. Likewise, if the patient was not very sick
and was being moved out of the ICU soon, the nurse did not enter the patient’s room as
often which again had the potential to affect the number of observations recorded and the
HHA rate. No other discrepancies to the data collection process were identified.
Results of Hand Hygiene Surveillance
Descriptive Analysis
The total number of hospital beds between the 4 hospitals (5 ICUs) was 1,574
with 144 ICU beds. Three of the hospitals were located in a large metropolitan area of
Texas while one hospital was located in a smaller more rural area of Texas. Five nurses
were observed 3 days each and 11 nurses were observed for 2 days. The most nurses
observed in one day were eight and this occurred on two separate days. In total, 64 nurses
participated in the study, 46 female nurses and 18 male nurses. The total observation
period consisted of 18 days of observation times 8 hours per day or 144 hours of direct
observation. Please see Table 1 for presentation of the number of observations made,
Table 2 for the percentages of the ranges of HHA, and Table 3 for the individual nurse
percent by hand hygiene range.
Table 1
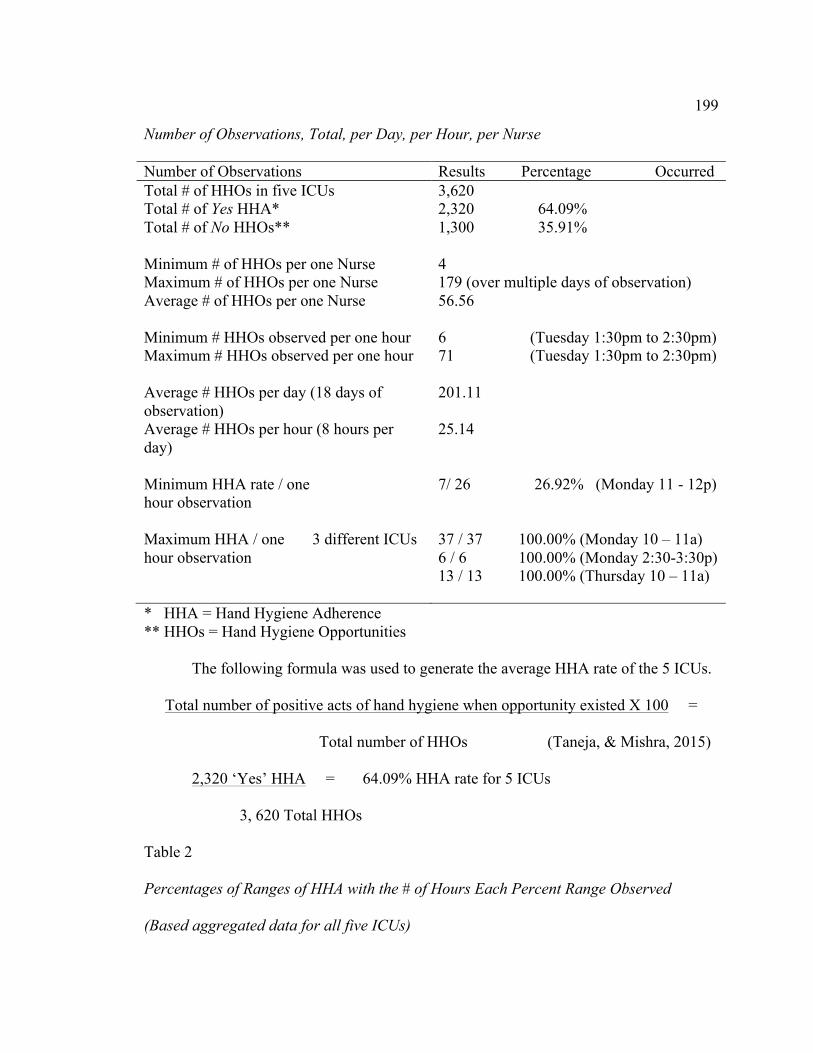
199
Number of Observations, Total, per Day, per Hour, per Nurse
Number of Observations Results Percentage Occurred Total # of HHOs in five ICUs Total # of Yes HHA* Total # of No HHOs** Minimum # of HHOs per one Nurse Maximum # of HHOs per one Nurse Average # of HHOs per one Nurse Minimum # HHOs observed per one hour
3,620 2,320 64.09% 1,300 35.91% 4 179 (over multiple days of observation) 56.56 6 (Tuesday 1:30pm to 2:30pm)
Maximum # HHOs observed per one hour 71 (Tuesday 1:30pm to 2:30pm) Average # HHOs per day (18 days of observation)
201.11
Average # HHOs per hour (8 hours per day) Minimum HHA rate / one hour observation Maximum HHA / one 3 different ICUs hour observation
25.14 7/ 26 26.92% (Monday 11 - 12p) 37 / 37 100.00% (Monday 10 – 11a) 6 / 6 100.00% (Monday 2:30-3:30p) 13 / 13 100.00% (Thursday 10 – 11a)
* HHA = Hand Hygiene Adherence ** HHOs = Hand Hygiene Opportunities
The following formula was used to generate the average HHA rate of the 5 ICUs.
Total number of positive acts of hand hygiene when opportunity existed X 100 =
Total number of HHOs (Taneja, & Mishra, 2015)
2,320 ‘Yes’ HHA = 64.09% HHA rate for 5 ICUs
3, 620 Total HHOs
Table 2
Percentages of Ranges of HHA with the # of Hours Each Percent Range Observed
(Based aggregated data for all five ICUs)

200
Range of HHA Percentage
# of Hours this range observed % of observation time this range occurred
20 – 29% 1 hour 0.69% 30 – 39% 6 hours 4.17% 40 – 49% 20 13.89% 50 – 59% 28 19.44% 60 – 69% 27 18.75% 70 – 79% 19 13.19% 80 – 89% 27 18.75% 90 – 100% 16 11.11%
Note. 81.24%% of the time, the HHA rate was above 50%. 43.05% of the time, the HHA rate was about 70%. 29.86%% of the time, the HHA rate was about 80%. 11.11% of the time, the HHA rate was above 90%. Table 3
Individual Nurse Percentage by Hand Hygiene Range
Range of HHA Frequency Percentage of Nurses 0 - 29% (Low Gelers) 4 6.3% 30 – 49% 11 17.2% 50 – 59% 60 – 69%
9 12
14.1% 18.8%
70 – 79% 11 17.2% 80 – 89% (High Gelers) 9 14.1% 90 – 100% (Super Gelers) 8 12.5%
Note. 49 of the 64 (76.56%) participant nurses maintained an average HHA rate > 50%. 28 of the 64 (43.75%) participant nurses maintained an average HHA rate > 70%. 17 of the 64 (26.56%) participant nurses maintained an average HHA rate > 80%. 8 of the 64 (12.5%) participant nurses maintained an average HHA rate of >90%. Individual rates per one hour of observation ranged from 0.00% HHA to 100.00% HHA. Aggregate data for all five ICUs.
In regards to missing data in this study, there were 64 participating questionnaires
each containing 15 demographic questions. Of the possible 960 responses (64 cases X 15
questions each), there were 11 missing answers: one did not provide which units had
been previously worked, two did not answer regarding their degree program, one did not

201
answer their spiritual affiliation, two declined to answer ancestry, one preferred not to
answer marital status, and four nurses preferred not to share their age. This yields a
percentage of 11 / 960 = 1.15% missing data.
Descriptive statistics are presented in the following tables for the hand hygiene
surveillance part of this study. Sums of participants, percentages of participation,
minimums, maximums, ranges, and averages (means) are presented. In looking for a
Hawthorne Effect, the paired samples t-test was used to compare the mean of the first two
hours with the mean of the last six hours of each day’s observation. Please see Table 4 for
nurse participation information, Table 5 for information concerning ages of the
participating nurses, Table 6 for information concerning the marital status of the
participating nurses, and Table 7 for information regarding number of children.
Table 4
Nurse Participation Information
Total Number Participants
Number Female Nurses
Number Male Nurses
Total # Nurses Employed in 5 ICUs
329 244 85
# Nurses in Study
64
46
18
% of Total # Nurses Participating
19.45% 18.85% 21.18%
# Nurses Working Day Shift
188 146 42
% of Nurses Participating from Day Shift
34.04% 31.51% 42.86%
Note. When considering the total population of all of the ICU nurses within the U.S. (Rappleye, 2015) and the world, the number of participating nurses is very low. The results demonstrated a sample of 46 female nurses (71.9%) and 18 male nurses

202
(28.1%) represented in this study. This is a much larger percentage of male nurses than what is represented in the state of Texas. In 2015, the percentage of male nurses in Texas was given as 9.98% (American Nurses Association, 2014; Minority nurse, 2015; Rappleye, 2015), which is higher than the national percentage of 8.57% (Rappleye, 2015).
Table 5
Age of Participating Nurses
Age Female RNs Male RNs Median age in 2000
(44.6 yrs)* 31 years 35 years
In this study: 2016 Median age 35 30 Mean age 36.51 34.47 years Minimum 24 23 Maximum 60 61
Mode 29, 35 26, 28, 29, 37 Note. Source- *Minority Nurse, 2015. Number of nurse participants = 60.
Table 6
Marital Status
Marital Status Percentage of Participants in each Category Single 23.4%
Cohabitating 9.4% Married 54.7%
Common Law Marriage 1.6% Separated 1.6% Divorced 6.3% Widowed 1.6%
Preferred not to answer (Missing data) 1.6% Note. Number of nurse participants = 63.
Table 7
Number of Children

203
Number of Children Percentage of Participants Having Children 0 46.9% 1 1.8% 2 25.0% 3 7.8% 4 0.0% 5 1.6%
Note. Number of nurse participants = 64. Percent with children = 53.2%
In 2015, the mean salary for 75% of RNs was < $78,970 with 25% of RNs
reported to earn < $55,970 and 10% earned < $48,350 per year (Registered Nurse, 2015).
In this study, the gross family income was used as a marker of family wealth, not just the
RNs’ salary, but it was unclear from some entries if the amounts entered were for a single
individual or for a family. Income ranges were similar across all five ICUs. Please see
Table 8 for this information.
Year of graduation from nursing school along with the number of years of active
nursing practice were of interest in helping to determine if age or years of practice was
more influential in HHA. Areas of previous nursing practice also brought additional
information. Please see Tables 9, 10, and 11 for this data.
Table 8
Gross Household Income for This Study
Gross Household Income Percentages of Participants in this Study <$39,000 1.6%
$40,000 to $49,000 6.3% $50,000 to $59,000 7.8% $60,000 to $69,000 15.6% $70,000 to $79,000 6.3% $80,000 to $99,000 20.3%
$100, 000 to $149,000 28.2% $150,000 to $199,000 9.4%
> $200,000 3.2%
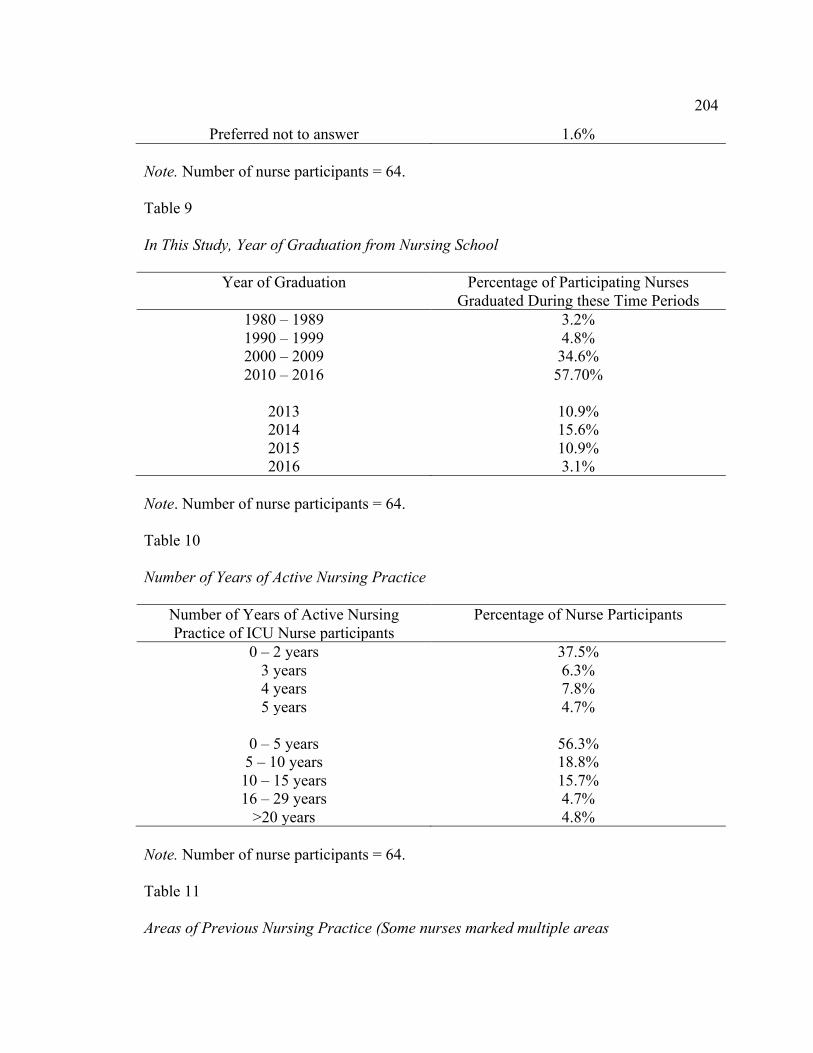
204
Preferred not to answer 1.6% Note. Number of nurse participants = 64.
Table 9
In This Study, Year of Graduation from Nursing School
Year of Graduation Percentage of Participating Nurses Graduated During these Time Periods
1980 – 1989 3.2% 1990 – 1999 4.8% 2000 – 2009 34.6% 2010 – 2016 57.70%
2013 10.9% 2014 15.6% 2015 10.9% 2016 3.1%
Note. Number of nurse participants = 64.
Table 10
Number of Years of Active Nursing Practice
Number of Years of Active Nursing Practice of ICU Nurse participants
Percentage of Nurse Participants
0 – 2 years 37.5% 3 years 6.3% 4 years 7.8% 5 years 4.7%
0 – 5 years 56.3% 5 – 10 years 18.8% 10 – 15 years 15.7% 16 – 29 years 4.7%
>20 years 4.8% Note. Number of nurse participants = 64.
Table 11
Areas of Previous Nursing Practice (Some nurses marked multiple areas

205
Area of Previous Nursing Practice Before Moving to ICU
Percentage of Participating Nurses
Only worked in the ICU 64.06% Medical/ Surgical Unit 14.06% Telemetry 14.06% Emergency Room 0.094% Transplant Unit, Medical Unit, OB, OR, Intermediate Care Unit, Neuro Unit, GI lab, Clinical Decision, & SNF/Rehab Unit
Less that 1.00% of the participating nurses had experience working
on one of these units. Note. Number of nurse participants = 63
The percentage of Associate Degree nurses was 38.7% while 61.3% of the
participating nurses had a Bachelor of Nursing Degree (BSN). Bachelor degrees in other
fields included a BS in Nutritional Sciences, BS in Advertising, BS in Biochemistry, BS
in Entrepreneurship, and a BS in Administration/Specialty in Public Health. One
participant had a master’s degree in nursing (MS) and two nurses were working on their
Nurse Practitioner degrees.
Data on the country in which the participating nurses were born is presented in
Table 12. Most of the nurses (81.3%) were born in the United States. Most participants
graduated from nursing schools in the United States (93.8%) with 6.3% graduating from
other countries. The most common ethnicities noted were Caucasian (White, Non-
Hispanic) at 35.5%, Hispanic at 30.6%, European at 9.7%, and Black at 11.29%.
Table 12
Country in which Participating Nurses were Born
Country in Which Nurse was Born Percentage of Participating Nurses from this Country
United States 81.3% Canada 1.6%
Central America 1.6% South America 1.6%

206
Africa 4.7% Asia 6.3%
Europe 3.1% Note. Number of participating nurses = 64
The results of the survey on spiritual affiliation is presented in Table 13.
Table 13
Spiritual Affiliation of Participating Nurses
Spiritual Affiliation of Participating Nurses Percentages of Participating Nurses Catholic 20.6% Baptist 14.3%
Nondenominational 9.5% Agnostic 7.9%
No Spiritual Affiliation 6.3% Atheism 3.2%
Note. Seventeen (17) different religions were represented. Denominator was 63.
The number of years the participating nurses were living in the United States is
presented in Table 14.
Table 14
Number of Years of Living in the United States
Number of Years of Living in the U.S. Percentage of Participants All my life, I was born here 78.1%
0 – 9 years 4.8% 10 – 19 years 10.9% 20 -24 years 3.1%
35 - >40 years 3.2% Note. Number of participating nurses = 64.
The results of the aggregated daily surveillance period is presented by the hour
and by the day in Table 15. The HHA rate of the first 2 hours of observation is presented
as is the HHA rate of the last 6 hours of observation. Total rates are presented as is the
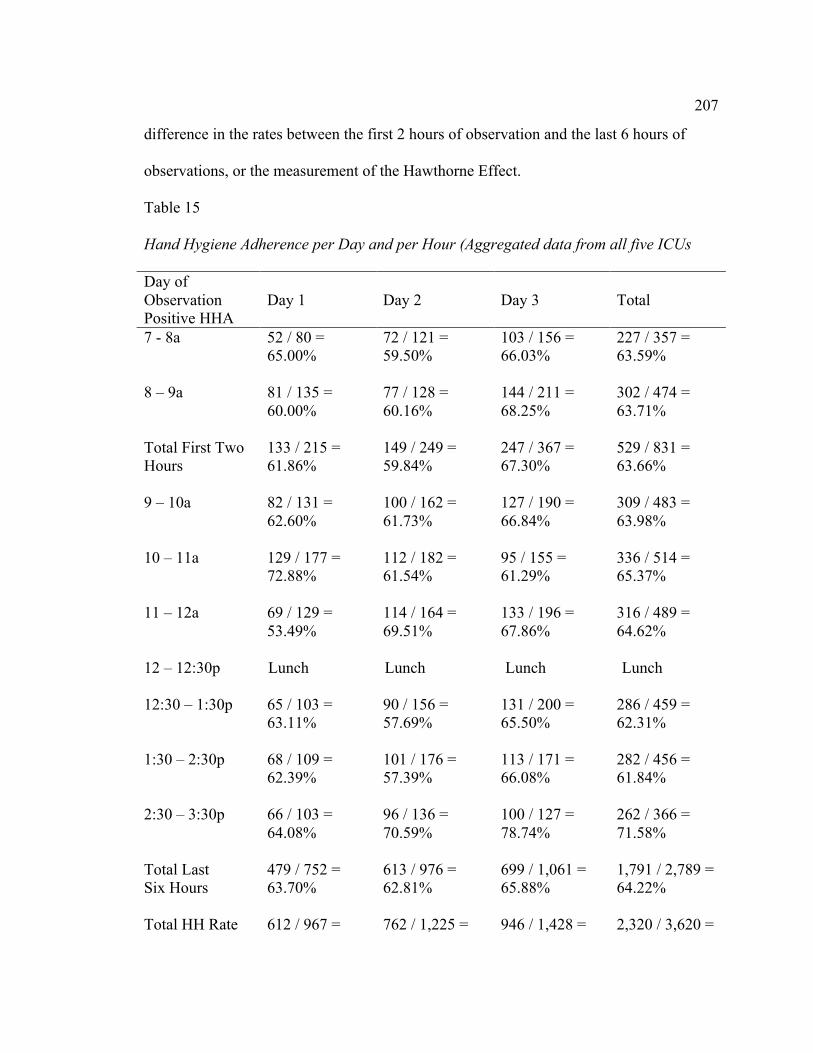
207
difference in the rates between the first 2 hours of observation and the last 6 hours of
observations, or the measurement of the Hawthorne Effect.
Table 15
Hand Hygiene Adherence per Day and per Hour (Aggregated data from all five ICUs
Day of Observation Positive HHA
Day 1
Day 2
Day 3
Total
7 - 8a
52 / 80 = 65.00%
72 / 121 = 59.50%
103 / 156 = 66.03%
227 / 357 = 63.59%
8 – 9a
81 / 135 = 60.00%
77 / 128 = 60.16%
144 / 211 = 68.25%
302 / 474 = 63.71%
Total First Two Hours
133 / 215 = 61.86%
149 / 249 = 59.84%
247 / 367 = 67.30%
529 / 831 = 63.66%
9 – 10a
82 / 131 = 62.60%
100 / 162 = 61.73%
127 / 190 = 66.84%
309 / 483 = 63.98%
10 – 11a
129 / 177 = 72.88%
112 / 182 = 61.54%
95 / 155 = 61.29%
336 / 514 = 65.37%
11 – 12a
69 / 129 = 53.49%
114 / 164 = 69.51%
133 / 196 = 67.86%
316 / 489 = 64.62%
12 – 12:30p Lunch Lunch Lunch Lunch 12:30 – 1:30p
65 / 103 = 63.11%
90 / 156 = 57.69%
131 / 200 = 65.50%
286 / 459 = 62.31%
1:30 – 2:30p
68 / 109 = 62.39%
101 / 176 = 57.39%
113 / 171 = 66.08%
282 / 456 = 61.84%
2:30 – 3:30p
66 / 103 = 64.08%
96 / 136 = 70.59%
100 / 127 = 78.74%
262 / 366 = 71.58%
Total Last Six Hours
479 / 752 = 63.70%
613 / 976 = 62.81%
699 / 1,061 = 65.88%
1,791 / 2,789 = 64.22%
Total HH Rate 612 / 967 = 762 / 1,225 = 946 / 1,428 = 2,320 / 3,620 =

208
63.29% 62.20%
66.25% 64.09%
Difference 1st 2 hrs & last 6 hrs
- 1.43%
-2.97%
1.42%
- 0.56%
Note. There was an aggregated HHA rate of all five ICUs of 64.09%. Minus indicates the rate was higher the last 6 hours.
Results of Data Collection for Hand Hygiene Surveillance
Data collection was done for 3-5 days at each of the participating ICUs, Monday
through Friday. The recorded hand hygiene rates per hour (aggregated data) for the five
ICUs follows. Data is displayed by day and by hour. The hourly data was the percentage
of positive HHA for that particular hour of observation over the total number of HHOs
made for that hour. Individual reports of the results for each individual ICU was given to
that ICU but were not shared with any other facility. Each ICU received only their own
data.
Figure 2 presents a chart showing the HHA rates per hour of the day. Patterns of
high HHA periods emerged during the daily observations.

209
Figure 2. HHA rate per hour of observation (aggregate data all five ICUs). Note. Horizontal time line indicates each hour of observation. Lunch was taken at 12:00pm until 12:30pm. Last three observation hours of 12.5-1.5p indicates 12.3 -1.30pm, etc.
Figure 3 presents a chart showing the number of positive and negative hand
hygiene opportunities that were collected on the first 3 days of observation. The
increasing number of observations may be contributed to more nurses being observed on
Tuesdays than on Mondays and more nurses being observed Wednesday than on
Tuesdays. As the week progressed, the nurses became more accepting of my presence
and were more willing to volunteer. The more nurses observed meant more hand hygiene
opportunities.
63.59% 63.71% 63.98% 65.37%
64.62%
62.31% 61.84%
71.58%
56.00%
58.00%
60.00%
62.00%
64.00%
66.00%
68.00%
70.00%
72.00%
74.00%
1 2 3 4 5 6 7 8
HHA Rate
7-‐8a 8-‐9a 9-‐10a 10-‐11a 11-‐12p 12.5-‐1.5p 1.5-‐2.5p 2.5-‐3.5p
HHA rates per hour
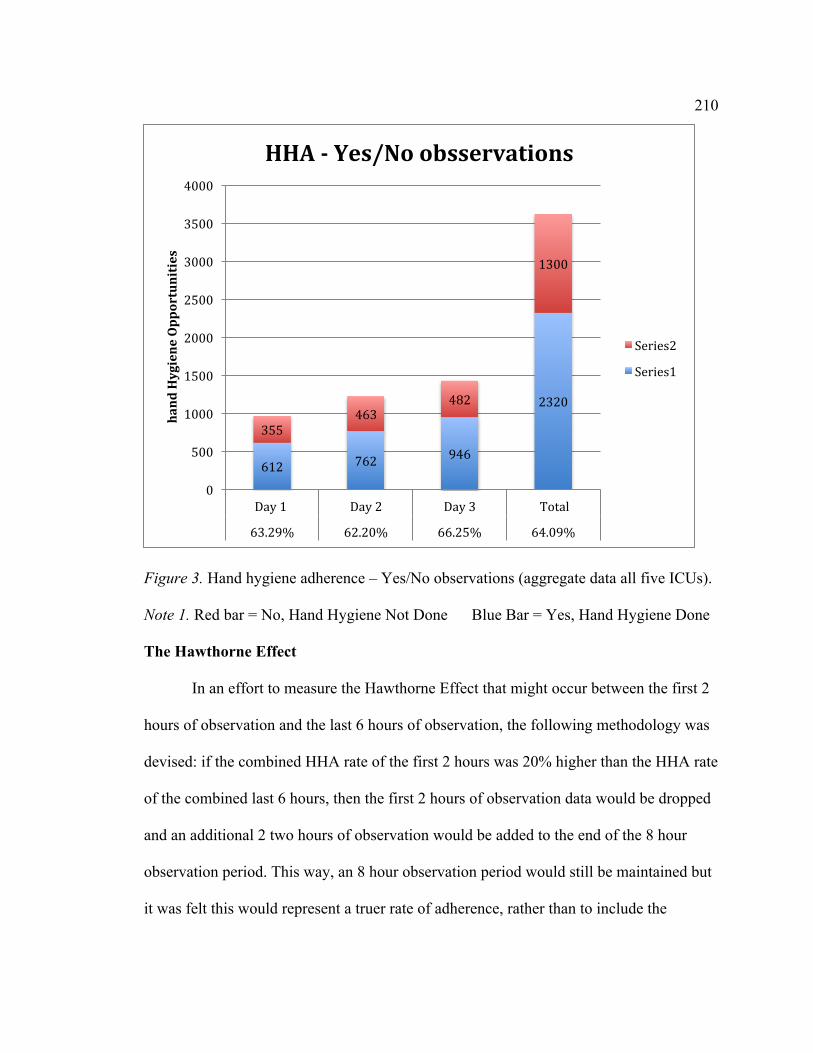
210
Figure 3. Hand hygiene adherence – Yes/No observations (aggregate data all five ICUs).
Note 1. Red bar = No, Hand Hygiene Not Done Blue Bar = Yes, Hand Hygiene Done
The Hawthorne Effect
In an effort to measure the Hawthorne Effect that might occur between the first 2
hours of observation and the last 6 hours of observation, the following methodology was
devised: if the combined HHA rate of the first 2 hours was 20% higher than the HHA rate
of the combined last 6 hours, then the first 2 hours of observation data would be dropped
and an additional 2 two hours of observation would be added to the end of the 8 hour
observation period. This way, an 8 hour observation period would still be maintained but
it was felt this would represent a truer rate of adherence, rather than to include the
612 762 946
2320
355 463
482
1300
0
500
1000
1500
2000
2500
3000
3500
4000
Day 1 Day 2 Day 3 Total
63.29% 62.20% 66.25% 64.09%
hand Hygiene Opportunities
HHA -‐ Yes/No obsservations
Series2
Series1

211
artificially high rates from the first 2 hours if elevated rates occurred. It was speculated
that as nurses became busier and more involved with their routines and patient duties,
their inherent hand hygiene behavior would replace an elevated elective hand hygiene
rate resulting from the overt direct observation and that any artificial higher rates could
not be sustained.
Measuring the Hawthorne Effect of subtracting the HHA rate of the last 6 hours
from the HHA rate of the first 2 hours yielded an overall difference in the rates of 3.70%
(range from individual days of observation 0.02% to 15.74%). In comparing the weeks’
averages for the difference between the first 2 hours and the last 6 hours, the range was
from a low of -4.72 % to a high of 5.55%. The minus indicates that the rate of the last 6
hours was higher than the rate of the first 2 hours. In this study, 12 of the days (66.67%)
observed had a higher HHA rate recorded for the first 2 hours of the shift with 6 days
(33.3%) recording a lower HHA rate for the first 2 hours than for the last 6 hours. During
all 18 days of observation, no data from the first 2 hours were required to be dropped due
to the 20% rule. HHA rates from the first two hours ranged from 36.84% to 90.11%
while rates for the last 6 hours ranged from 45.91% to 90.31%.
Despite the fact that nurses knew they were being observed, 23.4% of the nurses
recorded a HHA rate of less than 50.00% with 6.3% having a rate of less than 30.00%
and 3.1% had rates of less than 20.00%. Hourly overall rates of HHA ranged from 0.00%
to 100.00%. Table 16 presents the aggregated data from observation of the first 2 hours
and the last 6 hours along with the statistical significance.
Table 16

212
Comparing First 2 Hours of Observation with Last 6 Hours of Observation (Aggregate
data for all five ICUs)
Day of Observation
Rate of 1st 2 hours of observation
Rate of Last 6 hours of observation
Difference in rates between 1st 2 hours & last 6 hours
t-test (paired samples test) Alpha = 0.05
Day 1 61.86% 63.70% -1.43% t(4) = 0.133, p = .901
Day 2 59.84% 62.81% -2.97% t(4) = -.354, p = .741
Day 3 67.30% 65.88% 1.42% t(4) = 1.325, p = .256
Total 63.29% 62.20% 1.09% t(4) = -.163, p = .879
Note. Results indicate there was no statistically significant difference between the rates of the first two hours and the last six hours of observation for day one, day 2, day 3, or the weekly total.
Barriers to Hand Hygiene
Nurses carrying something in their hands (even a small single object such as a
syringe or a gauze package), talking on their spectra-link phones, donning rubber gloves
or personal protective equipment (PPE), and pushing or pulling workstations into or out
of patients’ rooms interfered with nurses gelling into and out of the patients’ room.
Pushing or pulling the workstations might be associated with carrying something in their
hands because of the physical handling of the workstation, thus engaging their hands.
Because all of these behaviors involve something to do with the nurses’ hands, these
actions seemed to interfere or block the routine of extending the arm to the gel dispenser
as the room was entered or exited. Using a paired sample t-test, these hand activities
were statistically significant as barriers to hand hygiene. Please see Table 17.
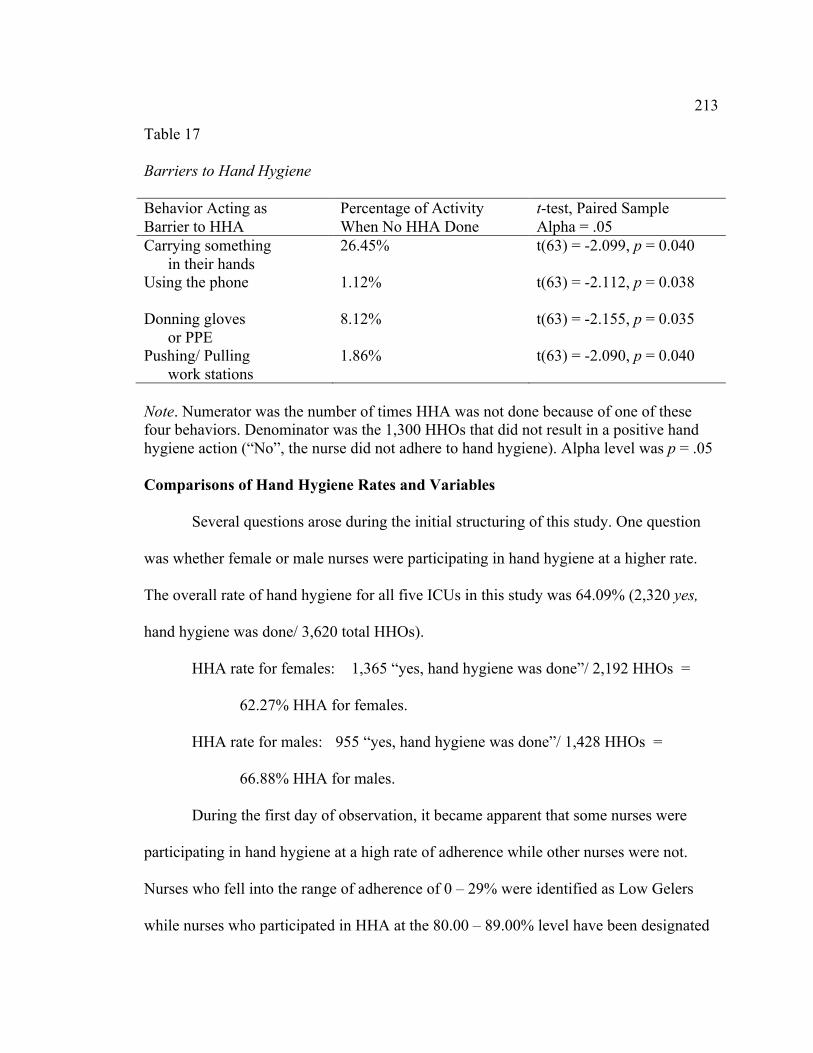
213
Table 17
Barriers to Hand Hygiene
Behavior Acting as Barrier to HHA
Percentage of Activity When No HHA Done
t-test, Paired Sample Alpha = .05
Carrying something in their hands
26.45% t(63) = -2.099, p = 0.040
Using the phone
1.12% t(63) = -2.112, p = 0.038
Donning gloves or PPE
8.12% t(63) = -2.155, p = 0.035
Pushing/ Pulling work stations
1.86% t(63) = -2.090, p = 0.040
Note. Numerator was the number of times HHA was not done because of one of these four behaviors. Denominator was the 1,300 HHOs that did not result in a positive hand hygiene action (“No”, the nurse did not adhere to hand hygiene). Alpha level was p = .05
Comparisons of Hand Hygiene Rates and Variables
Several questions arose during the initial structuring of this study. One question
was whether female or male nurses were participating in hand hygiene at a higher rate.
The overall rate of hand hygiene for all five ICUs in this study was 64.09% (2,320 yes,
hand hygiene was done/ 3,620 total HHOs).
HHA rate for females: 1,365 “yes, hand hygiene was done”/ 2,192 HHOs =
62.27% HHA for females.
HHA rate for males: 955 “yes, hand hygiene was done”/ 1,428 HHOs =
66.88% HHA for males.
During the first day of observation, it became apparent that some nurses were
participating in hand hygiene at a high rate of adherence while other nurses were not.
Nurses who fell into the range of adherence of 0 – 29% were identified as Low Gelers
while nurses who participated in HHA at the 80.00 – 89.00% level have been designated

214
as High Gelers. Those nurses who participate in HHA at the 90.00% to 100.00% range
have been labeled as Super Gelers.
In this study, male nurses had a higher overall HHA rate, a higher HHA rate
of participating in hand hygiene above the 50.00% adherence level, and a higher number
of High Gelers. Female nurses had a higher rate of HHA in the Super Geler category.
Please see Table 18 for a breakdown of adherence by gender.
Table 18
Comparison of Hand Hygiene by Gender
Gender Low Gelers
<29.00% 30.00% - 49.00%
50.00% - 79.00%
High Gelers 80.00% - 89.00%
Super Gelers 90.00% - 100.00%
Female Nurses
3 6.52%
10 21.74%
23 50.00%
4 8.70%
6 13.04%
HHA rate of >50.00% = 71.74% High Gelers & Super Gelers =21.74% Super Gelers= 13.04%
Male Nurses
1 5.56%
1 5.56%
9 50.00%
5 27.78%
2 11.11%
HHA rate of >50.00% = 88.89% High Gelers & Super Gelers = 38.89% Super Gelers = 11.11%
Note. 64 Participants: Female denominator was 46 participants; Male denominator was 18 participants.
One of the questions this study wanted to answer was if hand hygiene rates were
due to the age of the nurse or to the number of years of active nursing practice. This
question was raised because some people are now entering nursing as a second career o
after their children have been raised. So a nurse who is 50 years old may have been in
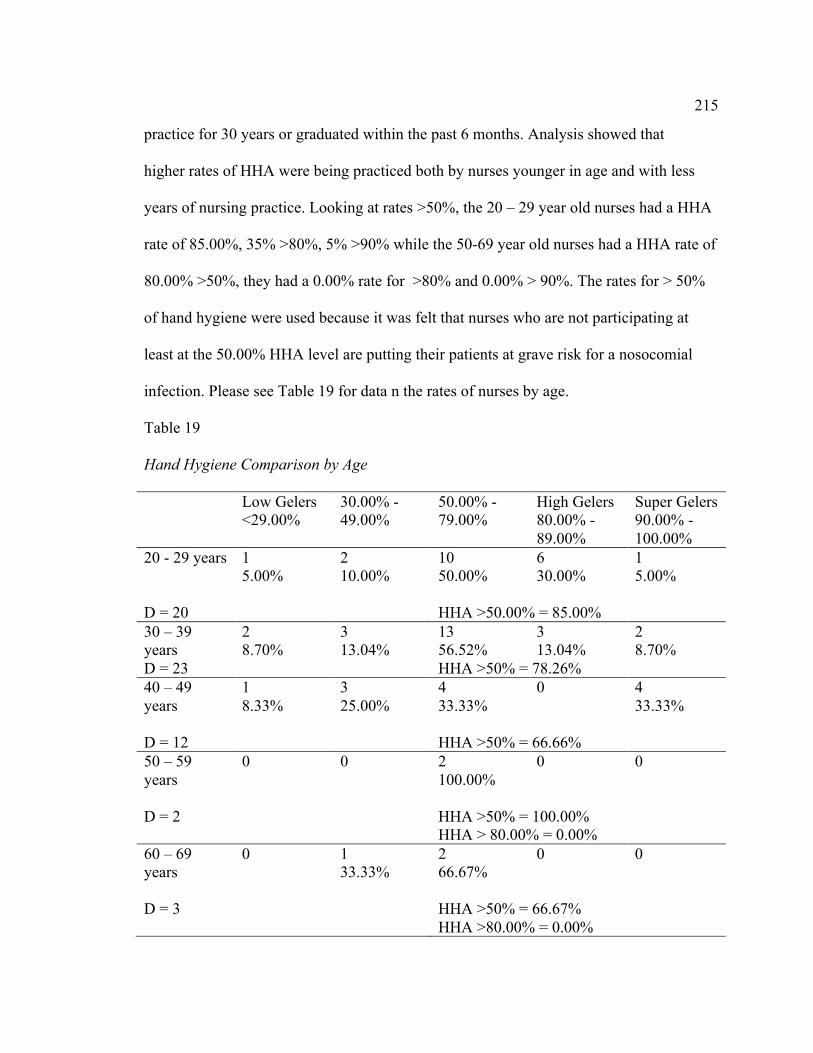
215
practice for 30 years or graduated within the past 6 months. Analysis showed that
higher rates of HHA were being practiced both by nurses younger in age and with less
years of nursing practice. Looking at rates >50%, the 20 – 29 year old nurses had a HHA
rate of 85.00%, 35% >80%, 5% >90% while the 50-69 year old nurses had a HHA rate of
80.00% >50%, they had a 0.00% rate for >80% and 0.00% > 90%. The rates for > 50%
of hand hygiene were used because it was felt that nurses who are not participating at
least at the 50.00% HHA level are putting their patients at grave risk for a nosocomial
infection. Please see Table 19 for data n the rates of nurses by age.
Table 19
Hand Hygiene Comparison by Age
Low Gelers <29.00%
30.00% - 49.00%
50.00% - 79.00%
High Gelers 80.00% - 89.00%
Super Gelers 90.00% - 100.00%
20 - 29 years
1 5.00%
2 10.00%
10 50.00%
6 30.00%
1 5.00%
D = 20
HHA >50.00% = 85.00%
30 – 39 years
2 8.70%
3 13.04%
13 56.52%
3 13.04%
2 8.70%
D = 23 HHA >50% = 78.26% 40 – 49 years
1 8.33%
3 25.00%
4 33.33%
0 4 33.33%
D = 12
HHA >50% = 66.66%
50 – 59 years
0 0 2 100.00%
0 0
D = 2
HHA >50% = 100.00% HHA > 80.00% = 0.00%
60 – 69 years
0 1 33.33%
2 66.67%
0 0
D = 3
HHA >50% = 66.67% HHA >80.00% = 0.00%

216
Note. Number of nurses participating = 60. Denominator was number of nurses in each age group, D=20, 23, 12, 2, and 3
In looking at the hand hygiene rates in regards to years of active nursing practice,
those with longer nursing careers tended to not be as adherent with HHA >50%. One to
two years of nursing practice had 76.92% to 81.82% HHA rates >50% while those nurses
with 11 to 32 years of experience had 61.54% to 66.67% HHA rates >50%. The older
nurse with more years of nursing practice are the groups which need reinforcement of the
importance of hand hygiene. Nurses with 5 – 9 years of nursing experience had the best
adherence >50% at 86.67%.
The comparison of hand hygiene by age is presented in Figure 4. Although nurses
in the 50-59 and 60-69 year brackets were 100% compliant with HHA >50%, there was
zero participation above the 79% range.

217
Figure 4. Comparison of hand hygiene by age.
Note. Blue bar = >50% participation; Pink bar = 80 – 89% rate, nurse is High Geler:
Green bar = >90% rate, nurse is Super Geler
Table 20 presents the data dealing with the HHA linked to the number of years of
active nursing practice. Better compliance with HHA was identified in the nurses with
fewer years of work experience.
Table 20
Hand Hygiene by Years of Active Nursing Practice
Years of active nursing practice
Low Gelers <29.00%
30.00% - 49.00%
50.00% - 79.00%
High Gelers 80.00% - 89.00%
Super Gelers 90.00% - 100.00%
1 yr 0 2 18.18%
5 45.45%
2 18.18%
2 18.18%
85.00% 78.00%
67.00%
100.00% 100.00%
30%
13%
0% 0% 0% 5% 9%
33%
0% 0%
20 -‐ 29 yrs 30 -‐ 39 yrs 40 -‐ 49 yrs 50 -‐ 59 yrs 60 -‐ 69 yrs
Percentage of hand hygiene
Comparison of hand hygiene by age
Series1
Series2
Series3

218
2 yrs 1 7.70%
2 15.38%
5 38.46%
3 23.08%
2 15.38%%
3 yrs 0 0 4 100.00%%
0 0
4 yrs 1 20.00%
1 20.00%
2 40.00%
0 1 20.00%
1-4 yrs 2
6.06% 5 15.15%
16 48.48%
5 15.15%
5 15.15%
1-4 years of nsg, HHA rate >50% =78.79%
5 – 9 yrs 0 2 13.33%
9 60.00%
4 26.67%
0
5-9 yrs of nsg, HHA rate >50% = 86.67%
11 – 17 yrs 2 15.38%
3 23.08%
6 46.15%
0 2 15.38%
11-17 yrs of nsg, HHA rate >50% =61.54%
22 – 32 yrs 0 1 33.33%
1 33.33%
0 1 33.33%
22-31 yrs of nsg, HHA rate >50% =66.67%
Note. Total denominator was 64 Participants. Denominators were number of nurses in each grouping of years of active nursing practice. 1 year, D=11; 2 years, D=13; 3 years, D=4; 4 years, D=5; 1-4 years, D=33; 5-9 years, D=15, 11-17 years, D=13; and 22-32 years, D-3. The data for the comparison of HHA by the number of years of active nursing
practice is also presented in a chart form in Figure 5.

219
Figure 5. Hand hygiene by years of active nursing practice. Note. Percentage of hand hygiene is percentage of nurses participating in a HHA rate greater than 50.00% There was also the question as to whether a nurse who was married would be
more responsible in regards to protecting their patient by participating in increased hand
hygiene. High Gelers were identified in single, cohabitating, and married nurses, but
only 6.67% of single nurses were identified as Super Gelers while 20.00% of the
married nurses participate >90% or were Super Gelers. Please see Table 21.
Table 21
Hand Hygiene Comparison by Marital Status
81.82% 76.92% 78.79%
86.67%
61.54% 66.67%
0.00%
10.00%
20.00%
30.00%
40.00%
50.00%
60.00%
70.00%
80.00%
90.00%
100.00%
1 yr 2 yrs 1-‐4 yrs 5 -‐ 9 yrs 11 -‐ 17 yrs 22 -‐ 32 yrs
Percentage of Hand Hygiene > 50%
Comparison of hand hygiene by years of
active nursing practice
Series1

220
Low Gelers <29.00%
30.00% - 49.00%
50.00% - 79.00%
High Gelers 80.00% - 89.00%
Super Gelers 90.00% - 100.00%
Single 0
4 26.67%
6 40.00%
4 26.67%
1 6.67%
D = 15 Evaluating rate of >50.00%, hand hygiene rate was 11/15 = 73.33%
Cohabitating 1 16.67%
0
4 66.67%
1 16.67%
0
D = 6 Evaluating rate of >50.00%, hand hygiene rate was 5/6 = 83.33%
Married 3 8.57%
6 17.14%
15 42.86%
4 11.43%
7 20.00%
D = 35 Evaluating rate of >50.00%, hand hygiene rate was 26/35 = 74.29%
Common Law
0
0 1 100.00%
0 0
Separated 0
0 1 100.00%
0 0
Divorced 0
1 25.00%
3 75.00%
0 0
Widowed 0
0 1 100.00%
0 0
Note. Denominator was number of nurses in each group
Does being a parent cause a nurse to be more cognitive of hand hygiene was also
a question of interest. Having children was significant at p = .000 when the dependent
variable was a percentage range of HHA using a paired sample t-test.
Table 22
Hand Hygiene Comparison by Number of Children
Low Gelers <29.00%
30.00% - 49.00%
50.00% - 79.00%
High Gelers 80.00% - 89.00%
Super Gelers 90.00% - 100.00%
0 children 2 6.67%
5 16.67%
15 50.00%
7 23.33%
1 3.33%
1 child 1 0 8 0 3

221
8.33% 66.67% 25.00% 2 children 1
12.50% 4 25.00%
6 37.50%
2 12.50%
3 18.75%
3 children 0 2 40.00%
3 60.00%
0 0
4 children No nurse recorded having four children
5 children 0 0 0 0 1 100.00%
Note. Denominator: no children = 30, one child = 12, two children = 16, three children = 5, and five children = 1
Analysis of areas of previous nursing practice revealed that 43/63 study
participants (68.25%) had only worked in the ICU. Other areas worked included the ER,
labor and delivery, OB, medical units, medical/surgical units, telemetry, and intermediate
care. High Gelers had worked only in ICU, medical units, and medical/surgical units.
Super Gelers had had experience only in the ICU, labor and delivery, and telemetry.
In looking at the gross household income in regards to HHA, please see the
following Table 23, Hand Hygiene Comparison by Gross Household Income.
In the review of hand hygiene in regards to the level of the nursing degree the RN
has, please see the following Table 24. Figure 6 depicts in a chart form the degree
programs and its association with HHA.
Table 23
Hand Hygiene Comparison by Gross Household Income
Low Gelers <29.00%
30.00% - 49.00%
50.00% - 79.00%
High Gelers 80.00% - 89.00%
Super Gelers 90.00% - 100.00%
< 59,000
0 2 3.17%
1 1.59%
2 3.17%
0
50,000 – 79,000
1 1.59%
2 3.17%
12 19.05%
2 3.17%
1 1.59%
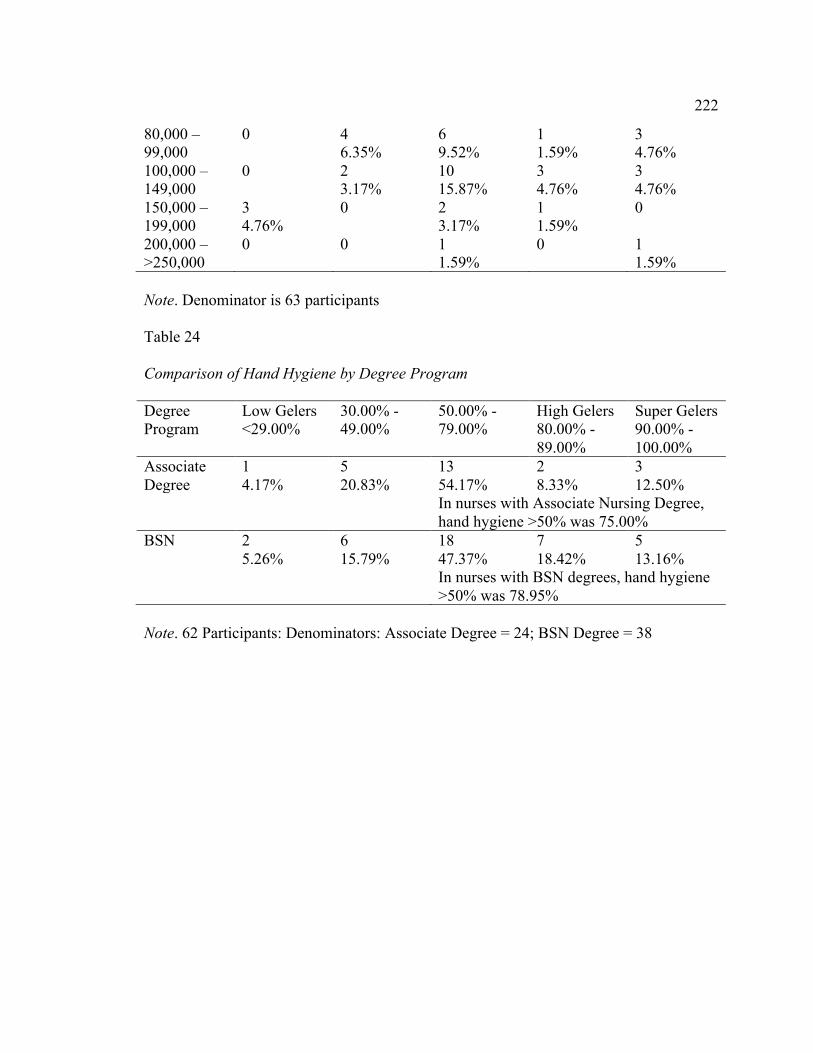
222
80,000 – 99,000
0 4 6.35%
6 9.52%
1 1.59%
3 4.76%
100,000 – 149,000
0 2 3.17%
10 15.87%
3 4.76%
3 4.76%
150,000 – 199,000
3 4.76%
0 2 3.17%
1 1.59%
0
200,000 – >250,000
0 0 1 1.59%
0 1 1.59%
Note. Denominator is 63 participants
Table 24
Comparison of Hand Hygiene by Degree Program
Degree Program
Low Gelers <29.00%
30.00% - 49.00%
50.00% - 79.00%
High Gelers 80.00% - 89.00%
Super Gelers 90.00% - 100.00%
Associate Degree
1 4.17%
5 20.83%
13 54.17%
2 8.33%
3 12.50%
In nurses with Associate Nursing Degree, hand hygiene >50% was 75.00%
BSN 2 5.26%
6 15.79%
18 47.37%
7 18.42%
5 13.16%
In nurses with BSN degrees, hand hygiene >50% was 78.95%
Note. 62 Participants: Denominators: Associate Degree = 24; BSN Degree = 38

223
Figure 6. Comparison of hand hygiene by degree program. Note. Blue bars = Associate Degree Program. Red bars = Bachelor of Nursing Program. Bars represent the percentage of degree nurses who participated in HHA at the >50.00% level. The results of the review of the country in which the nurse was born showed that
75.00% of the nurses born in the U.S. achieved a HHA rate of >50.00% while 83.33% of
the foreign born nurses achieved a HHA rate >50.00%. High Gelers were found in
23.08% of the nurses born in the U.S. and 41.67% of the foreign born nurses. Super
Gelers were identified among 9.62% of the nurses born in the U.S. and 25.00% of the
nurses born in foreign countries. Please see Table 25.
Table 25
Comparison of Hand Hygiene in Regards to the Country Where the Nurse was Born
Country in Low Gelers 30.00% - 50.00% - High Gelers Super Gelers
54.17
8.33 12.5
47.37
18.42 13.16
0
10
20
30
40
50
60
50.00 -‐ 79.00% 80.00 -‐ 89.00% 90.00 -‐ 100.00% Num
ber of Nurses in each category
Percentage of hygiene adhernce
Comparison of hand hygiene by degree program
Series1
Series2

224
which nurse born
<29.00% 49.00% 79.00% 80.00% - 89.00%
90.00% - 100.00%
United States
4 7.69%
9 17.31%
27 51.92%
7 13.464%
5 9.62%
HHA >50.00% = 75.00% High & Super Gelers = 23.08% Super Gelers = 9.62%
*Other country
0 2 16.67%
5 41.67%
2 16.67%
3 25.00%
HHA >50.00% = 83.33% High & Super Gelers = 41.67% Super Gelers born in countries = 25.00%
Note. * Other countries include Canada, India, Philippines, Kenya, Columbia, Bosnia, Cameroon, Mali, Nicaragua, and Estonia. 64 Participants: Denominators are 52 participants from the U.S and 12 participants from other countries.

225
Figure 7. Comparison of hand hygiene based on country in which nurse was born. Note. Blue bar = HHA rate greater than 50.00%.
Red bar = HHA rate between 80.00 – 89.00%. These are the High Geler nurses. Green bar = HHA rate between 90.00 – 100.00%. These are the Super Geler nurses.
To look at the hand hygiene rates according to ancestry of the nurse, all ethnic
categories were divided into four groups; Caucasian, Black, Asian, and Hispanic. There
were too few participants in the African and Black (born in America) groups to separate
them and have meaningful numbers. Please see Table 26.
Table 26
Comparison of Hand Hygiene with Ancestry of Nurse
75
83.33
23.08
41.67
9.62
25
0
10
20
30
40
50
60
70
80
90
Born in US Born country other than US
Percentge of hand hygiene > 50.00%
Comparison of hand hygiene based on country in
which nurse was born
> 50.00%
80-‐100%
90-‐100%

226
Ancestry of Nurse
Low Gelers <29.00%
30.00% - 49.00%
50.00% - 79.00%
High Gelers 80.00% - 89.00%
Super Gelers 90.00% - 100.00%
Caucasian 2 7 14 3 4
HHA rate above 50% = 70.00% High and Super Gelers – 23.33% Super Gelers – 13.33%
Black 0 0 4 3 0
HHA rate above 50% = 100.00% High and Super Gelers – 42.86% Super Gelers – 0.00%
Asian 0 1 0 1 3
HHA rate above 50% = 100.00% High and Super Gelers – 25.00% Super Gelers – 75.00%
Hispanic 2 2 13 2 1
HHA rate above 50% = 80.00% High and Super Gelers – 15.00% Super Gelers – 5.00%
Note. Caucasian = Caucasian-non-Hispanic: Canadian, European, Scandinavian. Denominator was 30; Black = African, Blacks born in US. Denominator was 7; Asian = Asian, Filipino, India. Denominator was 4; Hispanic = Caucasian-Hispanic; Latino. Denominator was 20. Total number of participants was 62

227
Figure 8. Comparison of hand hygiene by ancestry. Note. Percentage of HHA represents the percentage of nurses participating above the >50% level.
Nineteen different categories were marked in regards to religious affiliation. To
simplify looking at hand hygiene rates, these were reduced to four categories; no spiritual
affiliation, catholic, Christian based religions, and non-Christian based religions. Please
see Table 27 below.
Table 27
Comparison of Hand Hygiene with Spiritual Affiliation
Spiritual Affiliation
Low Gelers <29.00%
30.00% - 49.00%
50.00% - 79.00%
High Gelers 80.00% - 89.00%
Super Gelers 90.00% - 100.00%
No Spiritual Affiliation
3 27.27
1 9.09%
5 45.45%
1 9.09%
1 9.09%
HHA rate >50.00% HHA rate = 63.64%
70
100 100
80
23.33
43.86
25
15 13.33
0
75
5
0
20
40
60
80
100
120
Caucasian Black Asian Hispanic
Percentage of hand hygiene >50%
Comparison of hand hygiene by ancestry
>50.00%
80-‐100%
90-‐100%

228
D = 11up High Gelers & Super Gelers = 18.18% Super Gelers = 9.09%
Catholic 0 2 15.38%
9 69.23%
1 7.69%
1 7.69%
D = 13
HHA rate >50.00% HHA rate = 84.62% High Gelers & Super Gelers = 15.38% Super Gelers = 7.69%
Christian based
1 2.94%
8 23.53%
16 47.06%
5 14.71%
4 11.76%
D = 34
HHA RATE >50.00% HHA rate = 73.53% High Gelers & Super Gelers = 26.47% Super Gelers = 11.76%
Non-Christian based
0 0 0 2 50.00%
2 50.00%
D = 4
HHA rate >50.00% HHA rate = 100.0% High Gelers & Super Gelers= 100.0% Super Gelers = 50.00%
Note. No Spiritual Affiliation = None, Agnostic, Atheism. Denominator = 11
Catholic = Roman Catholic faith. Denominator = 13 Christian based religions other than Catholic = Assembly of God, Baptist, Christian, Church of Christ, Episcopalian, Evangelical, Jehovah’s Witness,
Methodist, Mormon, Non-denominational, Pentecostal, Seven Day Adventist. Denominator = 34
Non-Christian based religions = Buddhism, Islam, Judaism. Denominator = 4 Total Denominator = 62 participants. Figure 9 introduces the data that shows the comparison of hand hygiene by
religious affiliation. Non Christian religions exhibited higher HHA rates than the
Christian based religions. Those nurses with no religious affiliation recorded the lowest
HHA rates.

229
Figure 9. Comparison of hand hygiene by spiritual affiliation. Note. Blue bar = HHA rate >50.00%
Red bar = HHA rate between 80.00 – 100.00%, High and Super Gelers. Green bar = HHA rate between 90.00% and 100.00%, Super Gelers.
Results of Variables Analysis
Effect Size and Power
Using G*Power 3.1, a priori calculation using an alpha of 0.05, an effect size of
0.3, and a power of 95%, the sample size was calculated as 557 HHOs per ICU with a
10% margin added to achieve a sample size of 613 HHOs desired for each ICU. The
observations in the five ICUs yielded a total sample size of 3,620 HHOs, with 2,320
positive opportunities or hand hygiene was done. There were 1,300 negative
opportunities or times when hand hygiene was not done when it should have been. Now
that the true sample size is known, the power calculated through a post hoc analysis
11.29%
84.62% 73.53%
100.00%
3.23%
15.38% 26.47%
100.00%
1.61% 7.69% 11.76%
50.00%
0.00%
20.00%
40.00%
60.00%
80.00%
100.00%
120.00%
No AfIiliation Catholic Christian Based Non-‐Christian
Percentage of hand hygiene > 50.00%
Comparison of hand hygiene by
religious afLiliation
>50.00%
80-‐100%
90-‐100%

230
was 0.9999780 with an effect size of 0.1000003.
During the planning stages of this study, it was decided it was more important to
record more HHOs per nurse than to push to increase the number of nurse participants. A
combined total of 64 nurses from the five ICUs participated in this study. However, for
the regression analysis, the sample size of 64 may have been too few. If convention
dictates 15 cases or participants for each variable, then 15 participants X 16 variables =
240 participants would have been required. The 64 participants then represent only
26.67% of the sample needed. After two variables were dropped from the final analysis,
the number of cases or participating nurses would have been 15 participants X 14 (one
dependent variable and 13 independent) variables = 210 cases or 30.48% of the sample
required.
Justification for Final Model Variables
Based on the preliminary analysis of the model (Analyze à Correlate à
Bivariate), using all fifteen of the independent variables in the Independent Variables
Box and Options choice as Exclude cases pairwise, the Pearson correlation of the two
variables, year graduated from nursing school and number of years of active nursing
practice, was high at .958 [a level higher than .8 is considered to be a high level of
correlation] (Fields, 2005).
When step two was run using Analyze à Regression à Linear, using the
dependent variable of hand hygiene of the individual nurse as a percentage and using
all fifteen of the independent variables in the Independent Variables Box, the R square
was .267 or 26.7% of the hand hygiene rate was explained by the variables. This was not
231
a high level of influence meaning that 73.3% of hand hygiene was influenced and
explained by factors other than these demographic variables. P value was non-
significant at .526, confirming the non-influence. In this model, the VIF (variance
inflation factor) for “year graduated from nursing school” was 16.047 and the Tolerance
was .062. The VIF indicates a high level of multicollinearity and the Tolerance shows the
low influence of this variable. The variable number of years of active nursing practice
had a VIF of 14.785, showing a high level of multicollinearity with a Tolerance of .068,
again showing a low level of influence by this variable.
In considering which of these two variables should be dropped, in running the
Analyze à Regression à Linear, with each of these two variables used as the dependent
variable with the other fourteen independent variables keep in the Independent Variable
Box, the VIF for number of years of active nursing practice became 2.076 with a
Tolerance of .482. Year of graduation from nursing school becomes a VIF of 2.253 and
a Tolerance of .444. Because there was now a lower level of multicollinearity and a
higher Tolerance level for the variable number of years of active nursing practice, this
became the variable to retain and the variable year graduated from nursing school was
dropped from further analysis.
A second variable to be considered for elimination from the study was the
variable of hospital employee or agency nurse. In step one of the primary analysis, the
Pearson correlation ranges from -.190 to .168 showing a very low level of influence on
the hand hygiene rate of the ICU nurses. The VIF of this variable was 1.232 and the
Tolerance was .812 showing a high influence. But the sample mix was the area of

232
concern with this variable. In the 64 participants, only 4.7% of the nurses worked for an
outside agency while 95.3% of the nurses were employed by the hospital where they
were working. Based on the wide disparity between the two groups in terms of number of
participants, this variable was also eliminated from further analysis.
Multiple Regression Analysis
All eight assumptions of the test for multiple regression were met, including a
linear relationship with each of the independent variables, homoscedasticity,
multicollinearity, no significant outliers, and residuals were approximately normally
distributed (Lærd statistics, multiple regression, 2013).
Originally, the analysis plan was to run a logistic regression and have the
dependent variable dichotomous: hand hygiene, yes or no. But during the data collection
and analysis of the hand hygiene surveillance, it was realized that what was really desired
was a continuous dependent variable in which the numerator was the positive HHOs in
which the nurse did adhere to hand hygiene and the denominator was the total number of
HHOs recorded for that nurse. For each participant nurse, a hand hygiene rate was
calculated as a percentage in order to be able to compare rates by nurse and by hour of
observation. Because the dependent variable was changed to a continuous variable,
multiple linear regression was run instead of logistic regression.
In preparation for the final multiple linear regression, the dependent variable was
defined as the individual nurse hand hygiene rate as a percentage with the independent
variables being (1) date of birth (age), (2) gender, (3) marital status, (4) number of
children, (5) family income, (7) number of years of active nursing practice, (9) areas of

233
previous nursing practice, (10) degree program, (11) country in which the nurse was
born, (12) country from which nurse graduated nursing school, (13) ancestry, (14)
spiritual affiliation, and (15) number of years living in the United States. Numbers (6),
year of graduation from nursing school, and (8), hospital employee or agency nurse, were
dropped from variable list.
A multiple linear regression and correlation were run to investigate a possible
association between the hand hygiene rate of individual ICU nurses and the 13
demographic variables. Using the method of “Enter” to force all variables into the
equation, none of the independent variables were associated with an increase in hand
hygiene, R2 = .201, F(13, 44) = .854, p = .604, 95% CI [21.073, 98.816]. The p values in
all of the independent variables were above the significant level of p = .05, and therefore
all null hypotheses must be retained. The independent variables did not have an
association with the dependent variable of HHA in the individual ICU nurse. The
R2 value of 20.1% demonstrates a weak association between the hand hygiene rate of the
individual ICU nurses and the 13 demographic variables. Because of the high value of p
= .604 and the small influence of the 13 independent variables, no additional analysis
was attempted using multiple regression.
Although none of the variables showed significance to the dependent variable as a
percentage of the individual nurses’ rates, several of the variables showed significant
correlation with each other. Please see the following table (Table 28) for these figures.
Table 28
The p Value Results of Correlation of Variables to Other Variables (p=.05).
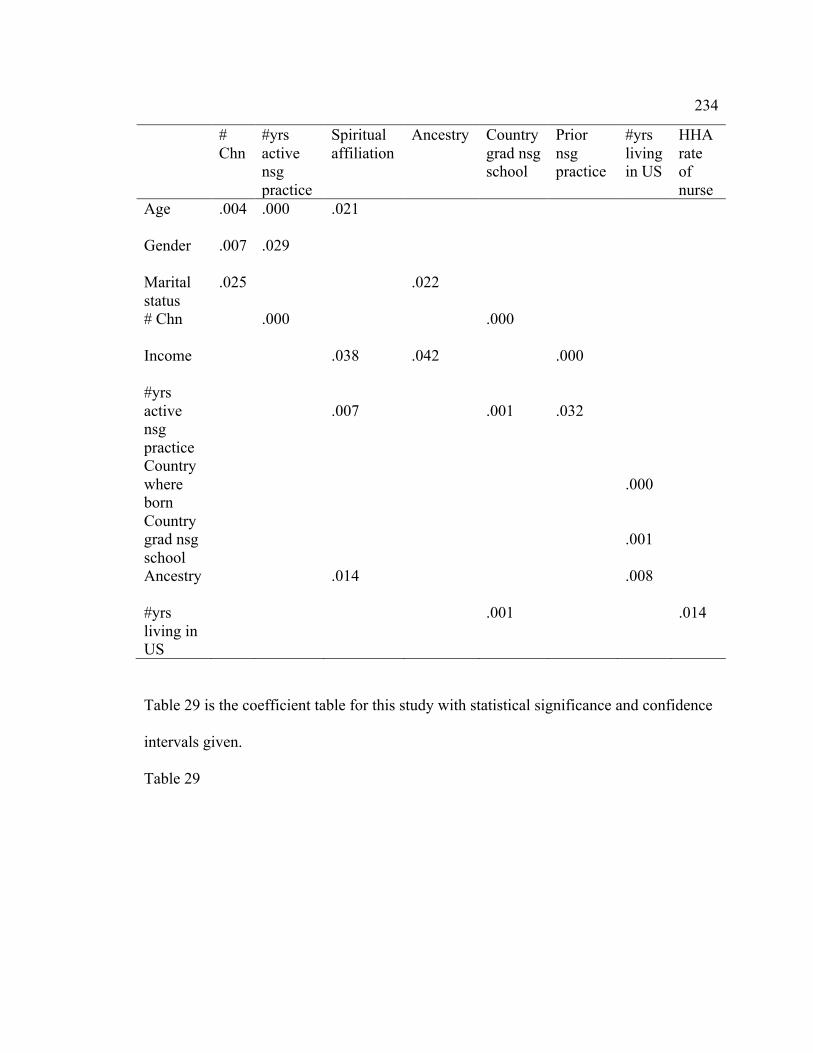
234
# Chn
#yrs active nsg practice
Spiritual affiliation
Ancestry Country grad nsg school
Prior nsg practice
#yrs living in US
HHA rate of nurse
Age
.004 .000 .021
Gender
.007 .029
Marital status
.025 .022
# Chn
.000 .000
Income
.038 .042 .000
#yrs active nsg practice
.007
.001
.032
Country where born
.000
Country grad nsg school
.001
Ancestry
.014 .008
#yrs living in US
.001 .014
Table 29 is the coefficient table for this study with statistical significance and confidence
intervals given.
Table 29

235
Coefficient Table
Independent
Variable
Beta T Sig. 95% Confidence Interval
Lower
Bound
Upper
Bound
Constant 3.108 .003 21.073 98.816
Age of nurse -.211 -1.228 .226 -1.308 .317
Gender .145 .963 .341 -7.773 22.013
Marital
Status
-.003 -.018 .986 -4.599 4.519
# Children .042 .241 .810 -6.015 7.651
Gross
income
-.035 -.213 .832 -1.897 1.534
# Yrs nsg
practice
-.121 -.628 .533 -1.747 .917
Prior nsg
practice
.173 1.071 .290 -.676 2.208
Degree
program
.037 .247 .806 -5.979 7.649
Country
nurse born
.028 .122 .904 -1.802 2.034
Country
grad nsg
school
.200 1.081 .286 -4.219 13.976
Ancestry .045 .274 .785 -.671 .882
Spiritual
affiliation
.255 1.586 .120 -.137 1.146
# Yrs living
in US
.179 .685 .497 -1.538 3.124
With the multiple regression analysis, because the confidence intervals of all of

236
the independent variables contain zero, the null hypotheses cannot be rejected and must
be retained (Miane, n.d.). Therefore, all of the null hypothesis of the independent
variables must be retained with there being no association between the independent
variable of HHA in the ICU nurses and the 13 demographic variables.
Answers to Research Questions
None of the p values in the multiple regression were significant. The null
hypothesis were accepted for all 13 of the independent variables tested. Chi Square was
also run for the categorical independent variables with the dependent variable of
individual hand hygiene percent range in which individual nurse HHA rates were divided
into ranges of 0-9%, 10-19%, 20-29%, etc. and the dependent variable of rate of HHA for
individual nurse <50.00% and >50.00%. The results of the Chi Square test also proved to
be non-significant for the categorical variables. Please see Table 30 for the results of this
analysis.
Table 30
Comparison of HHA with Two Dependent Variables using Chi Square
Independent Variable Pearson Chi Square Results HHA by % Range HHA by <50%, >50% Gender X(9) = 11.316, p = .255 X(1) = 2.121, p = .145 Marital Status X(63) = 44.988, p = .958 X(7) = 1.571, p = .980 Gross Household Income X(144) = 164.423, p = .117 X(16) = 16.956, p = .388 Areas of Previous Nursing Practice
X(72) = 61.871, p = .797 X(8) = 9.447, p = .306
Degree Program X(8) = 3.271, p = .916 X(1) = .131, p = .717 Country in Which Nurse Born
X(90) = 68.853, p = .952 X(10) = 6.879, p = .737
Country from Which Nurse Graduated Nursing School
X(27) = 21.956, p = .740 X(3) = 1.399, p = .706
Ancestry X(108) = 92.139, p = .862 X(12) = 12.222, p = .428 Spiritual Affiliation X(180) = 193.530, p = .232 X(20) = 16.891, p = .660

237
In testing the independent variables, which were scale variables, the paired
samples t-test was used. The dependent variable used was the HHA rate of individual
nurses dived into <50% and >50%. Please see the following tables for results of this
analysis, Tables 31 and 32. In this analysis, these three independent variables showed
significance, p = .000 for the number of years of active nursing practice, number of years
of living in the U.S., and the age of the nurse. The number of children was not significant
at p = .137.
When using the HHA rate for individual nurses in a percentage range, number of
children was statistically significant at p = .000; number of years of active nursing
practice was non statistically significant at p = .393; number of years of living in the U.S
was statistically significant at p = .000; and age of the nurse was statistically significant
at p = .000.
Table 31
Significant Relationships of Independent Variables using the Paired Sample t-Test with
Dependent Variable being the HHA Rate of Individual Nurse Divided into <50% and
>50%
95% Confidence Interval of the Difference
t
df
Sig. (2-tailed) Lower Upper
Pair 1
Number of Chn by Number - Individual Nurse HHA rate, <50%, >50%
-.076 .545 1.507 63 .137
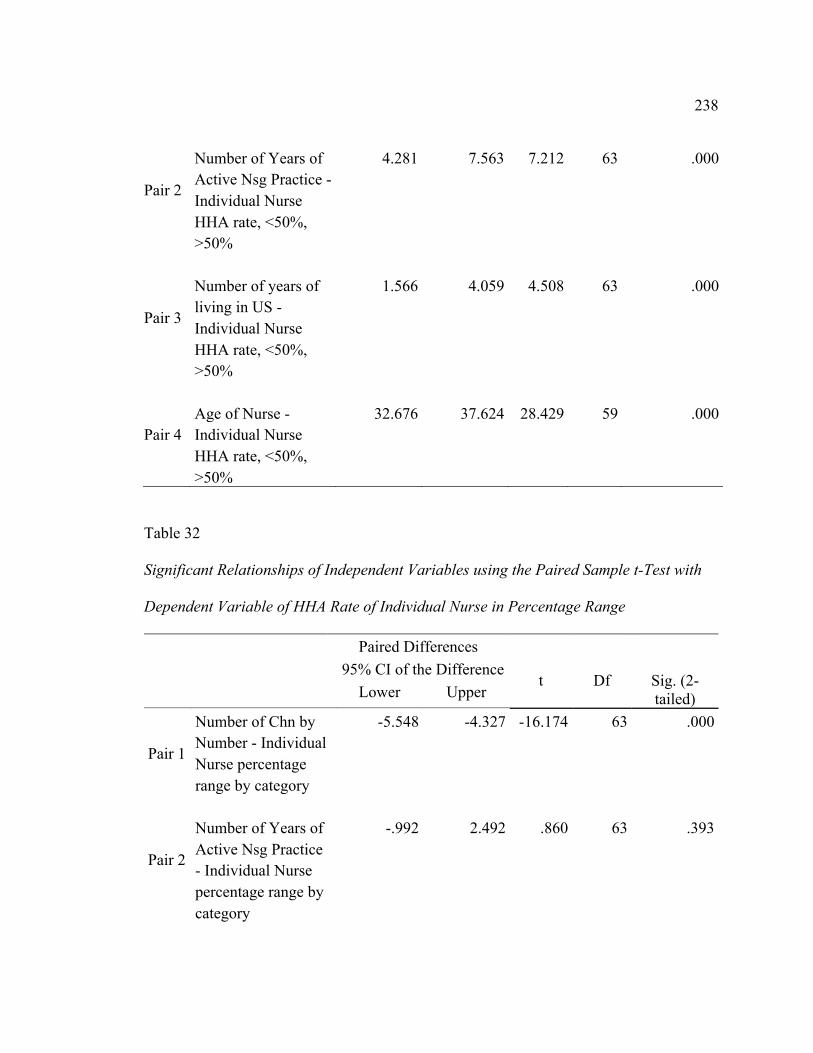
238
Pair 2
Number of Years of Active Nsg Practice - Individual Nurse HHA rate, <50%, >50%
4.281
7.563
7.212
63
.000
Pair 3
Number of years of living in US - Individual Nurse HHA rate, <50%, >50%
1.566
4.059
4.508
63
.000
Pair 4
Age of Nurse - Individual Nurse HHA rate, <50%, >50%
32.676
37.624
28.429
59
.000
Table 32
Significant Relationships of Independent Variables using the Paired Sample t-Test with
Dependent Variable of HHA Rate of Individual Nurse in Percentage Range
Paired Differences t
Df
Sig. (2-tailed)
95% CI of the Difference Lower Upper
Pair 1
Number of Chn by Number - Individual Nurse percentage range by category
-5.548 -4.327 -16.174 63 .000
Pair 2
Number of Years of Active Nsg Practice - Individual Nurse percentage range by category
-.992
2.492
.860
63
.393

239
Pair 3
Number of years of living in US - Individual Nurse percentage range by category
-3.589
-1.130
-3.834
63
.000
Pair 4
Age of Nurse - Individual Nurse percentage range by category
27.386
32.547
23.236
59
.000
The research questions and hypotheses are as follows:
1.What was the association between the HHA rates among ICU nurses and the
age of the ICU nurse? Multiple regression analysis showed there to be no association
between hand hygiene and age of the ICU nurse. The null hypothesis was retained.
However, the t-test analysis showed age to be significant, p = .000 when the HHA rate
was divided into percentage ranges and split into a <50% and >50% division. This makes
this variable reject the null hypothesis that there was no relationship between age and the
HHA rate of the individual nurse and accept the alternative hypothesis that there was an
association between age and HHA rates. It is felt that looking at the results of age and
HHA is clinically significant as this may affect where hand hygiene education should be
targeted. Age was also significant using percentages of HHA as dependent variable.
2. What was the association between the HHA rates among ICU nurses and
gender? The p value of the multiple regression was non-significant with retention of the
null hypothesis that there was no association between HHA and gender.

240
3. What was the association between the HHA rates among ICU nurses and their
marital status? Multiple regression showed the p value to be non-significant meaning
there was no association between the HHA rate of ICU nurses and their marital status;
thus the null hypothesis was retained.
4. What was the association between the HHA rates among ICU nurses and the
number of children they have? Multiple regression failed to show statistical significance
of the p value thus making it necessary to retain the null hypothesis that there was no
association between HHA rate and the number of children a nurse has. However, the
paired samples t-test for the HHA rate in percentage categories showed a p = .000 when
the dependent variable was a percentage range of HHA.
5. What was the association between the HHA rates among ICU nurses and the
gross family income of a nurse? Multiple regression results recorded a p = .832 thus
causing the retention of the null hypothesis that there was no association between HHA
and gross family income. The most common income was between $50,000 and $79,000
for 28.57% of the participating nurses. High Gelers and Super Gelers were identified
across all income brackets, but most were in the range of $80,000 to $149,000 gross
family income.
6. What was the association between the HHA rates among ICU nurses and the
year of graduation from nursing school? This variable was dropped from the final
analysis because of high multicollinearity with the variable years of active nursing
practice, which was retained.
241
7. What was the association between the HHA rates among ICU nurses and the
number of years of active nursing practice? The value of p = .533 makes this variable non
significant in the multiple regression analysis and thus the null hypothesis was retained
that there was no association between HHA and the number of years of active nursing
practice. However, in the paired samples t-test, using the dependent variable of <50% and
>50%, this variable was statistically significant, p = .000. This variable is also clinically
significant in that information has been gained so that hand hygiene education can be
targeted for the nurse who has been in practice for multiple years.
8. What was the association between the HHA rates among ICU nurses and being
a hospital employed nurse or an agency nurse? This variable was dropped because of the
low number of participants who worked for an agency (4.7%) in comparison to the
percentage of nurses working as a hospital employee (95.3%).
9. What was the association between the HHA rates among ICU nurses and areas
of previous nursing practice? The value of p = .290 was statistically non-significant for
the multiple regression analysis. The null hypothesis that there was no association
between HHA rate and areas of previous nursing practice was retained. Most of the
nurses in the sample had only worked in the ICU (68.25%). This turned out to be a
confusing variable because of how the question on the questionnaire was structured.
10. What was the association between the HHA rates among ICU nurses and their
degree program? The multiple regression analysis revealed a p = .806 thus retaining the
null hypothesis that there was no association between the HHA rate of the ICU nurse and
their degree program.

242
11. What was the association between the HHA rates among ICU nurses and the
country in which the nurse was born? The p = .904 was a statistically non-significant
value in the multiple regression thus causing the null hypothesis to be retained that there
was no association between the HHA rate of the ICU nurses and the country in which
they were born.
12. What was the association between the HHA rates among ICU nurses and the
country from which the nurse graduated? There was no association between the HHA
rates among ICU nurses and the country from which the nurse graduated, p = .286. This
null hypothesis was retained.
13. What was the association between the HHA rates among ICU nurses and the
nurse’s ancestry? The value of p = .785 was a statistically non-significant result causing
the retention of the null hypothesis that there was no association between HHA rates of
the ICU nurses and their ancestry or ethnic background. Having an Asian ancestry in this
study produced a greater participation in hand hygiene in the >50.00% group.
14. What was the association between the HHA rates among ICU nurses and the
nurse’s spiritual affiliation? The value of p = .120 reflects a statistically non-significant
result indicating the null hypothesis that there was no association between hand hygiene
and the spiritual affiliation of the nurse should be retained. Belonging to a non-Christian
religion such as Buddhism, Islam, or Judaism yielded the highest percentage of nurses
participating in HHA about the 50.00% level. However, this group had the smallest
number of participants so the results must be viewed cautiously.
243
15. What was the association between the HHA rates among ICU nurses and the
number of years a nurse has been living in the United States? The null hypothesis that
there was no association between HHA rates of the ICU nurses and the number of years
of living in the U.S. was retained due to the value of p = .497. In the paired samples t-
test, the p = .000 showed this variable to be statistically significant when the dependent
variable was both HHA <50%, >50% and the HHA was set in a percentage category.
(Field, 2013; Polit & Beck, 2012).
Summary
The results of the multiple regression analysis of the original study of determining
if there was an association between the dependent variable of HHA of the individual ICU
nurse and the independent demographic variables showed there to be no association
between the HHA rate of the individual ICU nurse and any of the 13 independent
demographic variables. However, in a paired samples t-test, the variables of age of the
nurse and the number of years of living in the US were statistically significant at p =
.000. The variable number of children was significant at the p = .000 level when the
dependent variable was the HHA rate of the nurse divided into percentage ranges. The
variable number of years of active nursing practice was statistically significant at a p =
.000 when the dependent variable was the HHA rate divided into <50% and >50%. It is
realized that this study was unique and significant in how the data was collected in a real
time prospective method concerning the hand hygiene surveillance.
Using a direct overt data collection system in which the nurses were asked to fill
out a questionnaire and were told their hand hygiene rates would be observed if they

244
agreed to participate in the study, provided a first time look at certain patterns that
emerged among the nurses. Observing some nurses for 8 to 24 hours provided an in-
depth perspective into HHA practices not investigated previously. How the Hawthorne
Effect was handled in this study was also a unique approach and for the first time has
been measured with a method other than comparing overt and covert hand hygiene rates.
The ideal ICU nurse would be a male nurse, aged 20 – 29 years, having children,
graduated within the past two years, born in a country other than the United States, being
of Asian ancestry, and belonging to a non-Christian religion.
Many of the results found in this study are in contrast to what has previous been
reported in the literature. Discussion and interpretation of the results of this study are
found in Chapter 5. Limitations of this study and suggestions as to how this study could
have been improved are mentioned along with recommendations for future studies.
Chapter 5 will also have a section on the theoretical framework and theory used for this
study. The impact on social change will be discussed in regards to the information gained
concerning HHA and demographic variables as well as the information gathered about
hand hygiene surveillance techniques and strategies.

245
Chapter 5: Discussion, Recommendations, and Conclusions
Purpose and Nature of the Study
This study provided a unique look at demographic variables and hand hygiene
surveillance. The variables of each nurse were tied directly to their own individual hand
hygiene rate. Only after this linkage was made was the data aggregated. Hand hygiene
rates were also recorded by individual hours of the day in a real time, prospective cross-
sectional direct observational study. Results of the hand hygiene surveillance were
tabulated giving hand hygiene rates in percentages for individual hours of the day with
hand hygiene rates of the nurses broken down into continuous and categorical ranges.
Hand hygiene rates were presented by age groups and by number of years of nursing
practice. Reasons for low adherence with hand hygiene as well as high adherence were
looked at. A unique method of dealing with the Hawthorne Effect was also used. A new
theory for use in infection control and in hand hygiene surveillance in the hospital setting
was also introduced in this study. All of this information will provide new insight into
nursing hand hygiene behavior.
The purpose of this study was to investigate if various demographic variables
were associated with the HHA rate of the ICU nurses. It was hoped that if an association
could be identified, sustainable and meaningful interventions could be designed to target
those nurses in that particular demographic group. It was another attempt to help solve
the problem of why HCWs are not 100% adherent with hand hygiene when not only are
their patients at risk for cross contamination and acquiring an HAI, but the nurses
themselves are at risk. With the emergence of new diseases, many being multidrug

246
resistant, the risk to the healthcare worker is increasing, making adherence to consistent
hand hygiene even more important.
Summarization and Interpretation of Key Findings
Many articles today report the average HHA rate of a facility so comparison of
rates can be made between hospitals and countries. Average HHA rate for the five ICUs
in this study was 64.09%. This rate can be compared to ICU rates of 60% in the United
Kingdom (FitzGerald, Moore, & Wilson, 2013), 70.7% in a study in Israel (Magnus et
al., 2015); 37.8% in Saudi Arabia (Mahfouz, El-Gamal, & Al-Azraqi, 2013); and 74% in
a German study (Wetzker et al., 2016). Using the room entry/ room exit method, a 2016
study in the U.S. reported a HHA rate of 55.0% for the ICUs and a 39.7% HHA rate in
the surgical/medical units (Chang et al., 2016).
HHA baseline rates for the U.S. have been listed as 51.3% for West Virginia
(Watson, 2016); 75.0% for Arkansas (Linam et al., 2016); and 72.7% for Texas (Midturi
et al., 2015). For comparison, a 2009 study in the U.S. listed the HHA rate as 26% in the
ICU (McGuckin, Waterman, & Govednik, 2009).
For this study, the aggregated overall HHA rate for these five hospital ICUs in
Texas was 64.09% with the HHA rate for female nurses being 62.27% and for male
nurses being 66.88%. For HHA over 50.00%, male nurses had 88.89% participation rate
while female nurses participated at 71.74%. More male nurses were identified as High
Gelers (38.89%) opposed to female nurses at 21.74%. For Super Gelers, more female
nurses fell into this group at 13.04% compared to male nurses at 11.11%.

247
Previous studies have shown female nurses to have higher HHA rates than male
nurses. A 2004 study in France showed female nurses at a 97.5% HHA rate with male
nurses being 90% (Moret, Tequi, & Lombrail, 2004). A study with 19 limited resource
countries in Latin America, Asia, the Middle East, and Europe recorded a HHA for
female nurses at 70% and for male nurses at 63% (Rosenthal et al., 2013). A study in
Columbia showed a rate of 77% for female nurses and 67% for male nurses (Barahona-
Guzmán, 2014). China recorded a rate of 64% for female nurses and 55% for male nurses
(Su et al., 2015). Only one article was found in which male nurses had a higher HHA
rate. A 2015 study in Brazil presented results of HHA for male nurses as 49% and for
female nurses as 38% (Medeiros et al., 2015). My results support Medeiros et al.’s (2015)
study.
In summarizing the finding of the association of the 13 independent demographic
variables studied (two of the original 15 demographic variables were dropped during
analysis) and the dependent variables of hand hygiene of individual nurses by percentage,
there was no association found using a multiple linear regression model for the analysis.
Using a Chi-Square table for the categorical independent variables and the dependent
variable of individual nurse percentage by range and individual nurse HHA of <50.00%
or >50.00%, again there were no associations found.
Using the paired sample t-test for the four scale variables, the three independent
variables of age of the nurse, the number of years of living in the U.S., and the number of
years of active nursing practice were statistically significant at p = .000 when run with the
dependent variables of individual nurse HHA rate divided <50.00% and >50.00%. The

248
independent variables of number of children, the number of years of living in the U.S.,
and the age of the nurse were statistically significant at the p = .000 level when the
dependent variable was the HHA rate of the nurse divided into percentage ranges.
It is felt there was a clinical significance in that there was a much higher level of
HHA in nurses 20 – 29 years old (85.00% of this group had a HHA rate > 50.00%) while
the 30-39 year old group had a 78.26% participation rate >50.00%. This was in contrast
to the nurses in the 50 -69 year old group (100.00% participation rate of >50.00%) but the
rate is deceptive because the rate of this group was actually between 50.00% and 79.00%
as no High Gelers or Super Gelers were identified in nurses older than 50 years of age.
Please see Table 19 and Table 20 in Chapter 4 for these results.
Of the 35 nurses (55.56%) who listed themselves as being married, 74.29% of
them participated in HHA levels above 50.00%. Of the nurses who were married, 20.00%
were in the Super Geler group while being single (23.81% of sample) had 6.67% of the
Super Gelers. No other marital status contributed to being in the Super Geler group.
Please see Table 21 in Chapter 4.
Almost half of the nurse participants (46.88%) had no children, 18.75% of the
nurses listed one child, 25.00% listed two children, 7.8% listed three children, and 1.56%
listed five children. No nurse reported having four children. Rates of HHA >50% were
76.67% for single nurses and 76.47% for nurses with children. HHA rate for nurses with
no children was 23.33% for High Gelers and 3.33% for Super Gelers. Nurses with
children, 12.50% were High Gelers and 20.59% were Super Gelers. Please see Table 22
249
in Chapter 4 for data on the number of children. Being a parent seems to support high
HHA rates.
The first year of nursing practice shows a HHA rate >50% of 81.82% with the
rate dropping slightly in the second year of practice to 76.92%. The third year of practice,
the HHA rate >50% was 100.00% but no High Gelers or Super Gelers were identified.
Rates >50% drop to 60.00% during the fourth year of nursing practice but rise again in
the 5 – 9 year group of nursing practice to 86.67%. For years of practice over 11 years,
the rates again drop with the 11 – 17 years of active practice group having a >50% HHA
rate of 61.64% and the 22 – 32 years of active practice group having a >50% HHA rate of
66.67%. This figures show that interventional programs should be aimed at those nurses
who have been practicing for four years and greater than 11 years. There was a gradual
decline in the rate of participation at the High Geler and the Super Geler level as the
number of years of active nursing practice increased. For those nurses with 1 -4 years of
active nursing practice, 30.30% were either High Gelers or Super Gelers. For those
nurses with 5 – 9 years of practice, 26.67% participated as a High Geler. For those nurses
with 11 – 17 years of active nursing practice, 15.38% participated as Super Gelers.
Nurses who had been practicing 22 – 32 years had a HHA rate >50% of 33.33%.
However, there was a very small number of nurses in this last group so the rates should
be viewed cautiously.
Higher hand hygiene rates >50.00% were found in younger nurses and in those
nurses with one or two years of active nursing practice. It might be wondered why older
nurses with multiple years of nursing practice would have lower HHA rates.

250
During the 1970s, the medical malpractice insurance crisis was the beginning of
hospitals looking at mounting financial pressure to reduce costs by establishing risk
management programs (American Society for HealthCare Risk Management, n.d.). At the
same time, The Joint Commission was beginning its emphasis on the reduction of HAIs
through an increase in hand hygiene adherence (The Joint Commission, 2007). National
Patient Safety Goals specifically addressing hand hygiene compliance were set in place.
The CDC published standardized definitions on nosocomial infections and the CDC,
APIC, SHEA, and WHO published guidelines for the reduction of HAIs. The CDC
established the National Nosocomial Infection Surveillance (NNIS) database with
national rates for nosocomial infections being published beginning in 1992 (CDC, NNIS,
2004). The SENIC trial (Haley, Quade, Freeman, & Bennet, 1980) proved that an
effective infection control program could reduce HAIs. This was also the time of the
emergence of HIV and a great concern for the rise in the rates of multidrug resistant
organisms.
During this time frame, greater emphasis was placed on hand hygiene and the
prevention of infections than in previous decades. Nurses who are now 20 - 29 years old
were born between 1987 and 1996 (HHA rate >50% was 85.00%). Nurses who are now
30-39 years old were born between 1977 and 1986 (HHA rate >50% was 78.26%), and
nurses who are now 40-49 years old were born between 1967 and 1976 (HHA rate >50%
was 66.66%, but 33.33% of this age bracket nurses were Super Gelers. So when nurses
who are now in the 20-49 year old brackets were little, there was a greater emphasis on
hand hygiene, not only in the hospital setting but also in the community. I propose that

251
during this time period, the inherent hand hygiene behavior of this age group was
increased as it had not been in the children born a decade before, thus producing better
HHA rates today. Whitby et al. (2006) state that inherent behavior is most likely
established by the age of 10 years. While the nurses in the 50 – 69 year old bracket had a
HHA rate >50% of 80.00% (rate was actually between 50% and 80%), there were no
High Gelers o Super Gelers identified in these two age groups.
It will be interesting to observe if the increased hand hygiene rates of the current
20-29 year old nurses will remain higher as they progress through the next decades. This
may be reflecting a slow cultural change in the community among children that is now
being reflected in the hand hygiene rates of young adults. There may be a higher inherent
hand hygiene rate built into the young adults of today due to the greater awareness of the
importance of hand hygiene when they were small. There has also been increased
emphasis on HHA in the nursing and medical schools which may also be reflecting
higher rates in elective hand hygiene rates. A 2009 study showed the HHA rate in a U.S.
ICU to be 26% (McGuckin, Waterman, & Govednik, 2009). Studies done in the U.S
published in 2015 and 2016 are reflecting a much higher HHA rate: 72.7% for Texas
(Midturi et al., 2015); 51.3% for West Virginia (Watson, 2016); and 75.0% for Arkansas
(Linam et al., 2016).
Nurses born in other countries participated in adherence to hand hygiene at levels
>50.00% (83.33% other countries vs. 75.00% for U.S. born), High and Super Gelers at
41.67% for other countries vs. 23.08% for the U.S. born, and 25.00% participating at the
Super Geler level for nurses born in other countries vs. 9.62% of those nurses born in the

252
U.S. So the thought that perhaps developing countries might have lower HHA rates
because of issues with clean water and available soap products was not verified. Please
see Table 25 and Figure 6 in Chapter 4 for data regarding country where the nurse was
born.
Observation Technique
Twenty hand hygiene opportunities per hour times 8 hours a day times 4 days
yields a sample size of 640. This afforded a few extra observations in case some hours of
observation did not yield the goal of 20 observations. It was felt that observing for the
four consecutive days would be less disruptive and intrusive to the nursing schedule and
to the operation of the ICU than observing random hours over a much longer period of
time. It was concluded that by using the same days of observation (Monday, Tuesday,
Wednesday, and Thursday), a better comparison between the ICUs could be made. It was
also decided that it was more important to record a greater number of HHOs per nurse for
a stronger potential association with the variables than to have a larger number of RNs
each with less HHOs. The objective was to gather as close to 100% of the HHOs of the
participating ICU nurses as possible, not to gather the HHA rate among the HCWs of the
entire unit.
Observing the full 12 hours of the ICU shift was considered, as this would have
facilitated shortening the total time spent at each ICU. But questions arose about
maintaining the concentration for 12 hours and the ability to physically endure 12 hours
of continuous observation over multiple days since only one observer was being utilized.
As this was a unique method of observation, there was no literature to assist in evaluating

253
what difficulties to expect. There was concern that perhaps boredom or loss of
concentration might occur, but perhaps because of the personal nature of the data
collection, it proved to be a stimulating and exciting experience, particularly once
patterns were beginning to be identified.
In retrospect, a continuous 8 hour observation period was not that difficult and I
wish I had set the parameters to be 12-hour observations instead of the eight hours. This
would have allowed a clearer picture of the increasing and decreasing HHA rate patterns
that emerged during the 8 hour observation period. Doing a 12-hour observation period,
looking at both day and night shifts, and covering all seven days of the week will
certainly generate a better understanding of the ICU nurses’ hand hygiene behavior and
will be considered for future studies.
Room entry and room exit were chosen as the HHO technique for several reasons.
Originally this was not a hand hygiene surveillance study and it was felt it would be too
difficult to gain approval from the Walden IRB and the hospitals to gather data using My
5 Moments of Hand Hygiene as the observation technique. In addition, if the WHO My 5
Moments of Hand Hygiene were followed, it would necessitate going into the patient’s
rooms to observe. While doing this, other nurses could not be watched. The goal was to
accomplish the 613 hand hygiene opportunities as quickly as possible and being in
patient rooms would delay the process. Sickbert-Bennett et al. (2016a) found that room
entry/ room exit covered 87% of the WHO My 5 Moments of Hand Hygiene so it was
felt that room entry/ room exit was a successful technique to use. The overall compliance
for the wash-in/ wash out (room entry/ room exit) technique and the WHO My 5

254
Moments of Hand Hygiene were also found to be similar in a study in Ohio at the
Cleveland VA Medical Center (Sunkesula et al., 2015). A higher compliance with room
exit than room entry was also identified in that study (Sunkesula et al., 2015).
Identification of Super Gelers, High Gelers, and Low Gelers
Because of the continual surveillance over an 8 hour period, certain nurses were
identified as gelling in and gelling out at a high level of adherence. The label of Super
Geler was given to those nurses whose HHA rates were between 90.00 –100.00%. High
Gelers were identified as those nurses whose HHA rates were between 80.00 – 89.99%.
Low Gelers were identified as those nurses whose HHA rates were between 0.00 –
29.00%.
To emphasis the importance of identifying Low Gelers and moving all nurses to a
higher level of adherence, a recent study investigated if a baseline high level of 80.00%
were moved to a 95% HHA rate, would this increase in hand hygiene lead to a decrease
in the HAIs. Results showed that a statistically significant rise in HHA rates was
associated with a statistically significant deduction in HAIs (Sickbert-Bennett et al.,
2016b).
Super Gelers frequently would have a 100.0% HHA rate during an observational
hour. Even if they were carrying something in their arms, they would transfer the bundle
to one arm and extend their other arm to the gel dispenser. Being intrigued as to why
some nurses were holding themselves to a higher standard of compliance, I spoke briefly
with these nurses to identify their personal reasons for this behavior. One nurse
emphasized the internalization of Standard Precautions. This nurse had taken special note
255
of the number of times different HCWs entered and exited the patients’ rooms without
doing hand hygiene and that multiple objects (including the patient’s chart) were carried
in and out of rooms (including isolation rooms) without disinfection. In an effort to self-
protect, this nurse had consciously improved his/her own hand hygiene rate.
Two nurses shared that they had once been exposed and determined they would
not put themselves at risk again. One nurse stated that HHA had been important to his/her
preceptor and it became important to them. Another nurse’s reason for their high HHA
rate was that hand hygiene had been emphasized at a prior hospital and the nurses’
adherence rates were tied to their raises and bonuses. Two nurse stated pregnancies
resulted in being more aware of being adherent.
One article using self-reported hand hygiene rates, reported that four variables
were correlated to HHA; perceived importance of hand hygiene, perceived risk to self,
perceived risk to others, and workplace assists hand hygiene (Hanna, Davies, &
Dempster, 2009). My study, using direct observation of HHA, confirms the finding of
this prior study.
It needs to be emphasized that when Super Gelers, High Gelers, and Low Gelers
are being observed during a routine hand hygiene surveillance period, the HHA rates
recorded will fluctuate depending on the mix of the nurses being observed. It does not
seem to be realistic that Super and Low Gelers can be identified during a short
observation time. What the ideal time for identification is unknown at this time, but it
does seem that at least several hours of observation might be necessary.

256
Many studies point to the different in the HHA rates of overt and covert
observation making the case that true rates can only be obtained if the nurses are unaware
they are being watched. But what is important in any surveillance is the difference or
change in rates, not necessarily the rates themselves. So if the surveillance is always done
overtly, then the same rates are being observed and the observer looks for an increase or
decrease in the rates. But if some observations in a hospital are done overtly and some are
done covertly and the rates are tabulated together, this presents a problem in what is
actually being reported. It would be recommended that one method of observation be
adopted and adhered to. While it is realized that most Infection Control/Prevention
Departments do not have the manpower or time to dedicate four hours to hand hygiene a
month, a consistent time frame on approximately the same shifts and day each month
would yield a more consistent prevalence study. It might be postulated that if the same
observer appeared approximately at the same time within a small range of days each
month, their presence would cease to be an anomaly, the Hawthorne Effect would
gradually lose its affect, and a more accurate prevalence rate could be recorded.
It has been reported that when an observer stays in one location for an extended
period of time, the HHA rates increase (Linam et al., 2016). It must e considered that an
increase in the HHA rate may simply be reflecting a busier time period with increased
HHOs and the presence of an observer may have nothing to do with a fluctuation in rates.
Logically, it is know that the average or mean HHA rate is the sum of the low and
high figures, added together and divided by n. But an average of 60.00% lulls one into
the illusion that nurses and all HCWs are participating in hand hygiene 6 out of 10 times.

257
In reality, in this study, only 18.75% of the nurses were participating at the HHA rate of
60 – 69% (average rate of 64.09% in this study). There was a 37.50% participation in
HHA < 50.00% and 62.50% of the nurses were participating in HHA >60.00%. Watching
the Super Gelers and the Low Gelers helped to crystalize that some nurses are
participating at high levels of adherence while others are not. It also brought the
realization that the patient was at the risk level of the lowest rate of adherence. While the
Super Geler is working hard to prevent cross transmission to themselves and to their
patient, all of their caution is negated when they are followed by a Low Geler the next
shift. Even if 99.99% of the time HHA is done, the one time it is not can lead to an HAI.
A hospital’s patient safety program is only as good as the rate of the Low Geler with the
lowest HHA rate.
Short observation periods of 10-20 minutes will not give the observer adequate
time to discern if they are watching Low Gelers, High Gelers, Super Gelers or those
nurses whose rates are between 30.00 – 79.00% range. If the observer is watching several
Super Gelers, the hospital’s average HHA is going to look great, but it may be presenting
a very false picture of what the actual HHA rate is on that particular unit. It is especially
difficult to gain an accurate rate if data from multiple units are aggregated. Different
HHA rates have been recorded on different units. In Germany, a surgical ICU had a HHA
rate of 39% compared to 72% in the medical ICU, and 73% in the neonatal ICU
(Scheithauer et al., 2009). McGuckin et al., (2009) reported a HHA rate of 26% for ICU
and 36% for non-ICUs. A study in Saudi Arabia reported an overall HHA rate of 67%
with rates recorded for the ICU of 39%, a burn unit with 70%, and the kidney unit with
258
43.4% (Mazi, Senok, Al-Kahldy, & Abdullah, 2013). In London, an overall rate of 60%
was reported, but the GI ward had a rate of 36% and the general ward recorded a rate of
25-33% (FitzGerald, Moore, & Wilson, 2013).
The average HHA rate is further complicated because frequently the full
disclosure of the methodology of the surveillance is not given. The average rate may be
dependent upon the days of the week observed, day shift or night shift, which hours of
the day are being observed, which units are being surveyed, and how many hours or days
observation was made. There are so many variables in each study, comparing average
rates between hospitals and countries may not be giving us an accurate picture of what is
actually happening in the hospitals. Guidelines need to be established so that one average
rate can be compared to another average, much like setting of standardized definitions for
HAIs.
The Hawthorne Effect
Asking the nurses to participate in this study, asking them to fill out the
questionnaire and return it, and sitting very visibly in the hallway for 8 hours a shift for
multiple days, this was very much a full frontal direct observational study. Because this
study could only be done using a direct overt observational method and because the
Hawthorne Effect is always a prominent factor to consider whenever anyone is being
monitored, it was decided to include a strategy to this study to deal head on with this
phenomenon. It was felt that if there were going to be a Hawthorne Effect, it would occur
early in the shift, when nurses were fresh and conscious of their HHA behavior. It was
also believed that an artificial increase in HHA behavior could not be sustained as the

259
nurse became busy and tired (Dai et al., 2015) and reverted to established inherent and
elective hand hygiene behavior (Whitby & McLaws, 2007a). Having a data set of
13,772,022 HHOs, 35 hospitals, 55 hospital units, and 4,157 HCWs, Dai et al. (2015)’s
data (extrapolated from their study) shows a decrease in HHA rates from 42.6% to 37.3%
(5.3% difference) in an 8 hour period and a decrease from 42.6% to 34.8 (a 7.8%
difference) during 12 hour shifts (Dai et al., 2015). Dai et al. (2015) were looking at the
effects of fatigue and how it affected the HHA rates of HCWs. So the question begs as to
whether the decline in HHA rates was due to the Hawthorne Effect disappearing as the
shift progresses, fatigue interfering with adherence, or these results were a combination
of both.
Some researchers point out that rates tend to raise the longer a person does
observation (Chen et al., 2013; Linam et al., 2016). This is based on the assumption that
as word is spread among the HCWs that surveillance is being done on them, more HCWs
will increase their HHA. But in this study, from the very beginning of the shift, having
given their consent for me to include them as a participant, they were totally aware their
HHA behavior was being observed as they entered and exited patient rooms. On 12 of the
18 days of observation (66.67%), the HHA rate was higher the first two hours than was
recorded for the last six hours (33.33% of the time). Since my data does not agree with
the studies by Chen et al. (2013) and Linam et al. (2016), it appears as if the differences
might be in the observation technique, the number of nurses being observed, observing
the same nurses rather than a random sample, the days being observed, and the time of
day that observation was done.

260
Knowing they were going to be observed for 8 hours continually may have altered
the nurses’ perception as it did one of the participating nurses. She commented several
hours into the day’s observation that at the beginning of the shift, she had thought she
needed to be very conscious of her hand hygiene behavior as she entered and exited
patient rooms in order to be as adherent as possible. But she then reasoned that would not
be helpful to me, to provide an inflated, false rate and so she decided that she would do
her normal hand hygiene practice.
Did the Hawthorne Effect occur during this study? Under the specific criteria set
forth in this study to monitor for a Hawthorne Effect (a difference of 20%), the answer is
no, as the highest percentage of differences in rates between the first two hours and the
last six hours was -15.74%. The lowest difference in rates between the two periods was
– 0.02%. The minus indicates that the rate of the last 6 hours was higher than the rate of
the first two hours.
In this study, 12 of the observation days (66.67%) had a higher HHA rate
recorded for the first two hours of the shift with 6 days (33.3%) recording a lower HHA
rate for the first 2 hours than for the last 6 hours. During all 18 days of observation, no
data were required to be dropped during the first 2 hours due to the 20% rule. HHA rates
from the first 2 hours ranged from 36.84% to 90.11% while rates for the last 6 hours
ranged from 45.91% to 90.31%. On 11 of the 18 days of observation (61.11% of the
time), the HHA rate was higher the first hour of observation (7:00 – 8:00 am) than the
second hour of observation (8:00 – 9:00am). On 7 of the 18 days observed (38.89%) the

261
HHA rate was higher the second hour of observation. This study confirmed the studies by
Chen et al. (2013) and Linam et al. (2016) only 38.89% of the time.
Measuring the Hawthorne Effect of subtracting the HHA rate of the last 6 hours
from the HHA rate of the first 2 hours yielded an overall difference in the rates of -3.70%
(range from individual days of observation -0.02% to -15.74%). In comparing the weeks’
averages for the difference between the first 2 hours and the last 6 hours, the range
was from a low of -4.72 % to a high of 5.55%. The minus indicates that the rate of the
last 6 hours was higher than the rate of the first two hours. Because of the way Dai et al.
(2015) reported their results, it was possible to extrapolate a HHA rate of 40.85% for the
first 2 hours and 37.87% for the next 6 hours generating a difference in the rate of 2.98%
or their difference in rates due to a perceived Hawthorne Effect. Please see Chapter 4,
Table 15, Hand Hygiene Adherence Per Day and Per Hour (aggregated data from all five
ICUs) for differences in rates on each day of observation. In this study, the differences in
HHA rates between the first 2 hours and the last 6 hours was not statistically
significant.
The higher and lower percentages of differences that occurred appeared to have
no pattern and may be contributed to watching different nurses on different days. New
nurses were being observed each day so the Hawthorne Effect may have decreased or
intensified according to whether nurses had been observed the day before or were new to
surveillance. One meta-analysis study reported that of the 19 studies reviewed, 12
provided some evidence of a Hawthorne Effect and further indicated that there was no
single effect (McCambridge, Witton, & Elbourne, 2014). Future research may confirm

262
that the Hawthorne Effect, like the act of hand hygiene, is a more complicated
phenomenon than previously thought in regards to hand hygiene.
It might be postulated that since the nurses were aware they were being watched
from the beginning of their shift, that the increase in HHA as the shift progressed may not
be due to their becoming aware of being watched, but rather the change in hourly rates
was due to the structure of the shift and the nursing activities involved. During the
beginning 2-3 hours, nurses are receiving report from the night shift, making assessments
of the patient, and reviewing the chart, lab work, and orders. There are limited hands-on
activities involved. During the mid-morning hours and early afternoon, participation in
hands-on activities increase, dressings are changed, medications are given, suctioning is
done, and blood is drawn. A greater number of potential HHOs that involved the risk of
direct contact with the patient and body fluids are presented, generating a greater desire
by the nurse to participate in hand hygiene. There was a lull observed in HHOs between
the 1:00 and 3:30pm time period. Major nursing duties have been completed and this
becomes the time for charting, checking lab and procedure results, and catching up.
It will be important to do studies observing the full 12-hour shifts to determine if
there is another increase of activity or the lull continues until 7:00pm when the shift
changes. It is suspected there will be another surge of activity during the 4:00 – 6:30pm
time frame as this is also a time of preparation for the oncoming nurse. In order for
oncoming nurses to have time to do their assessments, the outgoing nurse will insure IVs
are changed out, suctioning is done, patients are medicated, and turned. It is also

263
important that research be done in regards to all days of the week and for both shifts so
HHA patterns that exist can be discovered.
There were occasions when a Hawthorne Effect was visible. When a nurse or
other HCW, particularly physicians, walked out of a patient’s room, were a step beyond
the gel dispenser, looked up and saw the observer, reached back and then gelled their
hands, this action was triggered by the sudden awareness of the observer, not an inherent
or elective hand hygiene behavior. This was the Hawthorne Effect, a direct alteration in
behavior due to the presence of an observer. This behavior of the Hawthorne Effect was
not common and occurred only rarely. When this behavior was observed, the HHO was
not included in the surveillance. Nurses walking in and out of the patient rooms routinely
were not physically exhibiting the Hawthorne Effect, especially with some nurses being
observed to have such low HHA rates. It was possible that a mental Hawthorne Effect
was taking place albeit unseen.
The question is now generated as to whether a 20% difference is too generous and
perhaps a 15%, 10%, or even a 5% difference might be considered a more appropriate
percentage to use in looking at the HHA rates of the first 2 hours and the last 6 hours. Or
should the first 4 hours be compared to the last 4 hours of an 8 hour surveillance or the
first 6 hours be compared to the last 6 hours of a 12-hour shift. Additional studies are
encouraged to use this technique to actually measure a Hawthorne Effect rather than just
speculate the results may have been influenced by a Hawthorne Effect and list it as a
limitation of the study. But since this was the first time this methodology was used, it was

264
felt that a 20% difference was a good starting point but additional studies are needed to
investigate how this methodology should be altered for the best results.
Perhaps the most important element in handling the Hawthorne Effect is
consistency with the surveillance. Whether covert or overt observation is used, using the
same method introduces consistently and makes a change in the rates meaningful. An ICP
is looking for a change in the rates, not necessarily the rates themselves. And if the
methodology changes, then rates will correspondingly change. Chen et al. (2013) calls for
a standardization of audits. Right now, because of all of the different methodologies
being used in surveying HHOs, are we really comparing the same rate? Observation
periods are going from 10 minutes to up to four hours, random times during the day or
night, weekdays and weekends. A great deal of emphasis is given to the overall HHA rate
of a hospital and that rate is used to compare HHA among hospitals from all over the
world. The question remains, are we measuring the same average rate of HHA.
I also advocate for a standardized surveillance method issued by APIC or the
WHO. The WHO has given a suggestion of 30 HHO to be observed during the month
and for a 20 minute surveillance period + 10 minutes to be used (WHO, Guidelines on
Hand Hygiene in Health Care, Hand hygiene as a performance indicator, 2009). But does
this limited surveillance time and number of HHOs actually identify an accurate
accounting of the HHA rate. This study would suggest a longer period of observation
time is required. Studies are needed on just the surveillance methodology itself. Which
time frame works better, what days should be surveyed, and is there a difference between
the rates of the day and night shifts. I feel that with the increased number of studies being

265
conducted using the different lengths of observation, it is time for this issue to be
readdressed and updated. Boyce (2011) suggested that without a standardized
methodology, a realistic comparison between different facilities was impossible.
Barriers to Hand Hygiene Adherence
Perceived barriers to hand hygiene are real and a significant cause of non-
adherence with hand hygiene (Kalata, Kamange, & Muula, 2013; Mathur et al. 2011;
Pittet, 2001; Pittet et al., 2000; Squires et al., 2013). Please see Chapter 2, pages 88
through 91, for a more through discussion of barriers to HHA.
A nurse carrying something in their arms has been identified as a barrier to hand
hygiene. One study stated that when nurses were non-adherent with hand hygiene, 11%
of the time, the reason was because ‘hands full of supplies’ (Shabot et al., 2016). Given
the long surveillance period of this study, behavioral patterns began to emerge that would
not have been obvious in a shorter observation period. Carrying something in their hands,
talking on the spectra link phones (personal cell phones were prohibited in the ICUs),
donning gloves, and pushing or pulling their workstations on wheels (WOWs) were
monitored when the nurse did not participate in hand hygiene. HHA rates of carrying
something in their hands, donning gloves and PPE were very much an individual ICU
issue as the rates fluctuated among the different ICUs.
In some instances, the nurse would be carrying a large bundle of linen with both
hands and not gel when the room was entered. But at other times, if only a single object
such as a dressing (4 X 4) or a syringe was being carried and it was being carried only in

266
one hand, it was as if the overcrowding thoughts of the action to be carried out with this
object, displaced the automatic behavior of reaching out one’s arm to the gel dispenser.
When nurses did not participate in HHA, 26.45% (range 10% to 48% in
individual ICUs) of the time it was because they were carrying something in their hands,
t(63) = -2.099, p = .040, alpha was .05. Super Gelers were exceptions to this. Even if
carrying a large bundle, it was observed that the bundle would be transferred to one arm
while the other arm was then extended to obtain gel.
Talking on their spectra link phones occurred occasionally and represented a
small percentage of the time the nurse did not gel. From the intensity on the nurse’s face
while conversing on the phone, it appeared as if all of their thought processes were
involved with talking to the doctor, obtaining orders, or obtaining lab results. This in-
depth concentration interfered with gelling whether the nurse was entering or exiting the
patient’s room. Using the paired sample t-test, t(63) = -2.112, p = .038, alpha .05.
Donning gloves or PPE was also an action that definitely interfered with gelling
(WHO Guidelines on hand hygiene in health care: glove policies, 2009). Many HCWs
believe that hand hygiene is not necessary if protective gowns and gloves are being worn.
This constitutes a knowledge deficit in guidelines, hospital policies, the importance of
hand hygiene in reducing HAIs, and the importance of hand hygiene as a means of self-
protection (McLaughlin & Walsh, 2012, Stock et al., 2016). Donning gloves and PPE
accounted for 8.12% of the times when HHA was not done. This rate was affected by the
number of patients in isolation and the policies and guidelines of the individual hospitals
regarding the use of PPE when entering isolation rooms. One study gave a rate of 41% of

267
HHA when gloves were used (Fuller et al., 2011) while another study observed the most
common reason for non-adherence was wearing gloves in 26% of the HHOs (Johnson, &
Niles, 2016). Donning gloves and gowns interfered with gelling in and out at a lower rate
in this study than in previous studies. Doing a paired sample t-test showed this to be
statistically significant however, t(63) = -2.155, p = .035, alpha .05.
The gel dispenser was positioned outside the entrance to the patients’ rooms and
in some ICUs’ the PPE caddy was positioned on the opposite wall between two rooms.
Nurses would walk to the caddy first if they were going to be entering an isolation room;
begin donning a gown and gloves without gelling. One of the suggestions made to the
ICUs was to put a gel dispenser somewhere inside the caddy by the gloves. As this extra
amount of liquid alcohol solution may interfere with the fire marshal’s restrictions of how
much gel can be placed within a specified area, ICPs will need to find out their
restrictions before adding additional gel dispensers. It should also be noted that gloves are
difficult to put on when the hands have been wetted with the alcohol gel and nurses
seldom have the extra time required for the gel to dry before donning gloves.
A fourth barrier identified in the five ICUs was the pushing or pulling the WOW
or Workstation on Wheels into or out of the patient’s room. The paired samples t-test
results showed t(63) = -2.090. p = .040, alpha .05. The act of pulling or pushing the
WOW might also be considered a ‘hands activity’ as one or both hands are on the cart
moving it. These four activities, all involving the nurses’ hands in some way accounted
for 37.55% of the time the nurse did not participate in hand hygiene as he/she entered or
exited the patient’s room. An educational opportunity presents itself to remind nurses to
268
build gelling into their hand hygiene behavior when they are involved in one of these four
activities.
Talking to someone as the nurse entered or exited the rooms was also a barrier to
HHA. Lankford et al. (2003) pointed out that HCWs were less likely to participate in
hand hygiene if a higher-ranking person entered the room with them and did not perform
hand hygiene. This is why it is so vital that preceptors, charge nurses, upper management
staff, the CEO and administration (including the Board of Trustees) all support hand
hygiene not only in their words, but also in their actions. The importance of
administrative support is discussed in two articles (Jimmieson et al., 2016; Midturi et al.,
2015). One article about the influence of the mentor or preceptor found that the strongest
predictor of the student’s rate of hand hygiene was the mentor’s hand hygiene practice
(Snow, White, & Alder, 2006).
Code blue situations and bed alarms were also identified as barriers to HHA.
These situations however, may be an area where it is unrealistic to try and achieve 100%
compliance. In a code blue situation, the first priority has to be to get to the patient as
quickly as possible. The prioritizing becomes 1) do you save the patient or 2) protect the
patient from a possible HAI. If the patient dies, it is a very negative situation and it is a
mute issue if the patient acquires an infection. If the nurse does not do hand hygiene, it is
a neutral situation. There are no repercussions; the nurse does not get into trouble.
If a bed alarm sounds signaling that a patient is attempting to get out of bed, the
choice again becomes one of priority. Does the nurse rush into the room as quickly as
possible to prevent the patient from falling out of bed or does the nurse prevent the

269
patient from getting a possible HAI by first gelling at room entry. If the patient falls out
of bed, this is likewise a very negative situation. If the nurse does not gel, again, there are
no reprimands or consequences to the nurse. Nurses are taught that the care of the patient
is always the first priority, even if it means putting themselves at risk to do so. Schmidt &
DeShon (2007) investigated factors that influence the pursuit of multiple goals over time.
They found that time allocation (whether to rush in to the patient’s bedside or gel before
entering the room) was largely determined by progress toward the rewarded goal. Saving
the patient’s life during a code and not letting a patient fall out of bed are the rewarded
goals in these two scenarios. Two studies reported that secondary tasks (such as hand
hygiene) may suffer when greater effort is expended on primary resources (the patient)
(Dai et al., 2015; Mahida, 2016).
Analysis and Interpretation of the Findings in the Context of Healthcare
HHA Rates Depend on These Factors
During the hand hygiene surveillance part of this study, it was determined that
certain factors are influencing the HHA rates being reported: the day of the week
observation is done, the time of day, day shift or night shift, the number of patients a
nurse has been assigned, the unit being surveyed, the type of HCWs being surveyed,
amount of time for the surveillance period, and being an overt or a covert observation.
Because of the wide variety of rates recorded throughout the day in this study, rates
reported might be lower or higher than what is actually taking place in the unit. Because a
limited number of observations are being done, an artificial picture of the HHA rate may
result. Rates will also be affected by the acuity of the patient and if the patient is in

270
isolation. Not gelling before putting on gloves or PPE may be a problem in some ICUs.
How the observing is being done is a huge issue as HCWs are more apt to report
favorable rates on their own unit than another unit. There was a 9% rise in HHA rates
among HCWs reporting on their own units (Linam et al., 2016). Fries et al. (2012)
commented that the HHOs are influenced by when and where the observations are made,
the workload, the physical structure or layout of the unit being observed, and the flow
peak times (when there is the most activity results in the highest number of HHOs).
The most important factor affecting the HHA rates, however, is which nurses are
being watched. Even if all HCWs are being observed in a random surveillance, only a
limited number of the total number of nurses working on the unit is being observed.
While you are observing the day shift, you are not observing the night shift. So the rate
depends on how many Low Gelers and how many Super Gelers are being observed or
perhaps they are not being observed at all. If all Low Gelers are being observed (who
may exhibit an artificial HHA because of the Hawthorne Effect), the rate may be low.
Likewise, if all Super Gelers are being observed, an artificially high rate of HHA may be
recorded for the whole unit. Individual rates of HHA ranged from 6.45% to 100.00% (by
two different nurses on different days in different ICUs).
One comment that has to be made concerning the rates reported per day per hour
(Table 7 in Chapter 4) was the wide range of the rates recorded each day on individual
nurses. Because this data was aggregated in this study, the impact of the high HHA of
some nurses and the low rates of other nurses was lost. This study showed a range of
individual HHA rates from 0.00% to 100% HHA per hour. The rate generated from a

271
short surveillance period will be dependent on 1) which day is observed, 2) what time of
day is observed, 3) the number of patients a nurse has, 4) the acuity of the patient, 5) if
the patient is in isolation, 6) the fear level the nurse has in regards to the patient’s
condition (in other words, how important is it to the nurse to protect himself/herself from
a particular disease or infection, and 7) most importantly, which nurse is being observed:
a Low Geler or a Super Geler or a nurse whose HHA rate falls in the 50% range. Please
see Table 3 in Chapter 4.
The occurrences of the peak observation time or highest activity level of HHOs
may be unit dependent and may vary according to the individual unit or ICU. In one
study the peak HHO time was between 8:00am and 9:00am (13% of all HHOs), 11:00am,
4:00pm, and 8:00pm (Fries et al., 2012). Minimal activity occurred between midnight and
4:00am (Diller et al., 2014). In another 2012 study, it was reported that compliance was
lower in the first hour of a four-hour observation period (Stone, Fuller, Michie, McAteer,
& Charlett, 2012a).
When all HCWs were observed, only a small quality (1-3%) of the potential hand
hygiene opportunities were captured (Linam et al., 2016). Observers in hand hygiene
surveillance tend to watch and record those HCWs who are participating in hand hygiene
and fail to observe and record negative opportunities.
A great deal of pressure is being placed on hospitals by outside agencies and the
Centers for Medicare and Medicaid Services in regards to reimbursement. In trying to
achieve perhaps unrealistic goals of 100% compliance, there may be an underlying
unconscious desire by observers to demonstrate a high level of HHA as proof of the

272
hospital’s competency, even though the high rate may not be accurate.
Healthcare Environment Theory (HET)
The theory upon which this study has been based is a new self-developed theory,
the healthcare environment theory (HET). It was designed specifically for healthcare, the
hospital setting, for infection prevention, and for hand hygiene surveillance. The HET
was conceptualized from the ecological system theory developed in 1979 by Urie
Bronfenbrenner (Bronfenbrenner, 1994; Lang, 2015; Sincero, 2012a) and supported by
the systems thinking theory developed in the 1940s by Ludwig von Bertalanffy
(Zborowsky & Kreitzer, 2009). Please see the sections ‘Theoretical Foundation’ on pages
21 - 25 in Chapter 1 and on pages 50 - 59 in Chapter 2 for a more through discussion of
the evolution and components of the HET.
The HET consists of six environmental systems, which influence the HHA rate of
the HCWs. In this study it was seen how the family environment influences the HHA rate
of the ICU nurse in the results from the variables of being married, having children, gross
household income, and ancestry. Super Gelers were more likely to be married (Please see
Table 21 in Chapter 4), have children (please see Table 22 in Chapter 4), be in the
$80,000 to $150,000 income range (Please see Table 23 in Chapter 4), and be of
Caucasian or Asian descent (Please see Table 26 in Chapter 4).
Church environment influenced the HHA rate of the nurses in that Super Gelers
were more likely to belong to a Non-Christian based religion such as Buddhism,
Islamism, or Judaism. Those nurses who identified as Catholic had the lowest percentage
of Super Gelers (7.69%).

273
Administrative environment was especially prevalent in one ICU and this ICU
had the highest HHA rate of the five ICUs studied. A clear message from the
management staff sets the expectation of the environment, which in turn influences the
hand hygiene rate of the ICU nurses. This unit also had a strong teamwork ethic, which
may be interpreted as an extended family environment, which also influenced their higher
hand hygiene rate.
The community environment has perhaps influenced the ICU through a slightly
different manner in that there appears to be a cultural change taking place within the
hospital in regards to increased hand hygiene rates among the younger nurses and those
who have graduated more recently. This community change started in the 1970s (Please
see Chapter 4, pages 257 – 259 for a discussion concerning these community changes).
The highest rates of adherence were among those nurses who had graduated within the
past 1 – 2 years. This also shows the influence of the nursing school education on
increasing hand hygiene (Please see Table 20 in Chapter 4). High and Super Gelers were
more likely to come from the 1 - 4 years of active nursing practice (30.30%). For those
nurses with 5 – 9 years of active practice, only 26.67% were represented in the High
Geler group. In those nurses with over 11 years of nursing practice, only 15.38% were
represented in the Super Geler group. In the group with 22 -32 years of experience,
33.33% were Super Gelers but with the denominator being very small, this needs to be
viewed with caution (please see Table 20 in Chapter 4).
The community environment can also be said to have influence on the HHA rate
of the ICU nurse through the variable of the country in which the nurse was born. Nurses

274
who were born in countries other than the U.S. were more likely to be a part of the High
and Super Geler group. None of the nurses born in another country were identified as a
Low Geler while 7.69% of those nurses born in the U.S. were identified as Low Gelers
(Please see Chapter 4, Table 25).
Ancestry has already been shown to influence hand hygiene in the family
environment but functions as an influence in hand hygiene in the cultural environment as
well. All of the ICUs studied employed nurses with multiple cultural backgrounds, which
brings a richness and diversity to the units. Age might also be considered under the
cultural environment as each age group belongs to that particular age culture. Hand
hygiene rates >50.00% was recorded by 85.00%% of the nurses who were in the age
groups 20 – 29 years and 78.26% of the 30 – 39 years. All of the High Gelers and Super
Gelers identified in this study were between 20 – 49 years old while no High Geler or
Super Geler was identified in the two groups 50 – 59 years and 60 – 69 years. Pittet et al.,
(2004b) also found a gradual decline in HHA as the nurse aged, but Silva et al., (2014)
found that nurses older than 41 years of age had the highest HHA with 66.7%. The
findings of this study support Pittet et al.’s study but not that of Silva et al. (2014).
It must be remembered also that with the culture of age, as the ICU nurse ages
and gains experience, they are pulled into upper management or into other fields. The
high intensity (mentally, physically, and emotionally) of ICU activities is hard to
maintain for a prolonged period of years.
The work environment influenced the hand hygiene rate because in a teamwork
environment, all of the nurses are helping each other, which helps to reduce stress. By

275
sharing the work, it gives each nurse more time to follow policy and procedure and
participate in a higher hand hygiene rate. Respiratory and physical therapists were
working with the nurses to the benefit of the patient. Housekeeping staff at all ICUs were
observed to maintain a very high level of HHA. With all HCWs striving to maintain a
safer environment for the patient and for himself or herself, it is definitely seen as an
influential environment on the HHA rate of the ICU nurse. Attitudes of the management
staff also were an important interplay in this environment. Cruz and Bashtawi (2015)
stated that predictors of better HHA were a good attitude of the nurse toward the patient
and HHA, being a male, and having a HHA rate sufficient to reduce HAIs.
The work environment can also influence the hand hygiene rate of the ICU nurse
when entering or exiting the patient room and hand hygiene was not done. When the ICU
nurses entered or exited a patient’s room and hand hygiene was not done, 37.55% of the
time it was because of one of the four hand activities: carrying something in their hands,
talking on their spectra link phones, participating in donning gloves or gowns, or pushing
or pulling the WOW. Thus a work activity greatly influenced the hand hygiene rates of
the ICU nurse. This influence was statistically significant under the paired samples t-test.
Limitations of the Study
Limitations to this study were:
1) The nurses who did volunteer to participate might have had higher HHA rates
than those nurses who did not volunteer. It might be surmised that a nurse might
volunteer if he/she perceived their HHA rate to be higher even if in reality the rate was

276
much lower. In looking at literature on self-reporting of their HHA, nurses tend to have
higher self-reported rates than those identified from direct observation.
2) Only ICU RNs were observed. Other HCWs such as physicians, nurses’ aides,
housekeepers, lab personnel, x-ray technicians, physical therapist, etc. all have the
potential to do cross-contamination (38%) if proper hand hygiene is not done (Sickbert-
Bennett et al., 2016a). But since the focus of this study was on the association of
demographic variable on hand hygiene, the RNs afforded a larger, more clustered sample
of HHOs than other HCWs.
3) A limitation was having missed opportunities which prevented 100%
observation of the nurses watched. Missed opportunities resulted from the gel dispensers
being in the patient’s rooms, missing a room entry or exit by a nurse, and being unable to
see around people or equipment.
4) A limitation tied to missed opportunities was that not all ICUs nurses in an
individual ICU were watched thus affecting the true HHA rate of the ICU. But again, the
goal of the study was the association of the variables to hand hygiene, not a hand hygiene
study per se.
5) Because only one observer was used, observer bias must be considered a
limitation in this study. It is understood this study would have been strengthened if two or
more observers could have been used to validate HHO, but financial constraints
prohibited this as well as the hospital Infection Prevention Departments being unable to
furnish a second person due to limited personnel and resources. With only one observer,
the potential for personal biases being introduced into the observation process was
277
recognized and all attempts were made to control this (Sax et al., 2009). As the sole
observer, it was important to insure all nurses were given the opportunity to participate
and that all room entries and all room exits were monitored to the best of my ability. With
observing a limited number of nurses and restricting the observation to a certain number
of clearly visible rooms, it was roughly calculated that only about 10-15% of the
opportunities for those participating were missed. But it is also realized that while a
greater percentage of opportunities were captured for the nurses who were participating,
that meant the HHA rate for the remainder of the nurses was not being captured.
6) Another limitation was that the observation periods were only Monday,
Tuesday, and Wednesday for most of the ICUs (one ICU required four days to achieve
the sample size desired and one required five days), did not include all the days of the
week, the weekends, or the night shift, and did not cover the 12-hour shift. Using only
room entry/ room exit might be considered a limitation, as the WHOs My 5 Moments of
Hand Hygiene could not be monitored. But utilizing this method avoided the need to
enter patient rooms, which would have interfered with the observation of other nurses
entering or exiting their rooms at the same time. Sickbert-Bennett et al. (2016a) have
reported that room entry/ room exit cover 87% of the My 5 Moments of Hand Hygiene.
7) Additional limitations identified in Chapter 1 include observations being done
only in the ICU and not on all nursing units of the hospitals.
8) A limitation also existed in that only hospitals in Texas were observed. This
precludes looking at how nurses in other states might answer the demographic
questionnaire, although the questions were not state specific. It is also possible that the
278
HHA rate in other states may be higher or lower than the rates found in these 5 ICUs.
Because the nurses sampled were a convenience sample, they may not represent the
average nurse in Texas or in any other state in their answers to the demographic
questionnaire or their HHA rate.
Recommendations: Gaps Still Existing
Besides the gap in knowledge of demographic variables association with HHA,
gaps also exist concerning the role visitors and family members have on the transmission
of organisms to patients. Gaps also exit concerning studies of the transmission of C
difficile and other multidrug resistant organisms from patients to visitors or family
members (Munoz-Price et al., 2015). Literature also tends to concentrate on the
transmission of organisms from the nurse to the patient but there also appears to be a gap
in research on the transmission of organisms from the patient to the HCW.
A large gap that exists is the lack of studies on the different methodologies of
doing hand hygiene surveillance. What is the ideal time period to observe in order to
obtain an accurate rate? Is it okay to do random sampling or is it necessary to do targeted
surveillance and gather data from individual nurses? In order to obtain an accurate HHA
rate, can data be aggregated among different units of the hospital? Should we even be
reporting an average hospital HHA rate?
Why nurses are not participating in hand hygiene is a large gap. A gap also exits
as to why some nurses participate in high levels of HHA while others do not. A great
many studies list barriers to hand hygiene but there is still a need to investigate how much
of an interference in hand hygiene each of these barriers really are. More research needs

279
to be done on the spiritual affiliation and ethnicity of the nurse and if there is an
association with hand hygiene.
There is also a great need for the development of theories specific to hospital
studies, infection control and hand hygiene studies. In addition, a gap exits in the
measurement of the Hawthorne Effect. How much of an effect has really occurred in a
study? In regards to the methodology used in this study, was 20% an adequate percentage
to use or should it be a smaller percentage. The only measurement up to now has been the
comparison of the HHA rates of an overt and covert surveillance on the same HCW
population. But since covert surveillance is difficult to accomplish, if a methodology can
be refined so overt surveillance can be done, it may ease some of the problems for the
ICPs.
Recommendations for Practice
Recommendations were given to each of the ICUs in regards to their individual
HHA rates. Although these recommends were given to the five specific ICUs, any ICU
could adopt them.
• Install a gel dispenser inside the PPE caddy or in very close proximity to the
glove dispenser, depending on the regulation of the fire marshal. Instruct nurses
on the importance of gelling before putting on gloves. One study reported that
18% of the HCWs responded there was no need for hand hygiene if gloves were
used (John et al, 2016). In this study, donning gloves and gowns interfered with
hand hygiene <2.0% to >15.0% of the time.

280
• Carrying something in the hands or arms interfered with hand hygiene 10.0% to
48.0% of the time. This study showed that 37.55% of the times that the nurse did
not gel when going into or exiting a room, they were involved with one of these
four hand activities: carrying something in their hands, speaking on their spectra
link phone, donning gloves and/or gowns, and pushing or pulling the WOWs.
• Make nurses aware of their ICU’s HHA rates. Most nurses have a perception that
their rates are in the 90% range approaching 100%.
• Make nurses and all HCWs aware of the studies that show correlation between
increasing hand hygiene rates and decreasing HAIs.
• Assist preceptors to understand the importance of the role they play in increasing
hand hygiene in their precepts.
• Emphasize the importance of teamwork.
• Instruct upper management on the importance of their influence in the daily
routines of their units.
• Educate the CEO and administrative staff on understanding the importance of
their influence on the patient safety culture of the hospital.
• If HCWs from the different hospital departments are being utilized in the hand
hygiene surveillance program, schedule assignments so they are surveying a unit
other than their own.
• Train observers what they should be observing: to record not only the HHOs that
result in positive HHA but also those opportunities that result in no HHA and the
need for accurate rates.
281
• Modify the surveillance periods to include the busiest times of the day for
maximum HHOs to observe.
Hand hygiene behavioral patterns were identified that could not be recognized in
shorter observation periods. Although it is highly unlikely that any infection control
department will have the time or the manpower to do an 8 hour surveillance period, it is
hoped that the knowledge gained by this hand hygiene surveillance technique will be
helpful to other ICPs in determining an ideal length of time for surveillance and how to
utilize their surveillance to the fullest.
Implication for Positive Social Change
Impending social change in the ICUs that participated in the data collection was
expressed by the management teams of each ICU. These changes include bringing
awareness to the ICU nurses of their observed rates, awareness of behavioral patterns
identified, and the possible placement of another gel dispenser next to the personal
protective equipment (PPE) storage cabinet. Awareness of the importance of the
management team in regards to influencing HHA and building a culture of patient safety
was also emphasized to each facility (Jimmieson et al., 2016; Smiddy et al., 2015).
Currently the social change brought about by this study has occurred in the five ICUs
studied. It is hoped that what has been learned about the association of the demographic
variables and HHA will be helpful in teaching programs in regards to the age of the nurse
and the number of years of active nursing practice. The information gleaned from the
actual hand hygiene surveillance in regards to the percentages of the barriers identified,
identification of the Low Gelers, High Gelers, and Super Gelers, the Hawthorne Effect,

282
and the hourly variation in HHOs may prove to be the most helpful to the ICPs. This
study highlighted the need for a standardized surveillance system and this would
definitely bring about a large social change in how HHA rates are reported.
Conclusion
Although the original goal of this study was to investigate the association of 15
demographic variables with the consistency of the HHA of the ICU nurse, it was realized
during the data collection that the unique hand hygiene surveillance methodology used in
this study had provided valuable information regarding hand hygiene surveillance. The
answers to individual questionnaires were linked to that nurses individual hand hygiene
HHA rates before aggregating the data. HHA rates fluctuated during the 8 hours of
surveillance with HHOs being highest in the 10:00am to 1:00pm time periods. Although
the aggregated rate for all five ICUs was 64.09%, the individual nurse’s HHA rates
ranged from 6.25% to 100.00%. The male nurses in this study had an average HHA rate
of 66.88% while the female nurses had a HHA rate of 62.27%. Identification was made
of Low Gelers (a HHA rate of <29.00%), High Gelers (a HHA rate of 80.00 – 89.99%),
and Super Gelers (a HHA rate of >90.00%).
The Healthcare Environment Theory (HET) was introduced in this study and was
tested for the first time. It was shown how the six environments of the HET influenced
the hand hygiene rates of the ICU nurses and each of the other environments.
Also unique to this study was how the Hawthorne Effect was dealt with. In this
study, it was found there was an average of 3.70% difference between the rates observed
283
during the first 2 hours of observation and the last 6 hours of observation (range of 0.02%
to 15.74%).
When nurses were not adherent with hand hygiene when entering or exiting the
patient’s room, 37.55% of the time the nurse was involved in one of these four hand
activities: carrying something in their hands, using their spectra link phones, donning
gloves or PPE, and pushing or pulling the WOWs.
Although none of the demographic variables showed a statistical significance
using multiple regression, using the paired samples t-test, statistical significance (p =
.000) was found in these three independent variables: age of the nurse, the number of
years of living in the U.S., and the number of years of active nursing practice when the
dependent variable used was the HHA <50%, >50%. The independent variables of
number of children, the number of years of living in the U.S., and the age of the nurse
were statistically significant (p = .000) when the dependent variable used was a
percentage range of HHA.
A great deal was learned from this study in regards to the hand hygiene behavior
of the ICU nurse, but it also made evident how much more still needs to be discovered
about the why nurses do and do not participate in hand hygiene 100.00% of the time.

284
References
Agency for Healthcare Research and Quality (AHRQ). (2011). Healthcare-associated
Infections. U.S. Department of Health and Human Services. Retrieved from
http://www.ahrq.gov/qual/hais.htm
Agency Nursing: Highest pay & most flexibility. (2013). Alliant Healthcare Staffing.
Retrieved from http://www.biomedcentral.com/1471-2334/13/367
Ahmed, Q. A., Memish, Z. A., Allegranzi, B., & Pittet, D. (2006). Muslin health-care
workers and alcohol-based handrubs. The Lancet, 367(9515), 1025-1027.
doi:10.1016/SO140- 6736(06)68431-6
Aiello, A. E., Coulborn, R. M., Perez, V., & Larson, E. L. (2008). Effect of hand hygiene
on infectious disease risk in the community setting: A meta-analysis. American
Journal of Public Health, 98(8), 1372-1381. doi:10.2105/AJPH.2007.124610
Al-Hussami, M., Darawad, M., & Almhairat, I. I. (2011). Predictors of compliance
handwashing practice among healthcare professionals. Healthcare Infection, 16,
79-84. doi:10.1071/H111004/1835-5617/11/020079
Allegranzi, B., Conway, L., Larson, E., & Pittet, D. (2014). Status of the implementation
of the World Health Organization multimodal hand hygiene strategy in United
States of America health care facilities. Am J Infect Control, 42, 224-30.
doi:10.1016/j.ajic.2013.11.105
Allegranzi, B., Memish, Z. A., Donaldson, L., & Pittet, D. (2009). World Health
Organization global patient safety challenge task force on religion and cultural
aspects of hand hygiene, world alliance for patient safety. Religion and culture:

285
Potential undercurrents influencing hand hygiene promotion in health care. Am J
Infect Control, 37(1), 28-34. doi:10.1016/j.ajic.2008.01.014
Allegranzi, B. & Pittet, D. (2007). Healthcare-associated infection in developing
countries: Simple solutions to meet complex challenges. Infection Control
Hospital Epidemiology, 28(12), 1323-1327. doi:10.1086/521656
Allegranzi, B., & Pittet, D. (2009). Role of hand hygiene in healthcare-associated
infection prevention. Journal of Hospital Infection 73(4), 305-315.
doi:10.1016/j.jhin.2009.04.019
Allegranzi, B., Sax, H., & Pittet, D. (2013). Hand hygiene and healthcare system change
within multi-modal promotion: A narrative review. Journal of Hospital Infection
83(S1), S3-S10. doi:10.1016/SO195-6701(13)60003-1
Allegranzi, B., Storr, J., Dziekan, G., Leotsakos, A., Donaldson, L., & Pittet, D. (2007).
The first global patient safety challenge “Clean Care is Safer Care”: From launch
to current progress and achievements. Journal of Hospital Infection, 65(S2), 115-
123. doi:10.1016/SO195-6701(07)60037-9
Almaguer-Leyva, M., Mendoza-Flores, L., Padilla-Orozco, M., Sánchez-Hinojosa, R.,
Espinosa-Santacruz, D., & Camacho-Ortiz, A. (2014). Integrating medical
students as covert observers in the evaluation of hand hygiene adherence.
Am J Infect Control, 42(8), 937-939. doi:1016/j.ajic.2014.04.010
Al-Naggar, R. A., & Al-Jashamy, K. (2013). Perceptions and barriers of hand hygiene
practice among medical science students in a medical school in Malaysia.
International Medical Journal Malaysia, 12(2), 11-14. Retrieved from

286
http:/iiumedic.net/imjm/v1/download/Volume%2012%202.Vol12No2%20Page%
2011-14.pdf
Alp, E., Altun, D., Cevahir, F., Ersoy, S., Cakir, O., & McLaws, M-L. (2014). Evaluation
of the effectiveness of an infection control program in adult intensive care units:
A report from a middle-income country. Am J Infection Control, 42(10), 1056-
1061. doi:10.1016/j.ajic.2014.06.015
Al-Rawajfah, O. M., Cheema, J., Hewitt, J. B., Hweidi, I. M., & Musallam, E. (2013).
Laboratory-confirmed, health care-associated bloodstream infections in Jordan: A
matched cost and length of stay study. Am J Infect Control, 41(7), 607-611.
doi:10.1016/j.ajic.2012.08.014
Alsubaie, S., bin Maither, A., Alalmaei, W., Al-Shammari, A. D., Tashkandi, M., Somily,
Al M., … BinSaeed, A. A. (2013). Determinants of hand hygiene nonadherence
in intensive care units. Am J Infect Control 41(2), 131-135.
doi:10.1016/j.ajic.2012.02.035
Al-Tawfig, J. A., Abed, M. S., Al-Yami, N., & Birrer, R. B. (2013). Promoting and
sustaining a hospital-wide, multifaceted hand hygiene program resulted in
significant reduction in health care-associated infections. Am J Infect Control
41(6), 482-486. doi:10.1016/j.ajic.2012.08.009
American Association of Colleges of Nursing. (2014). Nursing shortage. Retrieved
from http://www.aacn.nche.edu/media-relations/fact-sheets/nursing-shortage
American Nurses Association (ANA). The nursing workforce 2014: Growth, salaries,

287
education, demographics, & trends. Retrieved from
http://www.nursingworld.org/MainMenuCategories/ThePracticeofProfessionalNu
rsing/workforce/Fast-Facts-2014-Nursing-Workforce.pdf
American Society for Healthcare Risk Management. (n.d.). A brief history of ASHRM:
1980-2010. Retrieved from
http://www.ashrm.org/about/files/A_Brief_History_of_ASHRM.pdf
Antibiotics currently in clinical development. (2015). The PEW Charitable Trusts.
Retrieved from http://www.pewtrusts.org/en/multimedia/data-
visualizations/2014/antibiotics-currently-in-clinical-development
Arabestani, M. R., Fazzeli, H., & Esfahani, B. (2014). Identification of the most common
pathogenic bacteria in patients with suspected sepsis by multiplex PCR. J Infect
Dev Ctries, 8(4), 461-468. doi:10.3855/jidc.3856
Arabi, Y. M., Arifi, A. A., Balkhy, H. H., Najm, H., Aldawood, A. S. Ghabashi, A., …
Raiy, B. A. (2014). Clinical course and outcomes of critically ill patients with
Middle East Respiratory Syndrome Coronavirus infection. Annals of Internal
Medicine, 160(6), 389-397. doi:10.7326/M13-2486
Arain, M., Campbell, M. J., Cooper, C. L., & Lancaster, G. A. (2010). What is a pilot or
feasibility study? A review of current practice and editorial policy. BMC Medical
Research Methodology, 10, 67. doi:10.1186/1471-2288-10-67
Archibald, L. K., & Jarvis, W. R. (2011). Health-care-associated infection outbreak
investigations by the Centers for Disease Control and Prevention, 1946-2005.
Am J of Epidemiology, 174(Suppl)(11), S47-S64. doi:10.1093/aje/dwr310

288
Assessing the methodology of the study. (2000). Lesson A-6. Tools for preparing
literature reviews. Retrieved from http://www.gwu.edu/~litrev/a06.html
Association for Professionals in Infection Control and Epidemiology, (APIC). (2015).
Guide to hand hygiene programs for infection prevention. Retrieved from
http://www.apic.org
Association for Professionals in Infection Control and Epidemiology (APIC). (n.d.a).
History. Retrieved from http://www.apic.org/About-APIC/History
Association for Professionals in Infection Control and Epidemiology (APIC). (n.d.b).
Infection surveillance, prevention and control (ISPC): Brief history. Retrieved
from http://www.health.nv.gov/PDFs/Infections/ISPC.pdf
Association for Professionals in Infection Control and Epidemiology (APIC). (n.d.c).
New England, history. Retrieved from
http://community.apic/org/newengland/home/history
Association for Professionals in Infection Control and Epidemiology (APIC). (n.d.d).
Number of APIC chapters. Retrieved from
http://apic.org/Search/Index?Keywords=number+of+APIC+chapters&x=0&y=0
Ayers, B. (2008). Statistics micro mini: Threats to your experiment! Retrieved from
http://www.stat.cmu.edu/~eayers/HCII/Threats.ppt
Azim, S., Juergens, C., & McLaws, M-L. (2016). An average hand hygiene day for
nurses and physicians: The burden is not equal. Am J Infect Control, 44(7), 777-
781. doi:10.1016/j.ajic.2016.02.006
Barahona-Guzmán, N., Rodriguez-Calderón, M. E., Rosenthal, V. D., Olarte, N.,

289
Villamil-Gómez, W., Rojas, C., … Silva, E. (2014). Impact of the International
Nosocomial Infection Consortium (INICC) multidimensional hand hygiene
approach in three cities of Colombia. International Journal of Infectious Diseases,
19, 67-73. doi:10.1016/j.injid.2013.10.021
Barba, E. J., Rosenthal, V. D., Higuera, F., Oropeza, M. S., Hernández, H. T., López, M.
S., … Safdar, N. (2005). Device-associated nosocomial infection rates in
intensive care units in four Mexican public hospitals. Am J Infect Control, 34(10),
682-688. doi:10.1016/j.ajic.2005.05.024
Barry, A., & Honoré, H. (2009). Everyday theory: A practical application of the
ecological perspective. American Journal of Health Education, 40(6), 368-372.
Retrieved from the http://www.questia.com/library/journal/1G1-
213777080/everyday-theory-a-practical-application-of-the-ecological
Bearman, G., (n.d.). Hand hygiene. Virginia Commonwealth University Medical Center,
Richmond, Virginia. Retrieved from
https://www.vcuhealth.org/upload/docs/AboutUs/InfectionControl/HandHygiene.
Berenson, R. A., Ginsburg, P. B., & May, J. H. (2007). Hospital-Physicians relations:
Cooperation, competition, or separation? Health Affairs, 26(1), w31-w43.
doi:10.1377/hlthaff.26.1.w31
Bieger, & Gerlach. (2012). Threats to internal and external validity. Research methods,
chapter 8. Retrieved from
http://www.slideshare.net/rodsazon/threats-to-internal-and-external-validity

290
Biovigil. (2013). Biovigil Hygiene Technologies, LLC. Retrieved from
http://www.biovigilsystmes.com/about/
Biswal, M., Rajpoot, S., Dhaliwal, N., Appananavar, S. B., Taneja, N., & Gupta, A. K.
(2014). Evaluation of the short-term and long-term effect of a short series of hand
hygiene campaigns on improving adherence in a tertiary care hospital in India.
Am J Infection Control, 42(9), 1009-1010. doi:10.1016/j.ajic.2014.05.025
Biswal, M., Singh, N. V., Kaur, R., Sebastian, T., Dolkar, R., Appananavar, S. B., …
Taneja, N. (2013). Am J Infection Control, 41(11), 1114-1115.
doi:10.1016/j.ajic.2013.05.026
Bloomfield, S. F., Aiello, A. E., Cookson, B., O’Boyle, C., & Larson, E. L. (2007). The
effectiveness of hand hygiene procedures in reducing the risks of infections in
home and community settings including handwashing and alcohol-based hand
sanitizers. Am J Infect Control, 35, S27-64. doi:10.1016/j.ajic.2007.07.001
Borg, M. A., Benbachir, M., Cookson, B. D., Ben Redjeb, S., Elnasser, Z., Rasslan, O.,
…Bagatzouni, D. P. (2009). Health care workers perceptions of hand hygiene
practices and obstacles in a developing region. Am J Infect Control, 37(10), 855-
857. doi:10.1016/j.ajic.2009.06.003
Boutin-Foster, C., Scott, E., Melendez, J., Rodriguez, A., Ramos, R., Balavenkatesh, K.,
& Michelen, W. (2013). Ethical considerations for conducting health disparities
research in community health centers: A social-ecological perspective. Am J of
Public Health, 103(12), 2179-2184. doi:10.2105/AJPH.2013.301599
Boyce, J. M. (2011). Measuring healthcare worker hand hygiene activity: Current

291
practices and emerging technologies. Infection Control & Hospital Epidemiology,
32(10), 1016-1028. doi:10.1086/662015
Boyce, J. M. (2013). Update on hand hygiene. Am J Infect Control, 41(5)S94-S96.
doi:10.1016/j.ajic.2012.11.008
Boyce, J. M., & Pittet, D. (2002). Guideline for hand hygiene in health-care settings:
Recommendations of the Healthcare Infection Control Practices Advisory
Committee and the HICPAC/SHE/APIC/IDSA Hand Hygiene Task Force.
Morbidity and Mortality Weekly Report, 2002, 51(RR-16), 1-44. Retrieved from
http://www.cdc.gov/mmwr/PDF/rr/rr5116.pdf
Breathnach, A. S. (2013). Nosocomial infections and infection control. Medicine, 41(11),
649-653. doi:10.1016/j.mpmed.2013.08.010
Bronfenbrenner, U. (1994). Ecological models of human development. International
Encyclopedia of Education, 3, 2nd Ed., Oxford: Elsevier. Retrieved from
http://edt2.educ.msu.edu/DWong/TE150/CourseReader/Bronfenbrenner-
EcologicalModelsofHumanDevel.pdf
Burke, J. P. (2003). Infection Control – A problem for patient safety. New England
Journal of Medicine, 348(7), 651-656. doi:10.1056/NEJMhpo20557
Burke, J., Smith, L. N., Sveinsdottir, H., & Willman, A. (2013). Patient safety: theoretical
considerations. National Conference, An Bord Altranais Conference on Patient
Safety Regulating to Safeguard the Patient, Royal Marine Hotel, Dun Laoghaire,
Co Dublin. UCD School of Nursing, Midwifery & Health Systems-Research
Publications 2009/10. Retrieved from

292
http://www.ucd.ie/research/publications/20092010/lifesciences/schoolofnursingmi
dwiferyhealthsystems/#conf_pubs
Cane, J., O’Connor, D., & Michie, S. (2012). Validation of the theoretical domains
framework for use in behaviour change and implementation research.
Implementation Science, 7(1), 37-53. doi:10.1186/1748-5908-7-37
Carayon, P. (2012). Sociotechnical systems approach to healthcare quality and patient
safety. Work, 41(0 1), 3850-3854. doi:10.3233/WOR-2012-0091-3850
Carayon, P., Wetterneck, T. B., Rivera-Rodriguez, J. R., Hundt, A. S., Hoonakker, P.,
Holden, R. & Gurses, A. P. (2014). Human factors systems approach to healthcare
quality and patient safety. Applied Ergonomics, 45(1), 14-25.
doi:10.1016/j.apergo.2013.04.023
Cassir, N., Thomas, G., Hraiech, S., Brunet, J., Fournier, P-E., La Scola, B., & Papazian,
L. (2015). Chlorhexidine daily bathing: Impact on health care-associated
infections caused by gram-negative bacteria. Am J Infect Control, 43(6), 640-643.
doi:10.1016/j.ajic.2015.02.010
Castro-Sánchez, E., Chang, P. W. S., Vila-Candel, R., Escobedo, A. A., & Holmes, A.
H., (2016). Health literacy and infectious diseases: why does it matter?
International Journal of Infectious Diseases 43, 103-110.
doi:10.10.16/j.ijid.2015.12.019
Cato, K. D., Cohen, B., & Larson, E. (2015). Data elements and validation methods used
for electronic surveillance of health care-associated infections: systematic review.
Am J Infect Control, 43(6), 600-605. doi:10.1016/j.ajic.2015.02.006

293
Centers for Disease Control and Prevention (CDC). (1986). Nosocomial Infection
Surveillance, 1984. Morbidity and Mortality Weekly Report Surveillance
Summaries, 35(SS-1), 17-29. Retrieved from
http://www.cdc.gov/mmwr/preview/mmwrhtml/00001772.htm
Centers for Disease Control and Prevention. (1996). Historical perspectives history of
CDC. Morbidity and Mortality Weekly Report, 45(25), 526-530. Retrieved from
http://www.cdc.gov/mmwr/preview/mmwrhtml/00042732.htm
Centers for Disease Control and Prevention. (2000). Monitoring hospital-acquired
infections to promote patient safety - United States, 1990-1999. Morbidity and
Mortality Weekly Report, 49(8), 149-172. Retrieved from
http://www.cdc.gov/mmwr/PDF/wk/mm4908.pdf
Centers for Disease Control and Prevention. (2004). National Nosocomial Infections
Surveillance (NNIS) System Report, data summary from January 1992 through
June 2004, issued October 2004. Am J Infect Control, 32(8), 470-485.
doi:10.1016/j.ajic.2004.10.001
Centers for Disease Control and Prevention. (2011a). Gram-negative bacteria infections
in healthcare settings. Retrieved from
http://www.cdc.gov/hai/organisms/gram-negative-bacteria.html
Centers for Disease Control and Prevention. (2011b). Occupational HIV transmission
and prevention among health care workers. August, 2011. National Center for
HIV/AIDS Viral hepatitis, STD, and B prevention, Division of HIV/AIDS
Prevention. Retrieved from

294
http://www.cdc.gov/hiv/resources/factsheets/pdf/hcw.pdf
Centers for Disease Control and Prevention. (2013a). Handwashing: Clean hands save
lives. Retrieved from http://www.cdc.gov/handwashing/why-handwashing.html
Centers for Disease Control and Prevention. (2013b). Our history - our story. Retrieved
from http://www.cdc.gov/about/history/ourstory.htm
Centers for Disease Control and Prevention. (2013c). Protocol for Hand Hygiene and
Glove use Observations. Retrieved from http://www.cdc.gov/dialysis/prevention-
tools/Protocol-hand-hygiene-glove-observations.html
Centers for Disease Control and Prevention. (2014a). About National Healthcare Safety
Network (NHSN). Retrieved from http://www.cdc.gov/nhsn/about.html
Centers for Disease Control and Prevention. (2014b). CDC/NHSN Surveillance
definitions for specific types of infections. Retrieved from
http://www.cdc.gov/nhsn/PDFs/pscManual/17pscNosInfDef_current.pdf
Centers for Disease Control and Prevention. (2014c). Operational guidance for acute
care hospitals to report central-line-associated bloodstream infections (CLABSI)
data to CDC’s NHSN for the purpose of fulfilling CMS’s hospital inpatient
quality reporting (IQR) requirements. Centers for Medicare and Medicaid
Services. Retrieved from
http://www.cdc.gov/nhsn/PDFs/CMS/Final-ACH-CLABSI-Guidance-2015.pdf
Centers for Disease Control and Prevention. (2015a). CDC current outbreak list.
Retrieved from http://www.cdc.outbreaks
Centers for Disease Control and Prevention. (2015d). MERS in the Republic of Korea.

295
Retrieved from
http://wwwnc.cdc.gov/travel/notices/watch/mers-republic-of-korea
Centers for Disease Control and Prevention. (2015e). 2014 Ebola outbreak in West
Africa: reported cases graphs. Retrieved from
http://www.cdc.gov/vhf/ebola/outbreaks/2014-west-africa/cumulative-cases-
graphs.html
Centers for Disease Control and Prevention. (2015f). Foodborne illness and outbreak
investigations. Retrieved from http://www.cdc.gov/foodsafety/investigations.html
Centers for Disease Control and Prevention. (n.d.). Appendix E race code list. Retrieved
from http://www.cdc.gov/nchs/data/dvs/RaceCodeList.pdf
Centers for Medicare & Medicaid Services. (2014b). Hospital-acquired conditions
(HAC) in acute inpatient prospective payment system (IPPS) hospitals. Retrieved
from http://www.cms.gov/HospitalAcqCond
Certification Board of Infection Control and Epidemiology, Inc. (CBIC), (2015). Contact
us. Retrieved from http://www.cbic.org/contact-us
Chagpar, A., Banez, C., Lopez, R., & Cafazzo, J. A. (2010). Challenges of hand hygiene
in healthcare: The development of a tool kit to create supportive processes and
environments. Healthcare Quarterly, 13, 59-66
doi:10.12927/hcq.2010.21968
Champion, V. L., & Skinner, C. S. (2008). The health belief model. In K. Glanz, B. K.
Rimer, & K. Viswanath (Eds.) Health behavior and health education: Theory,
research, and practice (p. 45-62). San Francisco, CA: Jossey-Bass.

296
Chang, N-C., N., Reisinger, H. S., Jesson, A. R., Schweizer M. L., Morgan, D., J.,
Forrest, G. N., & Perencevich, E. N. (2016). Feasibility of monitoring compliance
to the My 5 Moments and Entry/exit hand hygiene methods in US hospitals.
Am J Infect Control, 44(8), 938-940. doi:10.1016/j.ajic.2016.02.007
Chen, L. F., Carriker, C., Staheli, R., Isaacs, P., Elliott, B., Miller, B. A., … Sexton, D. J.
(2013). Observing and improving hand hygiene compliance: Implementation and
refinement of an electronic-assisted direct-observer hand hygiene audit program.
Infect Control Hospital Epidemiol, 34(2), 207-210. doi:10.1086/669084
Cheng, V.C.C., Tai, J.W.M., Ho, S.K.Y., Chan, J.F.W., Hung, K.N., Ho, P.L., Yuen,
K.Y.(2011). Introduction of an electronic monitoring system for monitoring
compliance with Moments 1 and 4 of the WHO “My 5 Moments for Hand
Hygiene” methodology. BioMed Center Infectious Diseases, 11, 151-164.
doi:10.1186/1471-2334-11-151
Christian denominations. (2015). Religion facts. Retrieved from
http://www.religionfacts.com/christianity/branches
Claude-Louis Berthollet. (n.d.). French chemist. Retrieved from
http://www.chemistryexplained.com/Ar-B0/Berthollet-Claude-Louis.html
Committee to Reduce Infection Deaths. (2013). State legislation & initiatives on
healthcare-associated infections. Updated October 2011. Retrieved from
http://www.hospitalinfection.org/legislation.shtml
Conway, P. (2013). U. S. efforts to reduce healthcare-associated infections. Testimony
before the Committee on Health, Education, Labor & Pensions, U.S. Senate;

297
September 24, 2013. U.S. Department of Health and Human Services. Retrieved
from https://www.gpo.gov/fdsys/pkg/CHRG-113shrg20866/html/CHRG-
113shrg20866.htm
Cork, D. P., Maxwell, P. J., & Yeo, X. J. (2011). Remembering Semmelweis: Hand
hygiene and its importance on today’s clinical practice. The American Surgeon,
77(1), 123-125. ISSN: 1555-9823, 2011, Jan. PMID: 21396327. Retrieved from
https://www.ncbi.nlm.nih.gov/pubmed/21396327
Creamer, E. Dorrian, S., Dolan, A., Sherlock, O., Fitzgerald-Hughes, D., Thomas, T., …
Humphreys, H. (2010). When are the hands of healthcare workers positive for
methicillin-resistant Staphylococcus aureus? Journal of Hospital Infection, 75(2),
107-111. doi:10.1016/j.jhin.2009.12.005
Creswell, J. W. (2009). Research design: Qualitative, quantitative, and mixed methods
approaches. Thousand Oaks, CA: Sage Publications, Inc.
Cruz, J. P., & Bashtawi, M. A., (2015). Predictors of hand hygiene practice among Saudi
nursing students: A cross-sectional self-reported study. Journal of Infection and
Public Health, 9(4), 485-493. doi:1016/j.jiph.2015.11.010
Cusini, A., Nydegger, D., Kaspar, T., Schweiger, A., Kuhn, R., & Marshall, J. (2015).
Improved hand hygiene compliance after eliminating mandatory glove use from
contact precautions – Is less more? Am J Infect Control, 43(9),
922-927. doi:10.1016/j.ajic.2015.05.0019
Dai, H., Milkman, K. L., Hofmann, D. A., & Staats, B. R. (2015). The impact of time at
work and time from work on rule compliance: The case of hand hygiene in health

298
care. Journal of Applied Psychology, 100(3), 846-862. doi:10.1037/a0038067
Davies, A. (2012). Battle of the jumbo jets: Airbus A380 vs. Boeing 747-81. Retrieved
from
http://www.businessinsider.com/airbus-a380-v-boeing-747-8i-breakdown-2012-9
Davis, J. (2014). Peripheral vascular catheter-related infection: Dwelling on dwell time.
Pennsylvania Patient Safety Advisory, 11(1), 30-35. Retrieved from
http://patientsafetyauthority.org/ADVISORIES/AdvisoryLibrary/2014/Mar;11(1)/
Documents/mar;11(1).pdf
de Almeida e Borges, L. F., Rocha, L. A., Nunes, M. J. & Filho, P. P. G. (2012). Low
adherence to handwashing program and high nosocomial infection in a Brazilian
hospital. Interdisciplinary Perspectives on Infectious Diseases, 2012, article ID
579681. doi:10.1155/2012/579681
Dearing, J. W. (2009). Applying diffusion of innovation theory to intervention
development. Research on Social Work Practice, 19(5), 503-518.
doi:10.1177/1049731509335569
Deficit Reduction Act Sec.5001. Hospital Quality Improvement. (2005). Retrieved from
http://www.cms.gov/Medicare/Medicare-Fee-for-Service-
Payment/HospitalAcqCond/Downloads/DeficitReductionAct2005.pdf
Delaware Health and Social Services, Division of Public Health. (2011). Direct and
indirect disease transmission. Retrieved from
http://dhss.delaware.gov/dhss/dph/files/directindtranspi.pdf
DeMaio, T. J., & Bates, N. (2012). New relationships and marital status questions: A
299
reflection of changes to the social and legal recognition of same-sex couples in
the U.S. Center for Survey Measurement. Research & Methodology Directorate,
U.S. Census Bureau, Washington, D.C. 20233. Retrieved from
https://www.census.gov/srd/papers/pdf/rsm2012-02.pdf
Demographic questions. (n.d.). Department of Psychology. Stanford University.
Retrieved from https://psychology.stanford.edu/demographicquestions
Developing a research proposal. (n.d.). Planning the methodology – limitations and
delimitations. Retrieved from
https://www.bcps.org/offices/lis/researchcourse/develop_writing_methodology_li
mitations.html
DeWandel, D., Maes, L., Labeau, S., Vereecken, C., & Blot, S. (2010). Behavioral
determinates of hand hygiene adherence in intensive care units. American
Journal of Critical Care, 19(3), 230-239. ISSN: 1062-3264. PMID: 20436062.
Retrieved from http://ajcc.aacnjournals.org/content/19/3/230.long
Dick, A. W., Perencevich, E. N., Pogorzelska-Maziarz, M., Zwanziger, J., Larson, E. L.,
& Stone, P. W. (2015). A decade of investment in infection prevention: A cost-
effectiveness analysis. Am J Infect Control, 43(1), 4-9.
doi:10.1016/j.ajic.2014.07.014
Dilek, A., Ülger, F., Esen, S., Acar, M., Leblebicioglu, H., & Rosenthal, V. D. (2012).
Impact of education and process surveillance on device-associated health care-
associated infection rates in a Turkish ICU: Findings of the International
Nosocomial Infection Control Consortium (INICC). Balkan Medical Journal 29,

300
88-92. doi:10.5152/balkanmedj.1011.028
Diller, T., Kelly, J. W., Blackhurst, D., Steed, C., Boeker, S., & McElveen, D. C. (2014).
Estimation of hand hygiene opportunities on an adult medical ward using 24-hour
camera surveillance: Validation of the HOW22 Benchmark Study. Am J Infect
Control, 42(6), 602-607. doi:10.1016/j/ajic.2014.02.020
Donker, T., Wallinga, J., Slack, R. & Grundmann, H. (2012). Hospital networks and the
dispersal of hospital-acquired pathogens by patient transfer. PLOS One, April 25,
2012. doi:10.1371/journal.pone.003500
Donlan, R. M. (2001). Biofilm: Microbial life on surfaces. Emerging Infectious
Disease Journal, 8(9), ISSN:1080-6059. doi:10.3201/eid0702.700277 Centers
for Disease Control and Prevention. Theme issue. 4th Decennial International
Conference on Nosocomial and Healthcare-Associated Infections. Retrieved from
http://wwwnc.cdc.gov/eid/article/7/2/pdfs/70-0277.pdf
Donlan, R. M. (2002). Biofilms and device-associated infections. Emerging Infectious
Disease Journal, 7(2), ISSN:1080-6059. Centers for Disease Control and
Prevention. http://dx.doi.org/10.3201/eid0809.020063
dos Santos, R. P., Konkewicz, L. R., Nagel, F. M., Lisboa, T., Stat, R. C. X., Jacoby, T.,
… Kuchenbecker, R. (2013). Changes in hand hygiene adherence after a
multimodal intervention and seasonality variation. Am J Infect Control, 41(11),
1012-1016. doi:10.1016/j.ajic.2013.05.020
Dudeck, M. A., Horan, T. C., Peterson, K. D., Allen-Bridson, K., Morell, G., Anttila, A.,
… Edwards, J. R. (2013). National Healthcare Safety Network (NHSN) Report,
301
data summary for 2011, device-associated module. Centers for Disease Control
and Prevention. Retrieved from
http://www.cdc.gov/nhsn/PDFs/dataStat/NHSN-Report-2011-Data-Summary.pdf
Duerden, B., Fry, C., Johnson, A. P., & Wilcox, M. H. (2015). The control of methicillin-
resistant Staphylococcus aureus blood stream infections in England. Open Forum
Infectious Diseases, 2(2). doi:10.1093/ofid/ofv035
Duggan, J. M., Hensley, S., Khuder, S., Papadimos, T. J., & Jacobs, L. (2008). Inverse
correlation between level of professional education and rate of handwashing
adherence in a teaching hospital. Infection Control and Hospital Epidemiology,
29(6), 534-538. doi:10.1086/588164
Dulon, M., Peters, C., Schablon, A., & Nienhaus, A. (2014). MRSA carriage among
healthcare workers in non-outbreak settings in Europe and the United States: a
systematic review. BMC Infectious Diseases, 14, 363. doi:10.1186/1471-2334-14-
363
Eber, M. R., Laxminarayan, R., Perencevich, E. N. & Malani, A. (2010). Clinical and
economic outcomes attributable to health care-associated sepsis and pneumonia.
JAMA Internal Medicine (Formally Archives of Internal Medicine), 170(4),
347-353. doi:10.1001/archinternmed.2009.509
Eckmanns, T., Bessert, J., Behnke, M., Gastmeier, P., & Rüden, H. (2006). Compliance
with antiseptic hand rub in intensive care units: The Hawthorne Effect. Infection
Control and Hospital Epidemiology, 27(9), 931-934. doi:10.1086/507294
Ecological perspective. (n.d.). Retrieved from

302
http://homepages.wmich.edu/~weinreic/SWRK350/TheoryLearningObject/ecolog
ical.html
Ecological systems perspective. (n.d.). School of Social Work. University of Windsor.
Retrieved from http://www1.uwindsor.ca/socialwork/ecological-systems-
perspective
Edgeworth, J. D., Yadegarfar, G., Pathak, S., Batra, R., Cockfield, J. D., Wyncoll, D., …
Lindsay, J. A. (2007). An outbreak in an intensive care unit of a strain of
methicillin-resistant Staphylococcus aureus sequence type 239 associated with an
increased rare of vascular access deice-related bacteremia. Clinical Infectious
Diseases, 44(40), 493-501. doi:10.1086/511034
Edwards, D., Monk-Turner, E., Poorman, S., Rushing, M., Warren, S., & Willie, J.
(2002). Predictors of hand-washing behavior. Social Behavior and Personality,
30(8), 751-756. doi:10.2224/sbp.2002.30.8.751
Eiamsitrakoona, T., Apisarnthanarak, A., Nuallaong, W., Khawcharoenporn, T., &
Mundy, L. M. (2013). Hand hygiene behavior: Translating behavioral research
into infection control practice [Abstract]. Infection Control &Hospital
Epidemiology, 34(11), 1137-1145. doi: 10.1086/673446
Erasmus, V., Brouwer, W. van Beeck, E. F., Oenema, A., Daha, T. J., Richardus, J. H.,
… Brug, J. (2009). A qualitative exploration of reasons for poor hand hygiene among
hospital workers: Lack of positive role models and of convincing evidence that hand
hygiene prevents cross-infection. Infection Control and Hospital Epidemiology, 30(5),
415-419. doi:10.1086/596773
303
Erasmus, V., Daha, T. J., Brug, H., Richardus, J. H., Behrendt, M. D., Vos, M. C.,
& van Beeck, E. F. (2010). Systematic review of studies on adherence with hand
hygiene guidelines in hospital care [Abstract]. Infection Control and Hospital
Epidemiology, 31(3), 283-294. doi:10.1086/650451
Esteves, D. C., Pereira, V. C., Souza, J. M., Keller, R., Simões, R. D., Eller, L. K.,
W., & Rodrigues, M. V. P. (2016). Influence of biological fluids in
bacterial viability on different hospital surfaces and fomites. Am J Infect
Control, 44(3), 311-314. doi:10.1016/j.ajic.2015.09.033
Eveillard, M., Raymond, F., Guilloteau, V., Pradelle, M-T., Kempf, M., Zilli-
Dewaele, M., … Brunel, P. (2011). Impact of a multi-faceted training
intervention on the improvement of hand hygiene and gloving practices in
four healthcare settings including nursing homes, cute-care geriatric wards
and physical rehabilitation. Journal of Clinical Nursing, 20, 2744-2751.
doi:10.1111/j.1365-2702.2011.03704.x
External validity. (2012). Lærd dissertation. Lund Research Ltd. Retrieved from
http://dissertation.laerd.com/external-validity.php
Famous doctors. (2009b). Famous doctors: Ignaz Semmelweis: Bright knowledge.
Retrieved from http: www.brightknowledge.org/knowledge-bank/medicine-and-
healthcare/famous-medicine/famous-doctors-ignaz-semmelweis
Faul, F., Erdfelder, E., Lang, A.-G., & Buchner, A. (2007). G*Power 3: A flexible
statistical power analysis program for the social, behavioral, and

304
biomedical sciences. Behavior Research Methods, 39, 175-191. PMID 17695343.
Retrieved from http://www.gpower.hhu.de Also retrieved from
https://www.ncbi.nlm.nih.gov/pubmed/17695343
Faul, F., Erdfelder, E., Buchner, A., & Lang, A.-G. (2009). Statistical power
analyses using G*Power 3.1: Tests for correlation and regression analyses.
Behavior Research Methods, 41, 1149-1160. doi:10.3758/BRM.41.4.1149
Retrieved from http://www.gpower.hhu.de
Featured religions and beliefs. (2014). Religions. Retrieved from
http://www.bbc.co.uk/religion/religions
Field, A. (2005). Discovering statistics using SPSS. London, England: Sage Publications.
Field, A. (2013). Discovering statistics using IBM SPSS statistics. Los Angeles, CA:
Sage.
Filho, M., A., O., Marra, A. R., Magnus, T. P., Rodrigo, R. D., Prado, M., de Souza
Santini, T., R., … Edmond, M., B. (2014). Comparison of human and electronic
observation for the measurement of compliance with hand hygiene. Am J Infect
Control, 42, 1188-92. doi:10.1016/j.ajic.2016.07.031
Fischer, K., & Zink, K. J. (2012). Defining elements of sustainable work systems – a
system-oriented approach. Work, 41, 3900-3905.
doi:10.3233/WOR-2012-0059-3900
FitzGerald, G., Moore, G., & Wilson, A. P. R. (2013), Hand hygiene after touching a
patient’s surroundings: the opportunities most commonly missed. Journal of
Hospital Infection, 84, 27-31. doi:10.1016/j/jhin.2013.01.008
305
Foreign exchange service. (2015). USF Rex. Retrieved from
http://www.usforex.com/currency-converter
Forthofer, R. N., Lee, E. S., & Hernandez, M. (2007). Biostatistics: A guide to design,
analysis, and discovery. Burlington, MA: Elsevier Academic Press.
French, S. D., Green, S. E., O’Connor, D. A., McKenzie, J. E., Francis, J. J. Michie, S.,
…& Grimshaw, J. M. (2012). Developing theory-informed behaviour change
interventions to implement evidence into practice: a systematic approach using
the Theoretical Domains Framework. Implementation Science, 7, 38.
doi:10.1186/1748-5908-7-38
Fries, J., Segre, A. M., Thomas, G., Herman, T., Ellingson, K., & Polgreen, P. M. (2012).
Monitoring hand hygiene via human observers: How should we be sampling?
Infection Control Hospital Epidemiology, 33(7), 689-695.
doi:10.1086/666346
Fuller, C., Besser, S., Savage, J., McAteer, J., Stone, S., & Michie, S. (2014). Application
of a theoretical framework for behavior change to hospital workers’ real-time
hand in the latex glove: A study of hand hygiene compliance when gloves are
worn. Infect Control Hosp Epidemiology, 32(12), 1194-1199. doi:10.1086/662619
Gallup poll: Nursing is the most trustworthy profession. (2013). Future of nursing,
Campaign for action. Retrieved from http://campaignforaction.org/community-
post/2013-gallup-poll-nursing-most-trustworthy-profession
García-Vázquez, E., Murcia-Payá, J., Canteras, M., & Gómez, J. (2010). Influence of a
hygiene promotion programme on infection control in an intensive-care unit.

306
Clinical Microbiology and Infection, 17(6), 894-900. doi:10.1111/j.1469-
0691.2010.03391.x
Garner, J. S., Favero, S., & Hospital Infections Program Center for Infectious Diseases,
Centers for Disease Control and Prevention. (1985). Guidelines for handwashing
and hospital environmental control, 1985. Centers for Disease Control and
Prevention. Retrieved from http://wonder.cdc.gov/wonder/prevguid/p0000412.asp
Garner, J. S., Jarvis, W. R., Emori, T. G., Horan, T. C., & Hughes, J. M. (1988). CDC
definitions for nosocomial infections, 1988 [Abstract]. Am J Infect Control, 16(3),
128-140. doi:10.1016/01966553(88)90053-3
Geffers, C., Sohr, D., & Gastmeier, P. (2008). Mortality attributable to hospital-acquired
infections among surgical patients. The Society for Healthcare Epidemiology of
America, 29(12), 1167-1170. doi:10.1086/592410
General demographic questions for any survey. (2009). Archdiocese of Philadelphia.
Retrieved from http://parishsurvey.org/samples.htm
Gerba, C. P., Wuollet, A., L., Raisanen, P., & Lopez, G. U. (2016). Bacterial
contamination of computer touch screens. Am J of Infect Control, 44(3), 358-
360. doi:10.1016/j.ajic.2015.10.013
Gifford, B. D., Zammuto, R. F., & Goodman, E. A. (2002). The relationship between
Hospital unit culture and nurses’ quality of work life. J. Healthc Manag, 47(1),
13-25. PMI:11836962. Retrieved from
https://www.ncbi.nlm.nih.gov/pubmed/11836962
Gill, N. S. (2015). Is “First do no harm” from the Hippocratic oath? Myth vs fact.

307
Retrieved from
http://ancienthistory.about.com/od/greekmedicine/f/HippocraticOath.htm
Goldman, M. (2008). Why is multiple testing a problem? Retrieved from
http://www.stat.berkeley.edu/users/mgoldman
Gould, D. J., Chudleigh, J., Drey, N. S., & Moralejo, D. (2007). Measuring handwashing
performance in health service audits and research studies. Journal of Hospital
Infection 66, 109-115. doi:10.1016/j.jhin.2007.02.009
G*Power: Statistical Power Analysis for Windows and Mac. (2013). Heinrich Heine
Universität Düsseldorf. Retrieved from http://www.gpower.hhu.de/en.html
Graf, K., Ott, E., Wolny, M., Tramp, N., Vonberg, R-P., Haverich, A., & Chaberny, I. F.
(2013). Hand hygiene adherence in transplant and other special patient groups:
An observational study. Am J Infect Control, 41(6), 503-508.
doi:10.1016/j.ajic.2012.09.00
Greising, C. H. (2010). Accountability at the top. Trustee, 63(9), 32. ISSN 00413674
Retrieved from
http://search.proquest.com.ezp.waldenulibrary.org/pqcentral/docview/759655256/
6767AC8689B24520PQ/8?accountid=14872
Griffith, I. (1918). The Dakin or Carrel-Dakin solution. The National Druggist, Volume
XLVIII, p. 23. Saint Louis, MO: Henry R. Strong.
Hagel, S., Reischke, J., Kesselmeir, M., Winning, J., Gastmeier, P., Brunkhorst, F., …
Pletz, M. W. (2015). Quantifying the Hawthorne Effect in hand hygiene
compliance through comparing direct observation with automated hand hygiene

308
monitoring [Abstract]. Infection Control and Hospital Epidemiology, 36(8), 957-
962. doi:10.1017/ice.2015.93
Haley, R. W., & Bregman, D. A. (1982). The role of understaffing and overcrowding in
recurrent outbreaks of Staphylococcal infection in a neonatal special-care unit.
The Journal of Infectious Diseases, 145(6), 875-885.
doi:10.1093/infdis/145.6.875
Haley, R. W., Culver, D. H., White, J. W., Morgan, W. M., & Emori, T. G. (1985a).
The national nosocomial infection rate. American Journal of Epidemiology,
121(2), 159-167. Retrieved from
https://www.researchgate.net/profile/Robert_Haley/publication/271587330_1985
_The_Nationwide_Nosocomial_Infection_Rate/links/54cd16e50cf298d6565caeff.
Haley, R. W., Culver, D. H., White, J. W., Morgan, W. M., Emori, T. G., Munn, V. P. &
Hooton, T. M. (1985b). The efficacy of infection surveillance and control
programs in preventing nosocomial infections in US hospitals (SENIC Project).
American Journal of Epidemiology, 121(2), 182-205. PMID 4014115. Retrieved
from https://www.ncbi.nlm.nih.gov/pubmed/4014115 Also retrieved from
ftp://72.167.42.190/ge/pdf/CAUTI/EfficacyOfInfectionSurveillanceAndControlPr
ograms_CAUTI_Haley_AmJEpid_0285.pdf
Haley, R. W., Quade, D., Freeman, H. E., & Bennet, J. V. (1980). Study on the efficacy
of nosocomial infection control (SENIC Project): Summary of study design
[Abstract]. American Journal of Epidemiology, 111(5), 472-485. Retrieved from
309
http://aje.oxfordjournals.org/content/111/5/472.short
Hand hygiene. (2015). Historical, Labarraque. International Spine Intervention Society.
Retrieved from https://www.spinalinjection.org/fact-finder.php?pID=20
Hanna, D., Davies, M., & Dempster, M. (2009). Psychological processes underlying
nurses’ handwashing behaviour. Journal of Infection Prevention, 10(3), 90-95.
doi:10.1177/1757177409104596
Harbarth, S., Sudre, P., Dharan, S., Cadenas, M., & Pittet, D. (1999). Outbreak of
Enterobacter cloacae related to understaffing, overcrowding, and poor hand
hygiene practices [Abstract]. Infection Control and Hospital Epidemiology, 20(9),
598-603. doi:10.1086/501677
Hassan, M., Tuckman, H. P., Patrick, R. H., Kountz, D. S., & Kohn, J. L. (2010). Cost of
hospital-acquired infection [Abstract]. Hospital Topics, 88(3), 82-89
doi:10.1080/00185868.2010.507124
Health Research & Educational Trust. (2010). Hand Hygiene Project: Best Practices from
Hospitals Participating in the Joint Commission Center for Transforming
Healthcare Project. Chicago: Health Research & Educational Trust. Retrieved
from http://www.hpoe.org/Reports-HPOE/hand_hygiene_project.pdf
Hebden, J. N. (2015). Slow adoption of automated infection prevention surveillance: Are
human factors contributing? Am J Infect Control, 43, (6), 559-562).
doi10.1016/j.ajic.2015.02.007
Hessels, A. J., & Larson, E. L. (2016). Relationship between patient safety climate and
standard precautions adherence: A systematic review of the literature. Journal of

310
Hospital Infection, 92, 349-362. doi:10.1016/j/jhin.2015.08.023
Historical perspective on hand hygiene in health care. (2009). WHO Guidelines on Hand
Hygiene in Health Care: First Global Patient Safety Challenge Clean Care is Safer
Care. Retrieved from http://www.ncbi.nlm.nih.gov/books/NBK144018/
Holmes, O. W. (1843). Contagiousness of puerperal fever: Part 1. The New England
Quarterly Journal of Medicine, reprinted in the Medical Essays in 1855.
Retrieved from
http://holmes.classicauthors.net/ContagiousnessOfPuerperalFever
Horan, T. C., Andrus, M., & Dudeck, M. A. (2008). CDC/NHSN surveillance definition
of health care-associated infection and criteria for specific types of infections in
the acute care setting. Am J Infect Control, 36(5), 309-332.
doi:10/1016/j.ajic.2008.03.002
Hospital National Patient Safety Goals. (2015). The Joint Commission. Retrieved from
http://www.jointcommission.org/assets/1/6/2015_HAP_NPSG_ER.pdf
Hosseinialhashemi, M., Kermani, F. S., Palenik, C. J., Pourasghari, H., & Askarian, M.
(2015). Knowledge, attitudes, and practices of health care personnel concerning
hand hygiene in Shiraz University of Medical Sciences hospitals, 2013-2014.
Am J Infect Control 43(9), 1009-1011. doi:10.1016/j.ajic.2015.05.002
Hota, B. (2004). Contamination, disinfection, and cross-colonization: Are hospital
surfaces reservoirs for nosocomial infection? Healthcare Epidemiology, 39(8),
1182-1189. doi:10.1086/424667
How many major races are there in the world? (2011). World-Mysteries Blog. Relate

311
IQ - CRM Platform. Retrieved from http://blog.world-
mysteries.com/science/how-many-major-races-are-there-in-the-world/
Hu, B., Tao, L., Rosenthal, V. D., Liu, K., Yun, Y., Suo, Y., …Saunders, C. L. (2013).
Device-associated infection rates, device use, length of stay, and mortality in
intensive care units of 4 Chinese hospitals: International Nosocomial Control
Consortium findings. Am J Infect Control, 41(4), 301-306.
doi:10.1016/j.ajic.2012.03.037
IBM Corp. Released 2013. IBM SPSS Statistics for Macintosh, version 22.0. Retrieved
from http://www-01.ibm.com/support/docview.wss?uid=swg21476197
idre. Institute for digital research and education. (2015). Annotated SPSS output logistic
regression. Retrieved from http://www.ats.ucla.edu/stat/spss/output/logistic.htm
Improved water source (% of population with access). (2015). World Bank Group.
Retrieved from http://data.worldbank.org/indicator/SH.H2O.SAFE.ZS
Infante, C. (2006). Bridging the “system’s” gap between interprofessional care and
patient safety: Sociological insights. Journal of Interprofessional Care, 20(5),
517-525. doi:10.1080/13561820600937598
Iñiguez G, Tagüeña-Martínez J, Kaski KK, Barrio RA (2012) Are Opinions Based on
Science: Modeling Social Response to Scientific Facts. PLoS ONE 7(8): e42122.
doi:10.1371/journal.pone.0042122
Iowa Department of Public Health Center for Acute Disease Epidemiology Healthcare
Associated Infection Prevention Plan January 01, 2010 (Updated April 28, 2010).
(2010). Retrieved from http://www.cdc.gov/HAI/pdfs/stateplans/Iowa.pdf

312
Isakov, A., Jamison, A., Miles, W., & Ribner, B. (2014). Safe management of patients
with serious communicable diseases: Recent experience with Ebola virus. Annals
of Internal Medicine, 161(11), 829-830. doi:10.7326/M14-2084
Jain, S., Edgar, Bothe, J., Newman, H. Wilson, A., Bint, B.,… Harris, J. (2015).
Reflection on observation: A qualitative study using practice development
methods to explore the experience of being a hand hygiene auditor in Australia.
Am J Infect Control, 43, 1310-1315. doi:10.1016/j.ajic.2015.07.009
Jansson, M. M., Syrjälä, H. P., Ohtonen, P. P., Meriläinen, M. H., Kyngäs, H. A., & Ala-
Kokko, T. I. (2016). Simulation education as a single intervention does not
improve hand hygiene practices: A randomized controlled follow-up study.
Am J Infect Control, 44(6), 625-630. doi:10.1016/j.ajic.2015.12.030
Jantarasri, L., Soparatana, P., Moongtui, W., Tantisiriwat, W., & Danchaivijitr, S.,
(2005). Roles of infection control nurses in community hospitals. J Med Assoc
Thai, 88, Suppl 10, S92-99. PMID: 16850649. Retrieved from
https://www.ncbi.nlm.nih.gov/pubmed/16850649
Jimmieson, N. L., Tucker, M. K., White, K. M., Liao, J.. Campbell, M., Brain, D., …
Graves, N. (2016). The role of time pressure and different psychological safety
climate referent in the prediction of nurses’ hand hygiene compliance. Safety
Science, 82, 29-43. doi:10/1016/j.ssci.2015.08.015
John, A., Tomas, M. E., Cadnum, J. L., Mana, T. S.C., Jencson, A., Shaikh, A., …

313
Donskey, C. J. (2016). Are health care personnel trained in correct use of personal
protective equipment? Am J Infect Control, 44(7), 840-842.
doi:10.1016/j/ajic.2016.03.031
Johnson, L., Grueber, S., Schlotzhauer, C., Phillips, E., Bullock, P., Basnett, J., & Hahn-
Cover, K. (2014). A multifactorial action plan improves hand hygiene adherence
and significantly reduces central line-associated bloodstream infections. Am J
Infect Control, 42(11), 1146-51. doi:10.1016/j.ajic.2014.07.003
Johnson, N., & Niles, M. (2016). Hand hygiene: Validation of self audits. Am J Infect
Control, 44(6), S28-S82. Supplement 2 June 2016. Poster abstract, 9 – 197, S63.
APIC 43 Annual Educational Conference & International Meeting/Charlotte, NC/
June 11-13, 2016. Retrieved from
http://ac.els-cdn.com.ezp.waldenulibrary.org/S0196655316301250/1-s2.0-
S0196655316301250-main.pdf?_tid=b117d2c2-30d4-11e6-b909-
00000aab0f02&acdnat=1465760254_96c390ff07b4f23115230e3e37c1b7fd
Joseph Lister and antiseptic surgery. (2015). Infectious diseases – timeline. The
Association of the British Pharmaceutical Industry. Retrieved from
http://www.abpischools.org.uk/page/modules/infectiousdiseases_timeline/timelin
e5.cfm?coSiteNavigation_allTopic=1
Jumaa, P. A. (2005). Hand hygiene: simple and complex. International Journal of
Infectious Diseases, 9 (1), 3-14. doi:10.1016/j.ijid.2004.05.005
Kalata, N. L., Kamange, L., & Muula, A. S. (2013). Adherence to hand hygiene protocol
by clinicians and medical students at Queen Elizabeth Central Hospital, Blantyre-

314
Malawi. Malawi Medical Journal, 25(2), 50-52. Retrieved from PubMed at
http://www.ncbi.nlm.nih.gov/pmc/articles/PMC3784937/
Kapil, R., Bhavsar, H. K., & Madan, M. (2015). Hand hygiene in reducing
transient flora on the hands of healthcare workers: An educational intervention.
Indian Journal of Medical Microbiology, 33(1), 125-128. doi:10.4103/0255-
0857.148409
Katherason, S. G., Naing, L., Jaalam, K., Mohamad, N. A. N., Bhojwani, K., Harussani,
N., & Ismail, A., (2010). Hand decontamination practices and the appropriate use
of gloves in two adult intensive care units in Malaysia. Journal of Infection in
Developing Countries, 4(2), 118-123. ISSN: 2036-6590. Retrieved from the
http://www.jidc.org/index.php/journal/article/viewArticle/593
Kaufman, G., & McCaughan, D. (2013). The effect of organizational culture on patient
safety. Nursing Standard, 27(43), 50-56. Retrieved from
http://web.a.ebscohost.com.ezp.waldenulibrary.org/ehost/pdfviewer/pdfviewer?vi
d=17&sid=fdf52462-bef6-4910-86b4-
bcb24afa4a21%40sessionmgr4004&hid=4209
Kendall, A., Landers, T., & Kirk, J. (2012). Point-of-care hand hygiene: Preventing
infection behind the curtain. Am J Infect Control, 40(4), S3-S10.
doi:10.1016/j.ajic.2012.02.009
Khan, R., Al-Dorzi, J. M., Al-Attas, K., Ahmed, F. W., Marini, A. M., Mundekkadan, S.,
… Arabi, Y. M. (2016). The impact of implementing multifaceted interventions

315
on the prevention of ventilator-associated pneumonia. Am J Infect Control, 44(3),
320-326. doi:10.1016/j.ajic.2015.09.025
Kingston, L., O’Connell, N. H., & Dunne, C. P. (2016). Hand hygiene-related clinical
trials reported since 2010: A systematic review. Journal of Hospital Infection,
92(4), 309-320. doi:10.1016/j.jhin.2015.11.012
Knoester, M., de Boer, M. F. J., Maarleveld, J. J., Claas, C. J., Bernards, A. T., de Jonge,
E., …Veldkamp, K. E. (2014). An integrated approach to control a prolonged
outbreak of multidrug-resistant Pseudomonas aeruginosa in an intensive care
unit. Clinical Microbiology and Infection, 20(4), 0207-0215. doi:10.1111/1469-
0691.12372
Kohli, E., Ptak, J., Smith, R., Taylor, E., Talbot, E. A., & Kirkland, K. B. (2009).
Variability in the Hawthorne Effect with regard to hand hygiene performance in
high-and low-performing inpatient care units. Infection Control Hospital
Epidemiology, 30(3), 222-225. doi:10.1086/595692
Kolacz, H. K. (2012). Lab 4 instructions: Multiple linear regression. University of
Alberta. Retrieved from http://www.stat.ualberta.ca/statslabs/stat252/files/ins4.pdf
Korniewicz, D. M., & El-Masri, M. (2010). Exploring the factors associated with hand
hygiene adherence of nurses during routine clinical practice. Applied Nursing
Research, 23(2), 86-90. Retrieved from
http://ac.els-cdn.com.ezp.waldenulibrary.org/S0897189708000505/1-s2.0-
S0897189708000505-main.pdf?_tid=3cc2eafe-90c1-11e6-920b-
00000aab0f02&acdnat=1476307210_cb15ca176318f87e9b750cf96b92fc

316
Kovacs-Litman, A., Wong, K., Shojania, K. G., Callery, S. Vearncombe, M., & Leis, J.
A. (2016). Do physicians clean their hands? Insights from a covert observational
study. Journal of Hospital Medicine, 5 July 2016. doi:10.1002/jhm.2632
Kurtz, S. L. (2011). Disparities in hand washing based on culture of patients and
healthcare workers. (Unpublished master’s thesis). Capella University,
Minneapolis, MN.
Kutscher, B. (2014). Hospitals, systems see operating margins shrink as expenses climb.
Modern Healthcare, August 13, 2014. Retrieved from
http://www.modernhealthcare.com/article/20140813/NEWS/308139963
Lærd dissertation. (2012) Internal validity. Lund Research Ltd. Retrieved from
http://dissertation.laerd.com/internal-validity.php
Lærd statistics. (2013). Multinomial logistic regression using SPSS statistics. Retrieved
from https://statistics.laerd.com/spss-tutorials/multinomial-logistic-regression-
using-spss-statistics.php
Landers, T., Ellingson, K., Grow, M. A., Kendall, A., Marx, J. F., Pincock, T., … Steed,
C. (2015). Guide to hand hygiene programs for infection prevention. Association
for Professionals in Infection Control and Epidemiology (APIC). ISBN:1-933-13-
60-5. Retrieved from http://www.apic.org
Lane, H. J., Blum, N., & Fee, E. (2010). Oliver Wendell Holmes (1809-1894) and Ignaz
Philipp Semmelweis (1818-1865): Preventing the transmission of puerperal fever.
American Journal of Public Health, 100(6), 1008-1009.
doi:10.2105/AJPH.2009.185363

317
Lang, S. S. (2015). Urie Bronfenbrenner, father of Head Start program and pre-eminent
‘human ecologist’, dies at age 88. Cornell Chronicle. Cornell University.
Retrieved from
http://www.news.cornell.edu/stories/2005/09/head-start-founder-urie-
bronfenbrenner-dies-88
Lankford, M. G., Zembower, T. R., Trick, W. E., Hacek. D. M., Noskin, G. A., &
Peterson, L. R. (2003). Influence of role models and hospital design on hand
hygiene of healthcare workers. Emerging Infectious Diseases, 9(2), 217-223.
doi:10.3201/eid0902.020249
Largest Christian denominations (35) in the United States. (2015). ProCon.org. American
Religious Identification Survey, 2001. Graduate Center of the City University of
New York. Retrieved from
http://undergod.procon.org/view.background-resource.php?resourceID=87
Larson, E. (2013). Monitoring hand hygiene: Meaningful, harmful, or helpful? Am
J Infect Control, 41(5), S42-S5. doi:10.1016/j.ajic.2012.09.029
Larson, E., & Lusk, E. (2006). Evaluating handwashing technique. Journal of Advanced
Nursing, 53(1), 46-53. doi:10.1111/j.1365-2648.2006.03666.x
Larson. E. L., Aiello, A. E., & Cimiotti, J. P. (2004). Assessing nurses’ hand hygiene
practices by direct observation or self-report. Journal of Nursing Measurement,
12,(1), 77-85. doi:10.1891/jnum.12.1.77.66072
Lathan, S. R. (2010). Caroline Hampton Halsted: the first to use rubber gloves in the
operating room. Baylor University Medical Center Proceedings, 23(4), 389-392.

318
US national Library of Medicine National Institutes of Health.
PMCID: PMC2943454. Retrieved from
http://www.ncbi.nlm.nih.gov/pmc/articles/PMC2943454/
Lebovic, G., Siddiqui, N., & Muller, M. P. (2013). Predictors of hand hygiene
adherence in the era of alcohol-based hand rinse. Journal of Hospital Infection,
83(4), 276-283. doi:10.1016/j.jhin.2013.01.001
Lee, A., Chalfine, A., Daikos, G. L., Garilli, S., Jovanovic, B., Lemmen, S., …Harbarth,
S. (2011). Hand hygiene practices and adherence determinants in surgical wards
across Europe and Israel: A multicenter observational study. Am J Infect Control,
39(6), 517-520. doi:10.1016/j.ajic.2010.09.007
Lee, Y. F., Merican, H., Nallusamy, R., Ong, L. M., Nazir, P. M., Hamzah, H. B., &
McLaws, M-L. (2016). Hand hygiene compliance in Penang, Malaysia: Human
audits versus product usage. Am J Infect Control, 44(6), e95-e97.
doi:10.1016/j.ajic.2015.12.031
Leon, A. C., Davis, L. L., & Kraemer, H. C. (2011). The role and interpretation of pilot
studies in clinical research. Journal of Psychiatric Res, 45(5), 626-629.
doi:10.1016/j.jpsychires.2010.10.008
Lewis, S., Moehring, R., Chen, F., Sexton, D., & Anderson, D. (2013). Assessing the
relative burden of hospital-acquired infections in network of community hospitals.
Infection Control Hospital Epidemiology, 34(11), 1229-1230.
doi:10.1086/673443
Linam, W. M., Honeycutt, M. D., Gilliam, C. H., Wisdom, C. M., Bai, S., Deshpande, J.

319
K. (2016). Successful development of a direct observation program to measure
health care worker hand hygiene using multiple trained volunteers. Am J Infect
Control, 44(5), 544-547. doi:10.1016/j.ajic.2015.12.019
Lohiniva, A.-L., Bassim, H., Hafez, S., Kamel, E., Ahmed, E. Saeed, T., & Talaat, M.
(2015). Determinants of hand hygiene compliance in Egypt: Building blocks for
a communication strategy. Eastern Mediterranean Health Journal, 21(9), 665-
670. SSN: 1020-3397. PMID: 26450863. Retrieved from
http://web.a.ebscohost.com.ezp.waldenulibrary.org/ehost/pdfviewer/pdfviewer?vi
d=3&sid=f90b4d49-ad63-47a0-a5b0-
be655d50f448%40sessionmgr4007&hid=4209
Long, J. A., Bamba, M. I., Ling, B., & Shea, J. A. (2006). Missing race/ethnicity data in
Veterans Health Administration based disparities research: A systematic review.
Journal of Health Care for the Poor and Underserved, 17(1), 128-140. Retrieved
from
http://muse.jhu.edu/login?auth=0&type=summary&url=/journals/journal_of_healt
h_care_for_the_poor_and_underserved/v017/17.1long.pdf
Louis Pasteur Biography. (2015). A&E Television Networks. Retrieved from
http://www.biography.com/people/louis-pasteur-9434402#personal-life
Loxton, N. (2008). Data screening using SPSS. Retrieved from
file:///Users/sharonkurtz/Downloads/Natalie%252BLoxton%252BData%252BScr
eening.pdf
Lynch, P., Pittet, D., Borg, M. A., & Mehtar, S. (2007). Infection control in countries

320
with limited resources. Journal of Hospital Infection, 65(S2), 148-150.
Proceedings of the Sixth International Conference of the Hospital Infection
Society. doi:10.1016/S)195-6701(07)60033-4
Machin, D., & Campbell, M. J. (2005). Design of studies for medical research. West
Sussex, England: John Wiley & Sons, Ltd.
Magill, S. S., Edwards, J. R., Bamberg, W., Beldavs, Z. G., Dumyati, G., Kainer, M. A.,
… Fridkin, S., K. (2014). Multistate point-prevalence survey of health care-
associated infections. New England Journal of Medicine, 370(13), 1198-1208.
doi:10.1056/NEJMoa1306801
Magill-Collins, A., Gaither, M., Gerba, C. P., Kitajima, M., Iker, B., & Stoehr, J. D.
(2015). Norovirus outbreaks among Colorado River rafters in the Grand Canyon,
Summer 2012. Wilderness & Environmental Medicine, 26(3) 312-318. Retrieved
from http://ac.els-cdn.com.ezp.waldenulibrary.org/S1080603215001003/1-s2.0-
S1080603215001003-main.pdf?_tid=c075ab64-e227-11e5-a0d7-
00000aab0f01&acdnat=1457109786_9ba1421e3562c97cbb10f32ddedd25ad
Magnus, T. P., Marra, A. R., Camargo, T. Z. S., Victor, E. d. S., da Costa, L. S. S.,
Cardoso, V. J., … Edmond, M. B. (2015). Measuring hand hygiene compliance
rates in different special care settings: A comparative study of methodologies.
International Journal of Infectious Diseases, 33, 205-208.
doi:10.1016/j.ijid.2015.02.016
Mahfouz, A. A., El-Gamal, M. N., & Al-Azraqi, T. A. (2013). Hand hygiene non-
adherence among intensive care unit health care workers in Aseer Central

321
Hospital, south-western Saudi Arabia. International Journal of Infectious
Diseases, 17(9), e729-e732. doi:10.1016/j.ijid.2013.02.025
Mahida, N. (2016). Editorial: Hand hygiene compliance: Are we kidding ourselves?
Journal of Hospital Infection, 92, 307-308. doi:10.1016/j.jhin.2016.02.004
Mahoney, S. (2009). Demographic questions: Sample survey template. Retrieved from
http://blog.verint.com/blog/demographic-questions-sample-survey-template
Maillet, M., Bouvat, E., Robert, N., Baccard-Longère, M., Morel-Baccard, C., Morand,
P., … Stahl, J-P. (2015). Mumps outbreak and laboratory diagnosis. Journal of
Virology, 62, 14-19. doi:10.1016/j.jcv.2014.11.004
Manzur, A., Tubau, F., Pujol, M., Calatayud, L., Dominguez, M. A., Peña, C., … Ariza,
J. (2007). Nosocomial outbreak due to extended-spectrum-beta-lactamase-
producing Enterobacter cloacae in a cardiothoracic intensive care unit. Journal of
Clinical Microbiology, 45(8), 2365-2369. doi:10.1128/JCM.02546-06
Mao, L., & Yang, Y. (2012). Coupling infectious diseases human preventive behavior,
and networks – A conceptual frame for epidemic modeling. Social Science &
Medicine, 74, 167-175. doi:10.1016/j.socscimed.2011.10.012
Marchetti, A., & Rossiter, R. (2013). Economic burden of healthcare-associated infection
in US acute care hospitals – Societal perspective. Journal of Medical Economics,
September. doi:10.3111/13696998.2013.842922
Maree, C. L., Daum, S., Boyle-Vavrat, S., Matayoshi, K., & Miller. L. G. (2007).
Community-Associated methicillin-resistant Staphylococcus aureus isolates and
healthcare-associated infections. Emerging Infectious Disease Journal, 13(2).

322
doi:10.3201/eid1302.060781
Marjadi, B., & McLaws, M.-L. (2010). Hand hygiene in rural Indonesian healthcare
workers: Barriers beyond sinks, hand rubs and in-service training. Journal of
Hospital Infection, 76, 256-260. doi:10.1016/j.jhin.2010.06.021
Markel, H. (2015). In 1850, Ignaz Semmelweis saved lives with three words: wash your
hands. PBS Newshour, May 15, 2015. Retrieved from
http://www.pbs.org/newshour/updates/ignaz-semmelweis-doctor-prescribed-hand-
washing/
Market Watch. (2015). Currency exchange rates. Currency tools, May 12, 2015.
Retrieved from http://www.marketwatch.com/investing/currencies/tools
Marra, A. R., Camargo, T. Z., Cardoso, V. J., Moura, D. F., de Andrade, E. C.,
Wentzcovitch, J., … Edmond, M. B. (2013). Hand hygiene adherence in the
critical care setting: A comparative study of 2 different alcohol handrub
formulations. Am J Infect Control, 41(2), 136-139. doi:10.1016/j.ajic.2012.02.018
Mastrandrea, R., Soto-Aladro, A., Brouqui, P., & Barrat, Al. (2015). Enhancing the
evaluation of pathogen transmission risk in a hospital by merging hand-hygiene
compliance and contact data: A proof-of-concept study. BioMed Central Research
Notes, 8(1), 426- 436. doi:10.1186/s13104-015-1409-0
Mathur, P. (2011). Hand hygiene: Back to the basics of infection control. Indian Journal
of Medical Research, 134(5), 611-620. doi:10.4103/0971-5916.90985
Mattaini, M. A., & Meyer, C. H. (n.d.). The ecosystems perspective: Implications for
323
practice. Chapter 1. Retrieved from
http://home.earthlink.net/~mattaini/Ecosystems.html
Mauskopf, S. (n.d.). Claude-Louis Berthollet, French Chemist. Retrieved from
http://www.chemistryexplained.com/Ar-Bo/Berthollet-Claude-Louis.html
May, J. H., Bazzoli, G. J., & Gerland, A. M. (2006). Hospitals’ responses to nurse
staffing shortages. Health Affairs, 25(4).W316-W323.
doi:10.1377/hlthaff.25.w316
Mazi, W., Senok, A. C., Al-Kahldy, S., & Abdullah, D. (2013). Implementation of the
world health organization hand hygiene improvement strategy in critical care
units. Antimicrobial Resistance Infection Control, 2, 15.
doi:10.1186/2047-2994-2-15
McCaig, L. F., McDonald, L.C., Mandal, S., & Jernigant, D. B. (2006). Staphylococcus
aureus – associated skin and soft tissue infections in ambulatory care. Emerging
Infectious Diseases, 12(11). doi:10.3201/eid1211.060190 Centers
for Disease Control and Prevention.
McCambridge, J., Witton, J., & Elbourne, D. R. (2014). Systematic review of the
Hawthorne Effect: New concepts are needed to study research participation
effects. Journal of Clinical Epidemiology, 67(3), 267-277.
doi:10.1016/j.jclinepi.2013.08.015
McGuckin, M., Waterman, R., & Govednik, J. (2009). Hand hygiene adherence rates in
the United States – a one-year multicenter collaboration using product/volume
usage measurement and feedback. American Journal of Medical Quality, 24(3),

324
205-2013. doi:10.1177/1062860609332369 School of Population
Health Faculty Papers, Paper 48. Thomas Jefferson University. Jefferson School
of Population Health.
McGuckin, M., & Govednik, J. (2015). A review of electronic hand hygiene monitoring:
Considerations for hospital management in data collection, healthcare worker
supervision, and patient perception. Journal of Healthcare Management, 60(5),
348-361. PMID:26554146. Retrieved from
https://www.ncbi.nlm.nih.gov/pubmed/26554146
McLaughlin, A. C., & Walsh, F. (2011). Individual differences in judgments of hand
hygiene risk by health care workers. Am J Infect Control, 39(6), 456-463.
doi:10.1016/j.ajic.2010.08.016
McLaughlin, A. C., & Walsh, F. (2012). Self-reported reasons for hand hygiene in 3
groups of health care workers. Am J Infect Control 40, 653-
658. doi:10.1016/j.ajic.2011.08.014
McLaws, M-L., Farahangiz, S., Palenik, C. J., & Askarian, M. (2015). Iranian healthcare
workers’ perspective on hand hygiene: A qualitative study. Journal of Infection
and Public Health, 8(1), 72-79. doi:10.1016/j.jiph.2014.05.004
McLaws, M-L., Maharlouei, N., Yousefi, F, & Askarian, M. (2012). Predicting hand
hygiene among Iranian health care workers using the theory of planned behavior.
Am J Infect Control, 40(4), 336-339. doi:10.1016/j.ajic.2011.04.004
Medeiros, E. A., Grinberg, G., Rosenthal, V. D., Angelieri, D. B., Ferreira, I. B.,
Cechinel, R. B., … Ferla, S. (2015). Impact of the International Nosocomial

325
Infection Control Consortium (NICC) multidimensional hand hygiene approach in
3 cities in Brazil. Am J Infect Control, 43, 10-15. doi:10.1016/j.ajic.2014.10.001
Mediator versus moderator variables. (1999). University of Wisconsin-Madison.
Retrieved from http://psych.wisc.edu/henriques/mediator.html
Merriam-Webster dictionary. (2015). An Enclopædia Britannica Company. Retrieved
from http://www.merriam-webster.com/dictionary/gender
Mertz, D., Johnstone, J., Krueger, P., Brazil, K., Walter, S. D., & Loeb, M. (2011).
Adherence to hand hygiene and risk factors for poor adherence in 13 Ontario
acute care hospitals. Am J Infect Control, 39(8), 693-696.
doi:10.1016/j.ajic.2010.12.002
Miane. D. (n.d.). Confidence intervals and Hypothesis testing. Retrieved from
http://davidmlane.com/hyperstat/B36454.html
Midturi, J. K., Narasimhan, A., Barnett, T., Sodek, J., Schreier, W., Barnett, J., …
Arroliga, A. (2015). A successful multifaceted strategy to improve hand hygiene
compliance rates. Am J Infect Control, 43(5), 533-536.
doi:10.1016/j/ajic.2015.01.024
Minority nurse. (2015). Nursing Statistics. Retrieved from
http://minoritynurse.com/nursing-statistics/
Mishra, B., Sarkar, D., Srivastava, S., Deepthi, S., N., C., & Mishra, S. (2013). Hand
hygiene – religious, cultural, and behavioral aspects. Universal Journal of
Education and General Studies, 2(6), 184-188. Retrieved from

326
http://universalresearchjournals.org/ujegs/pdf/2013/June/Mishra%20%20et%20al.
Monk-Turner, E., Edwards, D., Broadstone, J., Hummel, R., Lewis, S., & Wilson. (2005).
Another look at hand-washing behavior. Social Behavior and Personality, 33(7),
629-634. doi:10.2224/sbp.2005.33.7.629
Montagnani, C, Cocchi, P., Lega, L., Campana, S., Biermann, K. P., Braggion, C., …
Galli, L. (2015). Serratia marcescens outbreak in a neonatal intensive care unit:
Crucial role of implementing hand hygiene among external consultants. BioMed
Central Infectious Diseases, 15, 11-19. doi:10.1186/s12879-014-0734-6
Moret, L., Tequi, B., & Lombrail, P. (2004). Should self-assessment methods be used to
measure adherence with handwashing recommendations? A study carried out in
a French university hospital. Am J Infect Control, 32(7), 384-390.
doi:10.1016/j.ajic.2004.02.004
MRSA MD (2015). MRSA skin infections, overview. Retrieved from
http://mrsamd.com/no,96
Munoz-Price, L. S., Banach, D. B., Bearman, G., Gould, J. M., Leekha, S., Morgan, D. J.,
… Wiemken, T. L. (2015). Isolation precautions for visitors. Infection Control &
Hospital Epidemiology, 1-12. doi:10.1017/ice.2015.67
Napierala, M. A. (2012). What is the Bonferroni correction? American Academy of
Orthopaedic Surgeons, Now, 2012). Retrieved from
http://www.aaos.org/AAOSNow/2012/Apr/research7/?ssopc=1
National Data Period Two. (2015). Australia National Data. Retrieved from

327
http://www.hha.org.au/LatestNationalData.aspx
Neuendorf. (n.d.). Mediating vs. moderating variables. Retrieved from
http://academic.csuohio.edu/kneuendorf/c63111/hand22.pdf
Newton, R. R., & Rudestam, K. E. (2013). Your statistical consultant: Answers to your
data analysis questions (2nd ed.). Thousand Oaks, CA: Sage.
Novoa, A. M., Pi-Sunyer, T., Sala, M., Molins, E., & Castells, X. (2007). Evaluation of
hand hygiene adherence in a tertiary hospital. Am J Infect Control, 35(10), 676-
683. doi:10.1016/j.ajic.2007.03.007
Nursing fact sheet. (2015). American Association of Colleges of Nursing. Retrieved
from http://www.aacn.nche.edu/media-relations/fact-sheets/nursing-fact-sheet
Onwuegbuzie, A., Collins, K. M. T., & Frels, R. K. (2013). Using Bronfenbrenner’s
ecological systems theory to frame quantitative, qualitative, and mixed research.
International Journal of Multiple Research Approaches, 7(1), 2-8. Retrieved from
http://search.proquest.com.ezp.waldenulibrary.org/docview/1470898076?accounti
d=14872
Oxford Dictionary. (2015). Oxford University Press. Retrieved from
http://www.oxforddictionaries.com/us/definition/american_english/marital-status
Palmore, T. N., & Henderson, D. K. (2013). Managing transmission of Carbapenem-
resistant Enterobacteriaceae in healthcare settings: A view from the trenches.
Clinical Infectious Diseases, 57(11), 1593-1599. doi:10.1093/cid/cit531
Pan, A., Bombana, E., Tura, G., Curti, C., Lorenzotti, S., Mondello, P., … Goglio. A.
(2013). A survey of methicillin-resistant Staphylococcus aureus control strategies

328
in Italy. Infection, 41, 783-789. doi:10.1007/s15010-013-0454-7
Pan, S-C., Tien, K-L., Hung, I-C., Lin, Y-J., Sheng, W-H., Wand, M-J., … Chen, Y-C.
(2013). Adherence of health care workers with hand hygiene practices:
Independent advantages of overt and covert observers. PLoS ONE, 8, e53746.
doi:10.1371/journal.pone.0053746
Pantel, A., Richaud-Morel, B., Cazaban, M., Bouziges, N., Sotto, A., & Lavigne, J-P.
(2016). Environmental persistence of OXA-48-producing Klebsiella pneumonia
in a French intensive care unit. Am J of Infect Control, 44(3), 366-368.
doi:10.1016/j.ajic.2015.09.021
Pennsylvania Patient Safety Advisory. (2010). Demonstrating return on investment for
infection prevention and control. PA Patient Safety Advisory, 7(3), 102-107.
Retrieved from
http://patientsafetyauthority.org/ADVISORIES/AdvisoryLibrary/2010/Sept7(3)/P
ages/102.aspx
Petersen, E., Wilson, M. E., Touch, S., McCloskey, B., Mwaba, P., Bates, M., … Zumla,
A.(2016). Rapid spread of Zika virus in the Americas – implications for public
health preparedness for mass gatherings at the 2016 Brazil Olympic games.
International Journal of Infectious Diseases, 44, 11-15.
doi:10.1016/j.ijid.2016.02.001
Petrona, A. (2015). What is the ecological perspective? eHow. Retrieved from
http://www.ehow.com/about_6638441_ecological-perspective_.html
Pfoh, E., Dy, S., & Engineer, C. (2013). Intervention to improve hand hygiene

329
adherence: Brief update review. In P. G. Shekelle, R. M., Wachter, P. J.
Pronovost, K. Schoelles, K. M. McDonald, S. M. Dy, … B. D. Winters (Eds.),
Making health care safer II: An updated critical analysis of the evidence for
patient safety practices (Chapter 8). Comparative Effectiveness
Review No. 211. (Prepared by the Southern California-RAND Evidence-based
Practice Center under Contract No. 290-2007-10062-I.) AHRQ Publication No.
13-E001-EF. Rockville, MD: Agency for Healthcare Research and Quality.
March 2013. Retrieved from http://www.ahrq.gov/research/findings/evidence-
based-reports/ptsafetyuptp.html
Pittet, D. (2001). Improving adherence to hand hygiene practice: A multidisciplinary
approach. Emerging Infectious Diseases, 7(2), 234-240.
doi:10.1016/j.jhin.2004.06.002
Pittet, D. (2004). The Lowbury lecture: behaviour in infection control. Journal of
Hospital Infection, 58(1), 1-13. doi:10.1016/j.jhin.2004.06.002
Pittet, D., Allegranzi, B., Sax, H., Dharan, S., Pessoa-Silva, C. L., Donaldson, L. &
Boyce, J. M. (2006). Evidence-based model for hand transmission during patient
care and the role of improved practices. The Lancet Infectious Diseases 6(10),
641-652. Retrieved from
http://www.thelancet.com/journals/laninf/article/PIIS1473309906706004/abstract
Pittet, D., Allegranzi, B., Storr, J., Bagheri Nejad, S. B., Dziekan, G., Leotsakos, A., &
Donaldson, L. (2008). Developing countries. Journal of Hospital
Infection, 68(4), 285-292. doi:10/1016/j.jhin.2007.12.013

330
Pittet, D., & Boyce, J. (2001). Hand hygiene and patient care: Pursuing the Semmelweis
legacy. The Lancet Infectious Diseases, 1, Special issue, 9-20.
doi:10.1016/S1473-3099(09)70295-6
Pittet, D., & Donaldson, S. L. (2005). Clean care is safer care: The first global challenge
of the WHO World Alliance for Patient Safety. Am J Infect Control, 33(8), 476-
479. doi:10.1016/j.ajic.2005.08.001
Pittet, D., Hugonnet, S., Harbarth, S., Mourouga, P., Sauvan, V., Tourveneau S., &
Perneger, T. V. (2000). Effectiveness of a hospital-wide programme to improve
adherence with hand hygiene. The Lancet, 356(9238), 1307-1312.
doi:10.1016/S0140-6736(00)02814-2
Pittet, D., Simon, A., Hugonnet, S., Pessoa-Silva, C. L., Sauva, V., & Perneger, T. V.
(2004b). Hand hygiene among physicians: Performance, beliefs, and perceptions.
Annals of Internal Medicine, 141(1), 1-8. Retrieved from
https://www.ncbi.nlm.nih.gov/pubmed/15238364
Polit, D. F., & Beck, C. T. (2012). Nursing research: Generating and assessing evidence
for nursing practice (9th ed.). Philadelphia, PA: Lippincott Williams & Wilkins.
Powell, S. M. (2006). Patient safety focus: Creating a systems approach to patient safety
through better teamwork. Biomedical Instrumentation & Technology, 40(3), 205-
207. ISSN: 0800-8205. PMID: 16796325. NLM UID: 8905560.
Pronovost, P. (2015). Making progress in patient safety. World Health Organization.
Retrieved from
http://www.who.int/patientsafety/news_events/news/edit_pronovost/en/
331
Pyrek, K. M. (2014). The economics of hand hygiene adherence monitoring. Infection
Control Today, October, Special Edition. Retrieved from
http://www.infectioncontroltoday.com/reports/2014/10/the-economics-of-hand-
hygiene-compliance-monitoring.aspx
Raboud, J., Saskin, R., Wong, K., Moore, C., Parucha, G., Bennett, J., … McGeer, A.
2004). Patterns of handwashing behavior and visits to patients on a general
medical ward of healthcare workers. Infection Control and Hospital
Epidemiology, 25(3), 198-202. doi:10.1086/502377
Race and ethnicity classifications. (n.d.). State Data Center. Iowa Library Service. U.S.
Office of Management and Budget (1997). Retrieved from
http://www.iowadatacenter.org/aboutdata/raceclassification
Rahmqvist, M., Samuelsson, A., Bastami, S., & Rutberg, H. (2016). Direct health care
costs and length of hospital stay related to health care-acquired infections in adult
patients based on point prevalence measurements. Am J Infect Control 44(5), 500-
506. doi:10.1016/j.ajic.2016.01.035
Randle, J., Arthur, A., & Vaughan, N. (2010). Twenty-four-hour observational study of
hospital hand hygiene compliance. Journal of Hospital Infection, 76, 252-255.
doi:10.1016/j.jhin.2010.06.027
Randle, J. Clarke, M., & Storr, J. (2006). Hand hygiene adherence in healthcare
workers. Journal of Hospital Infection, 64, 205-209.
doi:10.1016/j.jhin.2006.06.008
Rappleye, E. (2015). Gender role of nurses across 50 states. Becker’s Hospital Review.
332
The Kaiser Family Foundation. Retrieved from
http://www.beckershospitalreview.com/human-capital-and-risk/gender-ratio-of-
nurses-across-50-states.html
‘Reckless and Blatant’ – TJC. (2008). Medical Staff Newsline. Hospital Association of
Southern California. Retrieved from
http://www.hasc.org/sites/main/files/file-attachments/msn_-_jan._2008_web.pdf
Registered Nurse Salaries in Texas. (2015). All guides about RN schools and programs.
Retrieved from http://www.topregisterednurse.com/salary/texas/
Religious landscape study. (2015). Religious landscape study. Pew Research Center:
Religion & Public Life. Retrieved from
http://www.pewforum.org/religious-landscape-study/
Reporting statistics in APA format. (n.d.). Retrieved from
https://web2.uconn.edu/writingcenter/pdf/Reporting_Statistics.pdf
Robert Kock. (n.d.). Exploring the history of medicine. Science Museum. Retrieved from
http://www.sciencemuseum.org.uk/broughttolife/people/robertkoch.aspx
Roberts, S., Upton, A., Morris, A., & Woodhouse, A. (2005). Hand-hygiene practices of
medical staff: Room for improvement. The New Zealand Medical Journal
(Online), 118, 1209. ISSN: 1175-8716. Retrieved from
https://www.researchgate.net/publication/8020850_Hand-
hygiene_practices_of_medical_staff_Room_for_improvement_4
Rodak, S. (2013). Why does low hand hygiene adherence still plague healthcare? 4
reasons. Becker’s Infection Control & Clinical Quality, April 04, 2013. Retrieved

333
from http://www.beckershospitalreview.com/quality/why-does-low-hand-
hygiene-adherence-still-plague-healthcare-4-reasons.html
Rosenfeld, E. (2014). Officials watch and wait after first US Ebola death. CNBC.
Retrieved from http://www.cnbc.com/2014/10/08/ebola-patient-in-dallas-
dies.html
Rosenthal, V. D., Guzman, S., Migone, O., & Safdar, N. (2005a). The attributable cost
and length of hospital stay because of nosocomial pneumonia in intensive care
units in 3 hospitals in Argentina: A prospective, matched analysis. Am J Infect
Control, 33, 157-161. doi:10.1016/j.ajic.2004.08.008
Rosenthal, V. D., Guzman, S., & Safdar, N. (2005b). Reduction in nosocomial infection
with improved hand hygiene in intensive care units of a tertiary care hospital in
Argentina. Am J Infect Control, 33:392-397). doi:10.1016/j.ajic.2004.08.009
Rosenthal, V. D., Maki, D. G., Mehta, Y., Leblebicioglu, H., Memish, Z. A., Al-Mousa,
H. H., … Aguirre-Avalos, G. (2014). International Nosocomial Infection Control
Consortium (INICC) report, data summary of 43 countries for 2007-2012.
Device-associated module. Am J Infect Control, 42(9), 942-956.
doi:10.1016/j.ajic.2014.05.029
Rosenthal, V. D. Maki, D. G., Salomao, R., Alvarez-Moreno, C., Mehta, Y., Higuera, F.,
… Leblebicioglu, H. (2006). Device-associated nosocomial infections in 55
intensive care units of 8 developing countries. Annals of Internal Medicine,
145(8), 582-592. ISSN: 1539-3704.
Rosenthal, V. D. Pawar, M., Leblebicioglu, H., Navoa-Ng, J. A., Villamil-Gómez, W.,

334
Armas-Ruiz, A., … Kübler, A. (2013). Impact of the International Nosocomial
Infection Control Consortium (ONICC) multidimensional hand hygiene approach
over 13 years in 51 cities of 19 limited-resource countries from Latin America,
Asia, the Middle East, and Europe. Infection Control Hospital Epidemiology,
34(4), 415-423. doi:10.1086/669860
Roundy, L. (2015). What is ecological systems theory. Bronfenbrenner’s ecological
systems theory of development: Definition & examples. Study.com. Retrieved
from http://study.com/academy/lesson/bronfenbrenners-ecological-systems-
theory-of-development-definition-examples.html
Rouse, M. (2015). Data scrubbing (data cleansing). TechTarget. Retrieved from
http://searchdatamanagement.techtarget.com/definition/data-scrubbing
Sachau, D. A. (2007). Resurrecting the motivation-hygiene theory: Herzberg and the
positive psychology movement. Human Resource Development Review, 6(4), 377.
doi:10.1177/1534484307307546
Sadatsafavi, H., Niknejad, B., Zadeh, R., & Sadatsafavi, M. (2016). Do cost savings from
reductions in nosocomial infections justify additional costs of single-bed rooms in
intensive care units? A simulation case study. Journal of Critical Care, 31(1),
194-200. doi:10.1016/j.jcrc2015.10.010
Sahay, S., Panja, S., Ray, S., Rao, B. K. (2010). Diurnal variation in hand hygiene
compliance in a tertiary level multidisciplinary intensive care unit. Am
J Infect Control, 38, 535-539. doi:10.1016/j.ajic.2010
Sahud, A, G., Bhanot, N., Radhakrishnan, A., Bajwa, R., Manyam, H., & Post, J. C.

335
(2010). An electronic hand hygiene surveillance device: A pilot study exploring
surrogate markers for hand hygiene compliance. Infect Control and Hosp
Epidemiol, 31(6), 634-639. doi:10.1086/652527
Salama, M. F., Jamal, W. Y., Al Mousa, H., Al-AbdulGhani, K. A., & Rotimi, V. O.
(2013). The effect of hand hygiene adherence in an IUC setting in a Kuwaiti
teaching hospital. Journal of Infection and Public Health, 6, 27-34.
doi:10.1016/j.jiph.2012.09.014
Salmon, S., Pittet, D., Sax, H., & McLaws, M-L. (2015). The ‘My five moments of hand
hygiene’ concept for the overcrowded setting in resource-limited healthcare
systems. Journal of Hospital Infection, 91(2), 95-99.
doi:10.1016/j.jhin.2015.04.011
Salmon, S., Tran, H. L., Bùi, D. P., Pittet, D., & McLaws, M-L. (2014a). Beginning the
journey of hand hygiene adherence monitoring at a 2,100-bed tertiary hospital in
Vietnam. Am J Infect Control, 42(1), 71-73. doi:10.1016/j.ajic.2013.07.011
Salmon, S., Truong, A. T., Nguyen, V. H., Pittet, D., & McLaws, M-L. (2014b). Health
care workers’ hand contamination levels and antibacterial efficacy of different
hand hygiene methods used in a Vietnamese hospital. Am J Infect Control, 42(2),
178-181. doi:10.1016/j.ajic.2013.07.013
Sammer, C. E., & James, B. R. (2011). Patient Safety Culture: The nursing unit leader’s
role. The Online Journal of Issues in Nursing, 16(3), Manuscript 3.
doi:10.3912/OJIN.Vol16No03Man03
Sax, H., Allegranzi, B., Chraïti, M-N., Boyce, J., Larson E., & Pittet, D. (2009). The

336
World Health Organization hand hygiene observation method. Am J Infect
Control, 37(10), 827-834. doi:10.1016/j.ajic.2009.07.003
Scheithauer, S., Haefner, H., Schwanz, T., Schulze-Steinen, H., Schiefer, J., Kock A.,
…Lemmen, S. W. (2009). Adherence with hand hygiene on surgical, medical,
and neurologic intensive care units: Direct observation versus calculated
disinfectant usage. Am J Infect Control, 37(10), 835-841.
doi:10.1016/j.ajic.2009.06.005
Scheithauer, S., Kamerseder, V., Petersen, P., Brokmann, J. C., Lopez-Gonzales, L-A.,
Mach, C., … Lemmen, S. W. (2013). Improving hand hygiene compliance in the
emergency department; getting to the point. BioMedical Central Infectious
Diseases, 13, 367. doi:10.1186/1471-2334-13-367
Scheithauer, S, & Lemmen, S. W. (2013). How can adherence with hand hygiene be
improved in specialized areas of a university hospital? Journal of Hospital
Infection, 83(S1), S17-S22. doi:10.1016/S0195-6701(13)60005-5
Scheithauer, S., Oude-Aost, J., Heimann, K., Haefner, H., Schwanz, T., Waitschies, B.,
… Lemmen, S. W. (2011). Hand hygiene in pediatric and neonatal intensive care
unit patients: Daily opportunities and indication-and profession-specific analyses
of adherence [Abstract]. Am J Infect Control, 39(9), 732-737.
doi:10.1016/j.ajic.2010.12.020
Schmidt, A. M., & DeShon, R. P. (2007). What to do? The effects of discrepancies,
incentives, and time on dynamic goal prioritization. Journal of Applied
Psychology, 92(4), 928-941. doi:10.1031/0021-9010.92.4.928
337
Schochet, P. Z. (2008). Technical methods report: Guidelines for multiple testing in
impact evaluations. Mathematica Policy Research, Inc., U.S. Department of
Education. Institute of Education Sciences, National Center of Education
Evaluation and Regional Assistance. Retrieved from
http://ies.ed.gov/ncee/pdf/20084018.pdf
Schweizer, M. L., Reisinger, H. S., Ohl, M., Formanek, M. B., Blevins, A., Ward, M. A.,
& Perencevich, E. N. (2014). Searching for an optimal hand hygiene bundle: A
meta-analysis. Clinical Infectious Diseases, 58(2), 248-259.
doi.org/10.1093/cid/cit670
Scott, R. II. (2009). The direct medical costs of healthcare-associated infections in US
hospitals and the benefits of prevention. Centers for Disease Control and
Prevention. Retrieved from
http://www.cdc.gov/HAI/pdfs/hai/Scott_CostPaper.pdf
Scott, R. D. (2009). The direct medical costs of healthcare-associated infections in U.S.
hospitals and the benefits of prevention. Centers for Disease Control and
Prevention. Retrieved from
https://www.cdc.gov/HAI/pdfs/hai/Scott_CostPaper.pdf
Semmelweis Biography. (2009a). Dr. Ignaz Semmelweis, Biography. Semmelweis
Society International. Retrieved from
http://semmelweis.org/about/dr-semmelweis-biography/
Sepkowitz, K. A., & Eisenberg, L. (2005). Occupational deaths among healthcare
workers. Emerging Infectious Diseases, 11(7), 1003-1008.
338
doi:10.3201/eid1107.041038
Shabot, M. M., Chassin, M. R., France, A-C., Inurria, J., Kendrick, J., & Schmaltz, S. P.
(2016). Using the targeted solutions tool to improve hand hygiene compliance is
associated with decreased health-care-associated infections. The Joint
Commission Journal on Quality and Patient Safety, 42(1), 6 -17. Retrieved from
https://www.jointcommission.org/assets/1/18/JQPS0116_01_Shabot.pdf
Shah, S., & Singhal, T. (2013). Hand hygiene and health care associated infections:
What, why and how. Pediatric infectious disease, 5, 130-134.
doi:10.1016/j.pid.2013.08.001
Sharma, S., Sharma, S., Puri, S., & Whig, J. (2011). Hand hygiene adherence in the
intensive care units of a tertiary care hospital. Indian Journal of Community
Medicine, 36(3), 217-221. doi:4103/0970-0218.86524
Shuttleworth, M. (2009). Internal consistency reliability. Explorable.com. Retrieved from
https://explorable.com/internal-consistency-reliability
Sickbert-Bennett, E. E., DiBiase, L. M., Willis, T. M. S., Wolak, E. S., Weber, D. J., &
Rutala, W. A. (2016a). Reducing health care-associated infections by
implementing a novel all hands on deck approach for hand hygiene compliance.
Am J Infection Control, 44, 313-e16. doi:10.1016/j.ajic.2015.11.016
Sickbert-Bennett, E. E., DiBiase, L. M., Willis, T. M. S., Wolak, E. S., Weber, D. J., &
Rutala, W. A. (2016b). Reduction of healthcare-associated infections by
exceeding high compliance with hand hygiene practices. Emerging Infectious
Diseases, 22(9), 1628-1630. doi:10.3201/eid2209.151440

339
Siddiqui, A. H., Srivastava, V. K., Aneeshamol, P.P., & Prakash, C. (2016). Hand
hygiene: From Semmelweis to present! Journal of Patient Safety & Infection
Control XX, XXX-XXX. Article in press. Available online on 4 March, 2016.
doi:10.1016/j.jpsic.2015.12.001
Siegel, J. D., Rhinehart, E., Jackson, M., Chiarello, L., the Healthcare Infection Control
Practices Advisory Committee. (2007). 2007 Guideline for isolation precautions:
Preventing transmission of infectious agents in healthcare settings. Centers for
Disease Control and Prevention. Retrieved from
http://www.cdc.gov/hicpac/pdf/isolation/Isolation2007.pdf
Silva, D., Andrade, O., & Silva, E. (2014). Perspective of health professionals on hand
hygiene. Atención Primaria, 46, Supplement 5, 135-139. 2nd World congress of
Health Research. Retrieved from http://ac.els-
cdn.com.ezp.waldenulibrary.org/S0212656714700800/1-s2.0-
S0212656714700800-main.pdf?_tid=eb10a5a4-924e-11e6-ac2c-
00000aab0f6c&acdnat=1476478013_070f9a1f811ee11ac10ec1785b35d2a9
Sincero, S. M. (2012a). Ecological systems theory. Retrieved from Explorable.com at
http://explorble.com/ecological-systems-theory
Sincero, S. M. (2012b). Questionnaire layout. Retrieved from Explorable.com at
https://explorable.com/questionnaire-layout
Smiddy, M. P., O’Connell, R., & Creedon, S. A. (2015). Systematic qualitative literature
review of health care workers’ adherence with hand hygiene guidelines.
Am J Infect Control, 43(3), 269-274. doi:10:1016/j.ajic.2014.11.007
340
Smith, S. (2013). Survey questions 101: Do you make any of these 7 question writing
mistakes? Qualtrics. Retrieved from
http://www.qualtrics.com/blog/writing-survey-questions/
Snow, M., White, G. L., Alder, S. C., & Stanford, J. B. (2006). Mentor’s hand hygiene
practices influence student’s hand hygiene rates. Am J Infect Control, 34(1), 18-
24. doi:10.1016/j.ajic.2005.05.009
Sokol, D. K. (2013). “First do no harm” revisited. British Medical Journal, 347.
doi:10.1136/bmj.f6426
Son, C., Chuck, T., Childers, T., Usiak, S. Dowling, M., Andiel, C., … Sepkowitz, K.
(2011). Practically speaking: Rethinking hand hygiene improvement programs in
health care settings. Am J Infect Control, 39(9), 716-724.
doi:10.1016/j.ajic.2010.12.008
Spatz, C. (2011). Basic statistics: Tales of distribution. Belmont, CA: Wadsworth
Cengage Learning.
Squires, J. E., Suh, K. N., Linklater, S., Bruce, N., Gartke, K., Graham, I. D., … &
Grimshaw, J. M. (2013). Improving physician hand hygiene adherence using
behavioral theories: a study protocol. Implementation Science, 8(16), 8-16.
doi:10.1186/1748-5908-8-16
State health facts. (2015). Total number of professionally active nurses. The Henry J.
Kaiser Family Foundation. Retrieved from the
http://kff.org/other/state-indicator/total-registered-nurses/
State health facts. (2016). Total number of professionally active nurses. The Henry J.
341
Kaiser Family foundation. Retrieved from the
http://kff.org/other/state-indicator/total-registered-nurses/
Steed, C., Kelly, J. W., Blackhurst, D., Boeker, S., Diller, T., Alper, P., & Larson, E.
(2011). Hospital hand hygiene opportunities: Where and when (HOW2)? The
HOW2 Benchmark Study. Am J Infect Control, 39, 19-26.
doi:10:1016/j.ajic.2010.10.007
Stock, S., Tebest, R., Westermann, K., Samel, C., Strohbücker, B., Stosch, C., …
Redaèlli, M. (2016). Implementation of an innovative hand-on-training to
improve adherence to hygiene rules: A feasibility study. Nurse Education Today,
36, 407-411. doi:10.1016/j.nedt.2015.10.012
Stone, P. W. (2009). Economic burden of healthcare-associated infections: an American
perspective. Expert Review of Pharmacoeconomics & Outcomes Research, 9(5),
417-422. doi:10.1586/ERP.09.53
Stone, S., Fuller, C., Michie, S., McAteer, J., & Charlett, A. (2012a). What is the optimal
period for measuring hand hygiene compliance: are longer periods better than 20-
minute periods? Infect Control Hosp Epidemiol, 33(11), 1174-1176.
doi:10.1086/668017
Stone, S. P., Fuller, C., Savage, J., Cookson, B., Hayward, A., Cooper, B., … Charlett, A.
(2012b). Evaluation of the national Cleanyourhands campaign to reduce
Staphylococcus aureus bacteraemia and Clostridium difficile infection in hospitals
in England and Wales by improved hand hygiene: four year, prospective,
ecological, interrupted time series study. British Medical Journal, 344, e3005.

342
doi:10.1136/bmj.e3005
Stout, A., Ritchie, K., & Macpherson, K. (2007). Clinical effectiveness of alcohol-based
products in increasing hand hygiene adherence and reducing infection rates: A
systematic review. Journal of Hospital Infection, 66(4), 308-312.
doi:10.1016./j.ajjhin.2007.04.017
Su, D., Hu, B., Rosenthal, V. D., Li, R., Hao, C., Pan, W., … Liu, K. (2015).
Impact of the International Nosocomial Infection Control Consortium (INICC)
multidimensional hand hygiene approach in five intensive care units in three cities
of China [Abstract]. Public Health, pii:S0033-35-3506(15)00090-6.
doi:10.1016:j.puhe.2015.02.023
Sunkesula, V. C. K., Meranda, D., Kundrapu, S., Zabarsky, T. F., McKee, M., Macinga,
D. R., & Donskey, C. J. (2015). Comparison of hand hygiene monitoring using
the 5 moments for hand hygiene versus a wash in-wash out method. Am J Infect
Control, 43(1),16-19. doi:10.1016/j.ajic.2014.10.003
Tajeddin, E., Rashidan, M., Razaghi, M., Javadi, S.S. S., Sherafat, S. J., Alebouyeh, M.,
… Zali, M. R. (2016). The role of the intensive care unit environment and health-
care workers in the transmission of bacteria associated with hospital acquired
infections. Journal of Infection and Public Health, 9(1), 13-23.
doi:10.1016/j.jiph.2015.05.010
Taneja, J., & Mishra, B. (2015). Promotion of Successful hand hygiene practices in the
intensive care units of a tertiary care hospital. Journal of Patient Safety &
Infection Control, 3(3), 130-133. doi:10.1016/j/psic.2015.11.004

343
Terry, K. (2010). Do you hold staff accountable for safety? Trustee, 63(5), 11-13.
Retrieved from
http://search.proquest.com.ezp.waldenulibrary.org/pqcentral/docview/346854932/
6767AC8689B24520PQ/5?accountid=14872
Texas Department of State Health Services (TDSHS). (2014). Registered nurses, 2014.
Texas Board of Nursing. Retrieved from
https://www.dshs.state.tx.us/chs/hprc/tables/2014/14RN.aspx
The Joint Commission. (2007). Improving America’s Hospitals: A report on quality and
safety. Retrieved from http://www.jointcommissionreport.org
The Joint Commission. (2009). Measuring hand hygiene adherence: Overcoming the
challenges. Retrieved from
http://www.jointcommission.org/assets/1/18/hh_monograph.pdf
The Joint Commission. (2015). National patient safety goals. Retrieved from
http://www.jointcomission.org
The Registered Nurse Population. (2010). Findings from the 2008 National Sample
Survey of Registered Nurses. U.S. Department of Health and Human Services
Health Resources and Services Administration. Retrieved from
http://bhpr.hrsa.gov/healthworkforce/rnsurveys/rnsurveyfinal.pdf
Thu, L. T. A.. Thoa, V. T. J., Van Trang, D. T., Tien, N. P., Van, D. T., Anh, L. T. K., …
Son, N. T. (2015). Am J Infect Control, 43(12), e93-e99.
doi:10.1016/j/ajic.2015.08.006
Top ten organized religions of the world. (2015). Info please. Retrieved from

344
http://www.infoplease.com/toptens/organizedreligions.html
Trillis, F., Eckstein, E. C., Budavich, R., Pultz, M. J., Donskey, D. J. (2008).
Contamination of hospital curtains with healthcare-associated pathogens.
Infection Control Hospital Epidemiology, 29 (11), 1074-1076.
doi:10.1086/591863
Trochim, W. M., Cabrera, D. A., Milstein, B., Gallagher, R. S., & Leischow, S. J. (2006).
Practical challenges of systems thinking and modeling in public health. American
Journal of Public Health, 93(3), 538-546. doi:10.2105/AJPH.2005.066001
Umscheid, C. A., Mitchell, M. D., Doshi, A., Agarwal, R., Williams, K, & Brennan, P. J.
(2011). Estimating the proportion of healthcare-associated infections that are
reasonably preventable and the related mortality and costs. Infection Control &
Hospital Epidemiology, 32(02), 101-114. doi:10.1086/657912
U.S. Nursing workforce: Tends in supply and education. (2013). Department of Health
& Human Services. Health Resources and Services Administration. Retrieved
from
http://bhpr.hrsa.gov/healthworkforce/reports/nursingworkforce/nursingworkforcef
ullreport.pdf
van Dalen, R., Gombert, K., Bhattacharya, S., & Datta, S. S. (2013), Indian Journal of
Medical Microbiology, 31(3), 280-282. doi:10.4103/0255-0857.115639
Van de Mortel, T., Bourke, R., McLoughlin J., Nonu, M., & Reis, M. (2001). Gender
influences handwashing rates in the critical care unit. Am J Infect Control, 29(6),
395-399. doi:10.1067/mic.2001.119511

345
Vere-Jones, E. (2007). More support for infection control teams, watchdog says. Nursing
Times, 8 November, 2007. Retrieved from https://www.nursingtimes.net/more-
support-for-infection-control-teams-watchdog-says/227258.article
Wachter, R. M. (2004). The end of the beginning: Patient safety five years after ‘To err is
human’. Health Affairs, November, W4-534-W545. doi:10:1377/hlthaff.W4.534
Watson, J. A. (2016). Role of a multimodal educational strategy on health care workers’
handwashing. Am J Infect Control, 44(4), 400-404.
doi10.1016/j.ajic.2015.10.030
Weston, D. (2010). The pathogenesis of infection and immune response. British Journal
of Nursing, 19(16), S4-S11. doi:10.12968/bjon.2010.19.Sup6.78211
Wetzker, W., Bunte-Schönberger, K., Walter, J., Pilarski, G., Gastmeier, P., & Reichardt,
C. (2016). Compliance with hand hygiene: Reference data from the national hand
hygiene campaign in Germany. Journal of Hospital Infection, 92(4), 328-331.
doi:10.1016/j.jhin.2016.01.022
Whitby, M., & McLaws, M-L. (2007a). Letter to the editor: Hand Hygiene: the behaviour
is the solution. Journal of Hospital Infection, 67(3), 291.
doi:10.1016/j.jhin.2007.08.001
Whitby, M., McLaws, M. L., & Ross, M.W. (2006). Why healthcare workers don’t wash
their hands: A behavioral explanation. Infection Control and Hospital
Epidemiology, 27(5), 484-492. doi:10.1086/503335
Whitby, M., Pessoa-Silva, C. L., McLaws, M-L., Allegranzi, B., Sax, H., Larson, E., …
Pittet, D. (2007). Behavioral considerations for hand hygiene practices: the basic

346
building blocks. Journal of Hospital Infection, 65(1), 1-8.
doi:10.1016/khin.2006.09.026
White, J. (2014). Hand washing: How one hospital achieved nearly 100% compliance.
Healthcare Treatments & Outcomes, July 22, 2014. Retrieved from
http://www.healthcarebusinesstech.com/hospital-hand-washing/
White, K. M., Jimmieson, N. L., Obst, P. L., Graves, N., Barnett, A., Cockshaw, W., …
Paterson, D. (2015). Using a theory of planned behavior framework to explore
hand hygiene beliefs at the ‘5 critical moments’ among Australian hospital-based
nurses. BioMed Center Health Service Research, 15(1), 15-59.
doi:10.1186/s12913-015-0718-2
Wilson, S., Jacob, C. J., & Powell, D. (2011). Behavior-change interventions to improve
hand-hygiene practice: a review of alternatives to education. Critical Public
Health, 21(1), 119-127. doi:10.1080/09581591003786122
Winkel, G., Saegert, S., & Evans, G. W. (2009). An ecological perspective on theory
methods, and analysis in environmental psychology: Advances and challenges.
Journal of Environmental Psychology, 29(3), 318-328.
doi:10.1016/j.jenvp.2009.02.005
World Health Organization (WHO) Guidelines on Hand Hygiene in Health Care. (2009).
Retrieved from
http://whqlibdoc.who.int/publications/2009/9789241597906_eng.pdf?ua=1
World Health Organization (WHO) Guidelines on Hand Hygiene in Health Care: First

347
Global Patient Safety Challenge: Clean Care is Safety Care. Hand hygiene
monitoring and feedback. (2009). Retrieved from
http://www.who.int/gpsc/5may/monitoring_feedback/
World Health Organization (WHO) Guidelines on Hand Hygiene in Health Care: First
Global Patient Safety Challenge: Clean Care is Safer Care. Hand hygiene as a
performance indicator. (2009). Retrieved from
http://www.ncbi.nlm.nih.gov/books/NBK144028/
World Health Organization (WHO) Guidelines on Hand Hygiene in Heath Care: First
Global Patient Safety Challenge Clean Care is Safer Care. Practical issues and
potential barriers to optimal hand hygiene practices: Glove policies. (2009).
Retrieved from http://www.ncbi.nlm.nih.gov/books/NBK144047/
World Health Organization (WHO). Guidelines on Hand Hygiene in Health Care: First
Global Patient Safety Challenge Clean Care is Safer Care. (2009). Religious and
cultural aspects of hand hygiene. Retrieved from
http://www.ncbi.nlm.nih.gov/books/NBK143998/
World Health Organization (WHO). (2010). The burden of health care-associated
infection worldwide: A summary. Retrieved from
http://www.who.int/gpsc/country_work/summary_20100430_en.pdf
World Health Organization (WHO). (2011). Report on the burden of endemic health
care-associated infection worldwide. Retrieved from
http://apps.who.int/iris/bitstream/10665/80135/1/9789241501507_eng.pdf?ua=1
World Health Organization (WHO). (2014). Save lives: Clean your hands. Clean Care is

348
Safer Care. Retrieved from http://www.who.int/gpsc/5may/en/
World Health Organization (WHO). (May 05, 2015a). Webinar: Healing hands: The role
of hand hygiene in healthcare globally. Retrieved from
https://www.youtube.com/watch?v=XAL6DF5o4tI&feature=youtu.be
World Health Organization (WHO). (2015b). WHO hand hygiene self-assessment
framework global survey summary report. Retrieved from
http://www.who.int/gpsc/5may/summary_report_HHSAF_global_survey_May12.
pdf?ua=1
Wuensch, K. L. (2014). Binary logistic regression with SPSS. Retrieved from
http://core.ecu.edu/psyc/wuenschk/mv/multreg/logistic-spss.pdf
XE Currency Converter. (Assessed 06-03-2016). Retrieved from
http://www.xe.com/currencyconverter/#rates
Xie, J. (2014). Why nurses are the most trustworthy profession in the US. Retrieved from
http://www.boston.com/jobs/news/2014/12/23/why-nurses-are-the-most-
trustworthy-profession-the/WyTs4WU2kQZ5RrQRROU3TP/story.html
Zborowsky, T, & Kreitzer, M. J. (2009). People, place, and process: the role of place in
creating optimal healing environments. Creative Nursing, 15(4), 186-190.
doi:10.1891/1078-4535.15.4.186
Zellmer, C., Blakney, R., Van Hoof, S., & Safdar, N. (2015). Impact of sink location on
hand hygiene compliance for Clostridium difficile infection. Am J Infect Control,
43(4), 387-389. doi:10.1061/j.ajic.2014.12.016
Zimlichman, E., Henderson, D., Tamir, O., Franz, C., Song, P., Yamin, C. K., …

349
Bates, D. W. (2013). Health care-associated infections: A meta-analysis of
costs and financial impact on the US health care system. JAMA Internal
Medicine, 173(22), 2039-2046. doi:10.1001/jamainternmed.2013.9763
Zingg, W., Holmes, A., Dettenkofer, M., Goetting, T., Secci, F., & Clack. L. , … Pittet,
D. (2015). The systematic review and evidence-based guidance on organization of
hospital infection control programmes (SIGHT) study group. Hospital
organization, management, and structure for prevention of health-care associated
infection: A systematic review and expert consensus. Lancet Infect Dis, 15(2),
212-224. pii: S1473-3099(14)70854-0.
doi:10.1016/S1473-3099(14)70854-0
Recommended