Democracy and Redistribution, 1880-1930: Reassessing the Evidence
Ben Ansell Assistant Professor
University of Minnesota [email protected]
David Samuels
Benjamin E. Lippincott Professor University of Minnesota
[email protected] Prepared for the 2010 Meeting of the American Political Science Association, Washington DC. This paper is part of a book-length project; see Ben Ansell and David Samuels, “Inequality and Democratization: A Contractarian Approach,” Comparative Political Studies (forthcoming, December 2010). We thank Kevin Lucas for research assistance.

2
Introduction
The gospel of political economy preaches that extending the franchise leads to greater
government redistribution. This belief is rooted in an obvious contrast: autocracies restrict
participation to an elite few, while democracies allow the poor greater voice. Logically, because
there are always more poor people than rich people, franchise expansion lowers the income of
the average voter, and raises the demand for redistribution of wealth. By the beginning of the
19th century, politicians and political philosophers across the political spectrum believed
universal suffrage would lead to the equalization of property.
This syllogism--between political and economic equality--has dominated the fears and
the hopes attached to democracy ever since in the inception of representative government
(Przeworski 2009, 301). Democracy may only mandate political equality, but since the late
1700s those on the right feared that political equality would threaten property—and likewise,
those on the left believed that acquisition of political rights would not satisfy those on the bottom
of the economic ladder. By Marx’s time, the idea had spread that “democracy in the political
realm must naturally lead to social and economic equality” (ibid, 303).1
Despite the persistence of vast socioeconomic inequalities in democracies around the
world, belief that democracy and property are in tension remains rock-solid. In 1981, Meltzer
and Richard helped formalize the “redistributive” model of democratic politics. They noted that
not only does universal suffrage mean that a majority of voters earn less than average income,
but also that pressures for redistribution will vary with economic inequality. The formalization of
the redistributive model sparked an avalanche of research seeking to explain cross-national
variation in patterns of government spending--both within democracies as well as between
1 Given the consensus opinion that political equality would threaten property, Przeworski (2007, 6) notes that the contractarian logic of North and Weingast and Olson “would bewilder nineteenth century observers.”

3
democracies and dictatorships. To scholars’ surprise, results of this research have consistently
questioned the gospel truth that democracies redistribute more than autocracies and that
inequality is correlated with pressures for redistribution. Scholars have repeatedly found that
democracies redistribute far less than they “should”—a puzzle that pushed some to add epicycles
to the original model in an effort to salvage their faith that a tension between democracy and
property truly exists. Scholars have proven unwilling to give up on the Meltzer-Richard model,
leading Adam Przeworski (2010, 85) to sardonically call it “political economists’ favorite toy.”
Models that explain a lot using only a little are rare gems—things of beauty, at least to
social scientists. Simplicity is seductive, and models with great explanatory power often become
the conventional wisdom. Yet simplicity is not always a virtue, because Ockham’s razor can
sometimes shave off essential information. Sometimes the simplest model is not the best model.
The shaky empirical results in support of the redistributive model call into question its utility for
explaining variation in government spending. Yet despite weak results, faith in the syllogism that
equates democracy and redistribution remains unshaken—so much so that even though Meltzer
and Richard did not devise their model to explain regime change, Acemoglu and Robinson
(2000, 2006), Boix (2003) and related “redistributivist” models have applied a rational
expectations logic derived from the Meltzer-Richard (MR) model to explain transitions to
democracy. The logic is as follows: “Everyone—from the incumbent dictator down to the
lowliest of peasants--knows that under democracy the poor will soak the rich. So, incumbent
elites will be reluctant to democratize to begin with, but their reluctance depends fundamentally
on what kind of assets there are (fixed or mobile) and how those assets are distributed within
society. All else equal, the distribution of wealth impacts the likelihood of regime change.”

4
The utility of these redistributivist models of regime change depends crucially on the
descriptive and predictive accuracy of this core assumption. One approach to assessing the model
is to test its direct implication that regime change is at least partly a function of inequality.
Elsewhere (Ansell and Samuels, 2010) we show that both Boix’s (2003) and Acemoglu and
Robinson’s (2006) arguments do not accurately predict regime transitions.2 Another approach to
assessing the utility of the redistributivist model of regime change is to assess its indirect
implications by testing the Meltzer-Richard hypothesis that inequality and democracy impact
government redistributive spending. This is precisely what Boix sought to do in Chapter Five of
his book (2003)--to bolster his argument about regime change by showing that the redistributivist
model helps explain patterns of government redistributive spending.
In this paper we subject the redistributivist model of democratization to one such indirect
test, exploring new data from an earlier historical period. We find that the redistributivist
approach to democratization fails on three dimensions: (a) democracy has no positive effect on
redistributive spending; (b) income inequality has no positive effect on redistributive spending;
and (c) the interaction between democracy and income inequality has no positive effect on
redistributive spending—in fact, its effect is robustly negative. We find this effect consistently in
both our historical analysis of the 1880-1930 period as well as for the more recent era. This is not
merely another wishy-washy null finding for the redistributivist argument, but rather a direct
disconfirmation of the entire theory.
The utility of redistributive models of democratization depends on the relative truth-value
of the underlying theoretical assumption about actors’ preferences, and on that model’s accuracy
in predicting levels of redistributive government spending. To the extent that the Meltzer-
2 For another argument, see Houle (2009).

5
Richard model holds up to empirical scrutiny, we gain confidence that the underlying assumption
is useful for thinking about actors’ preferences in cases of regime transition. To the extent that it
does not, then we have good reason to question the assumption that fear of the poor drives elites’
strategies in cases of regime change. In the next section we summarize the reasons why
democracies redistribute “less than they should.” This review situates our empirical analysis,
which builds on research by Peter Lindert (1994, 2004) on the historical roots of welfare-state
spending. Like Lindert, we agree that going back in history is a better strategy for deriving
inferences about actors’ relative fear of the consequences of democratization. However, our
results cast doubt on the theoretical utility and validity of such an assumption, because we find
no evidence that social spending increases as a function of expansion of suffrage or inequality.
Why Do Democracies Distribute Less than They ‘Should?’
Although some research finds that democracy and redistribution run hand in hand,3 the
weight of evidence calls the redistributivist model’s tenets into question. One hardly needs to
quibble about model specification, estimation techniques, or data quality; the prima facie
plausibility of the redistributivist model is wanting for the simple reason that democracy has
been and remains perfectly compatible with considerable (and rising) inequality. Significant
expropriation of wealth does not follow from universal suffrage; elites do not suffer great
economic losses, despite their self-serving stated fears. It also merits pointing out that the MR
model fails to explain why social-welfare spending increased fastest in wealthy democracies
3 See e.g. Meltzer and Richard (1983); Acemoglu and Robinson (2006); Boix (2001, 2003); Bueno de Mesquita et al. (2003); Ghorbarah, Huth, and Russett (2004); McGuire and Olson (1996); Niskanen (1997); Peters (1991); Alesina and Rodrik (1994); Tabellini (1992); Persson and Tabellini (1994); Milanovic (2000): Husted and Kenny (1997), and Lindert (1994, 2004). Compare Kenworthy and Pontusson (2005) to Kenworthy and McCall (2008).

6
decades after the advent of universal suffrage--and after leftist parties’ and labor unions’ strength
had peaked: after the 1960s (Lindert 2004, 5).
Despite nearly 30 years of research, which has arguably brought better measures of
democracy, inequality and redistribution and the accumulation of much more cross-national data,
it is fair to say that scholars have found no consistent and clear cross-national relationship
between democracy, inequality, and redistributive spending.4 Some scholars have even found a
negative relationship between inequality and redistributive spending, contradicting the
redistributivist model entirely (e.g. Moene and Wallerstein 2001, 2003; Shelton 2007).
The lack of consistent support for the redistributivist model has caused endless scholarly
head-scratching, and generated its own cottage industry of research seeking to explain why
virtually everyone’s predictions—Madison, Tocqueville, Marx, and Mill, not to mention Meltzer
and Richard—turned out to be wrong. Democracy and redistribution do not run together. Why is
formal political equality no barrier to massive economic inequality? Why is the model incapable
of explaining even broad patterns in the data? Apart from the lack of consistent empirical
support, it is no longer satisfactory to retort that all else equal, in equilibrium elites will fear the
median voter--because there are good theoretical reasons to believe that this is simply untrue.
Most efforts to resolve the puzzles the redistributivist model leaves unexplained do not
take issue with the median-voter logic of the MR model. Indeed, most explanations attempt to
salvage the redistributive model by implying that “the logic is true but other factors dilute its
effect.” For example, critics of democracy have long argued that although the median voter might
want redistribution, formal equality is no match for the informal power of the rich, who possess
4 See Cutright (1965); Jackman (1975); Tullock (1983); Pampel and Williamson (1989); Rodrigues (1999); Bénabou (1996); Easterly and Rebelo (1993), Shelton (2007), Perotti 1996; Banerjee and Duflo 2003; Aidt et al 2006; Aidt et al 2009: Aidt and Jensen (2009); Putterman (1997); Cheibub (1998); Lott (1999); Scheve and Stasavage (2010), Dincecco and Prado (2010); Kenworthy and McCall (2008). Reviews of the literature include Mueller (2003); Roemer (1998), (2009); and Harms and Zink (2003).

7
considerable mobilizational advantages over the poor in terms of money, organizational
resources, and social networks that bring them close to those who hold power. This argument has
been around for at least a century—one can trace it from Pareto through Mosca, Michels, Mills
and Schattschneider. More recently, political economists have tossed out the conspiratorial facets
of the approach yet have maintained the core of the argument (e.g. Bénabou 1996, 2000;
Bénabou and Ok 2001; Grossman and Helpman 2002) as part of an effort to formalize the
explanation for why so much government spending--even on public goods—favors the relatively
wealthy (e.g. Stigler 1970; Justman and Gradstein 1999; Lizzeri and Persico 2004; Ross 2006).
Other critics of democracy focus less on the material than the ideational resources of the
wealthy, suggesting that the rich might endeavor to create “false consciousness” on the part of
the poor though ideological domination, particularly via their ownership of the mass media. One
need not be an acolyte of Gramsci to appreciate this point; utilitarianism’s avatar John Stuart
Mill suggested that political equality per se would never drive public spending because most
voters lacked the necessary self-understanding to cast a vote in their own interest. Either
ideological domination or lack of ideological self-awareness could dilute the median-voter effect.
A third explanation for why democracies do not redistribute wealth takes issue with the
redistributivist model’s assumption that politics occurs along a single left-right dimension.
Politics is often fought across multiple dimensions; as the relative salience of non-economic
dimensions increases, the demand for redistribution will decline. Scholars have found good
empirical support for this point.5
Przeworski and Wallerstein (1988) offer a different explanation for the lack of
redistribution under democracy: the structural dependence of the state on capital. The prospect of
5 See Roemer (1998; 2005); Roemer and Lee (2004); Gilens (1999); Alesina and Glaeser (2004); Huber and Stanig (2009); Grossman (2003).

8
redistribution reduces investment, imposing a limit on redistribution even for governments that
want to equalize incomes. According to Przeworski and Wallerstein, Social-Democratic and
Socialist parties understood this logic by the early 20th century.
These arguments all explain the weak connection between democracy and redistribution
by implying that redistribution would happen if only some other things weren’t true. Other
scholars suggest that redistribution would not occur even nothing “diluted” the tension between
democracy and property. For example, it is possible that voters understand that there would be
negative consequences to expropriating the rich, and so prefer policies that equalize opportunity
but not outcomes. Similarly, Bénabou and Ok (2001) consider the “possibility of upward
mobility” (POUM) hypothesis: poor voters oppose taxation in the present because they expect
their (or their children’s) income to increase in the future (see also Alesina and La Ferrara 2005).
Finally, it is possible that most individuals simply do not believe that structural constraints shape
their life chances or that the wealthy conspire against them. Instead, they believe that although
individuals are born with different abilities to transform assets into incomes and that luck plays
an important role in one’s life chances, people generally get what they deserve in life and
shouldn’t ask for a handout.
The 20th century saw explosive growth of taxes, government spending and per capita
income in the world’s wealthiest democracies. Lindert (2004) has suggested that the lack of an
obvious tradeoff between higher taxation and economic growth suggests that the welfare state is
evidence of the existence of the mythical free lunch. Even so, despite the growth of redistributive
spending, inequality remains markedly persistent, changing only in situations of deep national
calamity such as war or global economic crises (Li et al 1997; Scheve and Stasavage 2010). No
consensus exists as to why democracies redistribute less than they are “supposed to,” but the
9
point remains: empirical support for the redistributive theory of democracy is weak, meaning that
we have good theoretical reason to believe that in most circumstances (all except situations ripe
for social revolutions, which are very rare (Skocpol 1979; Tilly 1993) elites have relatively little
to fear from the poor and rationally extend the franchise in their own economic interests
(Justman and Gradstein 1999; Lizzeri and Persico 2004; Ansell and Samuels 2010).
A final explanation for why democracy is not robustly associated with redistribution
actually comes from Boix (2003, Chapter Five) in his examination of the relationship between
democracy, inequality and public spending from 1970 to 1999. Boix argues that his theory of
endogenous democratization helps explain why democracies are not heavy spenders, despite the
Meltzer-Richard logic that underlies his model of regime change. He reasons that if regime type
is endogenous to pre-existing inequality, and if democracies only emerge under low levels of
inequality, then redistribution should be low in actually existing democracies, since such states
have fairly equal income distributions to begin with, which implies relatively low demand for
redistribution.
The logic of this claim is rather neat but it presents three major problems. First, the
redistributivist argument about regime change depends on the assumption that autocratic elites
believe that democracy causes undesired levels of redistribution. Yet if no actually existing
democracy exhibits this pattern, the model requires members of the elite to judge potential future
regimes on characteristics that never occur. In other words, what happens off the equilibrium
path becomes crucial for Boix’s argument about elite motivations. Second, this argument
presumes a rather deterministic world in which democratization only occurs under conditions of
low inequality and hence we never see redistribution. This argument is rather knife-edge. If,
democratization is at least partly “exogenous” rather than endogenous (Przeworski et al. 2000),

10
regime change can occur under conditions of moderate or high inequality, and we would expect
to see at least some variation in government spending as a function of levels of inequality.
Third—as we argue elsewhere (Ansell and Samuels, 2010) --Boix’s empirical analysis of regime
change is problematic. In fact, democracies do often emerge under conditions of relatively high
inequality. In such cases, the redistributivist model would expect relatively high levels of
redistribution to follow. Yet as we shall demonstrate, there is no evidence that such a dynamic
exists.
Democracy and Redistribution: Reexamining the Evidence
Many scholars are unwilling to set aside the logic of the redistributivist model, despite
the weak evidence in its favor. We recognize that the logic is seductive, and that perhaps even
repeated null findings will never fully convince adherents that their faith is misguided.
Regardless, the debate about the utility of the redistributivist approach to democratization
depends on consistent empirical evidence both of the impact of inequality on democratization
and of inequality on redistributive spending.
In this section we test the redistributive hypothesis on redistributive spending in a crucial,
early historical time-period. We agree with Lindert (2004), who suggested that the reason most
tests of the redistributive hypothesis are inconclusive is because they rely on data from the post-
war era. By the 1950s, the bureaucratic machinery enabling taxing and spending had existed for
several decades in Europe. Wagner’s Law predicts government spending will increase as the
technological and bureaucratic capacity for taxing and spending is put into place, regardless of
regime-type. And indeed, social spending increased rapidly across all wealthy democracies after

11
World War II. Because of high correlations between them, studies relying on post-war data will
have trouble disentangling the causal effects of key independent variables.
To avoid this problem, Lindert argues that the era in which welfare-state policies first
emerged—1880 to 1930--offers a much stronger test of competing theories of redistributive
spending. Prior to 1880, too few countries were democracies, and too few countries spent
anything on social welfare. To the extent that the redistributive logic explains patterns in
redistributive spending, we should see evidence that it can distinguish countries that were among
the first to expand the franchise from countries that delayed democratization until later. Even
within Europe, considerable variation existed prior to 1930 on key independent variables such as
democracy, inequality, demography, and per capita income—as well as on the dependent
variable. The earlier historical era reduces the potential endogeneity of key independent variables
and allows for more precise insights into the causal effect of democracy and inequality.
This earlier historical era offers a crucial laboratory for extending research on the
potential connections between democracy and redistribution. Let us explain how we plan to test
these links. At its simplest, the redistributive model entails the following predictive logic:
individuals, endowed with particular sets of economic assets, vote for a tax rate to finance the
level of government redistributive programs. The tax rate should correspond to the preferences of
the median voter, based on his or her pretax income. In turn, the median voter bases his or her
decision on the difference between his or her income and the average income. As inequality
increases, demand for redistribution also increases--and increased redistributive spending should
follow.
The main theoretically relevant variables used to test this hypothesis fall into three
categories: political, economic, and demographic. The most important political variable is
12
regime-type: Most broadly, the redistributivist logic suggests that democracy should have an
independent effect on redistributive spending, since voice is open to all yet the median voter
earns less than average income. More narrowly, the “degree” of democracy, in particular the
extent of the franchise, should have a direct effect on redistributive spending.
Several scholars have also suggested that in addition to regime type, the level of electoral
participation in democracies should impact redistributive spending. This is because differences
turnout change the relative position of the median voter: When turnout is high, the median voter
is relatively poorer, increasing demand for redistribution.
Turning to economic variables, the most important is the level economic development,
typically measured as per capita income. Since Wagner, scholars have held that economic
development will spur government intervention in the economy. For example, industrialization
creates an urban working class that experiences job turnover and job-related injuries relatively
more frequently. This generates increased demand for unemployment compensation, disability
payments, public health care, etc. As development proceeds, the economy also becomes more
complex, necessitating government intervention in a host of new areas. Finally, improvements in
medical technology and infant healthcare also lead to increased pressure for public healthcare.
The redistributive model also highlights the importance of economic inequality. Boix
suggests that, “The presence of sharp income differentials generates strong redistributive
pressures that should lead to very high taxes and transfers” (173), but notes that we should
observe this effect only in democracies. This means that the key mechanism in the redistributive
model is the interaction between democracy and inequality, because inequality should not
impact government spending in autocracies. Only in democratic regimes should inequality lead
to higher redistributive spending.

13
A third economic variable is globalization, typically operationalized as openness to
international trade. Much recent scholarship has illuminated the connection between a country’s
exposure to trade and its government’s reliance on redistributive spending (e.g. Alesina and
Rodrik 1994): greater exposure leads governments to construct a deeper and wider safety net for
citizens harmed by international competition.
The last group of important variables focuses on demography. First, many suggest that
ethnic and/or religious diversity tends to reduce redistributive spending. Second, partly as a
result of economic development, as the average age of the population increases, demands for
social spending such as public pensions and medical care will increase. Lindert (2004, 183) notes
that this effect has been observed ever since life expectancy began to accelerate in the late 19th
century. He also notes that the effect of an aging population appears across all types of social-
welfare spending (not just old-age pensions), although the precise mechanism driving this effect
remains unclear.
At present we are only able to collect a full range of these variables for the postwar era,
consequently our analysis of the 1880-1930 period is limited to basic political and economic
factors. Out 1961 to 1999 dataset does, however, include a broad specification along the lines
suggested above.
Data and Variables
1) Sample
Lindert critiqued several statistical tests of the redistributivist model for relying on biased
samples, even for the post-war era. Because data are most readily available for high-spending

14
OECD democracies but the incidence of regime-type and per capita income is not random among
missing cases, Lindert suggested that results are often biased towards confirming a relationship
between democracy and redistribution. We noted this to be the case for Boix’s results that link
democracy and inequality (Ansell and Samuels, 2010), and here suggest that the same problem
applies to Lindert’s own analysis of the 1880-1930 period.
Lindert (2004, following Lindert 1994) gathered data for 30 countries for 1880-1930,
although most countries in his dataset are not covered for the full period. POLITY IV counts 53
independent states in 1880, and 68 by 1930. While we are not yet able to find government
spending data for all 53 countries, we have been able to expand Lindert’s sample by a third, up to
40 cases. This has important implications for the composition of our sample vis-à-vis Lindert’s.
For example, in 1880 the countries in Lindert’s dataset had an average Polity2 score of 0.90,
whereas our cases in that year have an average score of 0.20. The average for the 53 countries in
the Polity dataset in 1880 was -1.15, suggesting that it remains for us to locate data for a number
of autocracies. Similarly, for 1930 the average Polity2 score for the countries in Lindert’s sample
was 4.80, while the average for the 37 countries in our dataset was 2.80; the average in the Polity
database was 0.00. In general, our sample more closely reflects the actual distribution of
independent states during this period than Lindert’s, suggesting that our results are less likely to
be biased.
2) Dependent Variables
We hew as closely as possible to Lindert’s measures, which closely echo contemporary
OECD definitions of social expenditures. Thus we gathered information on spending as a
percentage of GDP of four types of government programs: 1) welfare and unemployment

15
compensation; 2) pension subsidies; 3) health subsidies; and 4) housing subsidies. Separating
social spending into these four categories is important for testing the redistributive model of
politics because each category has different redistributive implications. The four categories are
listed from most to least progressive (Lindert 2004, 3); by implication, the redistributive model
of politics should have the most impact on welfare and unemployment compensation, and the
least impact on pension subsidies. Put differently, the former is intra-generational redistribution
from rich to poor, whereas the latter is inter-generational redistribution and--during the 1880-
1930 period--was often limited to individuals in certain middle-class professions (including the
government bureaucracy). If the effects of democracy on redistributive spending are less than
crystal-clear on types of spending that are most obviously redistributive, then the model loses
explanatory power.
To gather historical data on social-welfare spending as a percentage of GDP, we start
with Lindert’s data (2001, 2002).6 Lindert relied on a detailed International Labour Organization
(ILO) survey, International Survey of Social Services (ILO 1933, 1936). To add additional cases
we relied on the same ILO source as well as different countries’ official national statistical
yearbooks. (The full database for this paper and the 65-page statistical appendix are available on
request from the authors.) Our efforts resulted in a decade-by-decade view of social spending
that builds considerably on Lindert’s analysis.
3) Independent Variables
For ease of presentation and to maximize the number of observations on the social-
spending data, in this paper we limit the number of independent variables we explore to include
6 We thank Peter Lindert for providing the core databases for Growing Public.

16
different measures of democracy, per capita income, and various types of inequality.7 For
democracy, we explore both dichotomous and continuous measures. Specifically, we use Boix
and Rosato’s (2003) extension of Przeworski et al’s (2000) dummy for democracy, which
extends back to the 19th century, and the Polity index.8 Since we run a variety of statistical
specifications, some of our analyses below examine cross-sectional differences in the level of
democracy across countries, others examine within-country changes in regime type, and still
others examine the change in the “level” of democracy. Given our use of both types of
democracy measures and this variety of specifications, we believe we are covering the various
and several ways in which democracy might impact public spending.
In terms of economic variables, our analysis employs three key measures: per capita
income, income inequality, and land inequality. The former is taken from Maddison’s (2006)
well-known estimates of GDP per capita. We do not explicitly use an income growth variable
along with this level variable, but we do test specifications that examine ten-year changes in per
capita income, meaning we are able to pick up growth effects in these models.
The income inequality variable (a gini coefficient) comes from Bourguignon and
Morrisson (2001), while the land inequality variable is adapted from Vanhanen’s ‘family farms’
and ‘rural population’ variables. The income inequality data is the only existing compilation of
estimates for the 19th century, one that we have employed elsewhere (Ansell and Samuels 2010).
The original data--while heavily cited--has many caveats attached, which we discuss in the
aforementioned paper. Given these caveats, we run our estimates both with and without the
7 We intend to collect the remaining control variables used by Lindert (turnout, trade exposure, and age demographics) for the final version of this project. 8 We also tested the subcomponents of the Polity index to try to pick up which aspects of democracy seem most, or least, important in explaining public spending – these results are not shown but we discuss them briefly in the following section.

17
inequality variables. We also employ a more reliable measure of income inequality for our
postwar analysis.
Finally, although we currently lack extensive data on demographic structure, trade
exposure, and electoral turnout (where appropriate) and hence omit these variables at present, we
are able to mitigate some of these omitted variable problems by including a full series of regional
or country controls (depending on the specification) and year dummies.
Findings: 1880-1930
We begin by analyzing data from the 1880 to 1930 period. Table One presents a series of
estimations of the determinants of public spending using the Boix-Rosato democracy dummy as
an independent variable. Models 1 and 2 are pooled analyses with robust standard errors. We
present two simple specifications. Model 1 includes only democracy and GDP per capita,
whereas Model 2 adds income and rural inequality. Both models also contain a full set of region
dummies and year dummies. In neither case is the coefficient on democracy statistically
significant at conventional levels. There is some evidence in Model 1 that higher income
countries have higher levels of public spending but the inclusion of the two inequality variables
in Model 2 shows that this effect is not robust. Instead rural inequality is strongly negatively
associated with public spending.
Table One Here
A similar pattern can be observed in Models 3 and 4, which include country fixed effects
and thus measure only within-country differences. In neither case is the democracy dummy
robust and as before GDP per capita is only robustly related to public spending when inequality
is not controlled for. As opposed to Model 2, in Model 4 it is income inequality that is robustly

18
related to public spending. However, in sharp contrast with the expectations of the Meltzer-
Richard model, increases in income inequality are negatively related to public spending.
The same pattern is reflected in Models 5 and 6, which use ten-year changes in variables
in place of levels. Again the ten-year change in democracy is unrelated to ten-year changes in
public spending. Moreover, as in Models 3 and 4, changes in GDP per capita are only associated
with changes in public spending when inequality is not controlled for. Changes in inequality in
these models again have a negative effect on public spending. Overall, Table One provides
absolutely no support for the Meltzer-Richard redistributivist logic. Regime change does not
increase public spending, nor does increases in inequality. The relative income of the median
voter does not appear to matter for public spending.
Finally, Models 7 through 9 show another interpretation of democracy’s impact on public
spending – one we shall return to in our analysis of the post-1950 period and one that again
undermines the Meltzer-Richard rationale. In these models we introduce interaction terms
between the democracy dummy and the Gini index. That is, we are testing to see whether
inequality has an effect on public spending conditional on regime type (and vice versa). The
Meltzer-Richard model suggests that the purported positive effects of democracy on public
spending should increase with inequality, since this increases the distance between the income of
the median voter and the voter with mean income. Symmetrically, inequality should have a
stronger positive effect on public spending as the franchise expands from the richest to poorest.
Models 7 through 9 show no such pattern. In fact, Model 7--the pooled analysis--shows
precisely the opposite, a robust negative interaction between the democracy dummy and the Gini
coefficient. Combined with a positive coefficient for the Polity score variable and a (less robust)
positive coefficient for the Gini variable, this implies the following: at low levels of inequality,

19
more democratic states have higher levels of public spending but at high levels if inequality
more democratic states have lower levels of public spending. In Models 8 and 9, the
directionality is similar but the coefficients are not robust. These models are testing a slightly
different hypothesis, however. Whereas the pooled model asks whether unequal democracies are
different to more equal democracies (and their autocratic counterparts), Models 8 and 9 examine
within country changes and ask whether a particular country that is becoming both more
democratic and more unequal sees higher or lower public spending. There is no robust evidence
for either case here (although as we shall see there is in the 1960-1999 data) but the coefficients
point in the direction of the latter case, again counteracting the Meltzer-Richard expectation.
Perhaps the dummy operationalization of democracy is too blunt an instrument to
effectively proxy for political determinants of public spending. In Table Two, we replace the
dichotomous variable with the Polity index. As before, in the pooled Models 1 and 2 changes in
the Polity score towards democracy have no effect on public spending, and we see the same
pattern of GDP per capita only having an effect when inequality is not included.
Table Two Here
In Models 3 and 4 we do find robust positive effects of democracy on public spending: a
ten-point increase in the Polity score increases public spending by about a quarter of a point of
GDP. Models 5 and 6 show a similar pattern, albeit without a robust effect in Model 5. Two
points are worth noting about these results. First, the magnitude of the effect of democracy is tiny
in absolute terms--hardly enough to credibly threaten the economic position of the rich. Even
though public spending was very low in general during this era, a shift of a quarter point of GDP
still amounts to less than a third of a standard deviation in public spending.

20
Second, the effects of the Polity score come from its subcomponents that reflect
executive recruitment, and not the extension of the franchise: in separate regressions (not
shown) we find the only Polity subcomponent that produces a robust positive effect in the fixed
effects analysis is “XRCOMP”--the competitiveness of executive recruitment. This component
essentially reflects a transition from hereditary to competitive executive recruitment, that is, the
move from absolute monarchy to parliamentary constitutionalism. This is not an unimportant
result, but it is noteworthy that the Polity subcomponents that reflect the extension of the
franchise to the masses have no measurable effect on public spending.
Models 7 through 9 again test the interactive effects of democracy and inequality and as
in Table One, we obtain a robust negative relationship for the pooled model. This pattern, which
again completely contradicts the implications of the MR model but which echoes results several
scholars have found (Moene and Wallerstein 2001, 2003; Shelton 2007), can be seen in Figure
One, which plots the estimated effect on public spending of a one point shift in the Polity index
at various levels of inequality. At low levels of inequality, a robust positive effect of an increase
in the Polity index on public spending exists. However, once the Gini index passes its median in
the sample – 0.48 – this effect turns robustly negative. The estimated size of the effect at the 10th
and 90th percentiles of inequality (0.42 and 0.53) is that a one point shift in the Polity index will
increase or decrease public spending by just under 0.1 percent of GDP. Hence a ten point shift in
the Polity index is associated with a full percent point of GDP change in public spending – much
larger than the estimated effects drawn from Models 3 and 4, and in clear contradiction to the
expectations of the redistributivist argument. When we turn to Models 8 and 9 that examine only

21
within country changes, the interactive effect maintains the same directionality but is not
statistically robust.9
Figure One Here
Table Three provides a check on the potential impact of democracy and inequality on
public spending by breaking down the dependent variable into its various subcategories: welfare
and unemployment; pensions; healthcare; and housing. For each category of spending we
examine both pooled and fixed effects models as well as models with and without the
democracy/inequality interaction term. The basic message of this analysis is that only in one case
do we see a direct positive effect of democracy on public spending – pensions – arguably the
least redistributive of all four categories. The area of social spending most closely related to
redistribution – welfare and unemployment – sees no direct positive effect of democracy.
However, when we turn to the interactive effect of inequality and democracy we see the same
negative effect of inequality on spending in democracy as noted above most robustly for welfare
and unemployment, a finding that holds across both pooled and fixed effects models. Thus, in the
area of social spending most clearly “redistributive,” we see strong evidence that government sin
unequal democracies engaged in less redistributive social spending during the 1880-1930 period.
Table Three Here
Findings: 1961-1999
To check our surprising contradictory result, we now compare the effect of inequality and
democracy on redistribution in more recent decades. This is the era that Boix and nearly all other
9 Separate fixed-effects regressions for countries with below or above median inequality show that the positive effects of the Polity index only appear in the more equal group. Similarly, dividing the sample by a Polity score below or above zero we find no effect of inequality on public spending in dictatorships and a robust negative effect of inequality in democracies.

22
research explored. However, we find remarkably similar results to those from 1880 to 1930:
Neither democracy nor inequality exerts a direct positive effect on public spending. Instead, once
again we observe an interactive effect such that democracy is associated with higher public
spending at low levels of inequality and lower levels of public spending at higher levels of
inequality – the precise opposite of the redistributivist logic. Thus in all three formulations:
democracy, inequality, and their interaction, we find no support for the redistributivist model in
postwar data.
Since data availability is much greater for the postwar era than for 1880-1930, we are
able to include a much broader array of control variables. For the dependent variable, here we
use government consumption as a percentage of GDP.10 This variable has been used in a number
of studies of government spending, including Boix (2003), Rodrik (2000) and Shelton (2007). In
terms of independent variables we use measures of GDP, GDP per capita, and population (all
logged) and the percentage of the population either under fifteen or over sixty-five, from the
World Development Indicators. We retain the same rural inequality variable drawn from
Vanhanen as before but replace the Bourguignon and Morrisson income inequality data with
more reliable and broadly available Gini data from Babones and Alvarez-Rivadulla (2007), as
used in Ansell and Samuels (2010). We use a measure of trade openness (imports plus exports
over GDP) drawn from the Penn World Tables, and three measures of social heterogeneity
drawn from Alesina et al (2003): ethnic heterogeneity, linguistic diversity, and religious
diversity, as well as a measure of the proportion of the population identifying as Muslim. In a
number of models we also use a further series of controls that reduce the sample size
considerably but are also used in Boix’s (2003) analysis: turnout in legislative elections drawn
10 We intend to expand the range of dependent variables under analysis considerably – examining in particular the breakdown of various forms of redistributive spending along the lines used in our 1880 to 1930 analysis.

23
from the IDEA dataset (and its interaction with the Gini coefficient) and agricultural value-added
as a percentage of GDP.11 We also employ a series of country or year dummies depending on the
specification.
An important distinction between our data analyses and those of Boix is the much greater
sample size: Boix’s largest sample containing the Gini coefficient is 763 cases, whereas we are
able to triple that figure in many of our models. We point to this fact because Boix’s sample of
gini coefficients was heavily biased towards wealthy, equal democracies, suggesting that his
results may have been biased.
Table Four contains eight models, employing various statistical estimations, some with
random effects (pooled models) and others with fixed effects (within-country models). Each
model uses an AR1 error term specification to capture temporal dependency.12 Models 1 and 2,
respectively using random and fixed effects, show no direct effect of democracy or either type of
inequality on public spending. Per capita income is positively related to government
consumption – the Wagner’s Law effect – and population is negatively related to government
consumption – an economies of scale effect. In the pooled analysis but not the fixed effects
model, the size of dependent populations also has a positive effect on spending.
Table Four Here
Models 3 and 4 demonstrate that while there may not be evidence of direct effects of
these democracy and inequality on government consumption, there is a robust conditional effect
– once more with democracy producing higher public spending only where inequality is low and
lower spending where inequality is high. That this pattern emerges for an entirely different
11 Boix does not clearly describe what he uses for turnout data. We define turnout for each year as its value at the last relevant legislative election; this seems most theoretically appropriate given the redistributivist logic. 12 Lagged dependent variables are problematic in fixed effects models and in studies of public consumption, because they tend to ‘absorbing’ effects on the regression and because of possible unit root problems.

24
sample from Table Two is intriguing and suggests that this conditional relationship may be an
important but, as yet, unexplored aspect of government spending and redistribution and one that
lies in sharp contrast to the redistributivist consensus. Figure Two graphs this conditional effect,
using Model 3’s estimates, and is constructed in the same manner as Figure One.
Figure Two Here
Again we see the estimated effect of democracy flips at around the median level of
inequality, which in this sample is 0.45. At the tenth percentile of inequality (0.36) the effect of a
one-point increase in the Polity index is estimated to increase government consumption of just
under 0.1% of GDP - strikingly similar to the effect found in Figure One. At the ninetieth
percentile of inequality (0.58) the effect of a one-point increase in the Polity index is a decrease
in public consumption of just over 0.1 of national income.
Models 5 through 8 add turnout and agricultural value added variables to match Boix’s
specifications. We do not find any conditional effect of turnout or inequality. (In models not
reported, we find no direct effect of turnout.)
An irony of this analysis is that Boix finds precisely the same negative interaction
between democracy and inequality in his empirical analyses of public spending (see Boix 2003,
Tables 5.1 and 5.2). However, Boix argues that this finding should not count as a strike against
his argument, since in his estimation the “very high coefficient of democratic regime…
compensates for the negative coefficient of the interactive term.” In fact, the level of inequality
at which we estimate democracy has a negative impact on public spending is only slightly above
average—a gini of .49. While Boix’s analysis was limited to a pooled sample, we have shown in
this section that the interactive pattern appears also to apply to within-country changes.

25
Conclusion
In this paper we subjected the redistributivist model of democratization to an indirect test,
exploring new social-welfare spending data from an earlier historical era. We find that the key
hypotheses derived from the redistributivist logic fail to predict government redistributive
spending: Democracy has no positive effect, income inequality has no positive effect, and the
interaction between democracy and income inequality has no effect—in fact, its effect is robustly
negative.
Our finding, that neither inequality nor democracy has the robust positive effect on
redistributive spending is ironically supported by many of the empirical findings of authors who
seek to find evidence in support of the MR model, including Boix and Lindert. Boix’s conclusion
to Chapter 5 essentially admits that the redistributive logic upon which his book is based has
little effect on government spending, because the main engine driving growth in public
redistributive spending is demography: “As the median voter ages, the pressure for
intergenerational transfers increases sharply” (200). Lindert agrees, suggesting that the most
important variables driving the rise of redistributive spending in the 1880-1930 era are economic
and demographic--per capita income and average age of the population—not democracy and
inequality.
Regardless, social-welfare spending remained quite low until long after the 1880-1930
period despite many democratizations in this era; the biggest growth in welfare-state spending
didn’t occur until the 1960s and 1970s, long after democratization. Lindert suggests that the
reason there was so little soaking of the rich prior to WWII was because “the kinds of voters
sympathetic to progressive taxation and transfer payments were still less integrated into the
political process than in the postwar era” (1994, 21). This finding cuts the redistributive

26
argument off at the knees, since it acknowledges that democracy per se is not causing anything,
and even implies that turnout is not a cause but an effect of something more fundamental –
societal change and education, itself caused by economic development. Lindert’s conclusion
raises the question of “Exactly how long should it take after democratization for people to be
integrated ‘enough’ to demand redistribution?” Despite his best efforts, his results illustrate that
even the best-case scenario under-predicts redistribution as a function of democracy.
Our extension of both Boix’s and Lindert’s research further undermines the
redistributivist claim: we find no evidence that on their own, democracy and inequality impact
public spending. Our most intriguing finding, one that others have encountered but sometimes
treated as a nuisance or ignored, is the robust negative conditional relationship between
inequality, democracy and social-welfare spending. We found this effect using two distinct
samples from two separate historical eras. This is not merely a “null” finding for the Meltzer-
Richard model, it is a direct contradiction of the theory’s core premise. Unequal democracies, far
from increasing spending, actually appear to reduce it.
We recognize that we have provided no explanation for this result in this paper. A
provisional explanation is as follows: Our argument (Ansell and Samuels, 2010) suggests that
democratization--particularly partial democratization--is especially likely under conditions of
high income inequality, controlling for rural inequality, as this typically emerges as new
economic actors without political representation grow in income and demand commensurate
political status. To the degree then that we see democratization under conditions of economic
inequality, this heralds bourgeois liberalization rather than the revolution of the masses. Newly-
empowered yet relatively wealthy economic actors are unlikely to demand high levels of
27
government redistribution. Indeed, they may even cut the size of government, particularly if
autocracy had been associated with state expropriation of private property by the existing elite.
In contrast, democratization under conditions of relative equality marks the case where
the masses are relatively wealthier compared to the above case. We have argued elsewhere
(Ansell and Samuels, 2010) that a relatively wealthier mass population may force the bourgeoisie
to engage in joint rebellion rather than taking on the pre-existing elites alone. A joint rebellion
presumably means a stronger post-rebellion political position for the masses, and presuming their
interest in public spending and redistribution is greater than that for the bourgeoisie, we might
expect higher public spending under these conditions. In other words, democratization is a
function of different coalitions that emerge as a function of pre-existing levels of inequality.
Somewhat paradoxically, when inequality is relatively low, regime change involves the masses
but should thus be followed by higher government redistributive spending. However,
democratization is likelier under conditions of high inequality, when those pushing for regime
change--the bourgeoisie—are unlikely to push for redistribution to the poor.
28
References Acemoglu, Daron and James Robinson. 2000. “Why Did the West Extend the Franchise?
Democracy, Inequality and Growth in Historical Perspective.” Quarterly Journal of Economics 115: 1167-1199.
Acemoglu, Daron and James Robinson. 2006. Economic Origins of Dictatorship and Democracy. New York: Cambridge University Press.
Aidt, Toke et al. 2006. “Democracy Comes to Europe: Franchise Extension and Fiscal Outcomes, 1830-1938.” European Economic Review 50(2): 249-283.
Aidt, Toke and Peter Jensen. 2009. “Taxation and the extension of the voting franchise in western Europe, 1860-1938.” International Tax and Public Finance, vol. 16, pp. 362-394.
Aidt, Toke et al. 2009. “The Retrenchment Hypothesis and the Extension of the Franchise in England and Wales.” Unpublished, University of Cambridge.
Alesina, Alberto and Dani Rodrik. 1994. “Distribution, Politics and Economic Growth.” Quarterly Journal of Economics 109(2): 465-490.
Alesina, Alberto and Edward Glaeser. 2004. Fighting Poverty in the US and Europe: A World of Difference. New York: Oxford University Press.
Alesina, Alberto and Eliana La Ferrara. 2005. “Preferences for redistribution in the land of opportunities.” Journal of Public Economics 89(5-6): 897-931.
Ansell, Ben and David Samuels. 2010. “Inequality and Democratization: A Contractarian Approach.” Forthcoming (December), Comparative Political Studies.
Banerjee, Abhijit and Esther Duflo. 2003. “Inequality and Growth: What Can the Data Say?” Journal of Economic Growth 8: 267-299.
Bénabou, Roland. 1996. “Inequality and growth.” In B. S. Bernanke and J. J. Rotemberg (eds.), NBER Macroeconomics Annual 11: 11–74. Cambridge, MA: MIT Press.
Bénabou, Roland. 2000. ”Unequal Societies: Income Distribution and the Social Contract.” American Economic Review 90: 96-129.
Bénabou, Roland and Efe A. Ok. 2001 “Social Mobility and the Demand for Redistribution: The POUM Hypothesis.” The Quarterly Journal of Economics, Vol. 116(2): 447-487.
Boix, Carles 2001. “Democracy, Development and the Public Sector.” American Journal of Political Science 45:1-17.
Boix, Carles. 2003. Democracy and Redistribution. New York: Cambridge University Press. Bueno de Mesquita, Bruce et al. 2003. The Logic of Political Survival. Cambridge: MIT Press. Cheibub, José Antonio. 1998. “Political Regimes and the Extractive Capacity of Governments:
Taxation in Democracies and Dictatorships.” World Politics 50(3): 349-376. Cutright, Phillips 1965. “Political Structure, Economic Development and National Social
Security Programs.” American Journal of Sociology 70(5): 537-550. Dinecco, Mark and Mauricio Prado. 2010. “War, Democracy and Government Size over the
Long Run: A Structural Breaks Analysis.” Unpublished, IMT Luca Institute for Advanced Studies.
Easterly, William and Sergio Rebelo. 1993. “Fiscal Policy and Economic Growth.” Journal of Monetary Economics 32: 417-458.
Ghorbarah, H.A. et al. 2004. “Comparative Public Health: The Political Economy of Human Misery and Well-Being.” International Studies Quarterly 48(1): 73-94.

29
Gilens, Martin. 1999. Why Americans Hate Welfare: Race, Media, and the Politics of Anti-Poverty Policy. Chicago: University of Chicago Press.
Gouveia, M and N.A. Masia. 1998. “Does the Median Voter Model Explain the Size of Government?” Public Choice 97(1-2): 159-77.
Grossman, Volker. 2003. “Income Inequality, voting over the size of public consumption, and growth.” European Journal of Political Economy 19:265-287
Grossman and Helpman 2002. Special Interest Politics. Cambridge: MIT Press. Harms, Philipp and Stefan Zink. 2003. “Limits to redistribution in a democracy: a survey.”
European Journal of Political Economy 19: 651–668. Husted, T.A. and Kenny, L.W. 1997. “The effect of the expansion of the voting franchise on the
size and scope of government.” Journal of Political Economy 105: 54-82. Huber, John and Piero Stanig, 2009. “Individual income and voting for redistribution across
democracies.” Unpublished, Columbia University. Jackman, Robert. 1975. Politics and Social Inequality: A Comparative Analysis. New York: John
Wiley and Sons. Justman, Moshe, and Mark Gradstein. 1999. “The Industrial Revolution, Political Transition, and
the Subsequent Decline in Inequality in 19th Century Britain.” Explorations in Economic History 36: 109-127.
Kenworthy, Lane and Jonas Pontusson. 2005. “Rising Inequality and the Politics of Redistribution in Affluent Countries.” Perspectives on Politics 3(3): 449-471.
Kenworthy, Lane and Leslie McCall. 2008. “Inequality, Public Opinion and Redistribution.” Socio-Economic Review 6:35-68.
Lee, Woojin, and John E. Roemer. 1998. “Income distribution, redistributive politics and economic growth.” Journal of Economic Growth 3:217-240.
Lee, Woojin. 2003. “Is democracy more expropriative than dictatorship? The Tocquevillian wisdom revisited.” Journal of Development Economics 71:155-198.
Li, Hongyi, Lyn Squire and Heng-fu Zou. 1997. “Explaining International and Inter-temporal Variations in Income Inequality.” Economic Journal 108: 1-17.
Lindert, Peter 1992. “The Rise of Social Spending, 1880-1930, Appendices A and B.” Working Paper Series #68, Agricultural History Center, UC-Davis.
Lindert, Peter. 1994. “The Rise of Social Spending, 1880-1930.” Explorations in Economic History 33(1): 1-34.
Lindert, Peter. 2001 “Revised Data Set, “The Rise of Social Spending, 1880-1930.” Microsoft Excel spreadsheet. On file with authors.
Lindert, Peter. 2002. “Banks Data Set, Trimmed, 1860-1937.” Microsoft Excel Spreadsheet. On file with authors.
Lindert, Peter. 2004. Growing Public: Social Spending and Economic Growth Since the 18th Century. New York: Cambridge.
Lizzeri, Alessandro, and Nicola Persico. 2004. “Why did the elites extend the suffrage? Democracy and the scope of the government, with an application to Britain’s Age of Reform’.” Quarterly Journal of Economics 118: 707-765.
Lott, John. 1999. “How Dramatically Did Women’s Suffrage Change the Size and Scope of Government?” Journal of Political Economy 107(6):1163-1198.
Maddison, Angus. 2006. The World Economy: A Millenial Perspective. Volume II, Historical Statistics. Paris: OECD. Data available on-line at http://www.ggdc.net/maddison/

30
McGuire, Martin and Mancur Olson. 1996. “The Economics of Autocracy and Majority Rule: The Invisible Hand and the Use of Force.” Journal of Economic Literature 34(1): 72-96.
Meltzer, Alan and Scott Richard. 1981. “A Rational Theory of the Size of Government.” Journal of Political Economy 89(5): 914-27.
Meltzer, Alan and Scott Richard. 1983. “Tests of a rational theory of the size of government.” Public Choice 41:403-418.
Milanovic, Branko. 2000. “Do more unequal countries redistribute more? Does the median voter hypothesis hold?” European Journal of Political Economy 16:367-410.
Moene, Karl and Michael Wallerstein. 2001. “Inequality, Social Insurance and Redistribution.” American Political Science Review 95: 859-874.
Moene, Karl. and Michael Wallerstein. 2003. “Earnings inequality and welfare spending: a Disaggregated Analysis.” World Politics 55(4): 485-516.
Mueller, John. 2003. Public Choice III. New York: Cambridge. Mulligan, Casey et al. 2004. “Do Democracies Have Different Public Policies than
Nondemocracies?” Journal of Economic Perspectives 18(1): 51-74. Niskanen, W. A 1997. “Autocratic, Democratic and Optimal Government.” Economic Inquiry
35(3):464-79. Pampel, Fred and John Williamson. 1989. Age, Class, Politics and the Welfare State. New York:
Cambridge University Press. Perotti, Robert. 1996. “Growth, income distribution and democracy: what the data say.” Journal
of Economic Growth 1: 149–188 Persson, Torsten and Guido Tabellini. 1994. “Is Inequality Harmful for Growth?” American
Economic Review 84(3): 600-621. Peters, B. Guy. 1991. The Politics of Taxation: A Comparative Perspective. Cambridge, MA:
Blackwell. Przeworski, Adam. 2007. “Political Rights, Property Rights, and Development.” Working paper,
NYU Department of Politics. Przeworski, Adam. 2009, “Democracy, Equality, and Redistribution.” In Richard Bourke and
Raymond Geuss (eds.), Political Judgement: Essays in Honour of John Dunn. Cambridge: Cambridge University Press, pp. 281-312.
Przeworski, Adam. 2010. Democracy and the Limits of Self-Government. New York: Cambridge University Press.
Przeworski, Adam and Michael Wallerstein. 1988. “Structural Dependence of the State on Capital.” American Political Science Review 83(1):11-29.
Przeworski, Adam et al. 2000. Democracy and Development. New York: Cambridge University Press.
Putterman, R., 1997. Why have the rabble not redistributed the wealth? On the stability of democracy and unequal property. In: Roemer, J. (Ed.), Property Relations, Incentives, and Welfare. Macmillan, London, pp. 359–389.
Rodrigues, Francisco. 1999. “Does distributional skewness lead to redistribution? Evidence from the United States.” Economics and Politics 11:171-199.
Roemer, John. 1998. “Why the poor do not expropriate the rich: an old argument in new garb.” Journal of Public Economics 70:399-424.
Roemer, John. 2005. “Will Democracy Engender Equality?” Economic Theory 25: 217-234. Ross, Michael. 2006. “Is Democracy Good for the Poor?” American Journal of Political Science
50(4): 860–874.

31
Scheve, Kenneth and David Stasavage. 2009. “Institutions, Partisanship and Inequality in the Long Run.” World Politics 61:215:253.
Shelton, Cameron. 2007. “The Size and Composition of Government Expenditure.” J Public Economics 91: 2230-2260.
Skocpol, Theda. 1979. States and Social Revolutions. New York: Cambridge University Press. Stigler, G.J., 1970. “Director’s Law of public income distribution.” Journal of Law and
Economics 13, 1–10. Tilly, Charles. 1993. European Revolutions 1492-1992. Oxford: Basil Blackwell. Tullock, Gordon. 1983. “Further Tests of a rational theory of the size of government.” Public
Choice 41: 419-421.

Table One: 1880 to 1930 Public Spending using Boix-Rosato Dummy
(1) (2) (3) (4) (5) (6) (7) (8) (9) POOLED POOLED WITHIN WITHIN 10 YR Δ 10 YRΔ POOLED WITHIN 10 YR Δ Democracy 0.225 0.098 0.126 0.073 7.862*** 0.998 (0.145) (0.155) (0.127) (0.097) (1.525) (1.830) GDP per cap 0.172*** 0.090 0.369** 0.144 0.047 0.137 (0.054) (0.066) (0.142) (0.118) (0.064) (0.122) BM Gini 1.431 -9.833*** 6.306*** -8.415** (1.770) (3.233) (1.519) (3.853) Rural Inequality -1.343*** -1.010 -1.667*** -0.978 (0.348) (0.785) (0.305) (0.782) Democracy*GINI -16.412*** -1.930 (3.182) (3.871) Democracy Δ10 -0.050 -0.081 2.399 (0.060) (0.057) (1.603) GDP per cap Δ10 0.296** 0.110 0.086 (0.129) (0.108) (0.103) BM Gini Δ10 -8.726** -4.957 (3.676) (3.605) Rural Ineq. Δ10 -0.333 -0.219 (0.672) (0.647) Dem*Gini Δ10 -0.219 (0.647) Constant 0.612** -0.244 -0.322 3.757* 0.248*** 0.172** -1.346 4.725** 0.211** (0.268) (0.987) (0.444) (2.188) (0.087) (0.082) (0.890) (1.824) (0.083) Observations 150 134 150 134 108 97 134 134 97 Countries 40 35 40 35 34 27 35 35 27 Year Dummies Y Y Y Y Y Y Y Y Y Region Dummies Y Y N N N N Y N N R-squared 0.499 0.552 0.483 0.592 0.220 0.291 0.633 0.594 0.312
Standard errors in parentheses *** p<0.01, ** p<0.05, * p<0.1
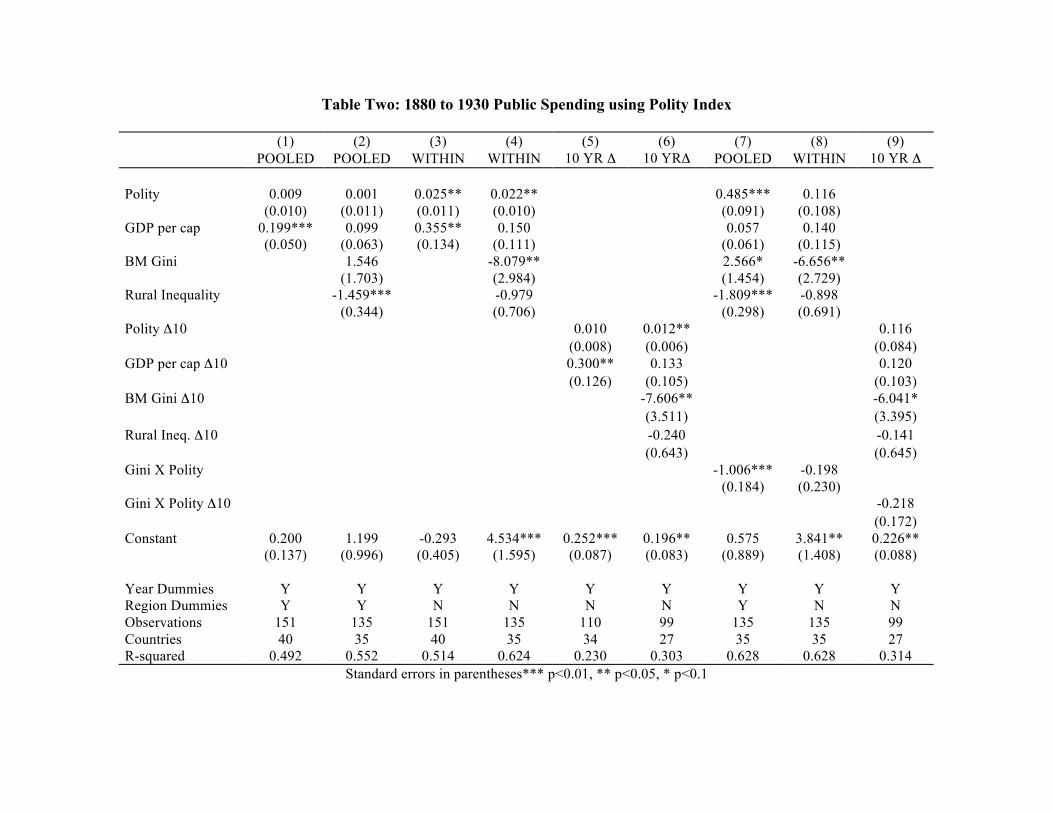
Table Two: 1880 to 1930 Public Spending using Polity Index
(1) (2) (3) (4) (5) (6) (7) (8) (9) POOLED POOLED WITHIN WITHIN 10 YR Δ 10 YRΔ POOLED WITHIN 10 YR Δ Polity 0.009 0.001 0.025** 0.022** 0.485*** 0.116 (0.010) (0.011) (0.011) (0.010) (0.091) (0.108) GDP per cap 0.199*** 0.099 0.355** 0.150 0.057 0.140 (0.050) (0.063) (0.134) (0.111) (0.061) (0.115) BM Gini 1.546 -8.079** 2.566* -6.656** (1.703) (2.984) (1.454) (2.729) Rural Inequality -1.459*** -0.979 -1.809*** -0.898 (0.344) (0.706) (0.298) (0.691) Polity Δ10 0.010 0.012** 0.116 (0.008) (0.006) (0.084) GDP per cap Δ10 0.300** 0.133 0.120 (0.126) (0.105) (0.103) BM Gini Δ10 -7.606** -6.041* (3.511) (3.395) Rural Ineq. Δ10 -0.240 -0.141 (0.643) (0.645) Gini X Polity -1.006*** -0.198 (0.184) (0.230) Gini X Polity Δ10 -0.218 (0.172) Constant 0.200 1.199 -0.293 4.534*** 0.252*** 0.196** 0.575 3.841** 0.226** (0.137) (0.996) (0.405) (1.595) (0.087) (0.083) (0.889) (1.408) (0.088) Year Dummies Y Y Y Y Y Y Y Y Y Region Dummies Y Y N N N N Y N N Observations 151 135 151 135 110 99 135 135 99 Countries 40 35 40 35 34 27 35 35 27 R-squared 0.492 0.552 0.514 0.624 0.230 0.303 0.628 0.628 0.314
Standard errors in parentheses*** p<0.01, ** p<0.05, * p<0.1

Table Three: Breaking Down Spending 1880-1930
(1) (2) (3) (4) (5) (6) (7) (8) Welfare Pensions Health Housing Welfare Pensions Health Housing Polity -0.007 0.005 0.003 0.001 0.002 0.016*** 0.004 0.001 (0.005) (0.004) (0.004) (0.001) (0.003) (0.006) (0.006) (0.001) GDP per cap 0.016 0.050** 0.033 0.012** 0.037 0.068 0.044 0.012 (0.030) (0.024) (0.024) (0.006) (0.037) (0.059) (0.038) (0.014) BM Gini 1.164 0.276 0.443 -0.036 -1.769 -2.542 -2.130 -1.157 (0.859) (0.603) (0.557) (0.138) (1.111) (1.506) (1.670) (0.755) Rural Inequality -1.219*** -0.013 -0.216* 0.034 -0.105 -0.528 -0.287 0.005 (0.189) (0.121) (0.121) (0.022) (0.285) (0.425) (0.325) (0.078) Constant 0.081 -0.107 0.434 -0.041 1.091** 1.431* 1.208 0.522 (0.518) (0.429) (0.364) (0.086) (0.462) (0.786) (0.876) (0.371) R-squared 0.494 0.565 0.435 0.222 0.290 0.555 0.360 0.326 (9) (10) (11) (12) (13) (14) (15) (16) Polity 0.205*** 0.194*** 0.052 0.027*** 0.099** 0.074 -0.088 0.025 (0.043) (0.038) (0.034) (0.008) (0.039) (0.067) (0.078) (0.019) GDP per cap -0.003 0.031 0.029 0.010 0.027 0.061 0.054 0.010 (0.031) (0.023) (0.025) (0.006) (0.037) (0.063) (0.039) (0.015) BM Gini 1.620** 0.605 0.544 0.016 -0.301 -1.693 -3.516 -0.792 (0.759) (0.516) (0.522) (0.122) (0.814) (1.651) (2.144) (0.478) Polity X Gini -0.440*** -0.392*** -0.103 -0.055*** -0.204** -0.122 0.193 -0.051 (0.089) (0.076) (0.067) (0.016) (0.082) (0.142) (0.159) (0.041) Rural Inequality -1.369*** -0.158* -0.252** 0.014 -0.021 -0.483 -0.366 0.026 (0.187) (0.093) (0.119) (0.024) (0.289) (0.436) (0.330) (0.089) Constant -0.199 0.063 0.371 0.001 0.376 1.021 1.882* 0.344 (0.468) (0.393) (0.350) (0.095) (0.346) (0.840) (1.084) (0.245) R-squared 0.555 0.654 0.442 0.281 0.321 0.562 0.386 0.346 Observations 136 133 134 137 136 133 134 137 Countries 35 35 35 35 35 35 35 35 Fixed Effects N N N N Y Y Y Y

Table Four: Postwar Analysis 1960 to 1999
(1) (2) (3) (4) (5) (6) (7) (8) Polity -0.024 -0.015 0.326*** 0.315*** -0.016 -0.010 0.242** 0.276** (0.016) (0.017) (0.094) (0.101) (0.016) (0.017) (0.100) (0.108) SB Gini -2.626 6.452 -1.083 8.124 -2.409 10.057 -3.475 5.363 (3.640) (7.203) (3.667) (7.228) (3.600) (7.456) (6.259) (8.067) Rural Inequality -0.480 3.426 -0.345 3.359 0.674 3.409 -2.805** -2.201 (1.475) (2.327) (1.476) (2.331) (1.489) (2.267) (1.430) (2.260) SB Gini X Polity -0.730*** -0.687*** -0.519** -0.581*** (0.193) (0.207) (0.207) (0.223) Turnout -1.066 0.458 (3.766) (4.055) Turnout X Polity 1.406 -2.473 (7.806) (8.389) Agricultural Sector -0.022 -0.002 -0.064*** -0.042** (0.015) (0.016) (0.016) (0.017) Log Population -0.787*** -1.705** -0.710*** -1.561** -0.897*** -1.481** -0.928*** -1.271* (0.257) (0.672) (0.258) (0.674) (0.250) (0.668) (0.234) (0.727) Log GDP per cap 2.309*** 2.709*** 2.212*** 2.522*** 1.734*** 2.353*** 0.990** 1.771*** (0.434) (0.683) (0.435) (0.685) (0.460) (0.687) (0.442) (0.684) Pop>64 0.726*** 0.226 0.697*** 0.201 0.622*** -0.047 0.670*** -0.012 (0.147) (0.238) (0.148) (0.238) (0.149) (0.281) (0.122) (0.210) Pop<15 0.196*** 0.017 0.189*** 0.010 0.148** 0.008 0.201*** 0.137** (0.064) (0.076) (0.064) (0.077) (0.065) (0.076) (0.056) (0.069) Openness 0.004 0.002 0.004 0.002 0.003 0.008 0.005 0.016*** (0.004) (0.005) (0.004) (0.005) (0.004) (0.005) (0.004) (0.005) Ethnic Division 0.503 0.000 0.701 0.000 -0.125 0.000 -0.952 0.000 (2.124) (0.000) (2.130) (0.000) (2.067) (0.000) (1.808) (0.000) Linguistic Division 1.040 0.000 0.562 0.000 0.579 0.000 1.988 0.000 (1.861) (0.000) (1.870) (0.000) (1.822) (0.000) (1.604) (0.000) Religious Division 2.455 0.000 2.419 0.000 2.761 0.000 2.106 0.000 (1.783) (0.000) (1.788) (0.000) (1.716) (0.000) (1.483) (0.000) Muslim Population 0.046*** 0.000 0.048*** 0.000 0.043*** 0.000 0.023** 0.000 (0.014) (0.000) (0.014) (0.000) (0.013) (0.000) (0.011) (0.000) Constant -9.774 2.670*** -10.072 2.332*** -1.263 3.480*** 5.501 5.386*** (6.199) (0.506) (6.205) (0.504) (6.553) (0.461) (6.382) (0.513) Country Dummies N Y N Y N Y N Y Decade Dummies N N N N Y Y Y Y Observations 2888 2775 2888 2775 2450 2338 1920 1814 Countries 113 93 113 93 112 92 106 87

36
Figure One: Effects of Polity Score on Public Spending by Level of Inequality 1880-1930

37
Figure Two: Effects of Polity Score on Public Consumption by Inequality 1960-1999
Recommended