Delivery of Preschool Services and Programs in Virginia’sPublic Education System
House Appropriations Committee RetreatNovember 14, 2006Susan HoggeHouse Appropriations Committee Staff

2
Preschool Programs in Virginia
Virginia has long been a sustained leader in supporting and developing early childhood education for four-year-olds as well as for all of elementary education childrenResearch shows that well prepared children entering kindergarten perform better than those who lack any formative skills As educational programs as grown so has the focus on student achievement and assessments
Virginia developed the Standards of Learning (SOL) years before any federal requirements of No Child Left Behind (NCLB) Act

3
Federally Funded Programs
Virginia has participated in a variety of federal preschool programs since the mid 1960’sPrimarily, these programs provide funding to support low-income at-risk children to help them meet state academic standards and to provide support servicesTitle I, Part A is the largest federal program supporting K-12 education - $207.8 million in FY 2007
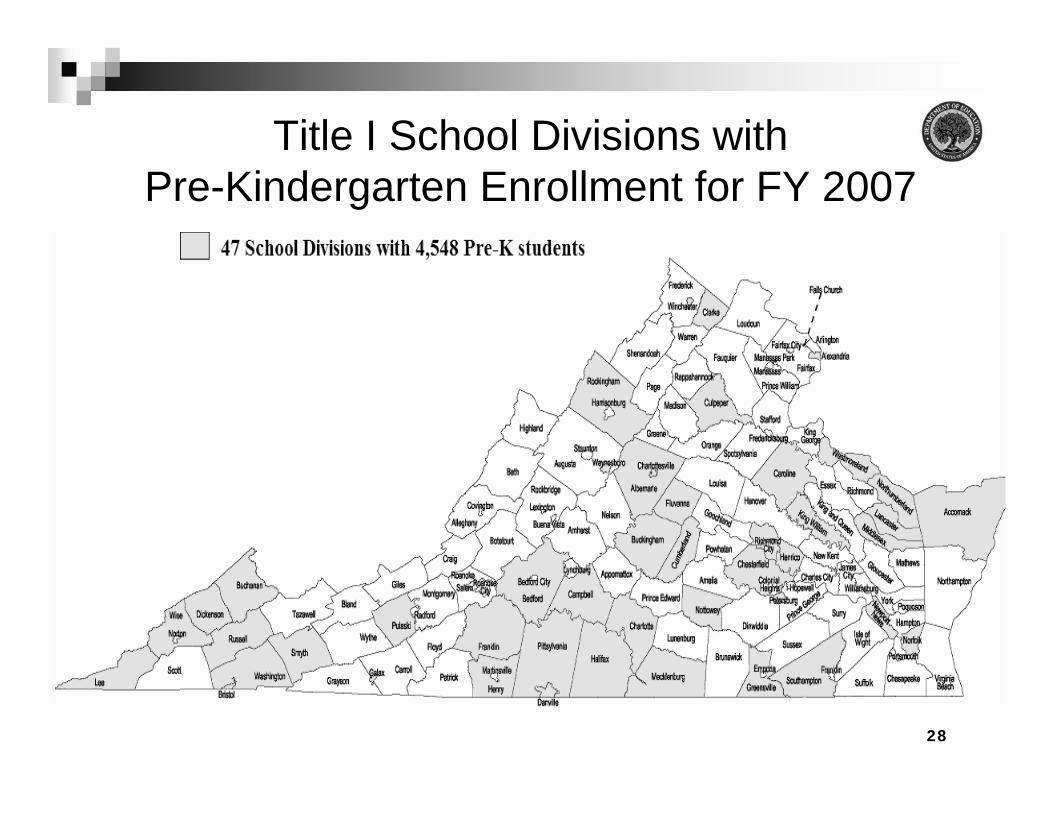
All 136 school divisions participate in this federal program andhave at least 1 school that receives funding47 divisions also include 4,548 Pre-K children in program
Title I, Part B focuses on young children, especially those from low-income families, with reading deficiencies in Pre-K to grade 3 - $21.3 million in FY 2007
43 divisions will receive funding for 87 schools

4
Federally Funded Programs
Head Start a comprehensive child development program which serves children from age 3 to 5, pregnant women, and their families - $98.8 million in FY 2006
It’s goal is to increase the school readiness of at-risk children in low-income familiesVirginia has 54 Head Start and Early Head Start (EHS) programs that serve over 16,000 children of which over 8,500 are 4 years old
Special Education: Grants to States - provides grants to divisions offset the costs of providing special education and related services to children with disabilities, ages 3 to 21 - $261.8 million in FY 2007Preschool Grants for Children with Disabilities - provides grants to divisions to make special education and related services available to children with disabilities, ages 3 through 5 - $9.1 million in FY 2007Virginia reported 6,025 four-year-olds enrolled in special education programs last year
5
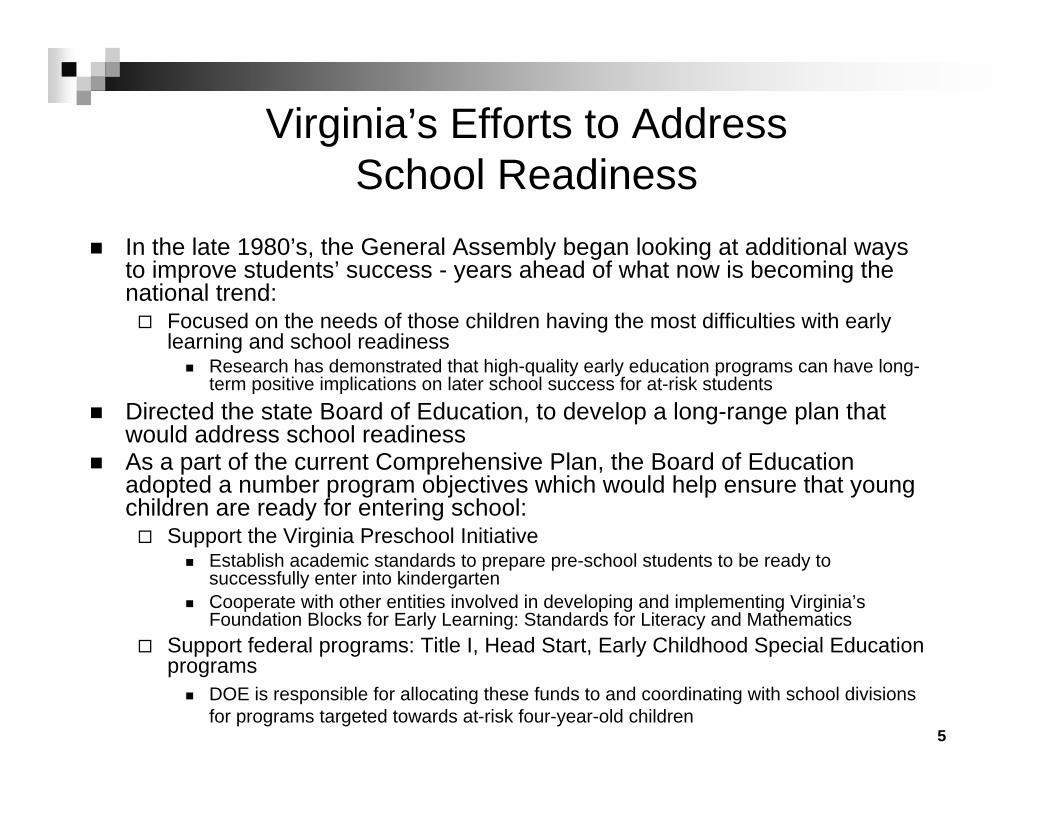
Virginia’s Efforts to Address School Readiness
In the late 1980’s, the General Assembly began looking at additional ways to improve students’ success - years ahead of what now is becoming the national trend:
Focused on the needs of those children having the most difficulties with early learning and school readiness
Research has demonstrated that high-quality early education programs can have long-term positive implications on later school success for at-risk students
Directed the state Board of Education, to develop a long-range plan that would address school readinessAs a part of the current Comprehensive Plan, the Board of Education adopted a number program objectives which would help ensure that young children are ready for entering school:
Support the Virginia Preschool InitiativeEstablish academic standards to prepare pre-school students to be ready to successfully enter into kindergartenCooperate with other entities involved in developing and implementing Virginia’s Foundation Blocks for Early Learning: Standards for Literacy and Mathematics
Support federal programs: Title I, Head Start, Early Childhood Special Education programs
DOE is responsible for allocating these funds to and coordinating with school divisions for programs targeted towards at-risk four-year-old children

6
Four-Year-Old ProgramsVirginia Preschool Initiative
As an outcome of the legislative work completed in the early 1990’s, the Virginia’s Preschool Initiative (VPI) or more commonly referred to as the At-Risk Four-Year-Olds was approved for funding in FY 1996The program focus is to serve those children who are at-risk of school failure and who do not receive any Head Start servicesVPI program is now designed to meet the criteria and standards in the Foundation Blocks for Early Learning that establish a measurablerange of skills and knowledge needed for at-risk four-year-olds to be successful in kindergarten School divisions are required to use Phonological Awareness Literacy Screening (PALS) - Pre-K test for literacy screening in both the fall and in the spring to assess student learning and readiness for kindergarten

7
Four-Year-Old ProgramsVirginia Preschool Initiative
Participation in program is incentive-based and voluntarySchool divisions must submit an annual plan for their program that includes these service requirements:
Quality preschool educationCurriculum focused on the learning needs of young childrenMaximum class size is 18 studentsQualified staff and develop a plan for staff trainingMinimum of half-day program and a full school yearPlan for home-school communicationAssessment procedures:
Foundation Blocks for Early Learning and PALSComprehensive child health servicesComprehensive social servicesTransportationParental involvement

8
FY 2006 - school divisions receive 100 percent funding for the at-risk four-year-olds in VPI who are not being served by Head Start FY 2007 - funding was increased from $5,400 to $5,700 per eligible student, with costs shared between the state and school divisions based on their composite indexLocalities can use state funding to:
Establish comprehensive preschool programs in public schools or community sitesExpand existing programs to serve more childrenUpgrade existing programs to meet criteria for preschool programs for unserved childrenPurchase preschool programs and services for at-risk four-year-old children from existing providers
Four-Year-Old ProgramsVirginia Preschool Initiative

9
Four-Year-Old ProgramsVirginia Preschool Initiative
Funding formula uses several components to determine the state’s allocation to each school division:
Virginia Employment Commission’s estimate for total number of children 0-5 in each locality – use 20% of total to represent the four-year-oldsPercentage of students in the free lunch program as a proxy for the number of ‘at-risk’ student slotsStudents being served by Head Start servicesComposite Index
Although state uses free-lunch as a proxy to determine the number of student slots for VPI, school divisions use their own definition of at-risk to determine student selection criteria:
Lives in poverty or homelessLimited English proficiencyHealth or developmental problems, low birth weight, substance abuseParent is a school dropout, has limited education, or chronically illFamily is under stress - poverty, unemployment, homelessness, episodes of violence, crime or incarceration

10
History of Appropriations and Actual Expenditures
100%80.4%$50.5 $62.82007 - 2008100%79.7%$49.6 $62.22006 - 2007
Budget Estimates100%82.6%$38.5 $53.22005 – 200690%73.6%$34.9 $47.42004 – 200560%93.8%$18.2 $19.42003 – 200460%93.8%$18.1 $19.32002 – 200360%90.8%$18.7 $20.62001 – 200260%86.0%$18.5 $21.52000 – 200160%100.0%$19.1 $19.11999 – 200060%100.0%$18.9 $18.91998 – 199960%100.0%$16.9 $16.91997 – 1998
60%97.4%$14.8 $15.21996 – 1997
30%77.7%$8.0 $10.31995 – 1996($ in millions)Actual Expenditures
Percent of Students Slots Funded
Percent of Available Funding Spent
Actual Expenditures (based on enrollment)
Appropriation

11
History of Participation Rates in VPI
65.4%65.9%67.9%79.8%79.6%75.2%% of Eligible Students Participating
12,249 11,237 10,318 5,858 5,823 5,966 Actual Number of Students Participating
18,730 17,042 15,185 7,337 7,311 7,938 Estimated Number of Students Eligible
100%100%90%60%60%60%% of Unserved Students Eligible for Funding
18,730 17,042 16,872 12,228 12,185 13,230 Total 4-Yr-Olds Unserved by Head Start
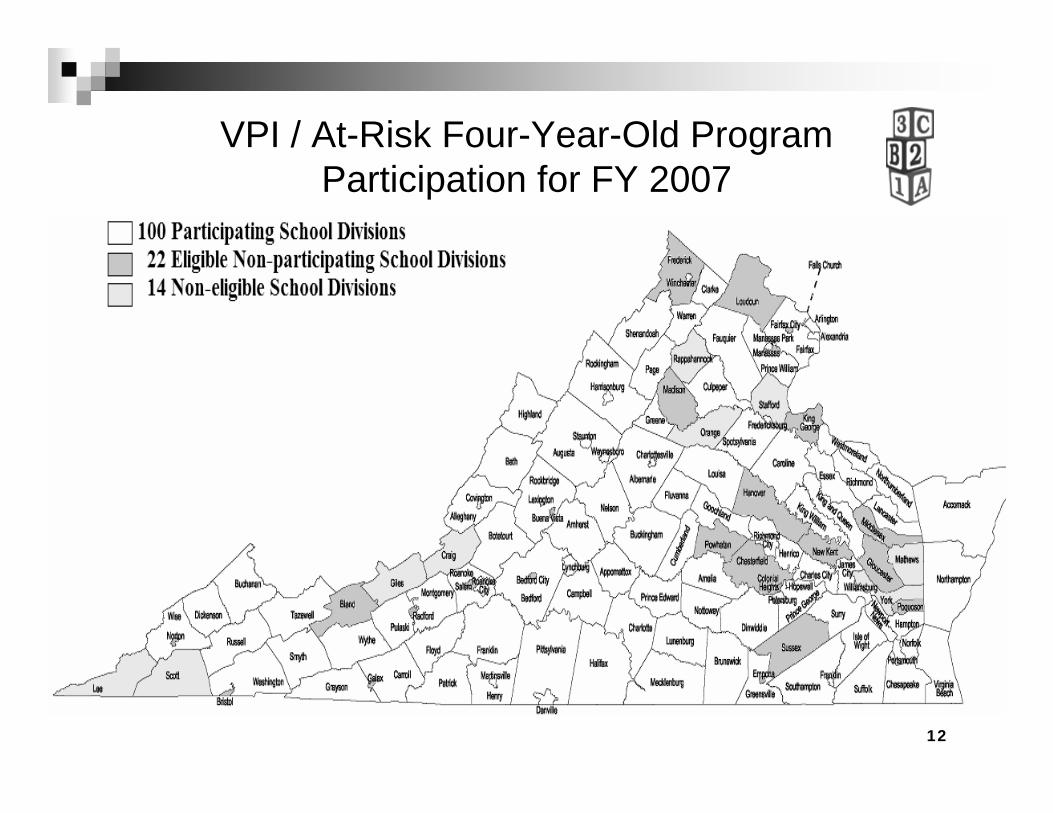
141921393936Localities Not Eligible
222525222225Eligible, but Not Participating
1009290757575Participating Localities
1221171159797100Localities Eligible for Funding
136136136136136136Number of Localities
FY 2007FY 2006FY 2005FY 2004FY 2003FY 2002
12
VPI / At-Risk Four-Year-Old ProgramParticipation for FY 2007

13
Summary of Preschool in Virginia
In total, Virginia’s preschool programs have a student capacity for 37,805 four-year-olds:
Virginia Preschool Initiative – 18,730Head Start – 8,502Special Education – 6,025Title I – 4,548
However, some school divisions have chosen not participate in the program
Shortages of teachers, classroom space, costs
Of the 100 participating divisions, about half do not fully participate, leaving 5,400 slots for students unused
Arlington, Fairfax County, Henrico, Virginia Beach

How Does Virginia Compare to Neighboring SREB States

15
National Status of Pre-K Programs in 2006
40 States with a state-funded Pre-K program10 States do not offer a state-funded Pre-K program: AK, ID, IN, MS, MT, NH, ND, SD, UT, WY
16
Pre-Kindergarten ProgramsWhat are the SREB States Doing?
About half of them established some type of pre-kindergarten initiative after Virginia began it’s program 10 years ago15 out of the 16 SREB states offer a Pre-K program
Mississippi currently does not offer a state program9 states offer a Pre-K program to 100% school divisionsAll of the state programs are full academic school yearHowever, the length of the school day varies:
15 states are evenly divided between providing a full-day, part-day, or local choiceVirginia offers local option to school divisions:
91 have full-day9 have part-day

17
Pre-Kindergarten ProgramsWhat are the SREB States Doing?
Minimum staff qualifications:All require either a state certification, BA, or BS for teachers
VA requires license and certification in Pre-K-3 or Pre-K-6All require in-service training for teachers
Requirements for instructional aides / assistants range from no specific training to a Child Development Associate (CDA) certificate
VA allows locality to determine qualifications

18
Pre-Kindergarten ProgramsWhat are the SREB States Doing?
Typical class sizes range from 18-20 students:12 states have 20 student maximum class size and a staff ratio of 10:1 (teacher and aide)AL, NC and VA have 18 student maximum and a staff ratio of 9:1 (teacher and aide)TX has 22 student maximum and a staff ratio of 22:1 (teacher)
Pre-K programs also provide children enrolled with various kinds of non-educational ‘wrap-around’ services for vision, hearing, health, immunization, developmental and behavior screenings
Majority of states, including VA, offer 5 or more
19
Pre-Kindergarten ProgramsWhat are the SREB States Doing?
FY 2005 per student state funding for Pre-K programs ranged from $721 up to $5,816 per child enrolled
VA ranked in the middle at $3,420 (state share only) for a reported count of 10,318 enrolled preschoolers
Total K-12 spending from all fund sources also has a wide range from $6,808 up to $12,386 per student
VA is the fourth highest state - $10,209

Student Achievement and Assessments
21
Standards of Learning (SOL)English Reading Test
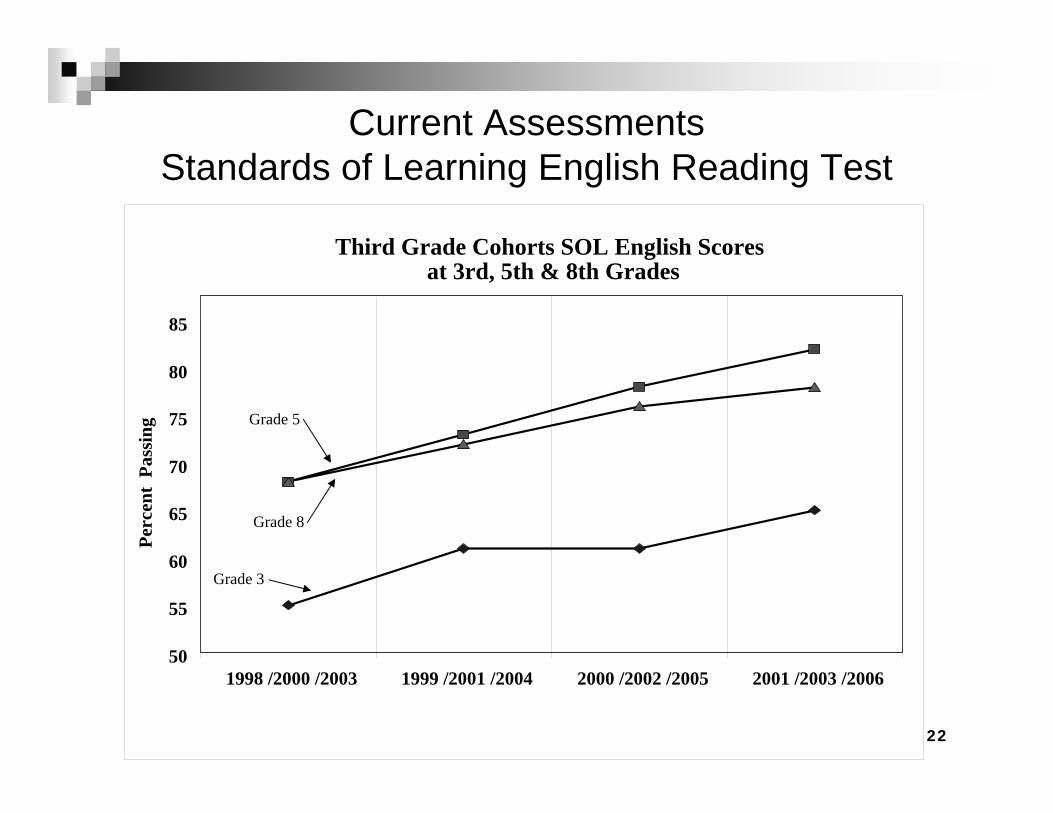
Currently, we don’t have any longitudinal data on success of children from preschool to the first benchmark of the SOLHowever, it’s clear that student achievement by the third grade is improvingThe passing score for this past spring’s 3rd grade English reading exam increased from 77% to 84% over last year’s
In turn, students needing remediation decreased from 20,400 in 2005 to 14,000 this past spring
Third grade English reading SOL exam is considered an accurate predicator of a student’s future success If growth in the success rate continues, we can expect to see a pass rate around 90% next spring
Leaving the number of children needing additional help under 9,000 statewide
22
Third Grade Cohorts SOL English Scoresat 3rd, 5th & 8th Grades
50
55
60
65
70
75
80
85
1998 /2000 /2003 1999 /2001 /2004 2000 /2002 /2005 2001 /2003 /2006
Perc
ent
Pass
ing
Current Assessments Standards of Learning English Reading Test
Grade 3
Grade 5
Grade 8

23
Current AssessmentsStandards of Learning English Reading Test
-----14,053 73,781 84 87,834 2005-2006
-----20,299 67,956 77 88,255 2004-2005
11,749 78,630 87 90,379 2005-200625,769 63,088 71 88,857 2003-2004
13,703 77,653 85 91,356 2004-200525,118 64,589 72 89,707 2002-2003
13,779 78,079 85 91,858 2003-200425,334 65,146 72 90,480 2001-2002
16,630 75,758 82 92,388 2002-200331,926 59,291 65 91,217 2000-2001
20,392 72,301 78 92,693 2001-200235,293 55,201 61 90,494 1999-2000
24,921 67,379 73 92,300 2000-200135,044 54,813 61 89,857 1998-1999
28,139 59,794 68 87,933 1999-200039,328 48,068 55 87,396 1997-1998
# Fail# PassSOL % Pass
Sept 30th Membership
School Year# Fail# Pass
SOL % Pass
Sept 30th MembershipSchool Year
5th Graders (Same 3rd grade Cohort - 2 years later)3rd Graders

Summary & Conclusions

25
Summary & ConclusionsVirginia has a number of programs to assist at-risk preschool children in obtaining early learning opportunities which prepare them forkindergarten
Day care assistance for low-income working familiesQuality programs to enhance day care with early learning opportunitiesPreschool programs focused on school readiness and early learning concepts
Most of the research demonstrates greater value in focusing state and federal preschool programs and services on at-risk low-income children who lag behind peers when beginning schoolBased on this year’s participation rates for school divisions in the VPI program, approximately one third of the VPI seats went unfilled
Several school divisions do not participate, and several school division are not currently using all of their student slots
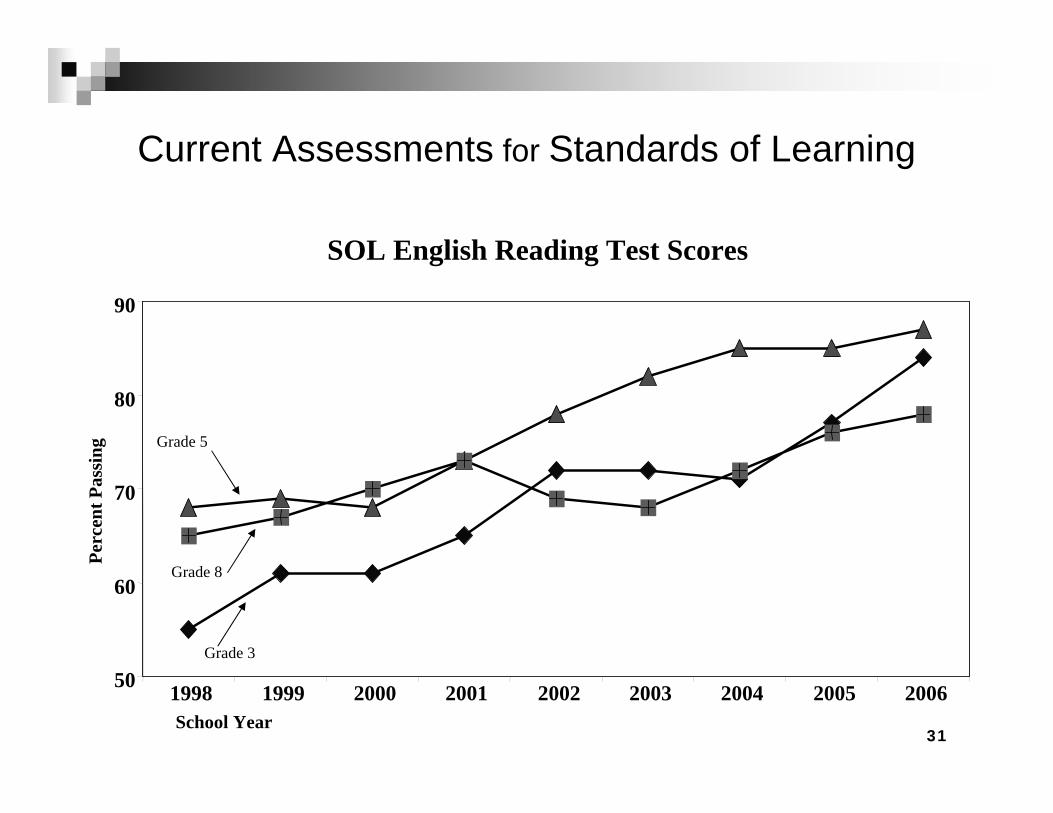
The SOL test cohorts since 1998 have consistently shown improvements over time, which would indicate that the current curriculum and programs are effective in promoting student success
Virginia does not track at-risk students’ progress and how they specific or individually score on the SOL tests

Appendix ASchool Divisions’ Participation
by Program

27
Head Start Programs in School Divisions for FY 2007
28
Title I School Divisions with Pre-Kindergarten Enrollment for FY 2007

29
Title I, Part B, Subpart 1 - Reading First Grants for FY 2007

Appendix B Test Results for
SOL English Reading, PALS& Head Start NRS
31
Current Assessments for Standards of Learning
SOL English Reading Test Scores
50
60
70
80
90
1998 1999 2000 2001 2002 2003 2004 2005 2006School Year
Perc
ent P
assi
ng
Grade 3
Grade 5
Grade 8

32
VPI Students Screened with PALS-Pre-K Fall and Spring: 2005-2006
10%90%59%41%6,815Nursery Rhyme Awareness (10)
15%85%59%41%6,781Rhyme (10)
17%83%68%32%6,807Print and Word Awareness (10)
12%88%53%47%6,745Beginning sound awareness (10)
14%86%67%33%6,800Alphabet recognition (26)
8%92%58%42%6,852Name writing (7)
Students Assessed Below
"Passing" Benchmark
Students Assessed Above
"Passing" Benchmark
Students Assessed Below
"Passing" Benchmark
Students Assessed Above
"Passing" Benchmark
Spring 2006Fall 2005
Total # of Students Assessed
PALS-Pre-K Task (maximum score)

33
Kindergarten Students Screened with PALS-K Fall and Spring: 2005-2006
14%86%82,61318%82%81,414TOTAL
14%86%72,65518%82%71,321Pre-K Status Unknown
16%84%40918%82%409YMCA
13%87%87211%89%884VPI and Title I
13%87%4,78213%87%4,853VPI
14%86%1,50911%89%1,528Title I
13%87%1,00511%89%1,023Other
18%82%1,36119%81%1,376Head Start
20%80%2020%80%20Even Start
Percent of Student Assessed
Below "Passing"
Percent of Student Assessed ABOVE
"Passing"
Total # of Students Assessed
Percent of Student Assessed BELOW
"Passing"
Percent of Student Assessed ABOVE
"Passing"
Total # of Students Assessed
Spring 2006Fall 2005
Pre-K Programs Students Attended Prior
to Kindergarten
34
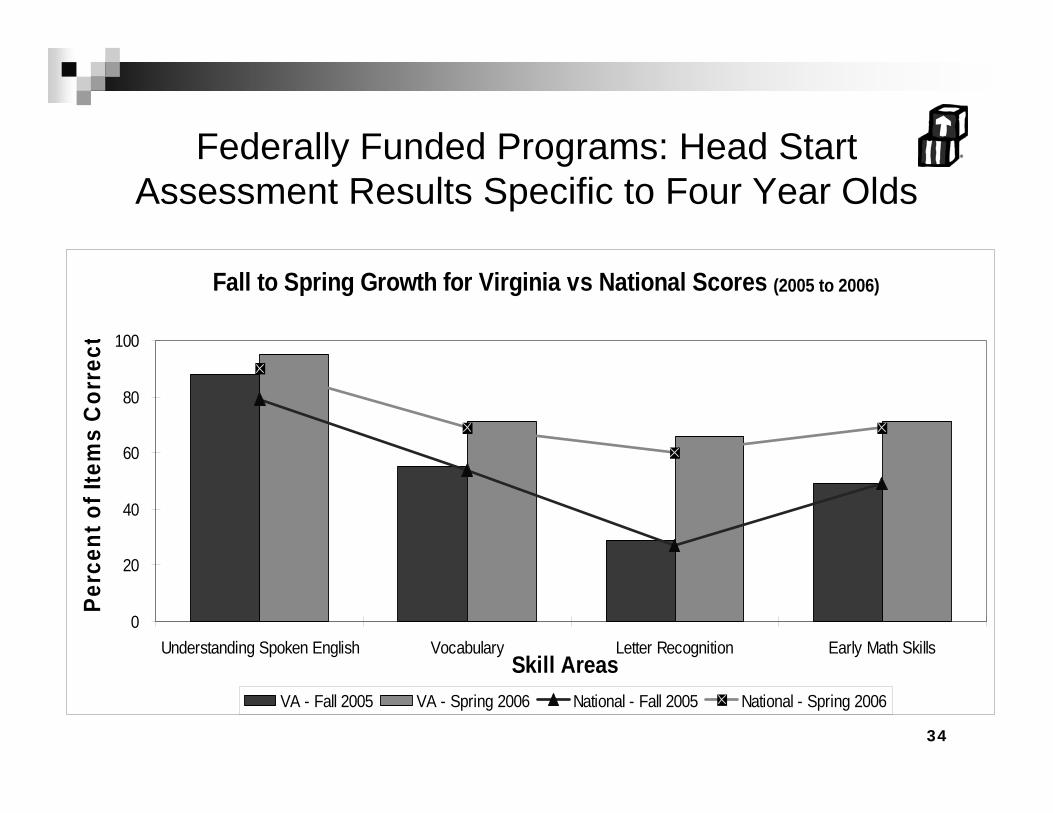
Federally Funded Programs: Head StartAssessment Results Specific to Four Year Olds
Fall to Spring Growth for Virginia vs National Scores (2005 to 2006)
0
20
40
60
80
100
Understanding Spoken English Vocabulary Letter Recognition Early Math SkillsSkill Areas
Perc
ent o
f Ite
ms
Cor
rect
VA - Fall 2005 VA - Spring 2006 National - Fall 2005 National - Spring 2006
35
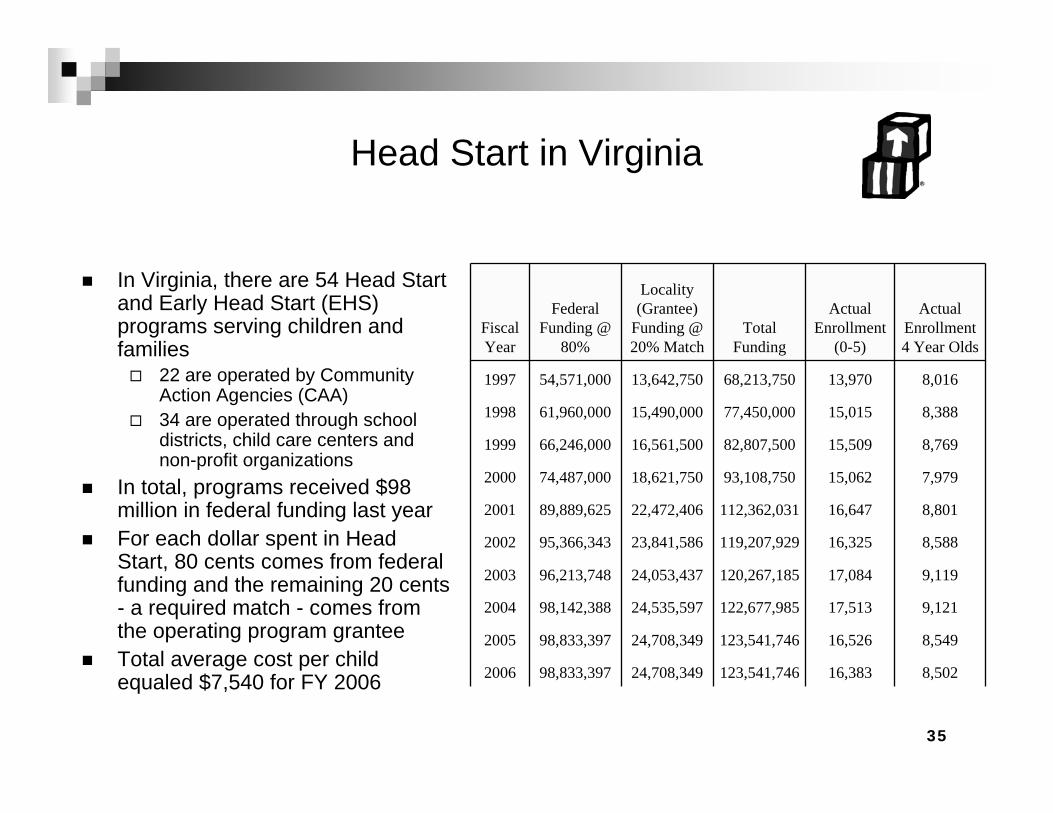
Head Start in Virginia
In Virginia, there are 54 Head Start and Early Head Start (EHS) programs serving children and families
22 are operated by Community Action Agencies (CAA)34 are operated through school districts, child care centers and non-profit organizations
In total, programs received $98 million in federal funding last year For each dollar spent in Head Start, 80 cents comes from federal funding and the remaining 20 cents - a required match - comes from the operating program granteeTotal average cost per child equaled $7,540 for FY 2006 8,50216,383123,541,746 24,708,349 98,833,397 2006
8,54916,526123,541,746 24,708,349 98,833,397 2005
9,12117,513122,677,985 24,535,597 98,142,388 2004
9,11917,084120,267,185 24,053,437 96,213,748 2003
8,58816,325119,207,929 23,841,586 95,366,343 2002
8,80116,647112,362,031 22,472,406 89,889,625 2001
7,97915,06293,108,750 18,621,750 74,487,000 2000
8,76915,50982,807,500 16,561,500 66,246,000 1999
8,38815,01577,450,000 15,490,000 61,960,000 1998
8,01613,97068,213,750 13,642,750 54,571,000 1997
Actual Enrollment 4 Year Olds
Actual Enrollment
(0-5)Total
Funding
Locality (Grantee)
Funding @ 20% Match
Federal Funding @
80%Fiscal Year
Recommended