Vivian HuntSara PrinceSundiatu Dixon-FyleLareina Yee
January 2018
Delivering through Diversity
ContentsExecutive summary 1
Introduction 4
Diversity and financial performance in 2017 8
Diversity around the world 20
Delivering impact through I&D 26
Conclusion 32
About the authors 33
Methodology 35
Executive summary
1 Delivering through Diversity Executive summary
Since Why Diversity Matters was published in 2015, we have seen growing awareness of the business case for inclusion and diversity (I&D). Widely cited, the report has influenced I&D policy-setting and transformation efforts by corporations, the public sector, and third-sector organizations worldwide. While social justice, legal compliance, or maintaining industry-standard employee environment protocols is typically the initial impetus behind these efforts, many successful companies regard I&D as a source of competitive advantage, and specifically as a key enabler of growth.
Yet progress has been slow. The 346 companies in our 2015 research (mostly based in the US and UK) have increased average gender representation on their executive teams only 2 percentage points, to 14%, and ethnic and cultural diversity by 1 percentage point, to 13%. What’s more, many companies are still uncertain as to how they can most effectively use I&D to support their growth and value creation goals.
Delivering through Diversity both tackles the business case and provides a perspective on how to take action on I&D to impact growth and business performance. This latest research reaffirms the global relevance of the correlation between diversity (defined here as a greater proportion of women and ethnically/culturally diverse individuals) in the leadership of large companies and financial outperformance. The research is based on a larger data set of over 1,000 companies covering 12 countries and using two measures of financial performance – profitability (measured as average EBIT margin) and value creation (measured as economic profit margin). As importantly, we studied the I&D efforts of 17 companies representing all major regions and multiple industries to have a more granular view of where in the organization diversity matters most, and crucially, how leading companies have successfully harnessed the potential of I&D to help meet their growth objectives.
Re-examining the business case for I&D, we found:
� The relationship between diversity and business performance persists. The statistically significant correlation between a more diverse leadership team and financial outperformance demonstrated three years ago continues to hold true on an updated, enlarged, and global data set.
� Leadership roles matter. Companies in the top-quartile for gender diversity on executive teams were 21% more likely to outperform on profitability and 27% more likely to have superior value creation. The highest-performing companies on both profitability and diversity had more women in line (i.e., typically revenue-generating) roles than in staff roles on their executive teams.
� It’s not just gender. Companies in the top-quartile for ethnic/cultural diversity on executive teams were 33% more likely to have industry-leading profitability. That this relationship continues to be strong suggests that inclusion of highly diverse individuals – and the myriad ways in which diversity exists beyond gender (e.g., LGBTQ+, age/generation, international experience) – can be a key differentiator among companies.
� There is a penalty for opting out. The penalty for bottom-quartile performance on diversity persists. Overall, companies in the bottom quartile for both gender and ethnic/cultural diversity were 29% less likely to achieve above-average profitability than were all other companies in our data set. In short, not only were they not leading, they were lagging.
2Delivering through Diversity Executive summary
� Local context matters. On gender, while there is plenty more to do, some companies lead the way in both absolute average diversity and representation in top-quartile – Australia, UK, and US companies make up over 70% of this group. On ethnicity, there is less global progress, but South African and Singaporean companies have a higher representation in the top-quartile versus overall representation in data set, suggesting material progress on ethnic diversity.
Lessons learned from the 17 leading companies we studied – among those that are engaging effectively with I&D – support our earlier perspective on what likely drives the relationship with performance: that more diverse companies are better able to attract top talent; to improve their customer orientation, employee satisfaction, and decision making; and to secure their license to operate. While progress has been slow on average, individual companies have made real strides in improving their I&D outcomes and in effectively using these results to influence business outcomes. From their experiences, we identified four imperatives for delivering impact through I&D:
� Commit and cascade. CEOs and leaders must articulate a compelling vision, embedded with real accountability for delivery, and cascade down through middle management.
� Link I&D to growth strategy. The I&D priorities must be explicitly defined based on what will drive the business growth strategy. Leading companies do this in a data-driven way.
� Craft an initiative portfolio. Initiatives in pursuit of the I&D goals should be targeted based on growth priorities, and investments made to both hard- and soft-wire the programs and culture of inclusion required to capture the intended benefits.
� Tailor for impact. I&D initiatives should be tailored to the relevant business area or geographic region context to maximize local buy-in and impact.
This work sheds light on how companies can use diversity as an enabler of business impact. It articulates a clear opportunity for companies to promote I&D in senior decision-making roles, and specifically in line roles on executive teams. As was the case with Why Diversity Matters, correlation does not demonstrate causation. However, the statistically significant relationship observed between greater levels of diversity in the leadership of a large corporate organization and financial performance does prompt action. We encourage companies to examine the case for I&D and how it is directly relevant to their business, as leading companies are already doing.
Designing a truly effective I&D strategy is no small undertaking. But we and the many companies we studied believe the potential benefits of stronger business performance are well worth the effort.

Delivering through diversity Section Heading33
4Delivering through Diversity Introduction 4
Many successful companies regard I&D as a source of competitive advantage. For some, it’s a matter of social justice, corporate social responsibility, or even regulatory compliance. For others, it’s essential to their growth strategy.
It makes sense that a diverse and inclusive employee base – with a range of approaches and perspectives – would be more competitive in a globalized economy. A small but increasing number of companies have recognized an opportunity to go even further, reframing I&D as an enabler of two of the foremost goals for CEOs: growth and value creation.1,2
Yet progress is slow. Many companies struggle to materially increase representation levels of diverse talent, gain an understanding of where in their organizations diversity matters most, and create truly inclusive organizational cultures to reap the benefits of diversity. The tangible impact these efforts have on organizational effectiveness, but also on business performance, remains elusive. For many global CEOs, the extent to which taking action on I&D can contribute to their path to growth remains unclear.
Why Diversity Matters research established a statistically significant correlation – without claiming a causal relationship – between greater levels of diversity in company leadership and a greater likelihood of outperforming the relevant industry peer group on a key financial performance measure, profitability. Why Diversity Matters was our firm’s most downloaded publication on diversity in 2016, demonstrating an increasing interest in the business case for diversity. Widely cited, the report has influenced I&D policy-setting and transformation efforts by corporations, the public sector, and third-sector organizations worldwide. Other reports, including our Women Matter series as well as research conducted by other organizations, have made similar findings. Corporate leaders we speak to appreciate the business argument for I&D. However, most wonder how to make I&D work for their firms and, more specifically, the extent to which this can support their growth and value creation goals.
Corporate leaders increasingly accept the business imperative for I&D, and most wonder how to make it work for their firms and support their growth and value creation goals.
1 Gartner 2017 CEO survey.
2 For more on how companies can design effective growth strategies, see Chris Bradley, Martin Hirt, and Sven Smit, “Have you tested your strategy lately?” McKinsey Quarterly, January 2011. For a discussion of value creation, see Chris Bradley, Angus Dawson, and Sven Smit, “The strategic yardstick you can’t afford to ignore,” McKinsey Quarterly, October 2013.
Introduction
5 Delivering through Diversity Introduction
To shape answers to this, we built on our 2015 research to expand our data set to more regions globally and examine an additional financial performance measure. We explore not only whether and where in the organization diversity matters, but also how companies can put it to work in pursuit of their business goals. Our latest research improves our understanding of the correlation between diversity and company financial performance, and of the actions companies can take to develop a robust I&D strategy, in five ways:
� Expanded, updated data set. We nearly tripled the number of countries and companies researched to 12 countries and more than 1,000 companies globally.
� Exploring diversity at different levels of the organization. We correlated financial performance with the diversity of a company’s total workforce, executive team, and board of directors, and within executive teams, we contrasted diverse representation in line versus staff roles.
� Additional lens on financial performance. We measured profitability, using EBIT margin, and longer-term value creation, using economic profit margin.3
� Broader, more holistic understanding of diversity. We considered through qualitative research how both inherent (e.g., gender, ethnicity and, where possible, sexual orientation) and acquired (e.g., international work experience, education and training, socioeconomic background) forms of diversity relate to financial performance.4
� Insight into company best practices. We developed in-depth profiles of 17 leading companies, articulating how they use diversity and inclusion to create value in their specific industry and geographic contexts.
This research extends and deepens the quantitative correlation analysis approach taken by Why Diversity Matters, and complements it with qualitative company research, with the practical aim of sharing insights from the experiences of companies effectively engaging with I&D. The same caveats apply to the correlation analyses reported here as did in Why Diversity Matters: correlation is not causation. While not causal, we observe a real relationship between diversity and performance that has persisted over time and across geographies. There are clear and compelling hypotheses for why this relationship persists, including improved access to talent, enhanced decision making and depth of consumer insight, and strengthened employee engagement and license to operate. We encourage businesses to examine the case for I&D at a more granular level to craft an approach that is tailored to their business, learning from leading diverse companies around the world as to ways to do this with high impact.
3 Net Operating Profit Less Adjusted Taxes – (Invested Capital x Weighted Average Cost of Capital). Previous releases of our preliminary findings used absolute economic profit as the proxy for value creation. Please see the Methodology appendix for further details.
4 Sylvia Ann Hewlett, Melinda Marshall, and Laura Sherbin, “How Diversity Can Drive Innovation,” Harvard Business Review, December 2013.
Our latest research improves our understanding of the correlation between diversity and company financial performance and of the actions companies can take to develop a robust I&D strategy.

It makes sense that a diverse and inclusive employee base – with a range of approaches and perspectives – would be more competitive in a globalized economy.
6

Delivering through diversity Section Heading7
8Delivering through Diversity Diversity and financial performance in 2017
Diversity and financial performance in 2017
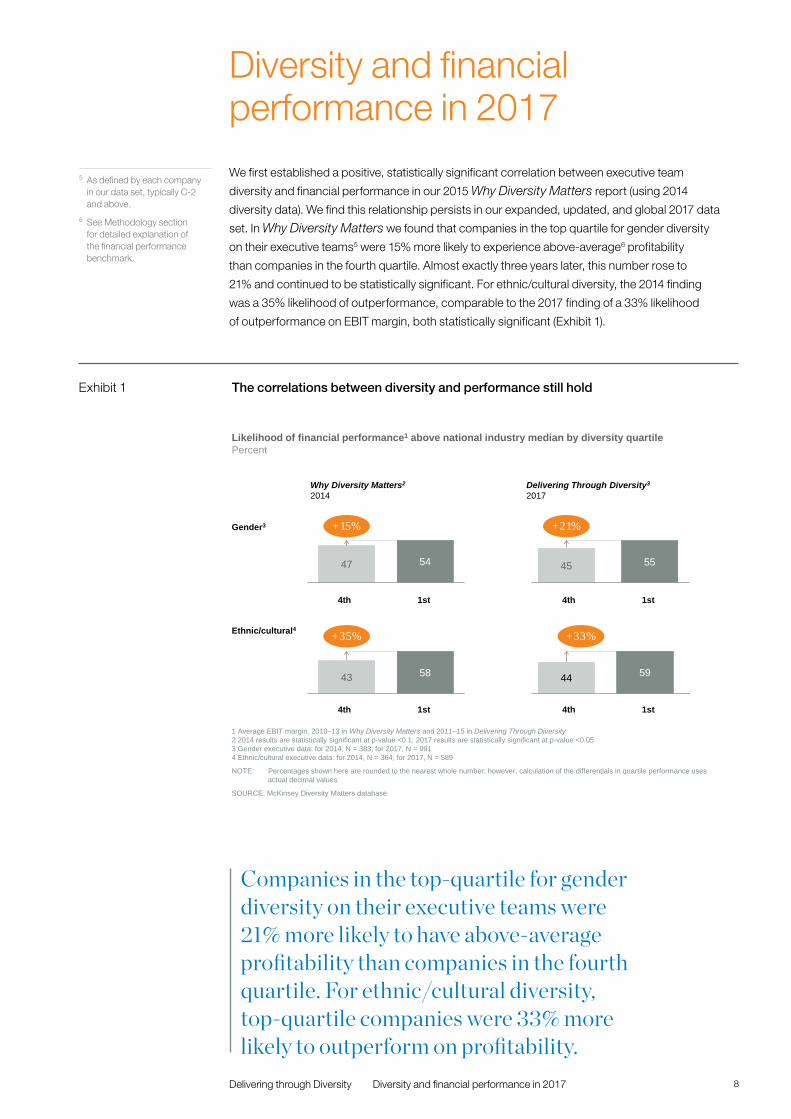
We first established a positive, statistically significant correlation between executive team
diversity and financial performance in our 2015 Why Diversity Matters report (using 2014
diversity data). We find this relationship persists in our expanded, updated, and global 2017 data
set. In Why Diversity Matters we found that companies in the top quartile for gender diversity
on their executive teams5 were 15% more likely to experience above-average6 profitability
than companies in the fourth quartile. Almost exactly three years later, this number rose to
21% and continued to be statistically significant. For ethnic/cultural diversity, the 2014 finding
was a 35% likelihood of outperformance, comparable to the 2017 finding of a 33% likelihood
of outperformance on EBIT margin, both statistically significant (Exhibit 1).
5 As defined by each company in our data set, typically C-2 and above.
6 See Methodology section for detailed explanation of the financial performance benchmark.
1 Average EBIT margin, 2010–13 in Why Diversity Matters and 2011–15 in Delivering Through Diversity 2 2014 results are statistically significant at p-value <0.1; 2017 results are statistically significant at p-value <0.053 Gender executive data: for 2014, N = 383; for 2017, N = 9914 Ethnic/cultural executive data: for 2014, N = 364; for 2017, N = 589
SOURCE: McKinsey Diversity Matters database
Why Diversity Matters2
2014
Likelihood of financial performance1 above national industry median by diversity quartilePercent
Delivering Through Diversity3
2017
Gender3
Ethnic/cultural4
+21%
5545
+15%
47 54
+35%
5843
+33%
5944
4th 1st
4th 1st
4th 1st
4th 1st
NOTE: Percentages shown here are rounded to the nearest whole number; however, calculation of the differentials in quartile performance uses actual decimal values
The correlations between diversity and performance still holdExhibit 1
Companies in the top-quartile for gender diversity on their executive teams were 21% more likely to have above-average profitability than companies in the fourth quartile. For ethnic/cultural diversity, top-quartile companies were 33% more likely to outperform on profitability.
Delivery example
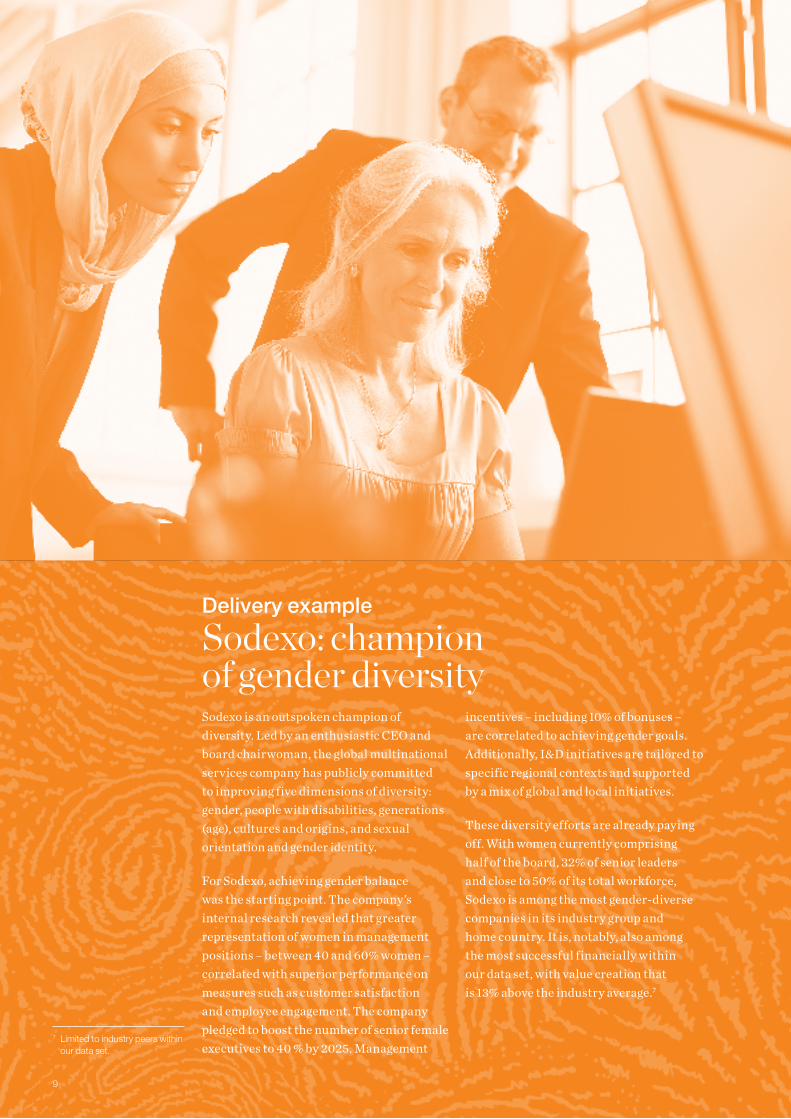
Sodexo: champion of gender diversitySodexo is an outspoken champion of diversity. Led by an enthusiastic CEO and board chairwoman, the global multinational services company has publicly committed to improving five dimensions of diversity: gender, people with disabilities, generations (age), cultures and origins, and sexual orientation and gender identity.
For Sodexo, achieving gender balance was the starting point. The company’s internal research revealed that greater representation of women in management positions – between 40 and 60% women – correlated with superior performance on measures such as customer satisfaction and employee engagement. The company pledged to boost the number of senior female executives to 40 % by 2025. Management
incentives – including 10% of bonuses – are correlated to achieving gender goals. Additionally, I&D initiatives are tailored to specific regional contexts and supported by a mix of global and local initiatives.
These diversity efforts are already paying off. With women currently comprising half of the board, 32% of senior leaders and close to 50% of its total workforce, Sodexo is among the most gender-diverse companies in its industry group and home country. It is, notably, also among the most successful financially within our data set, with value creation that is 13% above the industry average.7
7 Limited to industry peers within our data set.
© S
OD
EX
O
9
10Delivering through Diversity Diversity and financial performance in 2017
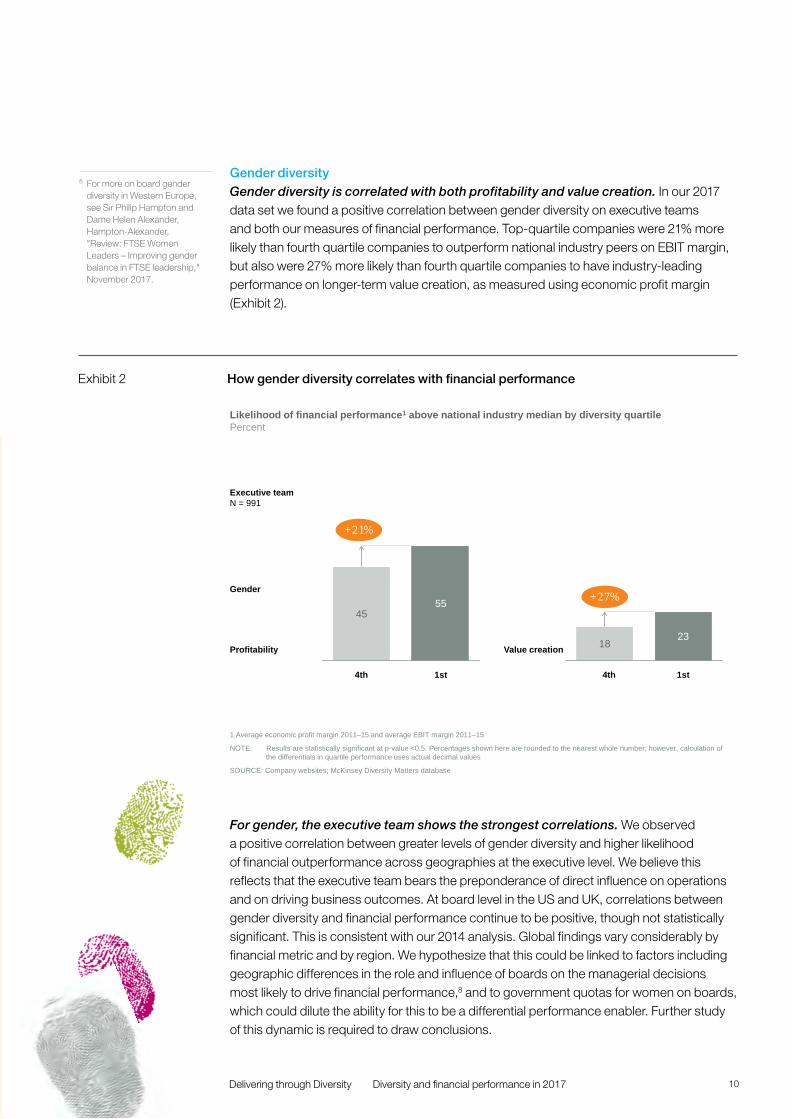
1 Average economic profit margin 2011–15 and average EBIT margin 2011–15
SOURCE: Company websites; McKinsey Diversity Matters database
Likelihood of financial performance1 above national industry median by diversity quartilePercent
NOTE: Results are statistically significant at p-value <0.5. Percentages shown here are rounded to the nearest whole number; however, calculation of the differentials in quartile performance uses actual decimal values
+21%
5545
+27%
2318Profitability Value creation
4th 1st 4th 1st
Gender
Executive teamN = 991
How gender diversity correlates with financial performanceExhibit 2
For gender, the executive team shows the strongest correlations. We observed a positive correlation between greater levels of gender diversity and higher likelihood of financial outperformance across geographies at the executive level. We believe this reflects that the executive team bears the preponderance of direct influence on operations and on driving business outcomes. At board level in the US and UK, correlations between gender diversity and financial performance continue to be positive, though not statistically significant. This is consistent with our 2014 analysis. Global findings vary considerably by financial metric and by region. We hypothesize that this could be linked to factors including geographic differences in the role and influence of boards on the managerial decisions most likely to drive financial performance,8 and to government quotas for women on boards, which could dilute the ability for this to be a differential performance enabler. Further study of this dynamic is required to draw conclusions.
Gender diversity Gender diversity is correlated with both profitability and value creation. In our 2017 data set we found a positive correlation between gender diversity on executive teams and both our measures of financial performance. Top-quartile companies were 21% more likely than fourth quartile companies to outperform national industry peers on EBIT margin, but also were 27% more likely than fourth quartile companies to have industry-leading performance on longer-term value creation, as measured using economic profit margin (Exhibit 2).
8 For more on board gender diversity in Western Europe, see Sir Philip Hampton and Dame Helen Alexander, Hampton-Alexander, "Review: FTSE Women Leaders – Improving gender balance in FTSE leadership," November 2017.
11 Delivering through Diversity Diversity and financial performance in 2017
SOURCE: Company websites; McKinsey Analytics; McKinsey Diversity Matters database
NOTE: EBIT margin used for the calculation of above-median financial performance
Gender diversity quartile
Women’s share of executive teams by role type (line or staff)Percent of total executives
3rd
2nd
1st
4th
All 14
20
11
8
2
10
6
4
1
7
More women executives in staff vs.
line roles
33% 67%
Share of women in line vs. staff roles on
executive teams
7% 14%
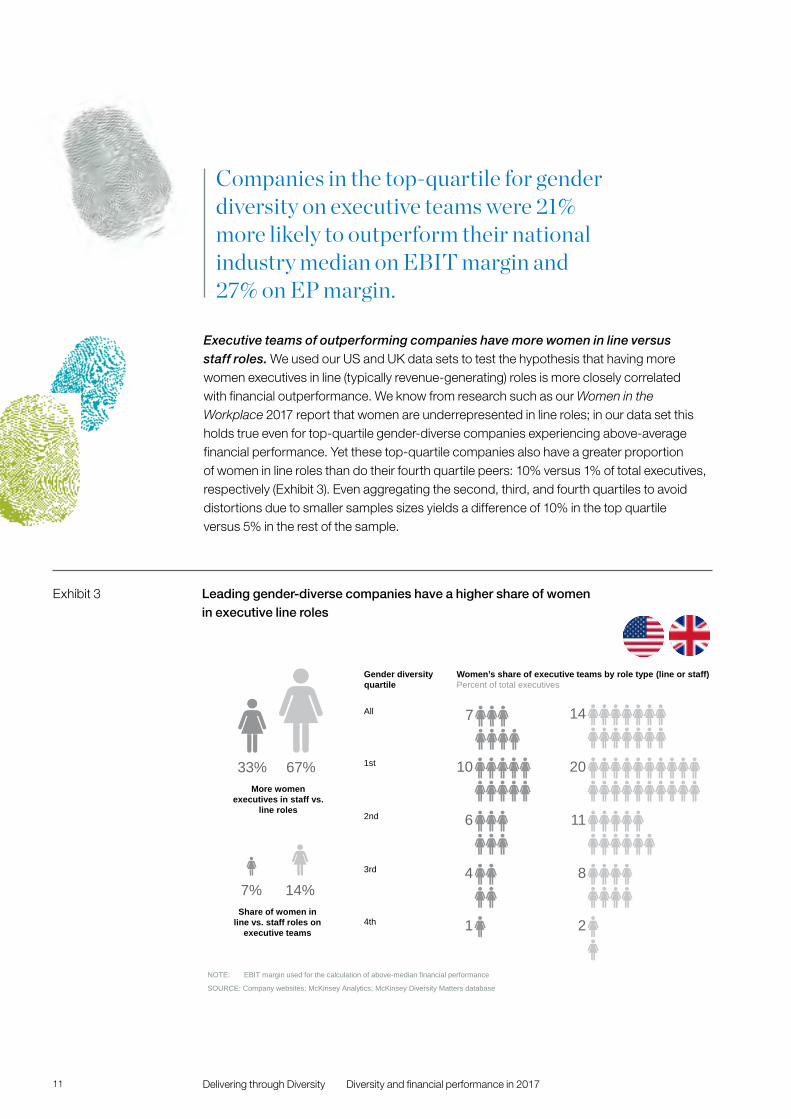
Leading gender-diverse companies have a higher share of women in executive line roles
Exhibit 3
Executive teams of outperforming companies have more women in line versus staff roles. We used our US and UK data sets to test the hypothesis that having more women executives in line (typically revenue-generating) roles is more closely correlated with financial outperformance. We know from research such as our Women in the Workplace 2017 report that women are underrepresented in line roles; in our data set this holds true even for top-quartile gender-diverse companies experiencing above-average financial performance. Yet these top-quartile companies also have a greater proportion of women in line roles than do their fourth quartile peers: 10% versus 1% of total executives, respectively (Exhibit 3). Even aggregating the second, third, and fourth quartiles to avoid distortions due to smaller samples sizes yields a difference of 10% in the top quartile versus 5% in the rest of the sample.
Companies in the top-quartile for gender diversity on executive teams were 21% more likely to outperform their national industry median on EBIT margin and 27% on EP margin.
9 Brazil, Mexico, Singapore, South Africa, United Kingdom, and the United States.
10 As in our first report, we measure ethnic diversity using the normalized Herfindahl-Hirschman Index (NHHI). See Methodology appendix for details.
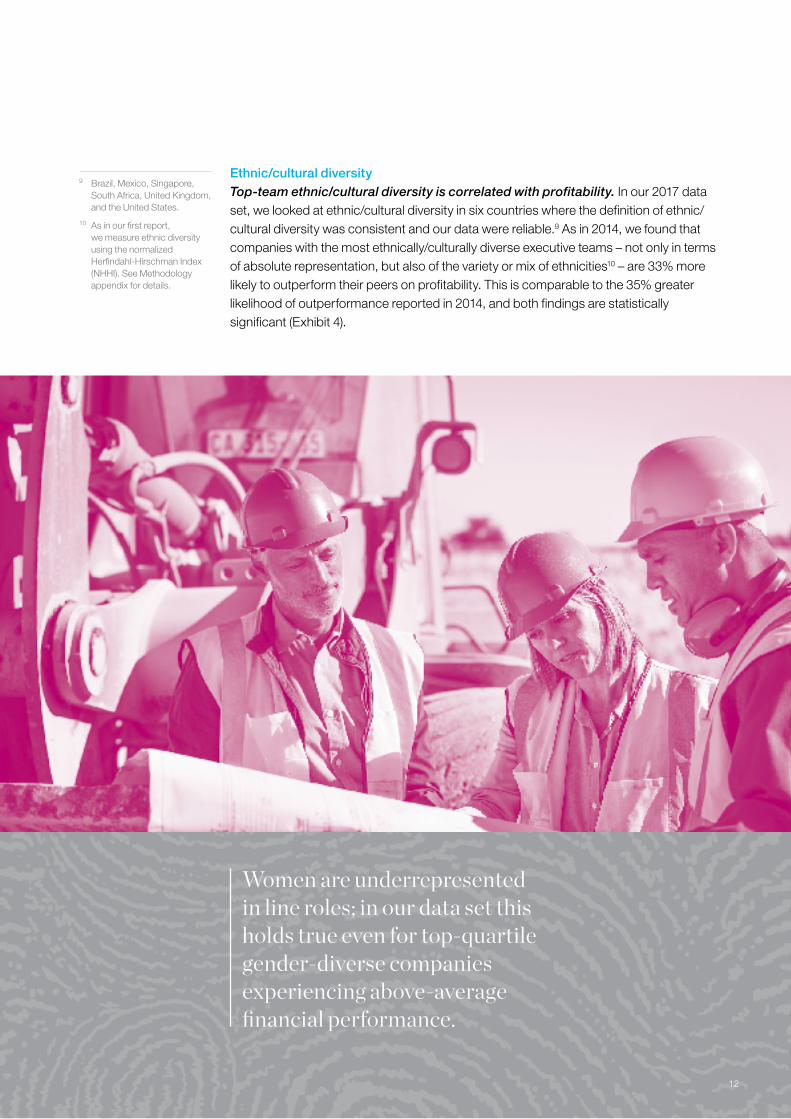
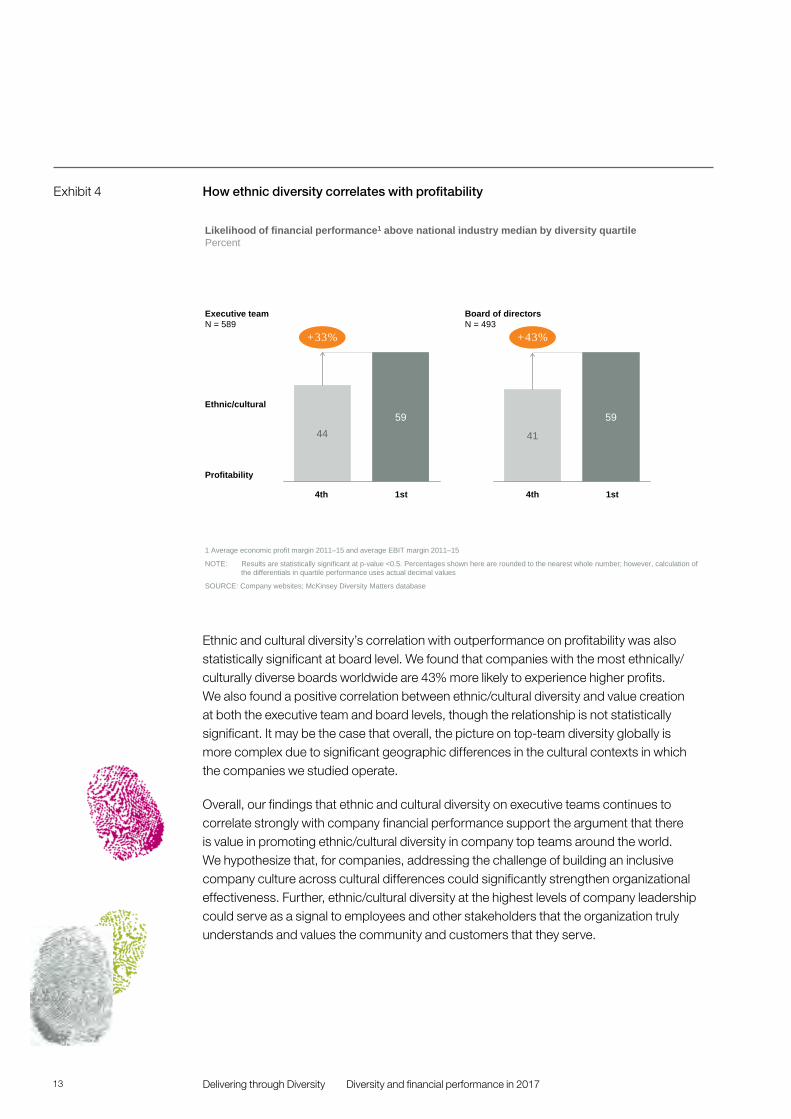
Ethnic/cultural diversity Top-team ethnic/cultural diversity is correlated with profitability. In our 2017 data set, we looked at ethnic/cultural diversity in six countries where the definition of ethnic/cultural diversity was consistent and our data were reliable.9 As in 2014, we found that companies with the most ethnically/culturally diverse executive teams – not only in terms of absolute representation, but also of the variety or mix of ethnicities10 – are 33% more likely to outperform their peers on profitability. This is comparable to the 35% greater likelihood of outperformance reported in 2014, and both findings are statistically significant (Exhibit 4).
Women are underrepresented in line roles; in our data set this holds true even for top-quartile gender-diverse companies experiencing above-average financial performance.
12
13 Delivering through Diversity Diversity and financial performance in 2017
SOURCE: Company websites; McKinsey Diversity Matters database
Executive teamN = 589
Likelihood of financial performance1 above national industry median by diversity quartilePercent
Board of directorsN = 493
1 Average economic profit margin 2011–15 and average EBIT margin 2011–15
NOTE: Results are statistically significant at p-value <0.5. Percentages shown here are rounded to the nearest whole number; however, calculation of the differentials in quartile performance uses actual decimal values
+33%
5944
+43%
59
41
4th 4th 1st 1st
Profitability
Ethnic/cultural
How ethnic diversity correlates with profitabilityExhibit 4
Ethnic and cultural diversity’s correlation with outperformance on profitability was also statistically significant at board level. We found that companies with the most ethnically/culturally diverse boards worldwide are 43% more likely to experience higher profits. We also found a positive correlation between ethnic/cultural diversity and value creation at both the executive team and board levels, though the relationship is not statistically significant. It may be the case that overall, the picture on top-team diversity globally is more complex due to significant geographic differences in the cultural contexts in which the companies we studied operate.
Overall, our findings that ethnic and cultural diversity on executive teams continues to correlate strongly with company financial performance support the argument that there is value in promoting ethnic/cultural diversity in company top teams around the world. We hypothesize that, for companies, addressing the challenge of building an inclusive company culture across cultural differences could significantly strengthen organizational effectiveness. Further, ethnic/cultural diversity at the highest levels of company leadership could serve as a signal to employees and other stakeholders that the organization truly understands and values the community and customers that they serve.
14Delivering through Diversity Diversity and financial performance in 2017
Profitability
1 Average economic profit margin 2011–15 and average EBIT margin 2011–152 Executive gender diversity analyzed for 991 companies in all regions. For 589 companies with gender and ethnic/cultural diversity data, in all
regions except Australia, France, Germany, India, Japan, and Nigeria
SOURCE: Company websites; McKinsey Diversity Matters database
Likelihood of financial performance1 above national industry median by diversity quartilePercent
-29%
Bottom on both vs. rest
57
40
4th 1st–3rd
Gender and ethnic/cultural2
Executive teamN = 589
NOTE: Percentages shown here are rounded to the nearest whole number; however, calculation of the differentials in quartile performance uses actual decimal values
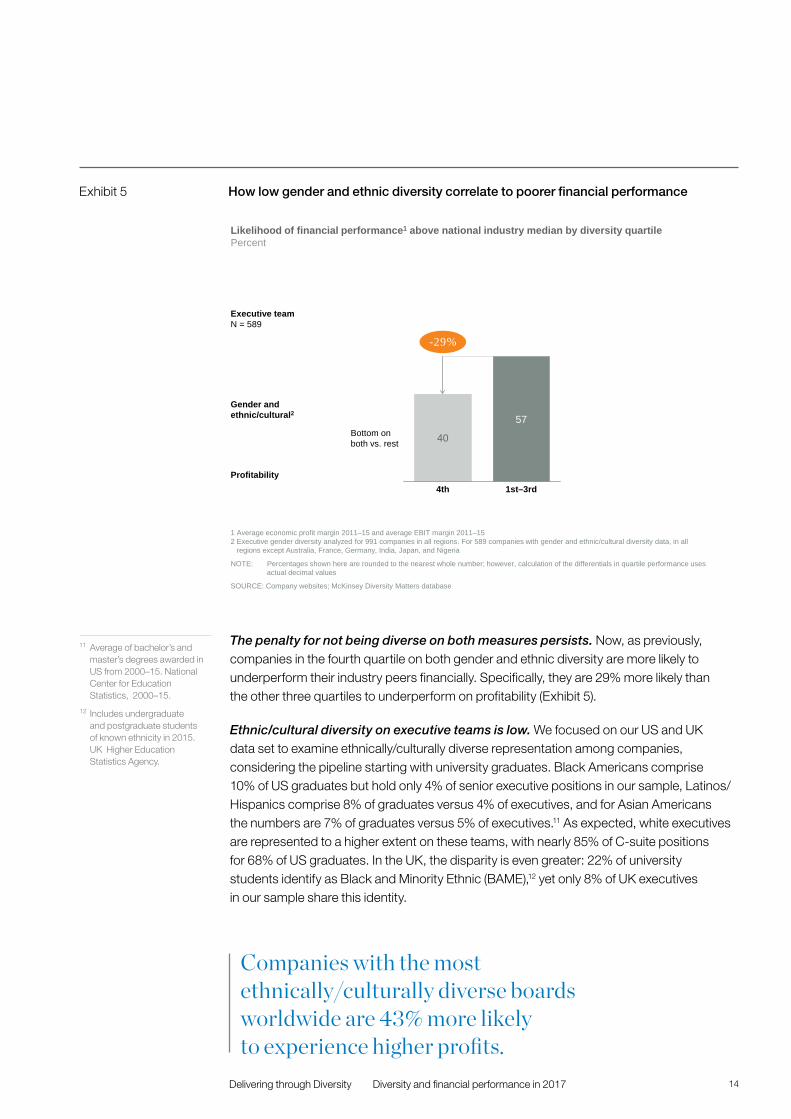
How low gender and ethnic diversity correlate to poorer financial performanceExhibit 5
The penalty for not being diverse on both measures persists. Now, as previously, companies in the fourth quartile on both gender and ethnic diversity are more likely to underperform their industry peers financially. Specifically, they are 29% more likely than the other three quartiles to underperform on profitability (Exhibit 5).
Ethnic/cultural diversity on executive teams is low. We focused on our US and UK data set to examine ethnically/culturally diverse representation among companies, considering the pipeline starting with university graduates. Black Americans comprise 10% of US graduates but hold only 4% of senior executive positions in our sample, Latinos/Hispanics comprise 8% of graduates versus 4% of executives, and for Asian Americans the numbers are 7% of graduates versus 5% of executives.11 As expected, white executives are represented to a higher extent on these teams, with nearly 85% of C-suite positions for 68% of US graduates. In the UK, the disparity is even greater: 22% of university students identify as Black and Minority Ethnic (BAME),12 yet only 8% of UK executives in our sample share this identity.
11 Average of bachelor’s and master’s degrees awarded in US from 2000–15. National Center for Education Statistics, 2000–15.
12 Includes undergraduate and postgraduate students of known ethnicity in 2015. UK Higher Education Statistics Agency.
Companies with the most ethnically/culturally diverse boards worldwide are 43% more likely to experience higher profits.

15 Delivering through diversity Section Heading15
Black women potentially suffer a double burden of bias that keeps them from the uppermost levels of corporate leadership. Underrepresentation on executive teams in general, and in line roles in particular, could be an important piece of this story.
16Delivering through Diversity Diversity and financial performance in 2017
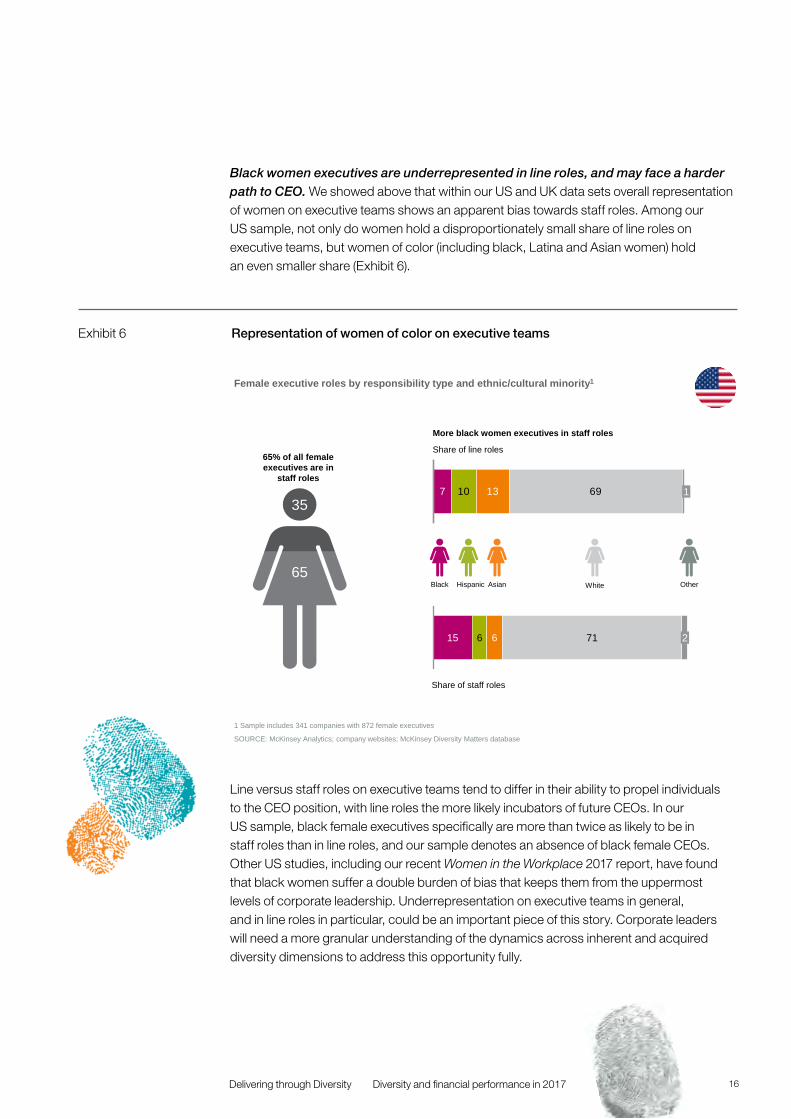
Black women executives are underrepresented in line roles, and may face a harder path to CEO. We showed above that within our US and UK data sets overall representation of women on executive teams shows an apparent bias towards staff roles. Among our US sample, not only do women hold a disproportionately small share of line roles on executive teams, but women of color (including black, Latina and Asian women) hold an even smaller share (Exhibit 6).
Line versus staff roles on executive teams tend to differ in their ability to propel individuals to the CEO position, with line roles the more likely incubators of future CEOs. In our US sample, black female executives specifically are more than twice as likely to be in staff roles than in line roles, and our sample denotes an absence of black female CEOs. Other US studies, including our recent Women in the Workplace 2017 report, have found that black women suffer a double burden of bias that keeps them from the uppermost levels of corporate leadership. Underrepresentation on executive teams in general, and in line roles in particular, could be an important piece of this story. Corporate leaders will need a more granular understanding of the dynamics across inherent and acquired diversity dimensions to address this opportunity fully.
Female executive roles by responsibility type and ethnic/cultural minority1
1 Sample includes 341 companies with 872 female executives
SOURCE: McKinsey Analytics; company websites; McKinsey Diversity Matters database
65% of all female executives are in
staff roles
Share of line roles
Share of staff roles
65
357 10 13 69 1
15 6 6 71 2
Black Hispanic Asian White Other
More black women executives in staff roles
Representation of women of color on executive teamsExhibit 6

Delivering through diversity Section Heading17
Spotlight on diversity in the financial services and technology sectorsIn our data set, financial services firms are overrepresented in the top quartile for gender diversity. As a whole, they have been able to improve gender diversity more than other industries we examined – with women comprising on average 18% of executive teams versus 13% among consumer and retail companies, for example. Since the publication of our first report, levels of gender-diverse representation in financial services firms have increased more than have levels of ethnic and cultural diversity.
The telecom, media, and technology (TMT) companies in our sample, the majority of which are tech firms, are disproportionately represented in the fourth quartile for gender. The companies in this industry group are also among those that have seen the greatest decline in diversity representation since our 2015 report. This could reflect widely covered challenges that parts of the sector have faced with issues like gender bias, pay, and promotion.

Delivering through diversity Section Heading
13 US National Center for Education Statistics, 2016 Digest of Education Statistics; and US Bureau of Labor Statistics, “Employed persons by detailed industry, sex, race, and Hispanic or Latino ethnicity,” Current Population Survey, February 2017.
14 Ibid.
18
Among US TMT companies, representation of women at whole company level is 30 to 35%, almost exactly the same as the proportion of STEM degrees granted to US women (35% and 33% of bachelor and masters, respectively).13 Yet women make up only 17% of US TMT executives
in our sample. With respect to ethnic and cultural diversity, 12% of TMT executives in our US data set are Asian, black, or Latino, whereas 30% of bachelor degrees in STEM were awarded to the three groups combined since 2000.14

19 Delivering through diversity Section Heading19
20Delivering through Diversity Diversity around the world
Diversity around the world
The correlations between gender and ethnic/cultural diversity and financial performance generally hold true across geographies, though with some variations in certain regions.
Our data yielded some noteworthy findings concerning the country level differences in executive team diversity. Specifically:
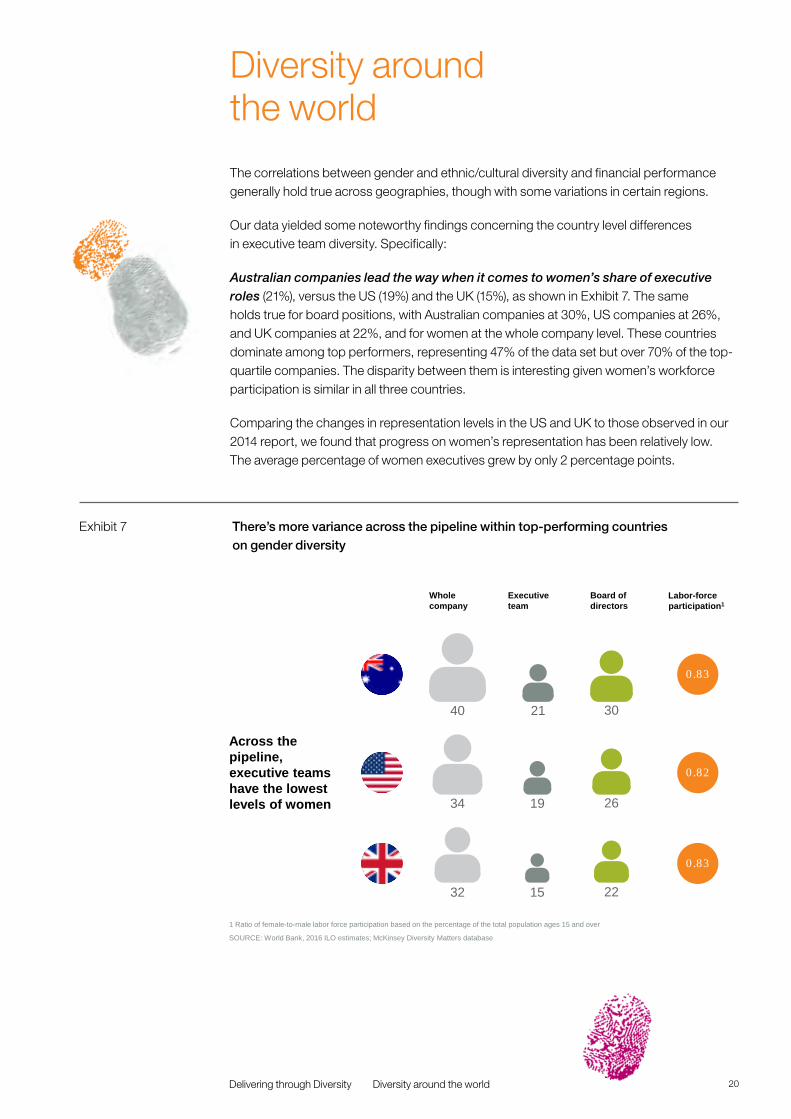
Australian companies lead the way when it comes to women’s share of executive roles (21%), versus the US (19%) and the UK (15%), as shown in Exhibit 7. The same holds true for board positions, with Australian companies at 30%, US companies at 26%, and UK companies at 22%, and for women at the whole company level. These countries dominate among top performers, representing 47% of the data set but over 70% of the top-quartile companies. The disparity between them is interesting given women’s workforce participation is similar in all three countries.
Comparing the changes in representation levels in the US and UK to those observed in our 2014 report, we found that progress on women’s representation has been relatively low. The average percentage of women executives grew by only 2 percentage points.
1 Ratio of female-to-male labor force participation based on the percentage of the total population ages 15 and over
SOURCE: World Bank, 2016 ILO estimates; McKinsey Diversity Matters database
Across the pipeline, executive teams have the lowest levels of women
Labor-force participation1
Whole company
Board of directors
Executive team
0.83
40 21 30
0.82
34 19 26
0.83
32 15 22
There’s more variance across the pipeline within top-performing countries on gender diversity
Exhibit 7
21 Delivering through Diversity Diversity around the world
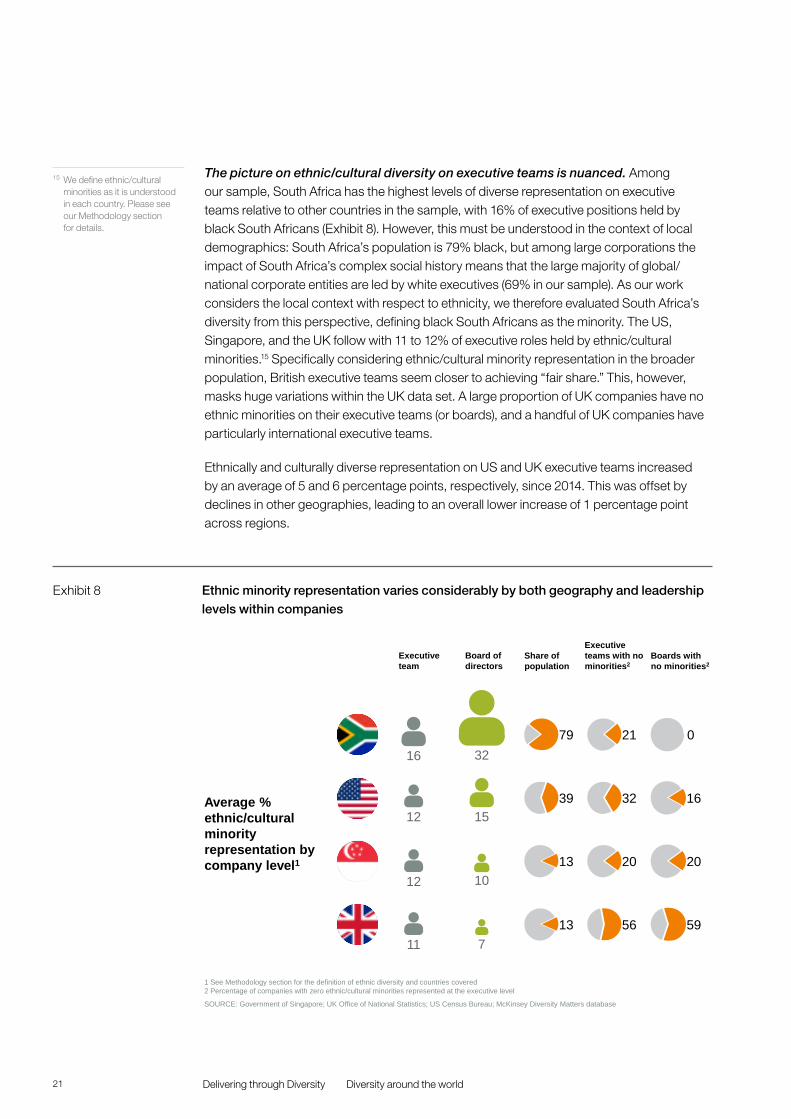
The picture on ethnic/cultural diversity on executive teams is nuanced. Among our sample, South Africa has the highest levels of diverse representation on executive teams relative to other countries in the sample, with 16% of executive positions held by black South Africans (Exhibit 8). However, this must be understood in the context of local demographics: South Africa’s population is 79% black, but among large corporations the impact of South Africa’s complex social history means that the large majority of global/national corporate entities are led by white executives (69% in our sample). As our work considers the local context with respect to ethnicity, we therefore evaluated South Africa’s diversity from this perspective, defining black South Africans as the minority. The US, Singapore, and the UK follow with 11 to 12% of executive roles held by ethnic/cultural minorities.15 Specifically considering ethnic/cultural minority representation in the broader population, British executive teams seem closer to achieving “fair share.” This, however, masks huge variations within the UK data set. A large proportion of UK companies have no ethnic minorities on their executive teams (or boards), and a handful of UK companies have particularly international executive teams.
Ethnically and culturally diverse representation on US and UK executive teams increased by an average of 5 and 6 percentage points, respectively, since 2014. This was offset by declines in other geographies, leading to an overall lower increase of 1 percentage point across regions.
15 We define ethnic/cultural minorities as it is understood in each country. Please see our Methodology section for details.
Share of population
Executive teams with no minorities2
Boards with no minorities2
79 21 0
39 32 16
13 56 59
13 20 20
SOURCE: Government of Singapore; UK Office of National Statistics; US Census Bureau; McKinsey Diversity Matters database
1 See Methodology section for the definition of ethnic diversity and countries covered2 Percentage of companies with zero ethnic/cultural minorities represented at the executive level
Board of directors
Executive team
Average % ethnic/cultural minority representation by company level1
32
10
16
7
12 15
12
11
Ethnic minority representation varies considerably by both geography and leadership levels within companies
Exhibit 8
Delivery example
Allianz and acquired diversityCompanies’ understanding of what diversity means varies worldwide and is continuously evolving. Hewlett et al. (2013) describe diversity as inherent attributes such as gender, age, or ethnicity, and acquired attributes such as education or socioeconomic background.16 Initially companies’ emphasis was on the inherent forms, and much remains to be achieved on this front. There is increasing appreciation that acquired diversity is also relevant, as it too contributes to the diversity of thought, leadership, and managerial styles companies seek.
Allianz, an international insurance firm headquartered in Germany, offers a good example of a company that understands the importance of including acquired traits in an I&D strategy, tracking progress against them and holding itself to account for impact.
The company has set I&D goals which address five dimensions of acquired as well as inherent diversity: gender, age, disability, education, and nationality/culture. Not only does the company promote acquired diversity – e.g., by employing people of different national origins and cultural exposure and by encouraging international rotations – it also shares its progress against all of its diversity goals, holds its managers accountable for delivery, and celebrates their successes.
22
16 Sylvia Ann Hewlett, Melinda Marshall, and Laura Sherbin, “How Diversity Can Drive Innovation,” Harvard Business Review, December 2013.
We first hypothesized in Why Diversity Matters that there are five key ways I&D can contribute to a company's performance and help drive value creation:
� Win the war for talent. Strengthening human capital for their organizations remains one of the top challenges for CEOs globally, and it continues to be seen as a key source of competitive advantage. A diverse and inclusive workplace is central to a company's ability to attract, develop, and retain the talent it needs to compete. The effects of major trends – globalization, technology, and demographics – create new growth opportunities for companies, while disrupting traditional business models and organizational structures.17 More diverse organizations have broader talent pools from which to source capability to compete in this changing world.
� Improve the quality of decision making. Published research from academia, corporations, and other organizations supports that diverse and inclusive groups make better quality decisions, often faster, and in a more fact-based manner, with less cognitive bias or groupthink.18, 19 Further studies show a positive correlation between better decision making and business performance.20
� Increase innovation and customer insight. Similarly, research supports that diverse and inclusive teams tend to be more creative and innovative than homogenous groups. Diverse teams bring different experiences, perspectives, and approaches to bear on solving complex, non-routine problems.21, 22 Diverse teams are also better able to target and distinctively serve diverse customer markets, such as women, ethnic minority, and LGBTQ+ communities which command an increasing share of consumer wealth23,24,25 and which could represent untapped markets for some companies.
23
Ways I&D can support business performance

� Increase employee satisfaction. I&D management improves employee satisfaction and also reduces conflict between groups, improving collaboration and loyalty. This can create an environment that is more attractive to high performers.
� Improve a company’s global image and license to operate. Even before the current climate raised the stakes on I&D, companies who were leaders in this space benefitted from an enhanced reputation extending beyond their employees to their customers, supply chain, local communities, and wider society. Recent highly publicized issues with gender and racial discrimination highlight that, for many companies, this is also a matter of license to operate.
We believe these drivers of value through I&D continue to be very relevant today. Our current work aims to support companies in their efforts to capture these benefits.
17 Richard Dobbs, James Manyika, and Jonathan Woetzel, No Ordinary Disruption: The Four Global Forces Breaking all the Trends. New York: PublicAffairs, May 2015.
18 Heidi Grant and David Rock, “Why Diverse Teams Are Smarter,” Harvard Business Review, November 2016.
19 Scott Berinato, Thomas Malone, and Anita Woolley, “What Makes a Team Smarter? More Women,” Harvard Business Review, June 2011.
20 Erik Larson, “New Research: Diversity + Inclusion = Better Decision Making At Work,” Forbes, September 2017.
21 Katherine W. Phillips, “How Diversity Makes Us Smarter,” Scientific American, October 2014.
22 Sylvia A. Hewlett, Melinda Marshall, and Laura Sherbin, “How Diversity Can Drive Innovation,” Harvard Business Review, December 2013.
23 Huasheng Gao and Wei Zhang, “Employment Nondiscrimination Acts and Corporate Innovation,” Management Science, June 2016.
24 M.V. Lee Badgett et al, “The Business Impact of LGBT – Supportive Workplace Policies,” The Williams Institute, May 2013.
25 “Buying Power” series, Catalyst, May 2015.
24

Delivering through diversity Section Heading25
26Delivering through Diversity Delivering impact through I&D
Delivering impact through I&D
Our research confirms that gender and ethnic/cultural diversity, particularly within executive teams, continue to be correlated to financial performance across multiple countries worldwide. In our first report, our hypotheses for what drives this correlation were: that more diverse companies are better able to attract top talent; to improve their customer orientation, employee satisfaction, and decision making; and to secure their license to operate.
As we mention in our introduction, companies report that materially improving representation of diverse talent within their ranks, as well as effectively utilizing I&D as an enabler of business impact, are particularly challenging goals. We compared levels of diversity on executive teams in 346 companies in our Why Diversity Matters data set (measured in 2014) to current levels at these companies. Overall, gender diversity on executive teams increased by 2 percentage points to 14%, while ethnic and cultural diversity increased by 1 percentage point to 13%. Considering the size of executive teams as defined in our sample (typically 10 to 15 executives) this suggests limited progress.
These aggregate numbers hide the fact that multiple companies worldwide are succeeding in making sizeable improvements to I&D across their organizations, and they are reaping tangible benefits. We sought to understand what CEOs could learn from the experiences of 17 companies who have been engaging actively with the topic about how to craft a high-impact I&D strategy.
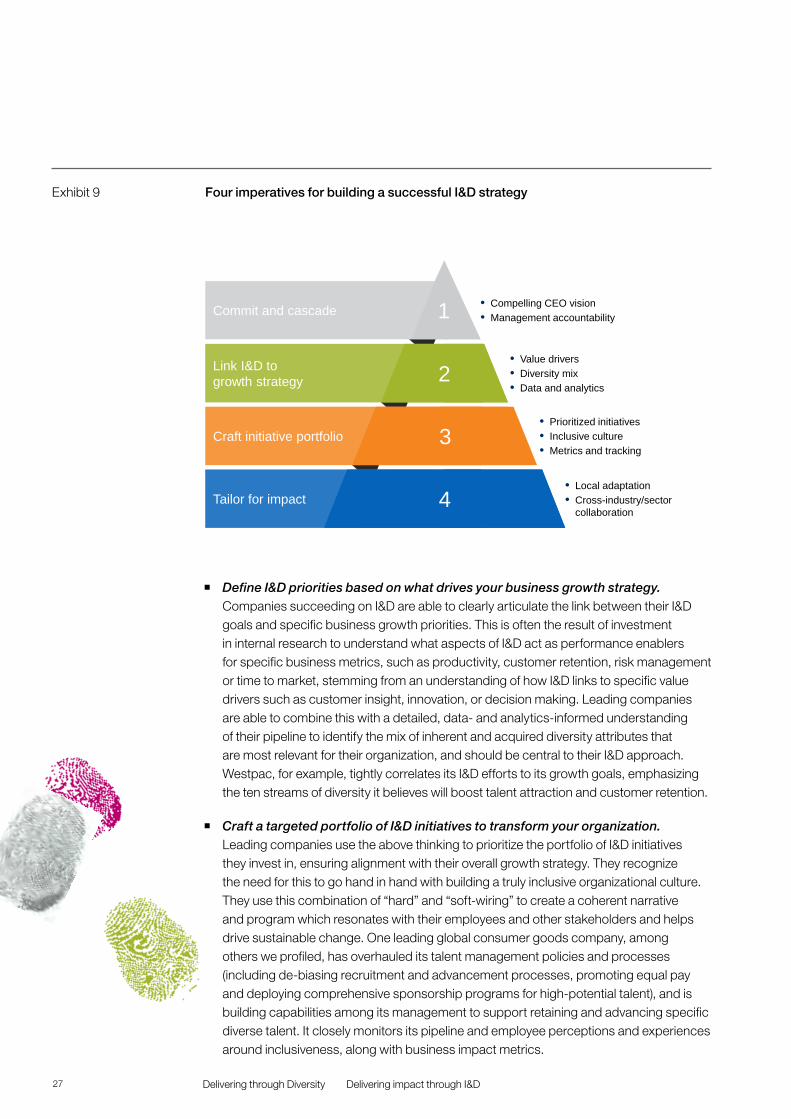
We found that the most successful companies all developed I&D strategies that reflected their business ethos and growth priorities and to which they were strongly committed. Four imperatives emerged as key (Exhibit 9):
� Articulate and cascade CEO commitment to galvanize your organization. Companies increasingly recognize that commitment to I&D starts at the top, with many publicly committing to an I&D agenda. Leading companies go further by cascading this commitment through their organizations and particularly to middle management. They promote ownership by their core businesses – encouraging role modeling and holding to account their executives and managers for delivery. They ensure these efforts are sufficiently resourced and supported centrally. For example, Sodexo has publicly stated its 40% target for women in senior executive roles, has resources in place to drive the strategy in each business line, and also ties 10% of executives’ bonus to achieving its I&D goals.
Companies report that materially improving representation of diverse talent as well as effectively utilizing I&D as an enabler of business impact, are particularly challenging goals.
27 Delivering through Diversity Delivering impact through I&D
• Compelling CEO vision• Management accountability
• Value drivers• Diversity mix• Data and analytics
• Prioritized initiatives• Inclusive culture• Metrics and tracking
• Local adaptation• Cross-industry/sector
collaboration
1
2
Commit and cascade
Link I&D to growth strategy
Craft initiative portfolio
Tailor for impact
3
4
Four imperatives for building a successful I&D strategyExhibit 9
� Define I&D priorities based on what drives your business growth strategy. Companies succeeding on I&D are able to clearly articulate the link between their I&D goals and specific business growth priorities. This is often the result of investment in internal research to understand what aspects of I&D act as performance enablers for specific business metrics, such as productivity, customer retention, risk management or time to market, stemming from an understanding of how I&D links to specific value drivers such as customer insight, innovation, or decision making. Leading companies are able to combine this with a detailed, data- and analytics-informed understanding of their pipeline to identify the mix of inherent and acquired diversity attributes that are most relevant for their organization, and should be central to their I&D approach. Westpac, for example, tightly correlates its I&D efforts to its growth goals, emphasizing the ten streams of diversity it believes will boost talent attraction and customer retention.
� Craft a targeted portfolio of I&D initiatives to transform your organization. Leading companies use the above thinking to prioritize the portfolio of I&D initiatives they invest in, ensuring alignment with their overall growth strategy. They recognize the need for this to go hand in hand with building a truly inclusive organizational culture. They use this combination of “hard” and “soft-wiring” to create a coherent narrative and program which resonates with their employees and other stakeholders and helps drive sustainable change. One leading global consumer goods company, among others we profiled, has overhauled its talent management policies and processes (including de-biasing recruitment and advancement processes, promoting equal pay and deploying comprehensive sponsorship programs for high-potential talent), and is building capabilities among its management to support retaining and advancing specific diverse talent. It closely monitors its pipeline and employee perceptions and experiences around inclusiveness, along with business impact metrics.
28Delivering through Diversity Delivering impact through I&D
� Tailor the I&D strategy to maximize local impact. Lastly, leading companies we spoke to recognize that while there is an imperative for an overall consistent direction for their I&D strategy, there is both the opportunity and the need to adapt this to different parts of their businesses and the varying geographic and sociocultural contexts in which they operate. Across several of our researched companies, this translated to a degree of local customization of overall I&D goals and priorities (e.g., reflecting varying regulatory contexts and differing starting points), and differing extents of wider local stakeholder engagement and cross-sector collaboration. In some companies this took the form of active pursuit of an advocacy and anti-discrimination agenda that not only motivated employees but also fostered local partnerships with other companies in the industry. In each instance, global I&D teams were careful to ensure ownership by local teams and business units, while providing adequate central support.
While rigorous attention to all four imperatives helps position I&D as an effective enabler in support of a company’s growth agenda, our experience suggests that there are critical areas companies tend to fall short on: these include leadership and management accountability, a fact-based and compelling business case for I&D, and the coherence and prioritization of the resulting action plan. We also found that while progress on representation can be brought about relatively rapidly with the right set of initiatives, embedding inclusion sustainably within the organization can take many years, often requiring action outside the organization. Companies that do this well are able to create a strong corporate ethos that resonates across employee, customer, supplier, investor, and broader stakeholder groups.
Companies succeeding on I&D are able to articulate the link between their I&D goals and specific business growth priorities.
29
Delivery example
Salesforce, an equality leaderSalesforce’s commitment to diversity and inclusion is more than apparent from the rapid pace of initiatives rolled out over the past few years. In 2015, CEO Marc Benioff publicly announced that the company would aim to employ an equal number of men and women.26 Moreover, Salesforce works to ensure that the diversity of its employees mirrors the diversity of the communities where the company is based and does business. It has also made important changes to its hiring processes to address unconscious bias, including more awareness training and competencies-based interviewing. In addition, interviewing for executive positions must include at least one female candidate or underrepresented minority.
In addition to broadening its hiring efforts, the company has taken steps to ensure men and women are paid equally for equal work. After analyzing the salaries of some 17,000 employees, in 2015 Salesforce adjusted the compensation of about 6% of employees, spending about US $3 million to do so.27 It now monitors salaries on an ongoing basis. Equal advancement is also a priority. Women now make up a minimum of one-third of attendees at executive management meetings and one-third of the speakers at customer events. In 2016, the number of women promoted increased by 33%.
In the US, Salesforce is recognized as a leading proponent of LGBTQ rights, being one of the first companies to speak out against anti-LGBTQ legislation in Indiana.28
30
In Australia as well as the U.S., the company is known for its support for same-sex marriage. Salesforce’s support for the LGBTQ community has not gone unnoticed. The company has been graded 100% by the Corporate Equality Index, which rates American businesses on their treatment of LGBTQ employees, consumers, and investors. It has also received a Brilliance in Diversity Award from The National Diversity Council and was named no. 4 on Fortune’s Best Places to Work for Diversity.
Perhaps most emblematic of Salesforce’s commitment to I&D is the 2016 decision to create a new C-suite position, the Chief Equality Officer. Reporting to the CEO, Chief Equality Officer Tony Prophet is responsible for ensuring that Salesforce reflects the diversity of the communities it serves and is truly inclusive.
26 Hope King, “Salesforce CEO: I didn’t focus on hiring women then. But I am now,” CNN, June 12, 2015, http://money.cnn.com/ 2015/06/12/technology/salesforce-ceo-women-equal-pay/index.html, accessed November 6, 2017.
27 Valentina Zarya, “Salesforce Spent $3 Million on Equal Pay. Here’s How Many Employees Got Raises as a Result,” Fortune, March 8, 2016, http://fortune.com/2016/03/08/salesforce-equal-pay/, accessed November 6, 2017.
28 Alexander C. Kaufman, “The CEO Who Took On Indiana’s Anti-LGBT Law — And Won,” Huffington Post, April 7, 2015, https://www.huffingtonpost.com/2015/04/07/marc-benioff-indiana_n_7017032.html, accessed November 6, 2017.

3131
32Delivering through Diversity Conclusion
Conclusion
We show that the business case for diversity continues to be compelling and have global relevance. We highlight the opportunity for promoting diversity in senior decision-making roles, and specifically in line roles on executive teams. Although levels of diverse representation in top teams are still highly variable globally – with progress being slow overall – there are practical lessons from successful companies that have made I&D work for them.
We have distilled the I&D experiences of top and rapidly improving companies on diversity to four key imperatives, creating the opportunity for CEOs to engage with their executive teams to set ambitious I&D aspirations for their organizations that are truly aligned with their business strategy. Delivering on these goals will require developing a solid understanding of their I&D baseline, creating a bespoke mix of I&D priorities to maximize business impact, purposefully allocating the required time and resources, and maximizing ownership of business units, with active support from the talent management organization.
Crafting a truly effective I&D strategy is no small effort, and requires strong and sustained and inclusive leadership. But we, and many of the companies we studied in depth, believe the potential benefits of stronger business performance are well worth it.
Crafting a truly effective I&D strategy is no small effort, but the potential benefits of stronger business performance are well worth it.
33 Delivering through Diversity About the authors
About the authors
Vivian Hunt, DBEVivian Hunt is the Managing Partner for McKinsey & Company’s United Kingdom and Ireland offices and is a Senior Partner of the firm. Vivian previously led the firm’s Pharmaceutical & Medical Products Practice in EMEA, and continues to advise leading companies on a broad range of strategy topics, with a particular focus on performance transformation and organizational development. In addition to her client responsibilities, Vivian is a leader within the firm on leadership and diversity. She frequently speaks on McKinsey & Company’s flagship research and co-authored publications such as: Women Matter, Diversity Matters and The Power of Parity: How advancing women’s equality can add $12 trillion to global growth.
Vivian is on the board of several business groups in the UK, including BritishAmerican Business, the CBI London Council, and the Mayor of London’s Business Advisory Board. She is also a member of the Trilateral Commission. Vivian is a trustee of The Henry Smith Charity and is Chair of HRH Prince of Wales’ Business in the Community’s “Seeing is Believing” program as well as a reader for the Queen’s Anniversary Prize. She sits on the Advisory Council of the Tate Modern and the Southbank Centre, as well as Teach First’s Business Leaders Council and on the Board of the US-UK Fulbright Commission. Vivian was appointed a Dame Commander of the Order of the British Empire by Queen Elizabeth II in the UK’s 2018 New Year Honours List for her services to the economy and to women in business.
Sara PrinceSara Prince is a Partner in McKinsey & Company’s Atlanta office. She is a core leader in McKinsey’s Consumer and Marketing and Sales Practices with a specific focus on helping clients transform their operating model and capabilities to deliver beyond market growth. Sara has 12 years’ experience serving consumer, travel, transportation and logistics, and financial services clients on growth strategy, commercial capability building, and growth transformation. She has helped clients with a full suite of multi-faceted strategic and commercial issues and leads McKinsey’s efforts to drive commercial excellence transformations with consumer-driven organizations.
In the continued pursuit of helping clients broadly in the areas of growth, talent and capability, Sara co-authored McKinsey’s groundbreaking 2015 work, Why Diversity Matters, correlating financial performance and levels of gender and ethnic diversity in a company’s leadership team. Sara has since partnered with a broad variety of global organizations to define their diversity strategy, deliver relevant capability-building programs, and develop advanced analytics approaches to drive desired organizational effectiveness and business outcomes using diversity and inclusion levers. Sara is on the Board of the Georgia region of the American Red Cross.
Sundiatu Dixon-Fyle, PhD Sundiatu Dixon-Fyle is an Associate Partner in McKinsey & Company’s London office and the global client development lead in McKinsey’s Inclusion and Diversity Service Line. The service line supports clients in designing and delivering tailored strategies to capture the benefits of diversity as a business performance enabler, through increasing representation of diverse talent and fostering inclusiveness.
Sundiatu has 15 years’ experience as a management consultant at the firm, most recently as a Senior Healthcare Expert serving clients in our Health Systems and Services (HSS) and Pharma and Medical Products (PMP) sectors.
34Delivering through Diversity About the authors
Lareina YeeLareina Yee is a Senior Partner of the Firm and leads the global Tech Infrastructure and Services sector for McKinsey & Company’s High Tech Practice. Lareina advises high tech, media, and industrial companies on commercial growth, digital transformation, sales excellence, and product strategy.
As a forefront leader within the firm advocating for gender parity in business, Lareina is head of McKinsey’s North American Women Program and leads the firm’s ongoing research on women in leadership. In addition, she co-created McKinsey Academy for Women and counsels executive teams on improving diversity in their organization. Lareina leads Women in Workplace, a research partnership with LeanIn.org and the Wall Street Journal. She is a frequent speaker on women, including forums at the Council on Foreign Relations, Fortune, Techonomy, Makers and has been featured on NPR, CNBC and Bloomberg. Lareina has served on the board of the International Center for Research on Women and is currently on the board of Safe and Sound.
ContributorsTreina Fabré and Saif Hameed are Engagement Managers in McKinsey’s London office, with additional contributions from: Max Grass Araya in Atlanta; Alex Guo in Boston; Corinne Spears in Chicago; Adrian Lo in Hong Kong; José Martín Quesada in London; Bomy Lee Chung in Miami; Aditi Tusnial in Mumbai; Dany El Khoury, Brenda Maldonado, Katarina Pregelj, and Ashley Schloss in New York; and Lexie Tonelli in San Francisco.
AcknowledgementsThe authors would like to thank our former colleague and co-author of the 2015 Why Diversity Matters report, Dennis Layton. We also appreciate the following senior colleagues for their commitment to this topic: Sandrine Devillard, Anu Madgavkar, Yasir Mirza, Brian Rolfes, Kevin Sneader, and Rodney Zemmel. We would like to thank Margaret Brooks and Ellis Griffith of McKinsey’s Global Inclusion and Diversity team for their collaboration and support. Additionally, the authors appreciate the support of colleagues from McKinsey’s Strategy Analytics Center (STAC) in compiling financial metrics for the companies in our sample. Finally, we thank the executives and I&D leaders of Allianz, MetLife, Salesforce, Sodexo, Westpac, and Wipro for contributing their time and sharing their companies’ experiences to complement the case study profiles underpinning this report.
Design and art directionLaurence Parc, McKinsey Design Project Lead
Exhibit designJanice Alexander, McKinsey Media Designer
en
Delivering through Diversity Methodology
Methodology
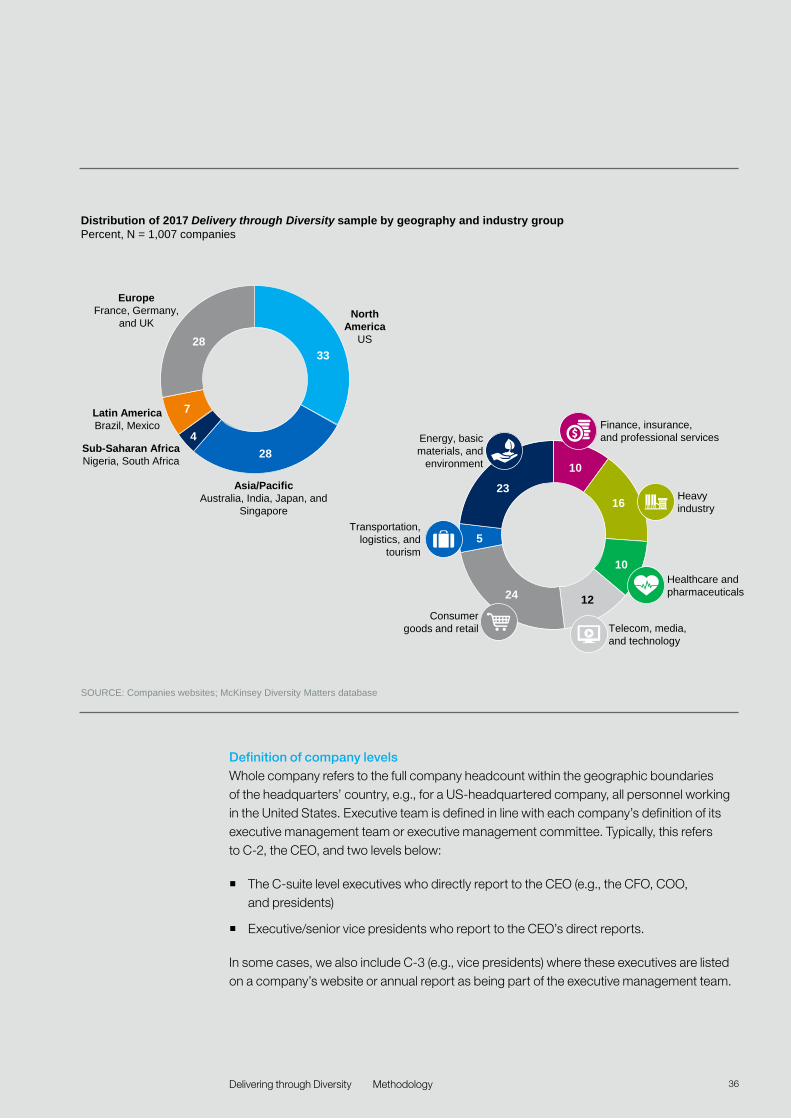
Company diversity and financial dataOur assessment gender and ethnic/cultural diversity is based on publicly available data from 1,007 companies across 12 countries globally. We reviewed corporate websites, annual reports, and other industry websites to gather statistics on the proportion of women and the split of ethnic/cultural groups for the whole company, the executive team, and the board of directors. We also gathered the representation of male and female executives (by ethnic/cultural group) in line and staff positions for most of the US- and UK-headquartered companies in our data set. Our data comes from the period of December 2016 to November 2017; however, most information dates to June 2017.
These demographic data were not available uniformly for each company in our data set. For this reason, the final tally of companies analyzed for a given correlation is less than the full sample of companies available, e.g., we have “whole company” gender data for 663 companies in ten countries only. The exact sample size for each correlation appears in the exhibits where our correlation findings are shown.
Financial data came from the Corporate Performance Analytics database by McKinsey and S&P Global. We measured profitability using average EBIT (earnings before interest and taxes) margins for non-financial companies and average ROE (return on equity) for financial companies over the five-year period from 2011 to 2015. We measured value creation for all companies using average economic profit as a percentage of average revenues (alternatively referred to as EP margin) over the same five-year period.
In a preliminary version of our findings, we measured value creation using absolute economic profit. We used EP margin rather than absolute EP as our chosen metric of value creation in order to normalize for company size. In the course of making the switch to the EP margin, we also increased our sample size by an additional 350 companies.
We limited our data set to those companies for which we could obtain complete financial data – both EBIT (or ROE in the case of financial companies) and EP – and at least one diversity data metric (gender or ethnicity) for at least one level of the organization (whole company, executive, or board of directors).
Our observations on other forms of diversity beyond gender and ethnic/cultural diversity, i.e., LGBTQ+ or age/generational diversity, were limited by a lack of access to publicly available representation data. We instead completed qualitative reviews of individual company’s initiatives in these areas. We infer from our qualitative research that the correlations observed on gender and ethnic/cultural diversity would likely hold for others like LGBTQ+ identity.
35
en
Delivering through Diversity Methodology
Definition of company levelsWhole company refers to the full company headcount within the geographic boundaries of the headquarters’ country, e.g., for a US-headquartered company, all personnel working in the United States. Executive team is defined in line with each company’s definition of its executive management team or executive management committee. Typically, this refers to C-2, the CEO, and two levels below:
� The C-suite level executives who directly report to the CEO (e.g., the CFO, COO, and presidents)
� Executive/senior vice presidents who report to the CEO’s direct reports.
In some cases, we also include C-3 (e.g., vice presidents) where these executives are listed on a company’s website or annual report as being part of the executive management team.
Finance, insurance, and professional services
Transportation, logistics, and
tourism
Heavy industry
Energy, basic materials, and
environment
Distribution of 2017 Delivery through Diversity sample by geography and industry groupPercent, N = 1,007 companies
SOURCE: Companies websites; McKinsey Diversity Matters database
North America
US
Asia/PacificAustralia, India, Japan, and
Singapore
Sub-Saharan AfricaNigeria, South Africa
Latin America Brazil, Mexico
EuropeFrance, Germany,
and UK
33
284
7
28
10
16
10
1224
5
23
Consumer goods and retail Telecom, media,
and technology
Healthcare and pharmaceuticals
36
Delivering through Diversity Methodology
Board of directors refers to the official directors of the corporate board, including both independent and executive directors, responsible for governance and, in some cases, management of the business. The composition of boards varies considerably across the sample and the degree of diversity observed in particular geographies may be influenced by government diversity quotas.
Methodology for determining diversity quartileCompanies in our global data set were grouped into quartiles based on the diversity of their organizations at each level. For gender diversity, quartiles were based on the percentage of women at a given level, and set relative to the total (‘“global’” sample) of 12 countries: US, UK, Germany, France, Brazil, Mexico, Japan, India, Australia, Singapore, South Africa, and Nigeria.
For ethnic diversity, we reprised a metric used in our original Why Diversity Matters publication: the normalized Herfindahl-Hirschman Index (NHHI). Used by economists to measure market concentration and competition within an industry, we adapted the NHHI metric to differentiate diversity in companies that had the same number of non-majority executives, but where one executive team included a greater range of ethnic backgrounds. Since the publication of the original research, we inverted the ratio such that an NHHI measure of 0 indicates a team where everyone has the same race or gender. Increases in NHHI indicate an increase in ethnic/cultural diversity.
HHI=∑ N (si 2)
NHHI=(HHI-1∕N) ⁄(1-1∕∕N)
NHHInew = 1 – NHHIold
Where N is the number of ethnic groups in the specific geography
Ethnic diversity quartiles were also set globally. However, given the limited availability of ethnic/cultural demographic data, the sample was much smaller – only 6 countries out of 12: the US, UK, Brazil, Mexico, Singapore, and South Africa.
While our correlations are based on the companies’ NHHI ratios, we also aggregated ethnic/cultural minority representation among the companies, by industry and by geography. We define ethnic group identity as it is understood in each geography:
� US: white/European ancestry, black/African ancestry, Latino/Hispanic of any race, Asian/Asian ancestry (including South Asian), other (including mixed race)
� UK: white/white British, black/Afro-Caribbean, Asian (including South Asian), other (including mixed race)
� South Africa: black, white, colored, other
� Singapore: Chinese, Malay, Indian, other (including white European)
� Brazil: black, brown (including mixed race), white, yellow (Asian), other
� Mexico: white, mestizo, indigenous, black, other
37
Delivering through Diversity Methodology
Methodology for financial performanceWe grouped companies into peer groups based on industry group and headquarters geography (nationally, or if necessary to ensure a sufficient sample size, regionally). Within each industry-geography pair, we then determined the relevant benchmark for “‘outperformance’” for each financial metric:
� EBIT margin benchmark set to be above the median for the relevant industry-geography peer group
� EP/revenues benchmark set to be the top quintile for the relevant industry-geography peer group.
We fit all of the financial data to curves and determined that differentiating the bar for financial performance was a necessary step to ensure we were truly capturing those companies with superior profitability and value creation, respectively. Specifically, the EP margin has much less variance around the median, requiring us to focus in on the rightmost end of the curve, i.e., the top quintile, to identify above-average performance.
Regression analysesWe ran multivariate regressions to confirm the relationship between either type of diversity and financial performance exists. We generally publish all results and note statistical significance. We consider as statistically significant any correlations with a p-value of <0.05. We also note where p-values meet a slightly lower bar of <0.1.
Deep-dive company profilesWe identified 17 high-performing companies in our data set and developed case studies for each using publicly available information from their respective websites. We supplemented our findings with senior executive interviews at the following companies (relevant geography as noted): Westpac (Australia), Wipro (India), Allianz (Germany, France), Sodexo (France), Salesforce (US), and MetLife (Japan).
To know more about our case studies or if your company would like to participate in our research in the future, please contact the authors.
Limitations of this workThis work adds to a growing body of research on the business case for I&D, and sheds light as to how companies can use diversity as an enabler of business impact. Several caveats are worth highlighting:
� Correlation is not causation. There are real limitations, and we are not asserting a causal link. As with many levers of business performance, particularly at such a high level, this would be challenging to demonstrate, likely requiring detailed longitudinal studies. Yet while not causal, the relationship is real. We have found statistically significant correlations between higher levels of diversity and above industry average financial performance, both in our original report and again in our 2017 update. Moreover, other research gives us good insight into what might underpin the relationship, and our interviews tell us how companies can make material differences in their I&D outcomes. Taken together, we think companies on the hunt for growth can get much more tactical on how they think about I&D as a lever to pull on the path to growth.
38
Delivering through Diversity Methodology
� Just as we cannot assert causality, we cannot say definitively what drives the correlations we find. It is theoretically possible that the better financial outperformance enables companies to achieve greater levels of diversity. Companies that perform well financially may choose to deploy more of their resources toward more advanced talent strategies, thus allowing them to attract more diverse talent, for example. However, in practice, this seems unlikely. We have observed that most companies only embark on a major transformation when they have a burning platform to do so.
� Standardized measures of inclusion need to be developed. It is now broadly accepted that inclusion is a requirement if diversity is to have a real impact. All leading companies we studied have developed ways to measure inclusion, including employee surveys and proxies. We would expect to see a positive correlation between inclusiveness and financial performance should a standardized measure of inclusiveness be available.
� Measuring diversity in critical value creation roles is a logical next step in this analysis, as an outside-in assessment of top teams is limited in its ability to focus on diversity in value-critical business areas and roles throughout the organization.
39

January 2018Copyright © McKinsey & Company Design contact: Visual Media Europewww.mckinsey.com
Recommended