Stephen F. Austin State University Stephen F. Austin State University
SFA ScholarWorks SFA ScholarWorks
Electronic Theses and Dissertations
12-2020
Delineating of the Utica Shale/Point Pleasant Formation Play Delineating of the Utica Shale/Point Pleasant Formation Play
System to Determine Influence of the Precambrian Basement in System to Determine Influence of the Precambrian Basement in
Northeastern Ohio Northeastern Ohio
Jarrod R. Bridges Stephen F Austin State University, [email protected]
Follow this and additional works at: https://scholarworks.sfasu.edu/etds
Part of the Geology Commons, Sedimentology Commons, Stratigraphy Commons, and the Tectonics
and Structure Commons
Tell us how this article helped you.
Repository Citation Repository Citation Bridges, Jarrod R., "Delineating of the Utica Shale/Point Pleasant Formation Play System to Determine Influence of the Precambrian Basement in Northeastern Ohio" (2020). Electronic Theses and Dissertations. 348. https://scholarworks.sfasu.edu/etds/348
This Thesis is brought to you for free and open access by SFA ScholarWorks. It has been accepted for inclusion in Electronic Theses and Dissertations by an authorized administrator of SFA ScholarWorks. For more information, please contact [email protected].

Delineating of the Utica Shale/Point Pleasant Formation Play System to Delineating of the Utica Shale/Point Pleasant Formation Play System to Determine Influence of the Precambrian Basement in Northeastern Ohio Determine Influence of the Precambrian Basement in Northeastern Ohio
Creative Commons License Creative Commons License
This work is licensed under a Creative Commons Attribution-Noncommercial-No Derivative Works 4.0 License.
This thesis is available at SFA ScholarWorks: https://scholarworks.sfasu.edu/etds/348
Delineating of the Utica Shale/Point Pleasant Formation Play System to
Determine Influence of the Precambrian Basement on Deposition in
Northeastern Ohio
By
Jarrod R. Bridges, Bachelor of Science
Presented to the Faculty of the Graduate School of
Stephen F. Austin State University
In Partial Fulfillment
Of the Requirements
For the Degree of
Master of Science
Stephen F. Austin State University
December 2020
Delineating of the Utica Shale/Point Pleasant Formation Play System to
Determine Influence of the Precambrian Basement on Deposition in
Northeastern Ohio
By
Jarrod R. Bridges, Bachelor of Science
APPROVED:
Dr. Julie Bloxson, Thesis Director
Dr. LaRell R. Nielson, Committee Member
Dr. Melinda Faulkner, Committee Member
Dr. Robert Friedfeld, Committee Member
Pauline M. Sampson, Ph.D.
Dean of Research and Graduate Studies
i
ABSTRACT
The Utica Shale/Point Pleasant Formation system has recently become
a highly developed unconventional target for oil and natural gas production, leading
to an increased desire for knowledge of the controls on deposition of this system.
Precambrian basement features have long been known to affect deposition of older
strata near these features across Ohio, but the effects of far field tectonics is not
fully agreed upon. Precambrian faults and lineaments are known to exist and have
been mapped, but are thought to have ceased their influence on deposition by
the time of the Knox unconformity during the Cambrian.
In the case of the Ordovician Utica Shale, Point Pleasant Formation,
Trenton Limestone, and the Black River Group, many believe that the deposition
of these strata were not affected by Precambrian faults/lineaments or other
basement features, rather their main influence was changes in sea level due
to basin loading, climatic changes, and localized uplift/subsidence. The objective
of this study was to determine if the deposition of these younger strata were
influenced by Precambrian faults and basement features. This was done by
analyzing a group of oil and gas wells in Lorain, Cuyahoga Lake, Geauga,
Ashtabula, Trumbull, Mahoning, Stark, Portage, Summit, Wayne, Ashland, and
Medina counties in northeastern Ohio. Electric well logs from these wells were

ii
added to Petra, a geological mapping program, and the tops of the Utica Shale,
Point Pleasant Formation, Trenton Limestone, and the Black River Group were
picked. These tops were then contoured into four structure maps and 4 isopach
thickness maps. These maps were analyzed with known Precambrian faults and
lineaments, along with known Precambrian basement features, to determine if
these Precambrian influences affected the deposition of these Ordovician strata.
It is known that high spatial resolution structure maps show contour
offsets across known and inferred structural features. It is also known that high
spatial resolution isopach maps show thinning and thickening across known and
inferred structural features. The purpose of this study was to take these methods
and apply them to the Utica Shale/Point Pleasant Formation system in order to
determine structural influence from the Precambrian basement on Ordovician
strata in northeastern Ohio.

iii
ACKNOWLEDGEMENTS
I would like to thank my Thesis Director, Dr. Julie Bloxson, for her help in all
things involved with this thesis, along with help in several classes throughout
graduate school. I also thank the remaining members of my committee: Dr.
Nielson, Dr. Faulkner, and Dr. Friedfeld, for their help and guidance through this
process. I would also like to thank my family for all of the support to get to this
point.
iv
TABLE OF CONTENTS
Abstract ................................................................................................................ i
Acknowledgements ............................................................................................. iii
Table of Contents ................................................................................................ iv
List of Figures ....................................................................................................... v
1. Introduction ...................................................................................................... 1
2. Geologic Setting ............................................................................................... 8
3. Stratigraphy ................................................................................................... 13
4. Methods .......................................................................................................... 19
5. Results ........................................................................................................... 22
6. Discussion ...................................................................................................... 36
6.1. Lineaments and Structure ............................................................................ 37
6.2. Localized Uplift ............................................................................................ 38
7. Conclusions ....................................................................................................49
8. References ..................................................................................................... 51
9. Appendices… ................................................................................................ 55
10. Vita ...............................................................................................................61
v
LIST OF FIGURES
Figure 1: Regional extent of the Utica Shale and Point Pleasant Formation. From
Bloxson (2017). (Page 6)
Figure 2: Map of Ohio showing the known faults and trends across the state, and
major “pre-Ordovician” structural features in the study area associated with
Precambrian basement rock. (Page 7)
Figure 3: Sebree Trough location. Modified from Bloxson (2019). (Page 12)
Figure 4: Generalized stratigraphic column of the study area and time of interest.
Modified from Bloxson (2017). (Page 18)
Figure 5: Data Map showing the wells used for analysis. The symbol highlight
identifies the tops that were picked for each well. Green=Utica, blue=Point
Pleasant, purple=Trenton, brown=Black River, yellow=a raster log was present
and able to be used. (Page 20)
Figure 6: Hand-picked Type Log from Ashland County, southwestern portion of
study area. (Page 21)
Figure 7: Black River Group Structure Map, 100’ contour interval. (Page 25)
Figure 8: Trenton Limestone Structure Map, 100’ contour interval. (Page 26)
vi
Figure 9: Point Pleasant Formation Structure Map, 100’ contour interval. (Page
27)
Figure 10: Utica Shale Structure Map, 100’ contour interval. (Page 28)
Figure 11: Trenton Limestone Isopach Map, 10’ contour interval. (Page 29)
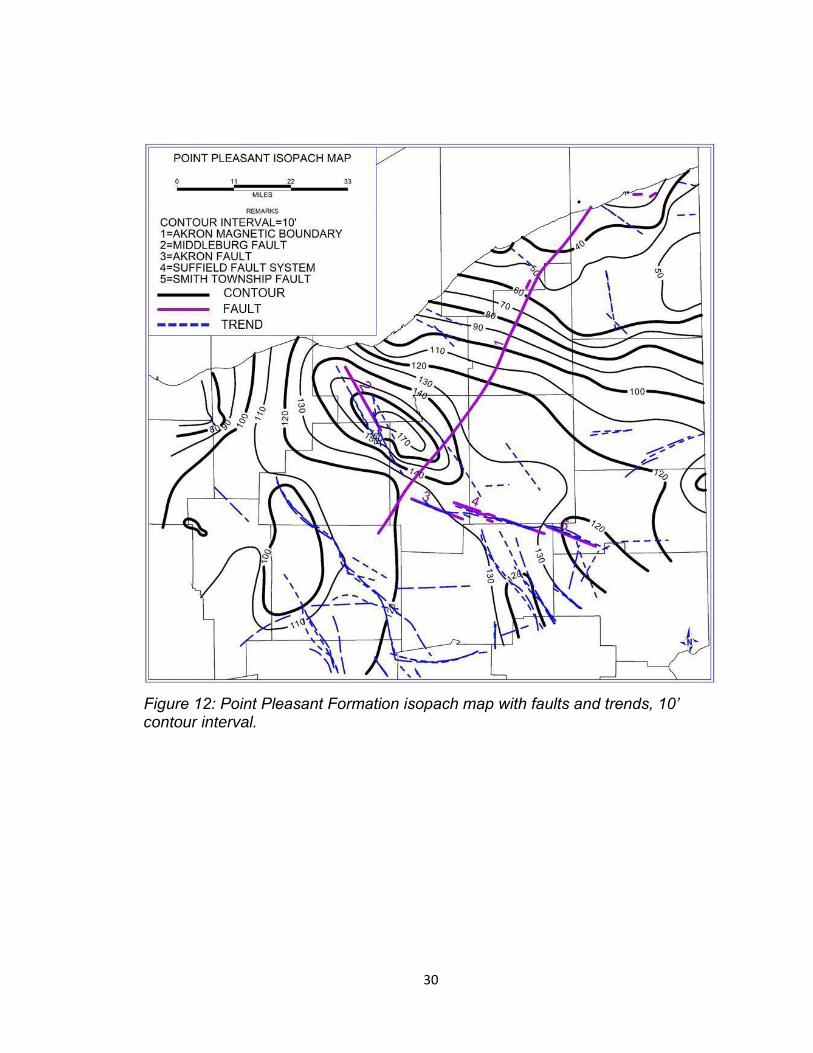
Figure 12: Point Pleasant Formation Isopach Map, 10’ contour interval. (Page
30)
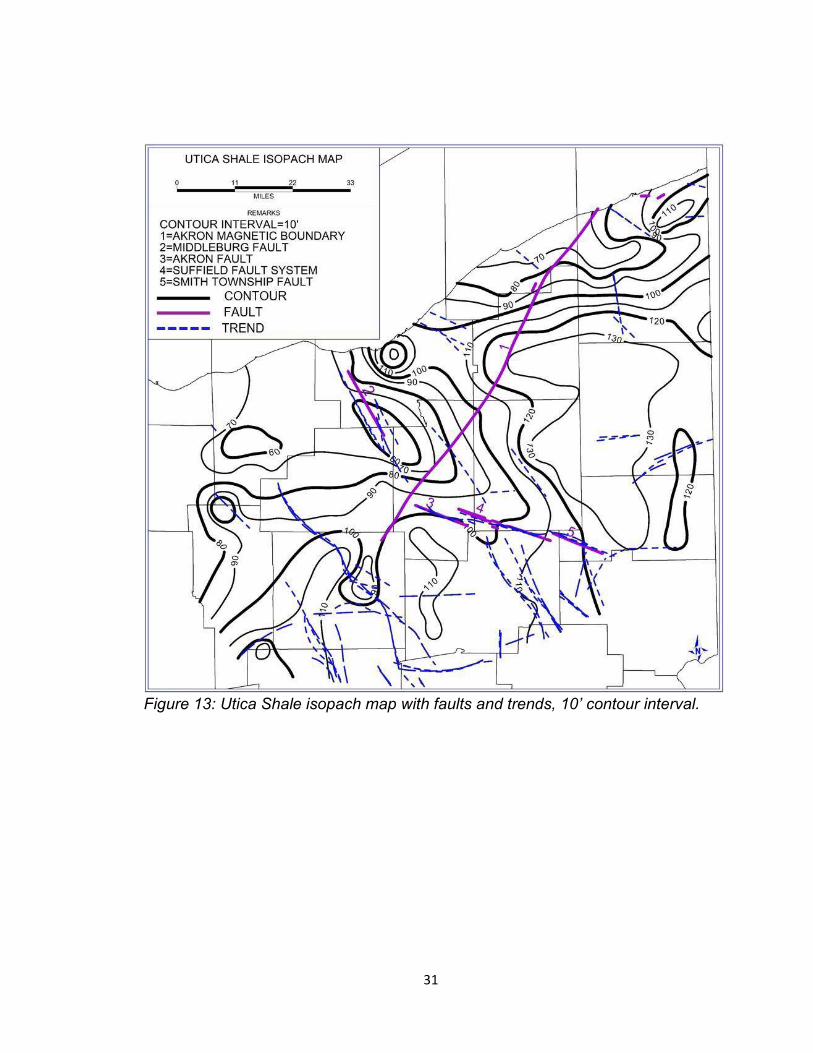
Figure 13: Utica Shale Isopach Map, 10’ contour interval. (Page 31)
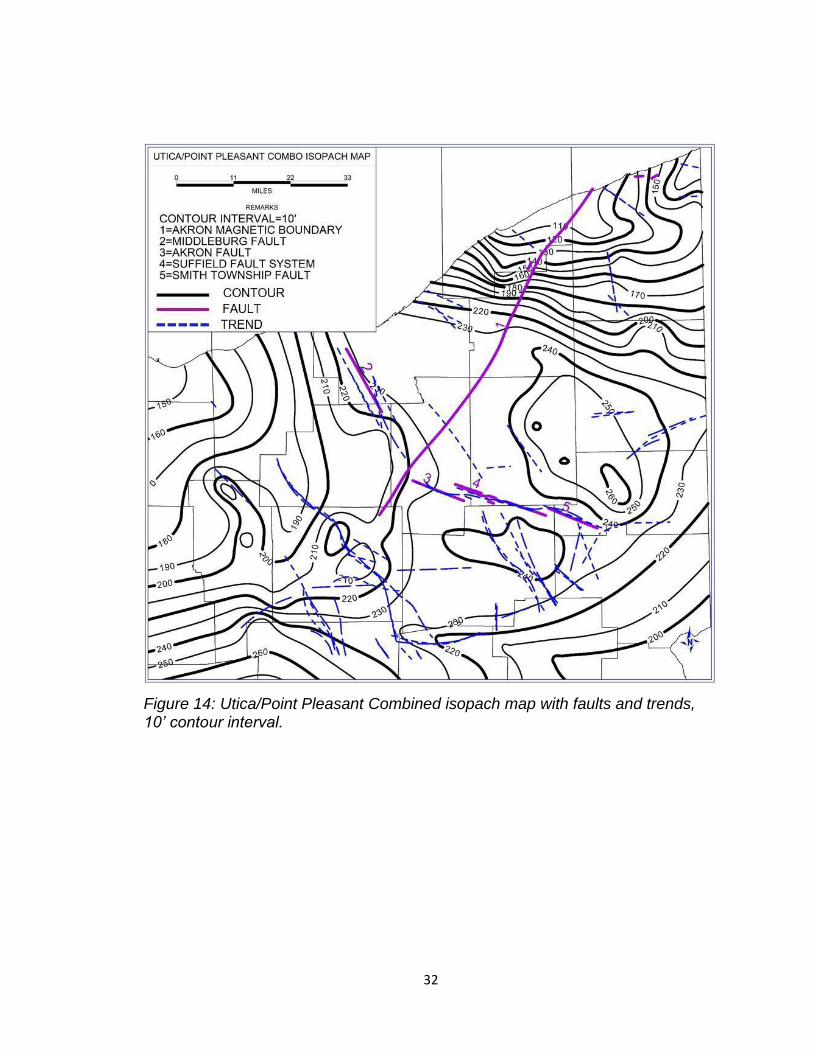
Figure 14: Utica/Point Pleasant Combined Isopach Map, 10’ contour interval.
(Page 32)
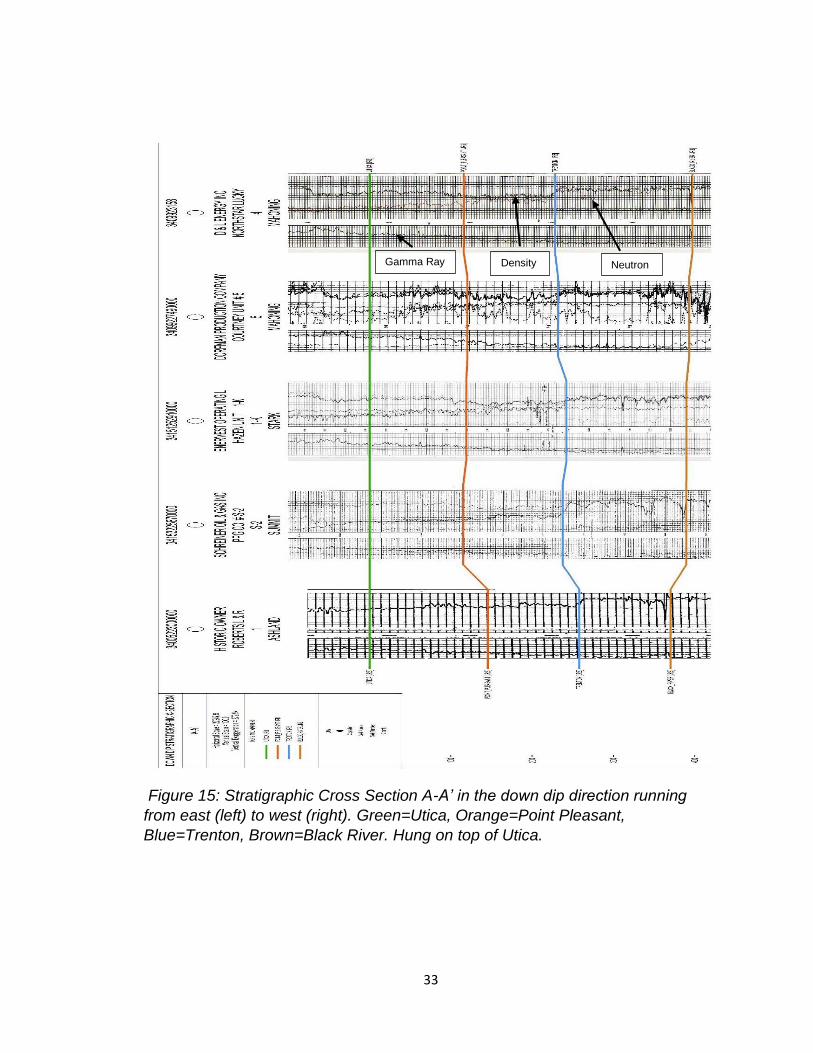
Figure 15: Stratigraphic Cross Section A-A’ in the down dip direction running
from east (left) to west (right). (Page 33)
Figure 16: Stratigraphic Cross Section B-B’ along strike, running from south (left)
to north (right). (Page 34)
Figure 17: Cross Section Locator Map showing section A-A’ in the downdip
direction, Section B-B’ along strike, faults and trends, and the area of uplift.
(Page 35)
Figure 18: Black River Group Structure Map showing areas of interest where
Devonian lineaments affect the structure contours. (Page 41)
vii
Figure 19: Trenton Limestone Structure Map showing areas of interest where
Devonian lineaments affect the structure contours. (Page 42)
Figure 20: Point Pleasant Structure Map showing areas of interest where
Devonian lineaments affect the structure contours. (Page 43)
Figure 21: Utica Shale Structure Map showing areas of interest where Devonian
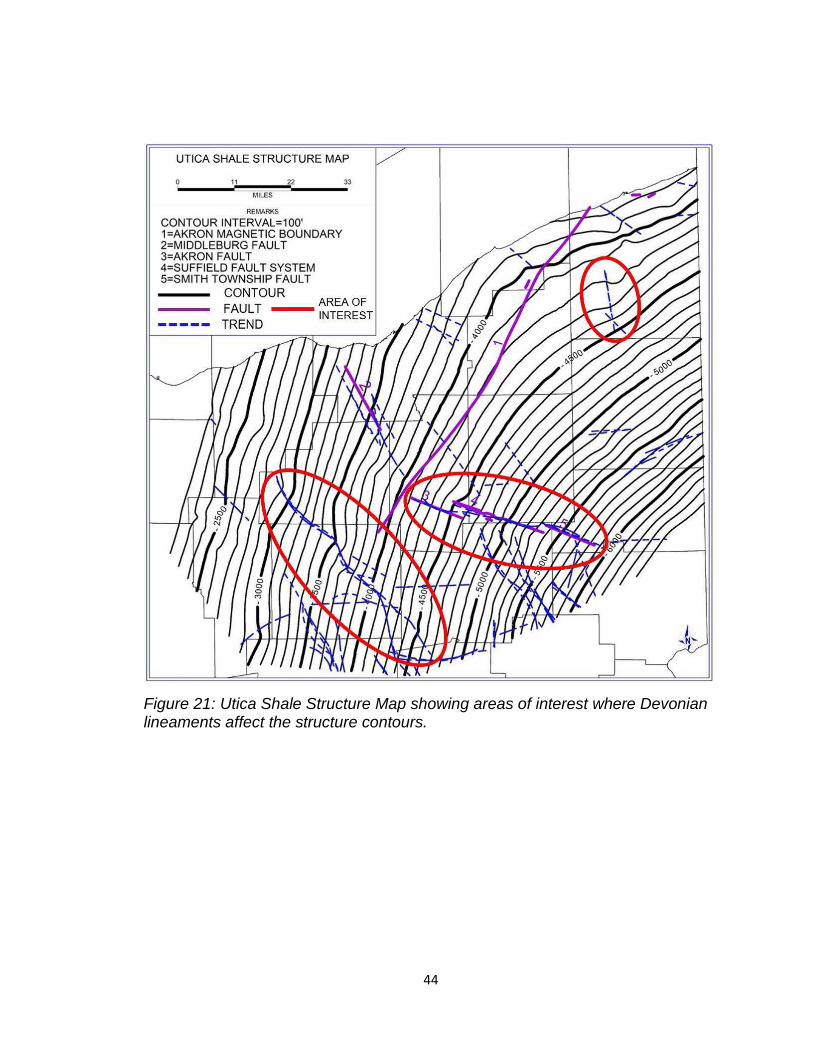
lineaments affect the structure contours. (Page 44)
Figure 22: Trenton Limestone Isopach Map showing area of interest where
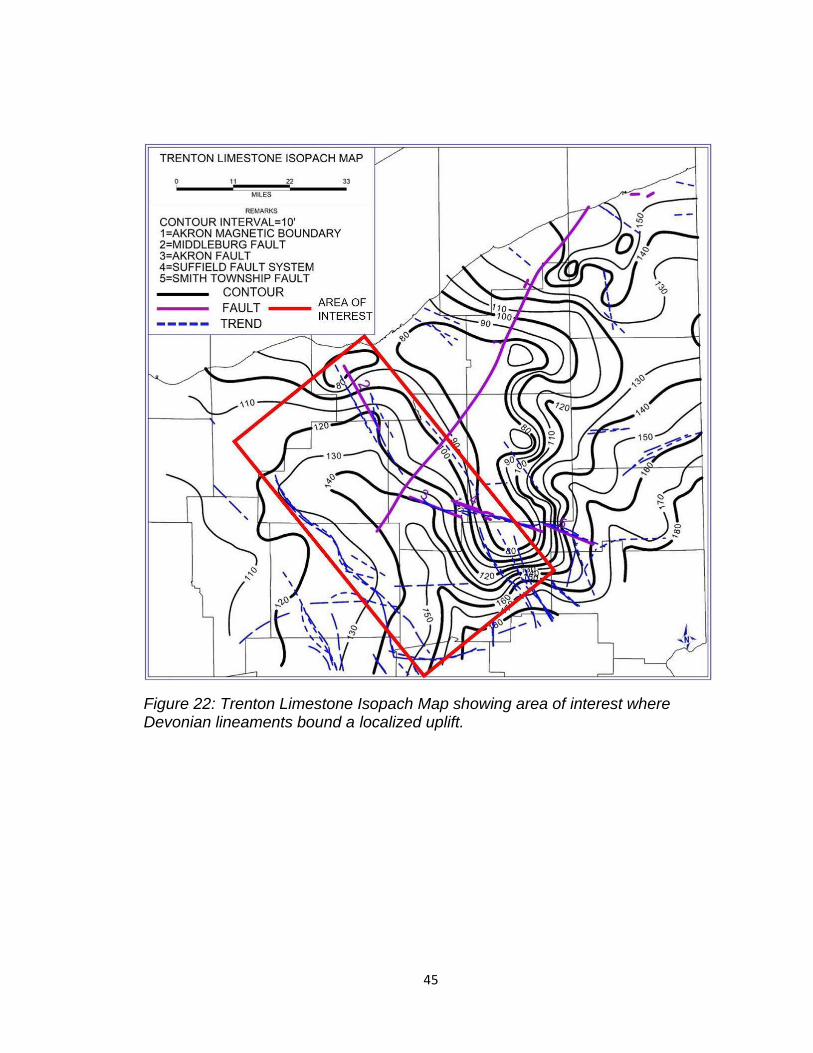
Devonian lineaments bound a localized uplift. (Page 45)
Figure 23: Point Pleasant Isopach Map showing area of interest where Devonian
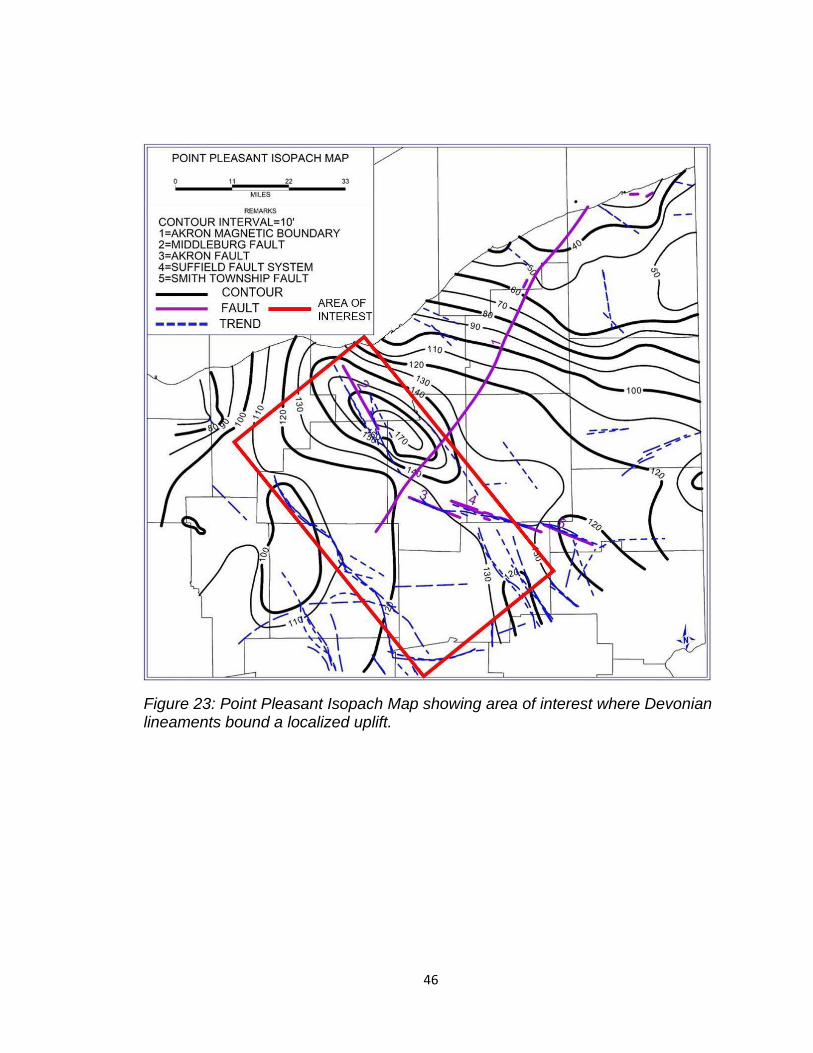
lineaments bound a localized uplift. (Page 46)
Figure 24: Utica Shale Isopach Map showing area of interest where Devonian
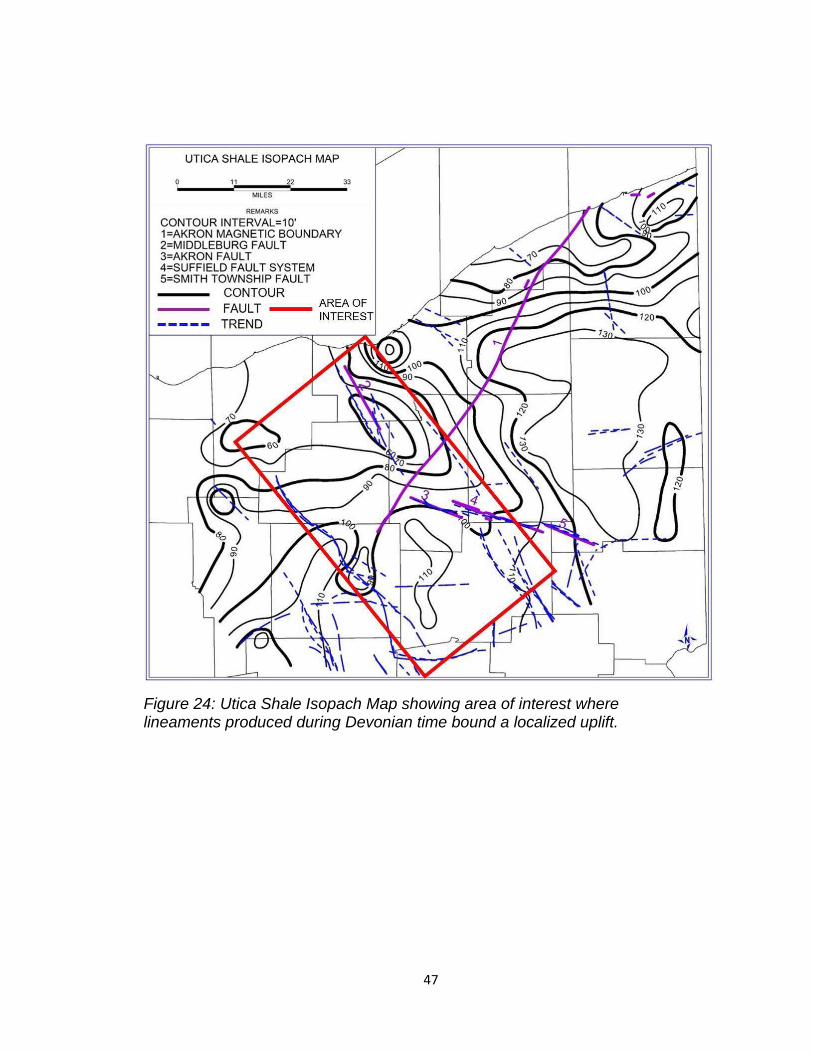
lineaments bound a localized uplift. (Page 47)
Figure 25: Utica Shale/Point Pleasant Combined Isopach Map showing area of
interest where Devonian lineaments bound a localized uplift. (Page 48)
1
1. INTRODUCTION
The Ordovician Utica Shale has long been known as a black, organic-rich,
deep basin mudstone that is the source rock for many of the Paleozoic
hydrocarbon plays across the basin. With recent improvements in technology, it
has become an unconventional reservoir as well (Ryder, 2008; Patchen, et al.,
2015). More correctly termed the Utica/Point Pleasant Play, it is a mixed
siliciclastic-carbonate system consisting of the lower Trenton/Lexington
limestones, Point Pleasant Formation, and Utica Shale, primarily targeted in
eastern Ohio and western-northwestern Pennsylvania (Wickstrom et al.; 1992
Lavoie et al., 2014; Hickman, et al., 2015). Recent increases in exploration for
production of hydrocarbons in the Upper Ordovician Utica Shale/Point Pleasant
play within the Appalachian Basin has led to an increased desire to understand
the deposition of this heterogeneous package.
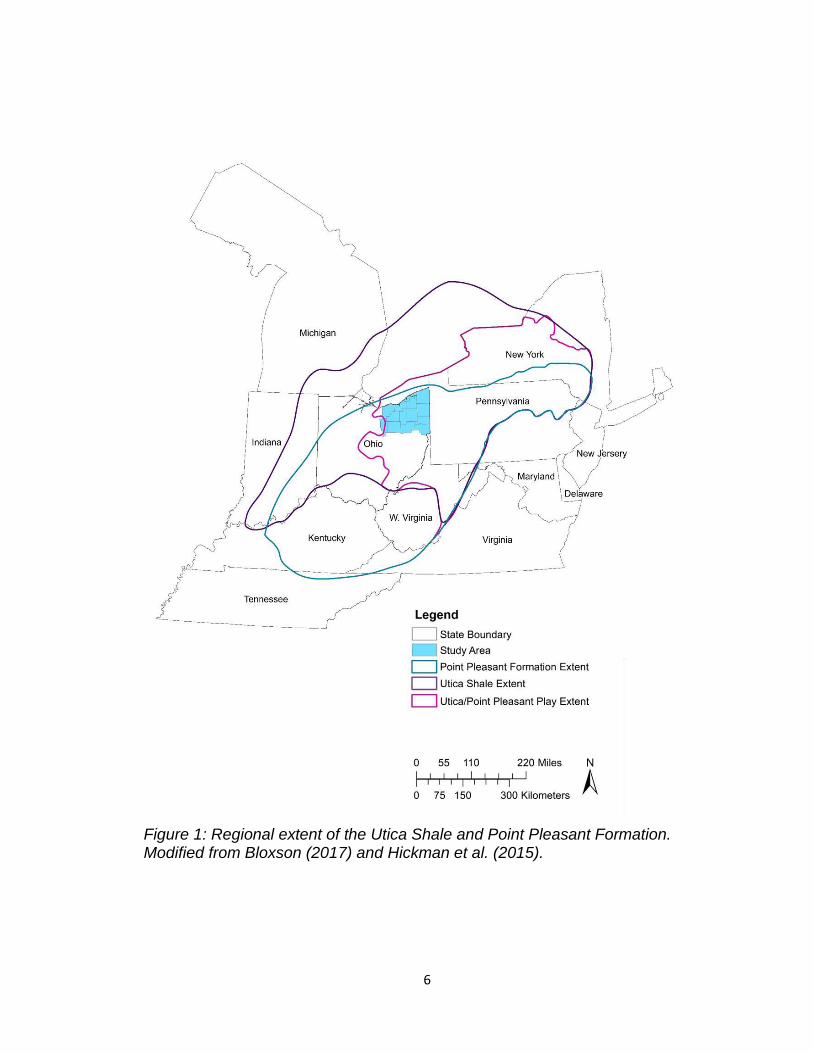
The Utica Shale spans throughout the Appalachian Basin from Quebec
through Pennsylvania into Indiana, while the Point Pleasant Formation is
generally confined to Ohio, Pennsylvania, and eastern New York (Figure 1).
Generally, this system decreases in carbonate content up-section. However,
when examining core from within the Appalachian Basin near the current
targeted drilling areas, there are heterogeneities both laterally and vertically,
2
dismissing the layer-cake model of Ordovician shales (Smith, 2015; Bloxson,
2017). Mineralogy has been shown to change across the basin, with depocenters
of dark, organic rich shale and light, carbonate rich shales (Bloxson, 2017),
potentially caused by local variations in sea level as a result of tectonic controls
or influx of storm debris from the nearby carbonate platforms. These pockets or
depocenters are generally poorly understood, both their causes and distribution
in the region (Hickman, et al., 2015; Smith, 2015).
The depositional arrangement of grains, changes in the depositional
environment, and, to various degrees, diagenesis are largely responsible for
changes in the physical properties of sedimentary strata. For example, a basin
being loaded by deposition can lead to a decrease in porosity due to mechanical
compaction and facilitate diagenesis. In contrast, an organic rich sediment that is
not buried in a timely manner may lose total organic content (TOC) to the carbon
cycle before being sheltered by the deposition of another layer. When properly
sheltered, organic rich shales such as the Utica Shale are formed. Mapping the
distribution of these organic rich shales shows that dark shale deposition is a part
of the sedimentary cycle associated with orogenies and the formation of the
adjacent foreland basins (Ettensohn and Lierman, 2012). Tectonic loading during
an orogeny results in deformation of the lithosphere and the adjacent basin
deepening due the down-warping (Ettensohn and Lierman, 2012). The adjacent
peripheral bulge rebounds in response to the lithosphere deformation. This
3
deepening foreland basin allows for the accumulation of fine-grained sediments,
including organic rich source rocks, within the basin. Continued subsidence due
to a combination of tectonics and sediment loading allow for expansion of the
accommodation space for continued sediment accumulation and burial of already
deposited, organic-rich fine-grained sediments (Ettensohn and Lierman, 2012). In
contrast, relaxing of a basin often leads to uplift and thinning of a section by the
removal of previously deposited section by erosion as uplift progresses.
Reactivation of dormant faults can be another process that causes uplift and
subsidence, which can also affect deposition by allowing more accumulation in
subsiding sides and removal of sediments and refusal of accumulation on
upthrown sides of a reactivated fault. These processes collectively fall under a
category termed far field tectonics, referring to the effects of large-scale tectonics
that can influence deposition in an area of interest that is some distance away
from the tectonic epicenter.
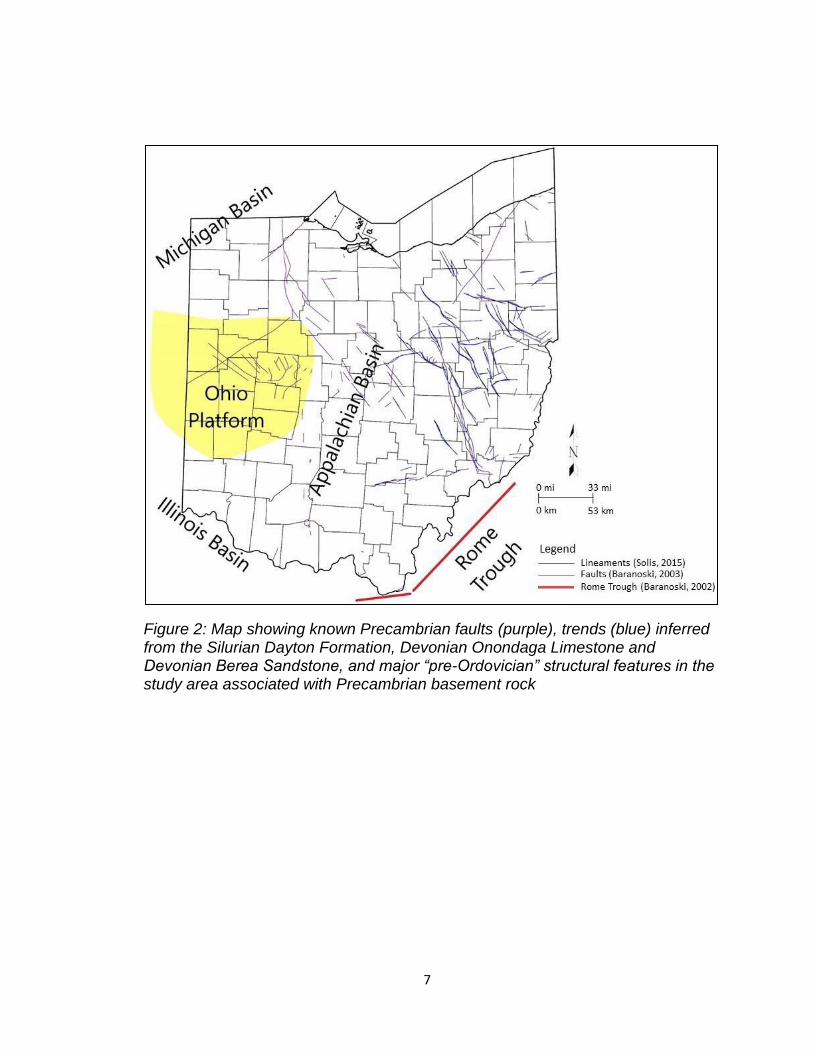
Ohio has long been known to be affected by far field tectonics, yet there
are relatively few known basement features within Ohio (Baranoski, 2013). Little
has changed since the original delineation map of Ohio’s Precambrian basement
(Bass, 1960), beyond new dating and provinces found within the state
(Baranoski, et al., 2009; Wickstrom, et al., 1985) and more detail adding to the
overall structural relief of the basement. Within Ohio, there are roughly 43 faults
or fault systems verified with seismic data across the state, along with two cross-
4
strike structural discontinuities in eastern Ohio (Cambridge and Pittsburgh-
Washington), and five miscellaneous structures that consist of impact structures,
rifting zones or anomalies that are not fully understood. Overall, these structures
are centered along the consortium for continental reflection profile (COCORP)
line, a public seismic dataset that runs in central Ohio from west to east, simply
because this is where data are present. Recently, Solis (2015) mapped the
eastern portion of the state in high detail for the Silurian Dayton Formation,
Devonian Onondaga Limestone, and Devonian Berea Sandstone. These maps
show disruptions in structure within these formations that correspond to the same
known faults in eastern Ohio, along with new potential structures across the state
that follow the same general fabrics of the known fault systems (Figure 2). This
suggests that there could be more faults or other types of structures previously
unknown across Ohio that most likely originate from the Precambrian Basement
and have been reactivated throughout time. Further detailed mapping of
Paleozoic strata could provide insight into the Precambrian structures, and how
they have reactivated over time to influence the Paleozoic strata.
Depositional trends of Utica Shale/Point Pleasant Play formations, Trenton
Limestone, and Black River Group were defined to determine if the Precambrian
basement and associated tectonics affected deposition of this mixed siliciclastic-
carbonate system. This was done by detailed mapping using well logs across
northeast Ohio to determine changes in structure and thickness for each of the
5
formations. Formation boundaries were determined for the Utica Shale, Point
Pleasant Formation, Trenton Limestone, and the Black River Group, and
structure maps were generated based on these four tops. Isopach thickness
maps were generated for the Utica Shale, Point Pleasant Formation, and Trenton
Limestone, as well as a combined thickness map for the Utica/Point Pleasant.
These maps were compared to regional faults/trends in the area of interest and
basement features in the state of Ohio.
6
Figure 1: Regional extent of the Utica Shale and Point Pleasant Formation. Modified from Bloxson (2017) and Hickman et al. (2015).
7
Figure 2: Map showing known Precambrian faults (purple), trends (blue) inferred from the Silurian Dayton Formation, Devonian Onondaga Limestone and Devonian Berea Sandstone, and major “pre-Ordovician” structural features in the study area associated with Precambrian basement rock
8
2. GEOLOGIC SETTING
The Ordovician Black River Group, Trenton Limestone, Point Pleasant
Formation, and Utica Shale within northeast Ohio represent a tectonically active
period, transitioning from warm-water carbonate platform to cool-water
carbonate platform, and finally tectonic loading and basin subsidence. This
system coincides with the Taconic Orogeny that occurred throughout the Middle
to Late Ordovician Period (Ettensohn and Lierman, 2012).
Prior to Middle-Late Ordovician deposition of the Black River Group, the
regional basin dynamics were extensional and passive (Patchen et al., 2006).
Basin dynamics changed during the Middle-Late Ordovician to a compressional
regime with the collision of the Taconic arc from the east (Patchen et al., 2006).
During this evolution, the regional setting transformed into a shallow water
carbonate ramp with epeiric seas transgressing over the area (Patchen et al.,
2006). This ramp dipped southeast to eastward, and extended from the Michigan
Basin and across the central Appalachian Basin (Patchen et al., 2006). The
carbonate ramp led to the formation of a warm, shallow, tropical depositional
environment that deposited the relatively uniform, shallow carbonate Black River
Group across the region. (Patchen et al., 2006). The deposited carbonates are
lithostratigraphically consistent across most of the Appalachian Basin region
9
(Patchen et al., 2006). During the time of Black River deposition, an elongated
depocenter formed which would later become characteristic of the Appalachian
Basin (Patchen et al., 2006).
During the Middle Ordovician, the Appalachian Basin continued to
evolve, and the more fossiliferous and coarser-grained Trenton Limestone
began deposition across the northwestern portion of the continent (Patchen et
al., 2006). Evolution included the formation of low-relief carbonate buildups that
define the Trenton Limestone (Patchen et al., 2006). A marine transgression
allowed for continued carbonate production across the region, consisting of
temperate marine fossiliferous carbonates with significant regional changes to
paleoclimate (Patchen et al., 2006). This formed a “ramp-like slope” that
extended from the Indiana/Michigan region to the Central Appalachian Basin.
The Black River ramp basin architecture remained during the earliest portion of
Trenton deposition until the Taconic orogeny began to increase in intensity
(Patchen et al., 2006). This change in orogenic intensity led to the formation of a
bulge and trough in the basin, and to the formation of new complex carbonate
platforms and sub-basins (Patchen et al., 2006). Increased volcanism during this
time led to the deposition of potassium bentonite beds that are found throughout
the region (Huff, 1983). The Millbrig bentonite bed is commonly used to
distinguish the end of Black River deposition and the beginning of Trenton
Limestone deposition on well logs, with a defining sharp decrease in neutron and
10
density porosity occurring with a sharp increase in gamma ray API units
(Patchen et al., 2006).
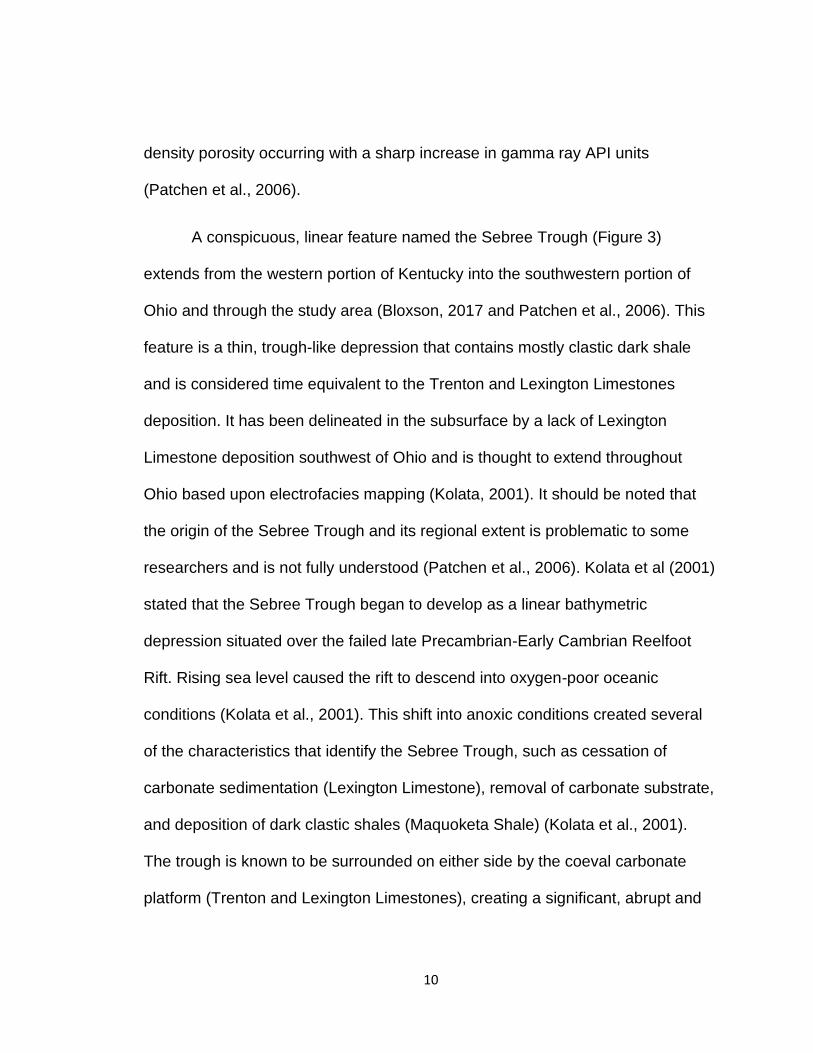
A conspicuous, linear feature named the Sebree Trough (Figure 3)
extends from the western portion of Kentucky into the southwestern portion of
Ohio and through the study area (Bloxson, 2017 and Patchen et al., 2006). This
feature is a thin, trough-like depression that contains mostly clastic dark shale
and is considered time equivalent to the Trenton and Lexington Limestones
deposition. It has been delineated in the subsurface by a lack of Lexington
Limestone deposition southwest of Ohio and is thought to extend throughout
Ohio based upon electrofacies mapping (Kolata, 2001). It should be noted that
the origin of the Sebree Trough and its regional extent is problematic to some
researchers and is not fully understood (Patchen et al., 2006). Kolata et al (2001)
stated that the Sebree Trough began to develop as a linear bathymetric
depression situated over the failed late Precambrian-Early Cambrian Reelfoot
Rift. Rising sea level caused the rift to descend into oxygen-poor oceanic
conditions (Kolata et al., 2001). This shift into anoxic conditions created several
of the characteristics that identify the Sebree Trough, such as cessation of
carbonate sedimentation (Lexington Limestone), removal of carbonate substrate,
and deposition of dark clastic shales (Maquoketa Shale) (Kolata et al., 2001).
The trough is known to be surrounded on either side by the coeval carbonate
platform (Trenton and Lexington Limestones), creating a significant, abrupt and
11
extensive change in lithofacies across this linear feature (Kolata et al.,2001).
After deposition of the cool-water carbonate platforms across the region,
there was an emergence of black and brown shales that marked a significant
change in paleogeography (Patchen et al., 2006). These black shales formed as
a result of clastic muds funneling into the depositional environment from volcanic
arcs of the Taconic Mountains to the east (Patchen et al., 2006). The previously
mentioned volcanic island arc system continued to migrate north through the
Late Ordovician and continued supplying clastic sediments that would drown the
carbonate platform in the Appalachian Basin (Patchen et al., 2006). These black
and brown clastics were interbedded with calcareous sediments in the newly
formed sub-basins to form the Point Pleasant Group and subsequently the Utica
Shale, while clean carbonate sediments continued to be deposited in the shallow
water carbonate platforms (Patchen et al., 2006). Further increasing intensity of
the Taconic orogeny during late Utica deposition caused an increase in
subsidence in the Appalachian Basin (Patchen et al., 2006). This increase in sea
level and/or subsidence caused the Utica Shale to begin depositing on the
previously mentioned shallow carbonate platforms as well (Patchen et al., 2006).
The increase in sea level and/or subsidence continued, leading to infilling of the
sub-basin region and complete drowning of the shallow water platforms (Patchen
et al., 2006).
12
Figure 3: Sebree Trough location. Interpreted extent of Sebree Trough shown in dashed red. Modified from Bloxson (2019) and Kolata (2001).
13
3. STRATIGRAPHY
The Black River Group is known to be a primarily brown to gray fine-
grained limestone with fossiliferous zones (Ives, 1960). The Black River Group
tends to be finer grained and contains fewer fossils that represent warm-water
deposition compared to the overlying Trenton Limestone, whose fossil content
represents cool-water deposition across the platform (Ives, 1960). The trace
amount of fossils present in the Black River Group include brachiopods, crinoids,
trilobites, gastropods, and bryzoans (Patchen et al., 2006). The basal unit of the
Black River Group is described as a green to gray calcareous shale transitional
unit, which contains sandy and pyritic intervals and localized lenses of dolomite
or limestone (Ives, 1960). The Group consists of the upper Black River
Limestone member and lower Gull River Limestone member, however these
members are grouped together for the purpose of this study, as the Point
Pleasant Formation and Utica Shale are the main formations of interest (Shafer
et al., 1994). On geophysical logs, the contact between the Black River Group
and Trenton Limestone is often determined by the presence of potassium
bentonite beds (Patchen et al., 2006). The most commonly used potassium
bentonite bed is the Millbrig bed found at the top of the Black River Group and
marks the change from the less fossiliferous mudstone lithology of the Black
14
River Group to the more fossiliferous, coarser grained packstone lithology of the
Trenton Limestone (Patchen et al., 2006). Burrows and stylolites are
commonplace in the mudstones of the Black River Group (Patchen et al., 2006).
The Black River Group is laterally equivalent to the High Bridge Group of
Kentucky and the Stones River Group of Tennessee (Patchen et al., 2006).
The Trenton Limestone overlies the Black River Group and is described
as primarily a brown to gray, fossiliferous packstone (Ives, 1960). The uppermost
portion of the Trenton Limestone consists of 5 to 10 feet of fractured dolomite
(Ives, 1960). The mineralogy is mainly carbonate, with most of the matrix
containing calcite with trace amounts of clay minerals in some Trenton
Limestone samples (Patchen et al., 2006). The basal unit of the Trenton
Limestone consists of a black carbonaceous/dolomitic shale bed roughly 3 feet in
thickness (Ives, 1960). The Trenton Limestone is laterally equivalent to the
Lexington Limestone of Kentucky (Patchen et al., 2006). Typical fossils include
brachiopods, crinoids, trilobites, gastropods, and bryzoans (Patchen et al., 2006).
The upper Trenton Limestone ends with a gradational contact into the overlying
Point Pleasant Formation in the study area of northeastern Ohio, however in
other areas the contact is sharp due to subaerial exposure or subsea processes
(Patchen et al., 2006).
15
The Point Pleasant Formation consists of interbedded shales, siltstones,
and limestones (Bloxson, 2017). It contains more overall carbonate content
compared to the Utica Shale, and decreases in overall carbonate content up
section (Bloxson, 2017; Smith, 2015). The calcareous shales of the Point
Pleasant Formation have been known to contain sparse fossils and are gray to
brown to black in color (Bloxson, 2017). The limestones beds of the Point
Pleasant Formation are described as gray grainstones (Bloxson, 2017). Typical
mineralogy of the shales of the Point Pleasant Formation consists of quartz, illite,
chlorite, muscovite, pyrite, micrite, and trace amounts of hematite and calcite
(Bloxson, 2017; Ohio Division of Geological Survey, 1976). The limestones of the
Point Pleasant Formation contain mostly calcite with sparse illite, chlorite, and
quartz (Bloxson, 2017; Ohio Division of Geological Survey, 1976; Smith, 2015).
The siltstones contain quartz, feldspar, and trace amounts of illite, chlorite, and
other mixed clay minerals (Bloxson, 2017; Ohio Division of Geological Survey,
1976; Ohio Division of Geological Survey, 1989a, b). Fossilized burrows,
brachiopods, trilobites, crinoids, and gastropods are common throughout
(Bloxson, 2017; Ohio Division of Geological Survey, 1989a, b; Ohio Division of
Geological Survey, 1976). The Point Pleasant Formation in southeastern Ohio
contains sufficient TOC (avg. 2.4 wt %), gas filled porosity (avg. 4.75%), and
proper mineralogy (normalized clay value of 32%) to be an economic
unconventional play (Brinkley, 2016). TOC content can reach upwards of 7% in
16
the Point Pleasant Formation across Ohio, however typically ranges between
2-4% (Eble, et al., 2015). Thickness of the play can reach 300 ft in Ohio, yet
thickens to over 700 ft in Pennsylvania (Patchen et al., 2006). In Pennsylvania,
TOC can reach upwards of 4.85%, although typically varies between 0.5-3.0%
(Ebel, et al., 2015). It should be noted that the Point Pleasant Formation and the
Utica Shale are often difficult to distinguish in core/electric log/outcrop, and
researchers often describe the two units as one system. The Point Pleasant
Formation is laterally equivalent to the Clays Ferry Formation of Kentucky, while
in New York it is referred to as the Indian Castle Shale (Hickman et al., 2015).
The Utica Shale, like the Point Pleasant Formation, has been described as
ranging from interbedded clastic and calcareous shales, to fully clastic siltstones,
to limestones (Bloxson, 2017). The Utica Shale is commonly black to brown in
color with sparse fossils throughout the calcareous portions of the formation
(Bloxson, 2017). Small concentrations of micrite have been found in the Utica
Shale, however the shale is mainly calcareous in mineralogy (Patchen et al.,
2006). Similar mineralogy and fossils are found between the Utica Shale and the
underlying Point Pleasant Formation. Typical mineralogy of the shales of the
Utica Shale consists of quartz, illite, chlorite, muscovite, pyrite, micrite, and trace
amounts of hematite and calcite (Bloxson, 2017; Ohio Division of Geological
Survey, 1989a, b; Ohio Division of Geological Survey, 1976). The limestones of
the Utica Shale contain mostly calcite with sparse illite, chlorite, and quartz
17
(Bloxson, 2017; Ohio Division of Geological Survey, 1989a, b; Ohio Division of
Geological Survey, 1976). The siltstones contain quartz, feldspar, and trace
amounts of illite, chlorite, and other mixed clay minerals (Bloxson, 2017; Smith,
2015, Ohio Division of Geological Survey, 1989a, b; Ohio Division of Geological
Survey, 1976). Fossilized burrows, brachiopods, trilobites, crinoids, and
gastropods are common fossils found in the formation Bloxson, 2017; Smith,
2015, Ohio Division of Geological Survey, 1989a, b; Ohio Division of Geological
Survey, 1976). Hummocky cross-stratification can be found in the Utica Shale in
the Appalachian Basin (ODNR Portage County Core). Across southeastern Ohio,
the Appalachian Basin Oil & Natural Gas Research Consortium and partners
determined that the Utica Shale contained insufficient TOC (< 1 wt. %), gas-filled
porosity (<2%), and mineralogy (normalized clay value of 49%) to be an
economic unconventional play (Brinkley, 2016). In other areas, such as New
York, the Utica shale contains properties to be an economic unconventional
reservoir (Eble, et al., 2015). A generalized stratigraphic column can be found in
Figure 4.
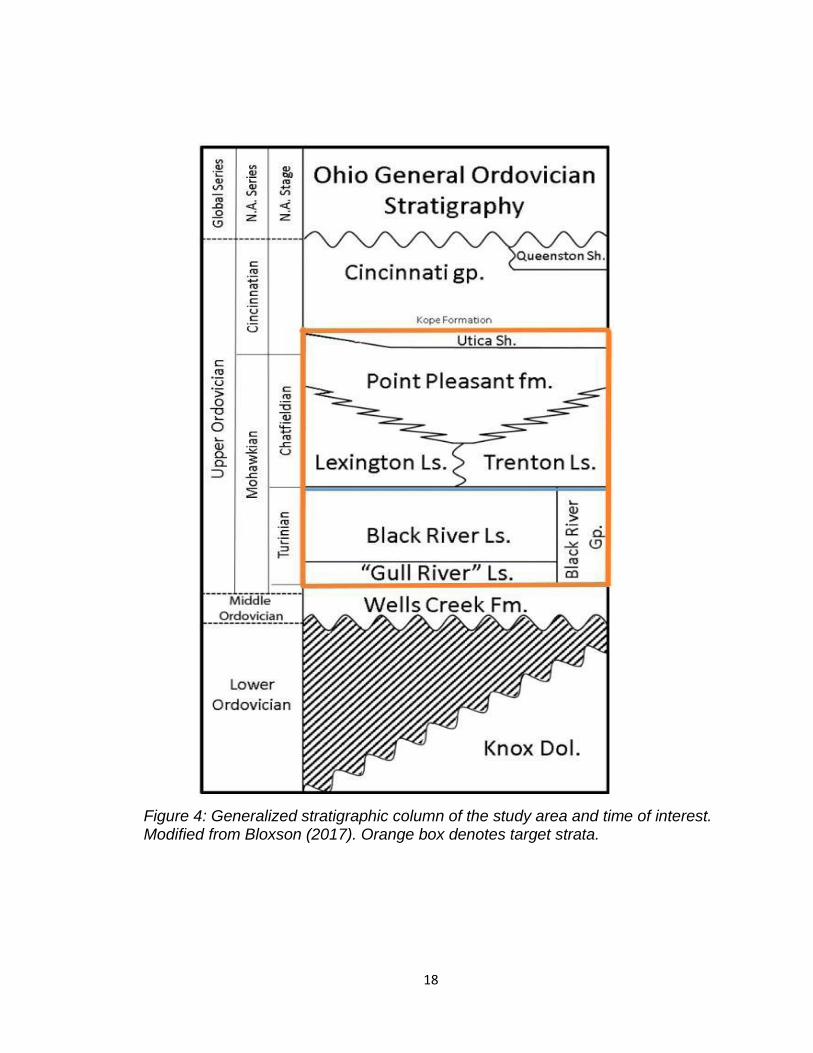
18
Figure 4: Generalized stratigraphic column of the study area and time of interest. Modified from Bloxson (2017). Orange box denotes target strata.
19
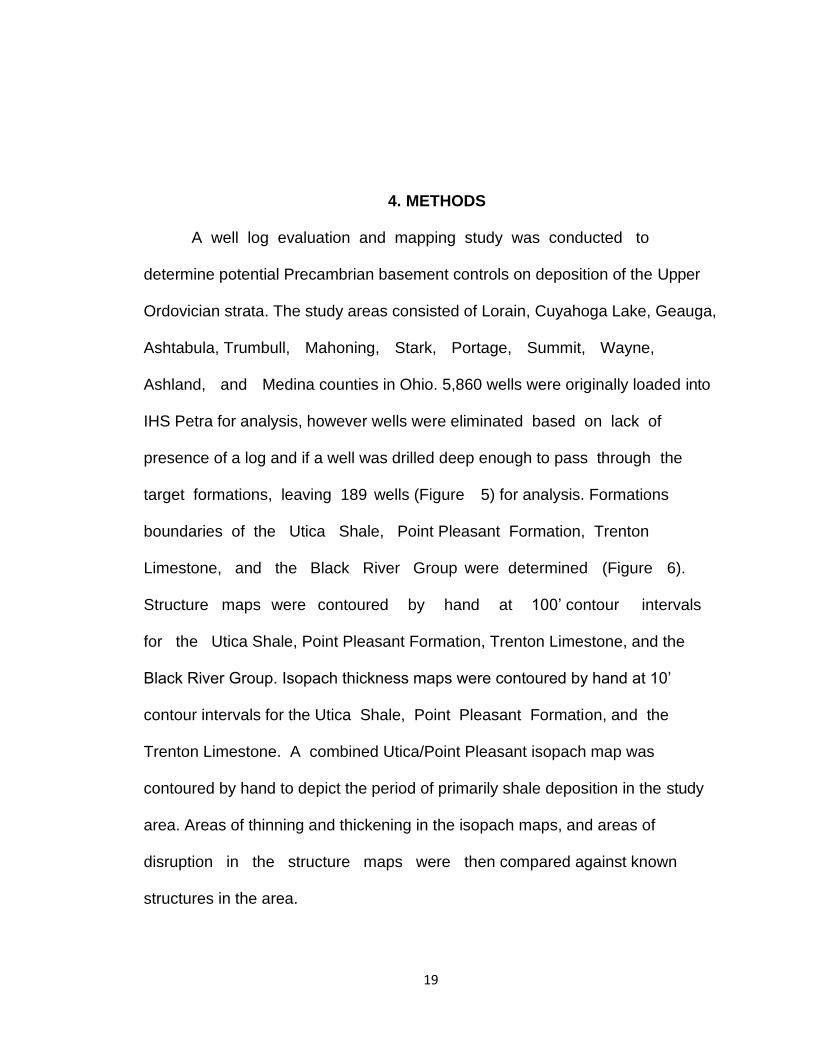
4. METHODS
A well log evaluation and mapping study was conducted to
determine potential Precambrian basement controls on deposition of the Upper
Ordovician strata. The study areas consisted of Lorain, Cuyahoga Lake, Geauga,
Ashtabula, Trumbull, Mahoning, Stark, Portage, Summit, Wayne,
Ashland, and Medina counties in Ohio. 5,860 wells were originally loaded into
IHS Petra for analysis, however wells were eliminated based on lack of
presence of a log and if a well was drilled deep enough to pass through the
target formations, leaving 189 wells (Figure 5) for analysis. Formations
boundaries of the Utica Shale, Point Pleasant Formation, Trenton
Limestone, and the Black River Group were determined (Figure 6).
Structure maps were contoured by hand at 100’ contour intervals
for the Utica Shale, Point Pleasant Formation, Trenton Limestone, and the
Black River Group. Isopach thickness maps were contoured by hand at 10’
contour intervals for the Utica Shale, Point Pleasant Formation, and the
Trenton Limestone. A combined Utica/Point Pleasant isopach map was
contoured by hand to depict the period of primarily shale deposition in the study
area. Areas of thinning and thickening in the isopach maps, and areas of
disruption in the structure maps were then compared against known
structures in the area.
20
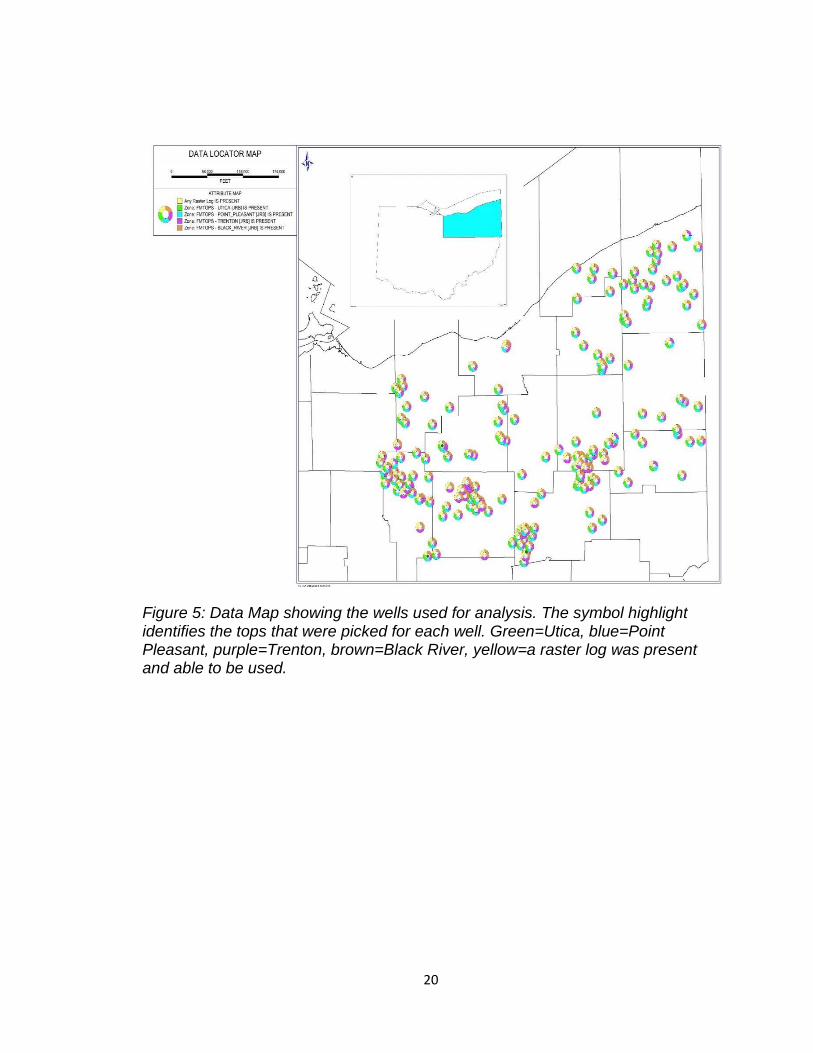
Figure 5: Data Map showing the wells used for analysis. The symbol highlight identifies the tops that were picked for each well. Green=Utica, blue=Point Pleasant, purple=Trenton, brown=Black River, yellow=a raster log was present and able to be used.
21
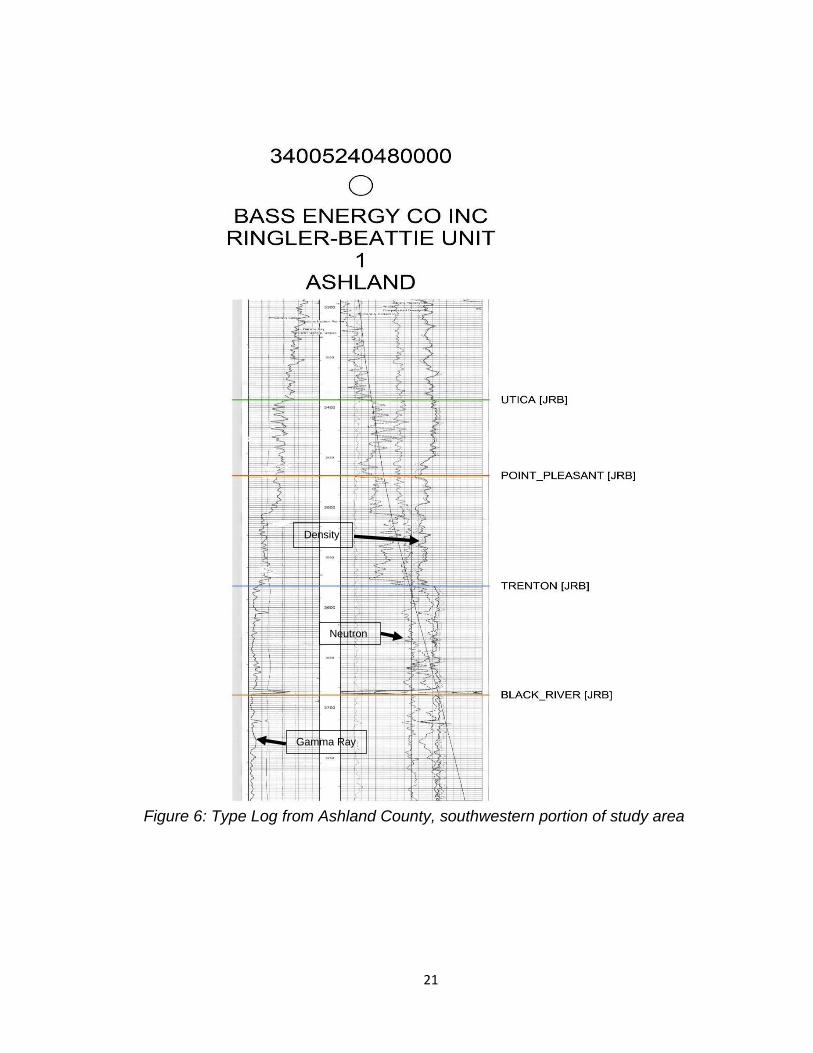
Figure 6: Type Log from Ashland County, southwestern portion of study area
Gamma Ray
Neutron
Density
22
5. RESULTS
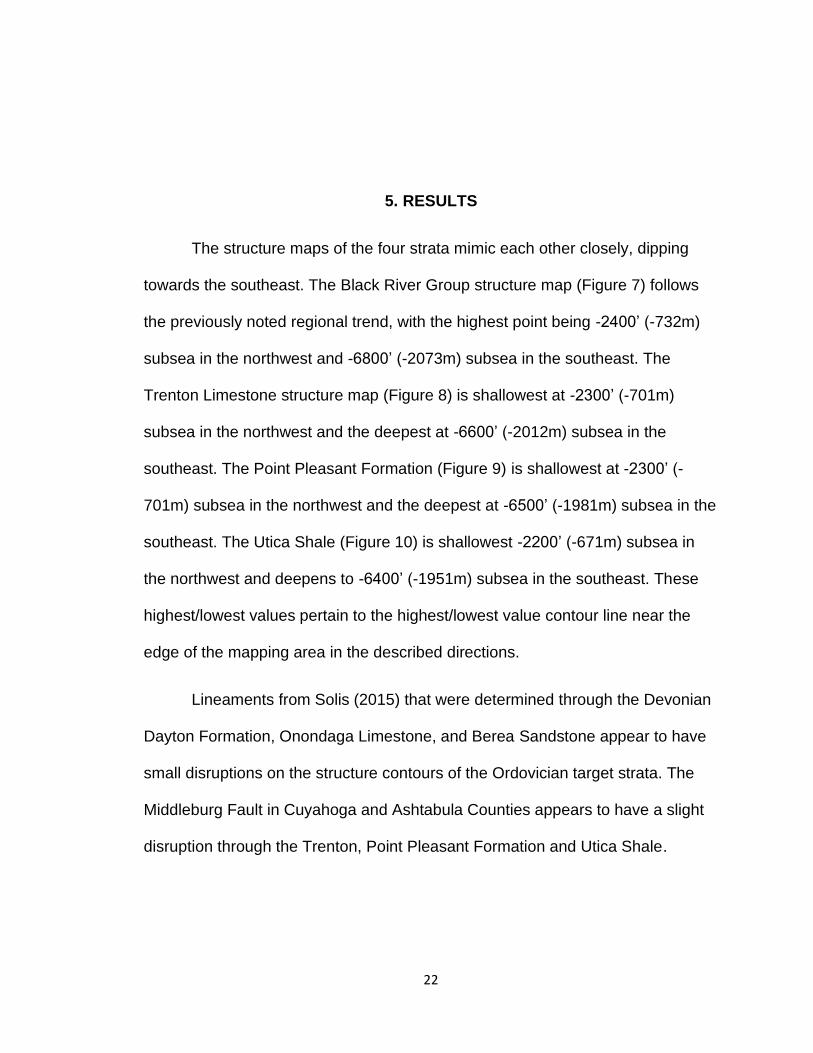
The structure maps of the four strata mimic each other closely, dipping
towards the southeast. The Black River Group structure map (Figure 7) follows
the previously noted regional trend, with the highest point being -2400’ (-732m)
subsea in the northwest and -6800’ (-2073m) subsea in the southeast. The
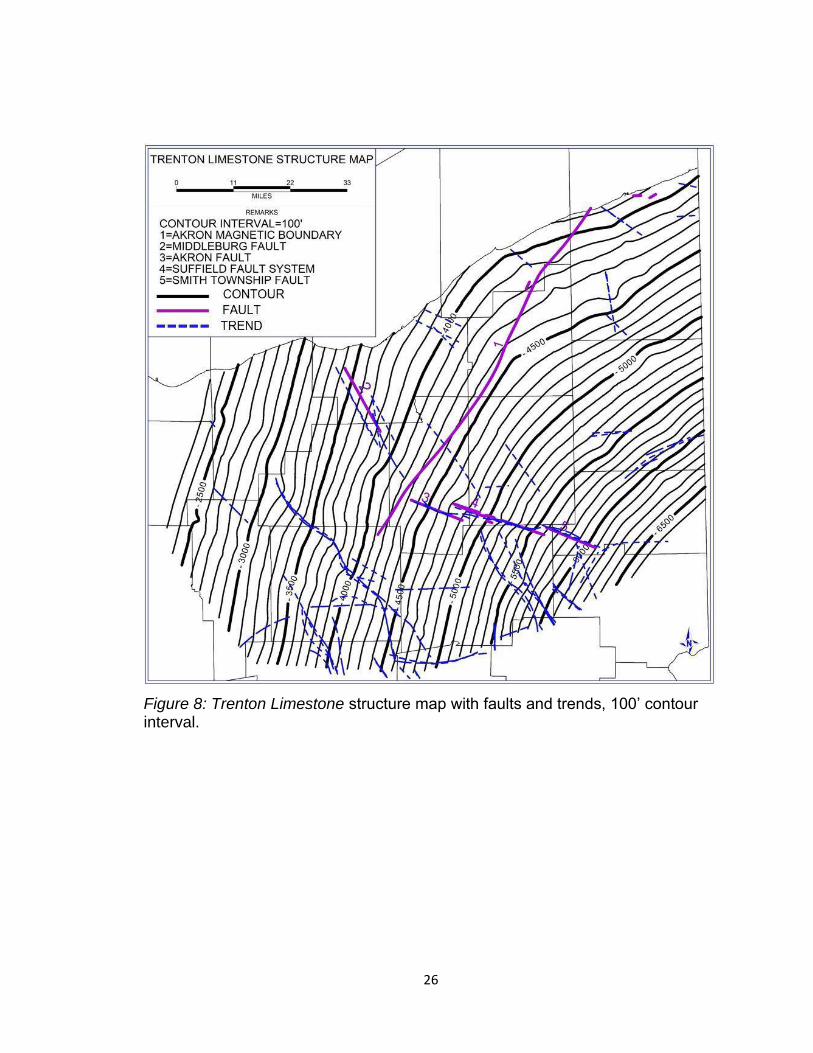
Trenton Limestone structure map (Figure 8) is shallowest at -2300’ (-701m)
subsea in the northwest and the deepest at -6600’ (-2012m) subsea in the
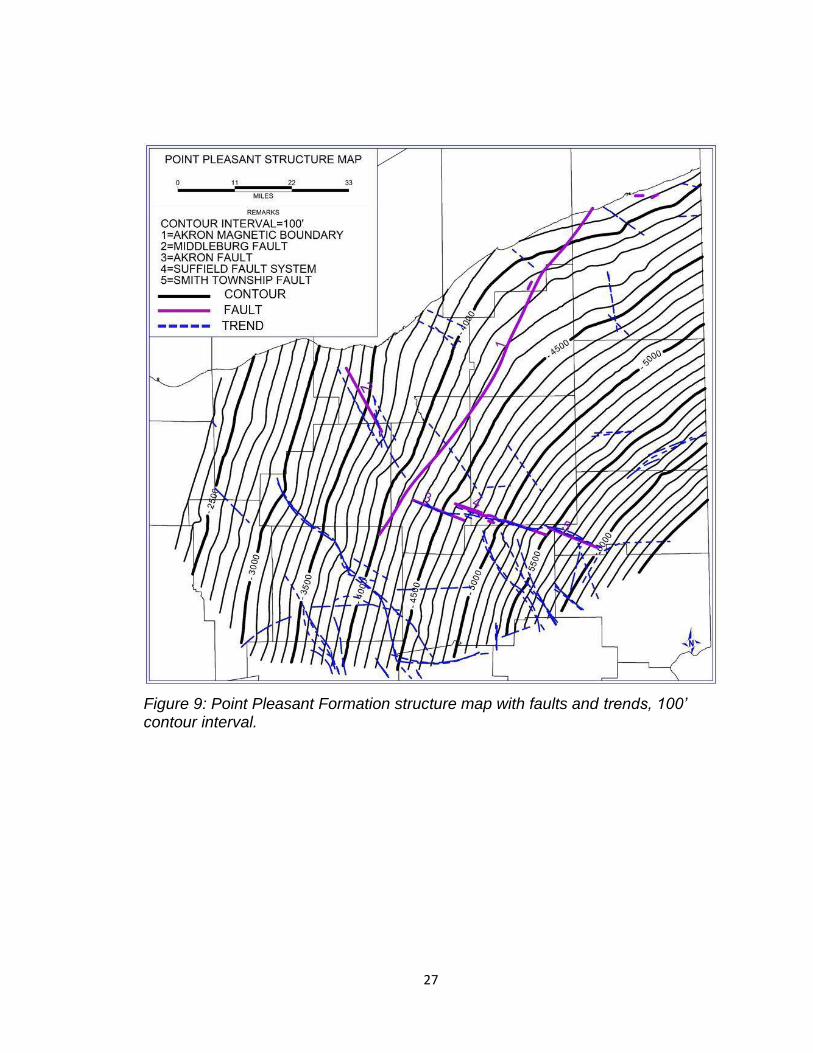
southeast. The Point Pleasant Formation (Figure 9) is shallowest at -2300’ (-
701m) subsea in the northwest and the deepest at -6500’ (-1981m) subsea in the
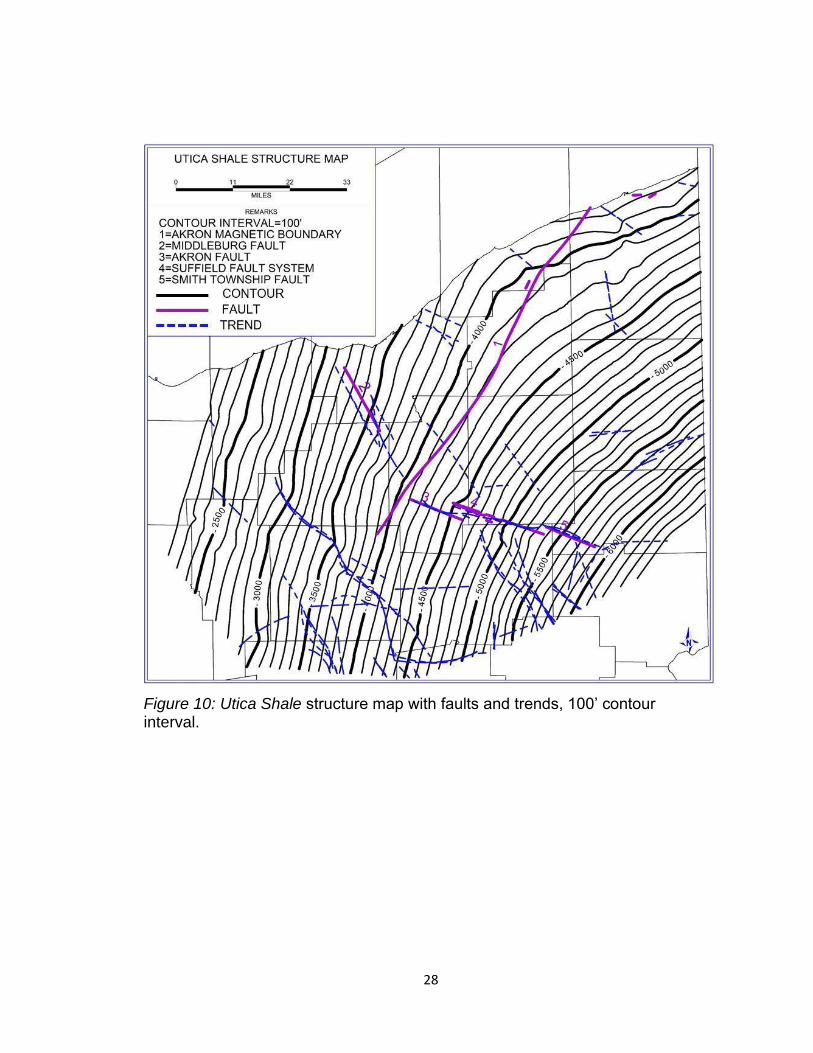
southeast. The Utica Shale (Figure 10) is shallowest -2200’ (-671m) subsea in
the northwest and deepens to -6400’ (-1951m) subsea in the southeast. These
highest/lowest values pertain to the highest/lowest value contour line near the
edge of the mapping area in the described directions.
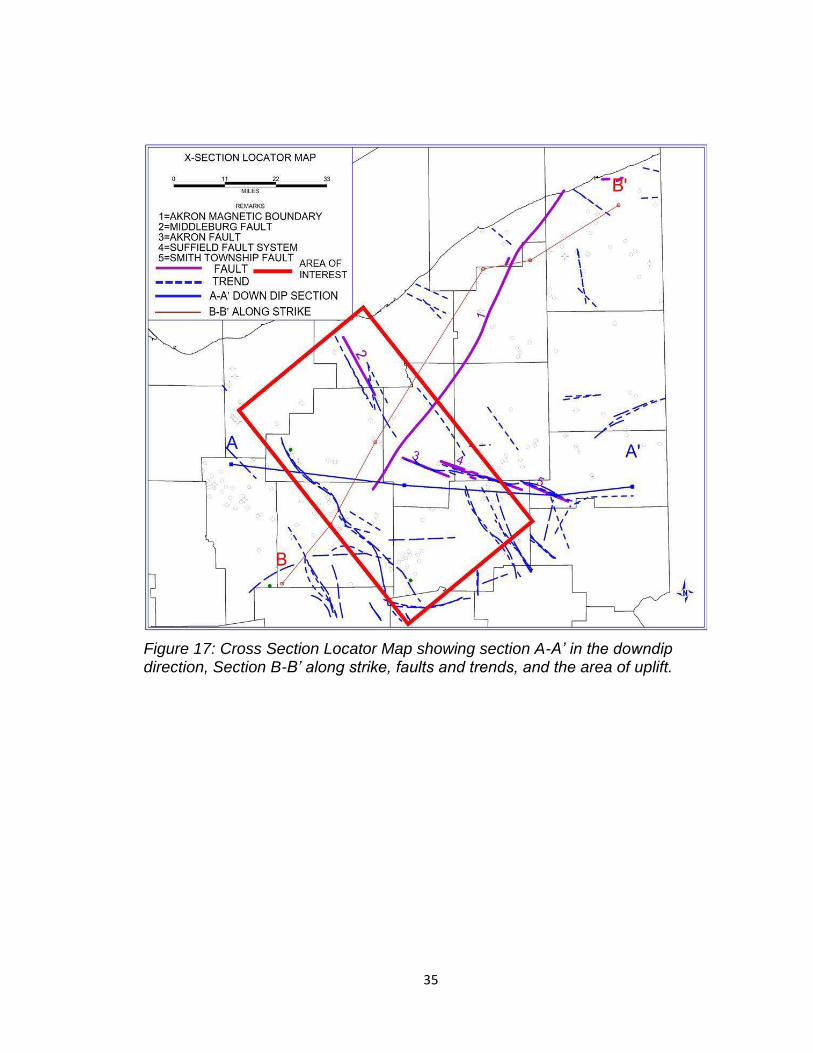
Lineaments from Solis (2015) that were determined through the Devonian
Dayton Formation, Onondaga Limestone, and Berea Sandstone appear to have
small disruptions on the structure contours of the Ordovician target strata. The
Middleburg Fault in Cuyahoga and Ashtabula Counties appears to have a slight
disruption through the Trenton, Point Pleasant Formation and Utica Shale.
23
The main lineament trending through Median and Wayne Counties also
influences the structure map, creating an apparent low-relief high. Finally, the
Akron-Suffield fault system in Summit, Portage and Stark Counties also appears
to have created offset in the area.
The generated isopach maps do not display the same general trend for
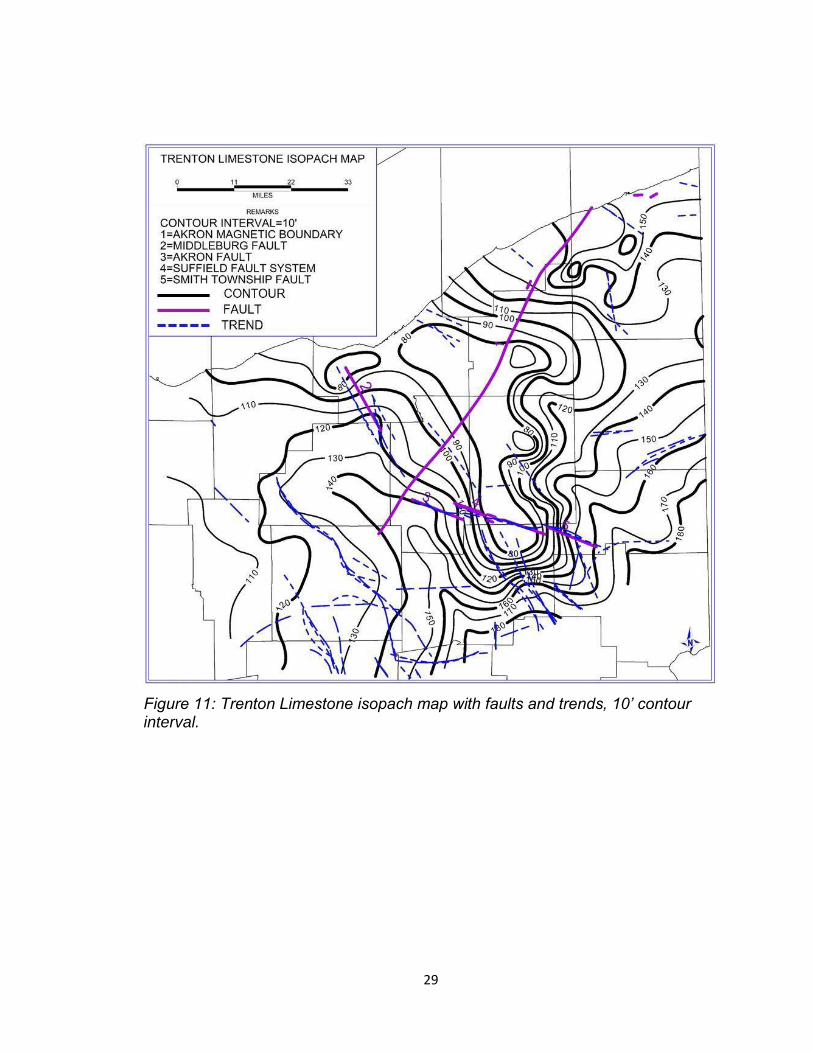
each target strata, contrary to the structure in the region. The Trenton isopach
map (Figure 11) shows an area of regional thinning near the center of the area of
interest, with a thinnest mapped value of 70’ (21m) and a thickest mapped value
of 160’ (49m) in the far northeastern corner of the state. The Point Pleasant
isopach map (Figure 12) shows the thickest portion to be 170’ (52m) thick near
the center of the area of interest, while the thinnest area is 40’ (12m) thick in the
far northeastern corner of the state. The Utica isopach map (Figure 13) shows an
area of regional thickening, with the thickest portion being 130’ (40m) thick near
the center of the mapping area, and the thinnest portion being 60’ (18m) thick in
the northwestern portion of the mapping area. The combined Utica/Point
Pleasant isopach map (Figure 14) shows a broad regional thickening near the
center of the mapping area, with the thickest portion being 260’ (79m) thick, and
the thinnest portion being 110’ (34m) in the northeastern portion of the mapping
area.
24
An area of thickening carbonate was noted in the Trenton Limestone
isopach map (Figure 11), with the area of thickening appearing to be bounded on
the northeastern and southwestern flank by the previously mentioned Devonian
lineaments. In the same general area, there is an area of rapid Point Pleasant
thickening in the northeastern corner that appears to trend along the Middleburg
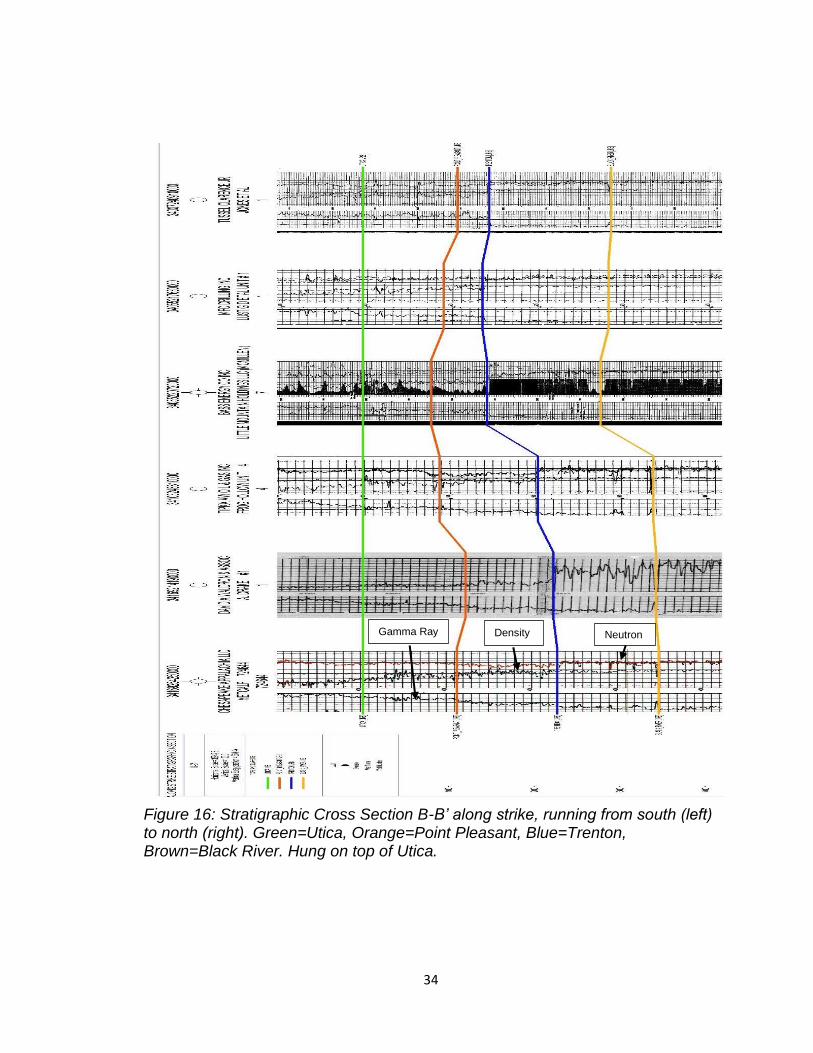
Fault. It was noted that the B-B’ along strike cross section (Figure 16) through
this area shows the thinning Trenton and thickening Point Pleasant, but also of
note is that the base of the Point Pleasant appears to be more carbonate rich in
this area of Point Pleasant thickening. In the same northeastern corner of the
Utica Shale isopach map, an area of rapid thinning was noted over the area of
rapid Point Pleasant thickening. In the overall described area bounded by
Devonian lineaments, thinning of siliciclastics in the Utica Shale isopach map
was noted, and this finding is corroborated with the B-B’ along strike cross
section showing overall Utica thinning through this region
(Figure 16).
25
Figure 7: Black River Group structure map with faults and trends, 100’ contour interval.
26
Figure 8: Trenton Limestone structure map with faults and trends, 100’ contour interval.
27
Figure 9: Point Pleasant Formation structure map with faults and trends, 100’ contour interval.
28
Figure 10: Utica Shale structure map with faults and trends, 100’ contour interval.
29
Figure 11: Trenton Limestone isopach map with faults and trends, 10’ contour interval.
30
Figure 12: Point Pleasant Formation isopach map with faults and trends, 10’ contour interval.
31
Figure 13: Utica Shale isopach map with faults and trends, 10’ contour interval.
32
Figure 14: Utica/Point Pleasant Combined isopach map with faults and trends, 10’ contour interval.
33
Figure 15: Stratigraphic Cross Section A-A’ in the down dip direction running
from east (left) to west (right). Green=Utica, Orange=Point Pleasant,
Blue=Trenton, Brown=Black River. Hung on top of Utica.
Gamma Ray Neutron Density
34
Figure 16: Stratigraphic Cross Section B-B’ along strike, running from south (left) to north (right). Green=Utica, Orange=Point Pleasant, Blue=Trenton, Brown=Black River. Hung on top of Utica.
Gamma Ray Neutron Density
35
Figure 17: Cross Section Locator Map showing section A-A’ in the downdip direction, Section B-B’ along strike, faults and trends, and the area of uplift.

36
6. DISCUSSION
Correlations between the Precambrian basement and the target strata
were able to be drawn through study of the generated structure and isopach
thickness maps. Though the (assumed) Precambrian aged faults are thought to
have largely ceased activity after the large-scale unconformity that formed
around Knox time, hypotheses and evidence have emerged suggesting far-field
tectonics originating from distanced basin features could have reactivated these
faults, causing them to affect the deposition of the target strata (Bloxson, 2017,
Solis, 2015, and Janssens, 1994). There are generally two orientations to the
faulting that exists in Ohio, a northwest/southeast trending set and a mostly
east/west trending set. The known Precambrian faults were determined largely
by seismic, which shows that the vast majority originate in the basement and
extend into the overlying strata. The lineaments mapped by Solis (2015) through
second derivative mapping of slope changes extend into the overlying Devonian
strata and are inferred to be Precambrian originated faults that were reactivated
through far field tectonics. Several of these lineaments match locations of known
Precambrian faults, with some now having suggested extended length. The vast
majority of the lineaments do not coincide with known faults or fault systems, yet
still match either of the two existing fabrics of faulting across the state. It is
37
assumed that these lineaments, or disruptions of a surface, are most likely faults
that extend from the Precambrian basement through the Devonian Berea
sandstone at the most recent, suggesting that the target strata of this study
should be affected by these lineaments as well. It is important to note that this
study was based on 189 wells across a large study area due to data availability
and structure was mapped at 100’ contour intervals; the effects of lineaments on
structure contours would likely be magnified with greater data density and a finer
contour resolution. In such relatively thin formations, it is thought that isopach
mapping would show influence of structure on strata (Janssens, 1994).
6.1. Lineaments and Structure
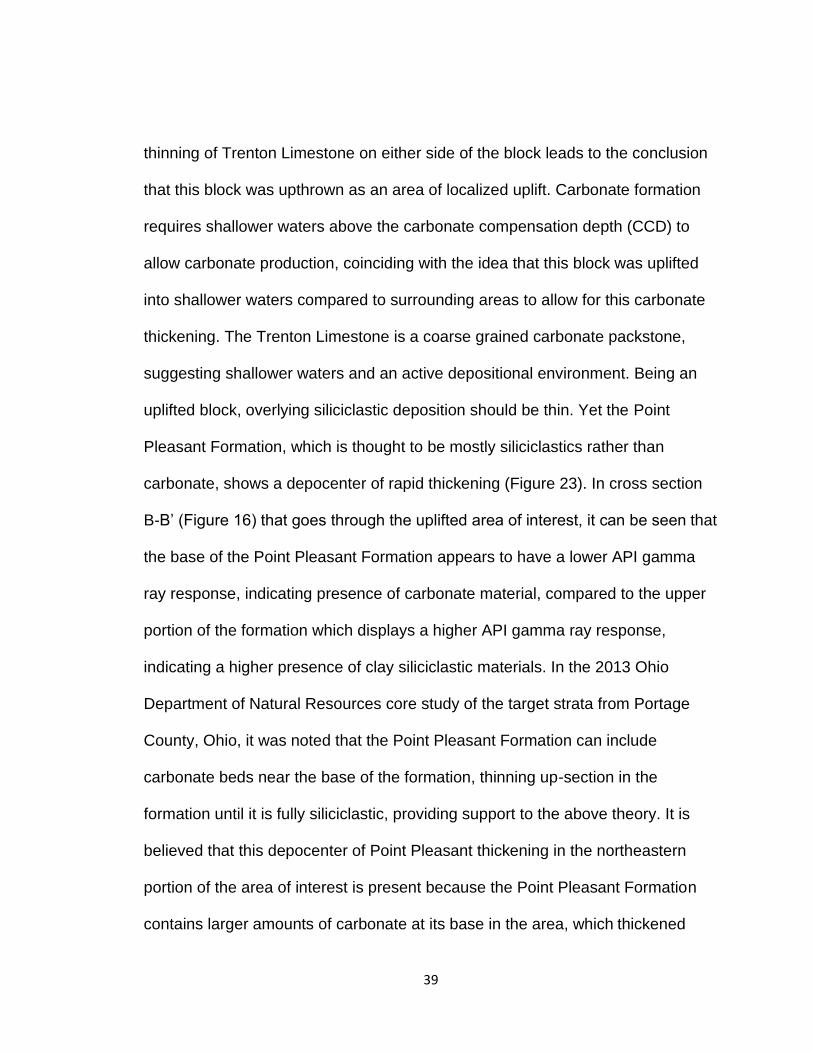
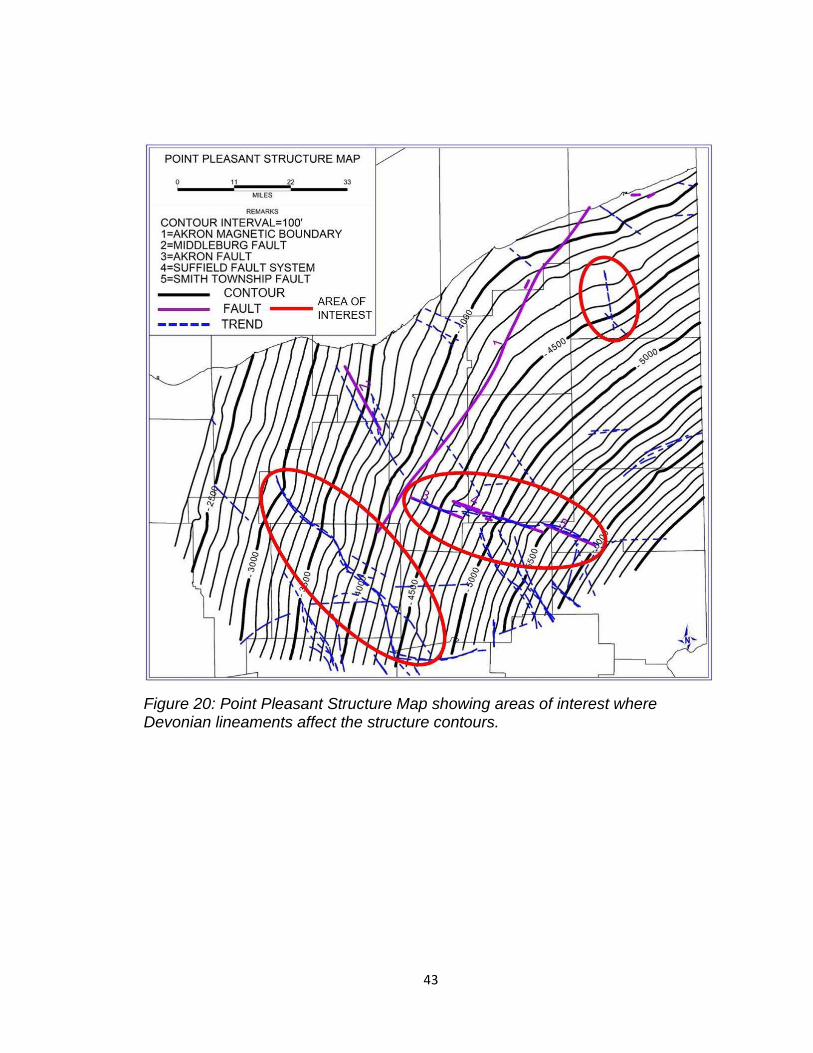
Several areas in northeast Ohio appear to have influence from Devonian
lineaments (Solis, 2015) on modern-day structure (Figures 18 – 21). Several
structural contours appear to bend and pull along strike of the lineaments,
Middleburg Fault, and the Akron-Suffield fault system in the Black River Group,
Trenton Limestone, Point Pleasant and Utica Shale structure maps. Baranoski
(2002) suggests that the Precambrian faults, of which the Devonian lineaments
are thought to be representing, began reactivation during early Cambrian time
and extended activity through Ordovician and Devonian periods into the
Permian period. Isopach maps generated in this study suggest that reactivation
of the Precambrian faults occurred pre-deposition or syn-deposition to affect the
38
thickening of target strata, while structure maps generated suggest that
reactivation occurred post-deposition of the target strata, giving support to
Baranoski’s theory.
6.2. Isopach maps and localized uplift
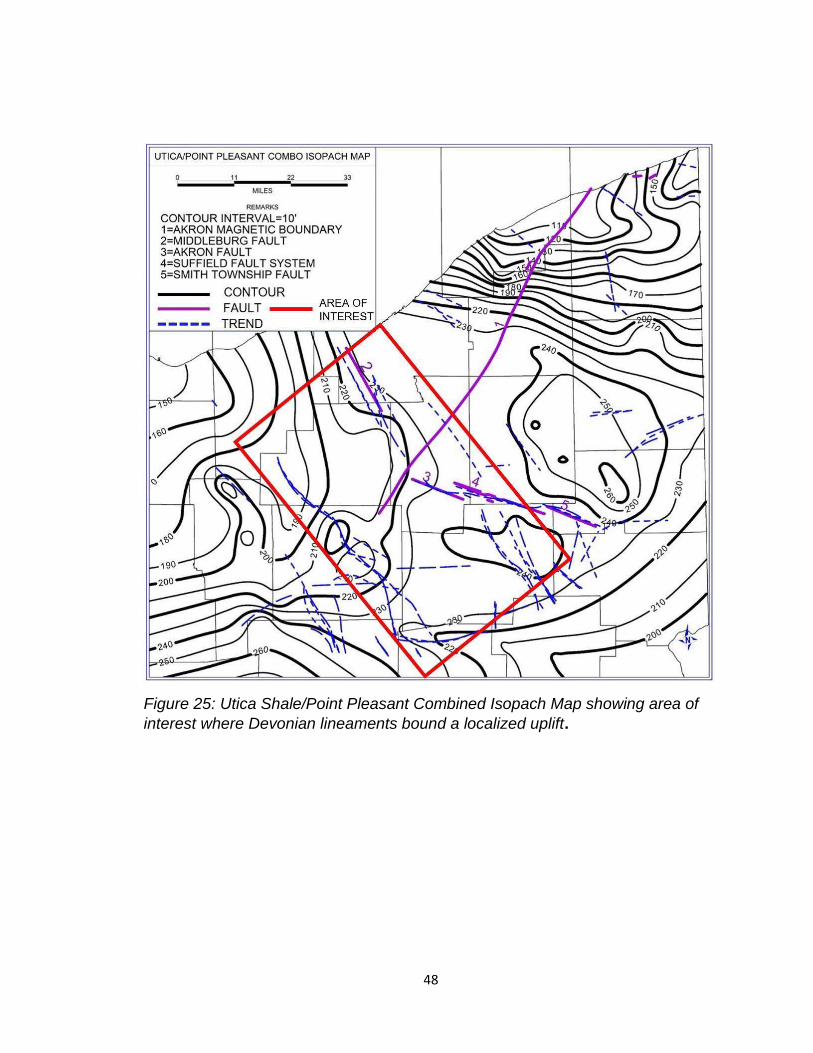
In the four isopach maps, there is an area with apparent thickening and
thinning in various strata bounded on three ends by Devonian lineaments
(Figures 22-25). The Trenton limestone (Figure 22) appears to experience
carbonate thickening in this area of interest. The Point Pleasant isopach shows a
depocenter of thickening in the northeastern corner of this area of interest while
the remainder of the formation in this area is somewhat static. Conversely, the
Utica Shale isopach shows an area of rapid thinning overlying the area of rapid
thickening noted in the Point Pleasant isopach, and the remainder of the Utica
isopach in the area of interest shows broad gradual thinning. These changes can
be better visualized in the B-B’ cross section of Figure 16, showing thickening of
the Trenton/lower Point Pleasant carbonate package and thinning of the Utica
across the described depocenter. It was concluded that the Devonian lineaments
bounding this area of interest represent faults, which originated from the
Precambrian basement, capable of throwing this “block” area upward or
downward, based on the differences in thinning and thickening across this area.
The broad carbonate thickening of the Trenton in this area combined with the
39
thinning of Trenton Limestone on either side of the block leads to the conclusion
that this block was upthrown as an area of localized uplift. Carbonate formation
requires shallower waters above the carbonate compensation depth (CCD) to
allow carbonate production, coinciding with the idea that this block was uplifted
into shallower waters compared to surrounding areas to allow for this carbonate
thickening. The Trenton Limestone is a coarse grained carbonate packstone,
suggesting shallower waters and an active depositional environment. Being an
uplifted block, overlying siliciclastic deposition should be thin. Yet the Point
Pleasant Formation, which is thought to be mostly siliciclastics rather than
carbonate, shows a depocenter of rapid thickening (Figure 23). In cross section
B-B’ (Figure 16) that goes through the uplifted area of interest, it can be seen that
the base of the Point Pleasant Formation appears to have a lower API gamma
ray response, indicating presence of carbonate material, compared to the upper
portion of the formation which displays a higher API gamma ray response,
indicating a higher presence of clay siliciclastic materials. In the 2013 Ohio
Department of Natural Resources core study of the target strata from Portage
County, Ohio, it was noted that the Point Pleasant Formation can include
carbonate beds near the base of the formation, thinning up-section in the
formation until it is fully siliciclastic, providing support to the above theory. It is
believed that this depocenter of Point Pleasant thickening in the northeastern
portion of the area of interest is present because the Point Pleasant Formation
contains larger amounts of carbonate at its base in the area, which thickened
40
due to the uplift that was present as Trenton deposition ceased and Point
Pleasant deposition began. The Utica Shale isopach (Figure 24) corroborates
this theory, with a general thinning across the area of interest and rapid thinning
coinciding with the area of rapid Point Pleasant thickening. The thinning in the
Utica Shale in this area is also easily viewed in cross section B-B’ (Figure 16). As
Point Pleasant deposition ceased and Utica Shale deposition began, it is inferred
that this localized uplift was still present, with thick carbonate deposition filling the
block. This left area for only a thin layer of Utica Shale to be deposited across the
block, with thicker Utica Shale depositing on either side of the uplifted block. The
combined Utica Shale/Point Pleasant isopach map (Figure 25) appears to
smooth out the inverse depocenters shown in the northeastern corner of the
Utica Shale and Point Pleasant isopach maps, along with smoothing out the
broad gradual thinning of the Utica and thickening of the Point Pleasant in the
remainder of the uplifted area of interest. The remaining portions of the study
area display typical behavior expected with general sea level changes stemming
from the overall basin orogeny.
41
Figure 18: Black River Group Structure Map showing areas of interest where Devonian lineaments affect the structure contours.

42
Figure 19: Trenton Limestone Structure Map showing areas of interest where Devonian lineaments affect the structure contours.
43
Figure 20: Point Pleasant Structure Map showing areas of interest where Devonian lineaments affect the structure contours.
44
Figure 21: Utica Shale Structure Map showing areas of interest where Devonian lineaments affect the structure contours.
45
Figure 22: Trenton Limestone Isopach Map showing area of interest where Devonian lineaments bound a localized uplift.
46
Figure 23: Point Pleasant Isopach Map showing area of interest where Devonian lineaments bound a localized uplift.
47
Figure 24: Utica Shale Isopach Map showing area of interest where lineaments produced during Devonian time bound a localized uplift.
48
Figure 25: Utica Shale/Point Pleasant Combined Isopach Map showing area of
interest where Devonian lineaments bound a localized uplift.
49
7. CONCLUSIONS
Overall, several Precambrian basement features appear to have an effect
on the Ordovician Black River Group, Trenton Limestone, Point Pleasant
Formation, and Utica Shale during and after deposition. The primary
Precambrian features seen to affect deposition of the Ordovician target strata is
the Akron-Suffield Fault system and the Middleburg Fault that were reactivated
and originate from the Precambrian basement. Lineaments mapped by Solis
(2015) have disrupted structure within the formations as well. These lineaments
are inferred to be faults, however that cannot be fully concluded without the use
of seismic data, which is not easily accessible in the study area.
A study of the four Ordovician structure maps (Figures 18-21) generated
shows the Devonian lineaments having some effect on the contours, though a
finer contour resolution would enhance the ability to interpret the affect of these
subsurface features. The four isopach maps generated for the Ordovician strata
(Figures 22-25) revealed a localized uplift, bounded on three edges by Devonian
lineaments, which affected thickness of the target strata. The uplift created a
shallow water environment, which led to thicker carbonate production compared
to the regions outside of the uplift, specifically in the Trenton Limestone. The
Point Pleasant Formation, which is known to have carbonate layers near the
50
base of the formation, experienced a rapid thickening in the northeastern corner
of the localized uplift, interpreted to be an area that contains carbonate at the
base of the Point Pleasant Formation during favorable carbonate production
conditions. Inversely, the overlying Utica Shale experienced a rapid thinning
over the area of rapid Point Pleasant Formation thickening, and shows a broad
overall thinning of siliciclastic production atop the localized uplift. The combined
Point Pleasant/Utica Shale isopach map smooths out the rapid
thickening/thinning sequence and the overall broad thickening/ thinning of the
two formations along the localized uplift.
51
8. REFERENCES
Baranoski, Mark T., 2002, Structure Contour Map On the Precambrian
Unconformity Surface in Ohio and Related Basement Features: Columbus, Ohio Department of Natural Resources, Division of Geological Survey Map PG-23.
Baranoski, Mark T., 2013, Structure Contour Map on the Precambrian Unconformity Surface in Ohio and Related Basement Features (ver. 2.0): Columbus, Ohio Department of Natural Resources, Division of Geological Survey Map PG-23.
Bass, M., N., 1960, Grenville Boundary in Ohio: Journal of Geology, V 68, p. 673- 677.
Bloxson, Julie M., 2019, Far-Field Tectonic Controls on Deposition of the Ordovician Utica/Point Pleasant Play, Ohio Using Core Logging, Well Logging, and Multi-Variate Analysis.
Bloxson, Julie M., 2017, Mineralogical and Facies Variations Within the Utica Shale, Ohio Using Visible Derivative Spectroscopy, Principal Component Analysis, and Multivariate Clustering: https://etd.ohiolink.edu/pg_10?0::NO:10:P10_ACCESSION_NUM:case14986646 69872459
Brinkley, Scott A., 2016, Petroleum Geology of the Utica/Point Pleasant Play in Washington County, Ohio: http://thescholarship.ecu.edu/bitstream/handle/10342/5899/BRINKLEY- MASTERSTHESIS-2016.pdf?sequence=1&isAllowed=y
52
Eble, Cortland, Hickman, John, Harris, David, and Cooney, Michele, 2015, Source rock geochemistry, in Patchen, D.G. and Carter, K.M., eds., A geologic play book for Utica Shale Appalachian basin exploration, Final report of the Utica Shale Appalachian basin exploration consortium, p. 102-141, Available from: http://www.wvgs.wvnet.edu/utica.
Ettensohn, Frank R. and Lierman, R. Thomas, 2012, Large Scale Tectonic Controls on the Origin of Paleozoic Dark-shale Source-rock Basins: Examples from the Appalachian Foreland Basin, Eastern United States: https://www.researchgate.net/publication/286097243_Large- scale_tectonic_controls_on_the_origin_of_paleozoic_dark-shale_source- rock_Basins_Examples_from_the_Appalachian_foreland_Basin_Eastern_United _States
Hickman, John B., Eble, Cortland, Riley, Ronald A., et al., 2015, A Geologic Play Book for Utica Shale Appalachian Basin Exploration: http://www.wvgs.wvnet.edu/utica/playbook/docs/FINAL_UTICA_REPORT_07012 015.pdf
Huff, Warren D. Correlation of Middle Ordovician K-Bentonites Based on Chemical Fingerprinting. The Journal of Geology, vol. 91, no. 6, 1983, pp. 657–669. JSTOR, www.jstor.org/stable/30064714. Accessed 11 Sept. 2020.
Ives, Robert E., 1960, Trenton – Black River Formation Developments in Michigan: https://www.michigan.gov/documents/deq/GIMDL- GGTBR_302379_7.pdf
Janssens, A., Olds, J. (1994). Scarp Associated with Middleburg Fault in Hinckley Township, Medina County, Ohio. Ohio Geological Society.
Kolata, D., Huff, W., Bergstrom, S. (2001). The Ordovician Sebree Trough: An Oceanic Passage to the Midcontinent United States. Geological Society of America Bulletin, August 2001.
53
Lavoie, D., Rivard, C., Lefebvre, R., Séjourné, S., Thériault, R., Duchesne, M., Ahad, J., Wang, B., Benoit, N., and Lamontagne, C. (2014) The Utica Shale and gas play in southern Quebec: Geological and hydrogeological syntheses and methodological approaches to groundwater risk and evaluation. International Journal of Coal Geology 126, 77-91.
Ohio Division of Geological Survey (1976) Core Description for Core 3003 accessed at https://apps.ohiodnr.gov/Website/Geosurvey/core_pdf/C03003.pdf on Oct 28, 2019.
Ohio Division of Geological Survey (1989a) Core Description for Core 2984 accessed at https://apps.ohiodnr.gov/Website/Geosurvey/core_pdf/C02984.pdf on Oct 28, 2019.
Ohio Division of Geological Survey (1989b) Core Description for Core 2984 accessed at https://apps.ohiodnr.gov/Website/Geosurvey/core_pdf/C02982.pdf on Oct 28, 2019.
Ohio Division of Geological Survey (2013) Core Description for Core 6434 accessed on Oct 28,2019
Patchen, Douglas G., Hickman, John B., Harris, David C., et al., 2006, A Geologic Play Book for Trenton-Black River Appalachian Basin Exploration: http://www.wvgs.wvnet.edu/www/tbr/docs/41856R06.pdf
Ryder, R.T., 2008, Assessment of Appalachian basin oil and gas resources: Utica-Lower Paleozoic Total Petroleum System: U.S. Geological Survey Open-File Report 2008–1287, 29 p., available only online at https://pubs.usgs.gov/of/2008/1287.
54
Shafer, William E., McClish, Richard F., Baranoski, Mark, Durr, Carolyn,1994, Morrow County, Ohio “Oil Boom”; 1961-1967 and the Cambro-Ordovician Reservoir of Central Ohio. The Ohio Geological Survey Anthology.
Smith, Langhorne B., Jr., 2015, Core description, petrography, sedimentology, stratigraphy, TOC and depositional environment, in Patchen, D.G. and Carter, K.M., eds., A geologic play book for Utica Shale Appalachian basin exploration, Final report of the Utica Shale Appalachian basin exploration consortium, p. 49-73, Available from: http://www.wvgs.wvnet.edu/utica.
Solis, M. P., 2015, Structure Contour Maps on Top of the Silurian Dayton Formation, Devonian Onondaga Limestone, and Devonian Berea Sandstone in Eastern Ohio. Ohio Division of Geological Survey PG-5. Maps, scale 1:500,000.
Wickstrom, L., Botoman, G., and Stith, D., 1985, Report on a Continuously Cored Hole Drilled Into the Precambrian in Seneca County, Northwestern Ohio: Ohio Division of Geological Survey Information Circular 51.
Wickstrom, L.H., Gray, J.D. and Stieglitz, R.D. (1992) Stratigraphy, structure, and production history of the Trenton Limestone (Ordovician) and adjacent strata in 199 northwestern Ohio. Ohio Division of Geological Survey Report of Investigations, no. 143, 78 p.
55
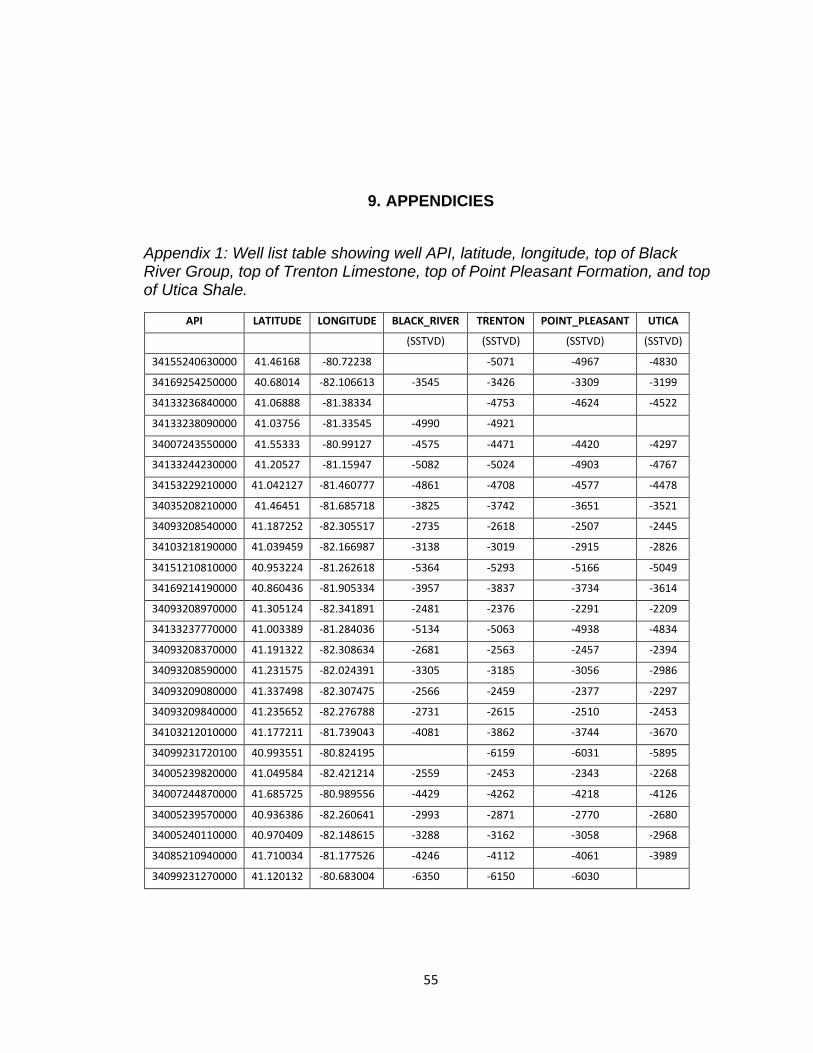
9. APPENDICIES
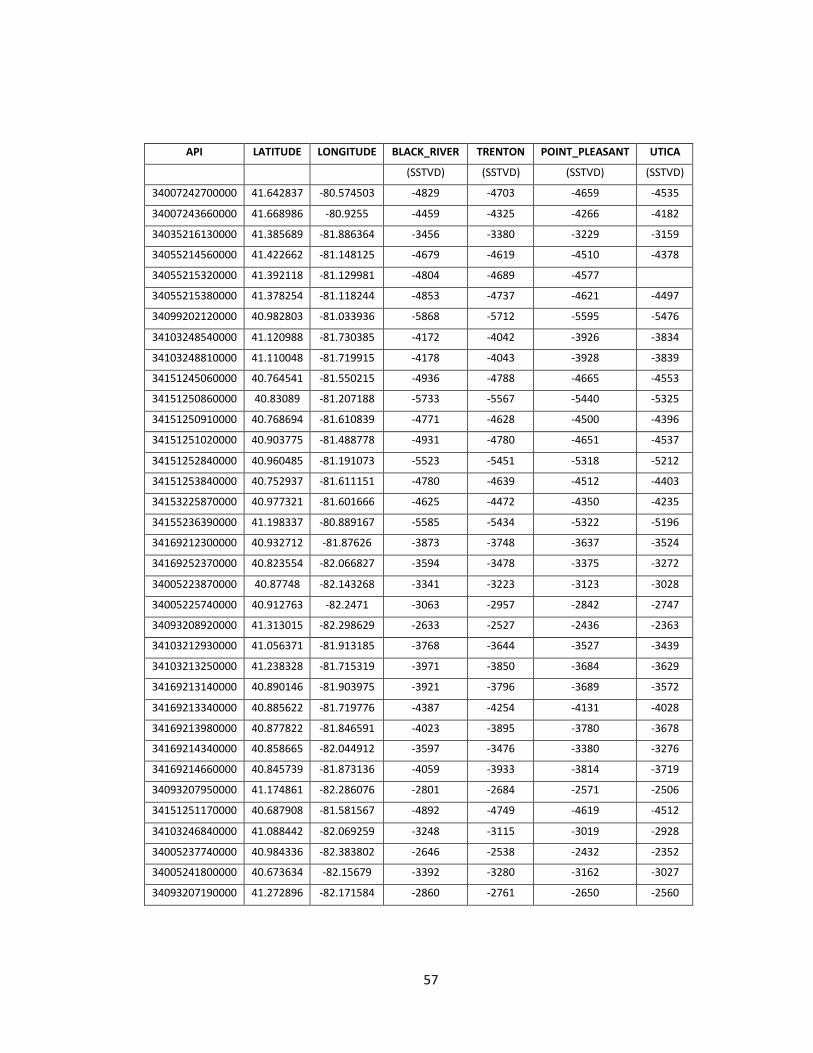
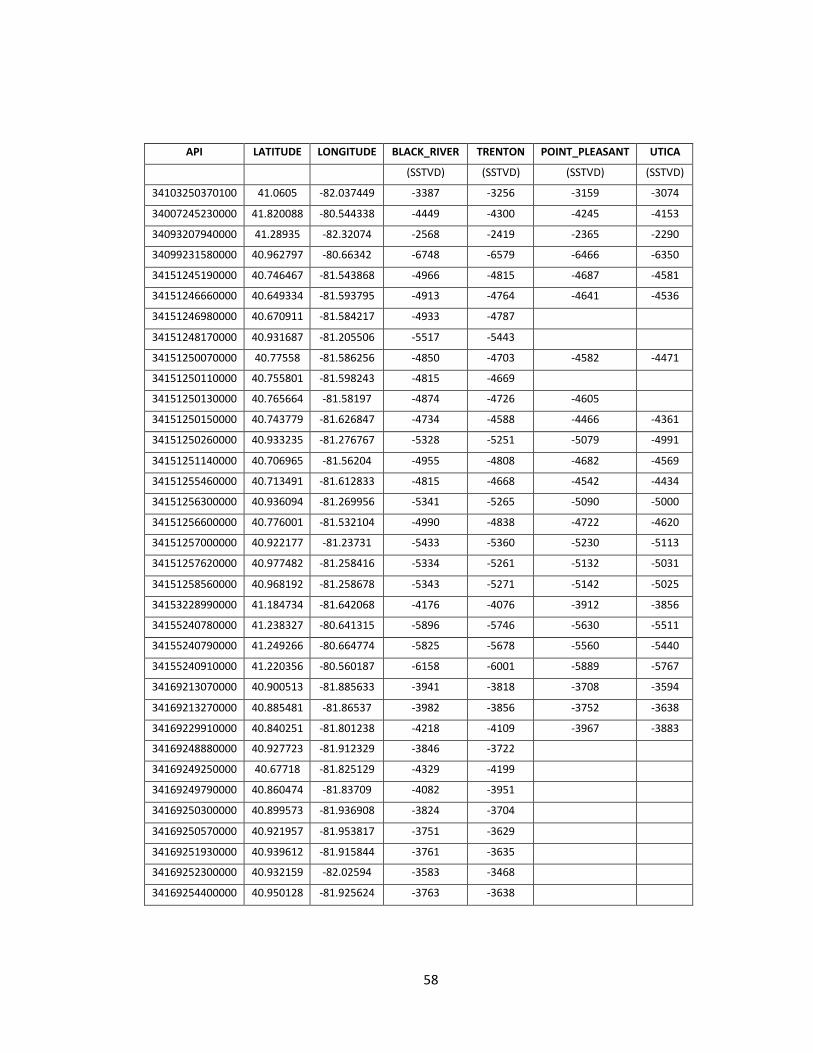
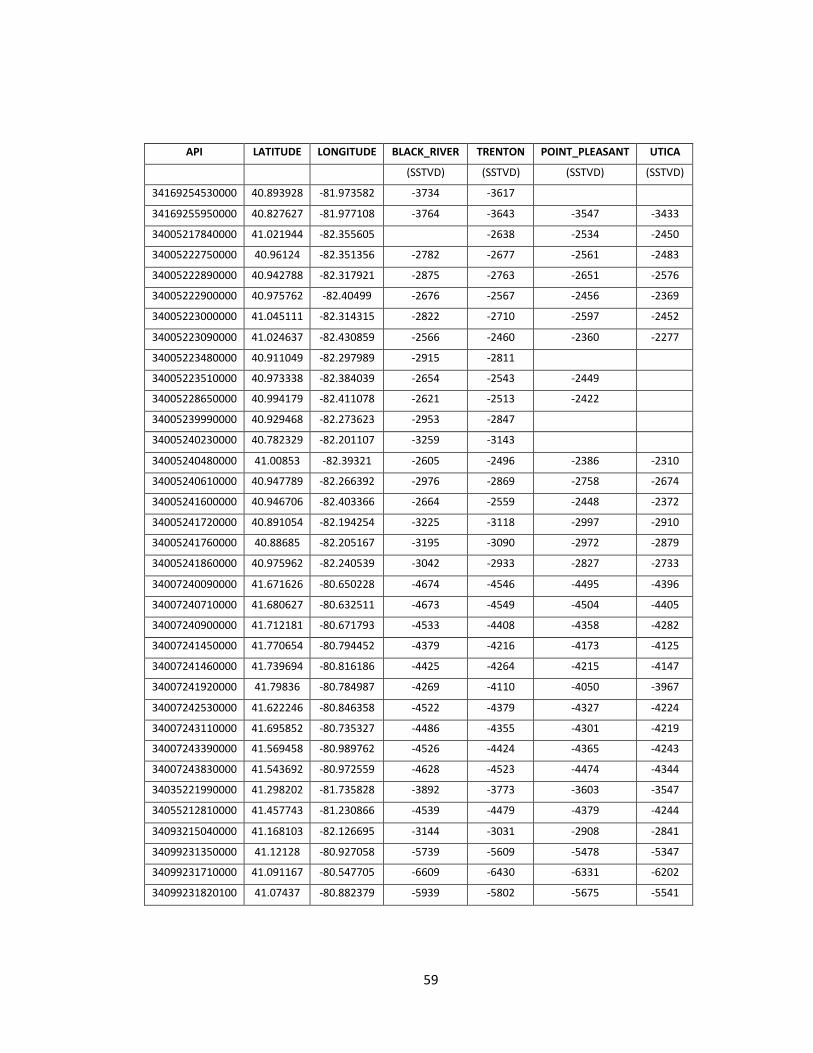
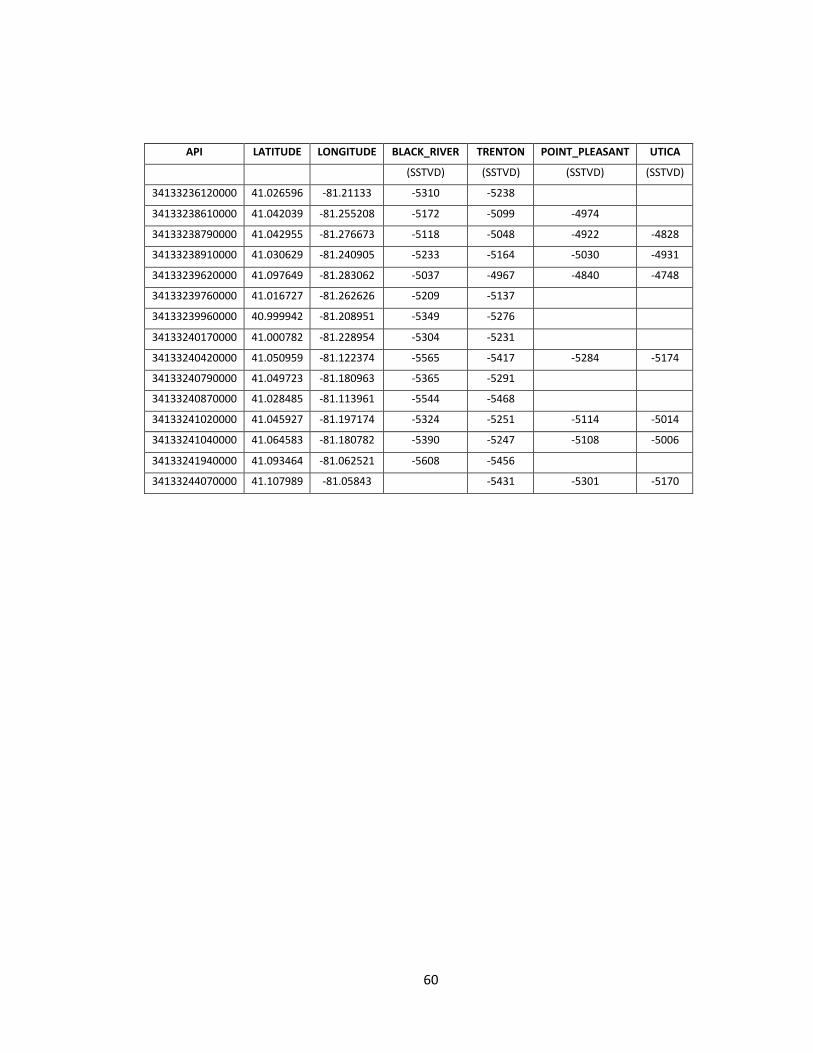
Appendix 1: Well list table showing well API, latitude, longitude, top of Black River Group, top of Trenton Limestone, top of Point Pleasant Formation, and top of Utica Shale.
API LATITUDE LONGITUDE BLACK_RIVER TRENTON POINT_PLEASANT UTICA
(SSTVD) (SSTVD) (SSTVD) (SSTVD)
34155240630000 41.46168 -80.72238 -5071 -4967 -4830
34169254250000 40.68014 -82.106613 -3545 -3426 -3309 -3199
34133236840000 41.06888 -81.38334 -4753 -4624 -4522
34133238090000 41.03756 -81.33545 -4990 -4921
34007243550000 41.55333 -80.99127 -4575 -4471 -4420 -4297
34133244230000 41.20527 -81.15947 -5082 -5024 -4903 -4767
34153229210000 41.042127 -81.460777 -4861 -4708 -4577 -4478
34035208210000 41.46451 -81.685718 -3825 -3742 -3651 -3521
34093208540000 41.187252 -82.305517 -2735 -2618 -2507 -2445
34103218190000 41.039459 -82.166987 -3138 -3019 -2915 -2826
34151210810000 40.953224 -81.262618 -5364 -5293 -5166 -5049
34169214190000 40.860436 -81.905334 -3957 -3837 -3734 -3614
34093208970000 41.305124 -82.341891 -2481 -2376 -2291 -2209
34133237770000 41.003389 -81.284036 -5134 -5063 -4938 -4834
34093208370000 41.191322 -82.308634 -2681 -2563 -2457 -2394
34093208590000 41.231575 -82.024391 -3305 -3185 -3056 -2986
34093209080000 41.337498 -82.307475 -2566 -2459 -2377 -2297
34093209840000 41.235652 -82.276788 -2731 -2615 -2510 -2453
34103212010000 41.177211 -81.739043 -4081 -3862 -3744 -3670
34099231720100 40.993551 -80.824195 -6159 -6031 -5895
34005239820000 41.049584 -82.421214 -2559 -2453 -2343 -2268
34007244870000 41.685725 -80.989556 -4429 -4262 -4218 -4126
34005239570000 40.936386 -82.260641 -2993 -2871 -2770 -2680
34005240110000 40.970409 -82.148615 -3288 -3162 -3058 -2968
34085210940000 41.710034 -81.177526 -4246 -4112 -4061 -3989
34099231270000 41.120132 -80.683004 -6350 -6150 -6030
56
API LATITUDE LONGITUDE BLACK_RIVER TRENTON POINT_PLEASANT UTICA
(SSTVD) (SSTVD) (SSTVD) (SSTVD)
3400523970000 41.061458 -82.220043 -3017 -2901 -2797 -2715
34099231570000 41.089891 -80.612405 -6465 -6297 -6187 -6066
34103248570000 41.083195 -82.060768 -3277 -3145 -3049 -2956
34155240430000 41.136155 -80.688827 -6125 -6020 -5851 -5725
34007242660000 41.603282 -80.854693 -4578 -4426 -4387 -4268
34007242740000 41.863438 -80.609169 -4092 -4035 -3922
34055221360000 41.40878 -81.076464 -4810 -4728 -4623 -4487
34055217630000 41.659356 -81.069851 -4433 -4286 -4241 -4146
34155236740000 41.381297 -80.969191 -4993 -4903 -4797 -4664
34007243380000 41.675107 -80.829825 -4415 -4350 -4234 -4140
34055220720000 41.63484 -81.265552 -4288 -4155 -4090 -4010
34085210500000 41.727289 -81.053342 -4220 -4088 -4041 -3961
34099227490000 40.940461 -80.980226 -6086 -5924 -5813 -5692
34103249010000 41.104426 -81.694652 -4225 -4090 -3977 -3886
34007245250000 41.527244 -80.530431 -5212 -5094 -5022 -4920
34007245420000 41.602245 -80.617002 -4889 -4754 -4718 -4602
34151257740000 40.801884 -81.13347 -6055 -5887 -5755 -5645
34055203390000 41.507815 -81.27764 -4438 -4355 -4258 -4131
34085202800000 41.745878 -81.162288 -4147 -4015 -3970 -3902
34085206610000 41.749224 -81.26689 -4109 -3974 -3935 -3869
34155236700000 41.184746 -80.777184 -5879 -5720 -5611 -5481
34005217620000 40.723555 -82.129113 -3459 -3326 -3225 -3115
34093209480000 41.092632 -82.330907 -2735 -2620
34103212850000 41.222423 -81.701806 -4024 -3909 -3766 -3708
34103248560000 41.051341 -81.886572 -3851 -3724 -3602 -3517
34151250160000 40.729934 -81.593579 -4827 -4683 -4557 -4449
34151250680000 40.7726 -81.193051 -5927 -5757 -5627 -5519
34169217650000 40.72118 -81.660613 -4685 -4544 -4415 -4307
34035216730000 41.456534 -81.690151 -3829 -3747 -3609
34055215340000 41.365029 -81.125627 -4870 -4750 -4632 -4510
34005229250000 40.920593 -82.332348 -2892 -2775 -2674 -2594
34007201910000 41.699164 -80.937046 -4416 -4286 -4229 -4158
34007239090000 41.683744 -80.873356 -4471 -4333 -4268 -4187
34007241800000 41.805408 -80.82612 -4166 -4038 -3985 -3875
34007241810000 41.83067 -80.790939 -4188 -4035 -3998 -3914
57
API LATITUDE LONGITUDE BLACK_RIVER TRENTON POINT_PLEASANT UTICA
(SSTVD) (SSTVD) (SSTVD) (SSTVD)
34007242700000 41.642837 -80.574503 -4829 -4703 -4659 -4535
34007243660000 41.668986 -80.9255 -4459 -4325 -4266 -4182
34035216130000 41.385689 -81.886364 -3456 -3380 -3229 -3159
34055214560000 41.422662 -81.148125 -4679 -4619 -4510 -4378
34055215320000 41.392118 -81.129981 -4804 -4689 -4577
34055215380000 41.378254 -81.118244 -4853 -4737 -4621 -4497
34099202120000 40.982803 -81.033936 -5868 -5712 -5595 -5476
34103248540000 41.120988 -81.730385 -4172 -4042 -3926 -3834
34103248810000 41.110048 -81.719915 -4178 -4043 -3928 -3839
34151245060000 40.764541 -81.550215 -4936 -4788 -4665 -4553
34151250860000 40.83089 -81.207188 -5733 -5567 -5440 -5325
34151250910000 40.768694 -81.610839 -4771 -4628 -4500 -4396
34151251020000 40.903775 -81.488778 -4931 -4780 -4651 -4537
34151252840000 40.960485 -81.191073 -5523 -5451 -5318 -5212
34151253840000 40.752937 -81.611151 -4780 -4639 -4512 -4403
34153225870000 40.977321 -81.601666 -4625 -4472 -4350 -4235
34155236390000 41.198337 -80.889167 -5585 -5434 -5322 -5196
34169212300000 40.932712 -81.87626 -3873 -3748 -3637 -3524
34169252370000 40.823554 -82.066827 -3594 -3478 -3375 -3272
34005223870000 40.87748 -82.143268 -3341 -3223 -3123 -3028
34005225740000 40.912763 -82.2471 -3063 -2957 -2842 -2747
34093208920000 41.313015 -82.298629 -2633 -2527 -2436 -2363
34103212930000 41.056371 -81.913185 -3768 -3644 -3527 -3439
34103213250000 41.238328 -81.715319 -3971 -3850 -3684 -3629
34169213140000 40.890146 -81.903975 -3921 -3796 -3689 -3572
34169213340000 40.885622 -81.719776 -4387 -4254 -4131 -4028
34169213980000 40.877822 -81.846591 -4023 -3895 -3780 -3678
34169214340000 40.858665 -82.044912 -3597 -3476 -3380 -3276
34169214660000 40.845739 -81.873136 -4059 -3933 -3814 -3719
34093207950000 41.174861 -82.286076 -2801 -2684 -2571 -2506
34151251170000 40.687908 -81.581567 -4892 -4749 -4619 -4512
34103246840000 41.088442 -82.069259 -3248 -3115 -3019 -2928
34005237740000 40.984336 -82.383802 -2646 -2538 -2432 -2352
34005241800000 40.673634 -82.15679 -3392 -3280 -3162 -3027
34093207190000 41.272896 -82.171584 -2860 -2761 -2650 -2560
58
API LATITUDE LONGITUDE BLACK_RIVER TRENTON POINT_PLEASANT UTICA
(SSTVD) (SSTVD) (SSTVD) (SSTVD)
34103250370100 41.0605 -82.037449 -3387 -3256 -3159 -3074
34007245230000 41.820088 -80.544338 -4449 -4300 -4245 -4153
34093207940000 41.28935 -82.32074 -2568 -2419 -2365 -2290
34099231580000 40.962797 -80.66342 -6748 -6579 -6466 -6350
34151245190000 40.746467 -81.543868 -4966 -4815 -4687 -4581
34151246660000 40.649334 -81.593795 -4913 -4764 -4641 -4536
34151246980000 40.670911 -81.584217 -4933 -4787
34151248170000 40.931687 -81.205506 -5517 -5443
34151250070000 40.77558 -81.586256 -4850 -4703 -4582 -4471
34151250110000 40.755801 -81.598243 -4815 -4669
34151250130000 40.765664 -81.58197 -4874 -4726 -4605
34151250150000 40.743779 -81.626847 -4734 -4588 -4466 -4361
34151250260000 40.933235 -81.276767 -5328 -5251 -5079 -4991
34151251140000 40.706965 -81.56204 -4955 -4808 -4682 -4569
34151255460000 40.713491 -81.612833 -4815 -4668 -4542 -4434
34151256300000 40.936094 -81.269956 -5341 -5265 -5090 -5000
34151256600000 40.776001 -81.532104 -4990 -4838 -4722 -4620
34151257000000 40.922177 -81.23731 -5433 -5360 -5230 -5113
34151257620000 40.977482 -81.258416 -5334 -5261 -5132 -5031
34151258560000 40.968192 -81.258678 -5343 -5271 -5142 -5025
34153228990000 41.184734 -81.642068 -4176 -4076 -3912 -3856
34155240780000 41.238327 -80.641315 -5896 -5746 -5630 -5511
34155240790000 41.249266 -80.664774 -5825 -5678 -5560 -5440
34155240910000 41.220356 -80.560187 -6158 -6001 -5889 -5767
34169213070000 40.900513 -81.885633 -3941 -3818 -3708 -3594
34169213270000 40.885481 -81.86537 -3982 -3856 -3752 -3638
34169229910000 40.840251 -81.801238 -4218 -4109 -3967 -3883
34169248880000 40.927723 -81.912329 -3846 -3722
34169249250000 40.67718 -81.825129 -4329 -4199
34169249790000 40.860474 -81.83709 -4082 -3951
34169250300000 40.899573 -81.936908 -3824 -3704
34169250570000 40.921957 -81.953817 -3751 -3629
34169251930000 40.939612 -81.915844 -3761 -3635
34169252300000 40.932159 -82.02594 -3583 -3468
34169254400000 40.950128 -81.925624 -3763 -3638
59
API LATITUDE LONGITUDE BLACK_RIVER TRENTON POINT_PLEASANT UTICA
(SSTVD) (SSTVD) (SSTVD) (SSTVD)
34169254530000 40.893928 -81.973582 -3734 -3617
34169255950000 40.827627 -81.977108 -3764 -3643 -3547 -3433
34005217840000 41.021944 -82.355605 -2638 -2534 -2450
34005222750000 40.96124 -82.351356 -2782 -2677 -2561 -2483
34005222890000 40.942788 -82.317921 -2875 -2763 -2651 -2576
34005222900000 40.975762 -82.40499 -2676 -2567 -2456 -2369
34005223000000 41.045111 -82.314315 -2822 -2710 -2597 -2452
34005223090000 41.024637 -82.430859 -2566 -2460 -2360 -2277
34005223480000 40.911049 -82.297989 -2915 -2811
34005223510000 40.973338 -82.384039 -2654 -2543 -2449
34005228650000 40.994179 -82.411078 -2621 -2513 -2422
34005239990000 40.929468 -82.273623 -2953 -2847
34005240230000 40.782329 -82.201107 -3259 -3143
34005240480000 41.00853 -82.39321 -2605 -2496 -2386 -2310
34005240610000 40.947789 -82.266392 -2976 -2869 -2758 -2674
34005241600000 40.946706 -82.403366 -2664 -2559 -2448 -2372
34005241720000 40.891054 -82.194254 -3225 -3118 -2997 -2910
34005241760000 40.88685 -82.205167 -3195 -3090 -2972 -2879
34005241860000 40.975962 -82.240539 -3042 -2933 -2827 -2733
34007240090000 41.671626 -80.650228 -4674 -4546 -4495 -4396
34007240710000 41.680627 -80.632511 -4673 -4549 -4504 -4405
34007240900000 41.712181 -80.671793 -4533 -4408 -4358 -4282
34007241450000 41.770654 -80.794452 -4379 -4216 -4173 -4125
34007241460000 41.739694 -80.816186 -4425 -4264 -4215 -4147
34007241920000 41.79836 -80.784987 -4269 -4110 -4050 -3967
34007242530000 41.622246 -80.846358 -4522 -4379 -4327 -4224
34007243110000 41.695852 -80.735327 -4486 -4355 -4301 -4219
34007243390000 41.569458 -80.989762 -4526 -4424 -4365 -4243
34007243830000 41.543692 -80.972559 -4628 -4523 -4474 -4344
34035221990000 41.298202 -81.735828 -3892 -3773 -3603 -3547
34055212810000 41.457743 -81.230866 -4539 -4479 -4379 -4244
34093215040000 41.168103 -82.126695 -3144 -3031 -2908 -2841
34099231350000 41.12128 -80.927058 -5739 -5609 -5478 -5347
34099231710000 41.091167 -80.547705 -6609 -6430 -6331 -6202
34099231820100 41.07437 -80.882379 -5939 -5802 -5675 -5541
60
API LATITUDE LONGITUDE BLACK_RIVER TRENTON POINT_PLEASANT UTICA
(SSTVD) (SSTVD) (SSTVD) (SSTVD)
34133236120000 41.026596 -81.21133 -5310 -5238
34133238610000 41.042039 -81.255208 -5172 -5099 -4974
34133238790000 41.042955 -81.276673 -5118 -5048 -4922 -4828
34133238910000 41.030629 -81.240905 -5233 -5164 -5030 -4931
34133239620000 41.097649 -81.283062 -5037 -4967 -4840 -4748
34133239760000 41.016727 -81.262626 -5209 -5137
34133239960000 40.999942 -81.208951 -5349 -5276
34133240170000 41.000782 -81.228954 -5304 -5231
34133240420000 41.050959 -81.122374 -5565 -5417 -5284 -5174
34133240790000 41.049723 -81.180963 -5365 -5291
34133240870000 41.028485 -81.113961 -5544 -5468
34133241020000 41.045927 -81.197174 -5324 -5251 -5114 -5014
34133241040000 41.064583 -81.180782 -5390 -5247 -5108 -5006
34133241940000 41.093464 -81.062521 -5608 -5456
34133244070000 41.107989 -81.05843 -5431 -5301 -5170

61
10. VITA
Jarrod R. Bridges graduated from Longview High School in Longview, Texas in
May 2013 and enrolled at the University of Texas at Austin. He originally majored
in biochemistry and followed that major path for two years before deciding to
pursue geology. He transferred to Texas Tech University in August of 2016 to
finish pursuing geology, and graduated Summa Cum Laude with a Bachelor of
Science in Geosciences in August of 2018. After finishing his undergraduate, he
enrolled in the geology graduate program at Stephen F. Austin State University in
August of 2018 to pursue a Master of Science degree. He interned with R. Lacy
Services in Longview, Texas as a geology intern during summer and Christmas
breaks from May 2015 through September 2018. He then began to intern with
both R. Lacy Services and Buffco Production, both in Longview, Texas, while
pursuing his Master of Science degree. In July of 2019, he was offered a full time
geologist position at Buffco Production and accepted that role, and has been in
that position since while finishing his graduate degree. He will continue his career
as a petroleum geologist after the completion of his graduate degree.
Permanent Address: 2029 Eden Drive, Longview, TX 75601
This thesis was typed by Jarrod R. Bridges in accordance with the GSA manual.
Recommended