1
Title Page 1
TITLE: Delamanid co-administered with antiretroviral drugs or anti-TB drugs shows no 2
clinically relevant drug–drug interactions in healthy subjects 3
AUTHORS: Suresh Mallikaarjun#, Charles Wells1, Carolyn Petersen2, Anne Paccaly3, 4
Susan E. Shoaf, Shiva Patil4 and Lawrence Geiter 5
AFFILIATION: Otsuka Pharmaceutical Development and Commercialization (OPDC), 6
Princeton, NJ, USA 7
# CORRESPONDING AUTHOR: E-mail: [email protected] Tel: 240-8
683-3221; Fax: 310-721-7221; 9
10
RUNNING TITLE: Lack of clinically relevant delamanid drug interaction 11
KEY WORDS: delamanid, drug-drug interactions, pharmacokinetics, tuberculosis, anti-12
retroviral agents 13
14
Current Affiliations: 15
1Charles Wells - Sanofi US, Bridgewater, NJ, USA 16
2Carolyn Petersen - C Petersen Consulting LLC, Sausalito, CA, USA 17
3Anne Paccaly - Regeneron Pharmaceuticals, Tarrytown, NY, USA 18
4Shiva Patil - Astellas Pharma Global Development Inc, Northbrook, IL, USA 19
AAC Accepted Manuscript Posted Online 25 July 2016Antimicrob. Agents Chemother. doi:10.1128/AAC.00509-16Copyright © 2016 Mallikaarjun et al.This is an open-access article distributed under the terms of the Creative Commons Attribution 4.0 International license.
on May 17, 2018 by guest
http://aac.asm.org/
Dow
nloaded from
2
Abstract 20
Objectives: Delamanid is a medicinal product approved for treatment of MDR-TB. 21
Three studies were conducted to evaluate the potential drug-drug interactions between 22
delamanid and antiretroviral drugs including ritonavir, a strong inhibitor of CYP3A4 and 23
selected anti-TB drugs, including rifampicin, a strong inducer of cytochrome P450 (CYP) 24
isozymes. 25
Methods: Multiple-dose studies were conducted in parallel groups of healthy subjects. 26
Plasma samples were analysed for delamanid, delamanid metabolite, and coadministered 27
drug concentrations, and pharmacokinetic (PK) parameters were determined. The 28
magnitude of the interaction was assessed by the ratio of the geometric means (GMR) 29
and 90% CIs. 30
Results: Coadministration of delamanid with tenofovir or efavirenz did not affect the PK 31
of delamanid. Coadministration of Kaletra® [lopinavir/ritonavir] with delamanid resulted 32
in about 25% higher delamanid AUCτ. Tenofovir, efavirenz, lopinavir, and ritonavir 33
exposure were not affected by delamanid. Coadministration of delamanid with the TB 34
drugs [ethambutol + Rifater® (rifampicin, pyrazinamide, and isoniazid)] resulted in lower 35
delamanid exposure (47% and 42% for AUCτ and Cmax, respectively), as well as 36
decreased exposure of three primary metabolites (about 30 to 50% lower AUCτ). 37
Delamanid did not affect rifampicin, pyrazinamide, and isoniazid exposure; ethambutol 38
AUCτ and Cmax were about 25% higher with delamanid coadministration. 39
on May 17, 2018 by guest
http://aac.asm.org/
Dow
nloaded from
3
Conclusions: The lack of clinically significant drug–drug interactions between 40
delamanid and selected antiretroviral agents (including the strong CYP inhibitor 41
ritonavir) and a combination of anti-TB drugs was demonstrated. While there was a 42
decrease in delamanid concentrations when coadministered with [ethambutol + Rifater], 43
this is likely related to decreased delamanid absorption and not CYP induction.44
on May 17, 2018 by guest
http://aac.asm.org/
Dow
nloaded from
4
Introduction 45
Multidrug-resistant tuberculosis (MDR-TB), or tuberculosis resistant to two first-line 46
drugs, isoniazid and rifampicin, has emerged over the past three decades to greatly 47
complicate efforts to control the disease. Current estimates are that approximately 48
480,000 cases of MDR-TB occur annually, or over 5% of the nearly 9.6 million people 49
estimated to develop TB each year (1, 2). MDR-TB is difficult to treat and usually 50
requires four to six medications including the more toxic and less potent second-line 51
drugs administered for up to two years. Additionally, treatment is further complicated 52
among MDR-TB patients with HIV co-infection. These patients require additional 53
treatment with anti-retroviral medications to have a better chance at survival (3). 54
Delamanid is an anti-TB agent from the nitro-dihydro-imidazole class of compounds that 55
inhibits mycolic acid synthesis in the Mycobacterium tuberculosis cell wall. In preclinical 56
development, delamanid showed potent in vitro and in vivo activity against both drug-57
susceptible and drug-resistant strains of M. tuberculosis (4). In clinical development, 58
delamanid showed measurable activity in early bactericidal trials in drug-susceptible TB 59
patients (5). In MDR-TB patients, treatment with delamanid in combination with an 60
optimised background regimen for 2 months significantly improved 2-month sputum 61
culture conversion (SCC) by approximately 50%, in comparison to treatment with 62
placebo plus an optimised background regimen (6). Additionally, in a longer-term 63
observational study, compared to ≤ 2 months of treatment, ≥ 6 months of treatment with 64
delamanid plus an optimised background regimen was associated with higher favourable 65
on May 17, 2018 by guest
http://aac.asm.org/
Dow
nloaded from
5
treatment outcomes (55.0% versus 74.5%, p<0.001) (7) and significantly lower mortality 66
(12.0% versus 2.9%, p=0.001) (8). Based on these results, delamanid was approved in the 67
European Union, Japan, and the Republic of Korea in 2014 for the treatment of 68
pulmonary MDR-TB in adult patients. The recommend dose of delamanid is 100mg bid 69
to be taken with food. 70
In the combined treatment of TB patients and MDR-TB patients co-infected with HIV, 71
the risk of clinically significant drug-drug interactions increases, especially when 72
considering the number of commonly co-administered anti-TB and antiretroviral 73
medications that are either inducers or inhibitors of CYP, including newer anti-TB drugs 74
such as bedaquiline and PA-824 (9, 10). Amongst the commonly co-administered drugs, 75
rifampin (11) is a strong inducer of CYP450 isozymes, efavirenz (12) has been shown to 76
be a moderate inducer of CYP3A4, and ritonavir (13) is a strong inhibitor of CYP3A. 77
The metabolism of isoniazid is mediated by N-acetyltransferase, which undergoes genetic 78
polymorphism leading to extensive and poor metabolizer phenotypes (14). Delamanid is 79
primarily metabolized by albumin to DM-6705; metabolism of DM-6705 to other 80
metabolites is thought to involve pathways mediated by CYP (15). While there are drugs 81
which are partially metabolized by albumin, metabolism as a primary pathway of drugs 82
by albumin is unique. Therefore, while clinically relevant drug-drug interactions with 83
inhibitors and inducers of CYP isoenzymes were not expected with delamanid, 84
interactions due to some CYP involvement could not be ruled out. 85
on May 17, 2018 by guest
http://aac.asm.org/
Dow
nloaded from
6
This report provides results from two broad categories of medications evaluated for 86
potential drug-drug interactions in the delamanid development program: first-line anti-TB 87
drugs (including the strong CYP3A4 and other CYP450 isoenzymes inducer rifampicin) 88
and antiretroviral drugs used in HIV infected patients (including the moderate CYP3A4 89
inducer efavirenz), and the strong CYP3A4 inhibitor ritonavir.90
on May 17, 2018 by guest
http://aac.asm.org/
Dow
nloaded from
7
Materials and Methods 91
Study design 92
All studies were performed in accordance with Title 21 of the US Code of Federal 93
Regulations (CFR) Part 50 and Part 56 and in compliance with the International 94
Conference on Harmonization-Good Clinical Practice (16), the sponsor’s standard 95
operating procedures, and ethical principles for the protection of human research subjects 96
that have their origins in the Declaration of Helsinki. The study protocols, amendments, 97
and informed consent forms were reviewed and approved by the governing institutional 98
review board (IRB) of each investigational centre prior to study start. Written informed 99
consent was obtained from all subjects before any study-related procedures were 100
performed. 101
Study 1: This was a phase 1, randomized, double-blind, placebo-controlled, drug-drug 102
interaction study following multiple once daily oral doses in three parallel groups of 103
clinic-confined healthy subjects receiving either i) delamanid, ii) ethambutol + Rifater or 104
iii) delamanid + [ethambutol + Rifater]. Rifater is a combination tablet of rifampin, 105
isoniazid and pyrazinamide. The study was conducted at PPD Development, LP in 106
Austin, Texas, USA. 107
Study 2: This was a phase 1, randomized, open-label, oral multiple-dose drug interaction 108
study in seven parallel groups of clinic-confined healthy subjects. Delamanid (twice daily 109
dosing), tenofovir, efavirenz or Kaletra (lopinavir/ritonavir) were administered alone, and 110
delamanid was also coadministered with tenofovir, efavirenz or Kaletra for 14 days. The 111
on May 17, 2018 by guest
http://aac.asm.org/
Dow
nloaded from
8
study was conducted at PPD Development, LP in Austin, Texas, USA. The efavirenz 112
arms (alone and with delamanid) were discontinued mid-study due to adverse events and 113
a revised design tested in Study 3. 114
Study 3: This was a phase 1, randomized, open-label, modified sequential, oral multiple-115
dose drug interaction study in two parallel groups of clinic-confined healthy subjects. 116
Subjects were administered either efavirenz for 10 days (Group 1) or delamanid twice 117
daily for 7 days, followed by delamanid twice daily plus efavirenz for 10 days (Group 2). 118
The study was conducted at Covance Clinical Research Unit in Evansville, Indiana, USA. 119
Subjects 120
All subjects enrolled in each study underwent a medical evaluation prior to the initiation 121
of study treatment. These assessments included a review of relevant medical history and 122
concomitant medications, physical examination, vital signs, body weight and height, 123
12-lead ECGs, and clinical laboratory tests. Subjects were evaluated to assure they met 124
the below listed inclusion and exclusion criteria. 125
Study 1: Healthy male or female subjects between 18 and 45 years of age, who weighed 126
≥55 kg and had a body mass index (BMI) between 19 and 32 kg/m2, were surgically 127
sterile or willing to remain abstinent or to practice double-barrier forms of birth control, 128
and were able to provide written informed consent. Subjects were in good health as 129
determined by medical history, physical examination, ECG, serum/urine biochemistry, 130
haematology, and serology tests. Main exclusion criteria were clinically significant 131
abnormalities in blood pressure, heart rate, ECG (including QTc > 450 msec); a history of 132
on May 17, 2018 by guest
http://aac.asm.org/
Dow
nloaded from
9
any significant drug allergy or a known or suspected drug hypersensitivity to any of the 133
drugs being studied; had used tobacco products or had daily exposure to second-hand 134
smoke within 2 months prior to the screening visit; had used any prescription, over-the-135
counter, or herbal medication, or vitamin supplements within 14 days prior to dosing, or 136
antibiotics within 30 days prior to dosing; had a positive urine alcohol test and/or urine 137
drug screen for substances of abuse at screening or upon admission to the study centre; 138
had consumed alcohol and/or food and beverages containing methylxanthines, grapefruit, 139
grapefruit juice, Seville oranges, or Seville orange juice within 72 h prior to dosing; were 140
unable to consume the standard meal; had taken an investigational drug or donated blood 141
or plasma within 30 days of dosing; had a history of or current hepatitis or AIDS or was a 142
carrier of HBsAg and/or anti-HCV or HIV antibodies; or had prior exposure to 143
delamanid. 144
Study 2: Similar to Study 1, except no minimum weight requirement; subjects were to 145
have a BMI ≥15 and ≤32 kg/m2; subjects were to be HIV negative; and subjects were 146
excluded if either their QTcF or QTcB interval was over 430 msec in male subjects or 147
450 msec in female subjects. Additionally, previous illicit drug consumption, a medical 148
history of psychiatric illness, or a diagnosis or significant symptoms of psychiatric illness 149
were added as exclusion criteria, and a mental/neuropsychiatric status examination was 150
also part of the scheduled assessments after the efavirenz treatment arms were 151
discontinued. 152
on May 17, 2018 by guest
http://aac.asm.org/
Dow
nloaded from
10
Study 3: Similar to Study 1, except no minimum weight requirement; subjects were to 153
have a BMI ≥18 and ≤32 kg/m2; subjects were to be HIV negative; and subjects were 154
excluded if their QTcF interval was over 450 msec in male subjects or 470 msec in 155
female subjects. As in Study 2, previous illicit drug consumption, a medical history of 156
psychiatric illness, or a diagnosis or significant symptoms of psychiatric illness were 157
exclusion criteria, and a mental/neuropsychiatric status examination was also part of the 158
scheduled assessments. 159
Treatment and dosing regimens 160
Study 1: Delamanid and placebo tablets were manufactured by Otsuka Pharmaceutical 161
Co., Ltd. (Japan). Ethambutol was supplied as commercially packaged Myambutol tablets 162
(X-Gen Pharmaceuticals, Big Flats, New York, USA) in strengths of 100 and 400 mg. 163
Rifater® was provided as commercially packaged tablets (Sanofi-Aventis, Bridgewater, 164
New Jersey, USA) which contained 120 mg rifampicin, 50 mg isoniazid, and 300 mg 165
pyrazinamide per tablet. Pyridoxine was supplied as commercially packaged generic drug 166
product with 25 mg pyridoxine per tablet (VersaPharm, Inc., Marietta, Georgia, USA). 167
Subjects were treated once daily for 15 days (Days 1 through 15) with delamanid and 168
[ethambutol + Rifater]; delamanid and placebo for [ethambutol + Rifater]; or placebo for 169
delamanid and [ethambutol + Rifater]. The administration of [ethambutol + Rifater] was 170
continued for an additional 4 days (Days 16 through 19). The dose of delamanid was 171
200 mg (four 50-mg tablets), the dose of ethambutol was 1100 mg (two 400-mg tablets 172
and three 100-mg tablets) and the dose of Rifater was 720 mg rifampicin/300 mg 173
on May 17, 2018 by guest
http://aac.asm.org/
Dow
nloaded from
11
isoniazid/1800 mg pyrazinamide (6 tablets). Additionally, subjects received 25 mg 174
pyridoxine once daily on Days 1 through 19 as prophylaxis against the development of 175
peripheral neuropathy from isoniazid administration. Labelling for ethambutol (17) and 176
Rifater (18) indicates that food decreases bioavailability. Therefore, ethambutol and 177
Rifater (or placebo) were administered on an empty stomach, 1 h before a standard 178
breakfast. One hour after administration of [ethambutol + Rifater], subjects consumed a 179
standard breakfast within 20 min. Dosing with delamanid (19) (or placebo) followed the 180
meal, and was administered within 30 min of beginning the standard breakfast. All doses 181
were administered from a cup with a closed lid to prevent subjects from inspecting the 182
tablets and were given orally with 240 mL of room temperature still water. 183
Study 2: Delamanid tablets were manufactured by Otsuka Pharmaceutical Co., Ltd. 184
(Japan). Tenofovir was supplied as commercially available Viread® manufactured by 185
Gilead Sciences, Inc. (Foster City, California, USA), and lopinavir/ritonavir as Kaletra® 186
manufactured by Abbott Laboratories (Abbott Park, Illinois, USA). Subjects were 187
randomly assigned to receive one of the five following treatments for 14 days: 100 mg 188
delamanid (two 50-mg tablets) twice daily; 300 mg tenofovir (one 300-mg Viread tablet) 189
once daily; 300 mg tenofovir once daily + 100 mg delamanid twice daily; 400 mg 190
lopinavir/100 mg ritonavir (two 200/50-mg Kaletra tablets) twice daily; or 400 mg 191
lopinavir/100 mg ritonavir twice daily + 100 mg delamanid twice daily. All doses were 192
given orally with 240 mL of room temperature still water. The once daily dose or the 193
morning dose of the twice daily regimens was given within 30 min of the start of a 194
on May 17, 2018 by guest
http://aac.asm.org/
Dow
nloaded from
12
standard meal. The evening dose of twice daily regimens was given 12 h after the 195
morning dose and within 30 min after the start of a standard meal. 196
Study 3: Delamanid tablets were manufactured by Otsuka Pharmaceutical Co., Ltd. 197
(Japan). Efavirenz was supplied as commercially available Sustiva® manufactured by 198
Bristol-Myers Squibb (USA). Subjects were randomly assigned to receive one of the 199
following two treatments: Group 1 – 600 mg efavirenz (one 600-mg Sustiva tablet) once 200
daily for 10 days; or Group 2 – 100 mg delamanid (two 50-mg tablets) twice daily for 201
7 days followed by delamanid 100 mg twice daily + efavirenz 600 mg once daily for 202
10 days, for a total of 18 days of dosing. Consistent with labelling, the once daily dose of 203
efavirenz in both groups was administered in the evening at about 8:00 pm on an empty 204
stomach (2 h after a standard meal and 2 h prior to snack)(20). The first dose of 205
delamanid was the evening dose administered on Day 1 and the last delamanid dose was 206
the evening dose administered on Day 18. Each evening dose of delamanid was 207
administered at about 6:00 pm and each morning dose of delamanid was administered at 208
about 8:00 am; all delamanid doses were given within 30 min of the start of a standard 209
meal. 210
Safety assessments 211
Safety assessments performed in these studies were consistent with well-monitored 212
phase 1 healthy subject studies and included physical examination, vital signs, 12-lead 213
ECGs, clinical laboratory tests, and collection of adverse events. Safety assessments were 214
also carried out at the end of the study treatment and follow-up period (or early 215
on May 17, 2018 by guest
http://aac.asm.org/
Dow
nloaded from
13
withdrawal for any reason). Additional safety assessments were done whenever deemed 216
appropriate by the investigator. In Study 1, visual acuity assessments were made on 217
Days 0, 7, and 15 (consistent with labelling for ethambutol) (17), and ECGs were 218
performed over a 24-h period at the same time each day on Days 0 and 15 to allow for 219
time-matched change from baseline analysis of potential QT prolongation effects. 220
Pharmacokinetic sampling 221
Study 1: Blood draws for the determination of plasma delamanid and delamanid 222
metabolite concentrations were obtained predose on Days 1, 10, 11, 12, 13, 14, and 15, 223
and postdose at 1, 2, 3, 4, 5, 6, 8, 12, 24, 48, 72, 96, and 120 h after the last dose of 224
delamanid or placebo on Day 15. Blood draws for determination of plasma ethambutol, 225
rifampicin, pyrazinamide, and isoniazid concentrations were obtained prior to the first 226
dose of [ethambutol + Rifater] or placebo on Day 1, and 1.5 h postdose on Days 10, 11, 227
12, 13, and 14, and on Day 15 at the following times: predose, and then 0.25, 0.5, 1, 1.5, 228
2.5, 3.5, 4.5, 5.5, 6.5, 7.5, 9.5, 13.5, and 24 h postdose. 229
Study 2: Blood draws for determination of plasma delamanid and delamanid metabolites, 230
tenofovir, ritonavir, and lopinavir concentrations were obtained predose on Days 1, 12, 231
and 13. On Day 14, blood samples were obtained predose and 1, 2, 3, 4, 5, 6, 8, 12, 16, 232
and 24 h after the morning dose. 233
Study 3: Group 1 – Blood draws for the determination of plasma efavirenz 234
concentrations were obtained predose Days 1, 8, 9, and 10, and at 1, 2, 3, 4, 5, 6, 12, 16, 235
and 24 h after the Day 10 dose. Group 2 – Blood draws for the determination of plasma 236
on May 17, 2018 by guest
http://aac.asm.org/
Dow
nloaded from
14
delamanid and delamanid metabolite concentrations were obtained prior to the delamanid 237
evening dose on Days 1, 5, 6, and 7, and at 1, 2, 3, 4, 5, 6, 14, 18, and 24 h after the 238
Day 7 delamanid evening dose. On Day 17, samples were obtained prior to the evening 239
dose and at 1, 2, 3, 4, 5, 6, 14, 18, and 24 h after the Day 17 evening dose. Blood draws 240
for the determination of plasma efavirenz concentrations were obtained prior to the 241
delamanid evening dose on Days 1 and 8, and prior to the efavirenz dose on Days 15, 16, 242
and 17. On Day 17, samples were also obtained at 1, 2, 3, 4, 5, 6, 12, 16, and 24 h after 243
the efavirenz dose. 244
Bioanalytical methods 245
Validated methods and performance of the assays are summarized below. Each validated 246
method had adequate linearity, sensitivity, precision, and accuracy to meet the objectives 247
of these three drug-drug interaction studies. No interference was observed when 248
delamanid and its metabolites were quantitated in the presence of rifampicin, 25-249
desacetylrifampicin, ethambutol, and isoniazid, as well as when these analytes were 250
quantitated in the presence of delamanid and all its metabolites. 251
Study 1: Plasma samples were analysed for delamanid and its metabolites using a 252
specific and validated high performance liquid chromatography assay with tandem mass 253
spectrophotometric detection (LC/MS/MS) method by Tandem Laboratories, Salt Lake 254
City, Utah, USA (21). Delamanid, its metabolites, and the internal standard (OPC-14714) 255
were extracted from plasma using protein precipitation followed by injection of the 256
supernatant. The method was linear over the range between 1.00 and 500 ng/mL for 257
on May 17, 2018 by guest
http://aac.asm.org/
Dow
nloaded from
15
delamanid and metabolites, with calibration curve coefficients of determination 258
(r2) ≥ 0.9868 for all analytes. For each batch of samples processed, the calculated 259
concentrations of at least two-thirds of the QC samples were within 15% of nominal. At 260
each QC concentration, the %CV values were within 8.6%, and the percent bias values 261
were within 5.0%. 262
Plasma samples were analyzed for ethambutol concentration using a specific and 263
validated LC/MS/MS method by PRA International, The Netherlands. Ethambutol and 264
the deuterated internal standard (d4-ethambutol) were extracted using protein 265
precipitation followed by injection of the supernatant. The method was linear over the 266
range between 50.0 and 10,000 ng/mL ethambutol, with calibration curve regression 267
coefficients (r) ≥ 0.9989. For each batch of samples processed, the calculated 268
concentrations of at least two-thirds of the QC samples were within 15% of nominal. At 269
each QC concentration, the %CV values were within 9.4%, and the percent bias values 270
were within 1.9%. 271
Plasma samples were analysed for rifampicin and its metabolite 25-desacetyl rifampicin 272
concentration using a specific and validated HPLC with ultraviolet (UV) detection 273
method by Tandem Laboratories, Salt Lake City, Utah, USA. Rifampicin, its metabolite, 274
and the internal standard (sulindac) were extracted from plasma using solid-phase 275
extraction. The method was linear over the range between 0.200 and 40.0 μg/mL for 276
rifampicin and between 0.100 and 5.00 μg/mL for the metabolite, with calibration curve 277
r ≥ 0.9998. For each batch of samples processed, the calculated concentrations of at least 278
on May 17, 2018 by guest
http://aac.asm.org/
Dow
nloaded from
16
two-thirds of the QC samples were within 15% of nominal. At each QC concentration, 279
the %CV values were within 3.8%, and the percent bias values were within 6.3% for both 280
analytes. 281
Plasma samples were analysed for isoniazid and pyrazinamide concentration using a 282
specific and validated HPLC/UV method by PRA International, The Netherlands. 283
Isoniazid, pyrazinamide, and the internal standard (nicotinamide) were extracted from 284
plasma using liquid-liquid extraction. The method was linear over the range between 285
0.0500 and 15.0 μg/mL for isoniazid and between 0.500 and 100 μg/mL for 286
pyrazinamide, with calibration curve r ≥0.9995 for both analytes. For each batch of 287
samples processed, the calculated concentrations of at least two-thirds of the QC samples 288
were within 15% of nominal. At each QC concentration, the %CV values were within 289
3.6% for isoniazid and pyrazinamide, and the percent bias values were within 2.3% for 290
both analytes. 291
N-acetyltransferase (NAT2) genotype to support isoniazid metabolism interpretation and 292
CYP2C9 genotype to assess delamanid metabolism interpretation were determined by 293
Gentris Clinical Genetics, Inc. (Morrisville, North Carolina, USA). 294
Study 2: Plasma samples were analysed for delamanid and metabolite concentration 295
using a specific and validated UPLC/MS/MS method by Tandem Laboratories, Salt Lake 296
City, Utah, USA, similar to that described in Study 1 (21). 297
Plasma samples were analysed for lopinavir and ritonavir concentration using a specific 298
and validated LC/MS/MS method by Tandem Laboratories, Salt Lake City, Utah, USA. 299
on May 17, 2018 by guest
http://aac.asm.org/
Dow
nloaded from
17
Lopinavir, ritonavir, and their deuterated internal standards were extracted from plasma 300
using solid-phase extraction followed by injection of the supernatant. The samples were 301
quantitated against calibration standards prepared in plasma and processed like the 302
samples. The method was linear over the range between 5.00 and 5000 ng/mL for 303
lopinavir and ritonavir, with calibration curve r2 ≥ 0.9868 for both analytes. For each 304
batch of samples processed, the calculated concentrations of at least two-thirds of the QC 305
samples were within 15% of nominal. At each QC concentration, %CV values were 306
within 4.5%, and the percent bias values were within 4.7% for both analytes. 307
Plasma samples were analysed for tenofovir concentration using a specific and validated 308
LC/MS/MS method by Tandem Laboratories, Salt Lake City, Utah, USA. The samples 309
were quantitated against calibration standards prepared in plasma and processed like the 310
samples. The method was linear over the range between 1.00 and 500 ng/mL tenofovir, 311
with calibration curve r2 ≥ 0.9868. For each batch of samples processed, the calculated 312
concentrations of at least two-thirds of the QC samples were within 15% of nominal. At 313
each QC concentration, %CV values were within 14.3%, and the percent bias values were 314
within 10.3%. 315
Study 3: Plasma samples were analysed for delamanid and its metabolites concentration 316
by Tandem Laboratories, Salt Lake City, Utah, USA using the UPLC/MS/MS method 317
described in Study 2, but only quantifying the 3 primary metabolites, DM-6704, 318
DM-6705, and DM-6706. 319
on May 17, 2018 by guest
http://aac.asm.org/
Dow
nloaded from
18
Plasma samples were analysed for efavirenz concentration using a specific and validated 320
LC/MS/MS method by Tandem Laboratories, Salt Lake City, Utah, USA. The method 321
was linear over the range between 10.0 and 2000 ng/mL for efavirenz, with calibration 322
curve r2 ≥ 0.9979. For each batch of samples processed, the calculated concentrations of 323
at least two-thirds of the QC samples were within 15% of nominal. At each QC 324
concentration, %CV values were within 5.8%, and the percent bias values were within 325
2.0%. 326
CYP2B6* genotype was determined using the Affymetrix DMET Plus Array by Covance 327
Genomics Laboratory LLC, Seattle, Washington, USA. 328
Pharmacokinetic and statistical analysis 329
In all three studies, PK parameter calculations and descriptive statistics, concentration 330
values below the quantitation limit were set to zero for PK parameter calculations and 331
descriptive statistics. Actual blood sample times were used for PK calculations, and PK 332
plasma concentration-time data were analysed using a noncompartmental method 333
(22).Values for Cmax and Tmax were determined directly from the observed data. Values 334
of AUC were determined using the linear trapezoidal rule. AUC over the dosing interval 335
τ, from time zero to τ (AUCτ) were estimated from data after the last dose in these 336
multiple-dose studies. 337
PK calculations were performed with WinNonlin® version 4.0 for Study 1 and 338
version 5.2 for Studies 2 and 3 (Pharsight Corporation, Princeton, New Jersey, USA). 339
Descriptive statistics for plasma concentrations by treatment and time point and PK 340
on May 17, 2018 by guest
http://aac.asm.org/
Dow
nloaded from
19
parameters by treatment were determined by S-Plus® version 6.1 for Studies 1 and 2 341
(Insightful Corporation, Palo Alto, California, USA) and by SAS® version 9.1.3 for 342
Study 3 (Cary, North Carolina, USA). For all studies, the primary PK analysis variables 343
were Cmax and AUCτ for delamanid and coadministered drugs. Statistical analyses were 344
performed using the log-transformed data of Cmax and AUCτ. The magnitude of the 345
drug-drug interaction was assessed by computing the ratio of the geometric means 346
(GMR) of the drug in combination versus alone and the corresponding 90% confidence 347
intervals (CIs) based on the log-transformed data. In Study 1, for delamanid, the ratio of 348
delamanid and ethambutol plus the fixed-dose combination of Rifater to delamanid alone 349
was determined. For ethambutol, the ratio of [ethambutol + Rifater] + delamanid to 350
[ethambutol + Rifater] alone was determined. Similar analyses were performed for each 351
additional drug in the regimen (rifampicin, isoniazid, and pyrazinamide). For Studies 2 352
and 3, the magnitude of the drug-drug interaction was assessed by computing the GMR 353
and the corresponding 90% CIs based on the log-transformed data similar to Study 1. 354
The interpretation of the confidence intervals was based on the article by Williams et al 355
(23), where four possible outcomes are possible, i.e. i) equivalence is documented (90% 356
CIs are within the 0.8 to 1.25 limits), ii) equivalence is suggested (where one of the 357
intervals is outside but the GMR is within the boundary, iii) inequivalence is documented 358
(90% CIs are outside the boundaries) and iv) inequivalence is suggested (where both the 359
GMR and one of the intervals is outside the boundary. 360
361
on May 17, 2018 by guest
http://aac.asm.org/
Dow
nloaded from
20
Results 362
Subject population 363
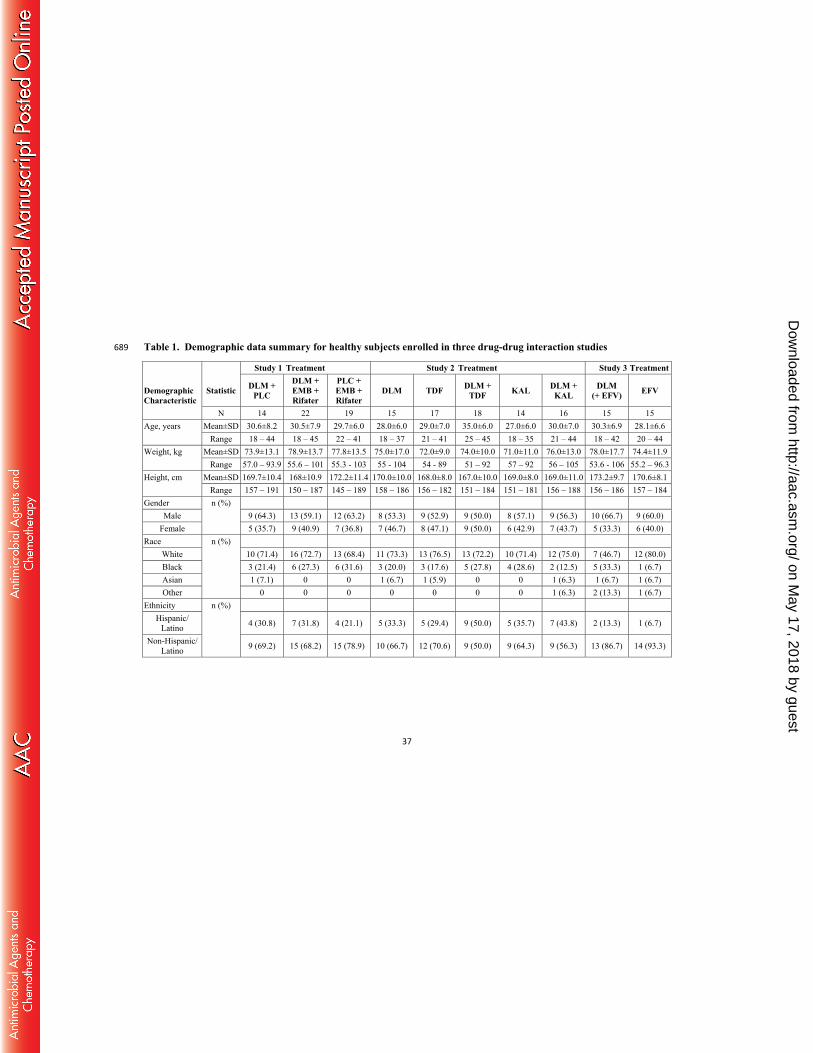
Demographic characteristics of the healthy subjects enrolled in the three drug-drug 364
interaction studies are shown in Table 1 by study and treatment group. Subjects were 365
mostly white (about 70% of the enrolled), non-Hispanic (50% to 93%), male (50% to 366
67%), and ranged in age from 18 to 45 years. Overall, the healthy subject populations 367
were similar in the three studies. 368
Subject Disposition 369
Study 1: A total of 55 subjects were randomized and received at least one dose of study 370
drug and thus were analysed for safety: 14 in the delamanid + placebo group; 22 in the 371
delamanid and [ethambutol + Rifater] group; and 19 in the placebo and [ethambutol + 372
Rifater] group. Overall, 25/55 subjects (45.5%) discontinued the study, 21/55 subjects 373
(38.2%) due to adverse events (AEs), and 4/55 (7.3%) due to investigator withdrawal of 374
subject. Most of the subjects (19/21) who discontinued due to an AE experienced a 375
generalized rash after receiving the first dose of [ethambutol + Rifater] and were 376
discontinued prior to receiving any delamanid or placebo for delamanid. The greater than 377
planned number of subjects as well as the imbalance in the number randomized per group 378
reflects the decision to replace 16 subjects who either withdrew due to generalized rash 379
(known to be a tolerance issue with Rifater) (18) or who were withdrawn by the 380
investigator because of a suspected decrease in visual acuity, which was shown on further 381
investigation to be a false positive event. No AEs related to visual acuity changes were 382
on May 17, 2018 by guest
http://aac.asm.org/
Dow
nloaded from
21
reported. No clinically relevant changes in safety ECGs were noted over time for subjects 383
in any treatment group. The maximum time-matched mean change from baseline in 384
individualized corrected QTintervals (QTcI) was lower for the delamanid and 385
[ethambutol + Rifater] group compared with the delamanid + placebo group (3.4 msec 386
versus 8.5 msec). Excluding the high incidence of generalized rash in subjects treated 387
with a single dose of [ethambutol + Rifater] observed in this study, overall, multiple once 388
daily oral doses of 200 mg delamanid alone and in combination with ethambutol and 389
rifampicin/isoniazid/ pyrazinamide were well tolerated. 390
Study 2: A total of 89 subjects were randomized and received at least one dose of study 391
drug and thus were analysed for safety: 15 in the delamanid alone group; 5 in the 392
efavirenz alone group; 4 in the efavirenz + delamanid group; 17 in the tenofovir alone 393
group; 18 in the tenofovir + delamanid group; 14 in the lopinavir/ritonavir alone group; 394
and 16 in the lopinavir/ritonavir + delamanid group. All of these subjects were included 395
in the safety analysis. The original protocol had a treatment group receiving efavirenz 396
(dosed in the morning) and another group receiving coadministered efavirenz (dosed in 397
the morning) and delamanid (dosed twice daily). Nine subjects were in these groups. 398
Subjects receiving efavirenz alone or delamanid + efavirenz experienced central nervous 399
system (CNS)-related AEs. These CNS events were likely due to administering efavirenz 400
in the morning and resulted in the cessation of dosing in these 2 treatment arms, early 401
discontinuation of subjects in the other treatment arms in the study, and an amended 402
protocol with five treatments (reported here as Study 2). The incidence of AEs among 403
subjects taking delamanid coadministered with the antiretroviral drugs tenofovir and 404
on May 17, 2018 by guest
http://aac.asm.org/
Dow
nloaded from
22
lopinavir/ritonavir was comparable to that in patients taking the antiretroviral drugs 405
alone. Overall, the combinations of delamanid with either tenofovir or with lopinavir and 406
ritonavir were well tolerated. 407
Study 3: As a result of the neuropsychiatric AEs observed with the use of efavirenz + 408
delamanid in Study 2, the two efavirenz arms were suspended and a new study (Study 3) 409
was designed with enhanced safety features (including dosing efavirenz in the evening on 410
an empty stomach consistent with labelling and exclusion of patients with a prior 411
psychiatric or drug abuse problem) to further explore the potential for drug-drug 412
interaction. A total of 30 subjects were randomized and received at least one dose of 413
study drug and thus were analysed for safety: 15 in the efavirenz alone group and 15 in 414
the group receiving delamanid alone for 7 days followed by delamanid + efavirenz for 415
10 days. Twenty-six of the 30 subjects (86.7%) completed the study. Administration of 416
efavirenz alone, delamanid alone, and delamanid + efavirenz were well tolerated, 417
although the overall incidence of AEs was higher during concomitant dosing compared 418
with either medication alone. While a higher rate of neuropsychiatric AEs (eg, euphoric 419
mood, abnormal dreams) was observed with delamanid + efavirenz compared with either 420
drug alone, no subject discontinued the study because of neuropsychiatric events or had 421
serious neuropsychiatric AEs. 422
Pharmacokinetic results 423
Delamanid plasma concentration versus time profiles after multiple-dosing for delamanid 424
alone or with each coadministered drug (by study) are shown in Figure 1. Key PK 425
on May 17, 2018 by guest
http://aac.asm.org/
Dow
nloaded from
23
parameters for delamanid, the number of PK evaluable subjects, and statistical evaluation 426
of potential drug-drug interactions (by study) are presented in Table 2. PK parameters of 427
coadministered drugs and statistical evaluation of potential drug-drug interactions (by 428
study) are presented in Table 3. 429
Study 1: Delamanid concentrations reached steady-state by Day 15, the last day of 430
dosing, following 200 mg once daily dosing of delamanid alone or with [ethambutol + 431
Rifater]. As expected, given the long half-life of metabolites (19), delamanid metabolite 432
concentrations did not yet reach steady-state with the 15 day duration of the study. Based 433
on the criteria of Williams et al, inequivalence of steady-state delamanid Cmax and 434
AUCτ was documented when coadministered with [ethambutol + Rifater] (Cmax 435
geometric mean ratio (GMR) 0.577 [90% CI: 0.492-0.676] and AUCτ GMR 0.525 [90% 436
CI: 0.439-0.628]) (Table 2). Concentrations of the primary and most prevalent 437
metabolites of delamanid in this study (DM-6704, DM-6705, and DM-6706) were also 438
about 30% to 50% lower (based on AUC) when delamanid was coadministered with 439
[ethambutol + Rifater] (Table 4). The mean Day 15 AUC ratio of metabolite DM-6704 to 440
delamanid and the ratio of metabolite DM-6705 to delamanid were similar between 441
treatments. This observation, coupled with the overall lower concentrations of 442
metabolites, suggests that induction of CYP3A4 by rifampicin does not play a major role 443
in the observed lower delamanid exposure with combination treatment, and that reduced 444
bioavailability of delamanid may occur when delamanid is coadministered with 445
[ethambutol + Rifater] under the conditions of this study. CYP2C9 genotype had no 446
effect on delamanid PK (unpublished results). 447
on May 17, 2018 by guest
http://aac.asm.org/
Dow
nloaded from
24
With regard to ethambutol concentrations, following coadministration of [ethambutol + 448
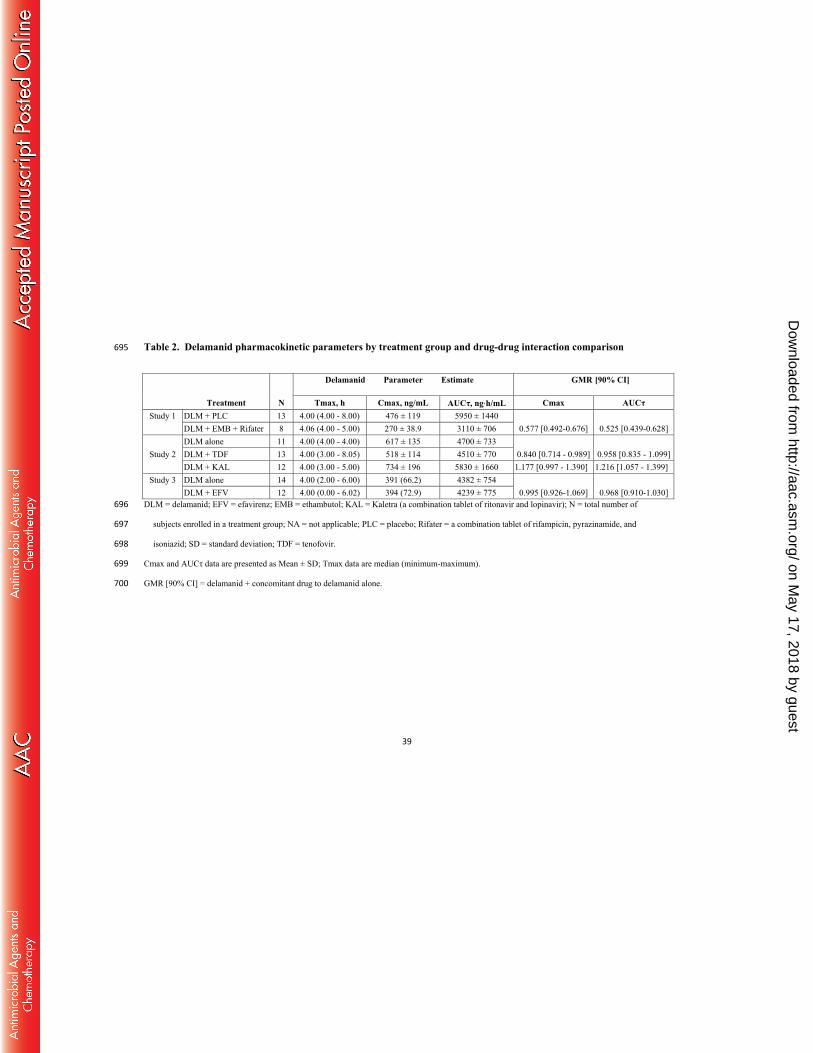
Rifater] with delamanid, equivalence was suggested (Table 3). Following 449
coadministration of [ethambutol + Rifater] with delamanid, equivalence was suggested 450
for rifampicin and pyrazinamide exposures when compared with Rifater given 451
alone(Table 3). With regard to isoniazid, as expected, NAT2 genotype had a profound 452
effect on isoniazid exposure, with slow acetylators having about 2-fold higher isoniazid 453
concentrations than intermediate/rapid acetylators. Since the two groups were not 454
matched for genotype, the prospective statistical analysis for isoniazid AUCτ was not 455
interpretable. From visual inspection of individual AUCτ values for slow acetylators 456
compared with intermediate/rapid acetylators, delamanid had no effect on isoniazid PK 457
(Figure 2). 458
Study 2: Delamanid concentrations reached steady-state by Day 14, the last day of 459
dosing, following 100 mg twice daily dosing of delamanid alone or with either 300 mg 460
tenofovir once daily, or 400 mg lopinavir/100 mg ritonavir (Kaletra) twice daily, as 461
indicated by the individual Day 12 through Day 14 predose delamanid plasma 462
concentrations. Table 2 provides the summary PK data and statistical evaluation for 463
delamanid. Equivalence in the steady-state exposure of delamanid was documented 464
when coadministered with tenofovir . Equivalence was suggested for delamanid exposure 465
following lopinavir/ritonavir co-administration. When co-administered with delamanid, 466
equivalence was documented for steady-state exposure of lopinavir and suggested for 467
tenofovir and ritonavir (Table 3). 468
on May 17, 2018 by guest
http://aac.asm.org/
Dow
nloaded from
25
Study 3: Steady-state was reached for delamanid (7 days of 100 mg twice daily dosing) 469
and efavirenz (10 days of once daily dosing in the evening) concentrations as indicated 470
by the individual predose plasma concentrations. As shown in Table 2 and Figure 1, 471
efavirenz did not affect the steady-state exposure of delamanid, and delamanid did not 472
affect efavirenz plasma concentrations (Table 3). Efavirenz plasma exposure was in 473
agreement with CYP2B6* genotype (unpublished results).474
on May 17, 2018 by guest
http://aac.asm.org/
Dow
nloaded from
26
Discussion 475
Delamanid received regulatory approval in the European Union, Japan, and the Republic 476
of Korea in 2014 for use as part of an appropriate combination drug regimen to treat 477
pulmonary MDR-TB in adults. During the development of delamanid, it was determined 478
that delamanid is primarily metabolized by plasma albumin (15) to form DM-6705 and 479
that delamanid is not metabolized by CYP enzymes (4). Subsequently, the metabolism of 480
DM-6705 is thought to occur via 3 different pathways, some of which are thought to be 481
mediated by CYP3A4 (24). The in vitro data indicated that the lack of involvement of 482
CYP in the primary metabolism of delamanid may be advantageous with regard to 483
potential drug-drug interactions, relative to other newer anti-TB agents. However, 484
prediction of in vivo interactions from in vitro data can be misleading due to complex 485
factors such as heterotropic effects, partial inhibition, nonspecific protein binding, etc., 486
that may bias the extrapolation (25). Therefore, in vivo studies to confirm in vitro 487
predictions are important, and these three studies were conducted to investigate whether 488
the lack of CYP involvement in vitro was reflected in a lack of in vivo drug-drug 489
interaction. 490
The anti-TB drug combination of [ethambutol + Rifater (isoniazid, rifampicin, 491
pyrazinamide)] with delamanid for 15 days in Study 1 resulted in about 45% lower 492
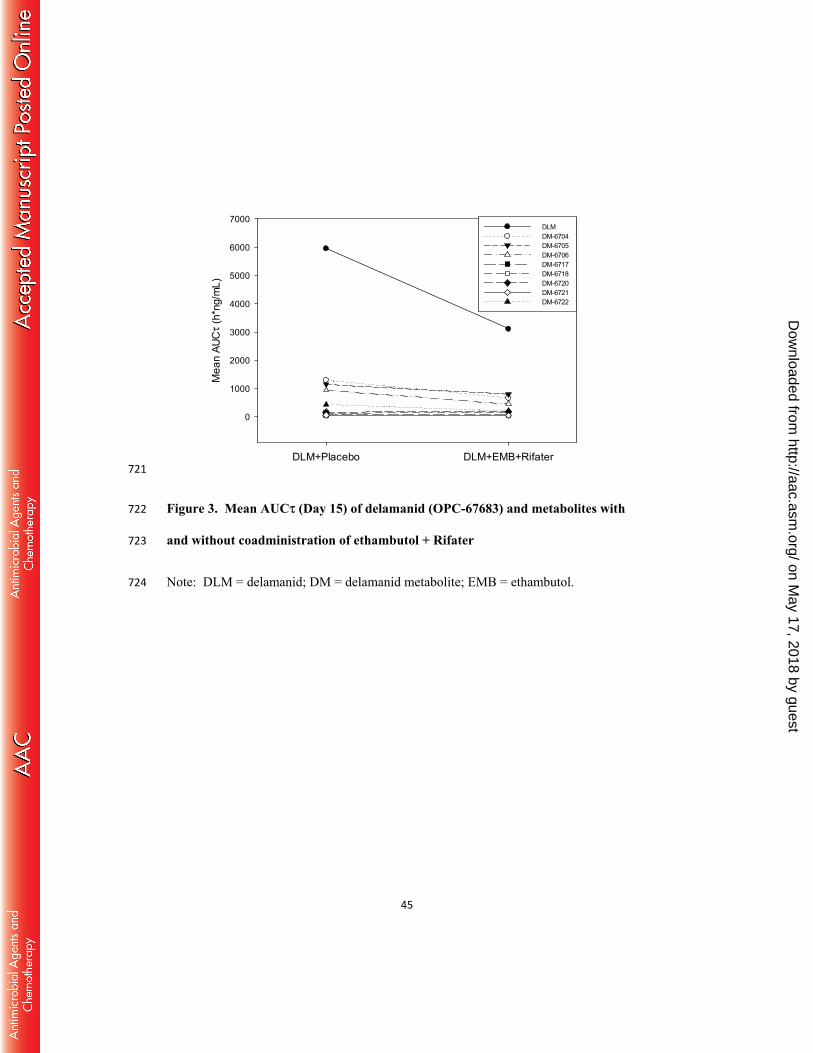
exposure of delamanid. Concentrations of the 4 most prevalent metabolites of delamanid 493
(DM-6704, DM-6705, DM-6706, and DM-6722) were also about 30% and 50% lower 494
relative to delamanid treatment alone (Figure 3). The ratios of metabolite DM-6704 or 495
on May 17, 2018 by guest
http://aac.asm.org/
Dow
nloaded from
27
metabolite DM-6705 to delamanid were similar between treatments (unpublished results). 496
These observations, coupled with the overall lower concentrations of metabolites, suggest 497
that induction of CYP3A4 by rifampicin does not play a major role in the observed lower 498
delamanid exposure with the combination treatment. Rifampicin is a potent inducer of 499
cytochrome P450 isozymes, including CYP3A4. If the lower delamanid concentrations 500
with [ethambutol + Rifater] treatment were due to induction of CYP3A4, a significant 501
increase in at least one of the metabolites should have been observed. Since the 502
metabolite concentrations were not higher after co-administration with 503
[Rifater + ethambutol], the lower delamanid concentrations are likely due to decreased 504
bioavailability of delamanid rather than a change in intrinsic clearance, as would occur 505
following induction by rifampicin. In addition, considering that delamanid 506
coadministered with efavirenz, a CYP3A inducer, did not result in changes in delamanid 507
exposure (Study 3), induction of CYP3A4 is unlikely to have been a major factor for the 508
lower delamanid exposure. Also, considering the low solubility of delamanid, limited 509
absorption of delamanid may have occurred when a total of 15 tablets were ingested by 510
the subjects (including delamanid and the other co-administered medications) within 1.5 511
hours. Induction of MDR1 transporters in the intestine by rifampin is also unlikely since 512
delamanid is neither a substrate of, nor an inhibitor of MDR1 (19). 513
514
A limitation of Study 1 is the fact that a combination of many drugs was given. A more 515
direct evaluation of the potential for interaction with a strong inducer of CYP3A4 would 516
on May 17, 2018 by guest
http://aac.asm.org/
Dow
nloaded from
28
be to study delamanid with a single agent-inducer, such as carbamazepine. However, 517
based on in vitro data and the efavirenz data, no significant interaction is expected. Of 518
note, given delamanid’s currently approved indication for the treatment of MDR-TB (19), 519
it is not expected to be used with the combination of isoniazid, rifampicin, pyrazinamide, 520
and ethambutol, given the current World Health Organization guidelines. But if such a 521
combination is to be administered with delamanid, caution should be exercised given the 522
decrease in delamanid exposure when administered with the combination. Another 523
limitation is the wide confidence intervals for some of the co-administered drugs, which 524
reflects the relatively limited number of subjects and a parallel-arm design, necessitated 525
by the relatively long half-life of delamanid’s metabolites. 526
Study 1 also evaluated the potential effect of delamanid on the coadministered drugs. 527
Delamanid did not meaningfully affect the plasma exposure of coadministered anti-TB 528
drugs isoniazid/rifampin/pyrazinamide, or ethambutol. 529
The antiretroviral drug tenofovir, when coadministered with delamanid, did not affect 530
delamanid or delamanid metabolite systemic exposure in a clinically relevant manner 531
(Study 2). Tenofovir is not metabolized by CYP450 isoenzymes, nor is it an inducer or 532
inhibitor of these enzymes. Tenofovir is renally eliminated as unchanged drug by a 533
combination of glomerular filtration and active tubular secretion (26). The small changes 534
seen when co-administered with delamanid are not clinically relevant and are in 535
agreement with the expectation of a lack of interaction based on the metabolic profile of 536
tenofovir and delamanid. 537
on May 17, 2018 by guest
http://aac.asm.org/
Dow
nloaded from
29
The antiretroviral drug combination of lopinavir/ritonavir (Kaletra), in which ritonavir is 538
a known strong inhibitor of CYP3A4, coadministered with delamanid, resulted in about 539
25% higher exposure of delamanid and metabolite DM-6705, and about 75% higher 540
exposure of metabolite DM-6704 while other metabolites were lower (Study 2, 541
unpublished results). Lopinavir is neither an inhibitor nor an inducer of CYP450 542
isozymes. Ritonavir is an inhibitor of cytochrome CYP3A and CYP2D6 to a lesser 543
extent. It also appears to induce CYP3A, CYP1A2, CYP2C9, CYP2C19, and CYP2B6 as 544
well as glucuronosyl transferase. Given that ritonavir is a strong inhibitor of CYP3A, if 545
indeed CYP3A were an important pathway for the metabolism of delamanid, there would 546
have been a significant increase in delamanid concentrations. While there was a small 547
increase in delamanid exposure, it was not clinically meaningful. Further, the inconsistent 548
pattern of metabolite changes, where some of them increased and some decreased, 549
supports the lack of significant CYP3A involvement. Some involvement of CYP3A is 550
possible, as evidenced by the changes in both delamanid concentrations as well as its 551
metabolites. 552
Efavirenz is metabolized by CYP3A4 and CYP2B6 and is known to inhibit in vitro 553
CYP2C9, CYP2C19, and CYP3A4 at therapeutic concentrations. In vivo, efavirenz is a 554
moderate inducer of CYP3A4, as well as CYP2B6, and 2C19 (20). In this trial design, as 555
in medical practice, efavirenz was given at night to reduce known AEs. Hence, PK 556
profiles of efavirenz and delamanid were measured after the evening dose and at steady 557
state, namely after 10 days of efavirenz and after 7 days of delamanid administration. 558
on May 17, 2018 by guest
http://aac.asm.org/
Dow
nloaded from
30
Coadministration of delamanid with efavirenz did not significantly affect delamanid 559
exposure (Study 3). 560
Thus, with regard to the interacting drugs, coadministration of delamanid with tenofovir, 561
lopinavir/ritonavir, or with efavirenz, did not significantly affect the systemic exposure of 562
these drugs. This is particularly important as combinations of efavirenz, tenofovir and an 563
additional NRTI are the first line of HIV therapy in many countries where the MDR-564
TB/HIV co-infection rate is high. The lack of significant CYP-related drug-drug 565
interactions of delamanid in clinical studies is supported by in vitro metabolism data. In 566
vitro studies showed that metabolites of delamanid were minimally quantifiable 567
following incubation of delamanid with liver microsomes, indicating that delamanid is 568
not metabolized by CYP enzymes, and additionally, that delamanid had neither 569
stimulatory nor inhibitory effects on CYP activities (4). In addition, in vitro studies have 570
shown that delamanid is not a substrate of the human transporters MDR1, BCRP, OCT1, 571
OATP1B1, and OATP1B3, and that delamanid does not inhibit the major human 572
transporters MDR1, BCRP, OAT1, OAT3, OCT1, OCT2, OATP1B1, OATP1B3, and 573
BSEP (19). 574
In consideration of other drugs for MDR-TB that could potentially be administered with 575
delamanid, there are several that are currently being used such as clofazimine, various 576
fluoroquinolones, ethionamide, prothionamide, cycloserine, paraaminosalicylic acid, 577
polypeptides, aminoglycosides, high dose isoniazid and pyrazinamide which are 578
eliminated by conjugation, acetylation, metabolism by CYP450 isoenzymes or renal 579
on May 17, 2018 by guest
http://aac.asm.org/
Dow
nloaded from
31
excretion. In addition other drugs, new and in development, such as bedaquiline and PA-580
824 are substrates of and are metabolized by CYP3A (9, 10). Given that delamanid is not 581
a substrate, inhibitor or inducer of CYP450 isozymes and it is not conjugated, acetylated 582
or excreted renally, clinically relevant metabolic interaction with these drugs, if co-583
administered together, are unlikely. 584
The drug-drug interaction studies conducted with delamanid show little effect on 585
delamanid exposure due to induction or inhibition of CYP enzymes, which is in 586
agreement with the in vitro data. The results of the studies with inducers of CYP3A4 587
(rifampicin and efavirenz) or inhibitors (ritonavir) indicated that CYP3A4 does not play a 588
major role in delamanid’s metabolism, in agreement with the in vitro data. Also, 589
delamanid has little potential for clinically significant CYP-related drug-drug interactions 590
and may be safely co-administered with other drugs whose metabolism is mediated via 591
the CYP450 pathways.592
on May 17, 2018 by guest
http://aac.asm.org/
Dow
nloaded from
32
Acknowledgements 593
We would like to acknowledge Dr Gail Jungbluth for providing medical writing services 594
in the preparation of this manuscript and Ms. Zuzanna Hübschmann for editing the 595
manuscript. 596
All authors were employees of Otsuka Pharmaceutical Development and 597
Commercialization at the time the study described in this manuscript was conducted. 598
Funding Information 599
This work was funded by Otsuka Pharmaceutical Development and Commercialization, 600
Inc. (OPDC), Princeton, NJ, USA.601
on May 17, 2018 by guest
http://aac.asm.org/
Dow
nloaded from
33
References 602
1. World Health Organization. 2015. Global Tuberculosis Report 2015. Geneva, 603
Switzerland. WHO/HTM/TB/2015.22. 604
2. U.S. Centers for Disease Control and Prevention. October 2014. Reported 605
Tuberculosis in the United States, 2013. Atlanta, GA. 606
3. Stop TB Partnership and World Health Organization. 2006. Global Plan to Stop 607
TB 2006– 2015. Geneva, Switzerland. WHO/HTM/STB/2006.35. 608
4. Matsumoto M, Hashizume H, Tomishige T, Kawasaki M, Tsubouchi H, Sasaki 609
H, Shimokawa Y, Komatsu M. 2006. OPC−67683, a nitro-dihydro-imidazooxazole 610
derivative with promising action against tuberculosis in vitro and in mice. PLoS Med 611
3:e466. http://dx.doi.org/10.1371/journal.pmed.0030466. 612
5. Diacon AH, Dawson R, Hanekom M, Narunsky K, Venter A, Hittel N, Geiter LJ, 613
Wells CD, Paccaly AJ, Donald PR. 2011. Early bactericidal activity of delamanid 614
(OPC-67683) in smear-positive pulmonary tuberculosis patients. Int J Tuberc Lung 615
Dis 15:949–954. http://dx.doi.org/10.5588/ijtld.10.0616. 616
6. Gler MT, Skripconoka V, Sanchez-Garavito E, Xiao H, Cabrera-Rivero JL, 617
Vargas-Vasquez DE, Gao M, Awad M, Park SK, Shim TS, Suh GY, Danilovits 618
M, Ogata H, Kurve A, Chang J, Suzuki K, Tupasi T, Koh WJ, Seaworth B, 619
Geiter LJ, Wells CD. 2012. Delamanid for multidrug-resistant pulmonary 620
tuberculosis. N Engl J 366:2151–2160. http://dx.doi.org/10.1056/NEJMoa1112433. 621
7. Skripconoka V, Danilovits M, Pehme L, Tomson T, Skenders G, Kummik T, 622
Cirule A, Leimane V, Kurve A, Levina K, Geiter LJ, Manissero D, Wells CD. 623
on May 17, 2018 by guest
http://aac.asm.org/
Dow
nloaded from
34
2013. Delamanid improves outcomes and reduces mortality in multidrug-resistant 624
tuberculosis. Eur Respir J 41:1393–1400. 625
http://dx.doi.org/10.1183/09031936.00125812. 626
8. Gupta R, Geiter LJ, Wells CD, Gao M, Cirule A, Xiao H. 2015. Delamanid for 627
extensively drug-resistant tuberculosis. N Engl J Med 373:291–292. 628
http://dx.doi.org/10.1056/NEJMc1415332. 629
9. van Heeswijk RPG, Dannemann B, Hoetelmans RMW. 2014. Bedaquiline: a 630
review of human pharmacokinetics and drug–drug interactions. J Antimicrob 631
Chemother 69:2310–2318. http://dx.doi.org/10.1093/jac/dku171. 632
10. Dooley KE, Luetkemeyer AF, Park JG, Allen R, Cramer Y, Murray S, 633
Sutherland D, Aweeka F, Koletar SL, Marzan F, Bao J, Savic R, Haas DW; 634
AIDS Clinical Trials Group A5306 Study Team. 2014. Phase I safety, 635
pharmacokinetics, and pharmacogenetics study of the antituberculosis drug PA-824 636
with concomitant lopinavir-ritonavir, efavirenz, or rifampin. Antimicrob Agents 637
Chemother 58:5245–5252. http://dx.doi.org/10.1128/AAC.03332-14. 638
11. Niemi M, Backman JT, Fromm MF, Neuvonen PJ, Kivistö KT. 2003. 639
Pharmacokinetic interactions with rifampicin: clinical relevance. Clin Pharmacokinet 640
42:819–850. http://dx.doi.org/10.2165/00003088-200342090-00003. 641
12. Usach I, Melis V, Peris JE. 2013. Non-nucleoside reverse transcriptase inhibitors: a 642
review on pharmacokinetics, pharmacodynamics, safety and tolerability. J Int AIDS 643
16:1–14. http://dx.doi.org/10.7448/IAS.16.1.18567. 644
on May 17, 2018 by guest
http://aac.asm.org/
Dow
nloaded from
35
13. Hsu A, Granneman GR, Bertz RJ. 1998. Ritonavir. Clinical pharmacokinetics and 645
interactions with other anti-HIV agents. Clin Pharmacokinet 35:275–291. 646
http://dx.doi.org/10.2165/00003088-199835040-00002. 647
14. Relling MV. 1989. Polymorphic drug metabolism. Clin Pharmacy 8:852–863. 648
15. Shimokawa Y, Sasahara K, Koyama N, Kitano K, Shibata M, Yoda N, Umehara 649
K. 2015. Metabolic mechanism of delamanid, a new anti-tuberculosis drug, in human 650
plasma. Drug Metab Dispos 43:1277–1283. 651
http://dx.doi.org/10.1124/dmd.115.064550. 652
16. U.S. Food and Drug Administration, HHS. 9 May 1997. International Conference 653
on Harmonisation; Good Clinical Practice: Consolidated Guideline; Notice of 654
Availability. Federal Register 62:25692–25709. https://www.gpo.gov/fdsys/pkg/FR-655
1997-05-09/pdf/97-12138.pdf 656
17. Stat-Trade, Inc. Revised January 2007. Myambutol (ethambutol hydrochloride), 657
United States Product Insert. Northport, NY. 658
http://www.accessdata.fda.gov/drugsatfda_docs/label/2008/016320s063lbl.pdf. 659
18. Sanofi-Aventis. Revised February 2013. Rifater (rifampin, isoniazid, pyrazinamide), 660
United States Product Insert. Bridgewater, NJ. 661
http://products.sanofi.us/rifater/Rifater.pdf. 662
19. Otsuka Novel Products GmbH. 2014. Deltyba (delamanid) Annex I: Summary of 663
Product Characteristics. München, Germany. 664
http://www.ema.europa.eu/docs/en_GB/document_library/EPAR_-665
_Product_Information/human/002552/WC500166232.pdf. 666
on May 17, 2018 by guest
http://aac.asm.org/
Dow
nloaded from
36
20. Bristol-Myers Squibb Company. Revised March 2015. Sustiva (efavirenz), United 667
States Product Insert. Princeton, NJ. http://packageinserts.bms.com/pi/pi_sustiva.pdf. 668
21. Meng M, Smith B, Johnston B, Carter S, Brisson J, Roth SE. 2015. Simultaneous 669
quantitation of delamanid (OPC-67683) and its eight metabolites in human plasma 670
using UHPLC-MS/MS. J Chromatogr B 1002:78–91. 671
http://dx.doi.org/10.1016/j.jchromb.2015.07.058. 672
22. Jusko WJ. 1992. Guidelines for collection and analysis of pharmacokinetic data, p 673
1–43. In Evans WE, Schentag JJ, Jusko WJ (ed), Applied Pharmacokinetics: 674
principles of therapeutic drug monitoring, 3rd ed. Applied Therapeutics, Vancouver, 675
Washington. 676
23. Williams RL, Chen ML, Hauck WW. 2002. Equivalence approaches. Clin 677
Pharmacol Ther. 72:229-37. http://dx.doi.org/10.1067/mcp.2002.126705 678
24. Sasahara K, Shimokawa Y, Hirao Y, Koyama N, Kitano K, Shibata M, Umehara 679
K. 2015. Pharmacokinetics and metabolism of delamanid, a novel anti-tuberculosis 680
drug, in animals and humans: Importance of albumin metabolism in vivo. Drug 681
Metab Dispos 43:1267–1276. http://dx.doi.org/10.1124/dmd.115.064527. 682
25. Wienker LC, Heath TG. 2005. Predicting in vivo drug interactions from in vitro 683
drug discovery data. Nat Rev Drug Discov 4:825–833. 684
http://dx.doi.org/10.1038/nrd1851. 685
26. Kearney BP, Flaherty JF, Shah J. 2004. Tenofovir disoproxil fumarate: clinical 686
pharmacology and pharmacokinetics. Clin Pharmacokinet 43:595–612. 687
http://dx.doi.org/10.2165/00003088-200443090-00003. 688
on May 17, 2018 by guest
http://aac.asm.org/
Dow
nloaded from
37
Table 1. Demographic data summary for healthy subjects enrolled in three drug-drug interaction studies 689
Study 1 Treatment Study 2 Treatment Study 3 Treatment
Demographic Characteristic
Statistic DLM + PLC
DLM + EMB + Rifater
PLC + EMB + Rifater
DLM TDF DLM + TDF KAL DLM +
KAL DLM
(+ EFV) EFV
N 14 22 19 15 17 18 14 16 15 15 Age, years Mean±SD 30.6±8.2 30.5±7.9 29.7±6.0 28.0±6.0 29.0±7.0 35.0±6.0 27.0±6.0 30.0±7.0 30.3±6.9 28.1±6.6 Range 18 – 44 18 – 45 22 – 41 18 – 37 21 – 41 25 – 45 18 – 35 21 – 44 18 – 42 20 – 44 Weight, kg Mean±SD 73.9±13.1 78.9±13.7 77.8±13.5 75.0±17.0 72.0±9.0 74.0±10.0 71.0±11.0 76.0±13.0 78.0±17.7 74.4±11.9 Range 57.0 – 93.9 55.6 – 101 55.3 - 103 55 - 104 54 - 89 51 – 92 57 – 92 56 – 105 53.6 - 106 55.2 – 96.3Height, cm Mean±SD 169.7±10.4 168±10.9 172.2±11.4 170.0±10.0 168.0±8.0 167.0±10.0 169.0±8.0 169.0±11.0 173.2±9.7 170.6±8.1 Range 157 – 191 150 – 187 145 – 189 158 – 186 156 – 182 151 – 184 151 – 181 156 – 188 156 – 186 157 – 184Gender n (%)
Male 9 (64.3) 13 (59.1) 12 (63.2) 8 (53.3) 9 (52.9) 9 (50.0) 8 (57.1) 9 (56.3) 10 (66.7) 9 (60.0) Female 5 (35.7) 9 (40.9) 7 (36.8) 7 (46.7) 8 (47.1) 9 (50.0) 6 (42.9) 7 (43.7) 5 (33.3) 6 (40.0)
Race n (%) White 10 (71.4) 16 (72.7) 13 (68.4) 11 (73.3) 13 (76.5) 13 (72.2) 10 (71.4) 12 (75.0) 7 (46.7) 12 (80.0) Black 3 (21.4) 6 (27.3) 6 (31.6) 3 (20.0) 3 (17.6) 5 (27.8) 4 (28.6) 2 (12.5) 5 (33.3) 1 (6.7) Asian 1 (7.1) 0 0 1 (6.7) 1 (5.9) 0 0 1 (6.3) 1 (6.7) 1 (6.7) Other 0 0 0 0 0 0 0 1 (6.3) 2 (13.3) 1 (6.7)
Ethnicity n (%) Hispanic/
Latino 4 (30.8) 7 (31.8) 4 (21.1) 5 (33.3) 5 (29.4) 9 (50.0) 5 (35.7) 7 (43.8) 2 (13.3) 1 (6.7)
Non-Hispanic/ Latino 9 (69.2) 15 (68.2) 15 (78.9) 10 (66.7) 12 (70.6) 9 (50.0) 9 (64.3) 9 (56.3) 13 (86.7) 14 (93.3)
on May 17, 2018 by guest
http://aac.asm.org/
Dow
nloaded from
38
DLM = delamanid; EFV = efavirenz; EMB = ethambutol; KAL = Kaletra (a combination tablet of ritonavir and lopinavir); n 690
= number of subjects in the subset; N = total number of subjects enrolled in a treatment group; PLC = placebo; Rifater = a 691
combination tablet of rifampicin, pyrazinamide, and isoniazid; SD = standard deviation; TDF = tenofovir; % = n/N. 692
Note: Study 2 data does not include either efavirenz treatment groups that were stopped early in the trial and do not have 693
pharmacokinetic data.694
on May 17, 2018 by guest
http://aac.asm.org/
Dow
nloaded from
39
Table 2. Delamanid pharmacokinetic parameters by treatment group and drug-drug interaction comparison 695
Delamanid Parameter Estimate GMR [90% CI]
Treatment N Tmax, h Cmax, ng/mL AUCτ, ng⋅h/mL Cmax AUCτ Study 1 DLM + PLC 13 4.00 (4.00 - 8.00) 476 ± 119 5950 ± 1440
DLM + EMB + Rifater 8 4.06 (4.00 - 5.00) 270 ± 38.9 3110 ± 706 0.577 [0.492-0.676] 0.525 [0.439-0.628] DLM alone 11 4.00 (4.00 - 4.00) 617 ± 135 4700 ± 733
Study 2 DLM + TDF 13 4.00 (3.00 - 8.05) 518 ± 114 4510 ± 770 0.840 [0.714 - 0.989] 0.958 [0.835 - 1.099] DLM + KAL 12 4.00 (3.00 - 5.00) 734 ± 196 5830 ± 1660 1.177 [0.997 - 1.390] 1.216 [1.057 - 1.399]
Study 3 DLM alone 14 4.00 (2.00 - 6.00) 391 (66.2) 4382 ± 754 DLM + EFV 12 4.00 (0.00 - 6.02) 394 (72.9) 4239 ± 775 0.995 [0.926-1.069] 0.968 [0.910-1.030] DLM = delamanid; EFV = efavirenz; EMB = ethambutol; KAL = Kaletra (a combination tablet of ritonavir and lopinavir); N = total number of 696
subjects enrolled in a treatment group; NA = not applicable; PLC = placebo; Rifater = a combination tablet of rifampicin, pyrazinamide, and 697
isoniazid; SD = standard deviation; TDF = tenofovir. 698
Cmax and AUCτ data are presented as Mean ± SD; Tmax data are median (minimum-maximum). 699
GMR [90% CI] = delamanid + concomitant drug to delamanid alone. 700
on May 17, 2018 by guest
http://aac.asm.org/
Dow
nloaded from
40
Table 3. Pharmacokinetic parameters of coadministered drugs and drug-drug interaction comparison 701
Parameter Cmax, μg/mL AUCτ, h⋅μg/mL Coadministered Drug
Without DLM
With DLM
GMR [90% CI]
Without DLM
With DLM
GMR [90% CI]
Isoniazid 5.54 ± 1.69 4.62 ± 0.98 0.854 20.0 ± 8.0 12.1 ± 6.9 0.588 a
(Study 1) (N = 9) (N = 8) [0.676 – 1.079] (N = 9) (N = 8) [0.399 – 0.867] Rifampicin 11.2 ± 3.87 13.2 ± 5.41 1.141 48.2 ± 18.3 55.9 ± 28.6 1.071
(Study 1) (N = 9) (N = 8) [0.775 - 1.677] (N = 9) (N = 8) [0.687 - 1.670] Pyrazinamide 49.7 ± 10.4 51.4 ± 9.06 1.043 488 ± 90.3 533 ± 141 1.074
(Study 1) (N = 9) (N = 8) [0.876-1.243] (N = 9) (N = 8) [0.886-1.303] Ethambutol 3.56 ± 0.93 4.45 ± 0.82 1.268 18.2 ± 3.21 22.4 ± 4.77 1.226
(Study 1) (N = 9) (N = 8) [1.046-1.538] (N = 9) (N = 8) [1.043-1.441] Tenofovir 0.326 ± 0.069 0.294 ± 0.076 0.894 3.130 ± 0.730 2.850 ± 0.644 0.914
(Study 2) (N = 12) (N = 13) [0.768 - 1.040] (N = 12) (N = 13) [0.781 - 1.068] Lopinavir 12.9 ± 3.17 13.6 ± 3.38 1.050 112 ± 22.5 118 ± 33.0 1.036
(Study 2) (N = 11) (N = 12) [0.880 - 1.254] (N = 11) (N = 12) [0.864 - 1.244] Ritonavir 1.30 ± 0.68 1.27 ± 0.80 0.959 5.83 ± 1.94 6.20 ± 2. 94 1.031
(Study 2) (N = 11) (N = 12) [0.657 - 1.399] (N = 11) (N = 12) [0.773 - 1.373] Efavirenz 5.95 ± 1.67 5.81 ± 3.03 0.937 84.7 ± 37.8 83.1 ± 57.8 0.937
(Study 3) (N = 14) (N = 12) [0.754 - 1.165] (N = 14) (N = 12) [0.715 - 1.228] GMR [90% CI] = concomitant drug + delamanid to concomitant drug alone. DLM = delamanid. 702
Cmax and AUCτ data are presented as Mean ± SD; 703
on May 17, 2018 by guest
http://aac.asm.org/
Dow
nloaded from
41
a The GMR presented for isoniazid are confounded by NAT2 genotype as the groups were not matched for slow and rapid 704
acetylators (unpublished data). 705
on May 17, 2018 by guest
http://aac.asm.org/
Dow
nloaded from
42
Table 4. Delamanid metabolite pharmacokinetic parameters with and without 706
[ethambutol + Rifater] (Study 1) 707
Treatment DLM + PLC DLM + EMB + Rifater
(N = 13) (N = 8)
Metabolite Cmax, ng/mL AUCτ, ng⋅h/mL Cmax, ng/mL AUCτ, ng⋅h/mL
DM-6704 63.5 ± 23.4 1290 ± 477 32.7 ± 14.2 667 ± 262 DM-6705 55.3 ± 13.6 1140 ± 311 40.7 ± 13.3 799 ± 227 DM-6706 45.1 ± 17.4 937 ± 351 22.0 ± 13.5 447 ± 239 DM-6722 21.1 ± 10.2 434 ± 214 10.1 ± 4.88 202 ± 96.7
DLM = delamanid; EMB = ethambutol; N = number of subjects; PLC = placebo; 708
Rifater = a combination tablet of rifampicin, pyrazinamide, and isoniazid; 709
SD = standard deviation. 710
Cmax and AUCτ data are presented as Mean ± SD. 711
on May 17, 2018 by guest
http://aac.asm.org/
Dow
nloaded from
43
712
Figure 1. Delamanid plasma concentration-time profiles alone or with 713
coadministered drugs 714
Note: DLM = delamanid; EFV = efavirenz; EMB = ethambutol; KAL = Kaletra 715
(lopinavir/ritonavir); TDF = tenofovir. 716
on May 17, 2018 by guest
http://aac.asm.org/
Dow
nloaded from
44
Ison
iazid
AUC
τ (h
* μg/
mL)
0
10
20
30
40Filled circle - Slow AcetylatorFilled triangle - Intermediate/Rapid Acetylator
DLM + EMB + Rifater Placebo + EMB +Rifater 717
Figure 2. Individual subject steady-state isoniazid AUCτ grouped by acetylator 718
genotype following [ethambutol + Rifater] alone or with delamanid 719
Note: DLM = delamanid; EMB = ethambutol. 720
on May 17, 2018 by guest
http://aac.asm.org/
Dow
nloaded from
45
DLM+Placebo DLM+EMB+Rifater
Mea
n AU
Cτ
(h*n
g/m
L)
0
1000
2000
3000
4000
5000
6000
7000DLM DM-6704 DM-6705 DM-6706 DM-6717 DM-6718 DM-6720 DM-6721 DM-6722
721
Figure 3. Mean AUCτ (Day 15) of delamanid (OPC-67683) and metabolites with 722
and without coadministration of ethambutol + Rifater 723
Note: DLM = delamanid; DM = delamanid metabolite; EMB = ethambutol. 724
on May 17, 2018 by guest
http://aac.asm.org/
Dow
nloaded from
Recommended